BigQuery already has AI built in. Gemini generates SQL from natural language, and the data canvas lets you explore tables without code. So why connect Google BigQuery to Claude?
Gemini in BigQuery is tied to the BigQuery console. Claude works outside of it. You can pull BigQuery data into the same conversation as your Google Ads or HubSpot data, and anyone on the team can read Claude’s analysis without knowing SQL. The fastest way to connect BigQuery to Claude AI is the connector by Coupler.io. It sends your data to Claude via MCP and adds an Analytical Engine to handle the calculations, so Claude doesn’t have to guess at the math. Explore how the connector setup looks, as well as alternative methods.
Choose the right method to connect BigQuery to Claude AI
| Connection method | Technical skill | Who does the math | Data freshness | Best for |
| Coupler.io | None — no-code setup | Analytical Engine computes, Claude interprets | Scheduled refresh (as frequent as every 15 min) | Recurring analysis with verified calculations |
| BigQuery connector in Claude | None — one-click connect | Claude computes directly | Live (queries run on demand) | Quick lookups, schema checks, ad-hoc questions |
| Google’s BigQuery MCP server (remote) | Moderate — GCP IAM, OAuth setup | Claude computes directly | Live (queries run on demand) | Teams already deep in GCP who want direct SQL access |
| Community BigQuery MCP servers (local) | Moderate to high — local server setup, service account keys | Claude computes directly | Live (queries run on demand) | Custom access controls, field-level restrictions, cost caps |
| API scripts / function calling | High — Python or Node.js, both BigQuery and Claude APIs | Depends on your implementation | On-demand or scheduled via cron | Production pipelines, automated report generation |
| Manual export | Low — BigQuery console only | Claude computes directly | Stale (snapshot at time of export) | One-off questions from small datasets |
| ETL/RAG pipelines | High — data engineering, vector store setup | Your pipeline computes | Batch or near-real-time | Semantic search over unstructured data alongside BigQuery tables |
Two methods stand out for most teams:
- Native BigQuery connector in Claude (zero setup, good for quick lookups)
- Coupler.io (scheduled refresh, Analytical Engine for accurate calculations, cross-source blending). The rest of the table covers options for teams with engineering capacity or specialized needs.


Connect your BigQuery data to Claude with Coupler.io
Get started for freeUse the Coupler.io connector to Claude for BigQuery users
Your data is already organized in BigQuery. Or maybe you’re still building your warehouse and need to load data from business apps into BigQuery first. Either way, Coupler.io handles both sides. It’s a data integration platform and AI analytics solution that connects 400+ business data sources to BigQuery and to AI tools like Claude through its MCP server.
For the BigQuery to Claude data integration specifically, the value of Coupler.io is the Analytical Engine layer on top of your existing queries. When Claude answers a question about month-over-month revenue growth across a 20-million-row transactions table, the Analytical Engine aggregates the numbers first. Claude explains what the trend means without attempting the computation on a truncated dataset. You also control exactly which tables and queries Claude can access, keeping sensitive data out of the conversation. Here is how to set up the BigQuery data connector by Coupler.io
Step 1: Create a data flow for BigQuery data
Sign up for a free Coupler.io account (no credit card needed). Create a new data flow and select BigQuery as the source and Claude as the destination. Or use the form below to get started right away.

Connect your BigQuery project by uploading the JSON key file from your Google Cloud service account. If you don’t have one yet, create a service account in the GCP console with BigQuery Data Viewer permissions, generate a key, and download the .json file.
Enter the SQL query for the data you want Claude to analyze. This can be a simple SELECT * FROM project.dataset.table to pull an entire table. Or use a more targeted query that joins tables, filters date ranges, aggregates data, and so on.
You can use the built-in Gemini to generate BigQuery SQL as we blogged in the BigQuery to AI article.

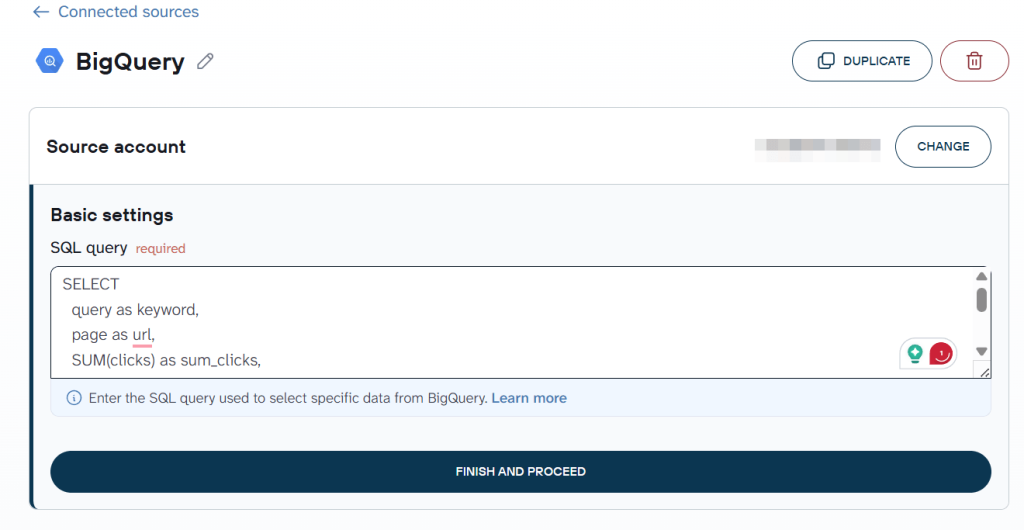
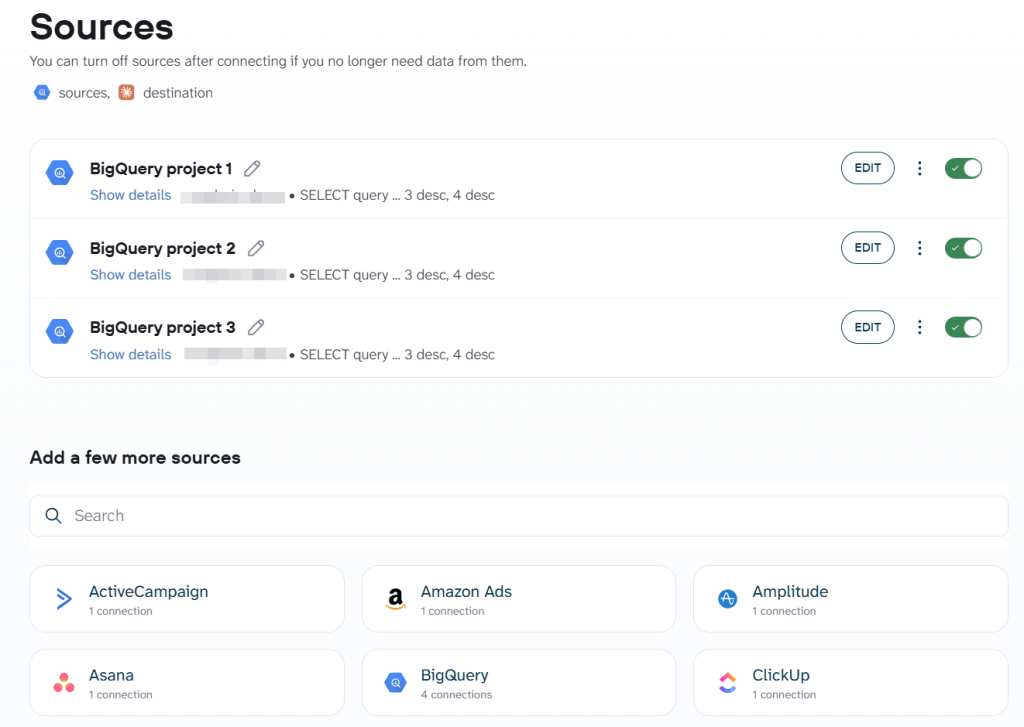
If you want to combine data from multiple BigQuery projects, datasets, or external apps, just add the needed sources in this data flow.

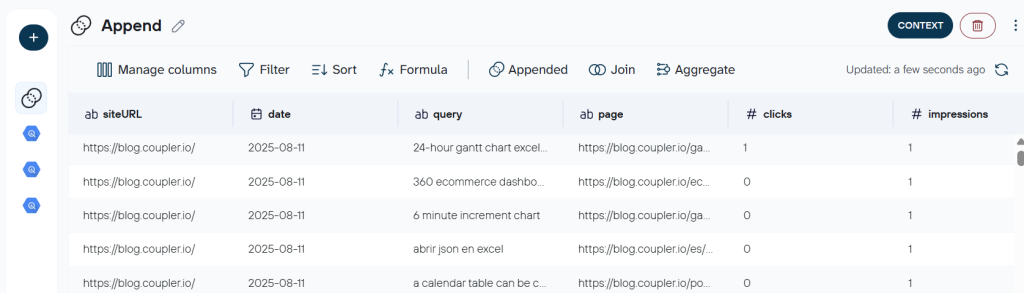
You can preview your data set before connecting it to Claude. Coupler.io also allows you to apply transformations such as renaming columns, hiding irrelevant fields, filtering rows, creating formula-based columns, or blending data from other sources. This is where you shape the dataset so Claude receives clean, analysis-ready data instead of raw warehouse dumps.

Before you analyze BigQuery data with Claude, add business context to the data flow. BigQuery column names like dim_cust_seg_cd or fct_txn_amt_net don’t explain themselves. In the Context field, describe what the tables represent, what your naming conventions mean, and any business logic Claude should know. For example: “txn_amt_net is the transaction amount after tax and refunds. Fiscal Q1 starts in February. The stg_ prefix means staging tables that should not be used for analysis.” Claude receives this context with every query, so you write it once instead of repeating it in every conversation.
Step 2: Connect Claude
Go to the Destination tab and click Get connector. This opens the Coupler.io connector page in Claude’s app. Click Connect and follow the authorization flow.

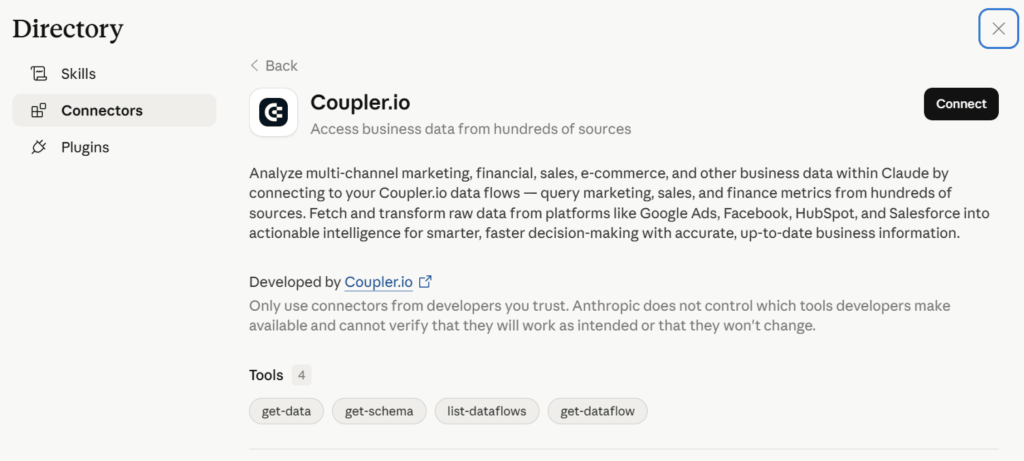
Back in Coupler.io, set the refresh schedule. You can update the data as frequently as every 15 minutes or as infrequently as once a month. Pick whatever matches how often your BigQuery data changes. Click Save and Run to start the first sync.
Step 3: Start a conversation with Claude about your BigQuery data
After a successful run, open a new conversation in Claude. Claude will ask permission to connect to the Coupler.io MCP server. Approve it.
Now ask BigQuery questions in plain English. Skip the generic “summarize my data” prompt. Instead, ask something specific:
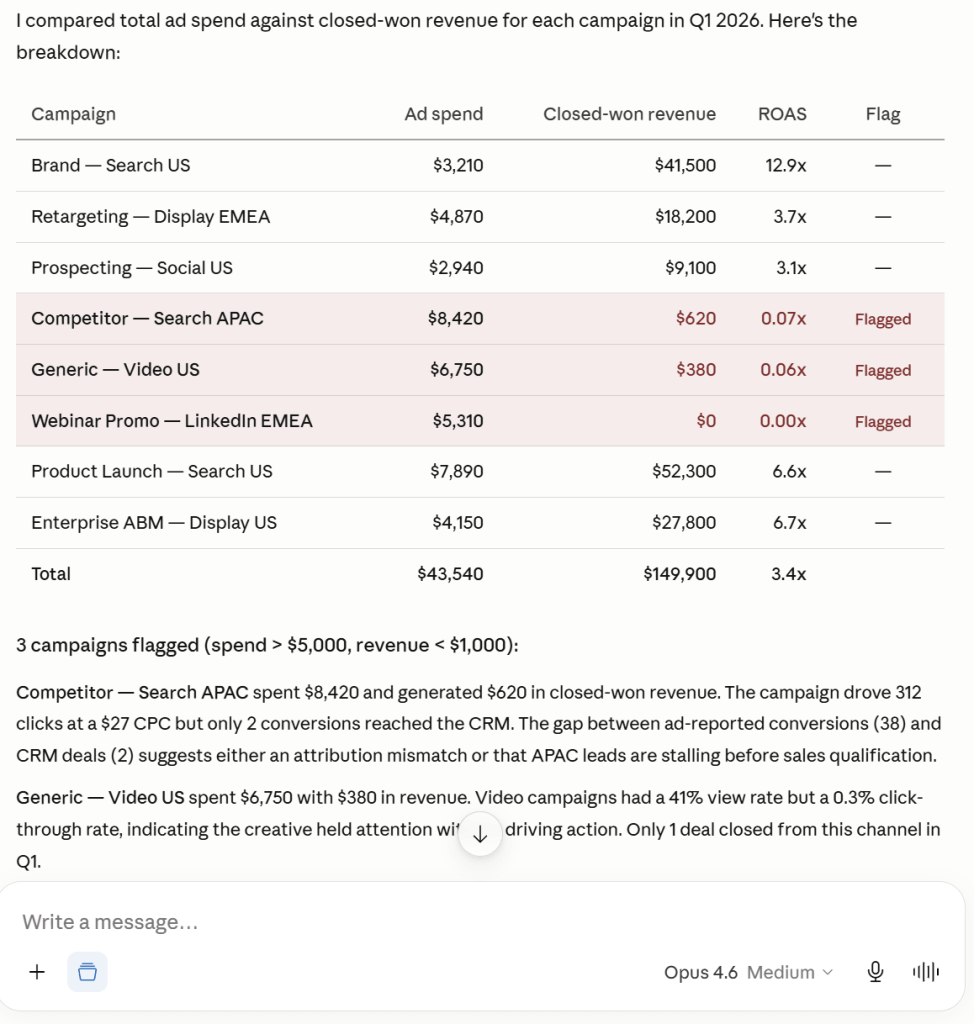
I have Google Ads spend data and CRM revenue data in the same dataset. Compare total ad spend by campaign against closed-won revenue for Q1 2026. Flag any campaigns where spend exceeded $5,000 but attributed revenue was under $1,000.
Claude pulls the data through the MCP connection, the Analytical Engine runs the calculations, and you get a breakdown you can act on. No SQL query, no file export. You ask in natural language, and Claude answers with computed results.

How does the Claude BigQuery connector differ from Coupler.io
As I mentioned already, Claude has a BigQuery connector in its connectors directory. If you’re on a Pro, Max, Team, or Enterprise plan, you can connect it in one click and start querying your warehouse data directly from a conversation.

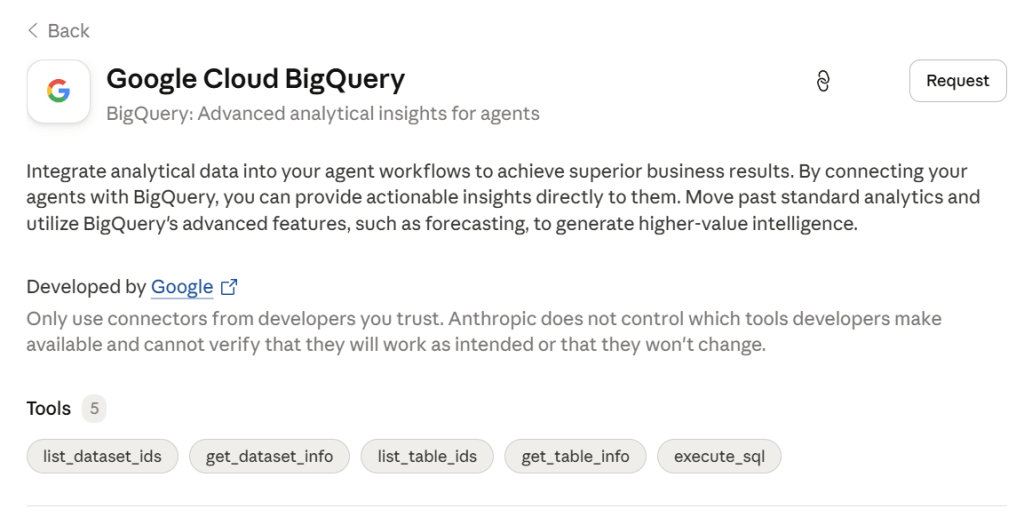
This method to connect BigQuery to Claude AI works well for contextual access during a conversation. It easily handles tasks such as checking a table schema before writing a query, listing tables and BigQuery datasets in a project, etc.
Where it falls short is analytical work. Ask Claude to calculate month-over-month growth rates across a dozen campaigns, and the native connector sends raw data to Claude. The model does the math itself. Claude is good at interpreting patterns. It’s not a calculator. On large datasets, that means approximations, truncated results, or wrong numbers.
Coupler.io fills that gap. The Analytical Engine runs the calculations before Claude sees the data. As a result, the numbers Claude reports are computed results, not estimates.
For quick lookups and schema exploration, the native connector is convenient. For recurring analysis where numbers matter, use Coupler.io.


Fable Food runs supply-and-demand analysis on BigQuery data in Claude
A global mushroom-ingredient manufacturer used Coupler.io to consolidate six source systems into BigQuery, then documented each field so Claude could interpret the data reliably. The head of operations uses Claude to generate SQL for supply-and-demand diagnostics, and the useful analyses get saved as repeatable playbooks the team can rerun on demand.
Read the case studyWhat can Claude do with BigQuery data?
Once Claude has access to your warehouse, you can work with it the way you’d work with an analyst who knows SQL and can read a schema.
Ask BigQuery questions in plain English. Instead of writing a query to find which product categories drove revenue last quarter, you type the question. Claude translates it to SQL, runs it against your data, and returns the answer in a readable format. This is text-to-SQL with Claude and BigQuery at its most practical: you describe the analysis, Claude handles the query.
Explore and document unfamiliar schemas. Point Claude at a dataset and ask it to explain what each table contains, how they relate to each other, and which columns are join keys. Useful when you inherit a BigQuery project with no documentation, or when onboarding a new analyst who needs to learn the data model.
Spot patterns and anomalies. Claude can scan large result sets for outliers that would take you an hour to find manually. Ask it to flag vendor invoices that spiked beyond their historical average, or campaigns where conversions dropped while spend stayed flat.
Generate and optimize queries. Describe what you need, and Claude writes the SQL. It can also review queries you’ve already written and suggest how to optimize BigQuery queries by reducing bytes scanned, using partition pruning, or restructuring joins.
Combine BigQuery with other data sources. Through Coupler.io, the same conversation can draw on BigQuery tables alongside Google Ads, HubSpot, Shopify, or any of 400+ connectors. Ask Claude to compare warehouse revenue figures against ad platform spend data without exporting anything.
Summarize BigQuery datasets for non-technical stakeholders. Ask Claude to turn a 50-column table into a two-paragraph summary that a VP can read in 30 seconds. Or ask for a board-ready quarterly recap that pulls numbers from your warehouse and explains them in plain language.
How to use Claude with BigQuery data – a few examples
The capabilities above work best when you see them applied to real warehouse problems. The three examples below put cross-source analysis, anomaly detection, and schema exploration into practice with specific prompts and the kind of output Claude returns. Each one is something you can adapt to your own BigQuery tables.
Use case 1: Cross-source data reconciliation
If you load both ad platform spend and CRM revenue into BigQuery (a common setup for marketing teams), you probably have a reconciliation problem. Google Ads reports 200 conversions for a campaign. Your CRM shows 140 closed deals from the same source. Where did the other 60 go? Maybe the attribution window differs. Maybe some leads stalled in the pipeline. Maybe the UTM tagging broke mid-month.
Asking Claude to reconcile these numbers manually, by uploading two CSVs and hoping it catches the discrepancies, is slow and error-prone at scale. With the Coupler.io BigQuery connection, Claude works from a single, pre-joined dataset where the Analytical Engine already matched campaigns to deals.
Try this prompt:
Compare Google Ads reported conversions against CRM closed-won deals for each campaign in Q1 2026. Show the gap between reported and actual conversions, sorted by largest discrepancy. For campaigns where the gap exceeds 30%, suggest possible causes based on the data (attribution window, lead status distribution, missing UTM parameters).
Claude returns a table with campaign names, reported conversions, actual closed deals, the gap percentage, and notes on likely causes.

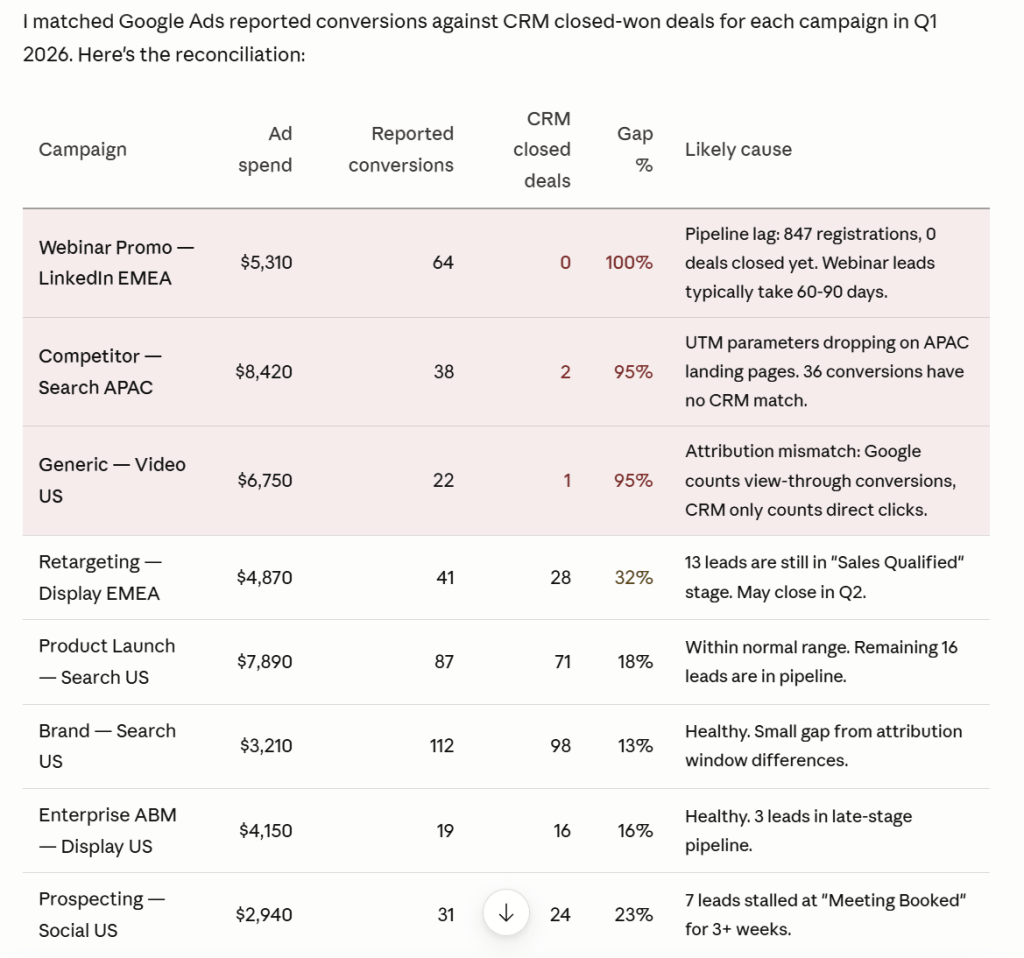
From there, you can:
- Fix UTM tagging on the campaigns with the widest gaps.
- Adjust your attribution model if the pattern is consistent across campaigns.
- Flag stalled leads in the CRM pipeline that inflate the conversion count without producing revenue.
Use case 2: BigQuery anomaly detection and cost review
Monthly budget reviews are tedious when you’re scanning dozens of vendor invoices and department line items looking for surprises. You know something spiked, the total is higher than expected, but finding which line item caused it takes an hour of filtering. This is where BigQuery anomaly detection through Claude saves real time.
With your BigQuery financial data connected to Claude through Coupler.io, you can ask Claude to do the scanning for you. The Analytical Engine computes the statistical baselines; Claude interprets which deviations matter. This also helps with BigQuery cost optimization: you can ask Claude to flag queries or processes that are driving up your warehouse spend.
Try this prompt:
Review the vendor_invoices and department_budgets tables for March 2026. Flag any line items where the actual cost exceeded the monthly average for that vendor or department by more than two standard deviations. Group the anomalies by department and rank them by dollar impact.
Claude returns a list of flagged items. A cloud infrastructure bill that jumped 40% because someone left a test cluster running. A marketing agency invoice that doubled because of an unplanned campaign extension. You get the anomaly, the magnitude, and the context.

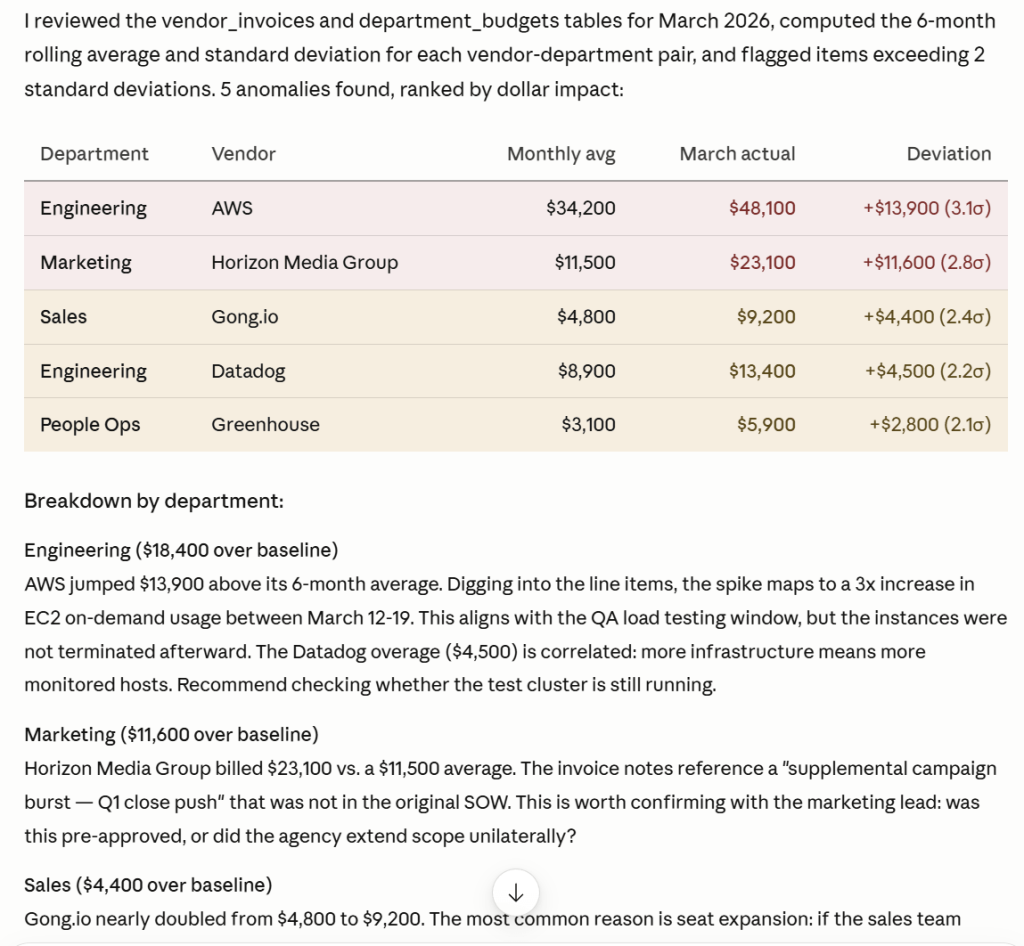
What to do with this:
- Set up the prompt as a recurring monthly analysis. Run it after each month-close to catch overruns early.
- For anomalies tied to vendor contracts, check whether the cost increase was within contract terms or needs renegotiation.
- Share the output with department heads as a starting point for their own budget reviews, rather than sending them a raw spreadsheet.
Use case 3: BigQuery schema documentation and query generation
You inherited a BigQuery project with 40 tables, cryptic column names, and zero documentation. dim_cust_seg_cd, fct_txn_amt_net, stg_ga4_events_raw. Nobody who built this is still on the team. Before you can generate insights from BigQuery, you need to understand what you’re looking at.
This use case is unique to BigQuery (and data warehouses in general). Most SaaS apps have fixed schemas. You know what a Facebook Ads campaign report contains. A warehouse schema reflects whoever built it, and it changes over time. BigQuery schema analysis is the first step before any useful data analysis can happen.
Try this prompt:
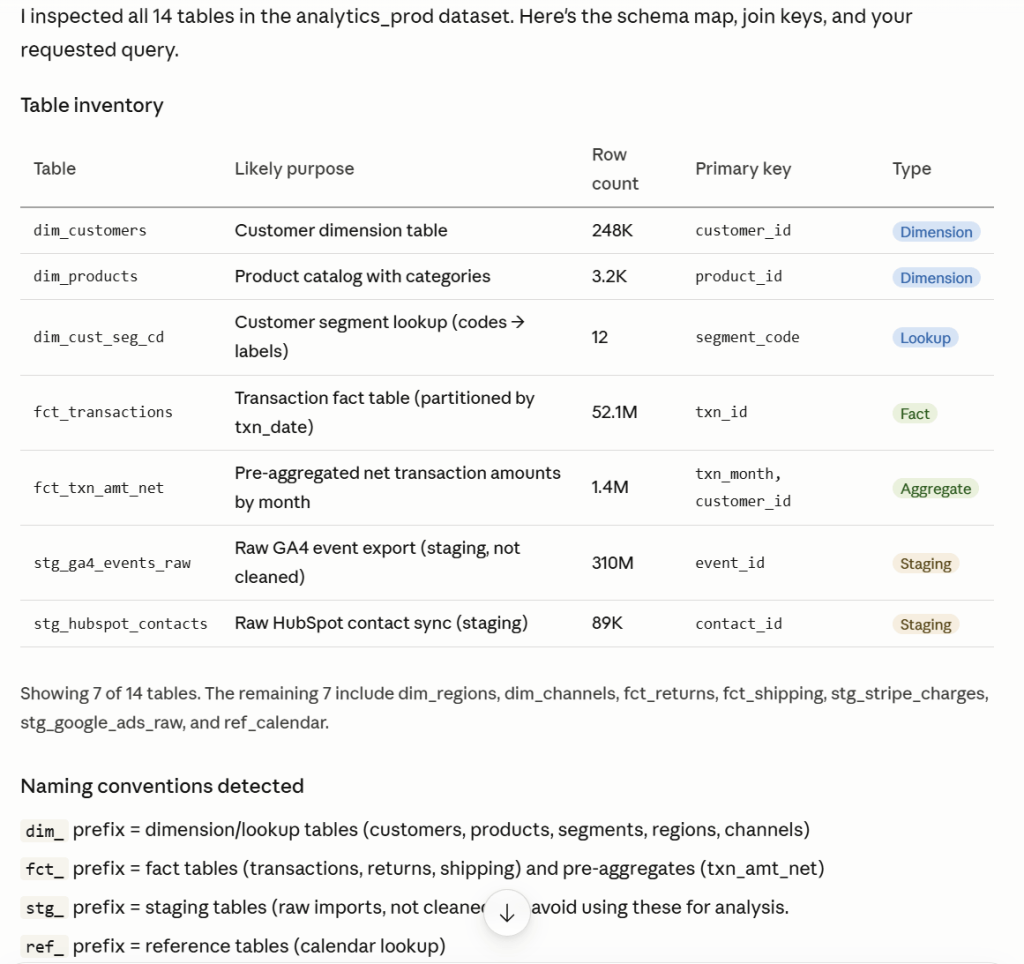
Inspect all tables in the analytics_prod dataset. For each table, describe what it likely contains based on the column names and data types. Identify which tables can be joined (shared key columns), and flag any tables that appear to be staging or temporary. Then write an optimized SQL query that joins the customer, transaction, and product tables to show total revenue by customer segment for the last 12 months. Minimize bytes scanned.
Claude maps out the schema, explains the naming conventions it detects, identifies join keys, and writes an optimized SQL query. This is text-to-SQL with Claude and BigQuery in action: you describe what you need in plain English, and Claude returns working code. Beyond this, Claude can write BigQuery queries from scratch and explain BigQuery queries you’ve already written. It can suggest how to optimize BigQuery queries to reduce bytes scanned and summarize BigQuery datasets so your team doesn’t have to reverse-engineer the schema.

Use this to:
- Build a data dictionary for your team. Copy Claude’s BigQuery schema documentation into an internal doc and refine it.
- Generate starter queries for analyses you run repeatedly, then save them as BigQuery views.
- Estimate query costs before running expensive joins. Claude can flag queries that will scan large volumes.
Ask Claude about your BigQuery data with Coupler.io
Try Coupler.io for freeClaude prompts for BigQuery data analysis
These prompts are ready to copy into a Claude conversation once your BigQuery data is connected. Each one targets a different analytical angle than the use cases above.
Trend analysis across a time-series table
Look at the daily_revenue table for the past 6 months. Break down revenue by product category, calculate the week-over-week growth rate for each category, and flag any category where growth turned negative for three or more consecutive weeks.
Data quality audit
Audit the customers and transactions tables. Report the percentage of null values per column, identify any duplicate rows by primary key, and flag orphaned foreign keys (transaction records that reference customer IDs not present in the customers table). Rank the issues by severity.
Cohort retention from a user events table
Using the user_events table, build a monthly cohort retention analysis. Group users by their first activity month, then show the percentage still active in each subsequent month. Highlight any cohort with a retention drop greater than 15 percentage points between months 1 and 2.
Query cost estimation
I need to join the orders table (partitioned by order_date, ~80M rows) with the line_items table (~200M rows) and the products table (~50K rows) to calculate margin by product category for Q1 2026. Estimate the bytes scanned for this query and suggest how to restructure it to reduce cost. Use partition pruning and column selection.
Table relationship mapping
Map all tables in the sales_warehouse dataset. For each table, list the primary key, any foreign key relationships you can infer from column names and data types, and the approximate row count from metadata. Output a relationship diagram description I can paste into a diagramming tool.
Compare metrics across two BigQuery datasets
I have a marketing_prod dataset and a finance_prod dataset in the same project. Compare total attributed revenue from marketing_prod.campaign_attribution against total booked revenue from finance_prod.monthly_revenue for Q4 2025. Show the gap by month and suggest which data source is likely more accurate for board reporting.
Natural language to SQL for a specific business question
Our VP of Sales wants to know: "Which sales reps closed the most deals over $50K in the last quarter, and what was their average deal cycle time?" Translate this into a SQL query using the deals and sales_reps tables. Include only deals with status = 'closed_won' and deal_value > 50000. Optimize for minimal bytes scanned.
What matters when you connect BigQuery data to Claude
Business context. Column names like dim_cust_seg_cd or fct_txn_amt_net don’t mean anything to Claude without explanation. Raw BigQuery data forces Claude to guess at naming conventions, metric definitions, and business logic. Coupler.io lets you attach business context to each dataset at the point of connection. Describe your schema once: explain that event_date in your GA4 export tables is a YYYYMMDD string (not a DATE type), that txn_amt_net excludes tax, that fiscal Q1 starts in February. Claude receives that background with every query. This reduces misinterpretation and eliminates the need to repeat the same context in every conversation.
Accurate calculations. Claude interprets data well but produces wrong numbers when asked to compute across large datasets directly. A request to calculate month-over-month revenue growth across 50 million transaction rows will go wrong if Claude attempts the math on whatever subset fits the context window. When you connect BigQuery through Coupler.io, the Analytical Engine handles the aggregation first and returns processed results. Claude explains what the numbers mean without guessing at the arithmetic.
Ready-to-use skills. You can load pre-built analysis skills in Claude that cover common BigQuery analysis patterns: schema exploration, trend analysis, anomaly detection, query optimization. The skill guides Claude through a structured analysis workflow without requiring you to write detailed prompts every time. Instead of explaining from scratch that you want a cost anomaly scan with standard deviation thresholds, the skill already knows the framework.
Multi-destination. The same data flow that feeds Claude can also push data to Google Sheets, Looker Studio, Power BI, BigQuery (another project), or other destinations. Your ops team gets a live spreadsheet. The exec team gets a Tableau dashboard. The marketing team gets a dashboard for analytics. You ask Claude about the same dataset. One pipeline, multiple outputs, no duplicate integrations. For more on BigQuery as a central hub for marketing data integration and data analytics use cases, see our dedicated guides.
What about BigQuery Claude data privacy?
BigQuery warehouses often contain sensitive data: financial records, customer PII, internal metrics that shouldn’t leave the organization. Before connecting any of it to an AI tool, you need to know what’s exposed and who controls access.
With Coupler.io, Claude never connects to BigQuery directly. Coupler.io sits between your warehouse and the AI tool. You control which tables and queries Claude can access through the data flow configuration. If a BigQuery table contains columns with PII or financial secrets, you filter them out before the data reaches Claude. Access is read-only: Claude can analyze what you share but cannot modify your BigQuery project, run arbitrary queries, or access tables outside the data flow.
On the compliance side, Coupler.io is SOC 2 Type II certified, GDPR-compliant, and HIPAA-compliant. Data transmitted to Claude for analysis is not retained by Anthropic for model training. Each conversation is independent; Claude does not carry data between sessions.
If you use one of the MCP server options instead, the privacy model depends on which server you choose. Google’s remote MCP server routes queries through Google’s infrastructure and uses your GCP IAM permissions to control access. Community MCP servers running locally keep data processing on your own machine. In both cases, you manage the access controls yourself through GCP service account permissions and IAM roles.
Other ways to export data from BigQuery to Claude
Beyond Coupler.io and the native Claude connector, there are other methods to get your BigQuery data into Claude. Each trades off setup time against flexibility and ongoing maintenance.
For an overview that covers all data sources, not just BigQuery, see how to connect business data to Claude.
Manual export
BigQuery’s console lets you export query results directly. Run your SQL query, click Save Results, and choose CSV, JSON, or Google Sheets as the format. Download the file and upload it to Claude. For a detailed tutorial on all export options, see our BigQuery data export guide.
Limitations are real. CSV and JSON exports cap at 1 GB per file. Anything larger requires staging through Google Cloud Storage first. You can also use the bq extract CLI command for larger exports, but that adds GCS as an intermediary. The Google Sheets option tops out at roughly 16,000 rows, which rules out most warehouse-scale datasets. There’s no scheduling for file exports: BigQuery’s scheduled queries save results to tables, not to downloadable files. Every time you need fresh data in Claude, you repeat the process.
This works for one-off questions from small datasets. It falls apart the moment you need recurring analysis, large data volumes, or results from joined tables that require pre-processing.
Google’s BigQuery MCP server
Google released a fully managed remote BigQuery MCP server in early 2026. It runs on Google’s infrastructure and provides an HTTP endpoint that AI tools, including Claude, connect to for querying data.
The server uses OAuth 2.0 with IAM for authentication. You authenticate with standard Google Cloud identities. Tools exposed include query execution, metadata retrieval, table and dataset listing, and data insights. Because it runs remotely, you don’t install or host anything locally. Access is read-only by default for query operations.
Setup requires a GCP project with the BigQuery API enabled, an OAuth consent screen config, and appropriate IAM roles assigned to the identity Claude will use. If your organization already manages GCP projects with proper IAM policies, this is manageable. If your team is new to GCP, the authentication setup can take an afternoon of reading documentation and troubleshooting permissions errors.
Google also offers an open-source alternative: the MCP Toolbox for Databases. This runs locally via stdio transport and gives you more control over configuration. It’s a good option if you prefer local execution or need to customize how ai agents interact with your warehouse.
The limitation: Claude gets direct SQL access to your warehouse, but you handle all cost controls yourself. BigQuery bills by data scanned, and an unconstrained agent can run expensive queries. You need to set up maximum bytes billed limits, restrict which bigquery datasets are accessible, and monitor usage. There’s no Analytical Engine. Claude does its own math on the query results.
Coupler.io’s connector is also MCP-based. But it’s available as a ready-to-use Claude connector and does not require you to configure IAM roles, OAuth consent screens, or billing safeguards. The Analytical Engine layer handles the calculations, and you control data access through the Coupler.io interface rather than through GCP IAM policies.
Community BigQuery MCP servers
Several open-source BigQuery MCP servers exist on GitHub. The two most established are mcp-server-bigquery (Python-based, installable via uvx) and mcp-bigquery-server (Node-based, installable via npx). Both run locally and connect to Claude Desktop through stdio transport.
Setup involves editing your Claude Desktop config file with the server command, your project ID (the dataset_id and location are optional filters), and a service account key file path. The ergut server adds field-level access restrictions so you can block Claude from reading specific columns that contain PII or financial secrets. Both support maximum bytes billed to prevent runaway query costs.
These are good options if you want granular control over what Claude can access and how much it can spend per query. The cost is that you own the server: you install it, keep it updated, manage the service account credentials, and troubleshoot when authentication breaks after a GCP policy change.
API scripts and function calling
BigQuery has mature client libraries in Python, Node.js, Java, and Go. You can build a data transfer pipeline that pulls data from BigQuery and sends it to the Anthropic SDK without any browser or UI involved.
The script approach: a Python script runs a SQL query against BigQuery and formats the results as a prompt. It sends that prompt to Claude’s Messages API via the Anthropic SDK, and the response comes back as text. You can automate this with cron, Airflow, Cloud Functions, or any orchestrator. It’s the right fit for fixed workflows that run on a predictable cadence: a weekly cost report, a daily anomaly scan, a monthly board summary.
Function calling (tool use) works differently. You define functions that execute specific BigQuery queries (get_revenue_by_segment, list_anomalies, fetch_campaign_metrics) and let Claude decide which function to call based on the user’s question. This is the right architecture for conversational interfaces where queries are unpredictable.
Both approaches require data engineering effort. You’re managing BigQuery authentication (service accounts, OAuth tokens), Claude API keys, query cost controls, error handling, retry logic, and API versioning on both sides. When BigQuery changes a column name or Claude’s API updates its response format, you fix it. For teams with engineering capacity, this is the most flexible option. For teams without it, the maintenance cost compounds.
ETL/RAG pipelines
BigQuery is already the warehouse in most data architectures, so this section works differently than for other sources. You’re not adding a warehouse between a SaaS app and Claude. You’re adding a retrieval layer on top of data that’s already in BigQuery.
If you need help getting data into BigQuery first, see our guide on how to import data into BigQuery.
RAG (retrieval-augmented generation) makes sense when you need to combine structured SQL queries with semantic search over unstructured text. Most LLMs, including Claude, work well with structured tabular data. But if your BigQuery project also stores support tickets, product descriptions, or internal docs, a vector store lets Claude search that text by meaning rather than by exact keyword.
The architecture adds a vector database (Vertex AI Vector Search, Pinecone, Weaviate) between BigQuery and Claude. You embed text fields from BigQuery into vectors and store them in the vector database. Claude queries both the structured data (via SQL) and the unstructured data (via semantic search).
This is the right approach for teams that need to ask questions like “find all support tickets related to billing disputes and correlate them with churn data from the customer table.” It requires ML engineering expertise for embedding, indexing, and retrieval tuning. For teams doing purely structured analytics, this adds complexity without clear benefit.
Which method should you choose?
Manual export covers one-off questions where you need a quick answer from a small dataset. Download a CSV, upload it to Claude, get your answer, move on. No setup required, but no reusability either. Once you need the same analysis next week with fresh data, you’re doing the whole process again.
The built-in BigQuery connector in Claude handles contextual lookups mid-conversation. Check a schema, pull a few rows, verify a column name. It’s zero-setup and fast. For analytical work (aggregations, trend calculations, cross-table joins), it passes the computational load to Claude, which means accuracy depends on dataset size and complexity.
Google’s remote MCP server gives Claude direct SQL access to your warehouse. If your team already manages GCP IAM policies and knows how to set up OAuth consent screens, this is a reasonable option. You get live query execution without a third-party tool. You also get the responsibility of cost controls and access management.
Community MCP servers add features that Google’s official server doesn’t: field-level access restrictions, configurable cost caps, dataset filtering. If data sensitivity or query cost control is a primary concern, these give you granular levers. The trade: you run and maintain the server yourself.
API scripts and function calling are for teams building production systems. If Claude is one component in a larger data pipeline, feeding automated reports, powering an internal analytics chatbot, or running scheduled analyses, this is the architecture that gives you full control. It’s also the architecture that requires the most engineering time.
Coupler.io fits teams that need recurring AI-powered BigQuery analysis with accurate numbers and no infrastructure to maintain. The Analytical Engine verifies the math. The MCP connector handles the data delivery. Scheduled refresh keeps the data current. You set it up once and focus on asking questions instead of managing pipelines.
Turn your BigQuery warehouse into a Claude-ready data source
Sign up for freeFAQs
Can Claude write and execute SQL queries against my BigQuery warehouse?
Yes, but it depends on the connection method. With Google’s BigQuery MCP server or community MCP servers, Claude can generate and execute SQL queries directly. With Coupler.io, you define the SQL query in the data flow setup, and the Analytical Engine processes the results before Claude sees them. With manual export, Claude can write SQL for you to run manually, but it can’t execute queries on its own.
Does connecting BigQuery to Claude expose my entire warehouse?
No. Every method lets you control access scope. In Coupler.io, you define which tables and queries Claude can access through the data flow configuration. With MCP servers, you specify which datasets and projects are visible. The community server by ergut even supports field-level restrictions to block specific columns. With the native Claude connector, access follows your GCP IAM permissions.
How do I control BigQuery costs when Claude runs queries?
BigQuery bills by bytes scanned, and an AI agent can run expensive queries if unconstrained. With Coupler.io, costs are predictable: the query runs once per scheduled refresh, and you write the query yourself. With MCP servers, set the maximum_bytes_billed parameter to cap individual query costs. With API scripts, add cost checks in your code before executing queries. The native Claude connector inherits your BigQuery project’s cost controls, but does not add its own safeguards.
Can I combine BigQuery data with other sources in the same Claude conversation?
With Coupler.io, yes. You can add multiple sources to a single data flow: BigQuery tables alongside data from Google Ads, HubSpot, Shopify, or any of the 400+ supported connectors. Claude sees the blended dataset as one unified source. With MCP servers, you’d need to configure separate servers for each source and manage the connections independently. With manual export, you’d upload multiple files and ask Claude to cross-reference them, which works but gets unwieldy fast.