TikTok Ads reports are easy to export once and upload to Claude. But when you need them regularly, the CSV gets obsolete quickly, and Claude’s analysis can’t rely on it.
Learn how to connect TikTok Ads to Claude to run accurate PPC analysis with up-to-date data and optimize campaigns more efficiently.

Choose the right method to connect TikTok Ads to Claude
| Connection method | Setup effort | Who does the math | Best for | Watch out for |
|---|---|---|---|---|
| Coupler.io Claude TikTok Ads connector | Low | Coupler.io Analytical Engine | Recurring PPC analysis, multi-account reporting, and teams that want Claude-ready data without engineering work | Automatic data refresh is available only on paid plans |
| Manual export | Low for one-off, high over time | You, or Claude, after you paste the file | Single checks, ad hoc questions, and small datasets | No scheduling, repetitive cleanup, and awkward week-to-week comparisons |
| Custom MCP server | High | Your stack, after the server is built | Teams that want a fully custom data layer and have developers to maintain it | You build, secure, and maintain the server yourself |
| API scripts | High | Your script | Fixed reporting pipelines, scheduled exports, and internal analytics teams | Pagination, auth, schema changes, and ongoing script maintenance |
| Function calling | High | Your application logic | Conversational apps where Claude decides which function to call | Requires an app layer, tool design, and maintenance |
For most marketing teams, the TikTok Ads connector by Coupler.io is the cleanest path because it turns TikTok Ads into structured, refreshable data before Claude sees it. Manual export fits a one-time analysis, while the API-based routes make sense only when engineering capacity is already part of the plan.


Analyze TikTok Ads in Claude with Coupler.io
Get started for freeUsing the Coupler.io Claude TikTok Ads connector
Coupler.io is a no-code data integration and AI analytics platform. It connects business data to Claude through an MCP-based integration, so AI analyzes structured information instead of a pasted export. The platform provides over 400 data sources for Claude integrations, runs calculations through its Analytical Engine, and delivers computed results to Claude for interpretation.
Check the AI integrations available in Coupler.io beyond Claude.ai, such as ChatGPT, Gemini, Cursor, Perplexity, etc.
For TikTok Ads, that matters because the useful analysis rarely happens at the raw export level. You usually need multiple ad accounts in one view, pre-calculated metrics like CTR, CPC, and ROAS, and a dataset that reflects your reporting logic before Claude answers questions. Coupler.io handles that calculation layer, so Claude interprets results, not doing arithmetic on numbers it can’t fully verify.
Install the Coupler.io connector in Claude right away. After that, simply tell Claude what kind of TikTok Ads analysis you need, and it will ‘communicate’ with Coupler AI to
- Connect your TikTok Ads account
- Prepare a data set for analysis
- Add a semantic layer and AI context
- Connect a data destination for your report if needed
- Refresh your data on a schedule you define

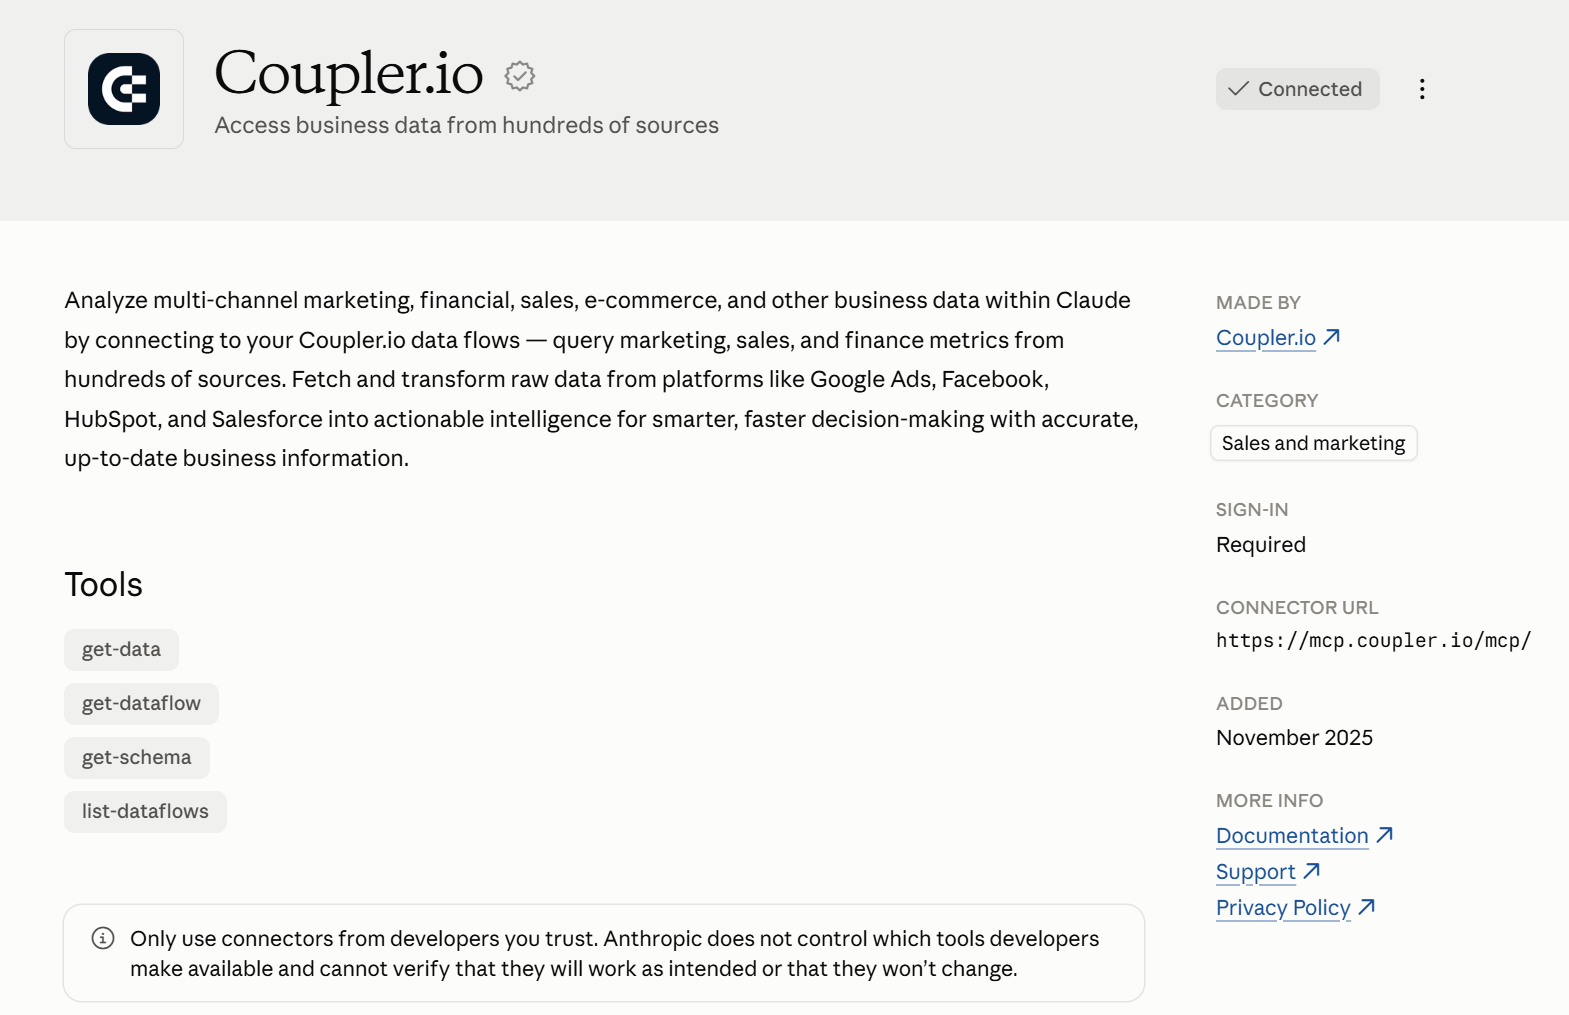
There is also an alternative path to configure the TikTok Ads to Claude connection in the Coupler.io UI, which looks like this👇
Step 1: Create a data flow for TikTok Ads data
To start creating a data flow with TikTok Ads as the source and Claude as the destination, click Proceed in the form below:

Next, sign up for Coupler.io (no credit card required). Connect your TikTok Ads account, choose the ad account(s) you want to pull data from, and select the report type that fits your analysis.
Then configure other required parameters, such as the report period, as well as the TikTok Ads metrics and dimensions to include.

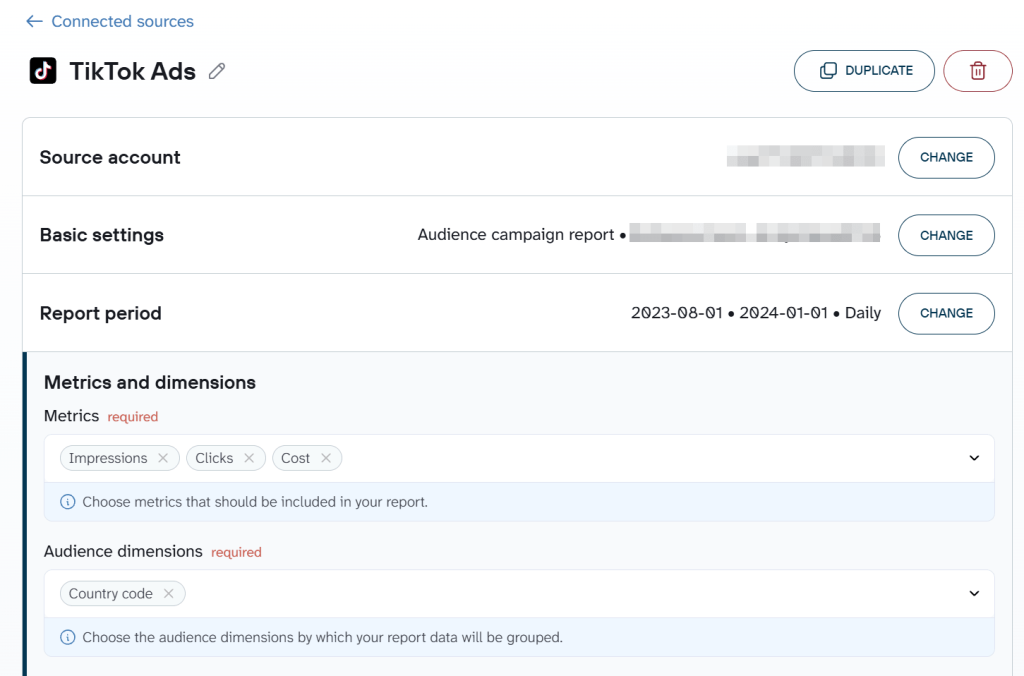
Before moving to the next step, you can add more sources to the same data flow. Blend records from different report types and accounts within TikTok Ads, or even merge data from other ad platforms and apps in a single setup rather than separate workflows.
Coupler.io also allows you to add business context in the dataset to provide Claude with the necessary background for accurate analysis, not just raw data that it can’t interpret. For example, you can specify how your conversion events map to goals or which attribution window you use, so you don’t need to clarify this in every conversation.
Learn how to connect Google Ads to Claude.
Step 2: Connect Claude
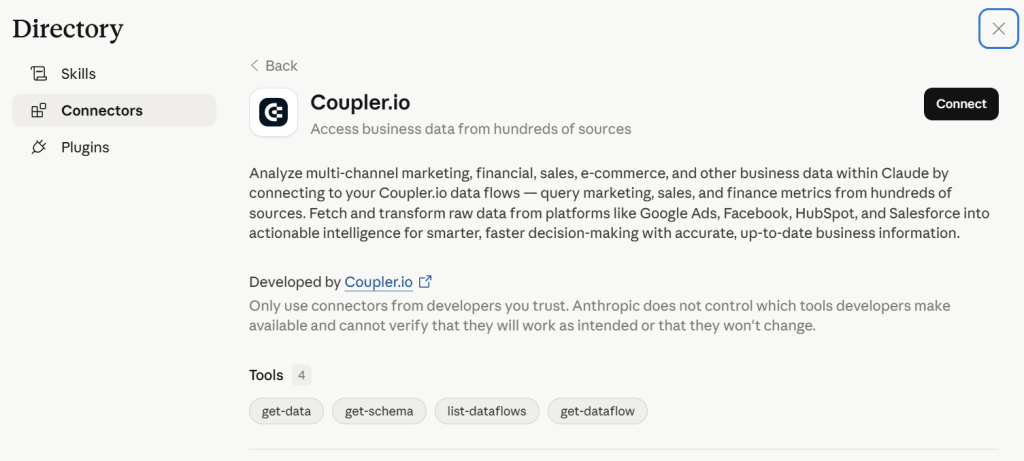
When you’re ready with your data, click Get connector, which takes you to the Coupler.io connector page in the Claude app. Follow the instructions in Claude to complete the setup, return to Coupler.io, and run the data flow.

Next, enable Automatic data refresh and specify the schedule. You can have your data updated as often as every 15 minutes. Click the Save and run button to activate your automation.

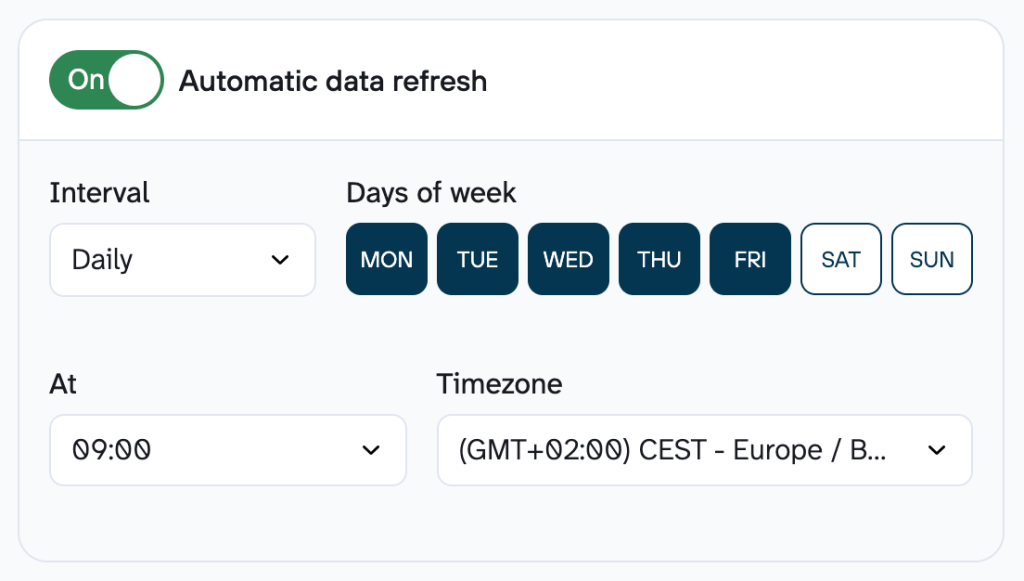
With automatic data refresh, Coupler.io keeps your records up to date on the schedule you set. To make sure Claude works with the latest PPC figures, start a new chat or ask it to re-fetch the refreshed data.
The flow is nearly the same when you connect Instagram Ads to Claude or connect Facebook Ads to Claude with Coupler.io.
Step 3: Start a conversation with Claude about TikTok Ads data
After the first successful run, open Claude and allow it to connect to the Coupler.io MCP server when prompted. At that point, you can generate TikTok Ads insights with Claude AI through natural language.
A useful prompt should match a real PPC decision. Here is an example tied to budget allocation:
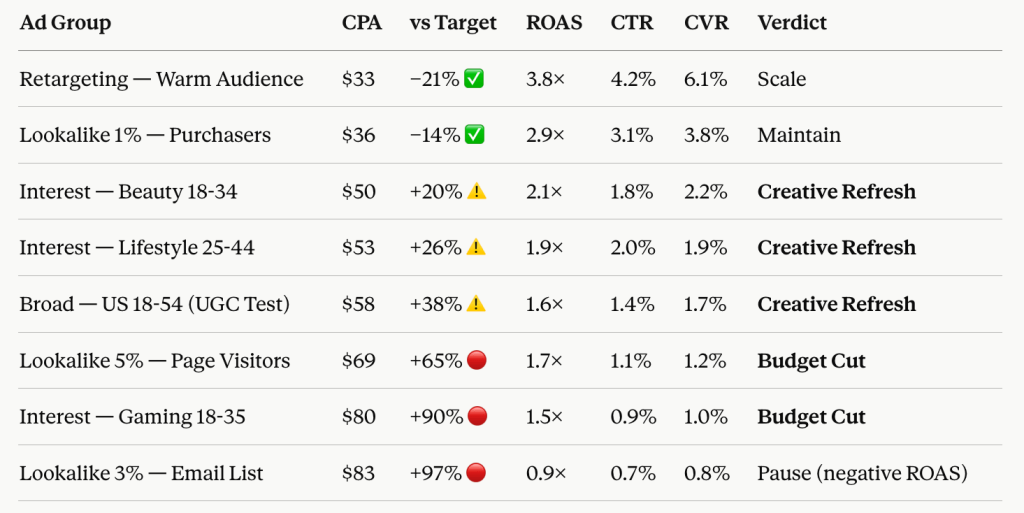
Review my TikTok Ads ad group data for the last 14 days. Identify which ad groups have a CPA above target but still show positive ROAS, and tell me which ones deserve a budget cut versus a creative refresh.
Here’s what Claude would return:

What TikTok Ads data can you connect to Claude?
Coupler.io’s TikTok Ads connector supports a wide range of report types:
- Basic advertiser report – overview of account-level performance metrics such as spend, impressions, clicks, and conversions.
- Audience campaign report – performance data for campaigns with audience segmentation insights.
- Audience advertiser report – aggregated account-level performance broken down by audience segments.
- Audience ad report – ad-level performance with detailed audience data.
- Audience ad group report – ad group performance by audience segments.
- Playable Ad report – engagement and interaction metrics for playable ad formats.
- Playable Ad report by country – playable ad performance by geographic location.
- Dynamic Showcase Ads (DSA) campaign report – campaign-level performance for DSA campaigns, including product-driven metrics.
- Dynamic Showcase Ads (DSA) report – detailed performance of DSA ads across products and creatives.
- Dynamic Showcase Ads (DSA) advertiser report – account-level overview of all DSA activity and results.
- Dynamic Showcase Ads (DSA) ad group report – performance metrics for DSA ad groups with targeting and product feed data.
Connect data to Claude with Coupler.io
Get started for freeWhat matters when you analyze TikTok Ads data with Claude
Business context
TikTok Ads uses account structure and metric definitions that need interpretation before analysis starts. Without context, Claude treats different campaign types as equivalent and all conversions as the same event, leading to wrong conclusions. Coupler.io lets you attach context directly to your datasets. For example, you can specify that “conversion” in this account means “add to cart” rather than purchase. Once that definition is set, Claude reasons from your business logic in every conversation, not from raw column names it has to guess at.
Accurate calculations
Raw TikTok Ads exports mix attribution windows in ways that distort blended calculations. If one campaign runs on 7-day click attribution and another on 1-day view, Claude shouldn’t be asked to add them together as if they follow the same measurement logic. Coupler.io’s Analytical Engine handles the computation and returns verified results.
You summarize TikTok Ads results with Claude or analyze the data in other ways without worrying about flawed inputs that mess up the output.
Ready-to-use skills
Rebuilding prompt logic from scratch every week is time-consuming. Instead, ready-to-use skills for paid social data cover the analysis patterns that come up every week:
- TikTok Ads Creative Analysis for creative performance ranking
- TikTok Ads Audience Analysis for audience efficiency comparison
- TikTok Ads Budget Pacing for tracking spend against monthly caps.
For hook rate, completion funnel, and CTR-to-CVR drop-off specifically, TikTok Ads Creative Fatigue and Velocity applies the same framework every time you ask.
Multi-destination
Most advertisers using TikTok Ads run parallel campaigns on Meta or Google and need to compare cross-channel CPAs. The same Coupler.io data flow connected to Claude can simultaneously import data to Google Sheets for client-facing weekly reports. Or you can send it to Data Studio for a live TikTok Ads dashboard. Use a single pipeline with multiple outputs to avoid exporting data from three platforms and reconciling numbers across tools.
Examples of how to use Claude with TikTok Ads
To show how AI can support TikTok Ads optimization, I used the same data flow connected to Claude via Coupler.io. The three TikTok Ads analytics use cases below focus on high-impact optimization areas:
- creative fatigue
- budget allocation across ad groups
- video creative performance
Identify creative fatigue before your ROAS drops
Creative fatigue usually shows up before performance fully collapses. The early warning signs are spread across several metrics. Frequency climbs, CTR slips, CPC rises, and ROAS starts to decay after the damage is already visible in the account. That is hard to catch manually when you have dozens of TikTok ads and a weekly reporting window that only shows you the end result.
With Coupler.io connecting data to Claude on a schedule, you can ask AI to trace the decline across the data rather than checking each creative one by one.
Here is my TikTok Ads performance data for the last 30 days, broken down at the ad (creative) level. Columns include: ad name, impressions, CTR, CVR, CPC, spend, frequency, and ROAS. Identify which creatives show signs of fatigue: look for combinations of increased frequency, declining CTR, and rising CPC over time. Flag each fatigued creative by name, estimate roughly when the decline began based on the data, and rank them by urgency. For each flagged ad, state which metric moved first and by how much.
Claude should return a ranked table of fatigued creatives, a short narrative on when the decline started for each, and a priority order for pausing or refreshing. The output gives you an action list rather than a general warning.

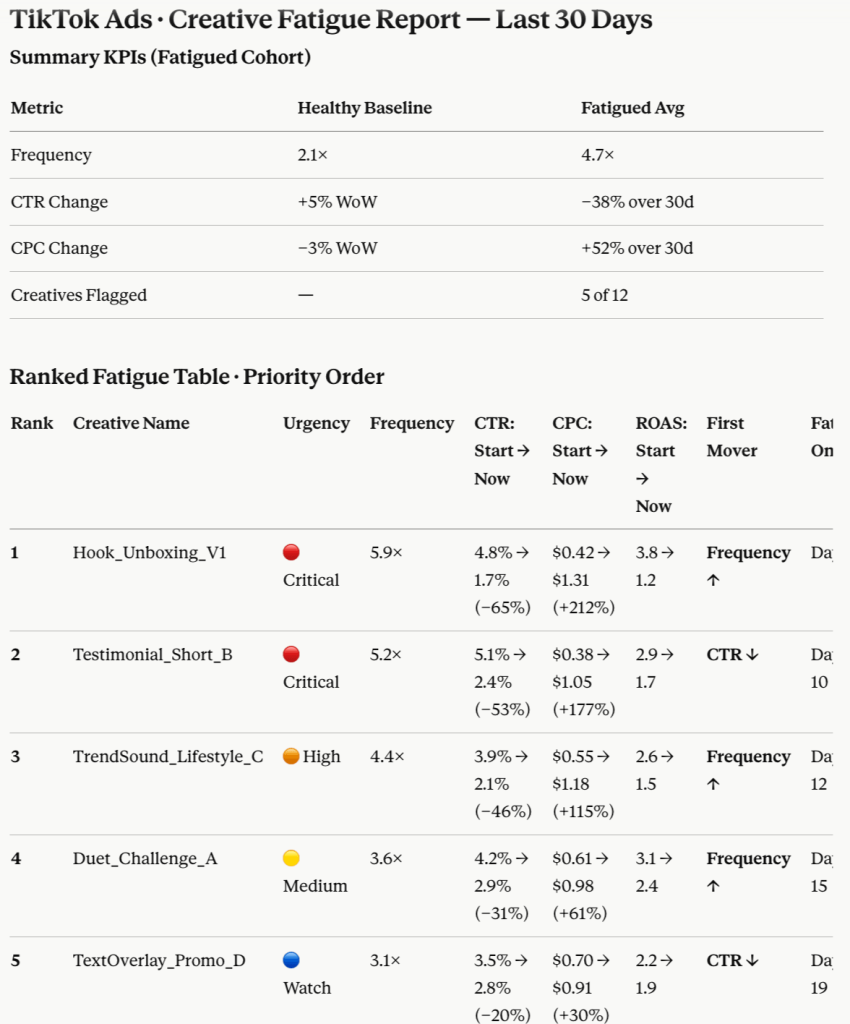
Specific takeaways:
- Watch for frequency above 3 before the ROAS drop becomes visible.
- Treat falling CTR plus rising CPC as an earlier warning than ROAS alone.
- Replace the weakest creative first if the frequency climb started before the CTR drop.
To run this fatigue check every week, use the TikTok Ads Creative Fatigue and Velocity skill. It packages the same frequency/CTR/CPC pattern matching into a repeatable ask.
Optimize budget allocation across ad groups based on CPA trends
Budget decisions get messy when ad groups are on different trajectories. One ad group may look expensive on CPA but still improve ROAS, while another shows a low CPA and still wastes spend because it can’t scale. Considering one metric without the other leads to the wrong reallocation.
Claude handles this well when the data includes the right breakdown. Coupler.io gives it a clean 14-day ad group view, so the recommendation is based on actual trend data rather than a quick glance at a single day of spend.
Using this TikTok Ads data broken down by ad group for the last 14 days, calculate CPA and ROAS for each ad group. Identify the top 3 ad groups by cost efficiency and the bottom 3 by CPA. Then produce a specific reallocation recommendation: which ad groups should receive an increased budget, which should be paused or reduced, and what percentage shift do you suggest for each? Show your reasoning tied directly to the numbers in the data.
You should get a table with CPA, ROAS, and a budget action for each ad group, plus a specific reallocation plan tied to the numbers.

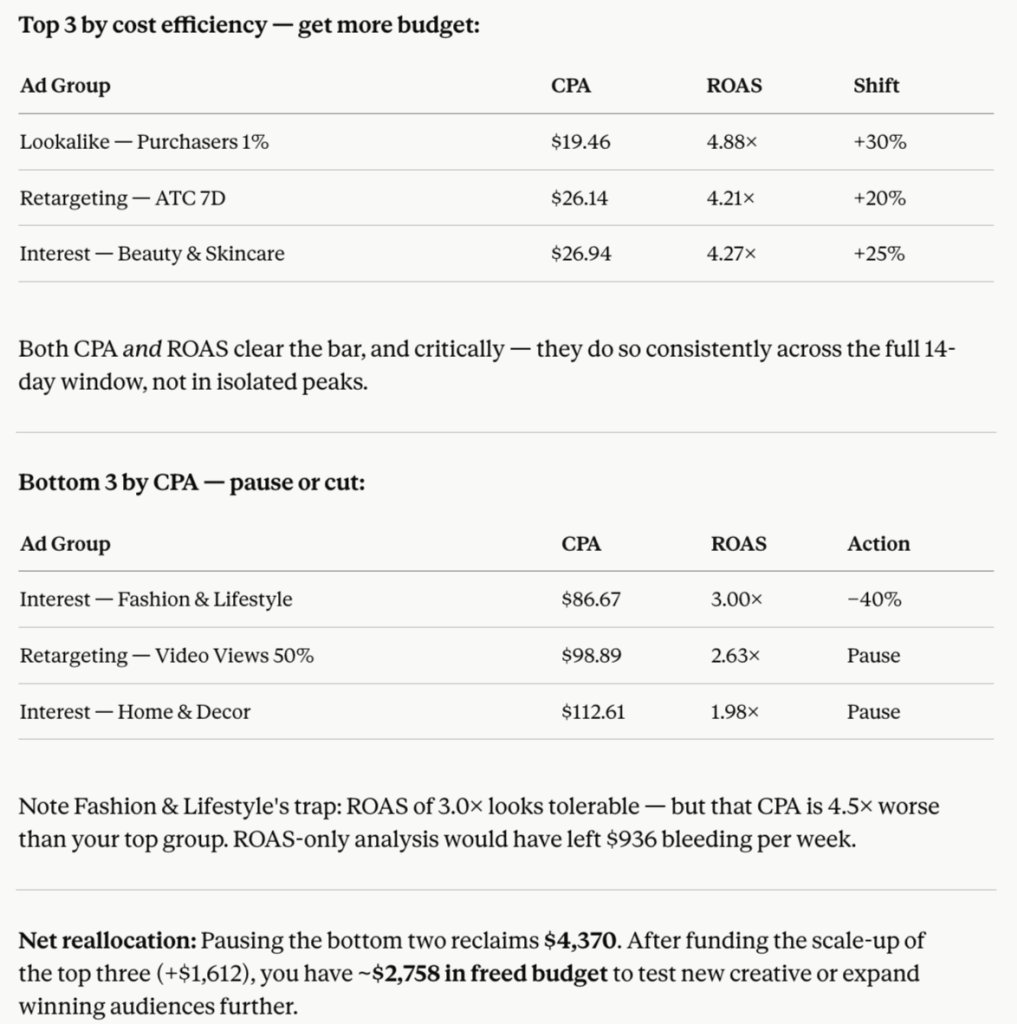
Specific takeaways:
- Use CPA and ROAS together before shifting the budget.
- Increase spend only where CPA is efficient, and performance is consistent across the full window.
- Pause or reduce ad groups that show high CPA across the entire 14-day period, not just one bad day.
The TikTok Ads Waste and Scale skill runs this CPA/ROAS reallocation analysis on demand. And TikTok Ads Budget Pacing checks whether you’re on track against your monthly cap in the same conversation.
Diagnose low hook rates to improve video creative performance
TikTok is a video-first channel, and hook rate matters more here than in most other ad formats. If the first three seconds fail, the completion funnel, the CTR, and the CPA almost never recover. The problem is that TikTok Ads reporting spreads these signals across different columns, so connecting them manually takes time.
Claude can diagnose where the drop starts when Coupler.io has already organized the video metric data and attached the right business context about what a “conversion” means in your account.
Here is my TikTok Ads video performance data. Columns include: ad name, impressions, 3-second video views, 25% completion rate, 75% completion rate, CTR, CPA, and spend. For each ad, calculate the hook rate (3-second views divided by impressions). Rank all ads by hook rate from lowest to highest. For the bottom 30% by hook rate, identify whether the drop-off pattern suggests the problem is in the opening frame, the audio cue, or the on-screen text based on any patterns visible in completion rate data. Suggest three specific creative angles to test in the next batch of ads.
As a result, Claude should return a ranked list by hook rate, a diagnosis for the bottom performers, and a concrete testing plan for the next creative batch.

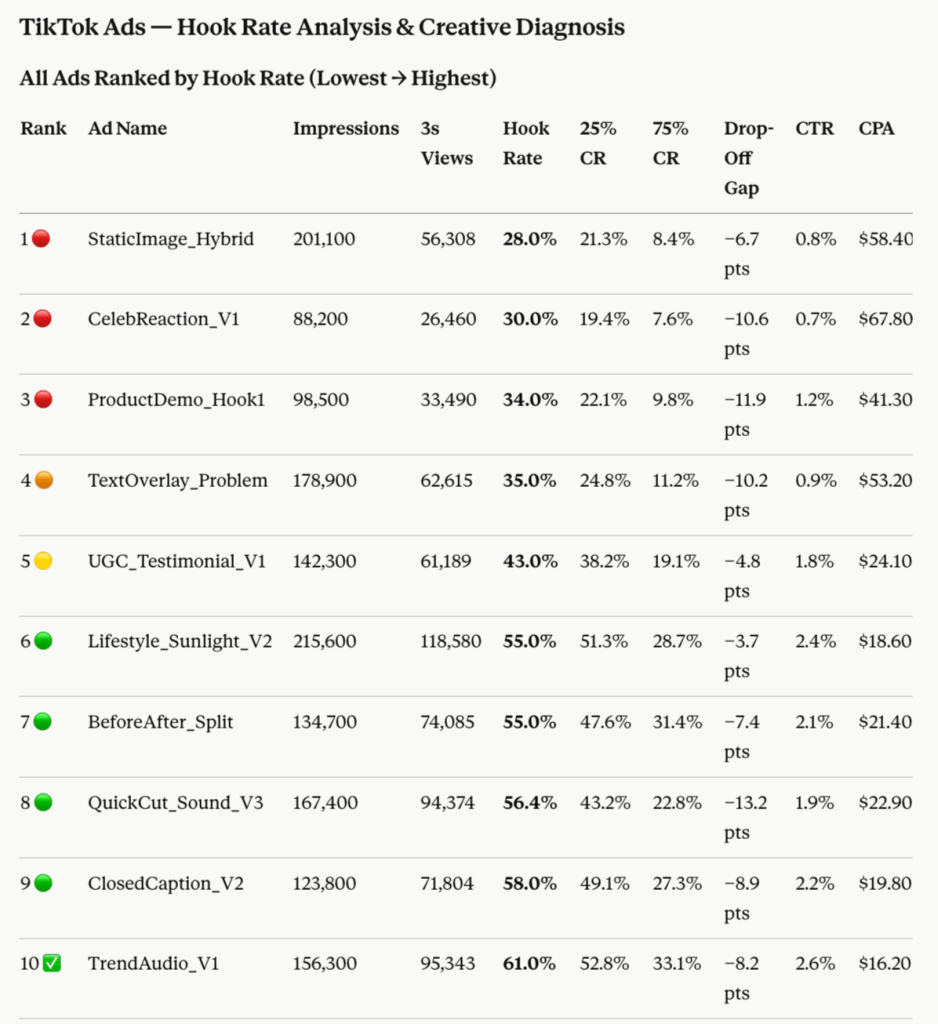
Specific takeaways:
- A weak hook rate points to a creative problem before the click stage.
- A large gap between 3-second views and 25% completion usually points to a weak opening frame, not a bad offer.
- Test a new creative angle in the next batch, not just a re-edit, when multiple low-hook-rate ads show the same drop-off pattern.
This hook-rate diagnosis is exactly what the TikTok Ads Creative Analysis skill automates. And you won’t need to rebuild the ranking-plus-diagnosis prompt each time you review a new creative batch.
Talk to Claude about your TikTok Ads performance
Try Coupler.io for freeClaude prompts for TikTok Ads analysis
From my experience, once TikTok Ads data is connected to Claude, the quality of further analysis depends heavily on how you frame your prompts. Below are examples of prompts I used to analyze campaigns, ad groups, creatives, audiences, and trends, each focused on a specific optimization task.
Here is my TikTok Ads campaign data for the last 30 days. Rank all campaigns by ROAS and flag any with a CPA more than 20% above my target of [X]. Summarize which campaigns are worth scaling and which should be reviewed.Using this ad group-level data, compare CTR and CVR across all ad groups in campaign [X]. Identify which ad groups have high CTR but low CVR, and suggest what that pattern likely indicates about audience-offer alignment.Here is my ad-level performance data, including hook rate, 75% video completion rate, and CPA. Identify the top 5 ads by hook rate and check whether a high hook rate correlates with a lower CPA in this dataset. Flag any exceptions.Analyze the frequency data across my active ad groups. Flag any ad groups where average frequency has exceeded 3 in the last 7 days, and CTR has dropped week-over-week. List them ranked by severity.Using this placement-level breakdown (In-Feed, TopView, Branded Mission), compare CPC, CTR, and ROAS for each placement type over the last 14 days. Recommend which placements to prioritize in the next campaign and which to deprioritize.Here is my TikTok Ads spend data by day for the last 4 weeks. Identify which days of the week consistently produce the lowest CPA and highest ROAS. Suggest a dayparting or budget scheduling adjustment based on this pattern.Review this audience-level performance data segmented by age group and gender. Identify the top-performing demographic segments by ROAS and the worst-performing by CPA. Recommend whether I should tighten targeting or keep it broad, and why.Here is my last 60 days of TikTok Ads data at the campaign level. Identify any trend breaks, points where CPM, CPC, or ROAS shifted significantly, and flag the weeks they occurred. Note whether the shift appears to be budget-driven, creative-driven, or external.
Other ways to export data from TikTok Ads to Claude
Coupler.io fits best when you need to connect TikTok Ads to Claude for recurring PPC analysis, such as weekly campaign reviews, ongoing budget optimization, and so on. But not every analysis needs that. If you are doing a one-time post-campaign audit or your team already maintains its own data infrastructure, a different method may be a better starting point.
Manual export
Manual export from TikTok Ads Manager demands your time to set the date range, clean the dataset, and re-upload the file whenever you need the most recent numbers. For ongoing TikTok Ads performance analysis with Claude, that overhead compounds quickly.
However, manual export is perfectly reasonable in one scenario: an occasional pull where freshness doesn’t matter. If you just need a data snapshot, saving a CSV or Excel file from the Reporting section gets the job done.
Custom MCP server
A custom MCP server makes sense in one scenario: your team already builds and operates its own data infrastructure. You need full control over what Claude can access, how the data is structured, and how it connects to internal systems beyond TikTok Ads.
In this case, you own the entire stack from designing which tools the server exposes to Claude to writing the connection logic against the TikTok Ads API. When TikTok changes its API schema or deprecates an endpoint, you fix it. When Claude’s MCP spec evolves, you update the server. For a team with platform engineers, that’s manageable. For a marketing team, it’s a second job.
Coupler.io’s connector uses the same MCP protocol but ships as a ready-to-use Claude connector. You do not need to build the server, track API changes, manage hosting, and more.
API scripts and function calling
API scripts give you a fixed pipeline: authenticate against the TikTok Ads API, pull the data you need, transform it, and push it somewhere Claude can access. The advantage is precision. You control exactly which metrics, date ranges, and breakdowns reach Claude, and you can schedule the pull to run overnight so the data is ready in the morning.
But precision comes with upkeep. The TikTok Ads API uses cursor-based pagination, so your script needs to handle multi-page responses correctly. Authentication tokens expire and need rotation. TikTok periodically updates its API schema. A field gets renamed, a report type changes its available dimensions, and your script breaks silently until someone notices the numbers look wrong. Every one of these issues is fixable, but each fix takes developer time, and the fixes never stop.
Function calling solves a different problem. Instead of pre-pulling all the data, you define a set of functions (“get campaign performance for date range X,” “pull ad group breakdown by placement“). Claude decides which function to call based on the question. That works well when the queries are unpredictable, like a conversational interface where different people ask different questions each week. The trade-off is that you need an application layer between Claude and the TikTok Ads API: a hosted service that receives Claude’s function calls, executes them, and returns the results. That’s another piece of infrastructure to build, deploy, and keep running.
I wouldn’t recommend either route to a marketing team without dedicated developer support. The initial build takes a few days; the ongoing maintenance is indefinite.
Which method should you choose?
Manual export works for a one-time analysis: a post-campaign review, a quick audit, or any situation where you pull the data once and move on. No setup overhead, but no refresh either.
Custom MCP server is the right fit when your team already builds data infrastructure and needs full control over what Claude can access and how data is structured. The deciding factor is whether you have engineers who will maintain it long-term.
API scripts and function calling make sense when you need a scheduled or conversational pipeline and have the developer capacity to build and maintain it. API scripts suit predictable, recurring exports. Function calling suits unpredictable queries where Claude picks the right data pull at runtime.
Coupler.io is the practical choice for recurring analysis without engineering overhead. You connect TikTok Ads to Claude, and Coupler.io handles the pipeline, the calculations, and the Claude connection out of the box. For most marketing teams running weekly or monthly TikTok Ads analysis, Coupler.io gets you to the first useful conversation faster.
Get analysis-ready data to Claude from 400+ sources
Try Coupler.io for freeFrequently asked questions
Is connecting TikTok Ads to Claude safe?
Your TikTok Ads data stays under your control. You choose which data set to connect to Claude, and Claude gets read-only access to it. AI can’t modify your TikTok Ads account or any source system. Coupler.io sits between the two, and the platform is SOC 2 Type II certified, GDPR- and HIPAA-compliant.
Can I connect multiple TikTok Ads accounts to Claude through Coupler.io?
Yes. You can pull data from multiple TikTok Ads accounts and blend it in a single data flow. That means cross-account performance comparisons occur within a single Claude conversation rather than across separate exports.
Learn how to connect TikTok Organic to Claude for AI-powered analysis of your organic social media data.
Does Coupler.io work with both Claude Desktop and Claude.ai (web)?
Yes. Coupler.io’s Claude integration is MCP-based and works through both Claude’s desktop and web versions.
Can I combine TikTok Ads data with other ad platforms like Meta or Google Ads in the same Claude analysis?
Yes. Coupler.io supports multi-source data flows and lets you blend data from TikTok Ads alongside other platforms before sending it to Claude. You can ask Claude to compare cross-channel CPA or ROAS in a single conversation.