Claude works as a solid Facebook Ads analyst, but only when it has fresh data. Records manually exported from Meta Ads Manager go stale the moment you download them. Custom MCP servers and API pipelines work, but they require more engineering than most marketing teams have available.
So I’ve tested every practical method to connect Facebook Ads to Claude. Below, I’ll walk you through the most practical method to connect Facebook Ads to Claude to make your PPC campaign analysis efficient and accurate.
Choose the right method to load Facebook Ads data to Claude
The best option depends on how often you need updated numbers and your team’s technical capacity. Some methods suit quick, one-off analysis. Others are built for automated, no-human pipelines.
Here’s when each method to get data from Facebook Ads to Claude makes the most sense:
| Connection method | Best for | Automation | Technical effort |
| Coupler.io | Recurring analysis of Facebook Ads (and other ad platforms) in Claude without an engineering setup | ✅ Yes | Low |
| Manual export | Ad hoc analysis | ❌ No | Low |
| Custom MCP server integration | Bidirectional connection between Facebook Ads and Claude, with full control over which tools are exposed and how data is shaped | ✅ Yes (requires build) | High |
| Direct API piping | Fully automated pipelines where scripts pull Facebook Ads data and feed it to Claude’s API on a schedule or trigger | ✅ Yes (requires setup) | High |
| Function calling | Conversational analytics where Claude dynamically fetches only the data it needs to answer each question, rather than receiving everything upfront | ✅ Yes (requires build) | High |
If you want to use Claude with the most recent Facebook Ads data and skip the manual export-upload cycle, Coupler.io is the fastest way to get there. No engineering work required.

Analyze your Facebook Ads data in Claude with Coupler.io
Get started for freeConnect Facebook Ads to Claude with the Coupler.io connector
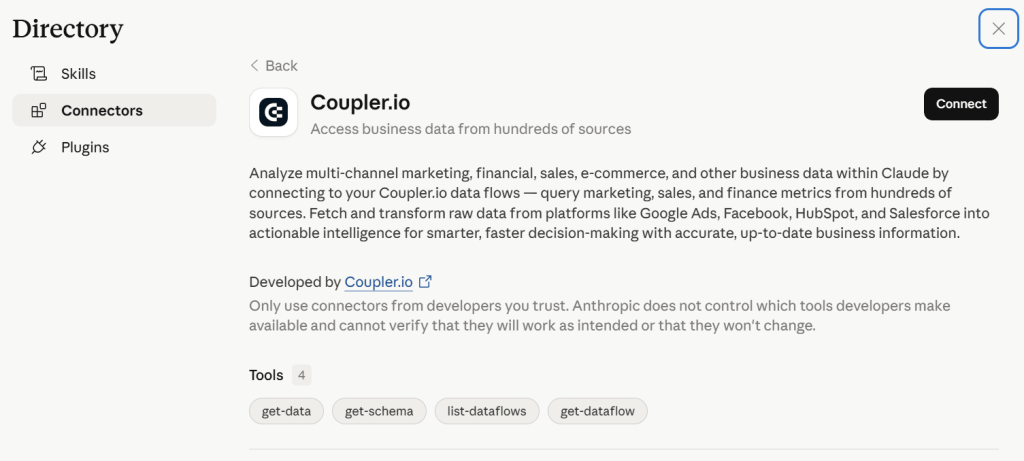
Coupler.io is a no-code data integration and analytics platform that connects 400+ business apps, including Facebook Ads, to AI tools such as Claude. Through its MCP connector, Claude queries your data in natural language conversations. You fetch Facebook Ads records in minutes, ask questions, and get answers based on the latest sync.
Coupler.io is already in active use by PPC experts and performance marketers. For example, Gabe Solberg, a B2B Growth Performance Marketer at Right Percent, used to waste hours every week manually stitching together campaign data. He switched to Coupler.io to connect Meta Ads to Claude, speeding up his daily performance health checks. Now they take under 10 minutes. Stakeholder reports refresh in seconds, and slipping ads get flagged before they burn budget.
The result: 60% less time on PPC reporting and faster, more confident decisions.
It takes only three steps to set up a Facebook Ads connector for Claude.
Step 1: Create a data flow for Facebook Ads data
Sign up for Coupler.io for free (no credit card required) and create a new data flow with Facebook Ads as a source. Or use the form below to get started right away:
Connect the Facebook account that has access to your Ads Manager. You’ll be taken to Facebook to sign in and authorize Coupler.io to pull the data on your behalf.
Next, choose the report type you want to connect from the dropdown list, such as Reports and Insights, List of Ads, and others.

Depending on the report type, you’ll also need to specify the required parameters. For example, if you pick Reports and Insights, you must select ad accounts from where to extract data, report period, metrics and dimensions, as well as attribution settings.
Claude integrations by Coupler.io also let you connect multiple sources in a single data flow. You can merge records from different Facebook accounts or even combine data from other ad platforms (Google Ads, LinkedIn Ads, etc.) and apps.
Learn how to connect Google Ads to Claude.
Step 2: Connect Claude
Once you’re ready with your data, click Get connector, which takes you to the Coupler.io connector page in Claude. Follow the instructions in the Claude app to complete the setup.
After that, go back to Coupler.io to run the data flow and automate data refresh on the schedule. To ensure Claude uses the most recent PPC figures, ask it to re-fetch the data from the latest run, or simply start a new chat.
The flow is almost the same if you connect Facebook Ads to ChatGPT with Coupler.io.
Step 3: Start a conversation with Claude about Facebook Ads
After the successful run, start a new conversation in Claude. If your question relates to data analysis of Facebook Ads, Claude will ask for your permission to connect to the Coupler.io MCP server. Once you confirm, Claude will be able to query your data flow.
Examples of how you can analyze your Facebook Ads campaigns in Claude?
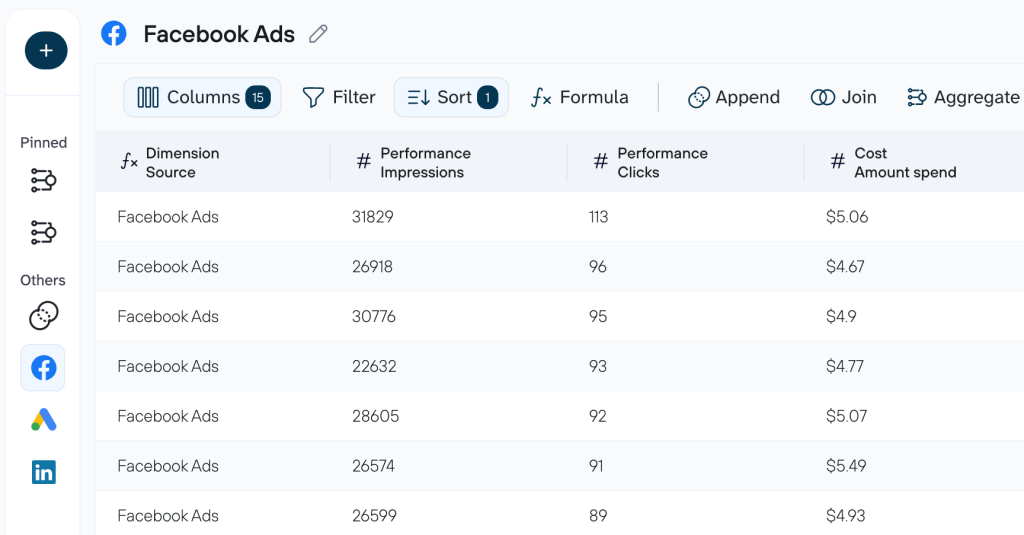
To show how AI-driven paid advertising analysis works in practice, I connected a Facebook Ads data flow named PPC campaign performance to Claude through Coupler.io. The three use cases below cover the highest-leverage decisions I faced in my Facebook Ads analytics:
- Where the budget is being split across placements
- How performance changes over time
- Which spend is generating results versus silently draining the budget
Use case 1: Where the budget is being split across placements
When you have active campaigns across both Facebook and Instagram, it’s easy to let the default budget split run on autopilot. But the two platforms behave very differently. One may deliver cheaper clicks while the other drives stronger engagement. Without a structured head-to-head comparison, you’re likely misallocating spend and don’t even know it.
To learn which platform is earning its share of the budget, use this prompt. It also gives you a daily breakdown showing whether the gap is consistent or driven by a single period:
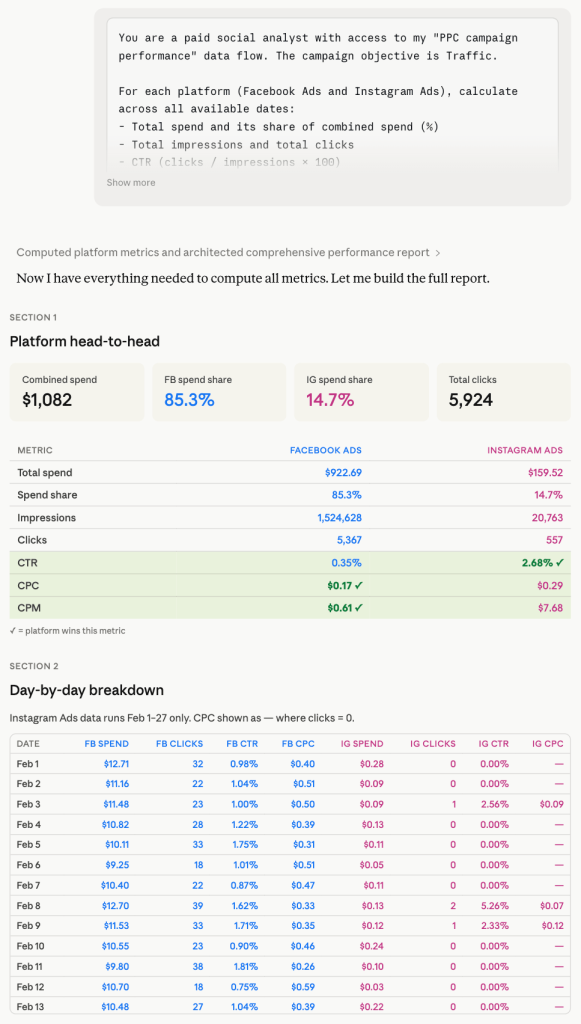
You are a paid social analyst with access to my "PPC campaign
performance" data flow. The campaign objective is Traffic.

For each platform (Facebook Ads and Instagram Ads), calculate
across all available dates:
- Total spend and its share of combined spend (%)
- Total impressions and total clicks
- CTR (clicks / impressions × 100)
- CPC (spend / clicks)
- CPM (spend / impressions × 1,000)
Then repeat the same calculations broken down by individual date.

Produce four sections:
1. Platform Head-to-Head
| Metric | Facebook Ads | Instagram Ads |
Rows: Total Spend, Spend Share %, Impressions, Clicks, CTR, CPC, CPM
2. Day-by-Day Breakdown
| Date | FB Spend | FB Clicks | FB CTR | FB CPC | IG Spend | IG Clicks | IG CTR | IG CPC |
Sorted ascending by date.
3. Efficiency Verdict
One short paragraph per platform. Is it earning its share of the budget?
Use numbers from the tables — no generic statements.
4. Budget Recommendation
One specific action: shift budget toward the more efficient platform, cap the weaker one, or maintain the split. State an exact percentage reallocation and the single metric that justifies it.
Based on Claude’s analysis of your Meta Ads data, here’s what you can act on:
- Don’t treat Facebook’s CPC advantage as a simple win. Its 0.35% CTR signals a wide, low-intent audience. Instagram’s 2.68% CTR means its clicks carried higher downstream potential.
- Verify the Feb 28 shift in Ads Manager. If this was a deliberate budget or audience restructure, treat the two periods separately in any future efficiency audit to avoid mixing incompatible data.
- Connect GA4 or pixel data for the next iteration. CTR tells you who clicked. Conversion data tells you who converted. Run this prompt again once downstream metrics are available to make a fully justified reallocation decision.
Use case 2: How performance changes over time
It’s useful to know your campaign’s average CPC. But what actually informs daily budget decisions is when clicks are cheapest, whether performance has improved or deteriorated over time, and which specific days are outliers.
To get a full trend breakdown with anomaly detection and a concrete pacing recommendation, ask Claude with the prompt below:
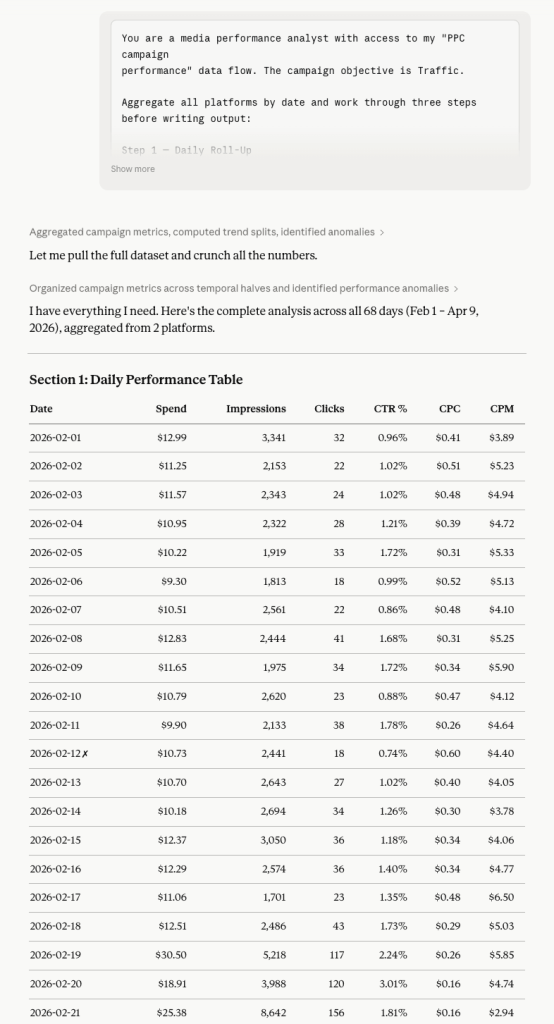
You are a media performance analyst with access to my "PPC campaign performance" data flow. The campaign objective is Traffic.

Aggregate all platforms by date and work through three steps before writing output:

Step 1 — Daily Roll-Up
Per date: Total Spend, Total Impressions, Total Clicks, CTR, CPC, CPM.

Step 2 — Trend Split
Divide all dates into two equal halves (first half vs. second half
by date order). For each half, calculate: Average Daily Spend,
Average CTR, Average CPC, Average CPM.
Mark each metric ▲ (improving) or ▼ (declining) between the halves.

Step 3 — Anomaly Detection
Best day: lowest CPC with at least 1 click.
Worst day: highest CPC or zero clicks despite above-average spend
(above-average = above the daily mean).

Output:
Section 1: Daily Performance Table
| Date | Spend | Impressions | Clicks | CTR % | CPC | CPM |
Sorted ascending. Mark best day ✓, worst day ✗.

Section 2: First Half vs. Second Half
| Metric | First Half Avg | Second Half Avg | Trend |

Section 3: Anomaly Report
Best Day and Worst Day — each with date, key numbers,
and one sentence explaining the likely cause.

Section 4: Pacing Recommendation
Should the daily budget be front-loaded, back-loaded, or kept flat? One clear answer, backed by the trend data.
Here are Claude’s recommendations based on the analysis:
- Back-load your daily budget. Front-loading wastes spend during the high-CPC learning phase before the algorithm has enough signal to optimize placement and bidding.
- Treat the first 10-14 days as a calibration period. Run a reduced daily budget until CPC stabilizes below $0.15, then scale up. The data shows the algorithm needed time to learn, not intervention.
- Don’t judge campaign health mid-flight. Feb 12-style poor performance is a learning-phase artifact. Pausing or restructuring too early resets the algorithm clock and restarts the expensive learning cycle.
Use case 3: Which spend is generating results versus silently draining the budget
Aggregate metrics hide the truth about where the budget is actually working. A $0.14 CPC looks healthy. But behind that average, some placements could be draining the budget with high costs and poor engagement, and the blended number won’t tell you that. Before any scaling decision, you must know which placements are efficient, which are costly, and what your blended CPC would look like if the waste were eliminated.
Here’s a prompt to score every day-platform combination, flag underperforming spend, and know what to cut, what to scale, and what to watch before the next budget cycle:
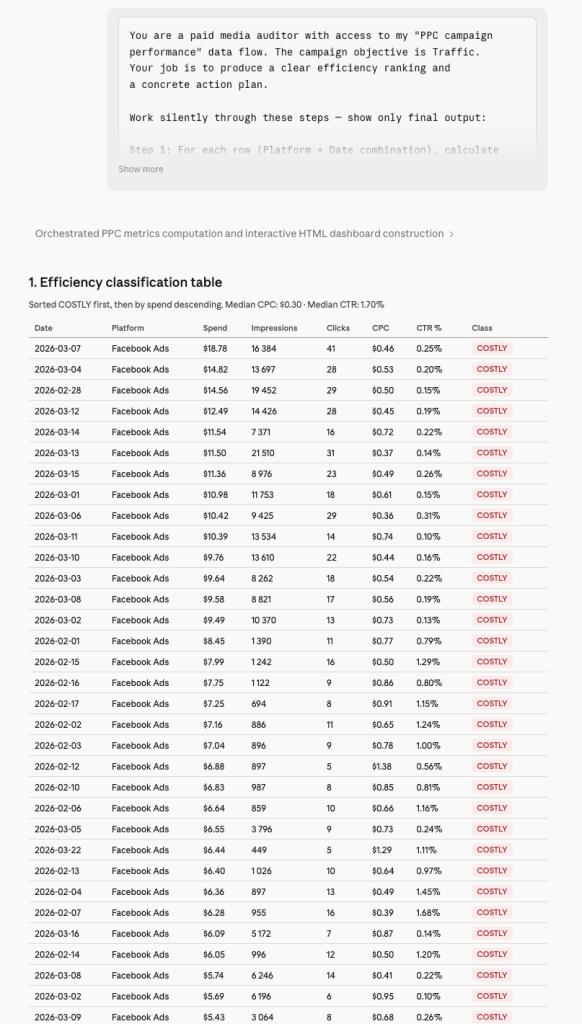
You are a paid media auditor with access to my "PPC campaign performance" data flow. The campaign objective is Traffic.
Your job is to produce a clear efficiency ranking and a concrete action plan.

Work silently through these steps — show only the final output:
Step 1: For each row (Platform + Date combination), calculate CPC and CTR.

Step 2: Compute the dataset median CPC and median CTR across all rows.

Step 3: Classify each row:
- EFFICIENT: CPC below median AND CTR above median
- COSTLY: CPC above median AND CTR below median
- MIXED: one metric above, one below

Step 4: Total up spend, impressions, and clicks by classification. Calculate what share of the total spend each classification holds.

Step 5: Scenario — if all COSTLY spending were reallocated to EFFICIENT rows proportionally, what would the new blended CPC be at the current EFFICIENT CTR?
1. Efficiency Classification Table
| Date | Platform | Spend | Impressions | Clicks | CPC | CTR % | Class |
Sorted: COSTLY first, then by Spend descending.
2. Spend by Classification
| Class | # Rows | Total Spend | Spend Share % | Avg CPC | Avg CTR |
3. Reallocation Scenario
Three plain sentences:
- How much spending is currently in COSTLY rows?
- What would blended CPC become if that spend moved to EFFICIENT rows?
- How many additional clicks would that generate at the current EFFICIENT CTR?
4. Ranked Action List

Exactly three actions, numbered by priority:
[Action] → [Specific date + platform] → [Expected outcome]
Reference actual rows. No vague advice.
According to Claude’s efficiency classification, you can do the following:
- Pause or reduce bids on the Feb 28 – Mar 16 COSTLY cluster first. These rows are burning the largest share of the budget at below-median CTR. Cutting them is the single highest-leverage action before the next budget cycle.
- Don’t scale until EFFICIENT rows are stress-tested. The reallocation scenario assumes EFFICIENT rows can absorb additional spend without CTR degradation. Validate this with a modest 20-30% budget increase before committing fully.
- Re-run this audit every four to six weeks. Median benchmarks shift as new creatives, audiences, or placements enter the mix. A classification that was accurate in March may be misleading by May.
With three structured prompts, Claude moves from raw Facebook Ads data to a ranked action plan:
- Which platform deserves more budget
- When to increase daily spend
- Exactly which rows to cut
That’s an analysis that would take a media buyer several hours to produce manually, delivered in a single conversation.
Talk to Claude about your Facebook Ads performance
Try Coupler.io for freeOther ways to export data from Facebook Ads to Claude
Beyond the Coupler.io connector for Claude, there are other methods to feed Claude your Facebook Ads data. Each one trades off setup time against data freshness and technical overhead.👇
Manual export
The most direct path from Facebook Ads to Claude. You download a file and hand it over. For low-stakes, occasional analysis, it often does the job.
How it works: Inside Meta Ads Manager, navigate to the report or table you want to export. Apply the date range and any column filters you need, then hit the export button to download the data as a CSV or Excel file. Once you have the file, upload it to a Claude conversation.
I’d reach for this method to export data from Facebook ads to Claude when I need a one-off analysis and don’t want to set up anything. It also works when the dataset is small enough to upload directly. And it’s a good way to explore what Claude can do with your data before committing to a recurring workflow.
The trade-off is obvious: every new analysis means another export-upload cycle. The data is a snapshot that goes stale the moment you download it. And if you’re working across multiple accounts or time ranges, the exports stack up fast. This isn’t viable for dashboards, recurring reports, or anything that needs to reflect current numbers.
Facebook Ads integration with Claude via a custom MCP server
MCP (Model Context Protocol) is an open standard that lets Claude connect directly to external data sources and tools through a structured interface. With a custom MCP server for Facebook Ads, Claude queries your ad data on demand, inside the conversation, without any manual file handling.
How it works: You build and host an MCP server that wraps the Facebook Marketing API. The server exposes tools like get_campaign_performance, list_ad_sets, or fetch_creative_insights that Claude calls during a conversation. When a user asks, “How did our retargeting campaigns perform last week?“, Claude calls the appropriate tool. The MCP server fetches real-time data from the Facebook API, and the result comes back directly into the conversation. The server handles authentication, API pagination, and any data shaping before handing results to Claude.
This method to connect Facebook Ads to Claude is the right choice if you’re building an internal analytics tool where analysts query campaign data through natural language. It also fits when you need Claude to combine Facebook Ads data with other sources through a unified interface. Either way, it eliminates the export-upload cycle entirely.
The cost is real, though. You need backend development to build, host, and maintain the server. Facebook’s Marketing API has rate limits and versioning requirements that need ongoing attention. Debugging issues across the Claude-MCP-Facebook API chain is more complex than simpler setups. For teams with infrequent or simple Facebook Ads reporting needs, it’s overkill.
Coupler.io connector is also an MCP server-based solution. But it’s available as a ready-to-use Claude connector and does not require you to build and maintain the MCP server.
Direct API piping
This approach cuts out the UI entirely. A script pulls data from the Facebook Marketing API and sends it straight to Claude’s API. No intermediate files, no browser, no human in the loop.
How it works: A Python or Node.js script authenticates with the Facebook Marketing API and requests the performance data you need. That includes impressions, spend, conversions, ROAS, CPA, or any available breakdown. It formats the data into a structured message and sends that payload to Claude’s API. The response gets captured and routed downstream: logged to a database, sent to Slack, written to a Google Sheet, or fed into another system. The whole pipeline runs on a schedule, triggered by an event, or embedded in a larger data workflow.
| Strength | Limitation |
| Fully automated, no humans required | Requires proficiency with both the Facebook Marketing API and Claude’s API |
| Handles large volumes and high cadence (daily, hourly) | Facebook’s API quirks (versioning, token management, nested edge structures) need ongoing maintenance |
| Claude’s output chains into downstream systems programmatically | Prompt engineering for large datasets needs careful work to avoid context window limits |
| Production-grade when properly monitored | Errors in either API layer silently break pipelines without monitoring |
Function calling
Also called tool use in Claude’s API, function calling flips the data flow. Instead of feeding Claude everything upfront, Claude decides mid-conversation which data it needs and fetches it on demand.
How it works: You define a set of functions, for example, get_spend_by_campaign(date_range, account_id) or compare_ad_creative_performance(creative_ids). And you describe them to Claude in the API call. When a user asks a question that requires data, Claude identifies which function to call and with what parameters.
Your application intercepts the call, queries the Facebook Marketing API, and returns the result. Claude uses it to generate a response. This loop can repeat multiple times in a single conversation turn if Claude needs data from more than one function.
I’d pick this over direct API piping when queries are unpredictable and pre-fetching all data upfront would be wasteful. It’s a natural fit for conversational analytics tools where users ask questions in natural language. Claude pulls only the data relevant to each question.
The complexity sits in the implementation. You need to handle the function call loop in your application logic. Latency increases with each round-trip between Claude, your app, and the Facebook API. Function definitions need careful scoping since poorly designed schemas lead Claude to call the wrong function or pass incorrect parameters. Debugging multi-turn flows requires thorough logging to trace where things go wrong.
Which method should you choose?
The right method depends on two things.
- How often do you need fresh Facebook Ads data in Claude?
- And does your team have engineering capacity to build and maintain a custom pipeline?
If you run ad hoc analyses a few times a month, manual export is fine. Download the CSV, upload it to Claude, and get your answers. The workflow breaks down once you need daily check-ins or multi-account reporting, but for occasional use, there’s nothing to set up.
If you’re building a production-grade internal tool and have developers available, a custom MCP server or direct API pipeline gives you full control. You own the data shaping, authentication, and downstream integrations. Function calling adds another layer of flexibility for conversational interfaces where queries are unpredictable.
If you need recurring, up-to-date Facebook Ads data in Claude without engineering work, Coupler.io is the most practical path. It handles the data pipeline, refreshes on a schedule, and connects to Claude through MCP. You spend your time on the analysis, not on exports and uploads.
For most marketing teams, the decision comes down to this: manual export for the occasional deep dive, Coupler.io for anything recurring.
