TikTok Analytics has no shortage of data. Reach, watch time, profile views, audience demographics, follower growth, and video creative performance are all in there. The hard part is turning it into an answer. Even a simple question, like why engagement dropped last week, means opening three or four reports and connecting the numbers yourself.
Bringing your TikTok Organic data into Claude cuts most of that work out. Rather than jumping between tabs, you ask what you want to know in plain language and get a straight answer back. Coupler.io keeps the data flowing and up to date, so Claude always has the full picture to work from.
Connect TikTok Organic data to Claude with the Coupler.io connector
Coupler.io is a no-code data integration and AI analytics platform. It connects data from 400+ business apps so you can analyze TikTok data with AI tools like Claude, ChatGPT, and Gemini.
TikTok’s analytics splits reporting into four separate views: Overview, Content, Viewers, and Followers. Coupler.io combines the ones you need into a single flow that builds a historical dataset over time. Its Claude integrations cover dozens of marketing sources, so TikTok doesn’t have to be the only one you connect. The main setup even happens directly in Claude.
1. Sign up for Coupler.io and install the connector
Open the Coupler.io connector page in Claude.ai and install the connector.
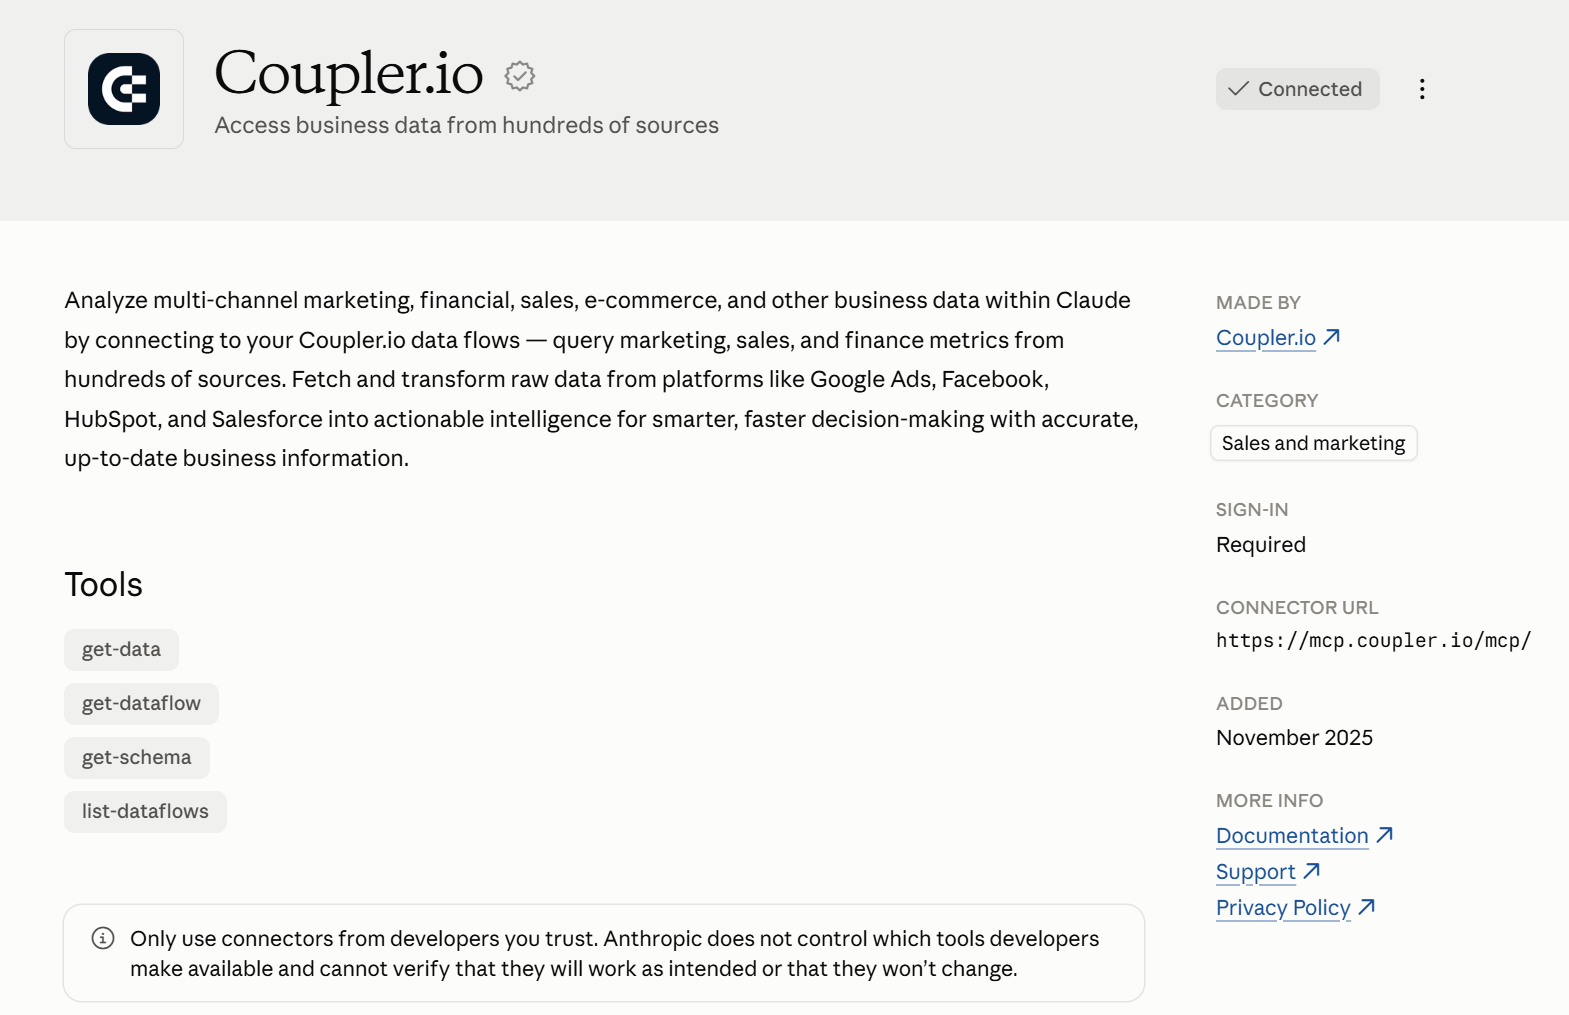
This is a one-time step: it lets Claude use Coupler.io’s tools for any source you connect later, not just TikTok.
2. Authorize your TikTok account and start chatting
Open a brand new chat in Claude and describe what you want to do:
‘I want to analyze the performance of my TikTok account over the past two months. Connect my TikTok Organic data to Claude.’
Claude doesn’t have access to your TikTok account through Coupler.io yet, so it should prompt you to authorize the connection through a secure link. Click on it and follow the instructions in a separate tab:
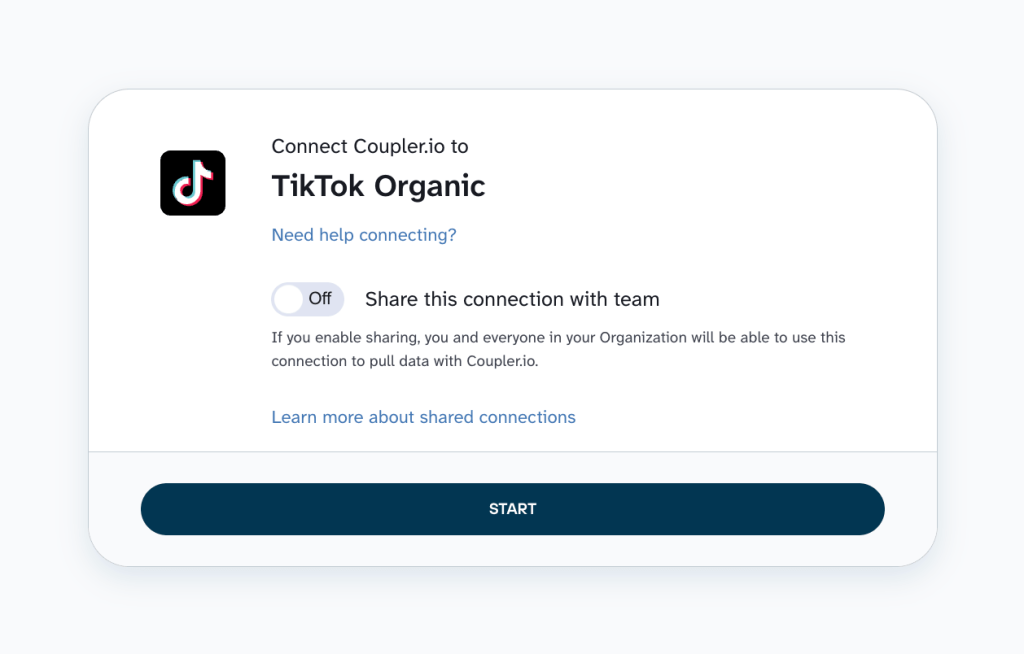
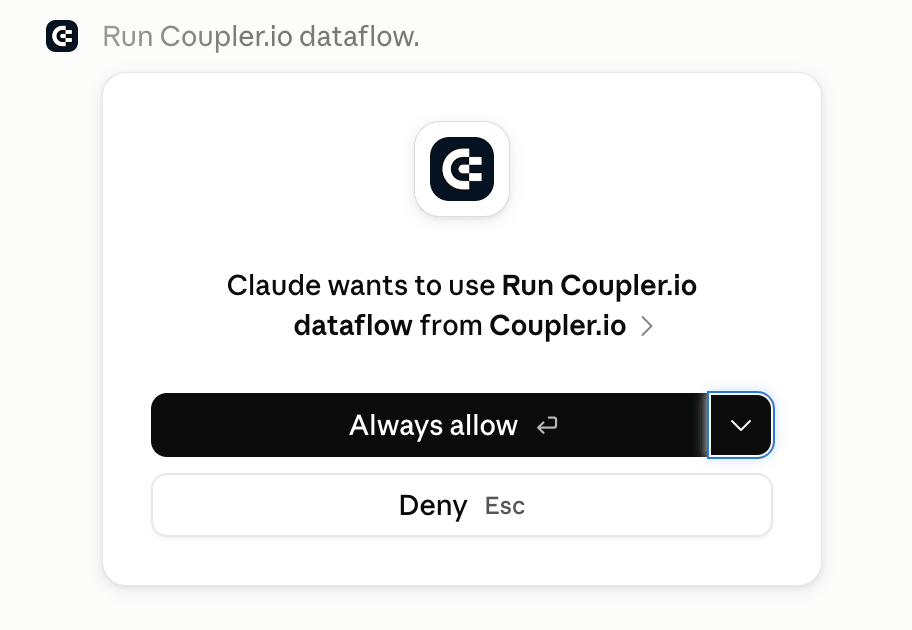
Type ‘Done’ in the chat. Claude sets up the TikTok organic data connector for you at this point; when prompted, give Coupler.io permissions to run your data flow.
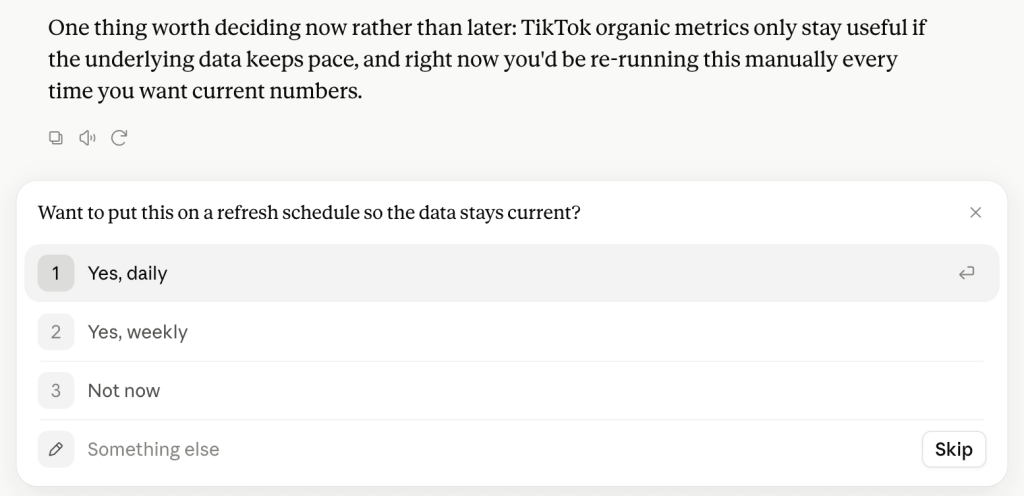
Claude should ask further questions, like what kind of report you want to pull. Here I’ve said ‘All of them’ as I’ll need all available data to demonstrate the examples in this article — but you can pick and choose. It’ll also prompt you to set up a refresh interval (daily or weekly), so your numbers stay up to date for future analyses.

Connect TikTok Organic data to Claude with Coupler.io
Start for freeWhy build the connection in Coupler.io instead?
Starting in Claude is faster for a first try or a single account. Doing it in the Coupler.io app lets you customize the smaller details upfront, like organizing data before Claude sees it.
Here are a few benefits:
- Filter rows, rename or hide columns, and add business context directly to the dataset. This keeps Claude from guessing at definitions later and gives it clean data to work with.
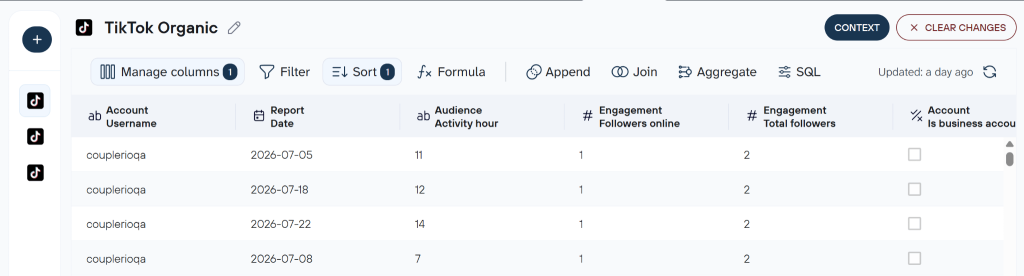
- Combine data from multiple sources, like TikTok Organic and TikTok Ads, Meta, etc. into one joined dataset. Claude can add each as separate sources, but joining them together is a manual step you do in the app.
- Load a TikTok dashboard template in Data Studio or the Coupler.io app. It’s a ready-made, visual report, running off the same data you connected to Claude.
- Coupler.io’s AI agent runs in the app against the same dataset, so a quick check on last week’s views doesn’t mean opening Claude.
Either path gets you the same result: TikTok data Claude can actually work with. Pick the first approach if you’re just testing the waters, or the Coupler.io-led one if you know exactly what you want the AI to see.
To go with option two, click proceed in the form below:
What matters when you analyze TikTok Organic data with Claude
Getting your TikTok organic metrics into Claude is the easy part. But to get answers you’d stake your content strategy on, you need to:
Give Claude the context to understand your strategy
Raw TikTok data doesn’t come with judgment calls built in. A 40% completion rate is strong on a 60-second video and weak on a 10-second one. A sudden spike in followers might be real growth, or it might just be a product giveaway that inflated the count for a week. Claude has no way of knowing which is which unless you tell it.
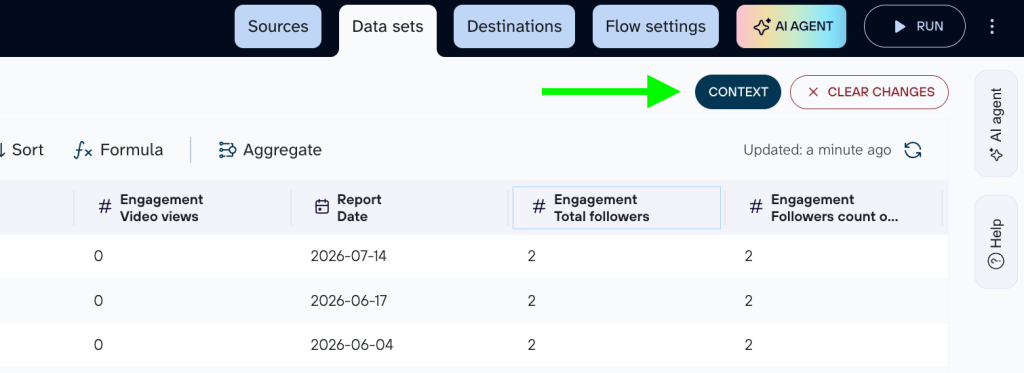
In your AI chat – or Coupler.io’s in-app context editor – you could specify that ‘anything over 35% completion counts as strong for our account.’ That gives Claude an actual bar to measure against instead of guessing at one. The same goes for anomalies: flag that ‘the July 10 spike came from a collab, not organic reach,’ and Claude won’t treat a one-off as a trend.
Get accurate calculations for more reliable insights
Claude is good at spotting patterns once you show it the numbers, but it isn’t a reliable calculator across a full dataset. Ask it to work out a blended engagement rate across sixty videos with wildly different view counts, and a plain average treats a video with 200 views the same as one with 200,000. This skews the account-wide number in the wrong direction.
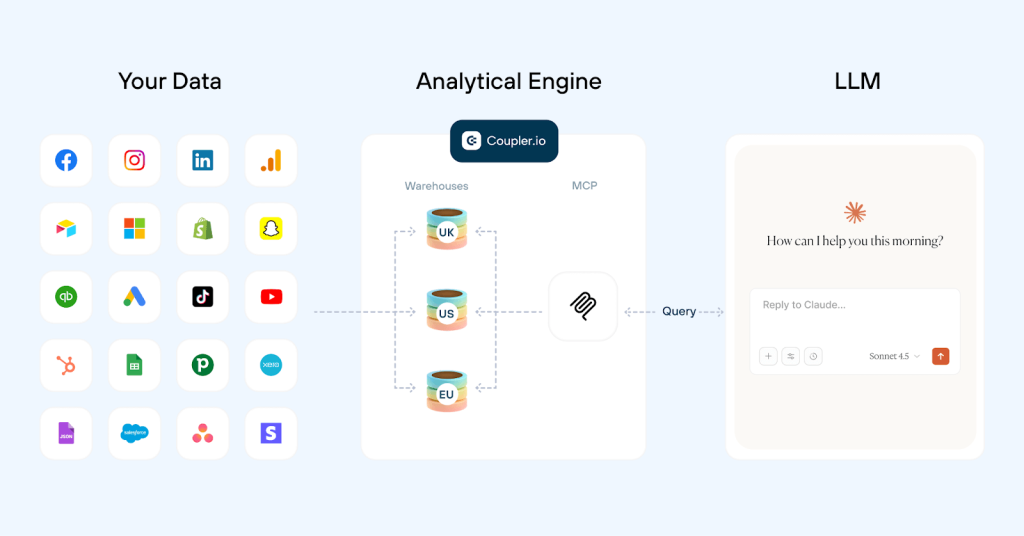
Coupler.io’s Analytical Engine runs that calculation before Claude sees the row. It weights the totals correctly across the dataset and hands Claude a verified number to interpret, rather than one to compute from scratch.
Use built-in skills to evaluate content performance
The same questions come up every time you review your TikTok performance. Which videos are driving results? When should you post? What content deserves another iteration?
Instead of explaining what you want to analyze from scratch, you can rely on built-in AI skills that already understand common marketing workflows.
With Coupler.io, the Marketing Analytics skill is automatically applied to your TikTok Organic data in Claude once it’s connected. That means your questions get an analysis tailored to your domain, rather than a generic response.
The same skills are also open source, so you can explore or customize them through the Coupler.io skills GitHub repository.
Connect multiple destinations
The data flow that lets you connect TikTok Organic data to Claude can feed other AI integrations at the same time. It might look like:
- Claude for quick conversational analysis
- Data Studio or Power BI for a dashboard your client or manager can check
- Google Sheets for reports with lots of video-level data
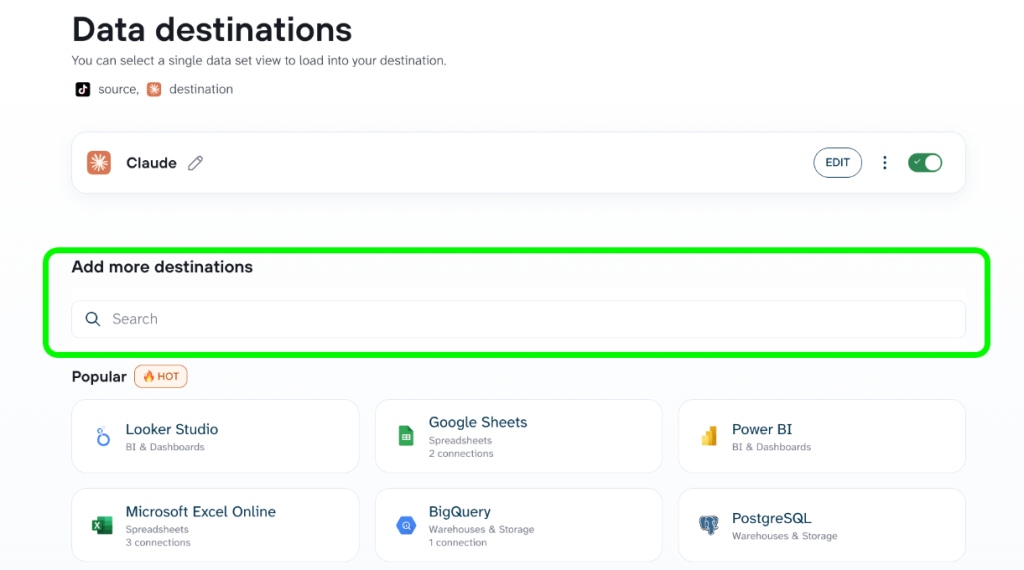
The idea is a single connection with multiple outputs. Set it up once during your data flow, and you stop maintaining two versions of the same TikTok report by hand. When the data refreshes, every destination updates together.
For the wider picture across platforms, see our guide to social media reporting.
Examples of how to use Claude with TikTok Organic data
Once you connect TikTok Organic data to Claude via Coupler.io, here’s what you can ask about your content.
Find the patterns in your best-performing videos
A handful of videos always outperform the rest, and it’s rarely obvious why. Your content report holds granular TikTok video performance numbers, like length and watch time, and your followers report shows when your audience is actually active. Put side by side, a pattern emerges.
Rank every video I posted in the last 60 days by views. For the top 10 and bottom 10, show me posting day, posting hour, video length, and average watch time. Then compare that against when my followers are usually active: were the top performers posted inside that window, or did any succeed despite going out at an off-peak hour?
Claude should return with two tables detailing your top and bottom performers, plus a brief summary:
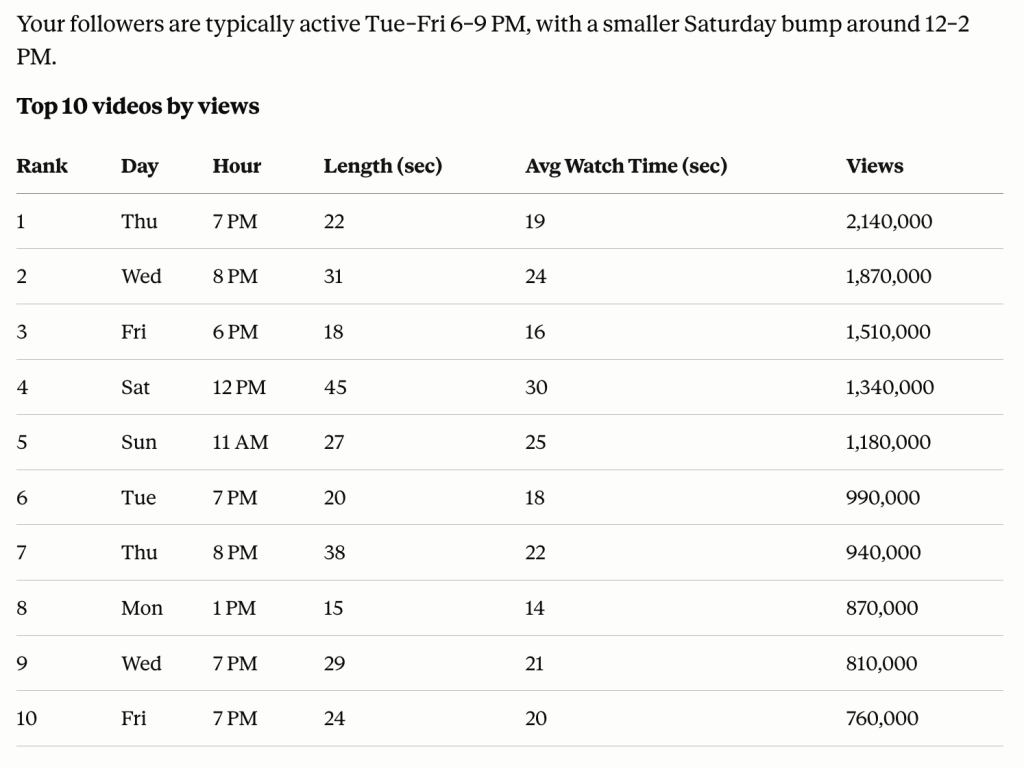
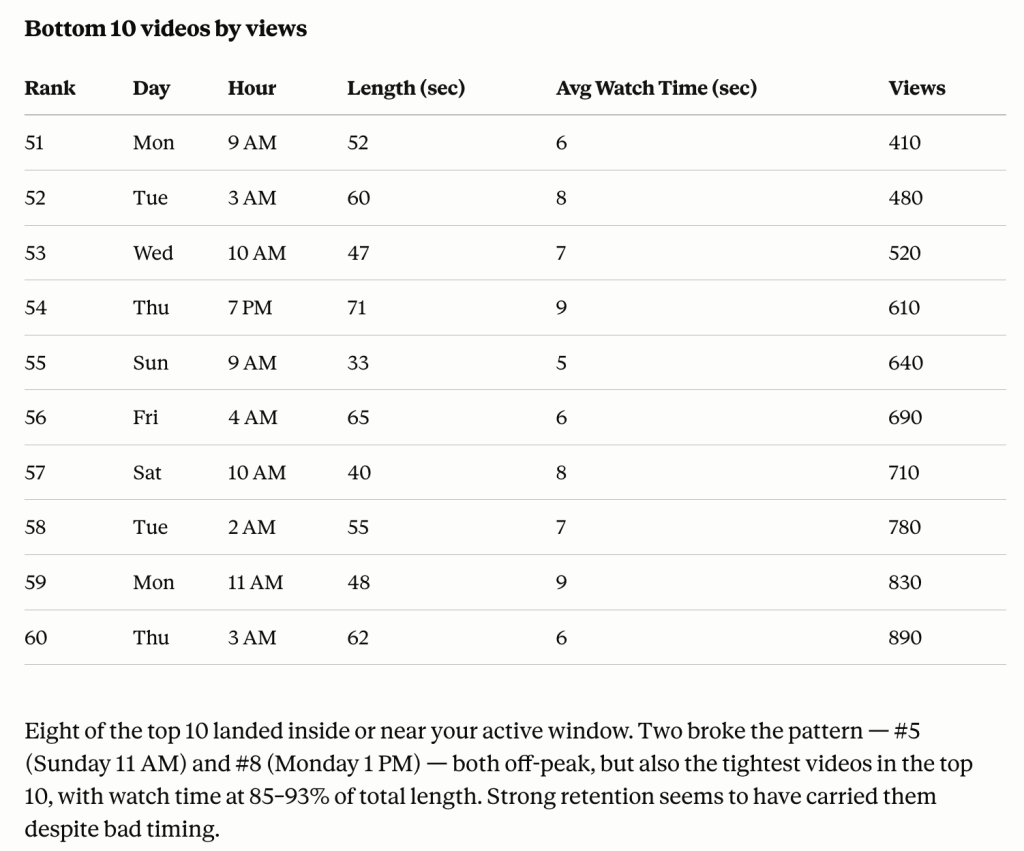
Takeaways:
- A video with strong watch time but posted off-peak is still a good candidate for your best-performing slot, since the hook is probably doing most of the work.
- If retention drops off past a certain runtime, the issue is usually pacing or a slow hook, not the topic itself.
- Videos that already land in your active window and hold high watch time are worth reusing as a format. Consider tightening the opening further, cutting toward that same length, and posting more often in that slot.
Trace an engagement drop back to reach, audience, or content
When TikTok engagement metrics fall, your analytics reports show the decline but not what’s behind it. The video could be reaching fewer people than usual, landing with an audience it doesn’t normally reach, or losing viewers partway through because the hook or pacing wasn’t quite right.
Bring stats from different reports together and Claude can narrow it down.
Pull every video from the last 60 days where engagement rate dropped below my 60-day average. For each one, show reach (views relative to my follower count), audience match (top viewing country vs. my overall follower country base), and retention (average watch time as a percentage of video length). Tell me which of the three moved most for each flagged video, and what that suggests is driving the drop.
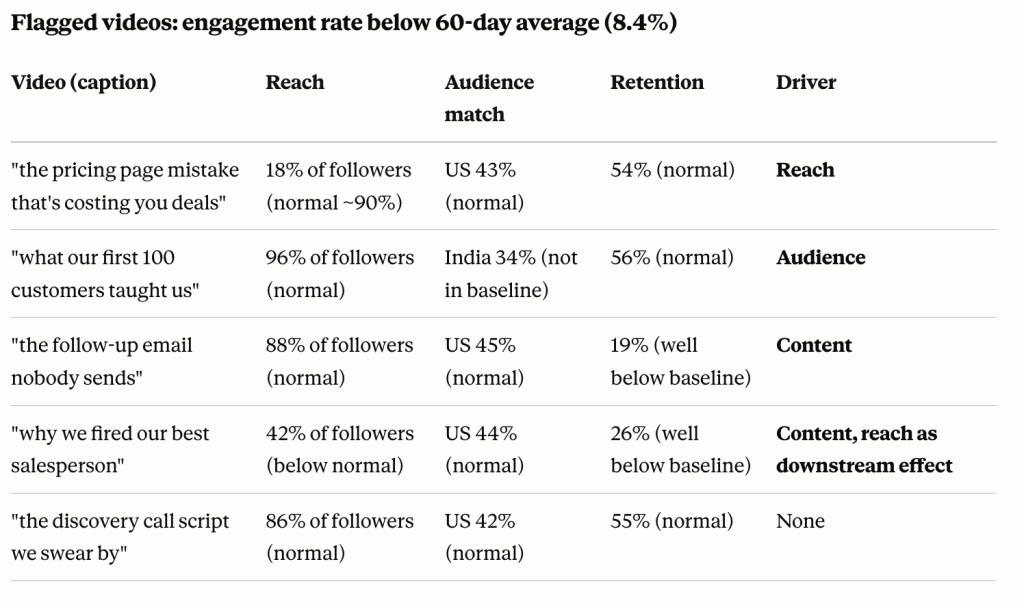
Takeaways:
- A reach collapse with everything else normal points to distribution. Worth testing a re-post or boost rather than an edit.
- An audience mismatch on its own usually means a trend carried the video into a new market, not genuine content strength.
- Weak retention alone points straight to the hook, and it’s the priority fix if it keeps showing up.
Align your content to the audience you are reaching
Your TikTok follower data shows one demographic mix, built up over time. A single video can reach a completely different crowd the moment it lands on the For You page, and nothing in TikTok flags that gap on its own. You need to pull both sides of the comparison to get an answer.
Show me my follower split by gender and by country, then show the top viewing countries for videos posted in the last 60 days.
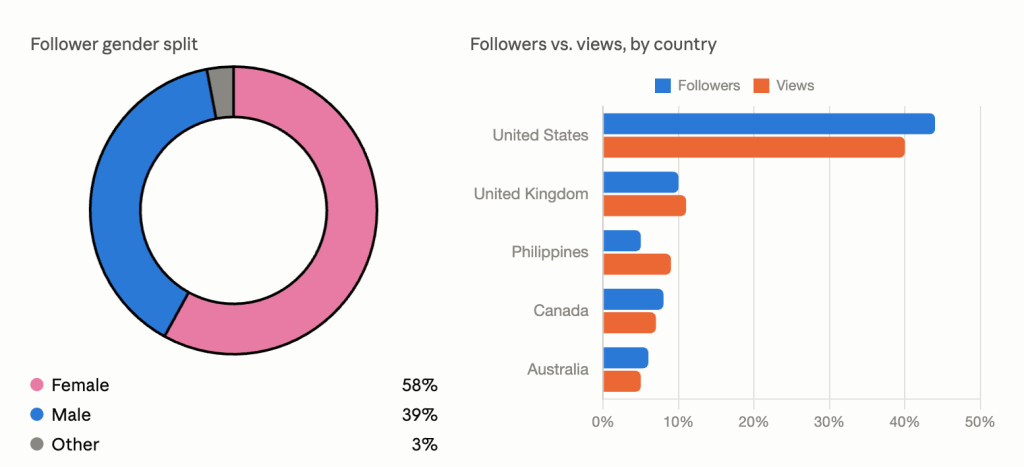
Once that comes back, check whether any of it lines up:
‘Compare each video's top viewing countries and gender split against my overall follower base. Flag any videos where the audience reached looks meaningfully different, and tell me what that could mean.’
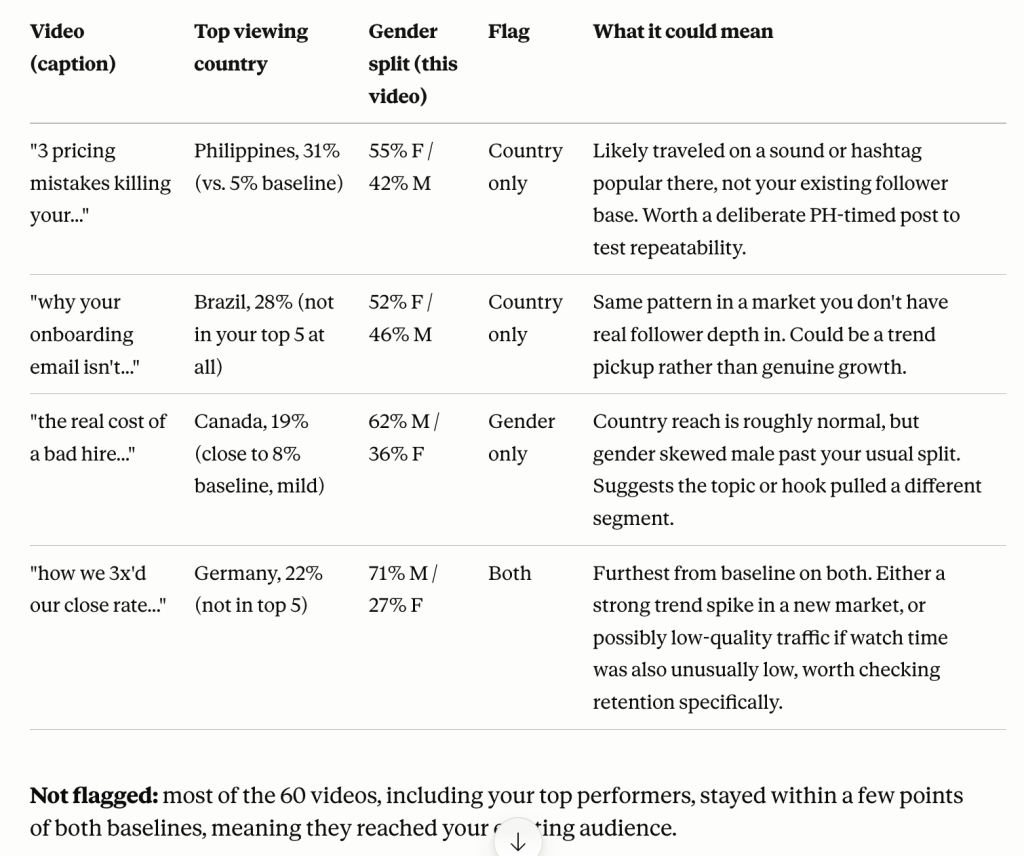
Takeaways:
- Countries with more views than followers are worth testing with local posting times and localized content.
- When a video’s top country doesn’t match your biggest follower base, it likely traveled through sound or hashtag reach, not your own audience.
- A video that already over-indexes on your underrepresented gender segment, like the bad-hire video pulling 62% male reach, is worth using as a template to grow that segment intentionally.
Compare organic vs paid boost performance
Your organic and paid campaigns live in separate reports, making it easy to lose sight of how they’re performing relative to each other. Joining them into one view lets you analyze social media campaigns with Claude and see whether your ad spend is having any real impact.
This one requires a couple of extra steps though. Connect your TikTok Ads manager account through Claude the same way you did TikTok Organic earlier (full walkthrough in the guide on connecting TikTok ads to Claude). Once it’s synced, you can query both datasets in the same conversation.
Compare organic and paid TikTok performance over the last 60 days. Show organic reach (video views) against paid reach (impressions), organic engagement (likes, shares, comments) against paid engagement (clicks and CTR), and total ad spend with cost per 1,000 impressions and cost per click. Tell me whether the paid campaigns are extending reach beyond what organic already covers, and whether the click performance justifies the spend.
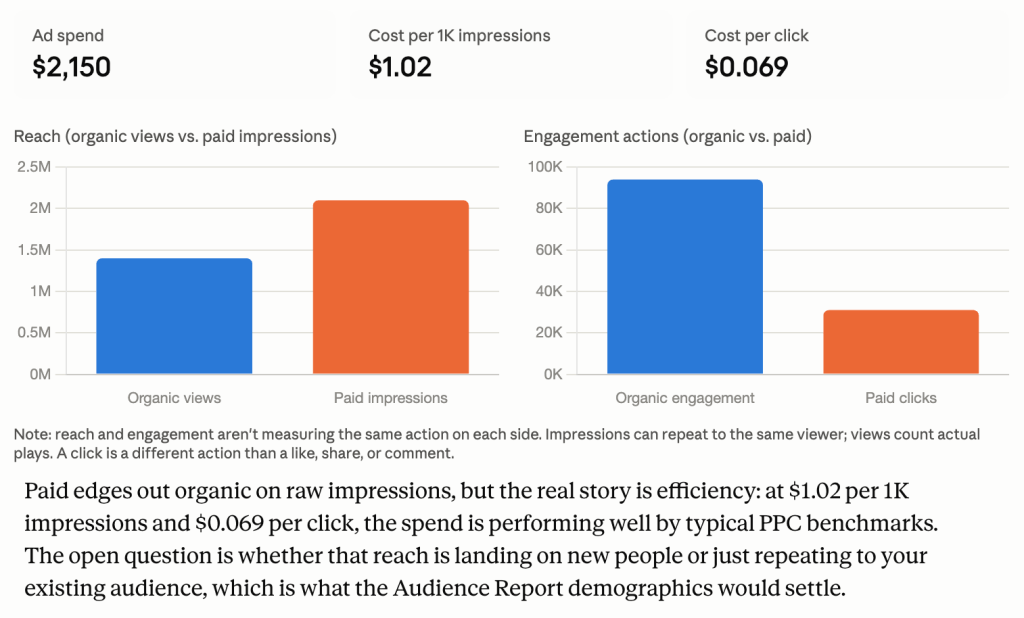
Takeaways:
- A strong CPM and CPC only means the spend is efficient, not that it’s reaching new people.
- Cross-check paid demographics against your organic follower base before deciding whether to scale spend.
To have this organic-vs-paid check regularly, use Coupler AI skills such as TikTok Ads Performance Review and TikTok Ads Waste and Scale. They will cover the paid side of this comparison as a repeatable report.
That’s an example of a quick breakdown. If you want to go further, ask Claude to pull the Audience Report demographics for your paid campaigns and compare them against your organic follower base to see how much of that reach is new.
Combine TikTok with 400+ sources in Claude
Sign up for freeClaude prompts for TikTok Organic data analysis
A set of prompts to run once your data is flowing, apart from the use cases I just shared.
High-reach, low-engagement videos
Find videos where views are in the top 25% of my last 60 days but engagement (likes plus comments plus shares, divided by views) is in the bottom 50%. List them with views, engagement rate, publish date, and caption. What do these "reached but flopped" videos have in common, and what didn't land?
Untested posting windows
Cross-reference my audience's peak hours with the publish times of my last 30 videos. Tell me which posting window I've been underusing and give me a specific time slot to test for my next post.
Conversation-starting captions
Rank my videos from the last 60 days by comments-per-view ratio (comments divided by views). List the top 10 and paste their captions. Based only on the captions and ratios, which types of prompts or hooks are pulling conversation? Suggest three caption ideas for follow-up videos.
Pull my top 10 videos by shares and top 10 by views from the last 60 days. Flag videos on the shares list but not the views list, then identify what those share-drivers have in common that my high-view videos don't. Suggest what to build my next post around.
Weekly engagement outliers
Calculate weekly average engagement rate across all videos for the last 8 weeks. Show week, video count, average, and week-over-week change. Identify the outlier week and which videos drove it.
Content gaps by market
List my top 5 audience markets. Explain which of those markets I'm under-serving in my content, and whether I should adjust language, content, or posting time to close the gap.
Content categories by gender segment
Pull my audience gender split. Then group my last 30 videos into content categories using their captions and rank each category by engagement rate. Which category is my strongest performer, and which one should I lean into if I want to grow the gender segment I'm reaching least?
Other ways to get TikTok Organic data into Claude
Coupler.io is the right fit when you want TikTok data refreshing on its own with the numbers already checked. But not every situation calls for that. Sometimes a single report or a pipeline your team already maintains is the simpler path. Here’s how the alternatives compare, and where each one falls short:
| Method | Ease of use/set-up | Who handles the math | Ideal for | Main limitation |
| Coupler.io | Low, no code, about 5 minutes inside Claude | Coupler.io’s Analytical Engine | Recurring content analysis, cross-account and cross-source reporting | Refresh frequency depends on your plan |
| Manual export | Low per download, high over time | You, or Claude, from a pasted CSV | A single one-time report, no repeat need | One report at a time, no scheduling |
| Third-party TikTok MCP server | Medium, self-hosted, developer setup | Claude, on raw scraped or API data | Competitor or public-account research, not your own account | Not built for your own organic data, no calculation layer |
| Custom MCP server | High, engineering build and maintenance | Depends on implementation | Teams with existing data infrastructure, or Claude Code access | Full-stack ownership: hosting, TikTok API changes, monitoring |
| API scripts and function calling | High, scripting and ongoing upkeep | Your code, or Claude on the output | Custom pipelines with in-house engineering support | Endpoint changes, rate limits, and manual snapshot logic for trends |
Whichever route you take, the job is the same: pull TikTok metrics into an AI assistant instead of piecing reports together by hand.
Manual export
Both TikTok Studio and the Business Suite let you export analytics as CSV or XLSX from the web app. You can choose a preset range of 7, 28, 60, or 365 days.
Each export, though, is limited to one report at a time: Overview, Content, Viewers, or Followers. There’s no combined download, so pulling all four into one dataset means exporting each separately and merging them yourself.
This approach works fine for a deep, one-time analysis. But since the data doesn’t refresh automatically, a recurring weekly or monthly review means repeating the same multi-download process every time.
If the pull is for the latter, TikTok report templates give you the same numbers without the repeat downloads.
Third-party TikTok MCP servers
This one’s more of a heads up than an actual alternative.
A search for ‘TikTok MCP server’ will mainly show tools that aren’t built for organic analytics. It’s either TikTok’s own Ads MCP server (not compatible with organic data) or servers that scrape public data instead of connecting to your account.
Seym0n’s tiktok-mcp is a good example of that second kind. It’s an open-source server that pulls a video’s subtitles, engagement numbers, and TikTok hashtag data through TikNeuron rather than the platform’s own API. Nothing about your own followers or video history, so it’s designed for competitor analysis rather than self-reporting.
Coupler.io’s connector is MCP-based too, but it’s built specifically for TikTok Organic, with a data-prep layer and Analytical Engine behind it. There’s no server to host, and the numbers reaching Claude are calculated and checked before they get there.
Custom MCP server
This works best for teams that already run their own data infrastructure and want TikTok Organic data plugged into existing systems.
It’s also the only route to Claude Code working with organic accounts and content data. TikTok built an official server for its Ads platform, but not for Organic, so there’s no ready-made option to lean on here.
Once it’s built, the server is yours to run: hosting, monitoring, and fixing whatever breaks when TikTok changes something on its end, or when Claude’s side of the connection changes. That’s a fair tradeoff for a team with engineers who already do this kind of work. For everyone else, Coupler.io runs on the same MCP protocol without asking you to build and maintain the server yourself.
API scripts and function calling
API scripts make sense when you need the same TikTok analysis every week and have someone who can build it. Authenticate against TikTok’s developer API, pull the fields you want on a schedule, and land them wherever Claude reads from. A weekly video performance summary is the standard case.
The costs show up later though. TikTok versions and deprecates endpoints. Rate limits force retry logic into the script. And a renamed field can break the pull; hardly noticeable until the numbers stop lining up.
Function calling suits unpredictable questions instead of a fixed pull. You define the calls Claude can make, and Claude picks the right one based on what’s asked. That fits a conversational interface better than a scheduled script, since the questions change week to week.
It’s a harder build, though, and it won’t sort out TikTok’s own quirks on its own. Getting a real day-by-day trend at the video level means storing snapshots yourself and calculating the difference — and that logic still has to live somewhere in the integration.
Both routes suit a team with engineers ready to build and maintain them. Without one, Coupler.io gets to the same place without that overhead.
Need a custom TikTok data setup for your team?
Book a demoFrequently asked questions
Is it safe to connect TikTok Organic data to Claude?
Yes. The TikTok data connection is read-only, so Claude can only view what Coupler.io has pulled. It can’t publish videos, edit your bio, or touch any TikTok settings. You also control which fields get shared before Claude sees them.
Does this work with a personal TikTok account, or do I need a Business account?
Personal accounts show basic TikTok profile insights in the app, but connecting that data (and more) to an outside tool needs a Business Account. Switching over takes a few minutes, and your videos, followers, and posting history stay exactly as they are.
Can I connect multiple TikTok accounts?
Yes. Agencies and creators managing more than one account can pull each into the same data flow, or keep them separate and blend the results when a cross-account comparison is helpful.
Can I combine TikTok Organic with TikTok Ads or other platforms?
Yes, and it’s one of the more useful reasons to set this up through Coupler.io. You can blend TikTok Organic with external data sources like TikTok Ads, Google Ads, Meta Ads, Shopify, or any of Coupler.io’s 400+ sources in the same data flow, then ask Claude questions that span all of them.
If Instagram is part of the same reporting, here’s how to connect Instagram insights to Claude.
Why is my audience data missing or showing zero?
TikTok withholds audience-level data (gender, country breakdowns) for accounts under 100 followers. If profile insights and video metrics are populating but audience reports aren’t, follower count is usually the reason.
Does this work with Claude Desktop?
Yes. The Coupler.io connector is MCP-based, so it works the same way in Claude Desktop as it does on the web.