Every client you sign brings in revenue and another monthly report. When those reports are built by hand, the reporting hours grow as fast as the client list. Eventually your team spends more time reporting on campaigns than running them.
To scale, you need to break that link between clients and hours. This guide shows how to scale client reporting for agencies by building one process that every account runs through. I’ll use Coupler.io, a marketing data integration and AI analytics platform, to show how each step works in practice.
Where a manual client reporting process breaks down
The monthly loop looks the same for every client. Pull the data from each platform. Check it against the client’s metric definitions. Prepare it, write the commentary, and send it. Then the client asks something the report didn’t cover, and someone goes back in.
That loop never gets shorter. Your 200th report takes as long as your 50th, because every step still happens by hand.
The hours add up fast. A 2026 study by Fluency found that marketing strategists spend an average of 46.5 hours a month on routine AdOps work. That figure doesn’t include client reporting.
Disconnected tools make it worse. In the Basis 2026 Advertising Agency Report, 44% of agency professionals named inefficient processes as a challenge. Another 40% named siloed systems.
Signs your reporting has reached this point:
- The first week of every month goes on reports
- A client asks for the latest numbers and someone has to go and pull them
- Someone copies figures from a marketing dashboard into a slide deck by hand
- Your specialists spend more time formatting data than acting on it
- Two account managers maintain different versions of the same report
Before you automate any of it, your reporting needs to follow the same rules for every client.
Standardize client reporting before you scale it
Every new client brings a chance for a slightly different dashboard layout, metric definition, or delivery process. To scale client reporting, set agency-wide standards for those decisions first. Then make exceptions deliberately when a client actually needs something different.
Build a client reporting KPIs library
Metric definitions are the expensive thing to retrofit onto 40 live accounts, because every historical number moves when you change them. So agree what each metric means at agency level first, and keep those defaults in one KPI library. Write each key metric down once:
- The standard definition
- Which data sources it comes from, like spend from Google Ads and Meta Ads, leads from the CRM
- The calculation
- The client’s benchmark, such as last quarter’s CPA or their target ROAS
The source is the part that gets missed. Conversion rate from Google Analytics 4 measures something different than conversion rate from a CRM, and both can end up in the same report. Decide which one your agency reports by default, then name the field it comes from.
Client reporting KPIs need a benchmark next to them. A cost per acquisition of $61 means nothing on its own. Next to last quarter’s $85, it is a good month. The same goes for a 1.4% CTR or a 3.2 ROAS. A metric with no business goal attached can come out of the report altogether.
Keep the library in a shared doc your whole team can edit, like Notion or Google Docs. When you onboard a client, start from those defaults and write down only what’s different for that client. In Coupler.io, those client rules go into the AI context attached to the client’s dataset.
Agree on white-label client reporting rules
Branding and access decisions can also become inconsistent as your client list grows.
Define your default rules for:
- Agency or client branding
- Report recipients
- Client-side permissions
- White-label client reporting requirements
Then document exceptions rather than letting each account manager handle them differently.
Coupler.io’s client reporting templates are white-label ready, so your team can apply the appropriate branding to an existing dashboard instead of creating a separate reporting system for each client.

Set a reporting cadence for each client tier
Define a default reporting cadence for each type of client you sign. Base it on the service package and how often the client’s campaigns needs attention.
| Broad client type | Reporting setup |
| High-touch accounts | Daily dashboard, monthly report with an executive summary, regular review call |
| Standard accounts | Monthly report & dashboard access, plus ad-hoc updates |
| Low-touch accounts | Monthly-quarterly report, dashboard access |
These are starting points. A paid media account with daily spend needs more contact than an SEO retainer, where keyword rankings shift over months. How often a client hears from you is a client retention decision as much as a reporting one. Below about 20 clients, tiers can add more overhead than they save, so decide case by case.
Once the cadence is set, check what actually goes out. Most clients end up with more than one marketing report, like a monthly breakdown plus a dashboard they asked for during a bad quarter. A year later both refresh, but nobody has checked which one gets read.
Ask at the next review call which numbers they check before the call and where they find them. A report no one opens does nothing for client retention, so remove the ones that don’t bring value.


Run client reporting on one system with Coupler.io
Book a demoHow to scale client reporting for marketing agencies
Coupler.io moves most of the monthly reporting work to onboarding. First, you set up each client’s dashboard and data once. Then your team uses Coupler AI to handle client questions between reports. Every new account goes through the same steps, which keeps your multi-client reporting process consistent across the roster.
1. Connect marketing data integrations and give business context
A client running Google Ads, Meta Ads, GA4, and Shopify means four logins and four exports. Someone then matches campaign names by hand in a spreadsheet. At 50, 70, 100+ clients, that’s most of a week.
Choose a client reporting template and connect the data
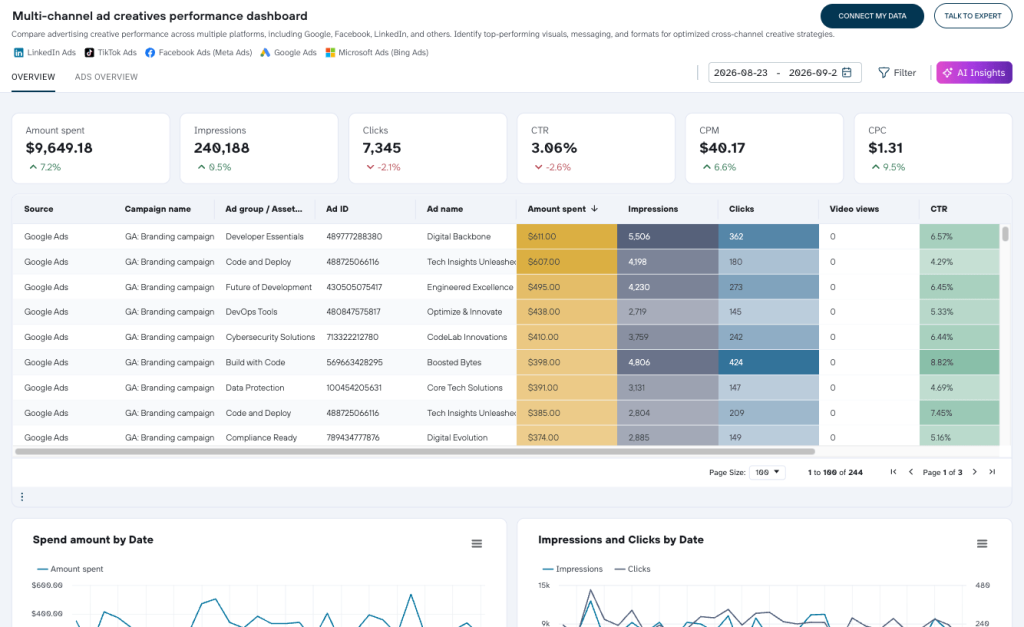
For most clients, reporting templates are the quicker route. Coupler.io has 250+ dashboard examples for BI tools (Data Studio, Google Sheets, etc.). You can search the library by marketing channel: PPC, social media, SEO, email marketing.

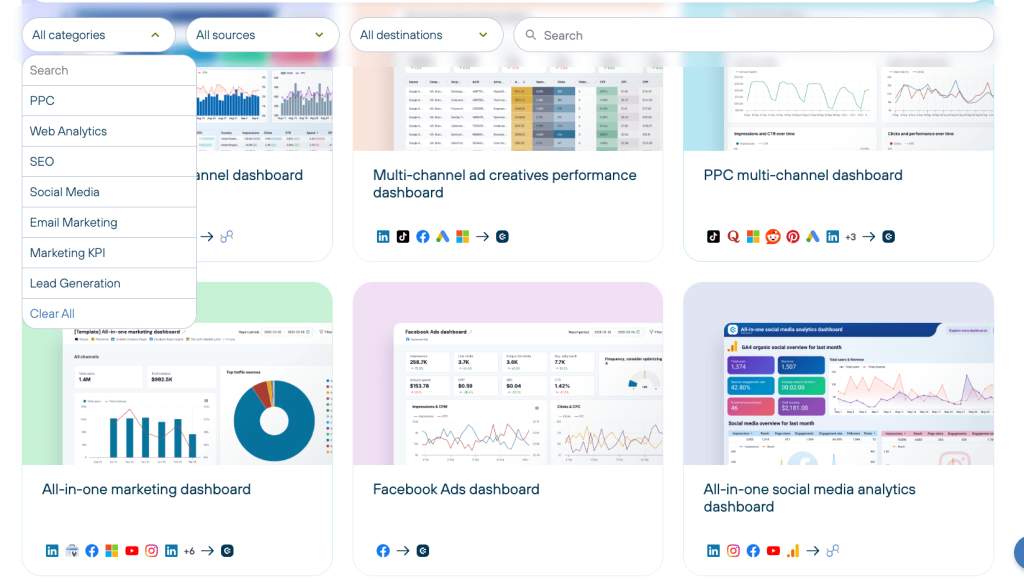
Pick based on the client’s data needs. A Google Ads dashboard works for a single-platform account. A Multi-channel creatives dashboard works for a client with many social media accounts. Our roundup of client reporting dashboards for agencies covers the main ones.
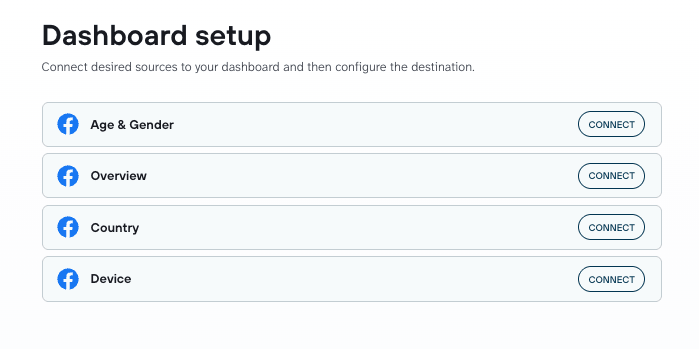
Dashboard setup only takes a few minutes. You connect the account(s) and then configure the destination.

But if you’re not sure which template fits, ask Coupler AI. It’s an assistant inside the product that works on your connected client data. It can see what that client runs and point you to a matching template.
Let Coupler AI do the data work for you
Tell Coupler AI what you need to know, from which source, and how often. It connects your account, sets up the data flow, keeps it refreshed, and lets you analyze the results inside Coupler.io or another AI tool.
Try for free

Set the definitions once so the answers hold up later
The dashboard knows what a lead column is. It doesn’t know how this client counts one. For them a lead is a booked call, while the client you set up last month counted every form fill.
That difference never shows up on the live dashboard. A chart displays whatever is in the column. It shows up during analysis. Someone asks why cost per lead went up, and the answer depends on what a lead is. An AI tool reads the column in front of it. If that column counts form fills and this client only pays for booked calls, the answer comes back confident and wrong.
Coupler.io solves this with AI context. Every dataset has context attached to it, and you write the client’s rules into it once, in plain language:

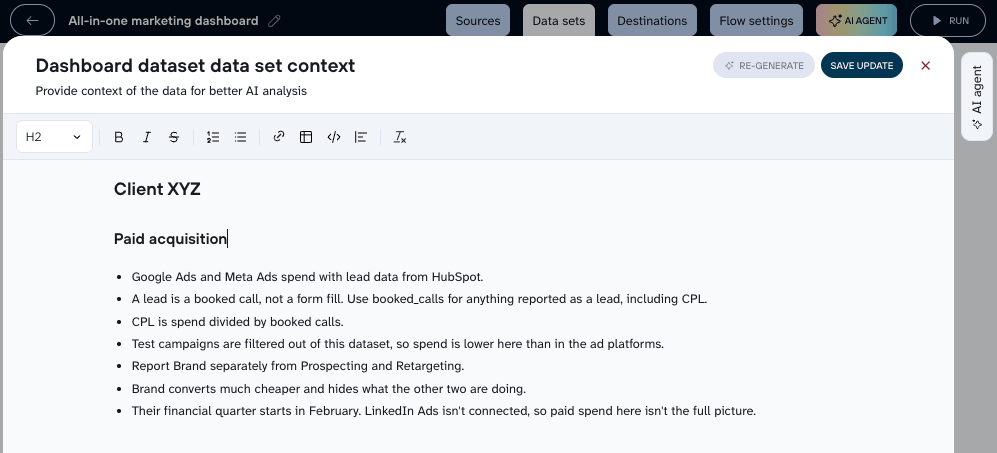
Those definitions travel with the data, and so every answer your team gets is based on them. One template can serve 30 clients, each with their own rules and metrics.
Last, set the refresh to match how often the client hears from you. A monthly report doesn’t need a daily refresh; a client with daily spend does.

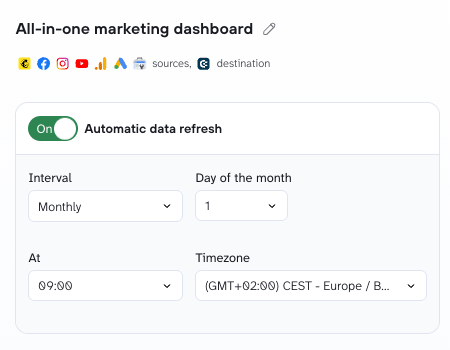
Here’s how much time one agency saved by setting up dozens of clients this way:


How SellThru cut new client setup from two weeks to two or three days
SellThru runs 35+ client reporting dashboards on Coupler.io, pulling ad platform and GA4 data together for a mixed client base. Automated data mapping cut new account setup from two weeks to two or three days. Tracking reliability now stays above 95%. Result: the team saves more than 20 hours a month.
Akshay Kapoor, Account Director at SellThru, calls it a “must-have tool for any agency looking to simplify data integration.”
2. Use AI to handle questions between reports
Clients often ask questions the report didn’t cover. Every new client adds more of them, and the usual workaround is uploading a file into an AI tool. You manually export client data, load it into a chat, generate an analysis, and check the numbers before repeating them to a client. It all takes time and energy away from creative work.
Coupler AI works on fresh client data you already connected, with your metric definitions applied. Your team can use it inside Coupler.io or in Claude or ChatGPT.
Say a client emails on a Wednesday asking why their leads look down:
Why did cost per lead go up for Client XYZ over the last two weeks?
The answer names the campaigns that moved and how much of the change each one accounts for.

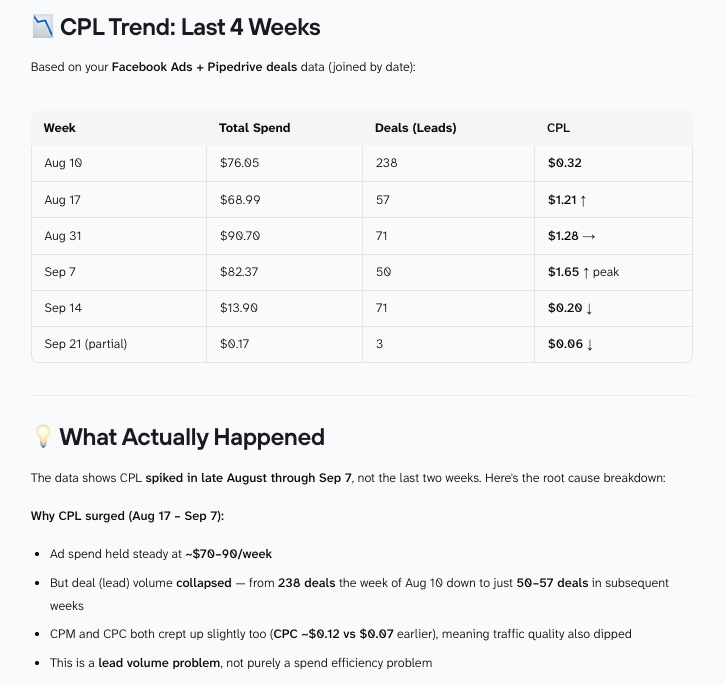
Both the agent and the dashboard read the same dataset. Tell a client on Tuesday that cost per lead rose 12%, and the monthly report says 12% too. The Analytical Engine works that figure out from the data, and the AI explains what it means.
Quick tip: always read the answer before forwarding it. The numbers come from your data, but the interpretation is the model’s. “Why did CPL go up” has more than one defensible answer.
Some questions come back every month for every client. Rather than writing the prompt each time, pick a pre-built Skill from Coupler.io’s AI Skills library.

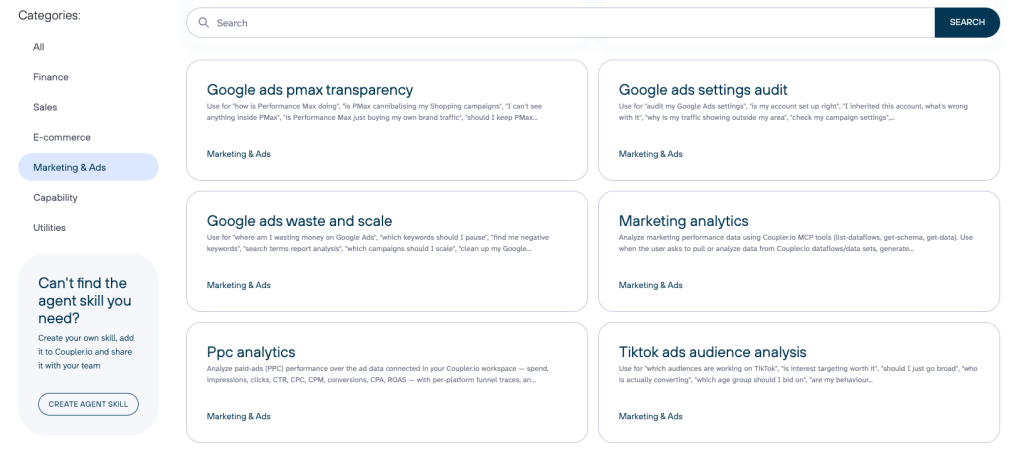
For example, the Facebook Ads Budget Pacing Skill answers the mid-month “are we on track” question before the client asks it.
The monthly write-up starts in the same place. The Google Ads Client Report skill works from last month’s data. It drafts the executive summary you’d put in front of a client. That includes how to present a target they missed. Our guide to building client reports with AI goes into more detail on AI-generated reporting.
To sum up, here’s what changes once both steps are in place:
| Reporting job | Manual process | After automated setup |
| Pull data from each platform | Every month | Marketing data integrations connected once during onboarding |
| Match campaign names across channels, apply the client’s metric rules | Every month | Done once, carried with the data |
| Refresh the dashboard | Every month | On an automatic schedule |
| Write the marketing report summary | Every month | Drafted from the data with AI |
For a quick walkthrough, read how to set up AI reporting via conversation.
Get mid-cycle answers on client data with Coupler.io
Book a demoScale client reporting for clients who don’t fit a standard setup
Some clients track data that a standard setup doesn’t cover:
- A retailer tracking margin by SKU
- A B2B client whose pipeline logic sits in custom CRM fields
- A franchise reporting by region against local targets
When a client like this signs, the report usually ends up being built manually every month. It doesn’t have to. A custom report can run on the same system as everything else.
Only the report structure changes. Your metric definitions, the destinations, and the refresh schedule all still apply. Rather than picking a template off the shelf, you describe what this client needs and the AI Agent builds the setup around it.

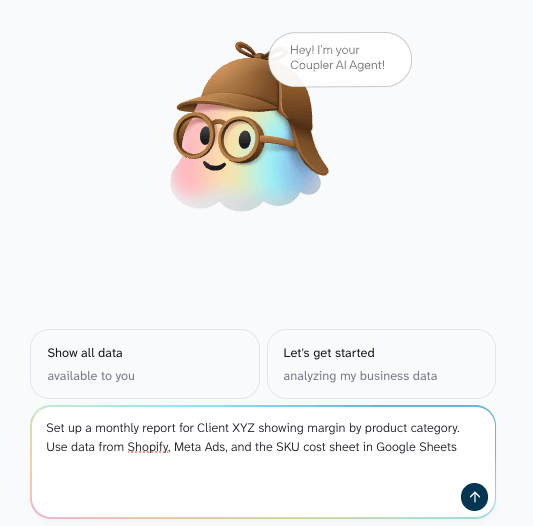
Keep the complex logic in the data. Margin bands, regional groupings, a client’s own attribution rule. Each is a transformation saved in that client’s setup. It runs every time the data refreshes. Heavier work needs more, like joining spend from one source with revenue from another. You describe what you need and the agent writes the SQL. Check the query once and it runs from then on.


How ULTRA\OPS built reporting for a client no template covered
ULTRA\OPS built a custom Airtable app where a client planned its ad campaigns. Airtable’s own reporting had run out of room, and a custom API connection would have been slow and expensive. With Coupler.io, the team had dashboards running in a single day and cut development time by an estimated 10x. The dashboards now pull DV360, Meta, and TikTok data on a schedule.
Some setups are too complex to build on your own, even with AI. For example, a report might blend metrics from a dozen sources, or need to match a client’s own financial model. For cases like these, Coupler.io’s team builds the setup together with your agency. You don’t have to work it out from documentation.
Have Coupler.io build your custom reporting setup
Talk to our teamBest practices for automated client reporting
Automated client reporting still needs an owner. Nobody notices a broken habit for a month or two, and by then it is on 40 accounts.
Set expectations on what reporting includes
Put the reporting scope in the contract:
- Which marketing report the client gets, and how often
- What dashboard access includes
- How many format changes you cover
- What counts as an ad-hoc request
The last one causes the most friction, so make it specific. A client asking why a figure looks off is not an ad-hoc request. A client asking for Q3 creative performance split by audience is.
Document your client reporting process
Most of what you need to run a client’s reporting lives in one person’s head. That works until they’re away during reporting week and someone else has to find the flow.
Write your client reporting framework down so a colleague could take over:
- Naming conventions
- Connection owners and backups
- Where your templates live
- KPI definitions
- Refresh schedules
- Who answers client-facing reporting questions
The test is whether a new account manager can make a routine change without asking around.
Control who sees each client’s data
As your team grows, more people work on client accounts, including contractors who only need one or two of them.
Coupler.io workspaces keep each client’s data flows, connections, and dashboards apart. Someone working on two accounts won’t see the rest of your roster.

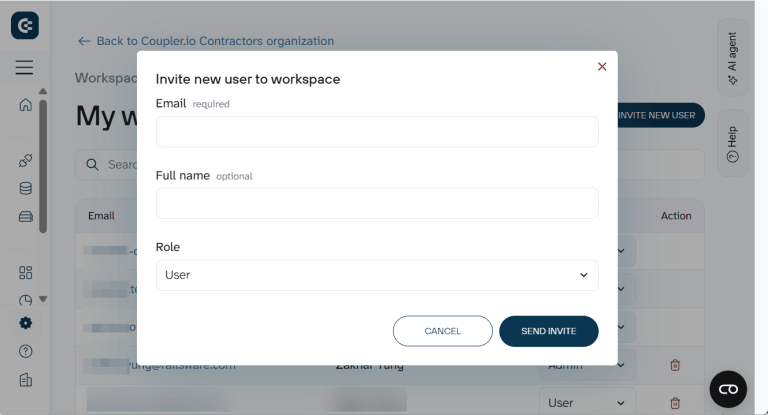
Give each person their own login instead of a shared one. When someone leaves or ends a project, you remove their access, and nobody else has to change a password.
Track your marketing reporting automation
A template covers the channels a client had when you set it up. When that changes, nothing breaks, which is the problem. The client opens a second Google Ads account or launches LinkedIn campaigns, and the report keeps arriving without it.
Smaller versions happen too. A campaign gets renamed and your groupings miss it. Someone leaves the client’s team and access is revoked. Your marketing reporting automation keeps running through all of it.
So check for changes at the source, not just for failed runs:
- Any key metric that dropped to zero, or jumped with no campaign change behind it
- Any client who opened an account or launched a channel since the last cycle
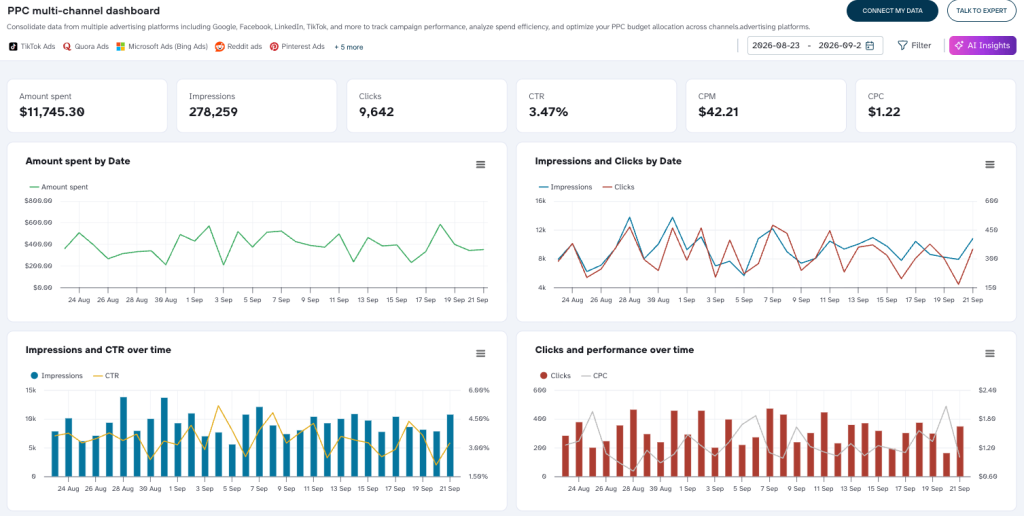
A second account on a platform you already report on is a quick fix. Add it to the flow and the dashboard picks it up on the next refresh. A new channel is a bigger job, since a single-platform template has nowhere to put it. That client moves to a multi-channel template. For example, a PPC multi-channel dashboard or an All-in-one social media analytics dashboard.

What scalable client reporting looks like once it’s running
The process won’t always be tidy. Someone still has to read the draft analysis and decide what to tell the client. Clients who want a deck will still want a deck. And waiting on platform access isn’t a reporting problem.
You’ll know you have scalable client reporting when these are true:
- Reporting setup is one of the quicker parts of onboarding, not the thing that holds it up
- A client’s numbers are the same wherever they appear
- Your team can answer a mid-cycle question in minutes. No need to spend hours investigating, validating, and crafting a response.
- A client with cross-channel sources or specific metric definitions doesn’t need a workaround
Scalable client reporting comes from one system rather than a custom setup per client. You can standardize client reporting at four points: where the accounts connect, how data is organized, which template you start from, and what each metric means. That’s how to scale client reporting for agencies without your headcount scaling with it.
Onboard your next client faster with Coupler.io
Start for freeFAQs
Do I need dedicated client reporting tools, or can I use what I already have?
You need something that pulls data from the platforms on a schedule and applies the same metric definitions every time. Native exports and BI dashboards don’t. They show data someone had to manually collect and organize.
That’s the part client reporting tools handle, and it’s separate from where the report is read. Some client reporting software keeps the report inside its own interface. Coupler.io sends prepared data to Data Studio, Power BI, Google Sheets, or the AI tools your team uses.
What happens to a client reporting dashboard and its data when a client leaves?
Pause their data flows and revoke access to their accounts. Once that’s done, you can disconnect those accounts so they stop counting toward your bill. Then apply your data-retention policy to the historical data, based on your contract and final billing questions.
How many clients can one account manager handle?
That depends on account scope, data complexity, and how much you standardize client reporting. At 20 to 30 hours of manual reporting per client per month, an account manager fills up fast. With automated client reporting in place, that drops to a few hours.
Is it safe to connect client data to AI tools?
That depends on how you build the connection. With Coupler.io, AI tools query prepared datasets and never reach your client’s source systems. You choose which datasets are accessible and exclude sensitive fields first. Coupler.io is SOC 2 Type II certified and GDPR and HIPAA compliant.