
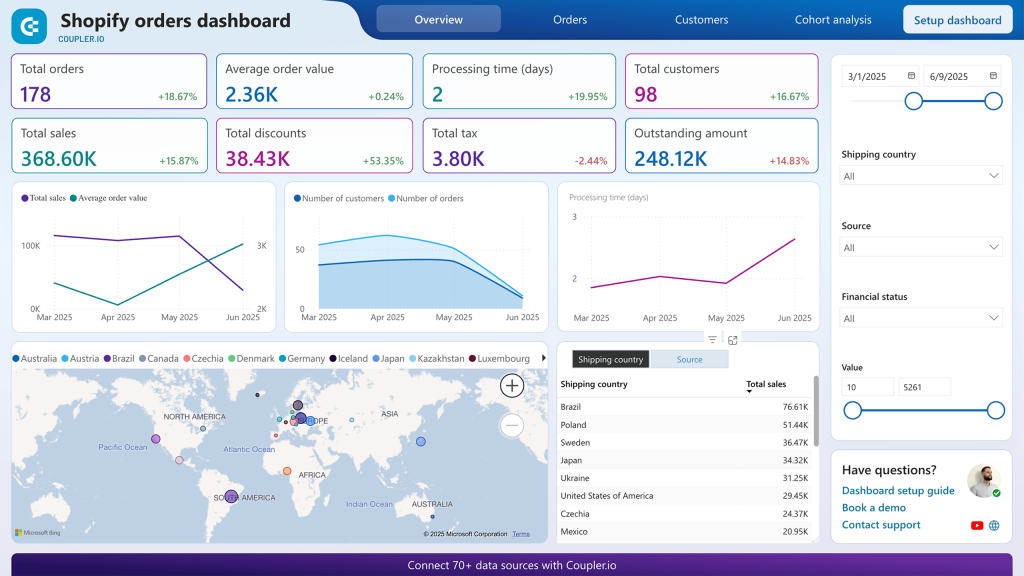
Every Shopify store generates data across orders, products, customers, and inventory, but Shopify’s built-in reports only go so far. When you connect Shopify to Microsoft Power BI, you get the flexibility to build custom dashboards and dig into performance trends that Shopify’s native reports can’t surface. Since there is no native Shopify connector in Power BI, I’ll show how you can set up a live connection using Coupler.io. It not only creates Shopify integrations but also provides pre-built dashboard templates and AI analytics capabilities for your Shopify data.
How to connect Shopify to Microsoft Power BI with Coupler.io
Coupler.io is a data integration platform and AI analytics tool that connects Shopify (along with 400+ other sources) to Power BI, spreadsheets, data warehouses, and AI tools like Claude and ChatGPT. The setup takes a few minutes with no code: you pick what data to pull, apply any filters or transformations, connect Power BI, and automate data refresh on the desired schedule. Once the data flow is running, your Power BI reports stay up to date without manual exports
Use the form below to create a data flow from Shopify to Power BI. You’ll be offered to sign up for Coupler.io for free without providing any sensitive data like a credit card.

Proceed with the setup, which requires you to complete the following 4 steps:
Step 1. Collect Shopify data
Connect to your Shopify account. You’ll need to enter your full shop name and then log in to Shopify. Then select the data entity to export from Shopify: customers, inventory, products, orders, and so on.

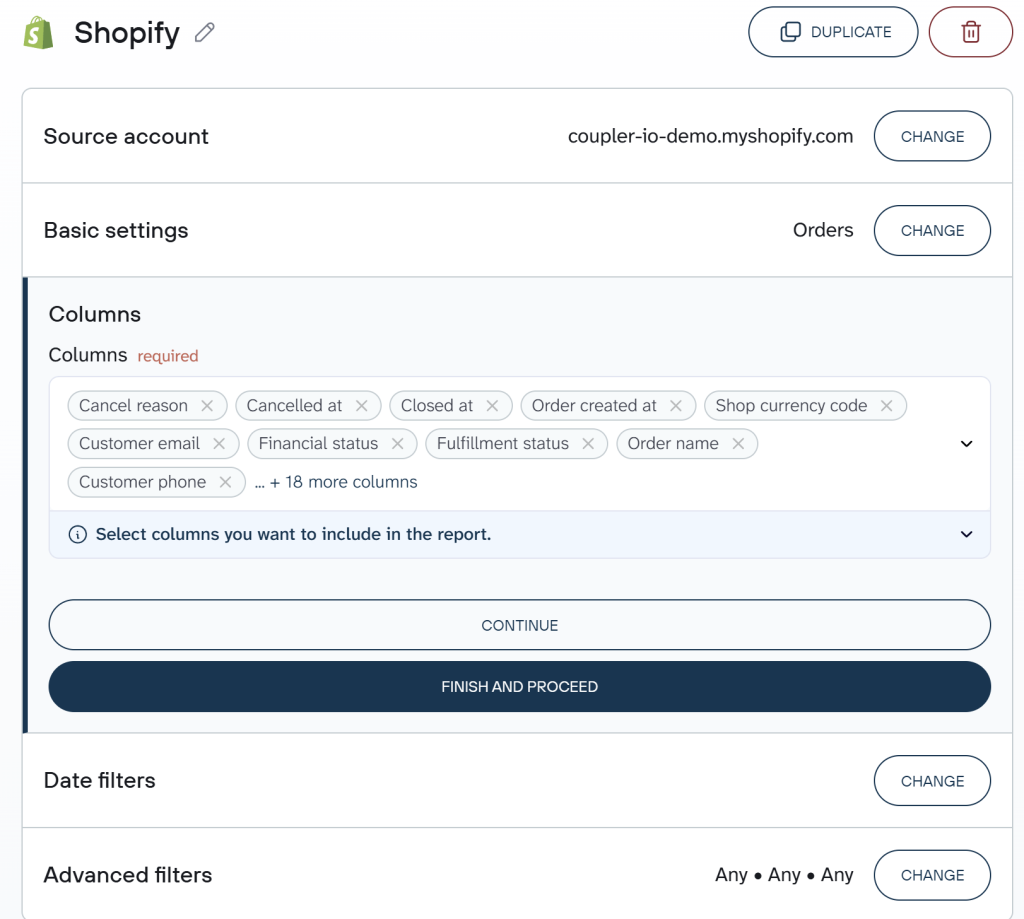
Optionally, you can specify the reporting dates for the records, filter them by status or by ID.
Shopify is one of 400+ sources available in Coupler.io. If you run ads alongside your store, you can pull data from Google Ads, Facebook Ads, TikTok Ads, or other platforms into the same data flow and blend it with your Shopify orders in the next step. Or simply combine information from multiple Shopify stores, accounts, or data entities in one data set. Just click on the Add one more source button and configure additional sources.
Step 2. Organize your data set
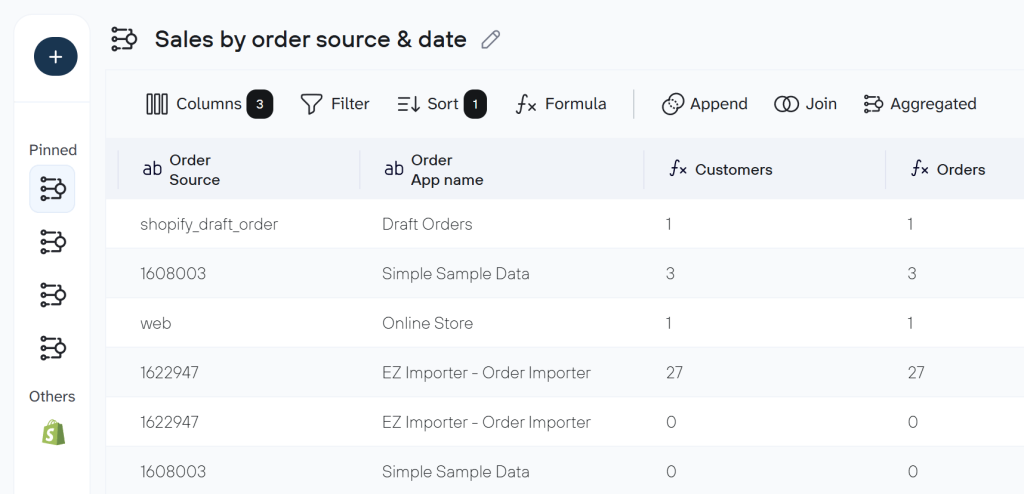
Before your Shopify data reaches Power BI, you can shape it to match your reporting needs. Coupler.io gives you several options:
- Column management — hide columns you don’t need in Power BI, rename fields for clarity, and change column types.
- Filter — narrow the dataset by any criteria, such as order status, date range, or product type.
- Sort — set the default sort order for the exported data.
- Formula — create calculated columns using supported formulas. Useful for things like margin calculations or concatenating fields.
- Aggregate — group rows and calculate sums, averages, or counts. If you want total revenue by product or average order value by country before the data hits Power BI, set it up here.
- Blend — combine data from the additional sources you added in Step 1. If you pulled Shopify orders and Google Ads spend into the same data flow, this is where you join them into a single table.

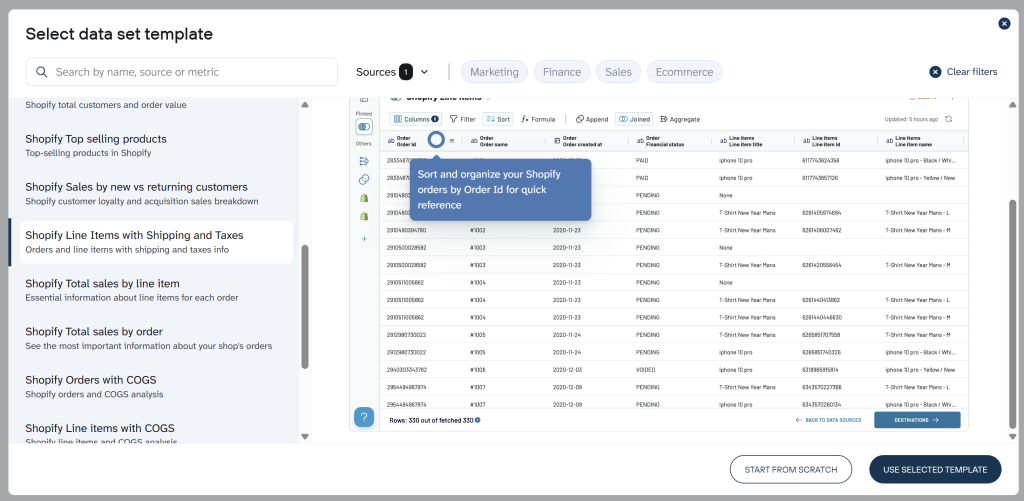
Tip: If you’re loading Shopify data into Power BI for sales analysis, inventory tracking, or profitability, consider using a data set template instead of building transformations manually. Each template comes with your data already structured, aggregated, and enriched with the right metrics. So, when it lands in Power BI, you can start building visuals immediately instead of spending time on data prep.
To get started, create a new data flow in Coupler.io, click Start with template, and search for Shopify. Select the template, connect your accounts, choose Power BI as the destination, and your analysis-ready report will be loaded automatically.

Tip: Coupler.io lets you add business context to your dataset — descriptions of what each column means, how metrics are calculated, what the data represents, and more. This context travels with the data into AI tools, so when you ask a question about refund rates or average order value, the AI already knows the definitions instead of guessing.
Step 3. Load data to Power BI and schedule refresh
Once the data preparation is complete, you can connect Shopify to Power BI. Follow the instructions in the wizard which include the following steps:
- Generate and copy the Power BI integration URL
- Go to Power BI desktop and navigate to Get data => Web.

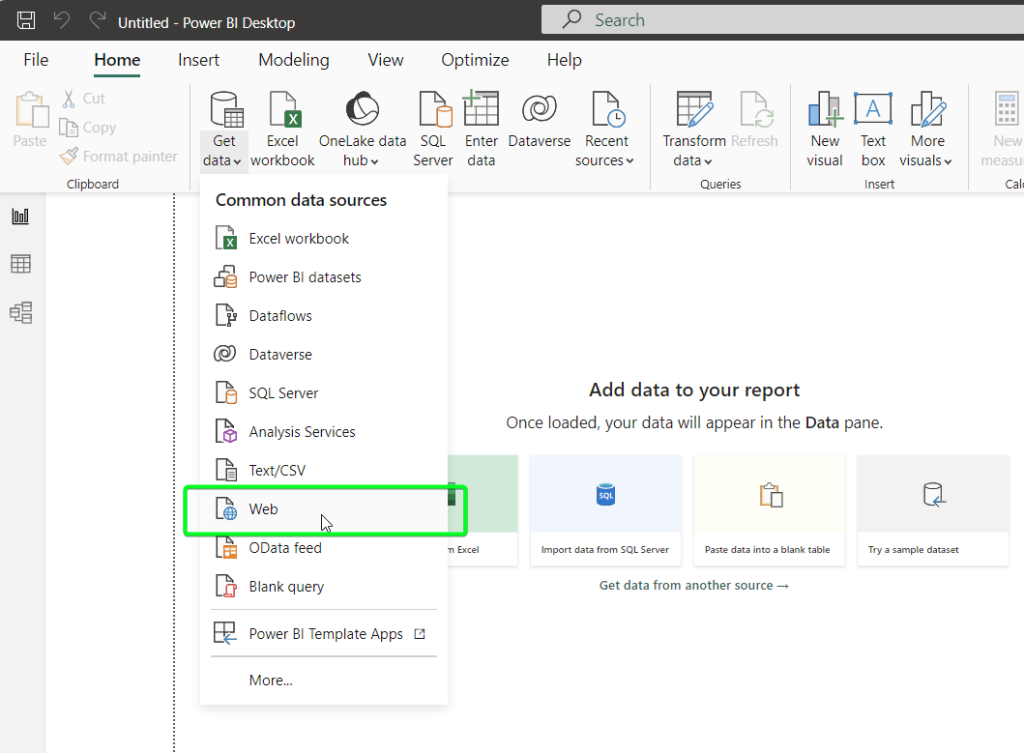
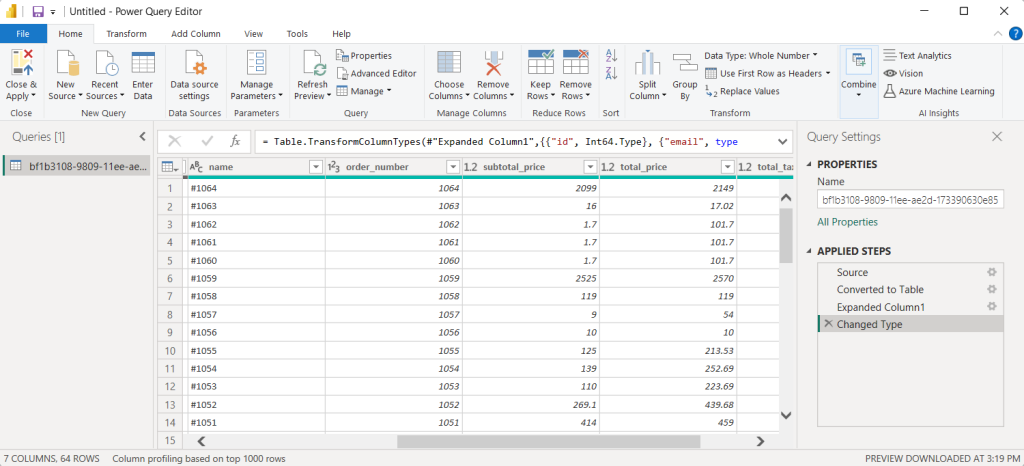
- Insert the integration URL and click OK. In a few moments, a Power Query Editor with your Shopify data will open.

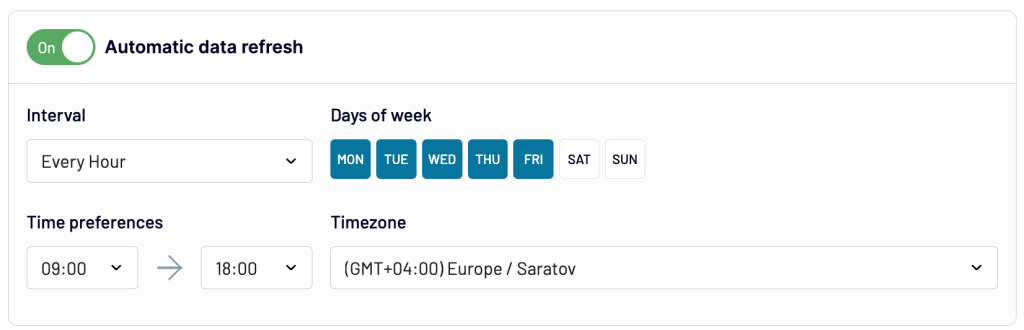
Before you start building reports, set up automatic data refresh. This is the step that lets you automate data flow from Shopify to Power BI. Go back to Coupler.io and toggle on Automatic data refresh. You can set the interval (as often as every 15 minutes), choose specific days of the week, and pick a time zone. Once the schedule is active, your Shopify dataset updates on its own.

Power BI is not the only destination you can use for this data. Within the same data flow, Coupler.io lets you send Shopify data to multiple destinations at once. You can connect Shopify to Power BI for dashboards, Google Sheets for a shared sales tracker, BigQuery for long-term storage, and Claude for ecommerce analytics in conversations. You configure additional destinations in the same data flow without duplicating the source connection.
Bonus step. Analyze Shopify data with AI
Once your Shopify data is flowing into Power BI on a schedule, you already have a clean, structured dataset that refreshes automatically. You can analyze that same dataset with AI by asking questions in plain English instead of building visuals.
Coupler.io’s AI Agent lets you chat with your Shopify data directly. You type a question, the Analytical Engine runs the calculation on your live dataset and validates the result, and the AI returns a verified answer.

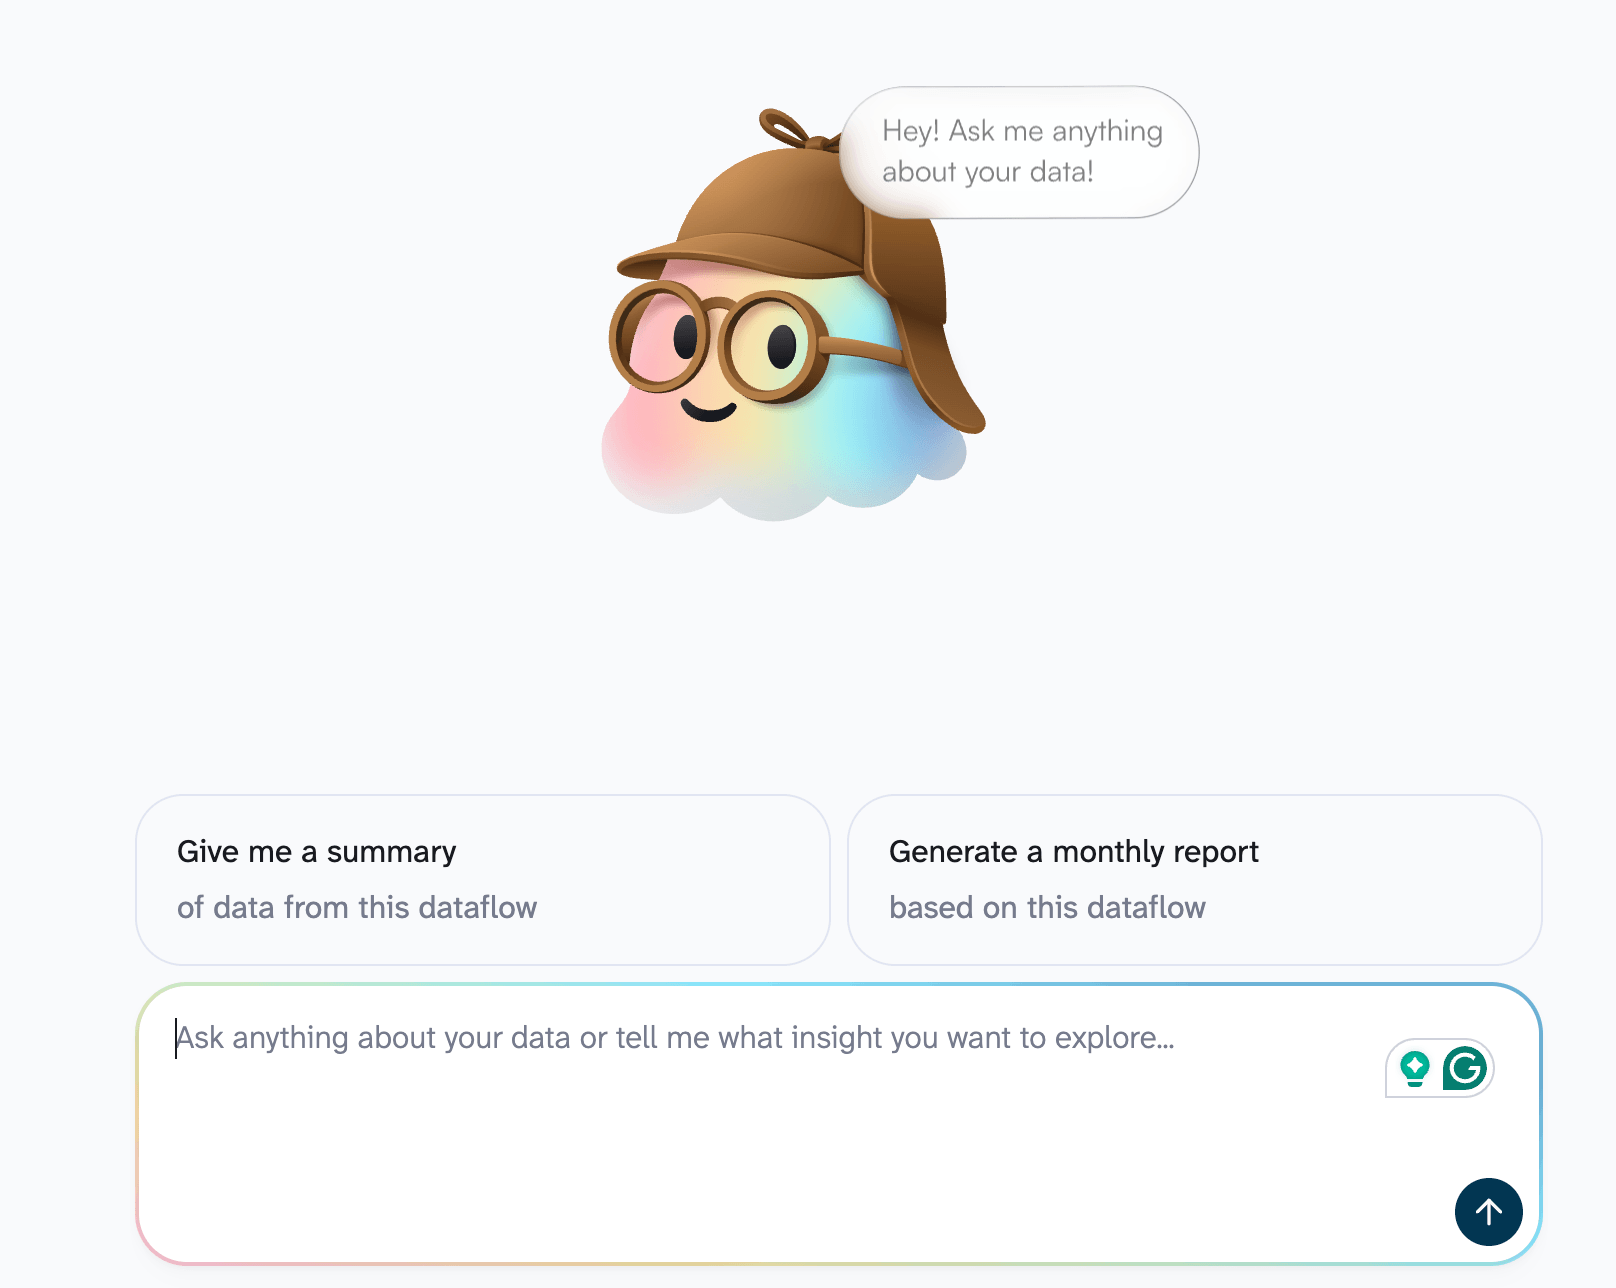
A few examples of what you can ask:
- What’s my average order value for the last 30 days, and how does it compare to the previous period?
- Which products have the highest refund rate this quarter?
- Show me revenue by country for the past 90 days, sorted by total spend.
Coupler.io also offers an ecommerce analytics skill — a set of pre-configured analysis patterns built around order data, product performance, customer segmentation, and inventory metrics. Instead of writing prompts from scratch, the skill guides the analysis toward the questions that matter most for store owners.


One Shopify connector with over 15 destinations for reporting and AI analytics
Try Coupler.io for freeWhat data you can load from Shopify to Power BI
Coupler.io’s Shopify connector supports the following data entities:
- Orders — Individual purchase records including order number, status, totals, and timestamps.
- Customers — Customer profiles with contact details, order history stats, and account status.
- Inventory — Stock levels and availability for each product variant across locations.
- Products — Product catalog entries with titles, descriptions, types, vendors, and publishing status.
- Products with variants — Products expanded to show each variant’s price, SKU, weight, and inventory details.
- Orders with line items — Orders broken down by each purchased item, including product, quantity, price, and discounts applied.
- Orders with activities — Orders enriched with their event timeline — status changes, edits, and fulfillment updates.
- Orders transactions — Payment transactions tied to orders, including authorization, capture, and payment method details.
- Orders refunds transactions — Refund-specific payment transactions showing amounts returned, method, and processing status.
- Orders with refunded items — Orders expanded to show each refunded line item with quantities returned and refund reasons.
- Orders with shipping lines — Orders paired with their shipping method, carrier, cost, and delivery details.
- Order fulfillments with line items — Fulfillment records showing which items were shipped, tracking numbers, and shipment status.
You select the data entity when configuring the Shopify sources connection when setting up the data flow. If you need data from multiple entities in the same Power BI report, add them as separate sources and blend within the same data flow.
Analyze your Shopify data in Power BI with dashboard templates
Power BI provides a wide range of chart types, DAX formulas, and interactive filtering for reporting and analysis of your Shopify data. For a deeper walkthrough, check out our Power BI tutorial. Enjoy them and have fun building your Shopify analytics dashboard and other charts for your business.

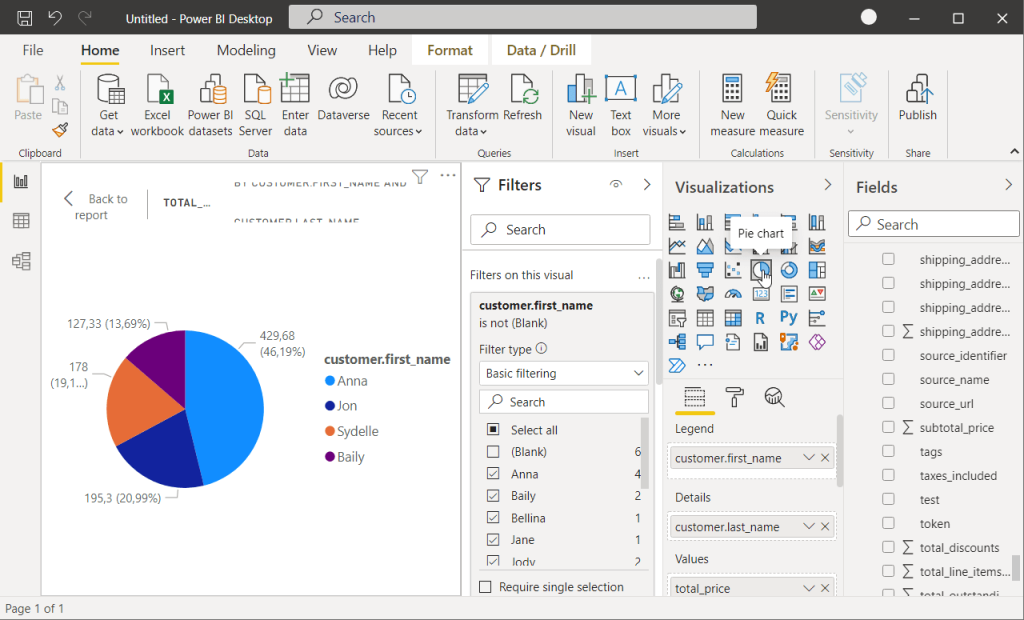
While Power BI offers incredible flexibility for custom analytics, Coupler.io created a few dashboard templates specifically designed for Shopify store owners. These templates provide instant insights without the complexity of manual Power BI setup, covering the complete customer journey from marketing to fulfillment.
Shopify orders dashboard
If you’re tracking post-purchase operations like fulfillment status, payment processing, and geographic revenue distribution, the Shopify orders dashboard pulls it together in one view. It connects order data, customer info, and product analytics through Coupler.io, with automatic refresh so the numbers stay up to date. You can monitor order lifecycles, break down revenue by country, compare new vs returning customer spending, and identify top-selling products by both quantity and revenue.
Shopify orders dashboard in Power BI

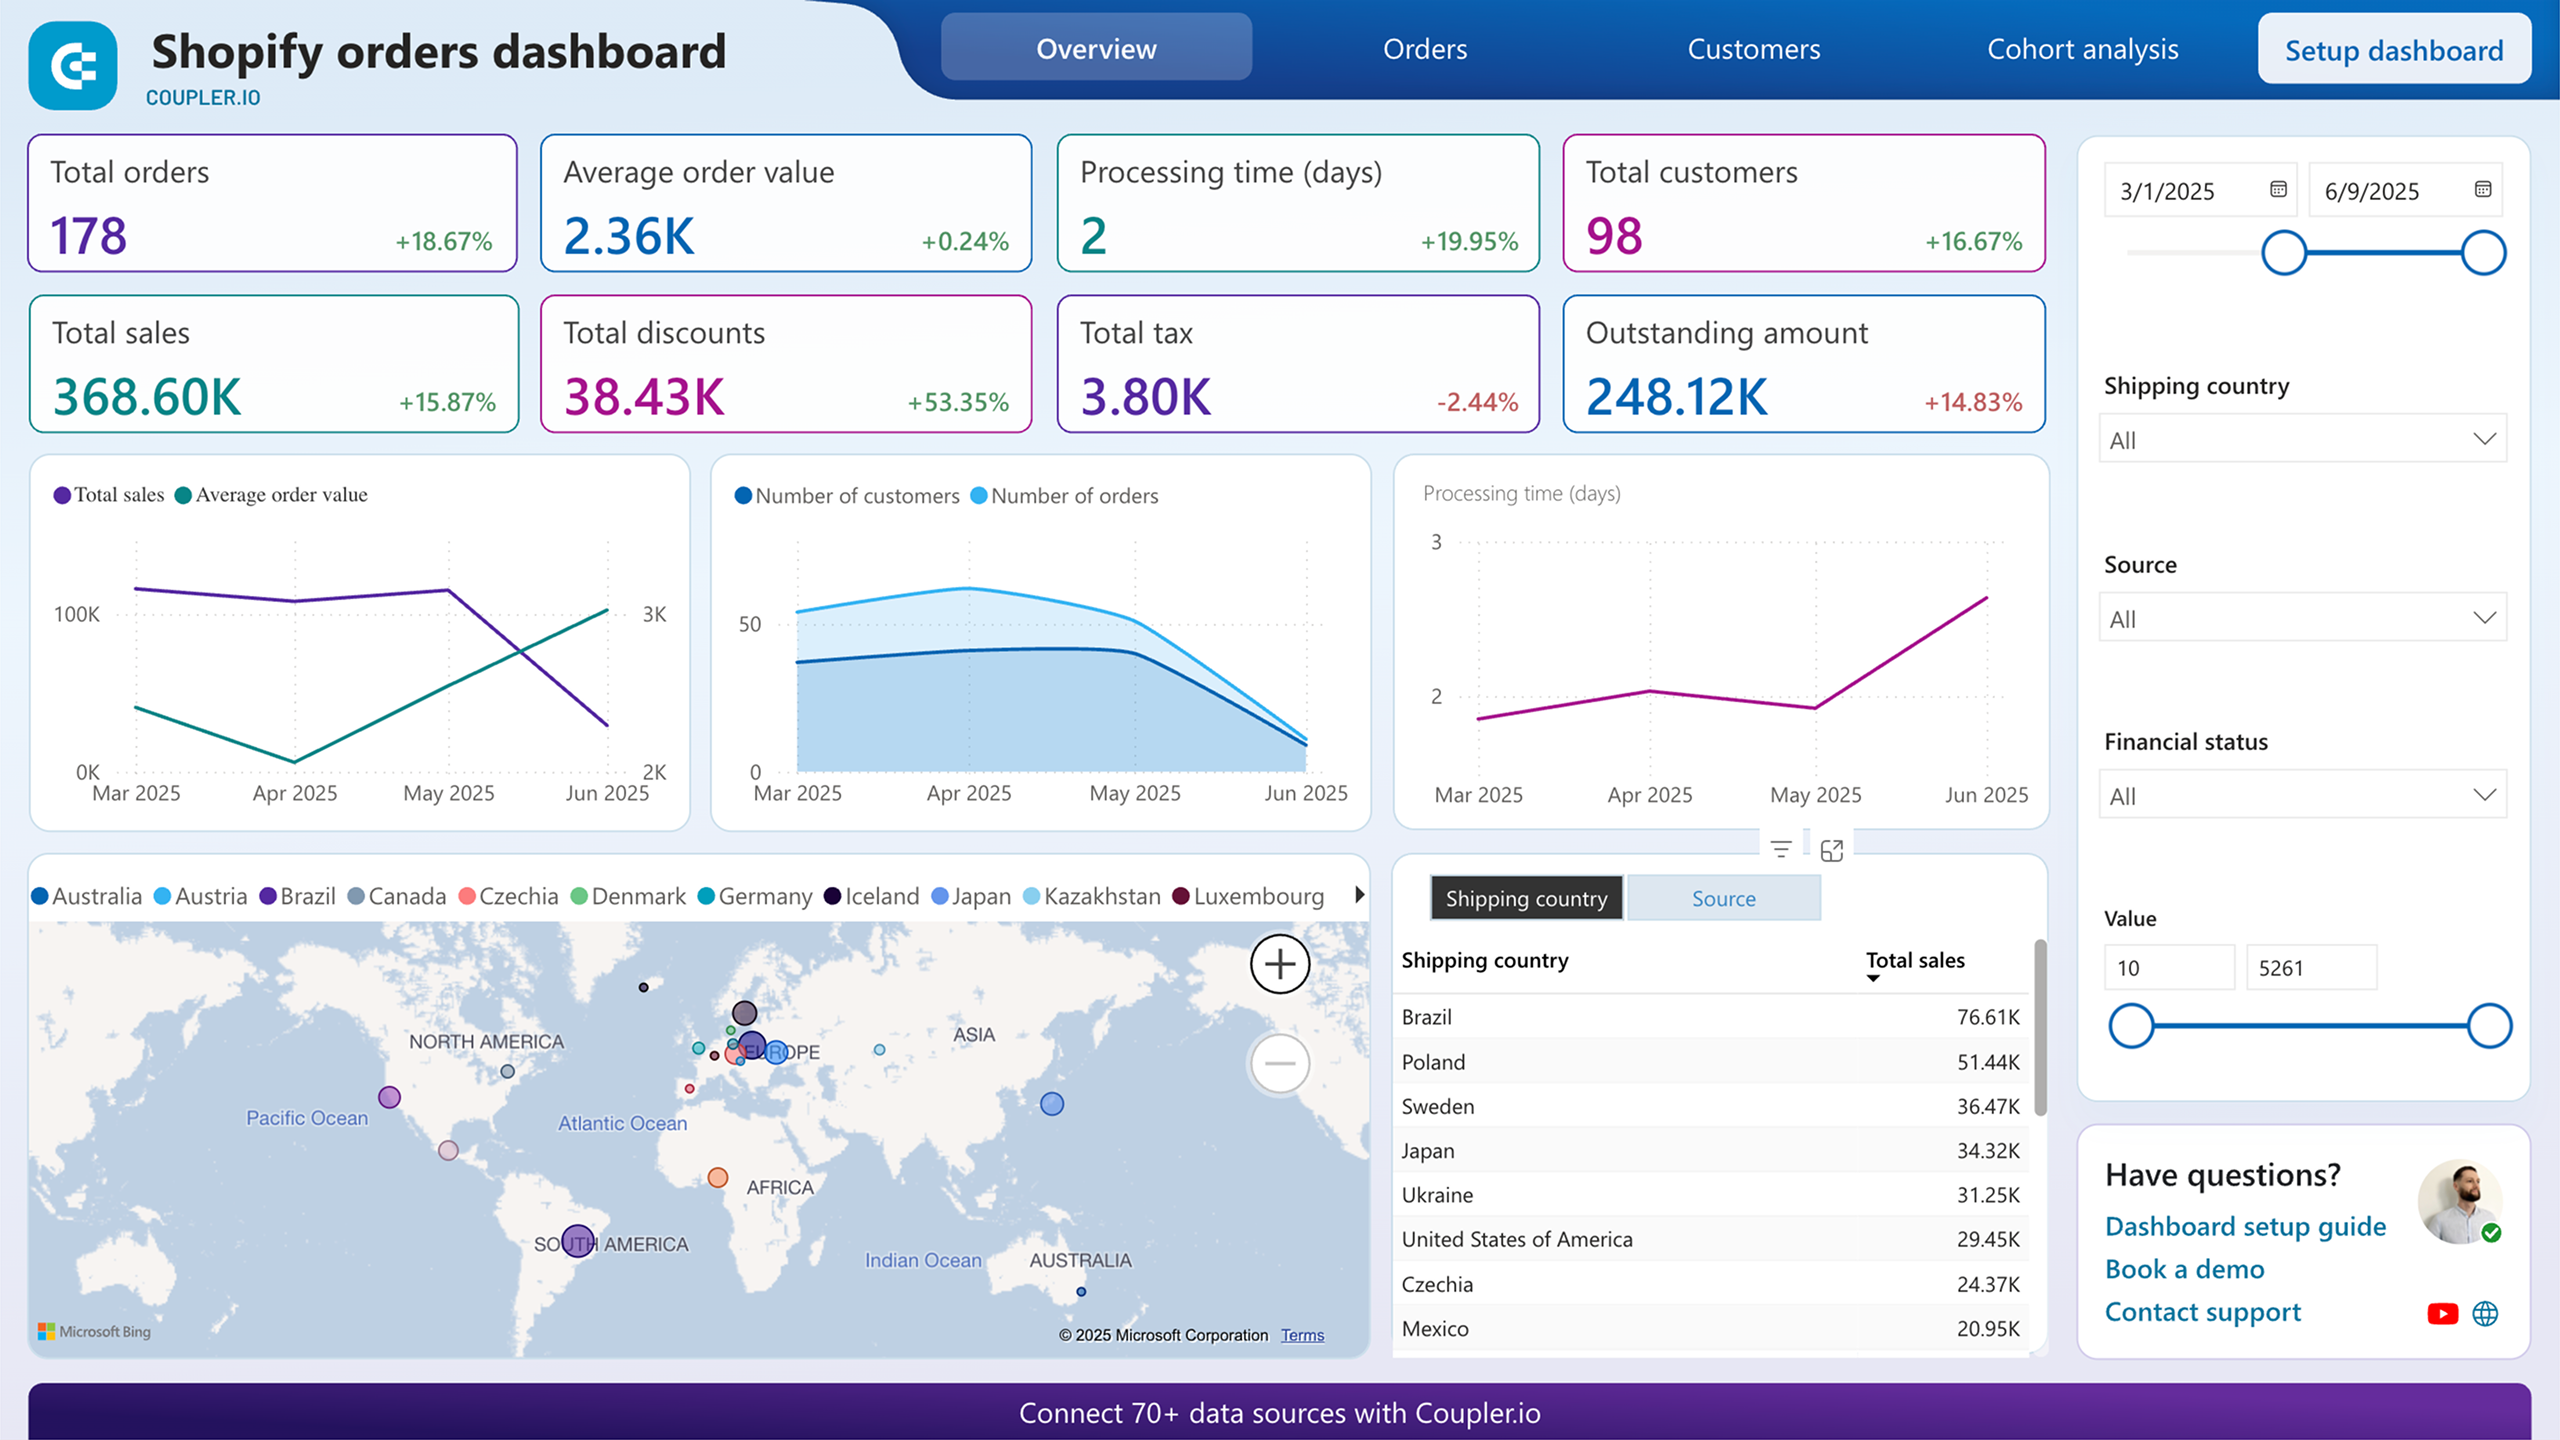
Shopify orders dashboard in Power BI
Preview dashboardThe Shopify dashboard template comes pre-built in Power BI with automated Shopify integration through Coupler.io. The connector seamlessly syncs order data, customer information, and product performance metrics, ensuring your e-commerce analytics remain current with real-time data synchronization and eliminating manual data exports.
Shopify marketing funnel analytics dashboard
When you’re running ads across Google, Facebook, or other platforms alongside your Shopify store, the gap between ad spend and actual purchases is hard to see without combining the data. The Shopify marketing funnel analytics dashboard connects Shopify, GA4, and your ad platforms into a single funnel view, from impressions and clicks through to completed orders. It tracks weekly funnel performance, compares ROI across channels, and breaks down spend by platform so you can see where the budget is going and what it’s producing.
Shopify marketing funnel dashboard in Power BI

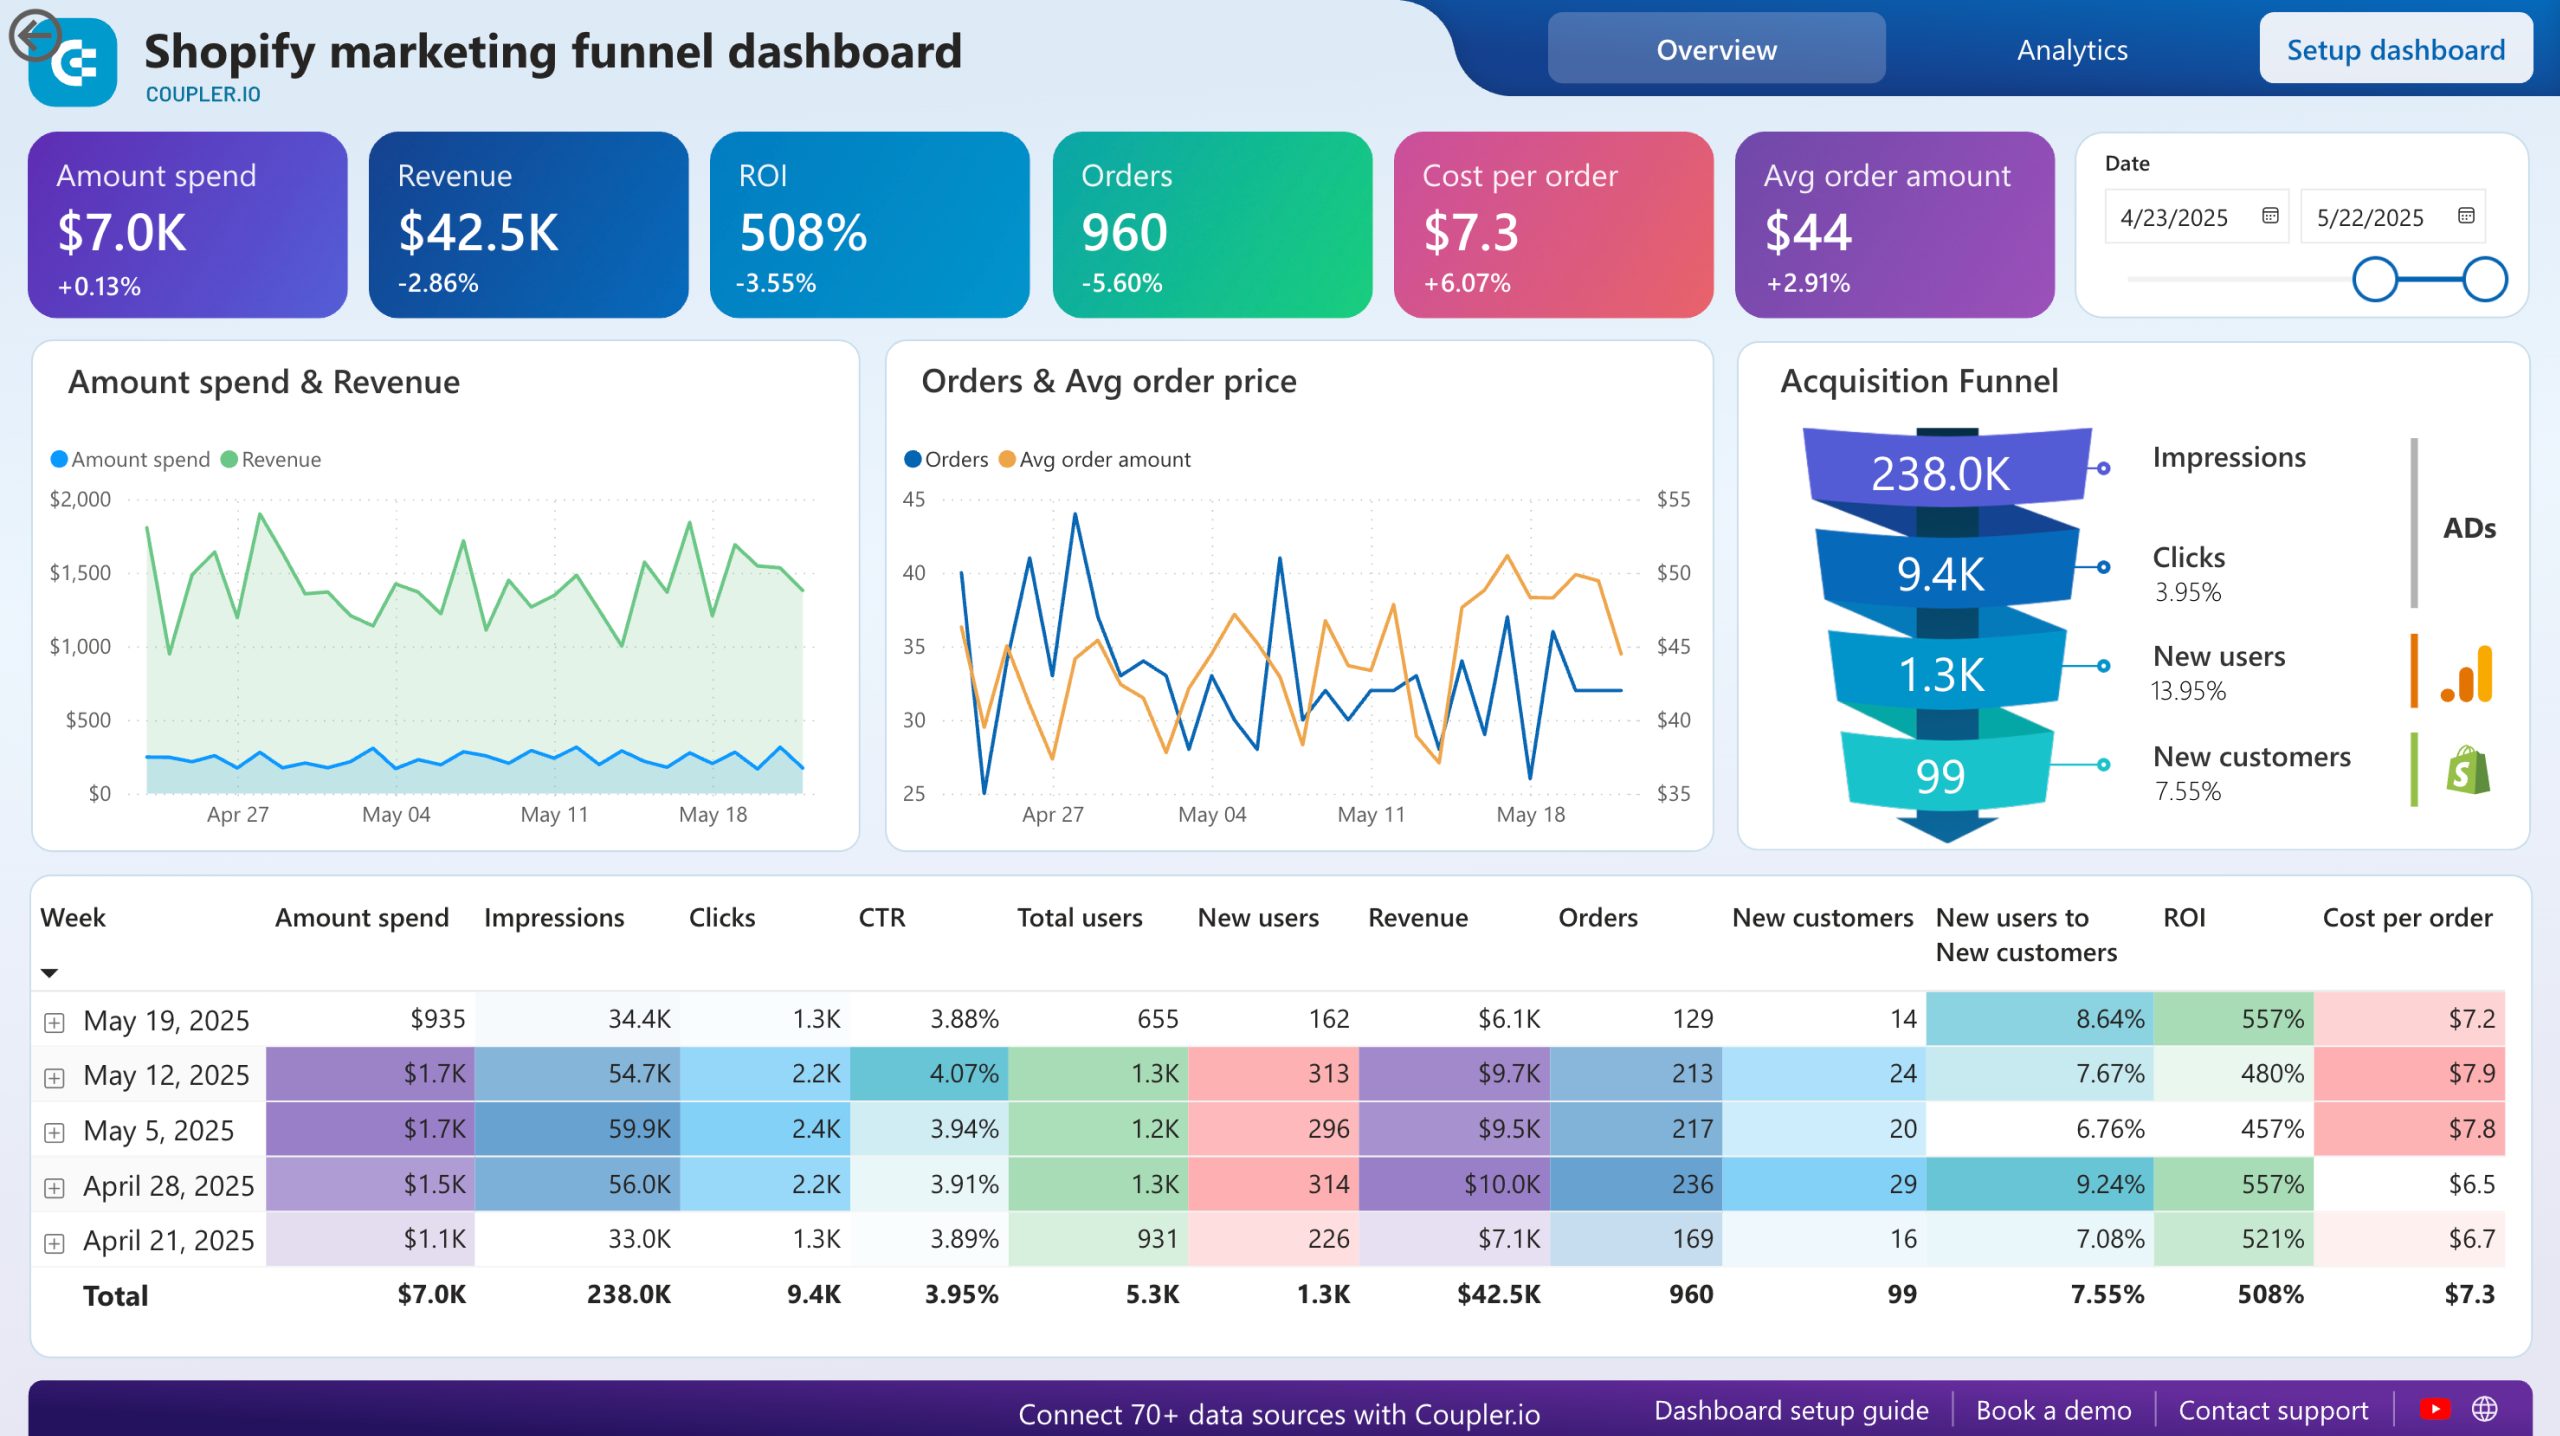
Shopify marketing funnel dashboard in Power BI
Preview dashboardThe dashboard combines data from Shopify, Google Analytics 4, and major advertising platforms like Facebook Ads and Google Ads to give you a complete view of your customer acquisition journey from impression to purchase.
The dashboard comes pre-built in Power BI with automated data connections by Coupler.io. Simply follow the setup instructions to connect your Shopify store, Google Analytics, and advertising accounts. Data refreshes automatically, so you’ll always have current insights without manual updates.
Shopify store traffic dashboard
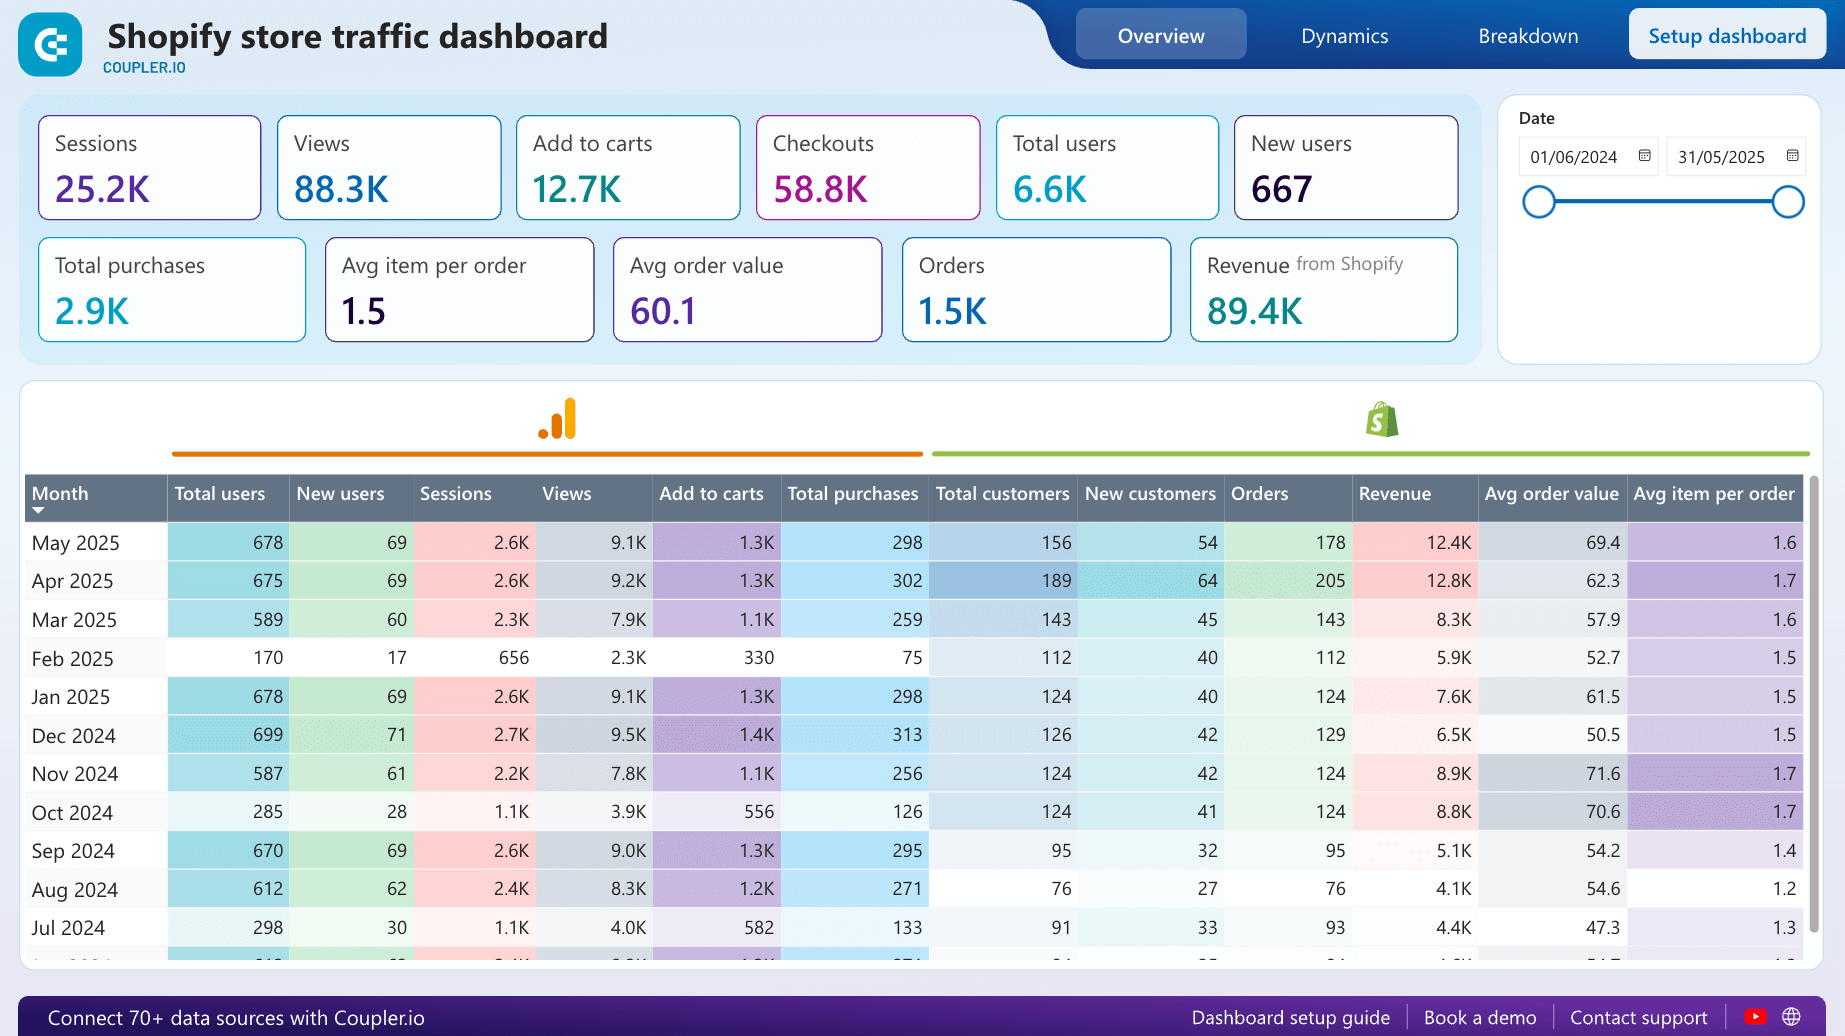
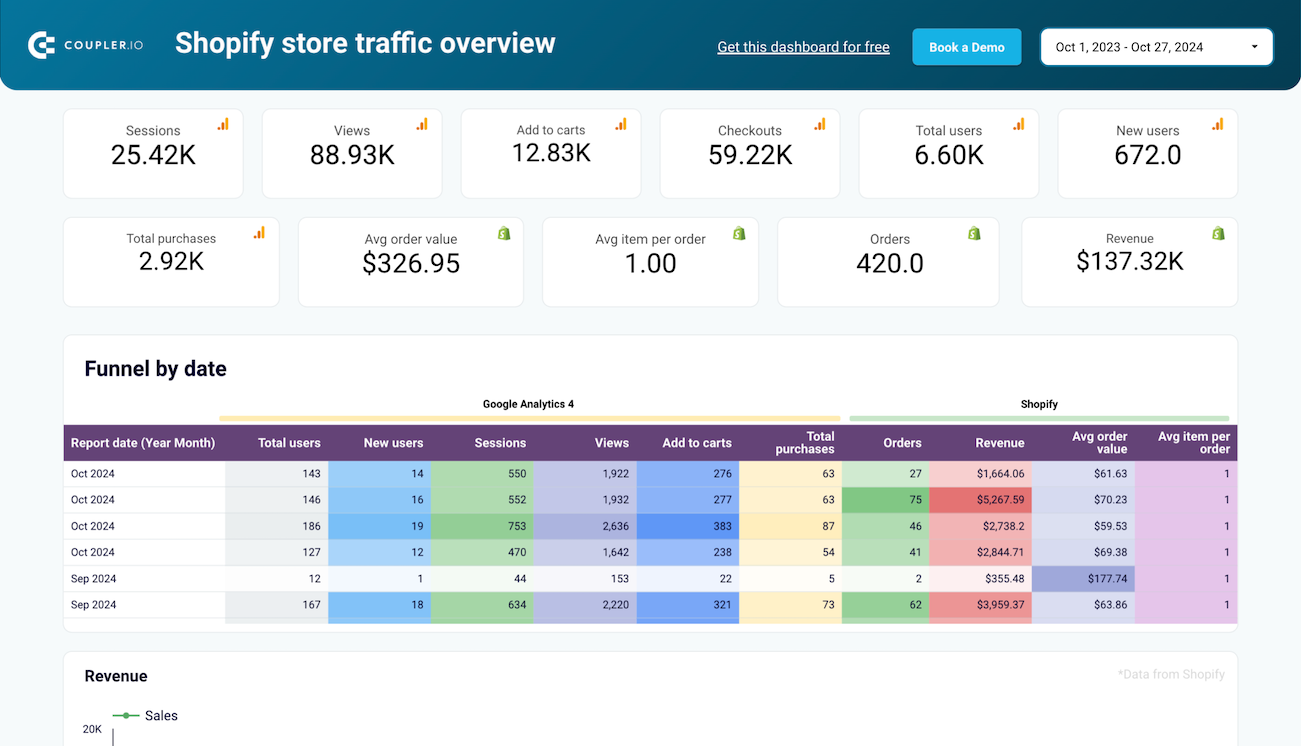
For stores where conversion rate is the main concern, the Shopify store traffic overview dashboard tracks the journey from site visit to purchase by combining Shopify and GA4 data. It shows where visitors drop off between browsing, adding to cart, and checkout, and breaks down order volume by country so you can spot geographic patterns. Available as both a Power BI and a Data Studio template.

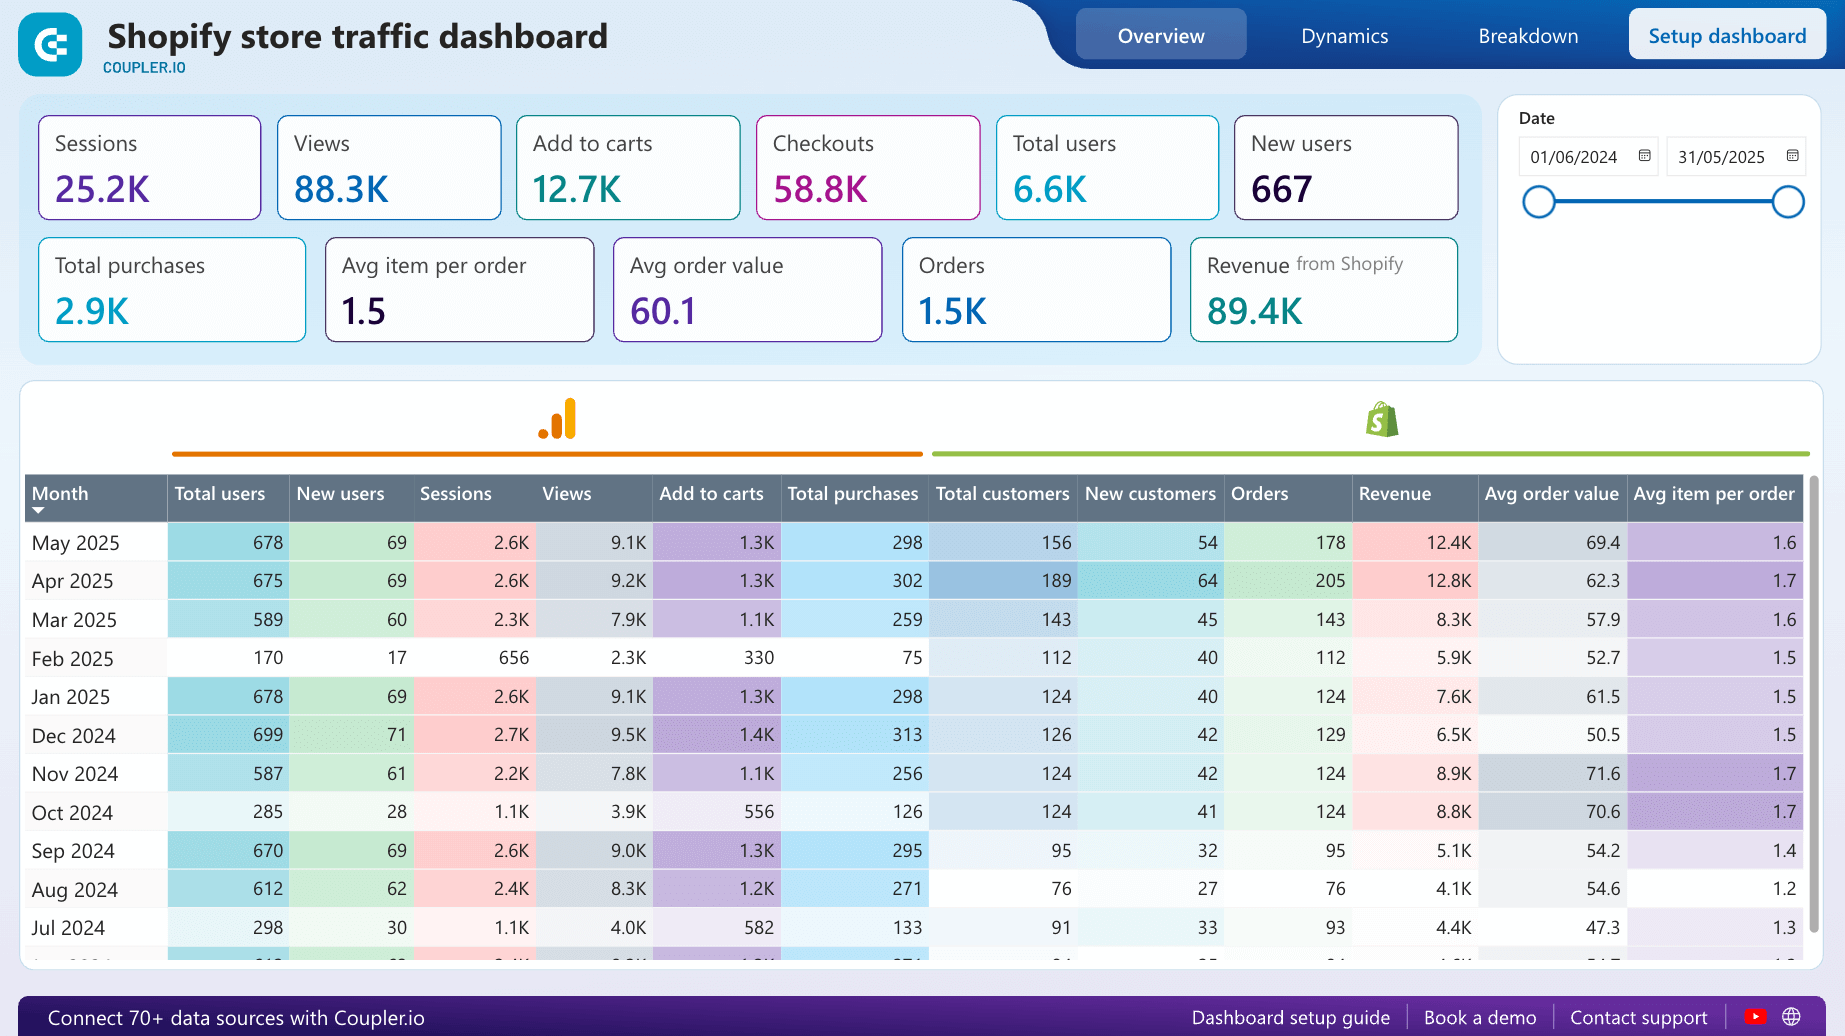
This Shopify dashboard is built in Power BI but also available as one of the most popular Shopify Looker Studio templates. It is equipped with Coupler.io’s dedicated connectors for Shopify and GA4. To make a copy of either template, simply sign up for Coupler.io for free and connect your business accounts.



What are other ways to connect Shopify to Power BI?
Since Power BI doesn’t have a native Shopify connector, every method involves some kind of intermediary. Coupler.io handles that with a direct connection, but there are other approaches worth knowing about, especially if you have specific constraints around tooling or budget.
Shopify API + Power Query. You can call the Shopify Admin API directly from Power BI using Power Query’s Web connector. This gives you full control over the data, but you need to handle authentication, pagination, rate limits, and JSON parsing yourself. There’s no built-in scheduling either: you refresh manually or set up a Power BI gateway, which adds its own configuration. For a one-off pull, this can work, but maintaining it long-term means maintaining code.
Excel as a middle step. Another option is exporting Shopify data to Excel (either manually from Shopify admin or through Coupler.io’s Shopify to Excel connector), then loading the workbook into Power BI. This lets you review raw data in a spreadsheet before it reaches Power BI. The downside is that you’re adding an extra step to every refresh cycle, and keeping the Excel file in sync with Power BI requires OneDrive and Power BI Desktop. If you only need a one-time snapshot, it’s fine. For ongoing reporting, it’s more maintenance than the direct connection.
Third-party iPaaS tools (Zapier, Make, etc.). General automation platforms can move Shopify data to a destination that Power BI can read, such as Google Sheets to Power BI or a database. They handle triggers and basic field mapping, but they’re not built for analytical workloads. You won’t get transformations like aggregation, blending, or formula columns before the data reaches Power BI, and scheduling options are usually tied to pricing tiers.
With Coupler.io, you get the direct Shopify to Power BI integration, built-in transformations, auto-refresh as often as every 15 minutes, dataset templates that skip the data prep entirely, and AI analysis on the same data.
Integrate Shopify with Power BI using Coupler.io
Get started for freeFAQ on connecting Shopify to Power BI
Does Shopify have a native Power BI connector?
No. Power BI doesn’t include a built-in Shopify connector, so you need a third-party tool or the Shopify API to move data between the two. Coupler.io provides a direct connection with no code and automatic refresh.
How often can Shopify data refresh in Power BI?
With Coupler.io, automatic refreshes run as often as every 15 minutes. The data flow runs on its own, so your Power BI reports stay up to date without manual exports.
Can I combine Shopify data with other sources in the same Power BI report?
Yes. Coupler.io lets you add multiple sources to the same data flow and blend them before loading to Power BI. For example, join Shopify orders with Google Ads spend or GA4 session data into a single table.
Can I use Google Sheets instead of Power BI for Shopify reporting?
Yes. Coupler.io supports Google Sheets as a destination, and it’s possible to connect Google Sheets to Power BI later if needed.
What about Data Studio or other BI tools?
The same Shopify data flow can send data to Data Studio, BigQuery, Excel, and other destinations. If you want to go the Data Studio route, the Shopify to Data Studio guide covers that setup.