The COVID-19 outbreak caused significant constraints of public life and traveling. Air connection throughout the world has been closed for several months. Now, countries have begun to renew air connection and allow tourists in. Because of that, we decided to share a dashboard with the available destinations open for travelers and those expected to open soon. And of course, we’ll explain how to do this and which tools to use. Here we go!
The Dashboard: What does it consist of?

The idea of this dashboard belongs to the Railsware team, as they had to postpone their Yearly Summer Summit as a result of the pandemic. The dashboard was designed to monitor the current status: track international flights and travel situations. You can see two sections:
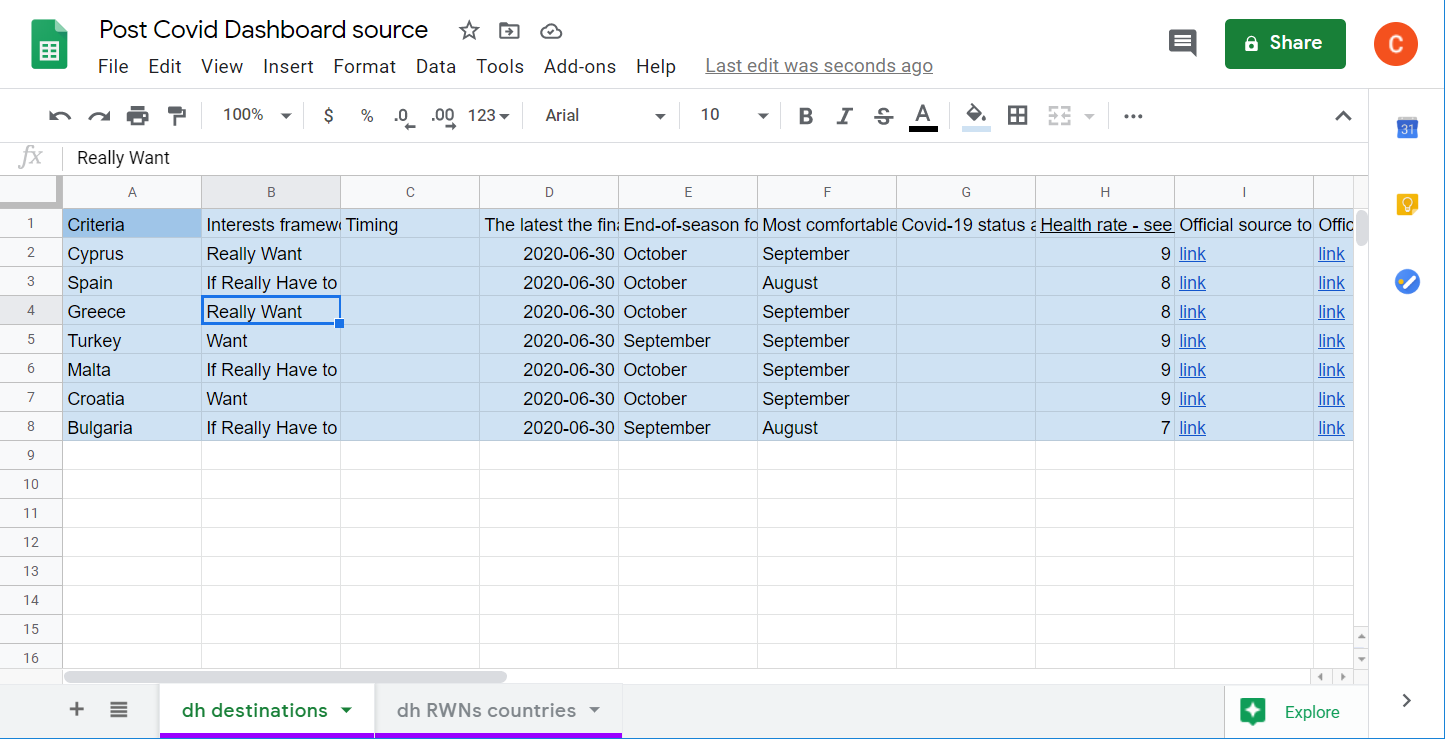
- Destinations: Seven destinations have been selected based on the Typeform questionnaire. Each is introduced, along with significant data like the Covidly Health Rate, date of air connection renewal, and more.
Here is how a Source Google Sheet for it looks:
- RWNs countries: The selection of countries the Railswarians are residing in, as well as the Covidly Health Rate, date of air connection renewal, and the link to the official information source.
Here is how a Source Google Sheet for it looks:

The dashboard has been introduced in Google Data Studio. You are welcome to check out this must-watch Data Studio Tutorial for Beginners. However, the essence of the dashboard is a data source created in Google Sheets. Read further for more directions on how to collect the data for it.
Source Google Sheets for the Destination Tracker
Destinations and RWNs countries are the tip of the iceberg. Behind these two sheets are a few more with different data. Let’s go step by step and fill in the Source Google Sheets with the data we need.
Selection of Countries
The process begins with a Typeform questionnaire, consisting of two questions:
- “Which country are you currently residing in?” (Railsware has a successful remote work culture)
- “Which destination country would you like the Railsware Summer Summit 2020 to take place in?”
Once the responses have been submitted to Typeform, we imported them into Google Sheets using Coupler.io. It’s a tool to pull data from third-party apps and data sources (Typeform, Xero, Airtable, etc.) into Google Sheets.
In the blog post Typeform to Google Sheets, there is a detailed explanation on how you can import Typeform responses into a spreadsheet. That’s what we’ve got:

After that, you can use the UNIQUE function to filter out the unique values from the imported data. Here is a sample formula:
=unique('Typeform survey results'!S2:S)
'Typeform survey results'!S2:S– the column with the countries where Railswarians reside.

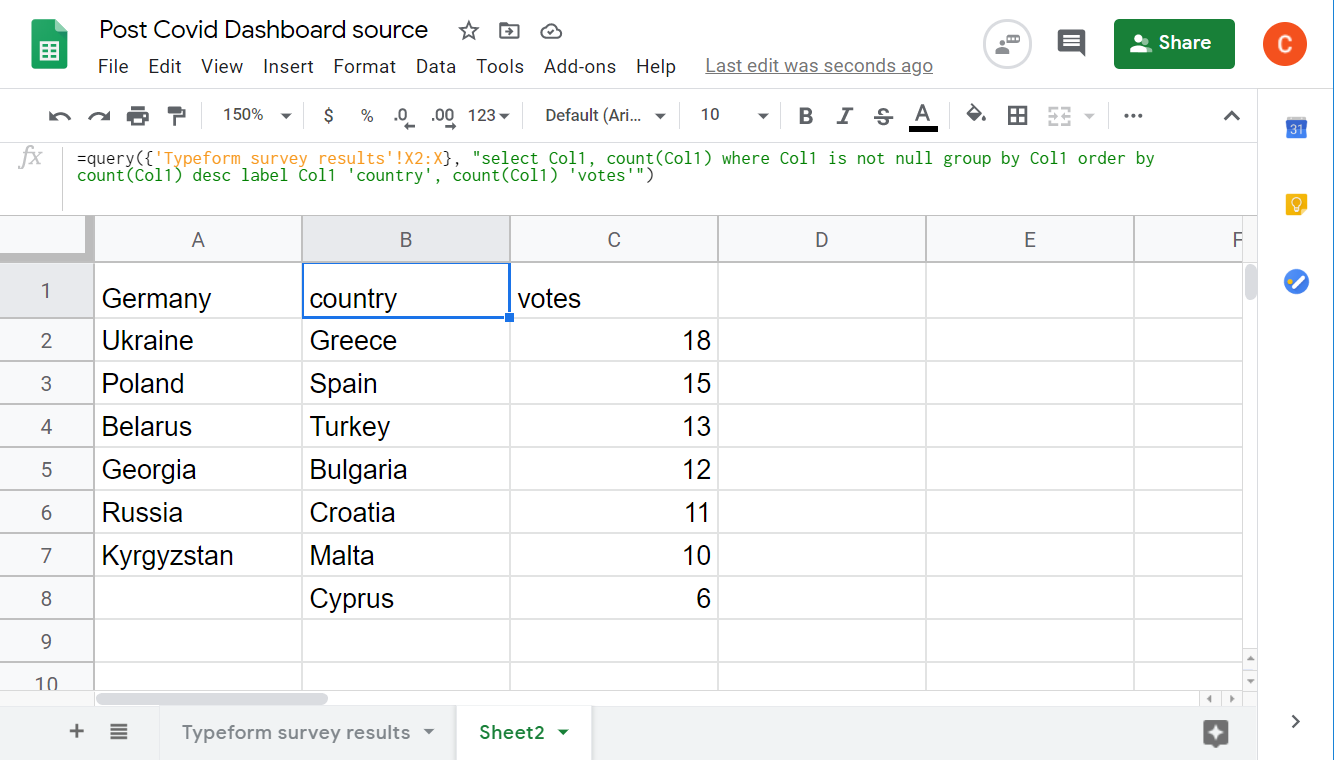
You may choose to use QUERY to filter out the unique values and sort them by popularity.
=query({'Typeform survey results'!X2:X}, "select Col1, count(Col1) where Col1 is not null group by Col1 order by count(Col1) desc label Col1 'country', count(Col1) 'votes'")
'Typeform survey results'!X2:X– the column with the destination countries for the Railsware Summer Summit 2020.
Learn more about what you can do with the QUERY function in our dedicated blog post.
Covidly Health Rate and information about air connection renewal
On covidly.com, you’ll find the actual Health Score – the metric to assess the overall health of most countries.
And here is the selection of destinations and their official sources to track status updates:
Of course, you can add more destinations and their respective sources to your custom dashboard. Re-open EU and IATA are also trustworthy sources you can benefit from.
Unfortunately, you’ll have to import all this data manually. However, if you know sources where the required data is published online in CSV, you can fetch it with the CSV importer.
Where to store all this information
Originally, the Railsware folks created a core sheet, which they set up with versatile related data. We can’t share it with you, but we can show you a snapshot:
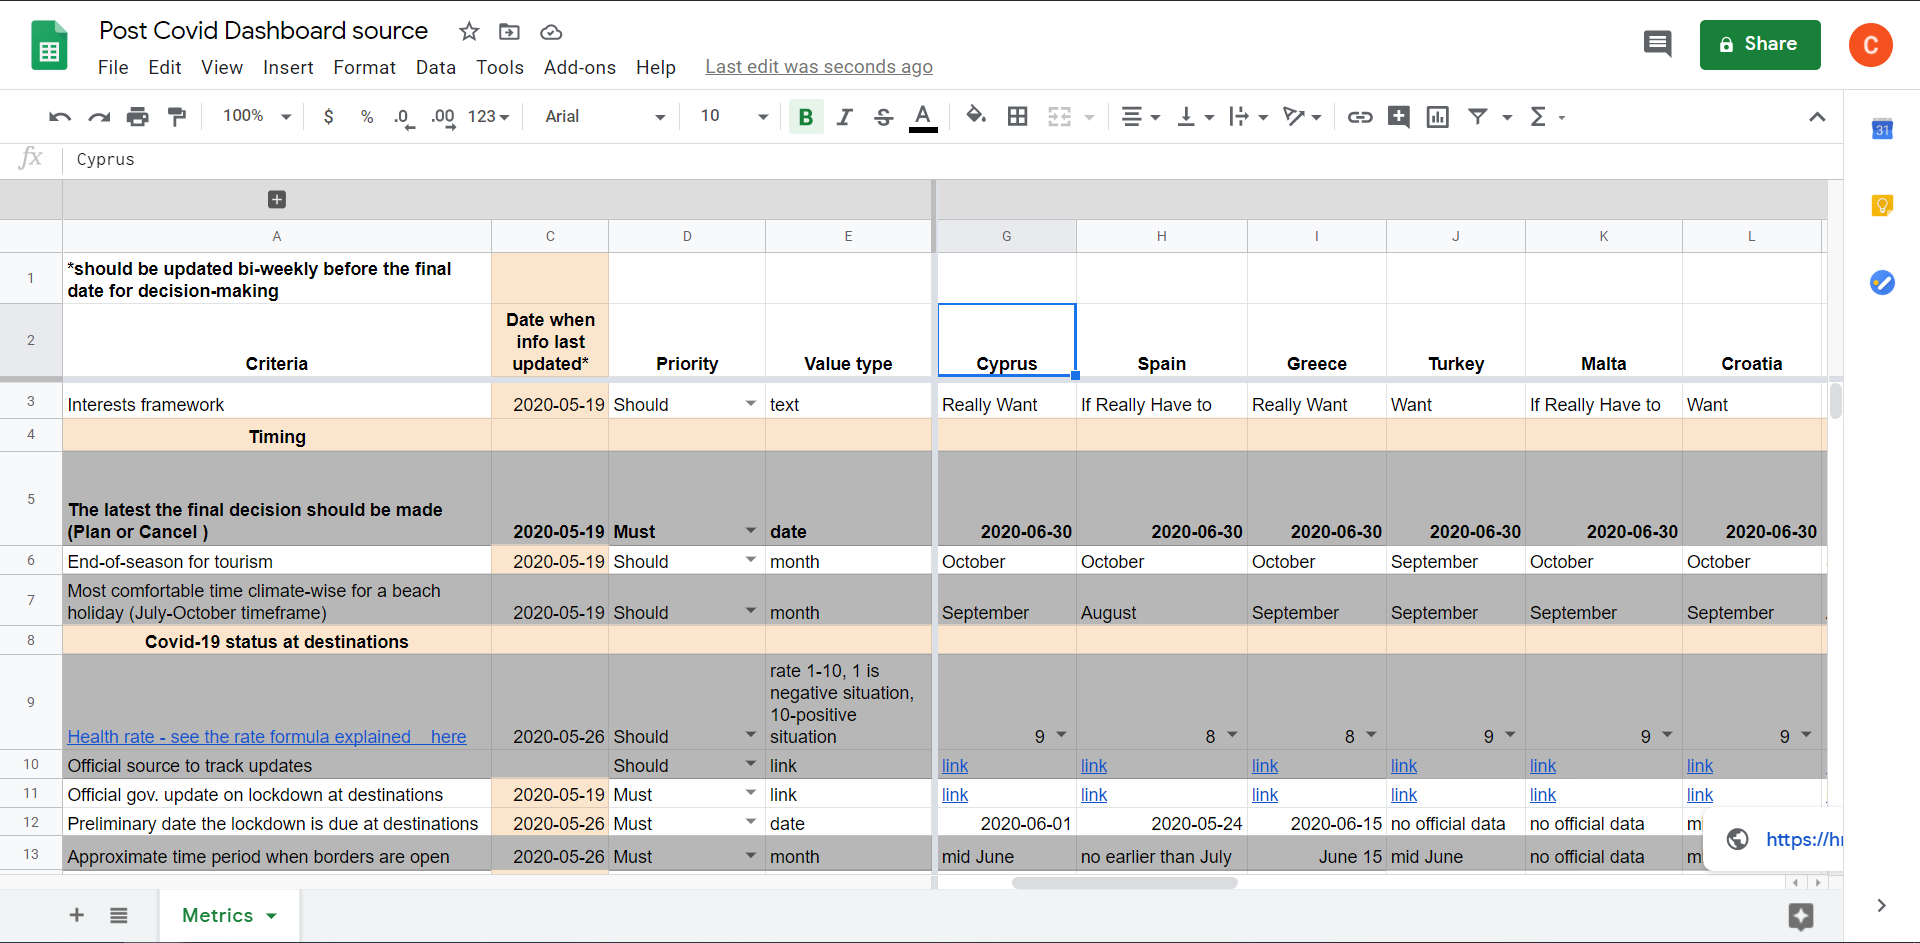
This sheet contains tons of data and not all of it is introduced on the dashboard. And what’s next?
Extract the data for the Destinations Dashboard
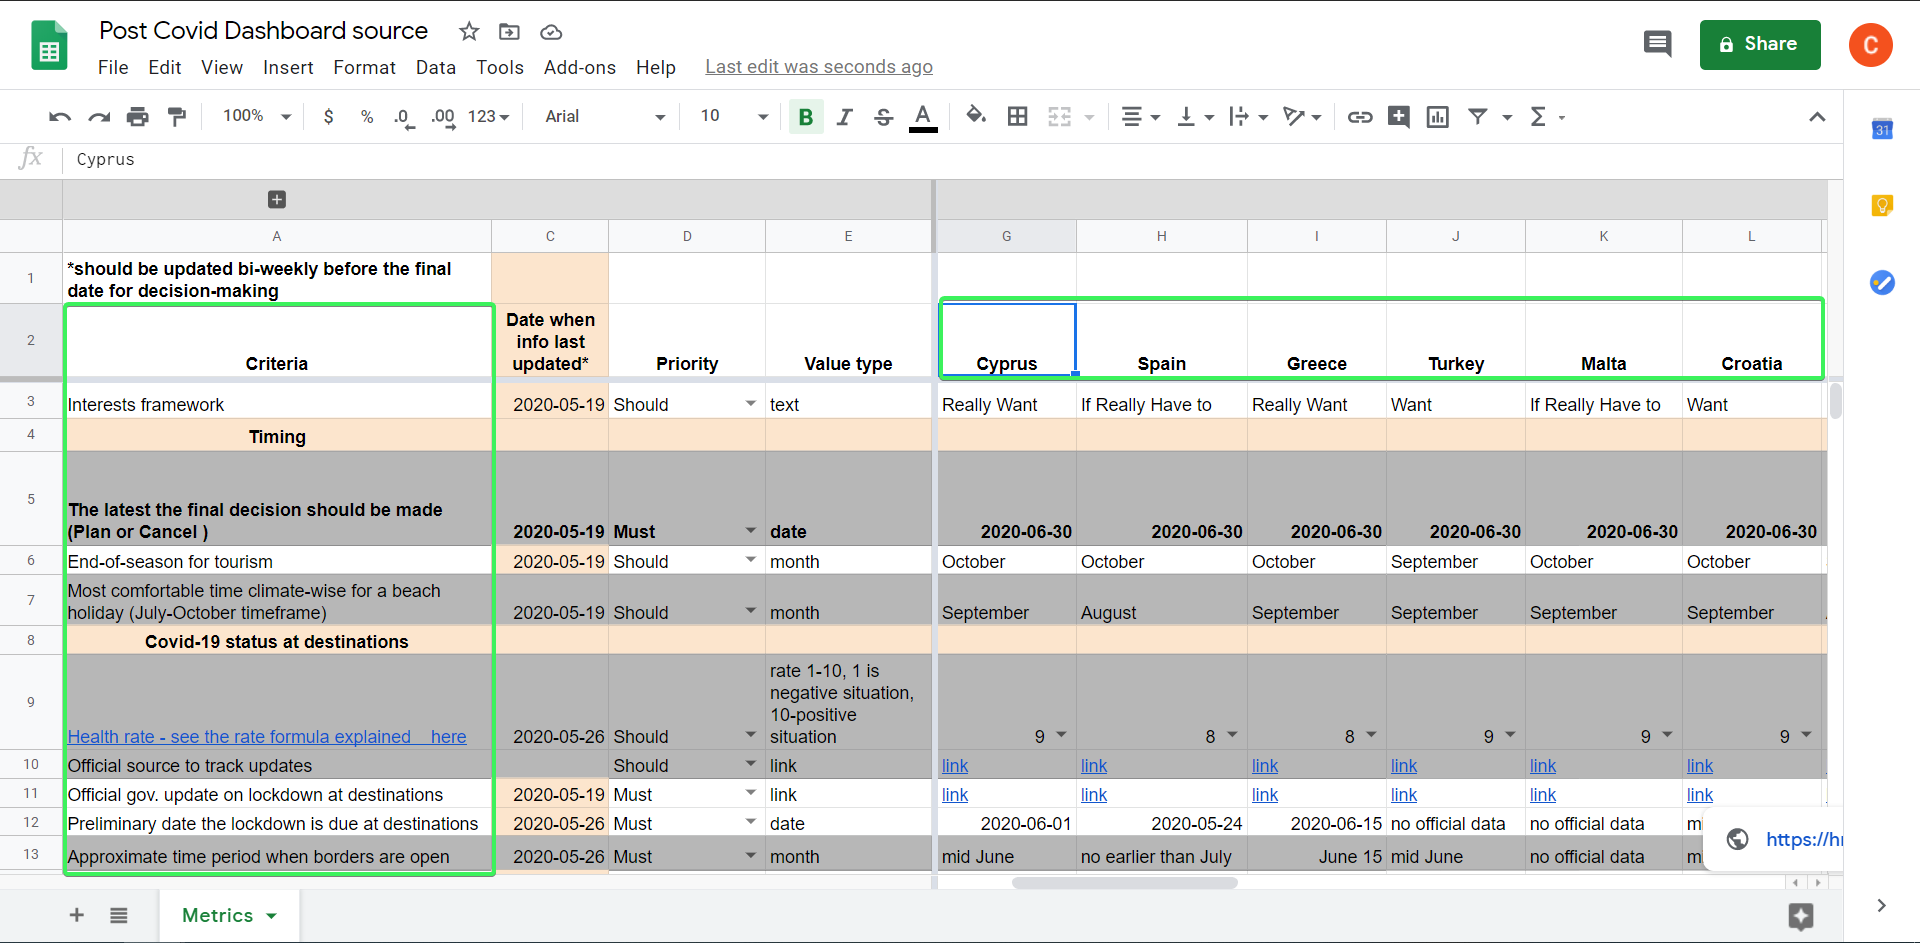
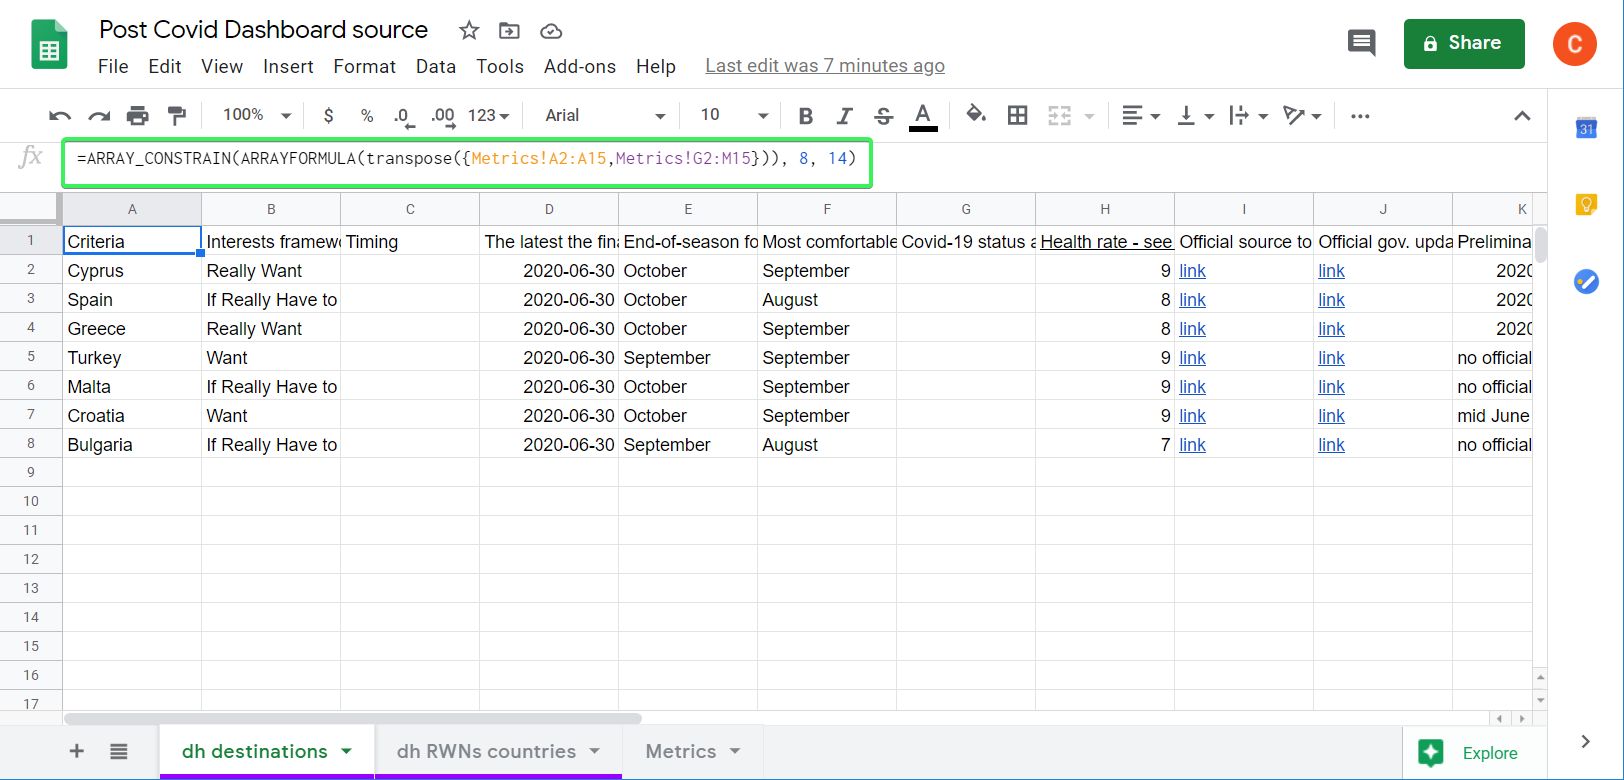
Now you need to extract the data from the core sheet and place it into two sheets (dh destinations & dh RWNs countries). You can do this manually or apply some complex formulas like this one:
=ARRAY_CONSTRAIN(ARRAYFORMULA(transpose({Metrics!A2:A15,Metrics!G2:M15})), 8, 14)
The ARRAY_CONSTRAIN function will return a subset of the input range from the core sheet (Metrics) and place it transposed with the TRANSPOSE function. So, from this:
You’ll get this:
After the sheets have been set up with the required data, you can link them to Data Studio.
Building the dashboard in Data Studio
- Run Google Data Studio.
- Click on the Blank Report.
- Choose Google Sheets as a Google Connector.
- Select a spreadsheet and a sheet with the data for the dashboard => click Add.

After that, you can modify this Table chart and add others to tailor the dashboard you want. Check out the video Data Studio – Filters and Sorting in DataTable, Scorecard, GeoMap and Charts to polish your skills.
The Dashboard = Google Sheets + Coupler.io + Data Studio
To build the Post Covid-19 Destinations Dashboard we used the following tools:
- Google Sheets to accumulate and process data.
- Typeform to question Railswarians.
- Coupler.io to import Typeform responses into Google Sheets.
- Google Data Studio to visualize data and tailor the dashboard.
We hope that you liked the outcome and, probably, would use our experience for your project. If anything is unclear or you have any questions, feel free to ask them in the comment section below. Good luck with your data!


