Ways to load data from Google Analytics
There are two approaches to Google Analytics data export: manual and automated.
To export data manually, you need to navigate to the required report in the GA4 interface and click the button to download it. It’s a nice option for instant data sharing. This way, you can export GA4 reports to Google Sheets or download them as PDF or CSV files.
To automate data export from GA4, you can use the following options:
- BigQuery Links aka BigQuery export. This is a built-in option to stream all of your raw events from Google Analytics 4 properties to BigQuery. The method is suited for backup and advanced analytics since you can query the data using SQL syntax.
- Coupler.io. This is a data integration platform that lets you turn raw data into insightful reports. With Coupler.io, you can automate GA4 data exports to:
- Spreadsheet apps, including Google Sheets and Microsoft Excel
- Data warehouse,s including BigQuery, Redshift, and PostgreSQL
- BI tool,s including Looker Studio, Power BI, Tableau, and Qlik
- AI tools via the Google Analytics MCP for conversational data analysis
In addition to data export automation, Coupler.io provides a number of free ready-to-use GA4 dashboard templates.
How to automate data export from Google Analytics with Coupler.io
To automate exports of GA4 data, select the needed destination in the form below and click Proceed. You’ll be offered to create a Coupler.io account for free.
After that, you only need to complete 3 simple steps:
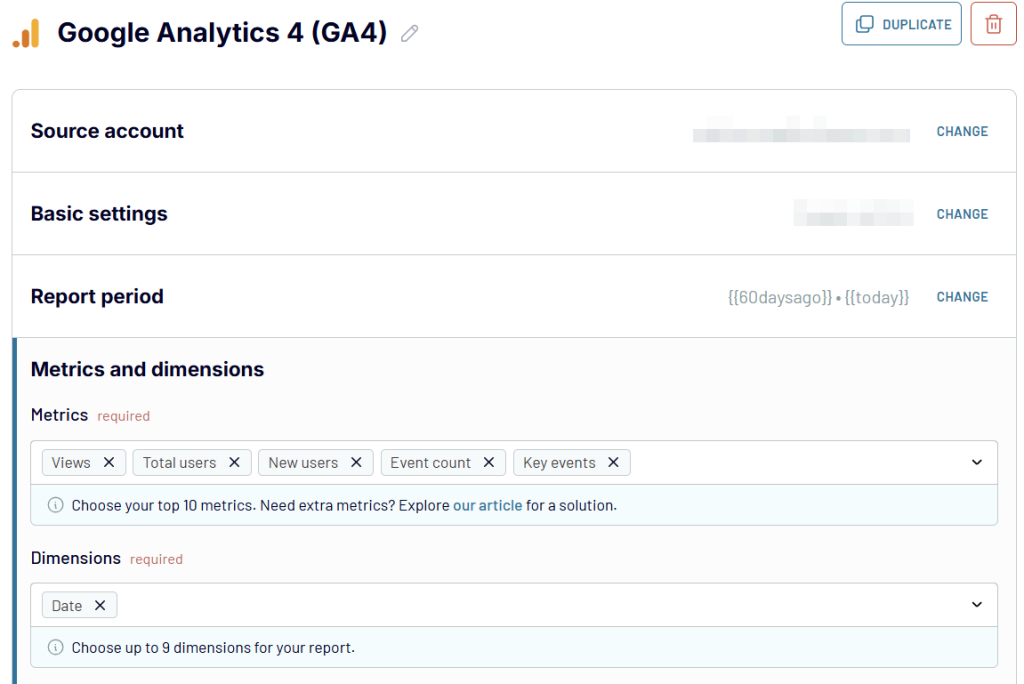
1. Collect data
- Connect your Google account, and select the properties available in your account. You can choose multiple properties to export data.
- Then specify the report period: start and end dates.
- The last thing to do is to choose up to 10 metrics and up to 9 dimensions for your report.
Before moving to the next step, you can add a few more sources. These could be advertising platforms like LinkedIn Ads or Facebook Ads, CRM tools like Pipedrive or HubSpot, and more. You can join data from the connected sources to create multi- or cross-channel reports.
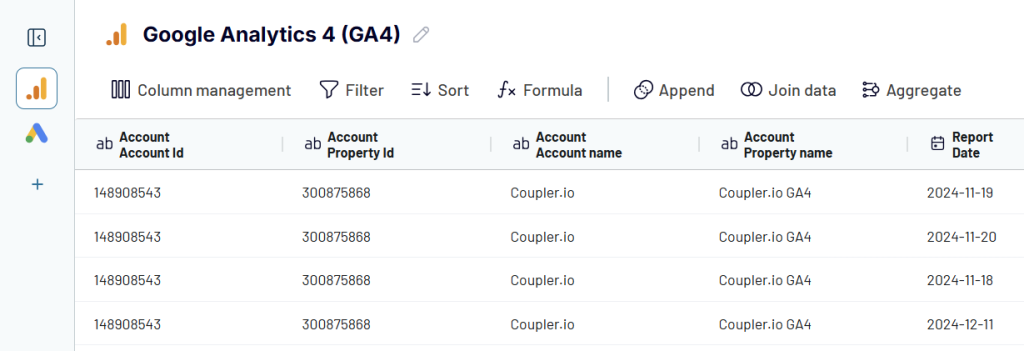
2. Transform data
- Preview and transform your data before exporting it to the selected destination. Coupler.io allows you to:
- Manage columns including edit, hide, reorder, etc.
- Filter and sort data
- Add new columns using calculation formulas
- Aggregate data in specific columns by performing operations like sum, average, count, and others.
- Combine data if you’ve connected multiple GA4 accounts, different applications and sources.
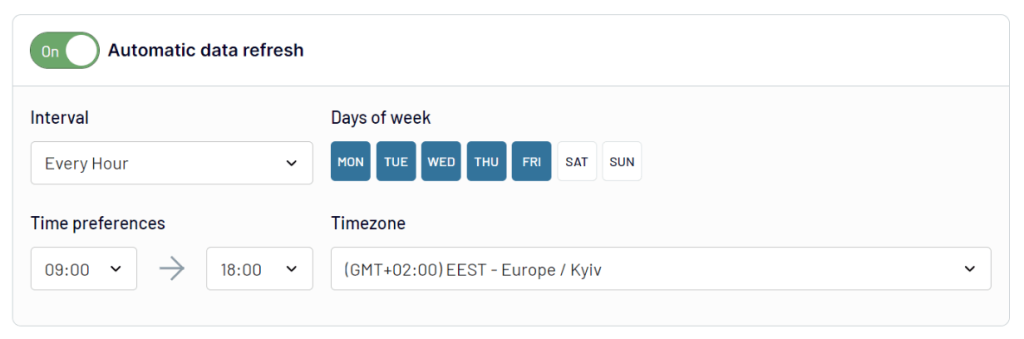
3. Load data and schedule refresh
- The final step is to configure your destination and specify where to load data.
- For spreadsheets (Google Sheets or Excel) – connect the app account and select a spreadsheet and a sheet.
- For data warehouses (BigQuery, Redshift, PostgreSQL) – connect the project/database and specify/create a dataset and table.
- For BI tools (Looker Studio, Power BI, Tableau) the process is different since you’re creating a data source there. Follow the in-app instructions to complete this step.
- For AI tools – follow the in-app instructions to connect GA to ChatGPT, Claude, Gemini, and other LLMs or AI agents.
Note: If you’ve combined GA4 data with information from other sources, you’ll also need to choose whether you want to load the joined data or data from a separate source.
To finalize your Google Analytics 4 integration, enable Automatic data refresh and set a schedule to automate exports of Google Analytics data.
Coupler.io not only lets you export GA4 data but also provides ready-to-use dashboard templates.
Custom GA4 dashboard templates for instant reporting
GA4 report templates by Coupler.io allow you to derive insights into your Google Analytics data without the need to build a dashboard from scratch. They are available in Google Sheets, Looker Studio, Power BI, and Tableau and are equipped with the built-in Google Analytics connector by Coupler.io. You can share them with stakeholders so that they always have access to the most recent data from Google Analytics.
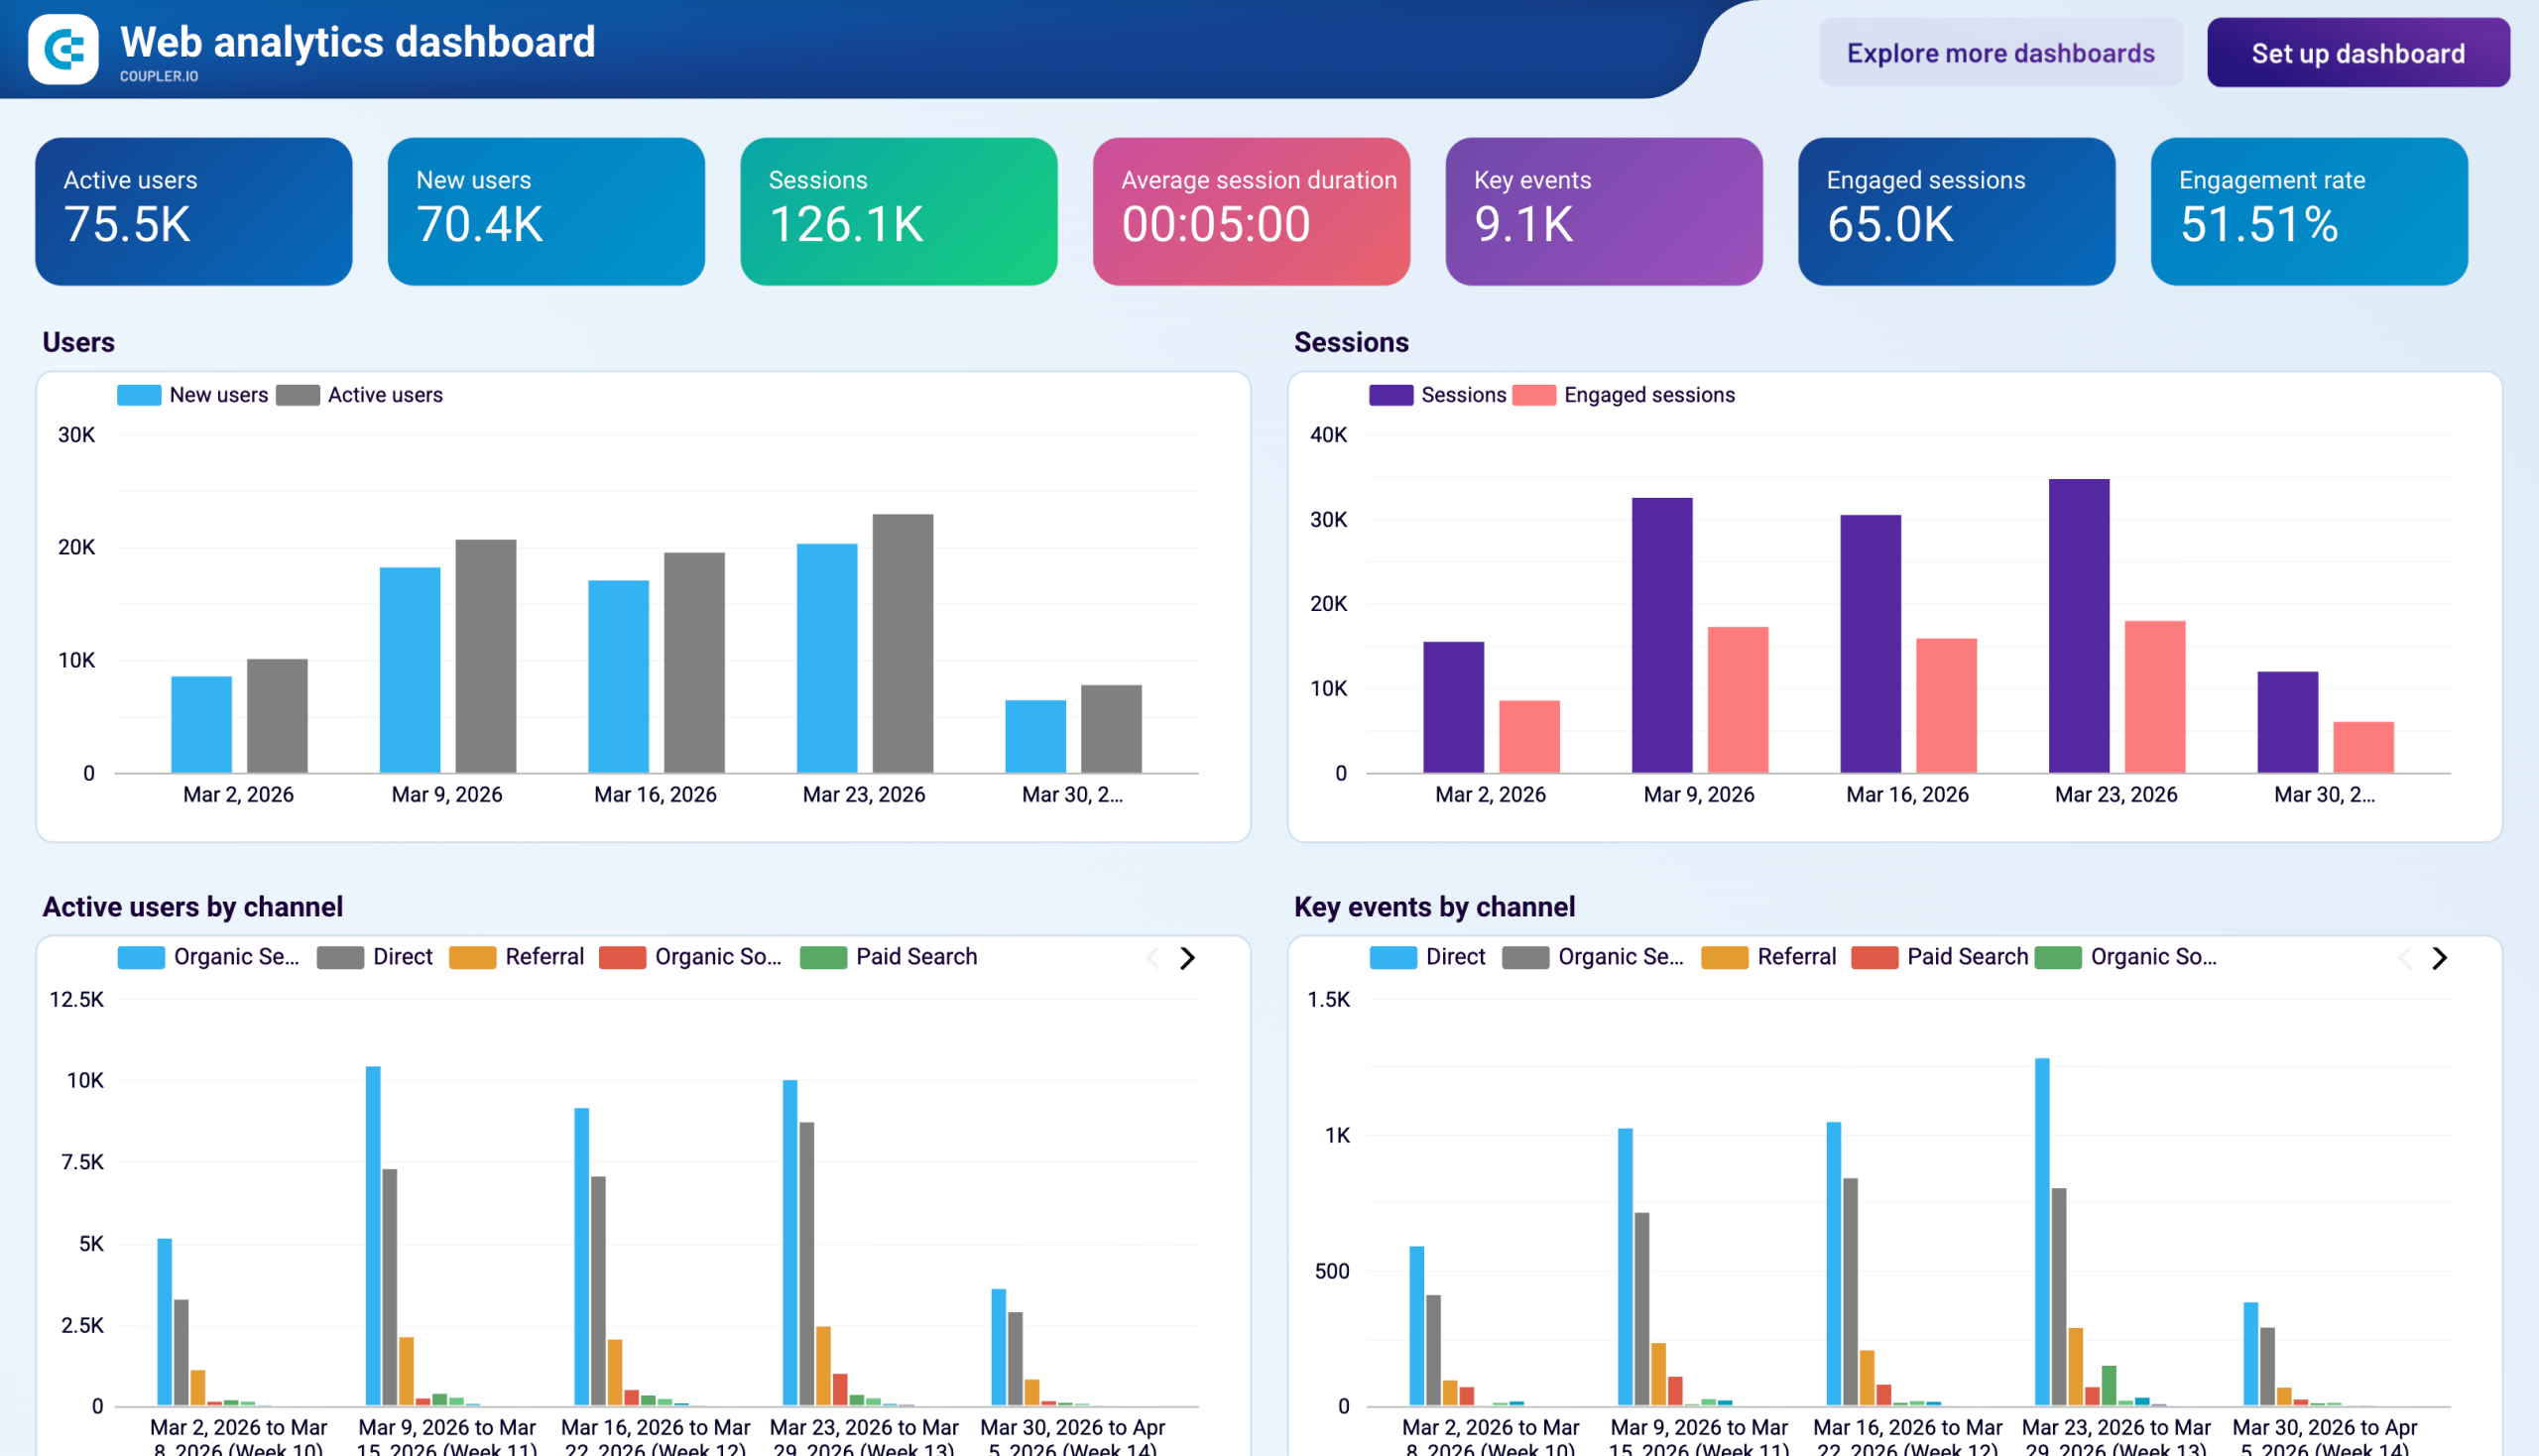
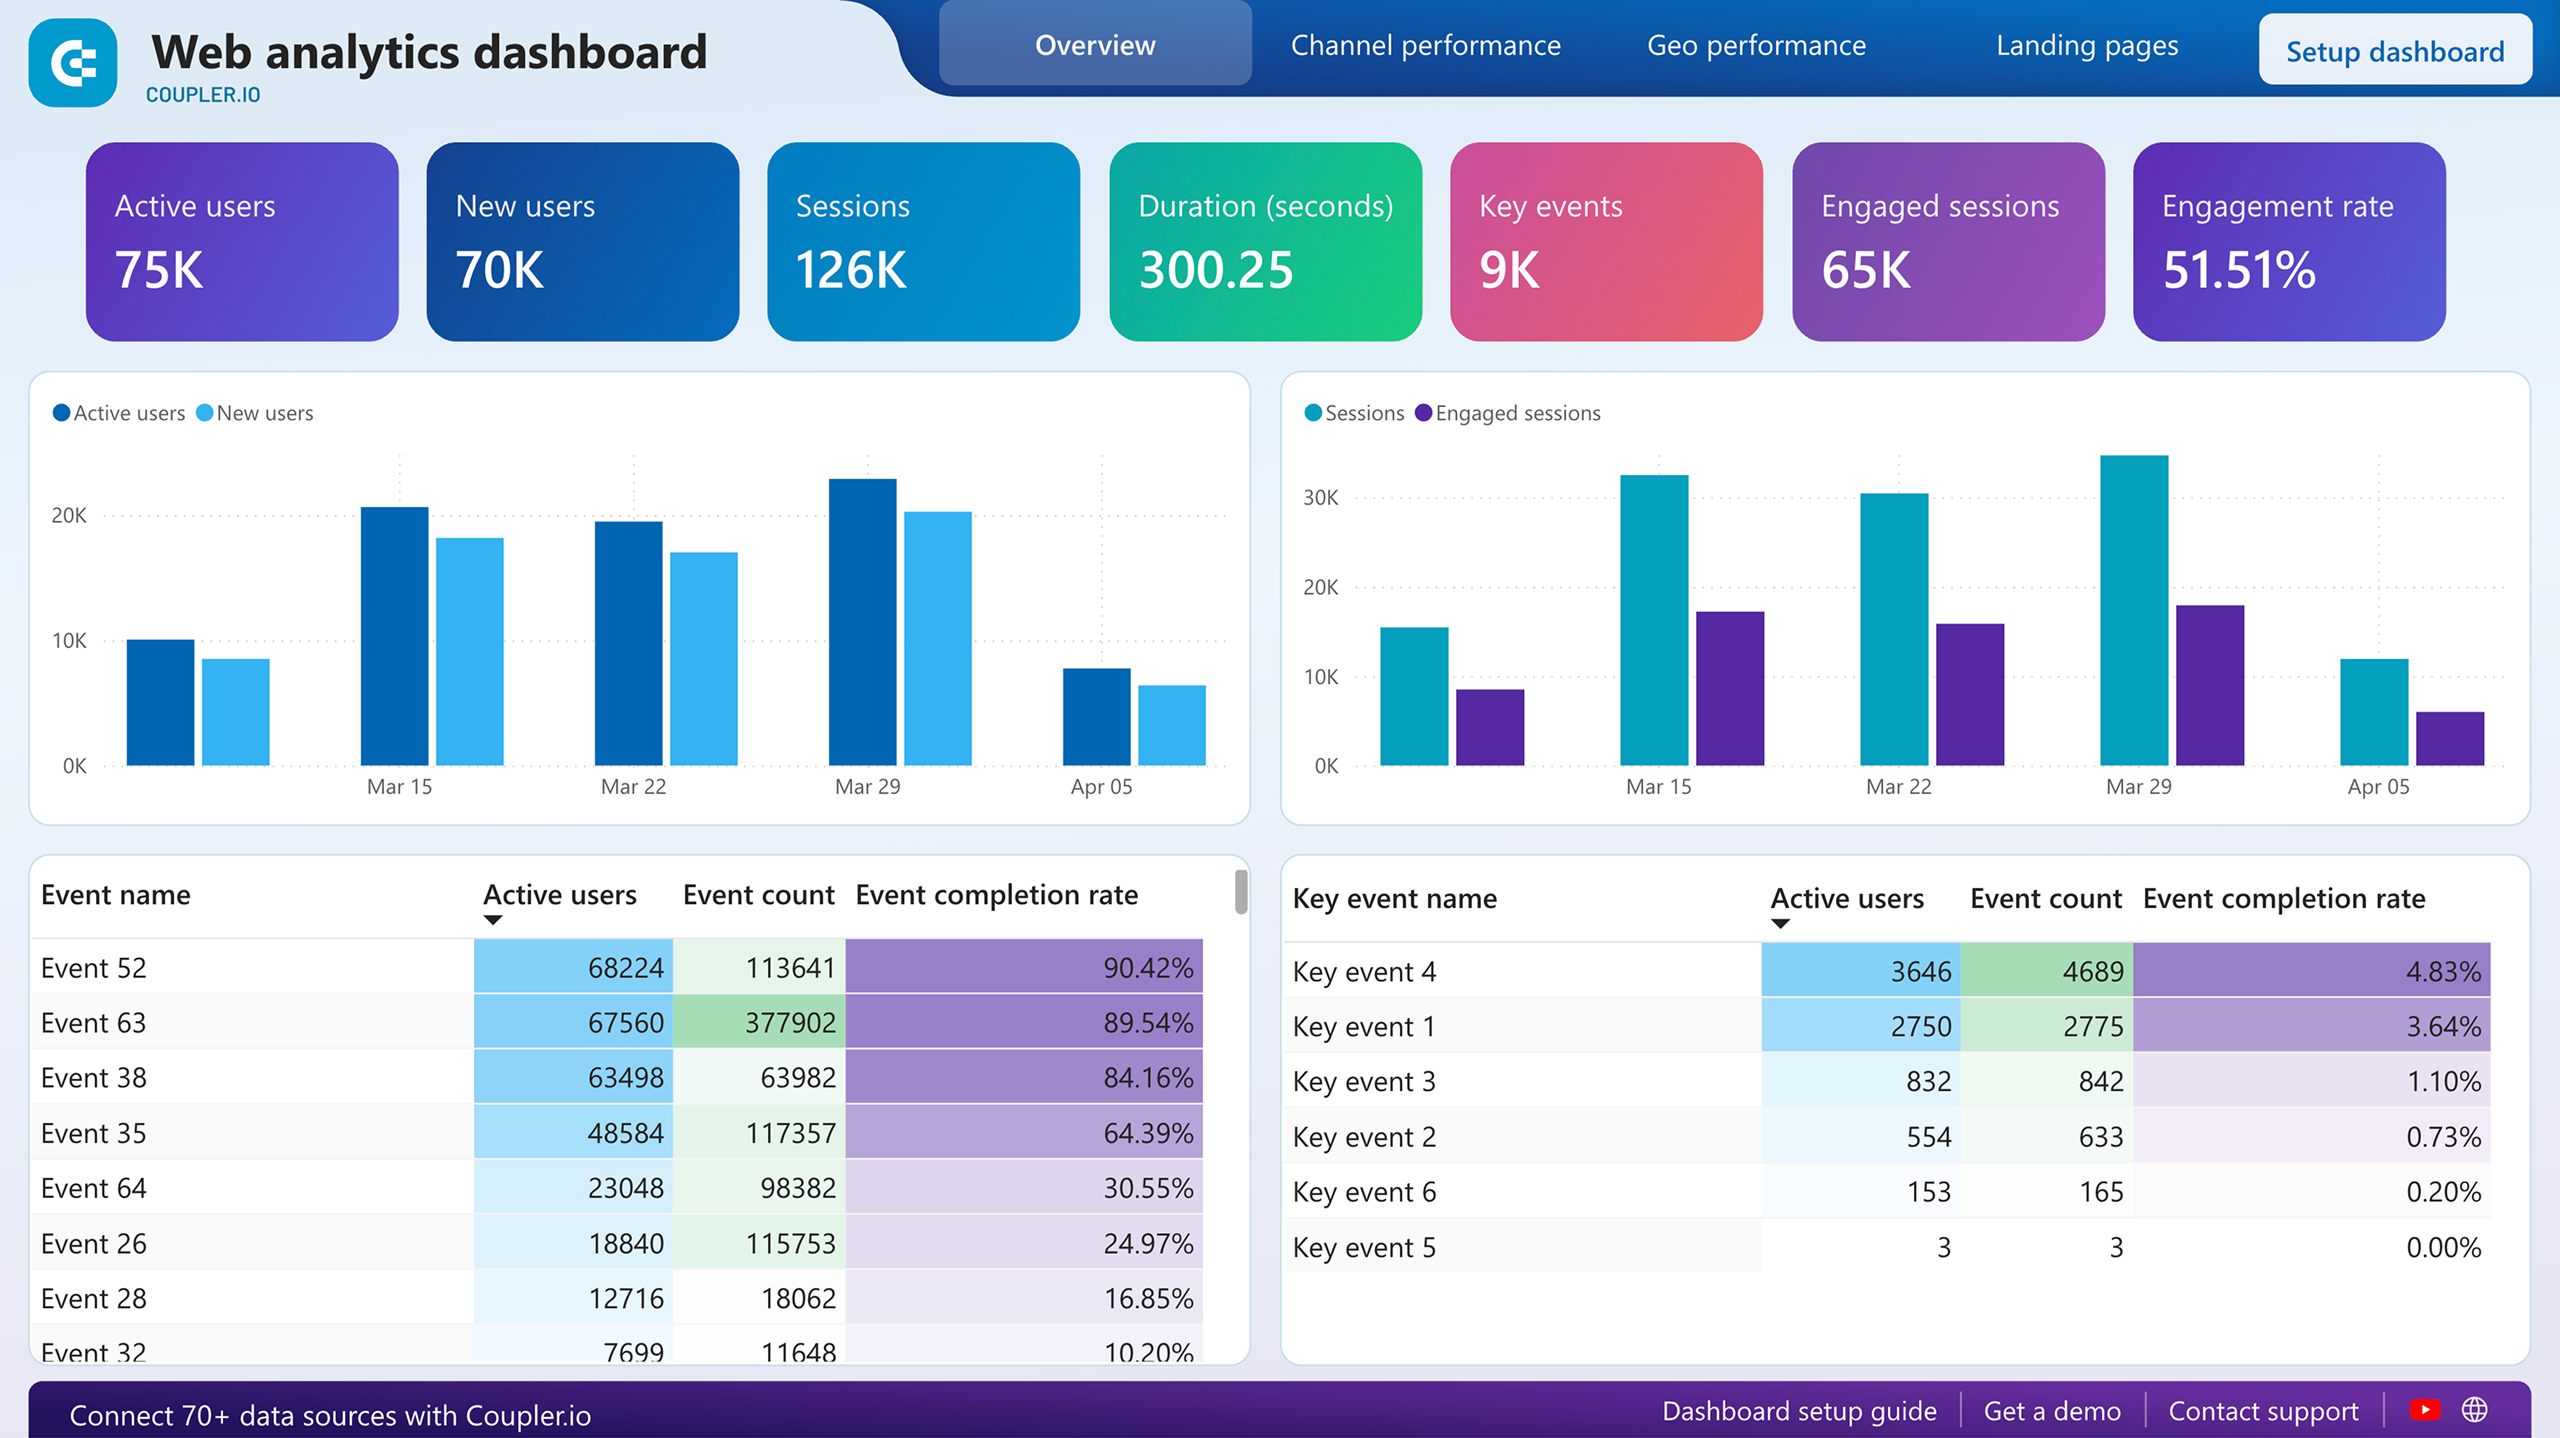
Web analytics dashboard template
This Google Analytics 4 dashboard gives you a clear view of your website’s traffic, engagement, and user activity. It pulls GA4 data into a single-page layout where you can track how visitors find your site, how they behave once they arrive, and whether they complete the events that matter to your business.
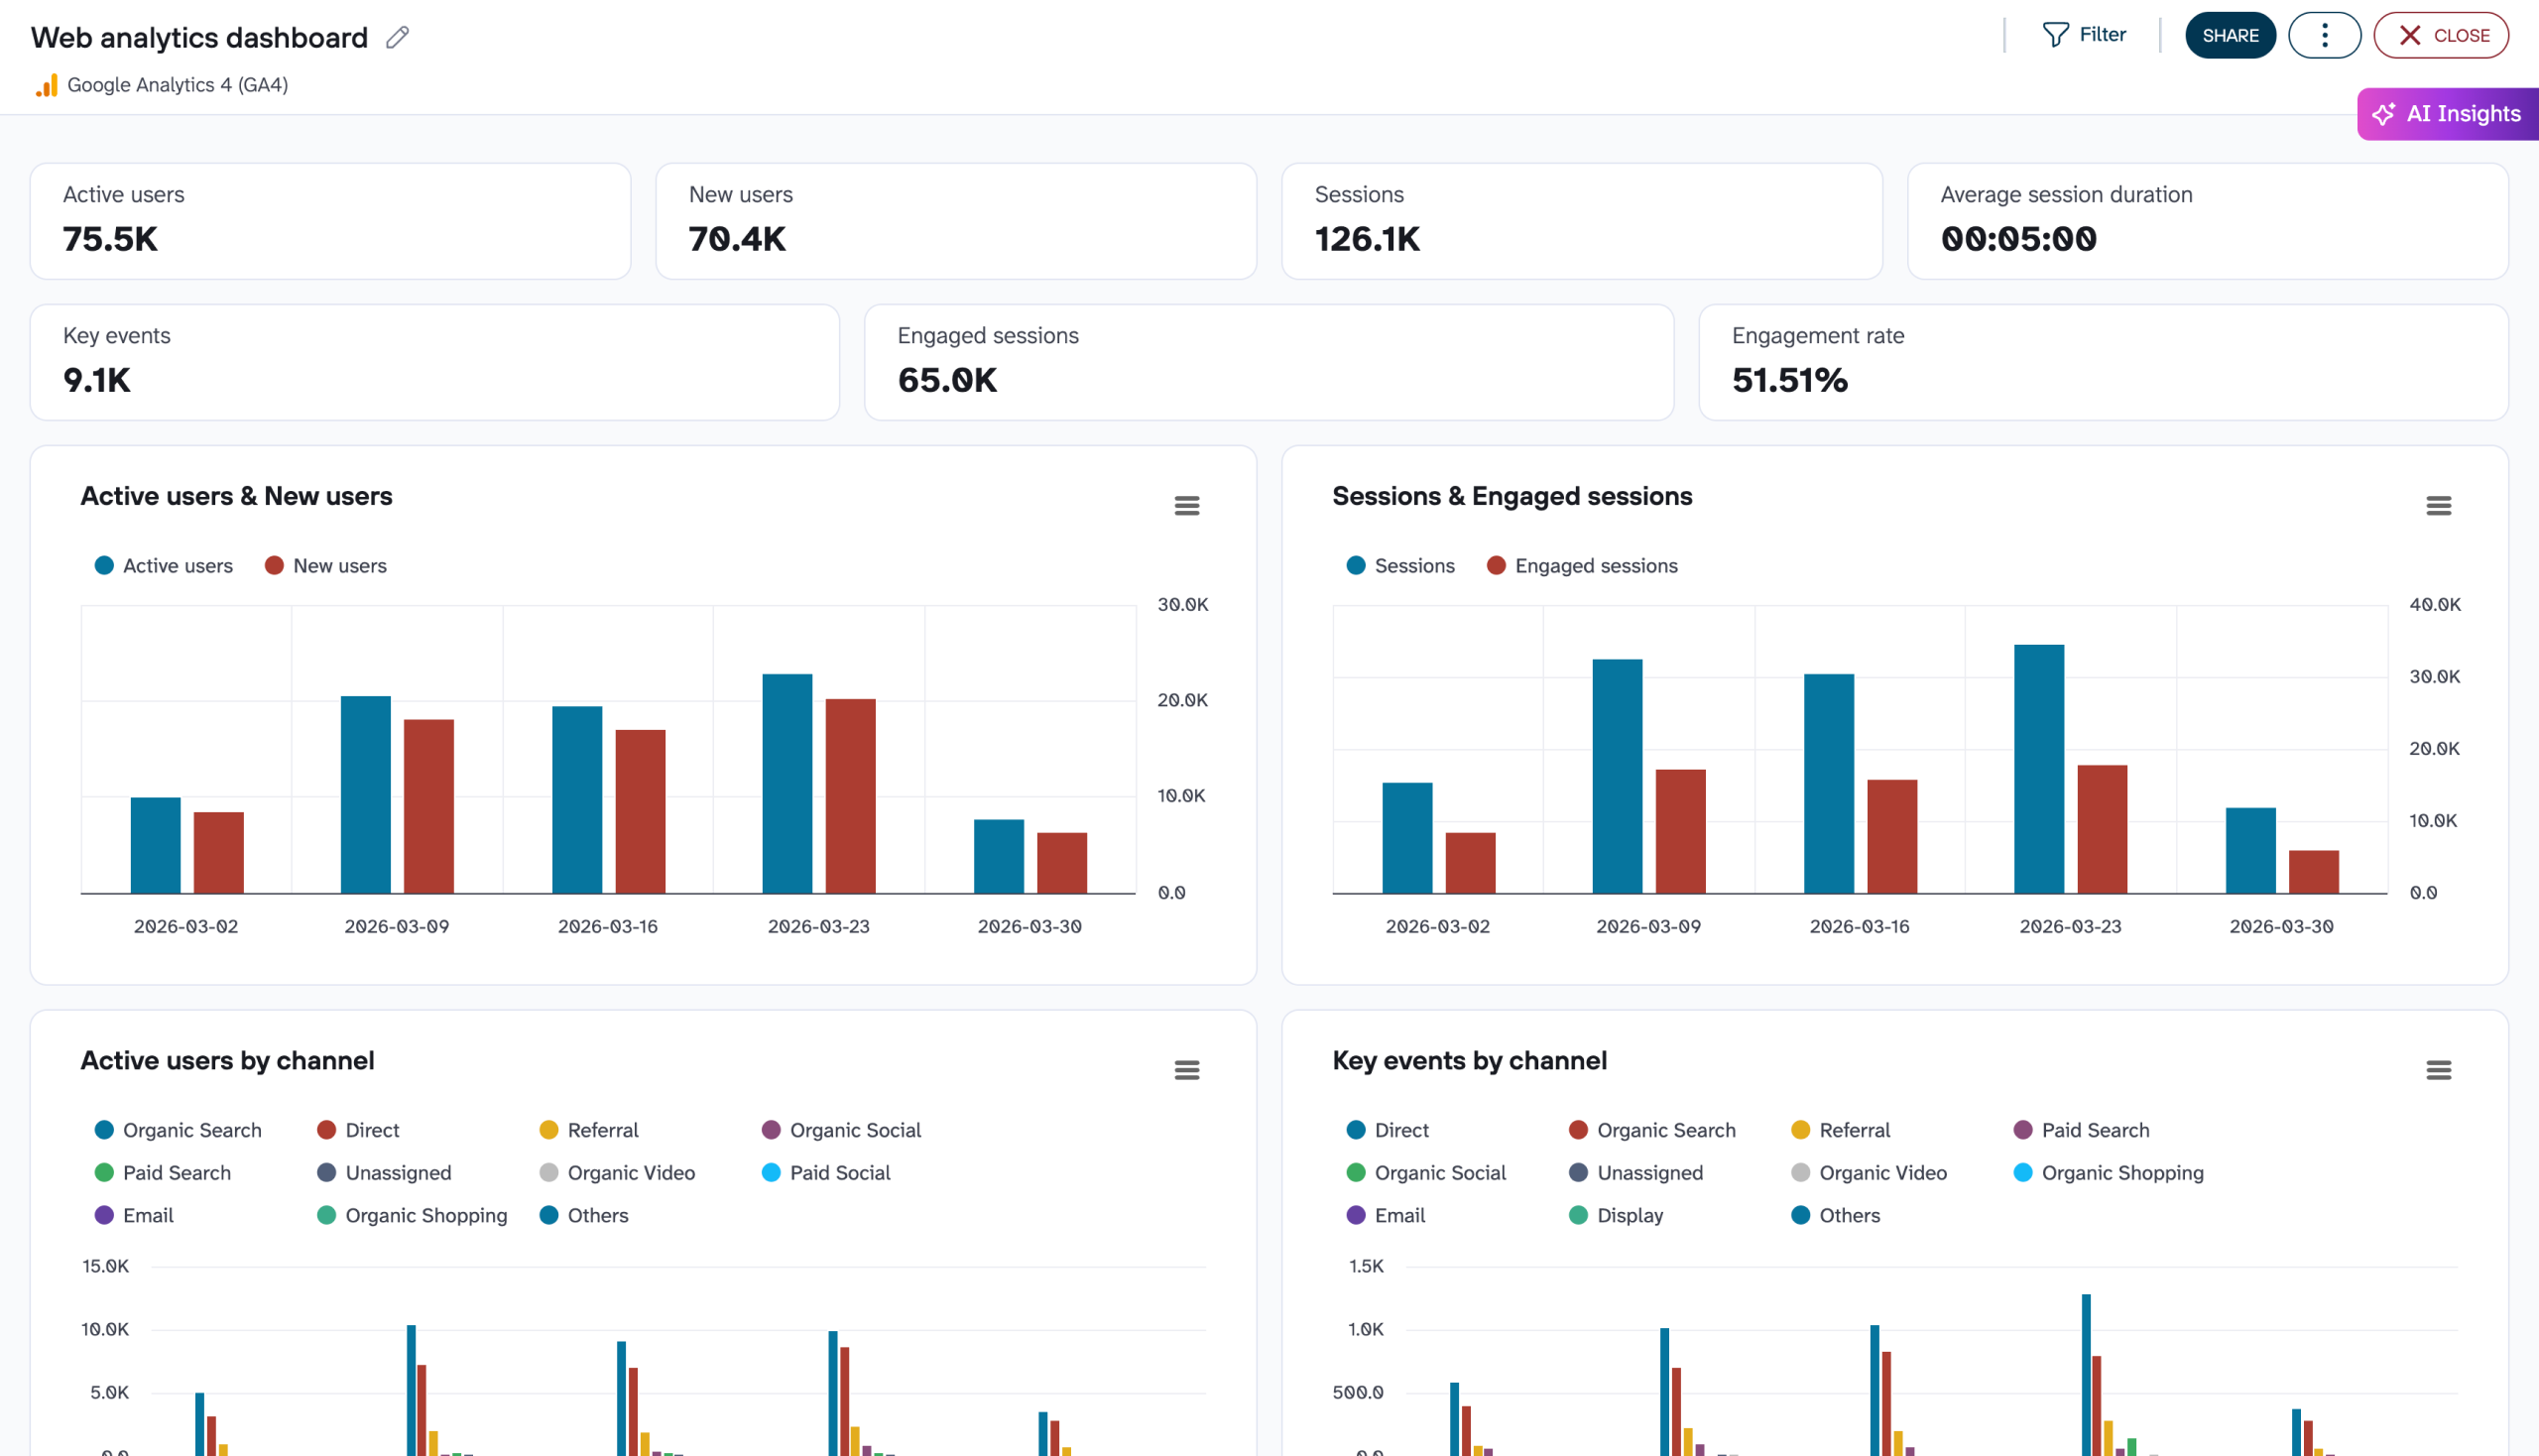
With the web analytics dashboard by Coupler.io, you can compare acquisition channels on both volume and engagement quality, monitor key event completion rates, identify your strongest geographic markets, and evaluate which landing pages hold visitors’ attention. This helps you focus marketing spend on the channels and content that actually drive results.
The dashboard template is available in Coupler.io, Google Sheets, Looker Studio, Power BI, and Tableau. Choose the version that fits your reporting needs and try it right away for free!


Google Analytics dashboard for multiple properties
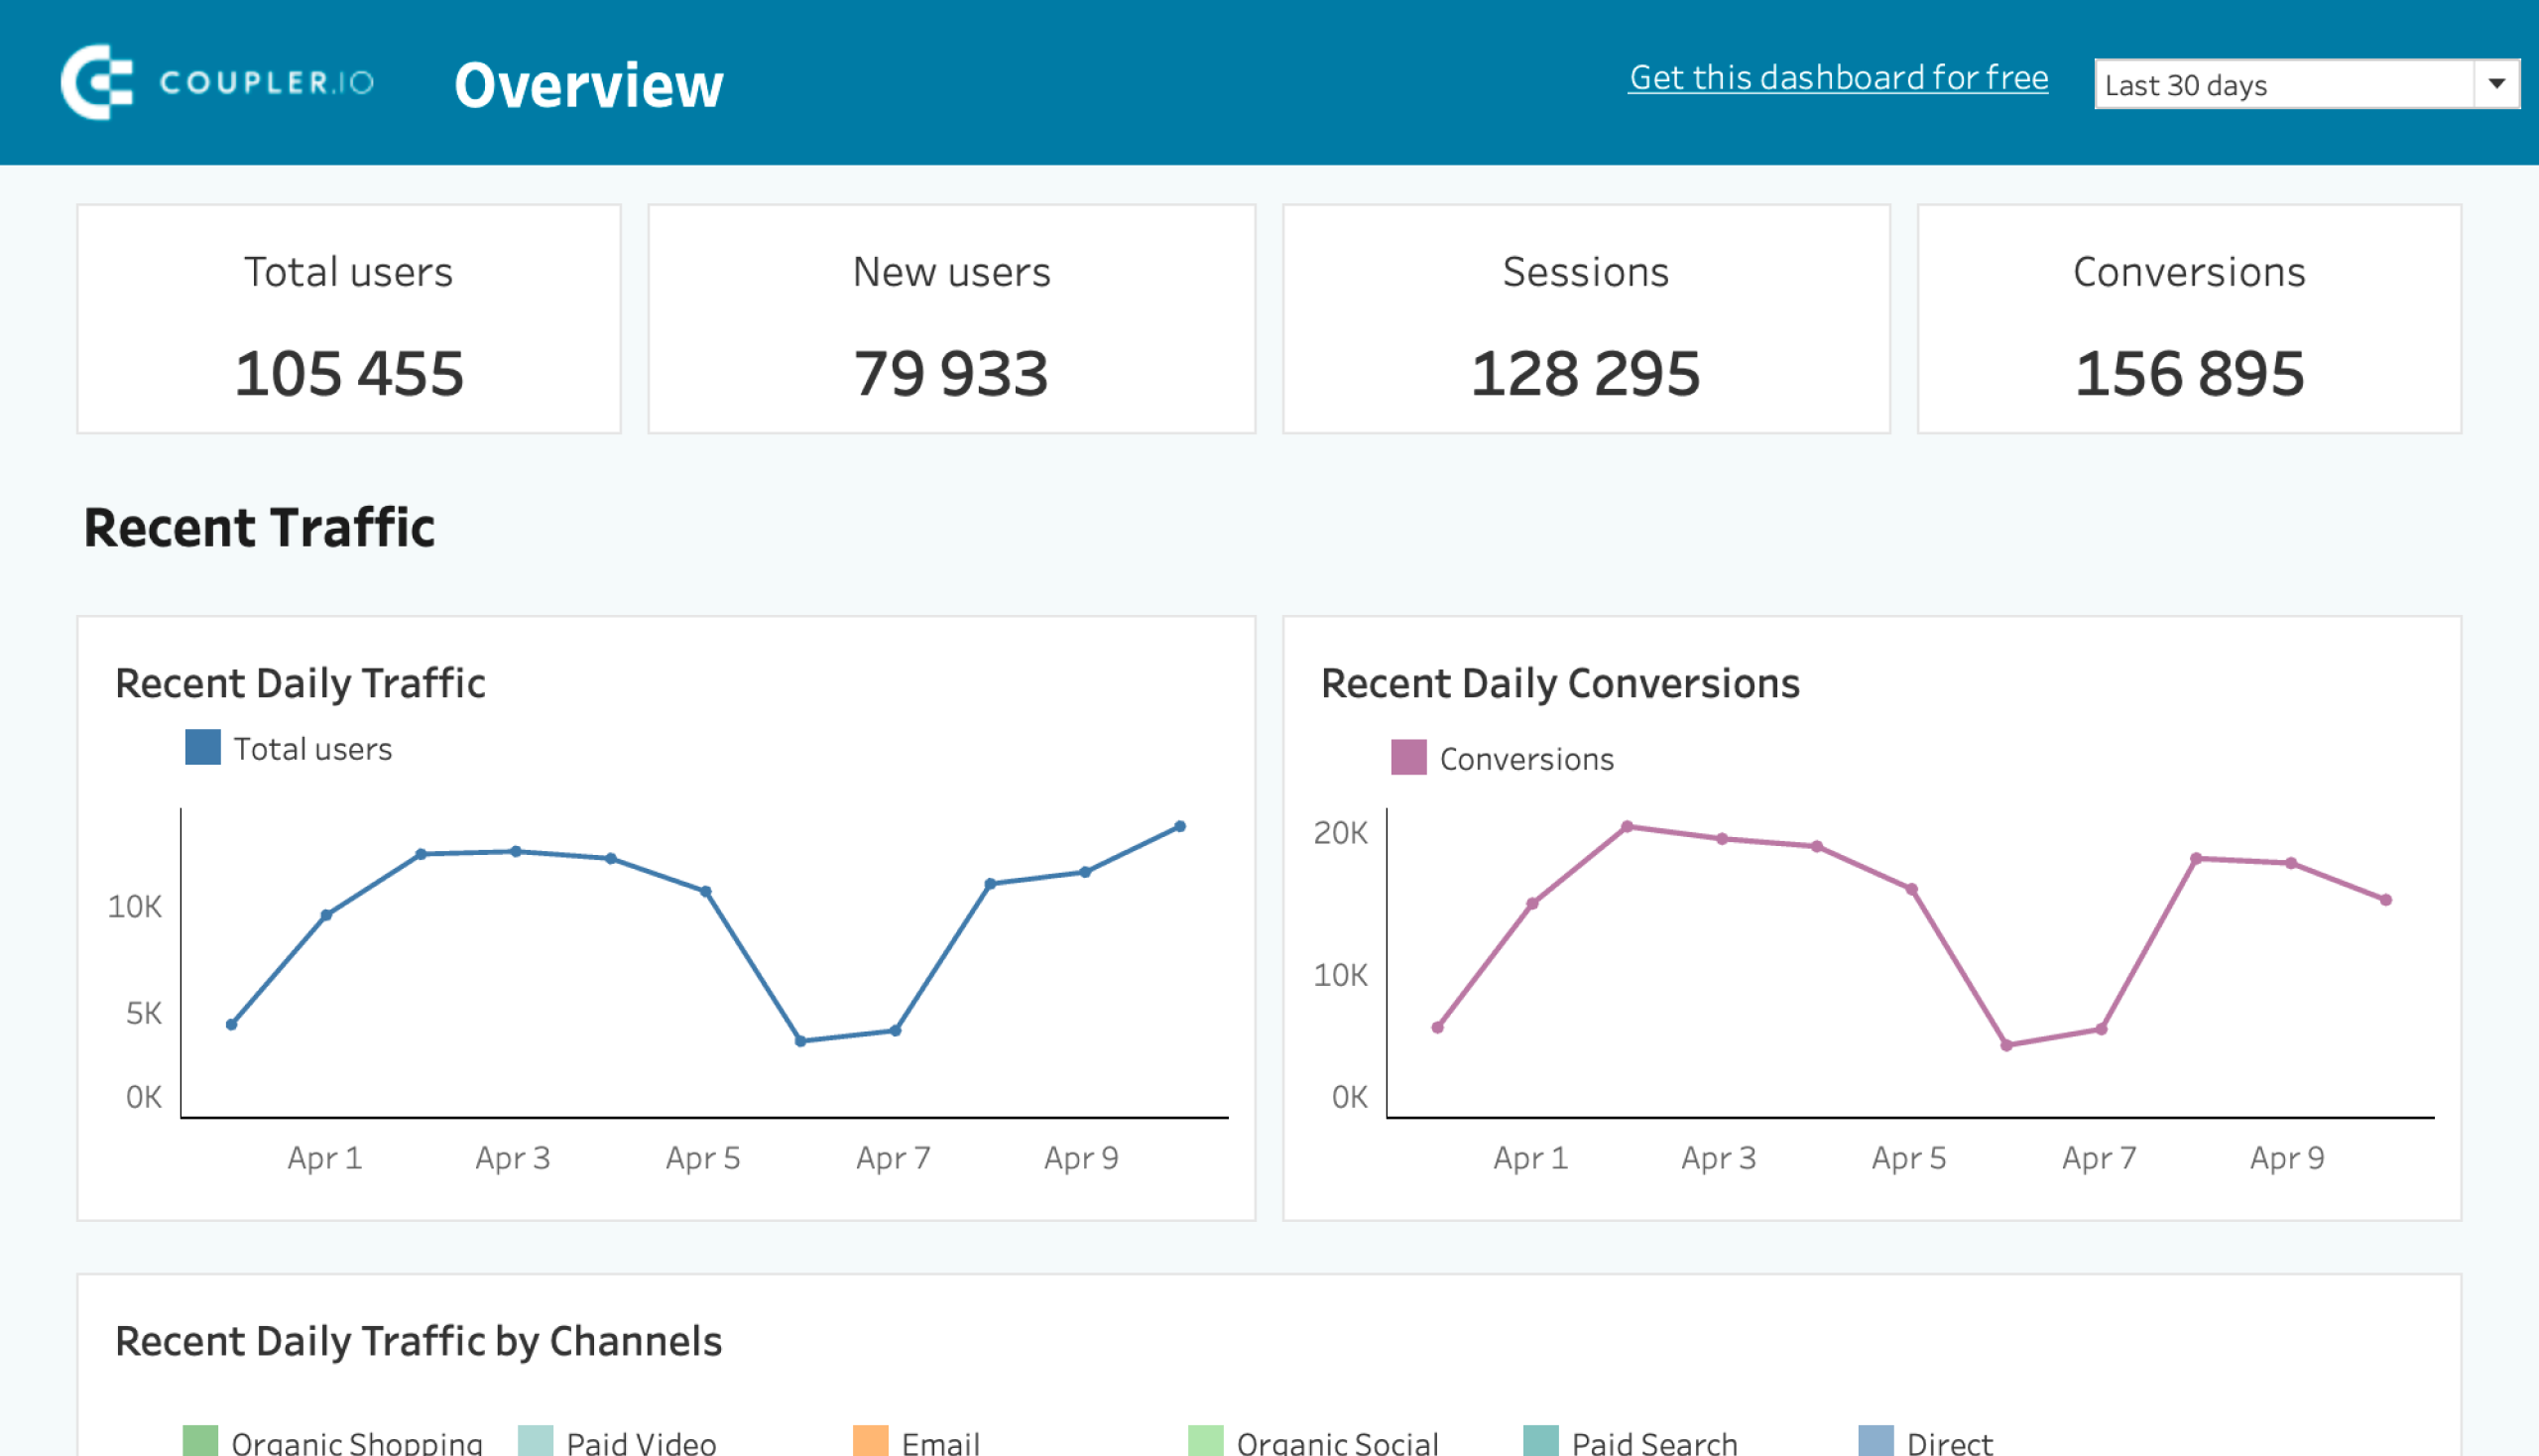
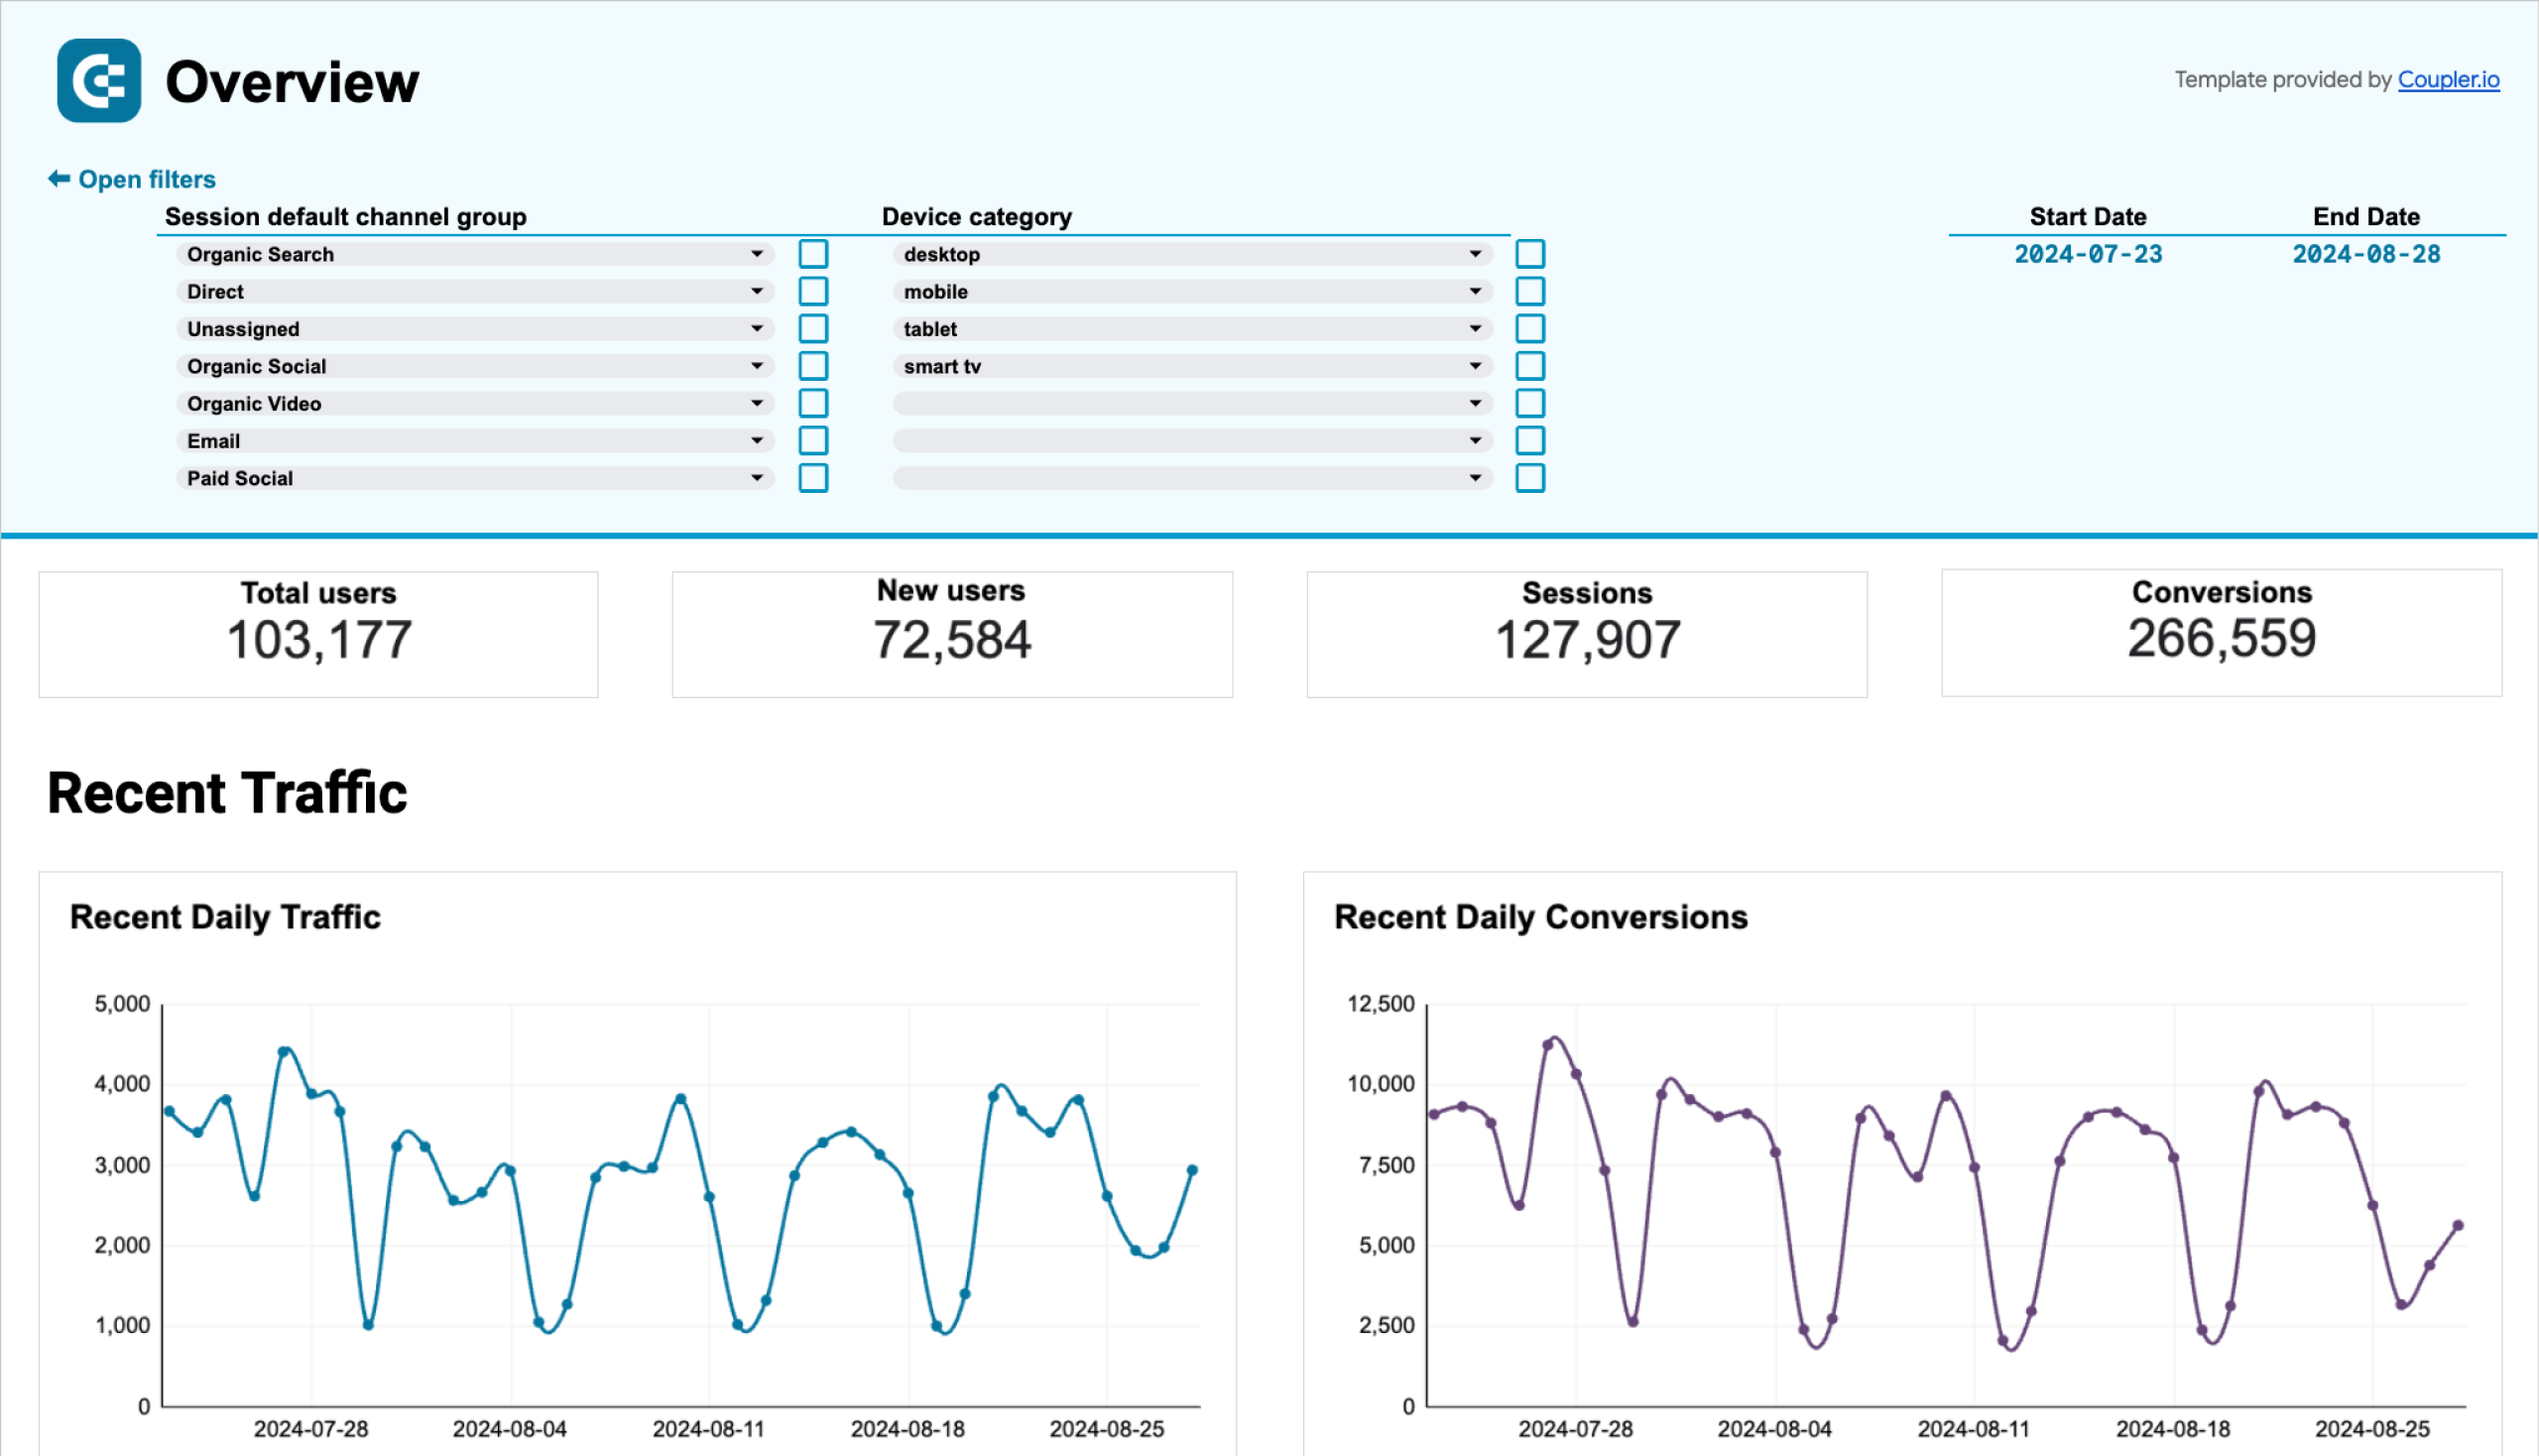
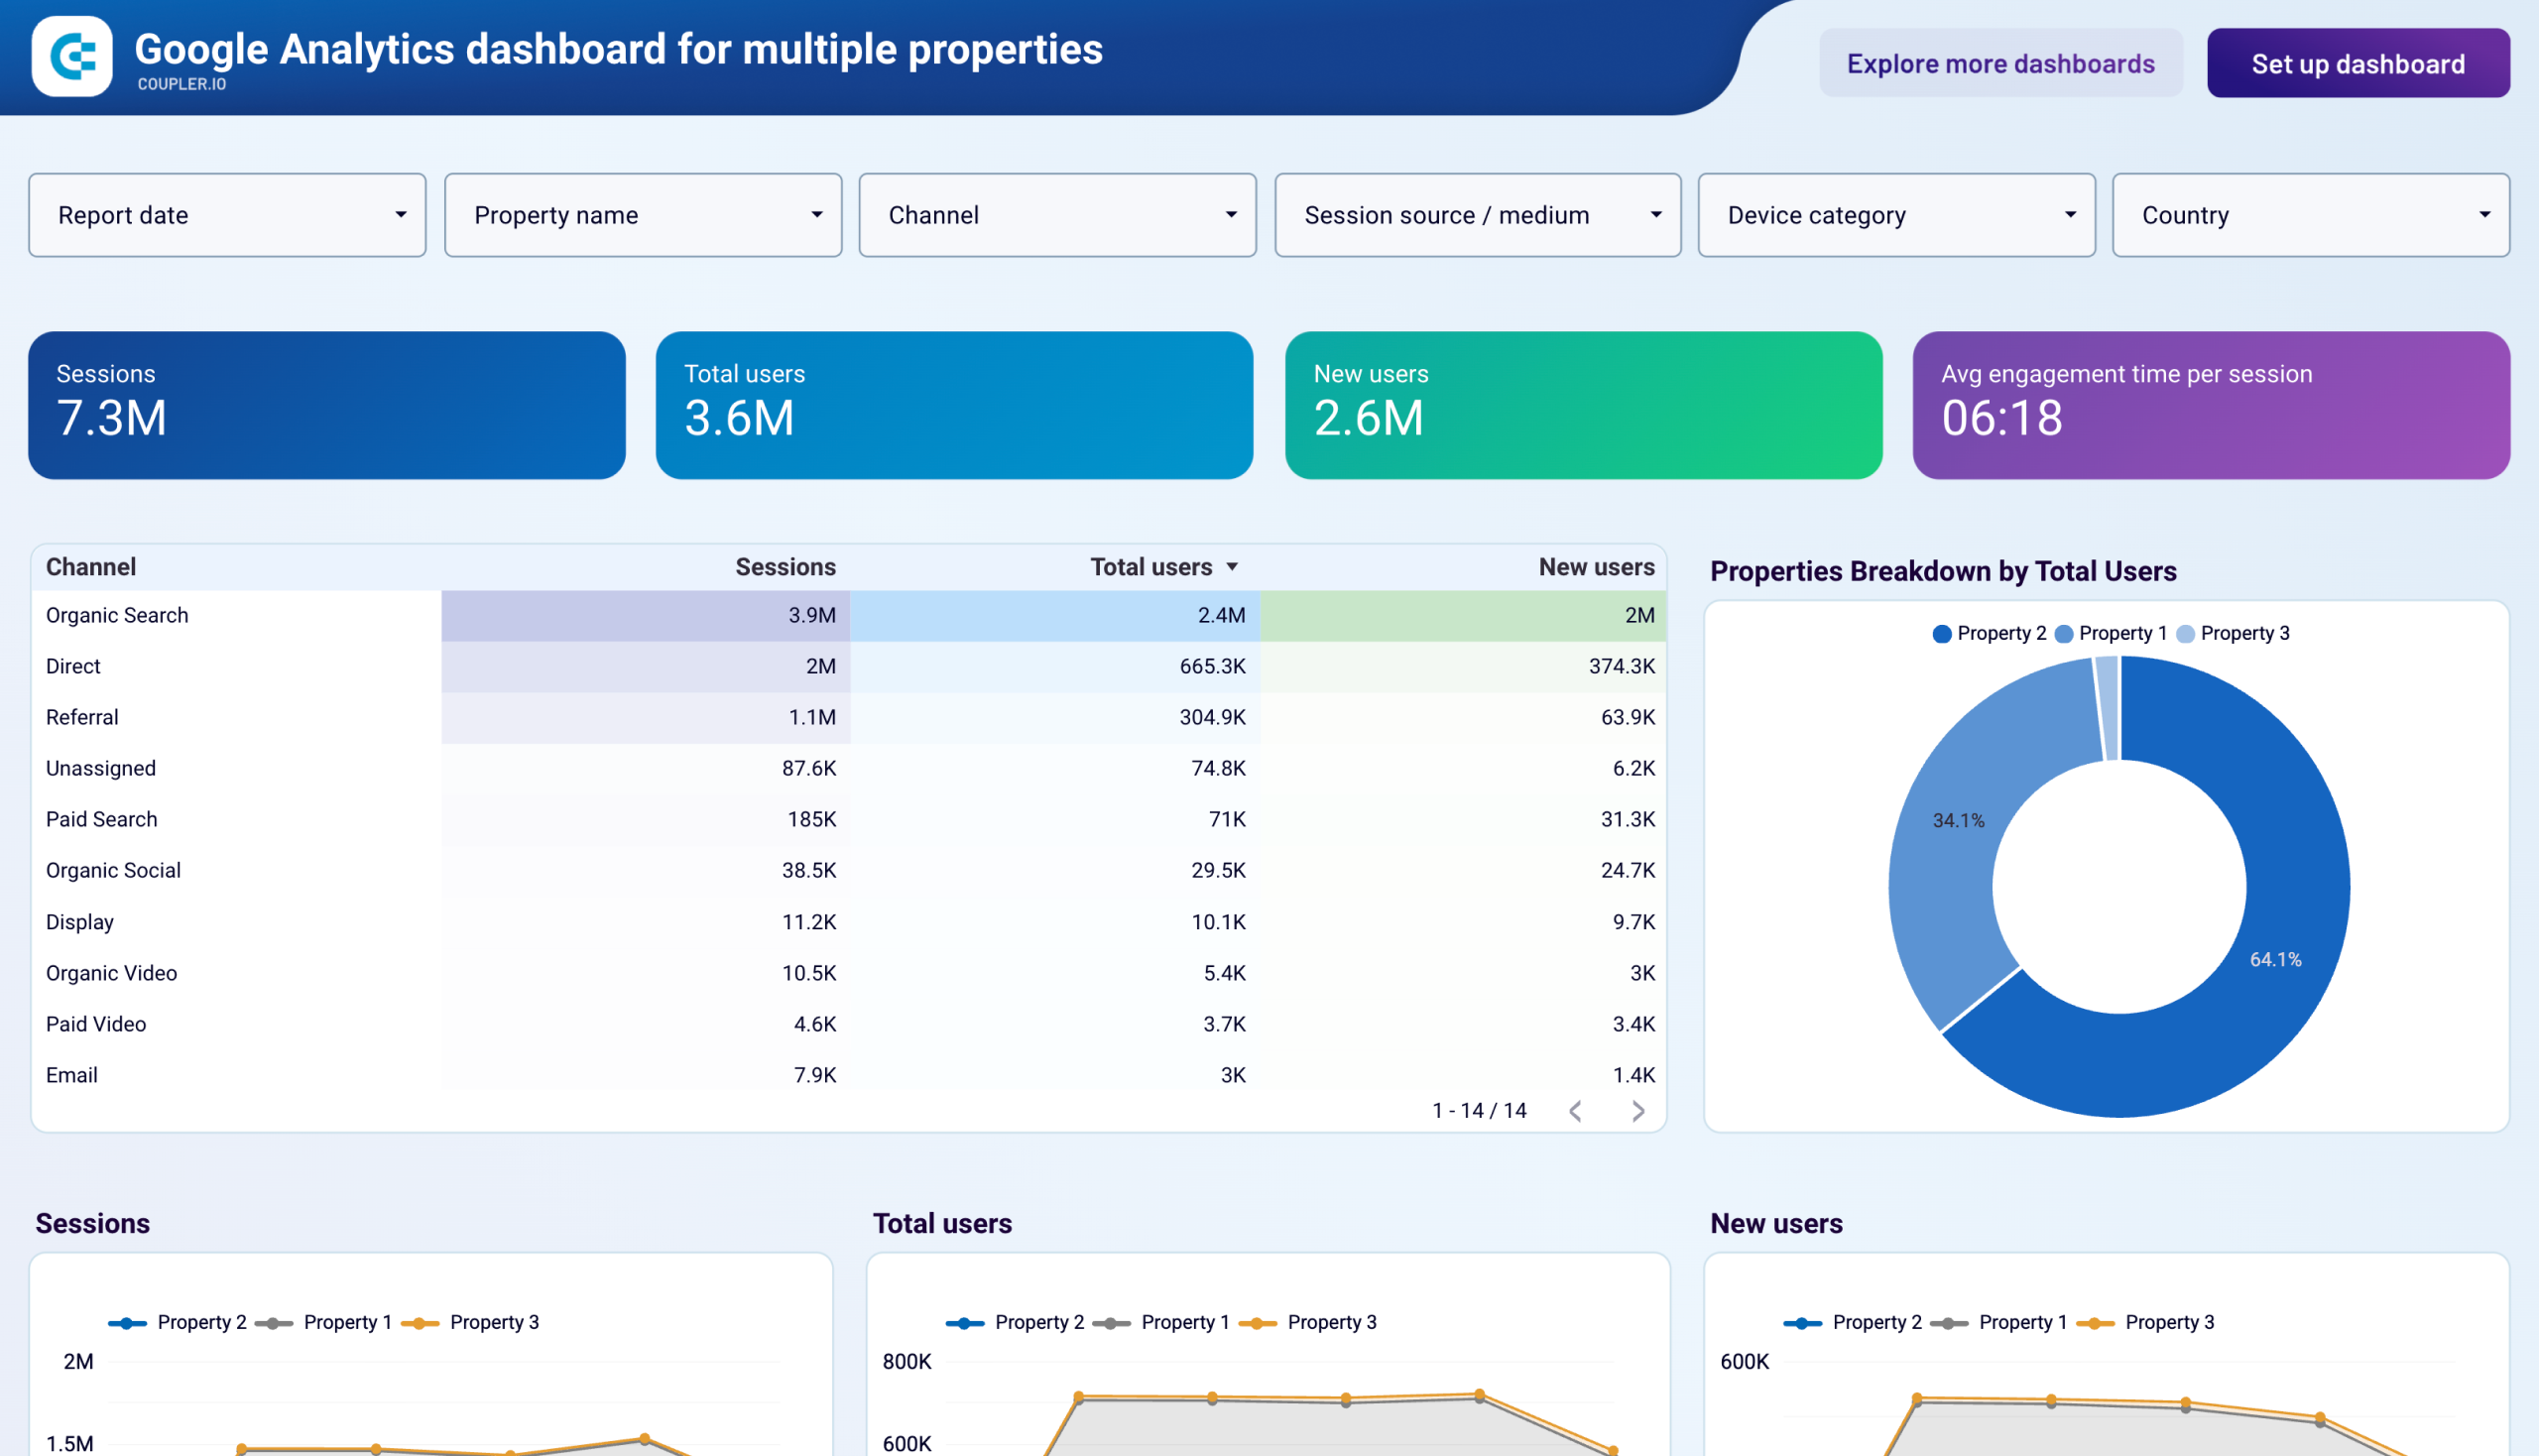
Above we mentioned that you can collect data from multiple GA4 properties with Coupler.io. Well, this dashboard template is designed right for such kinds of analytics. It collects information from your properties and lets you check their performance in one place.
Google Analytics dashboard for multiple properties
 Preview dashboard
Google Analytics dashboard for multiple properties
Preview dashboardYou can easily monitor sessions, new users, conversions, and other traffic-related metrics by property. To start using the dashboard, just connect your GA4 account and select the needed properties following the enclosed instructions. In a few moments, you’ll get a fully functional report that will refresh automatically.
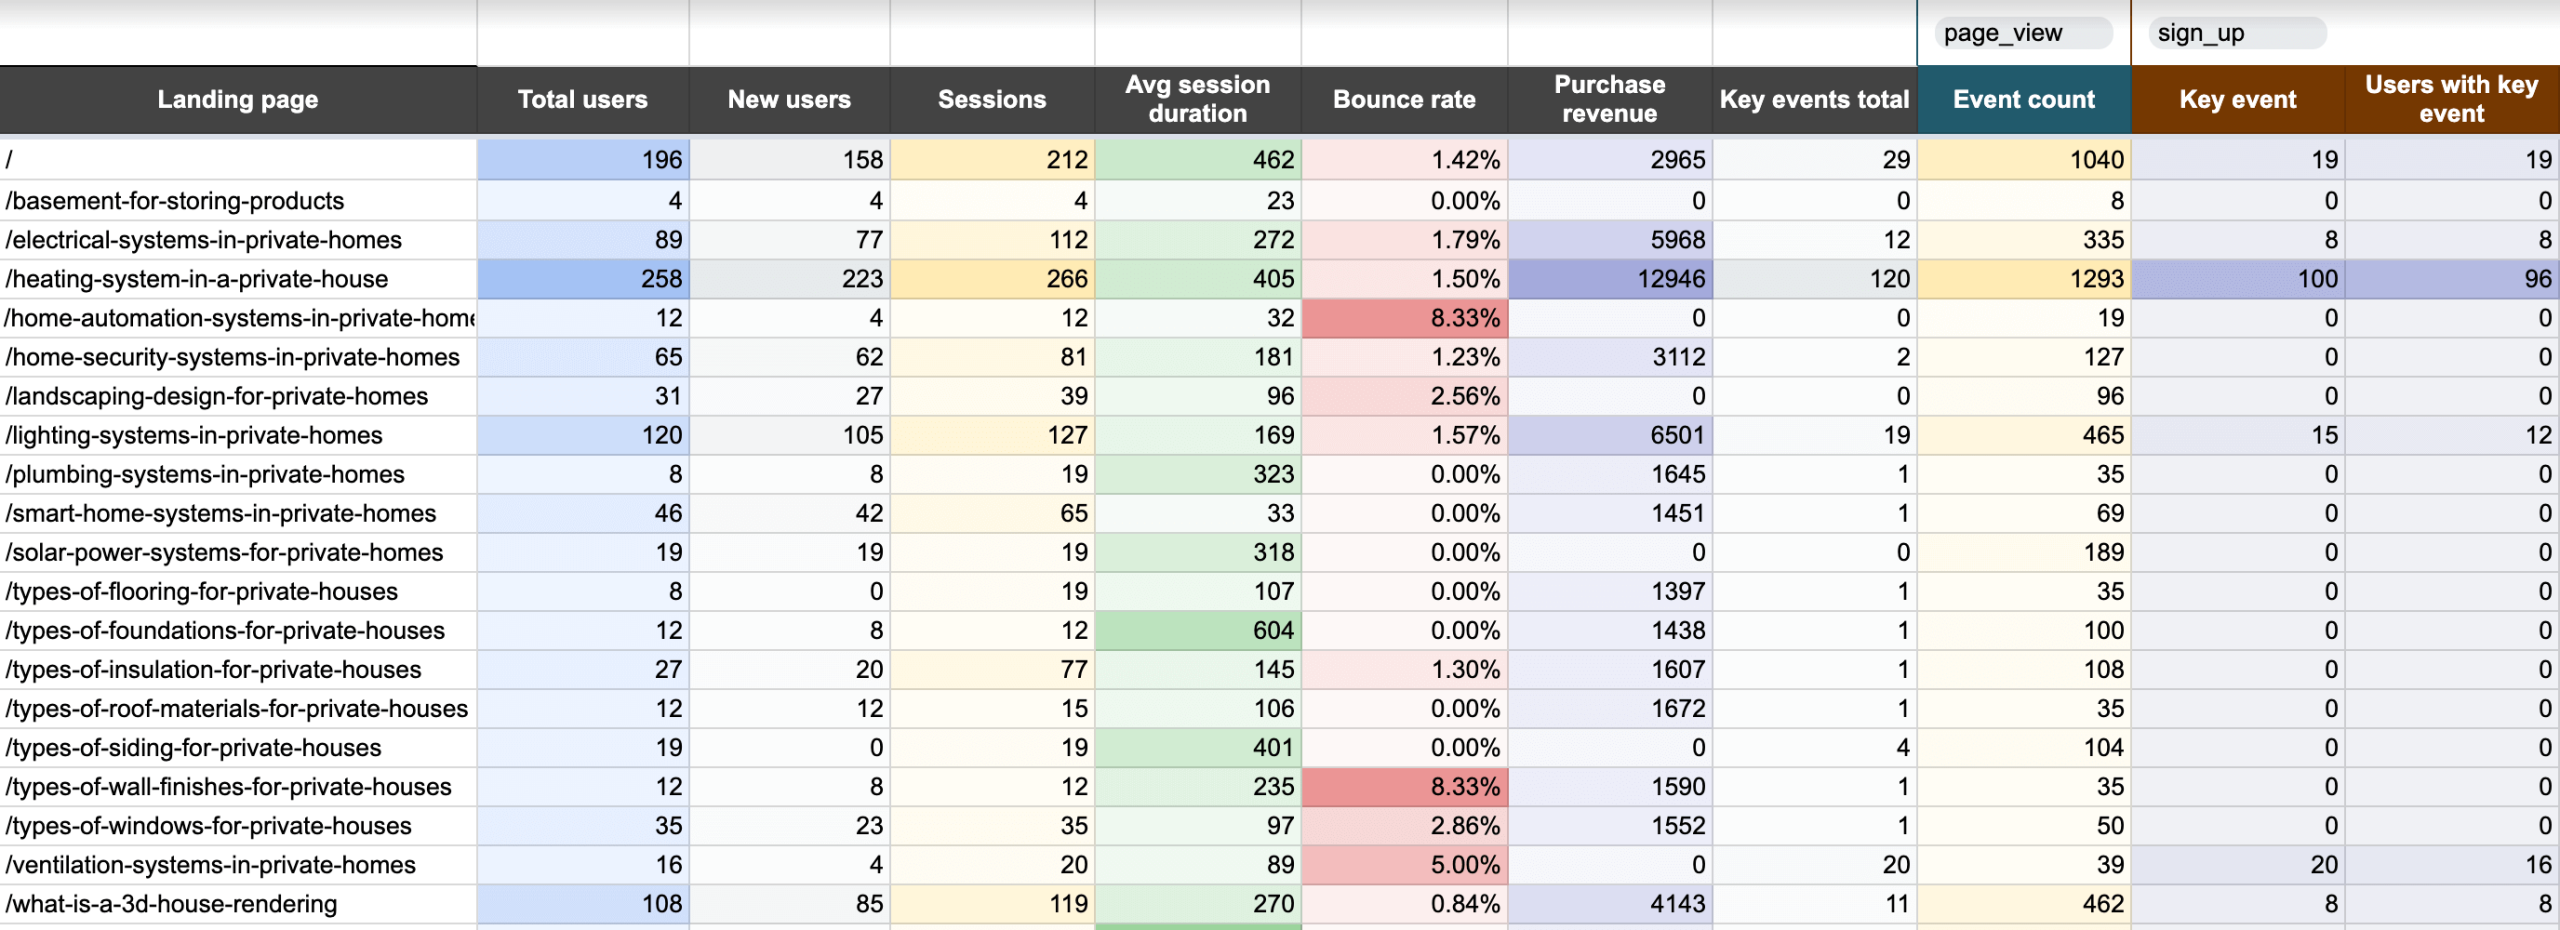
Landing page performance dashboard
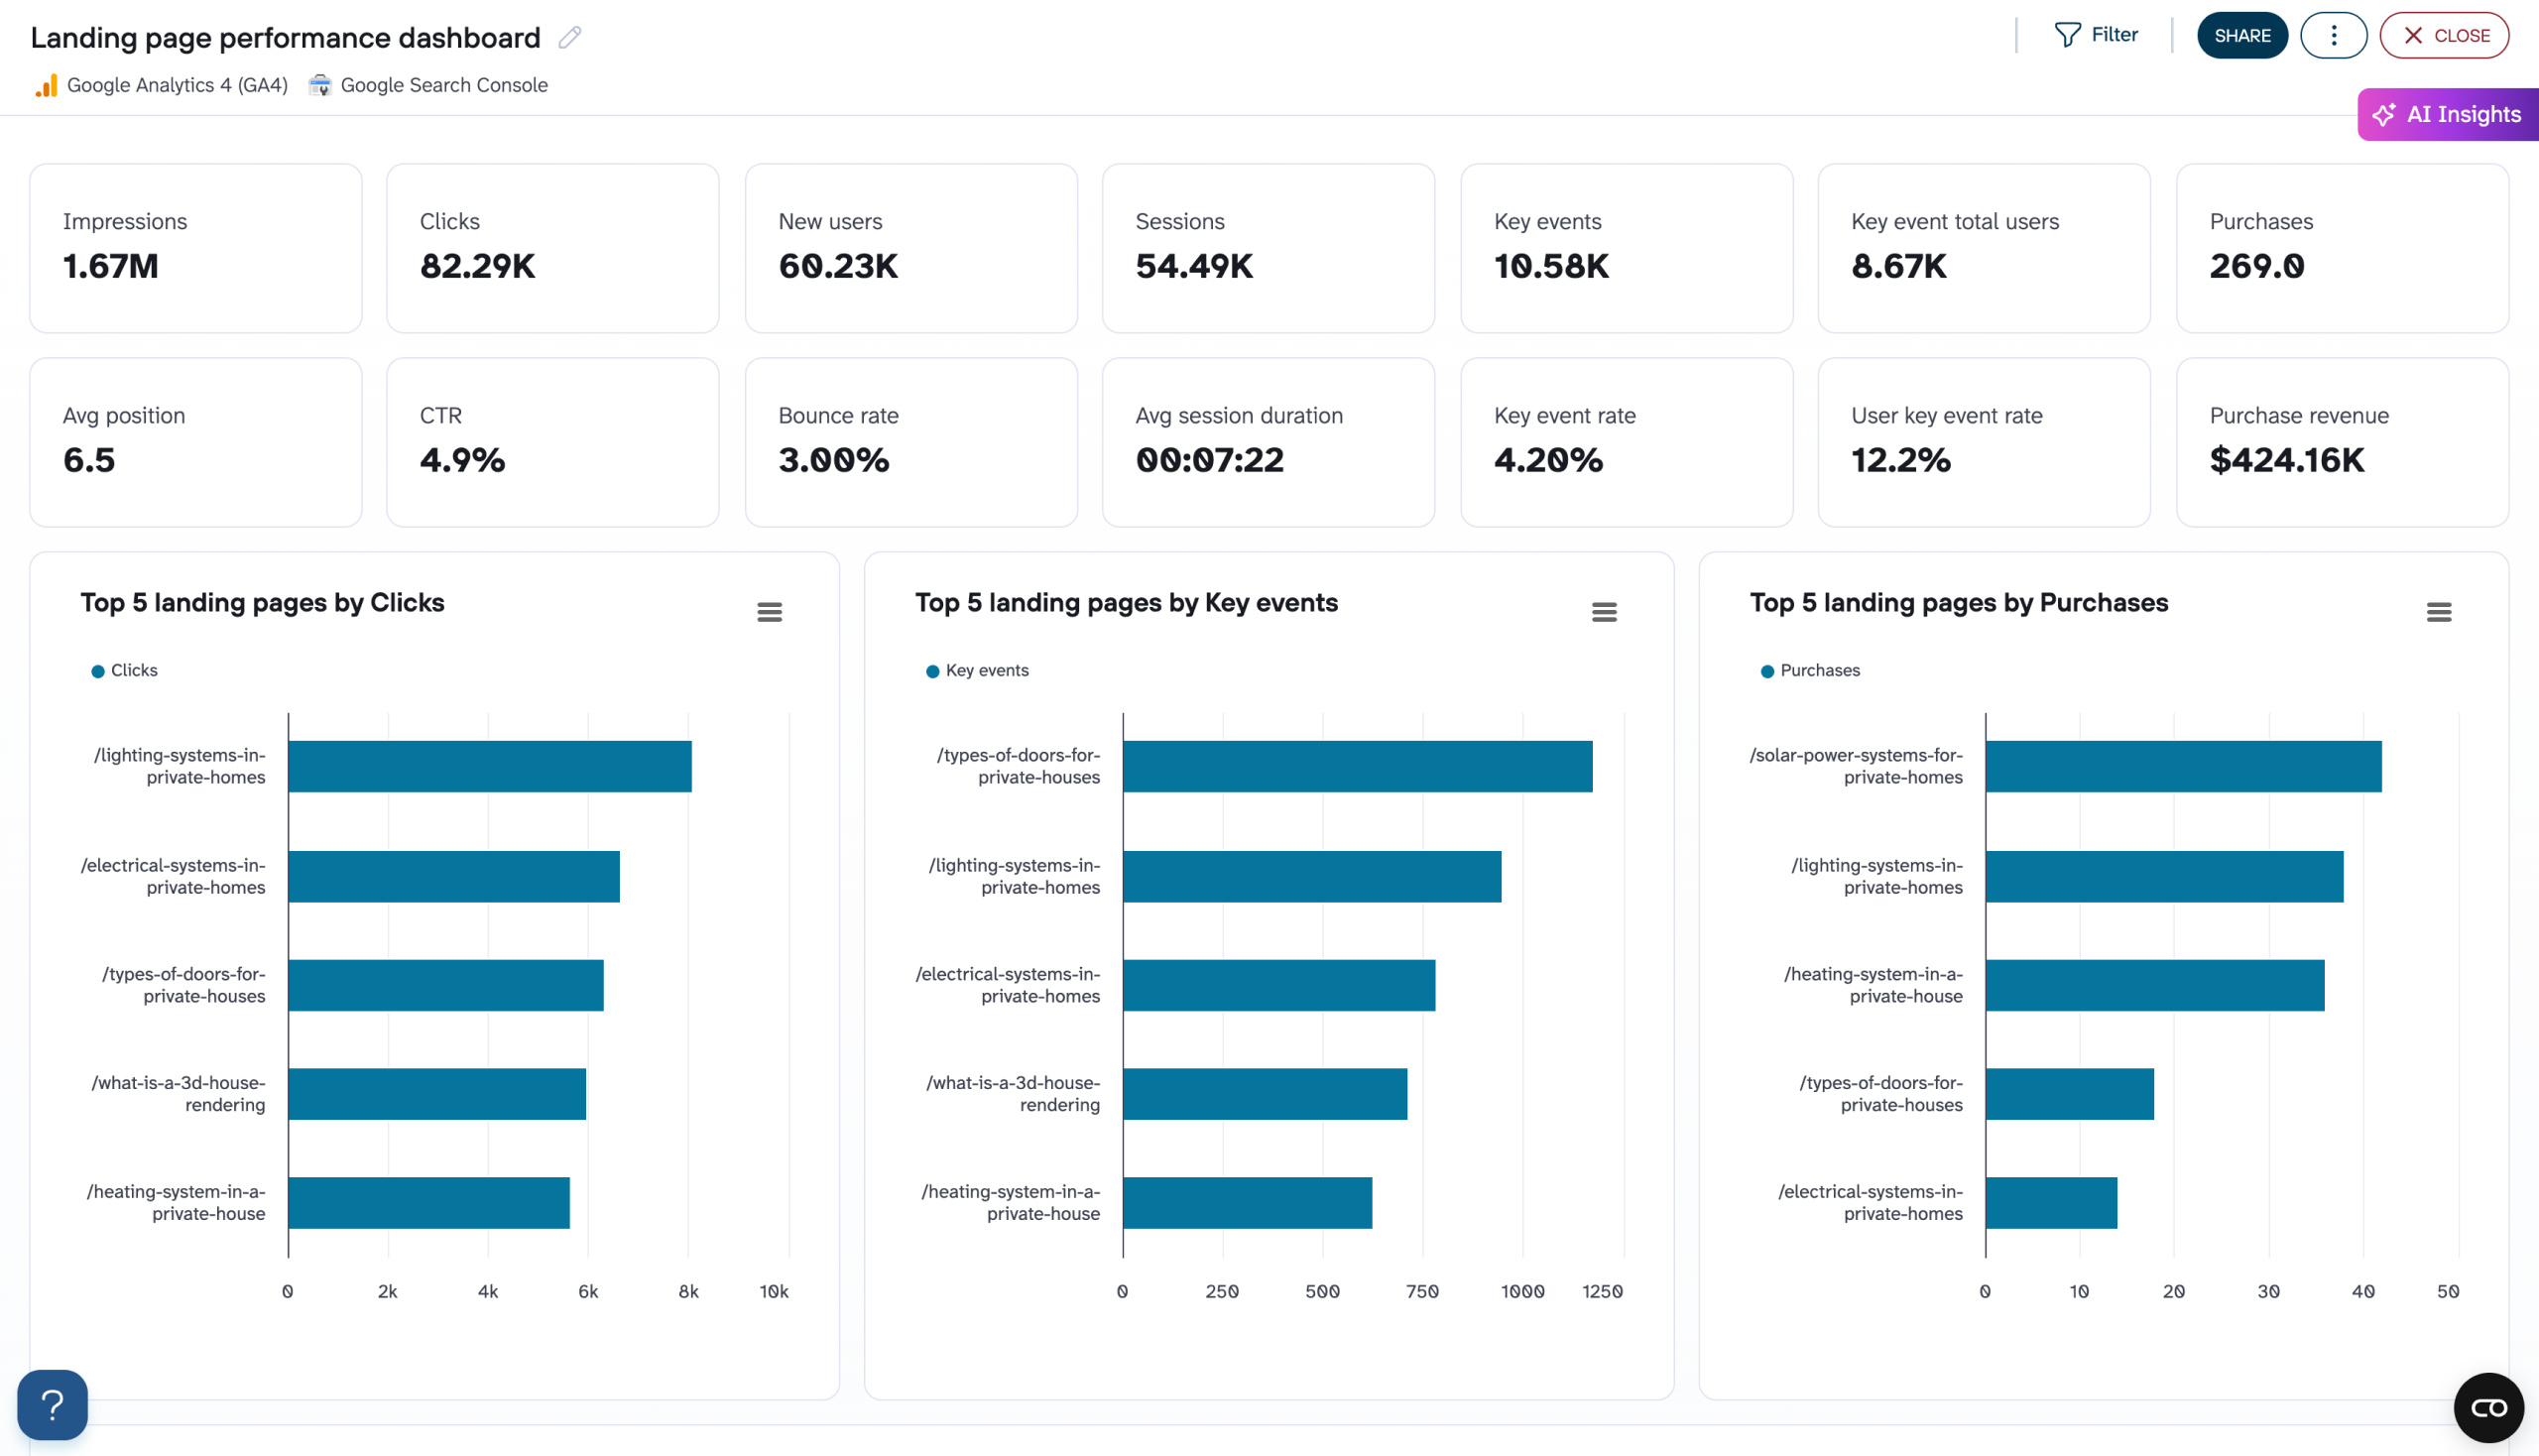
This dashboard template is not only GA4-based. It collects data from two sources: Google Search Console and Google Analytics 4. As a result, you can get an overview of your landing pages’ performance for the last 30 days.
Landing page performance dashboard
 Preview dashboard
Landing page performance dashboard
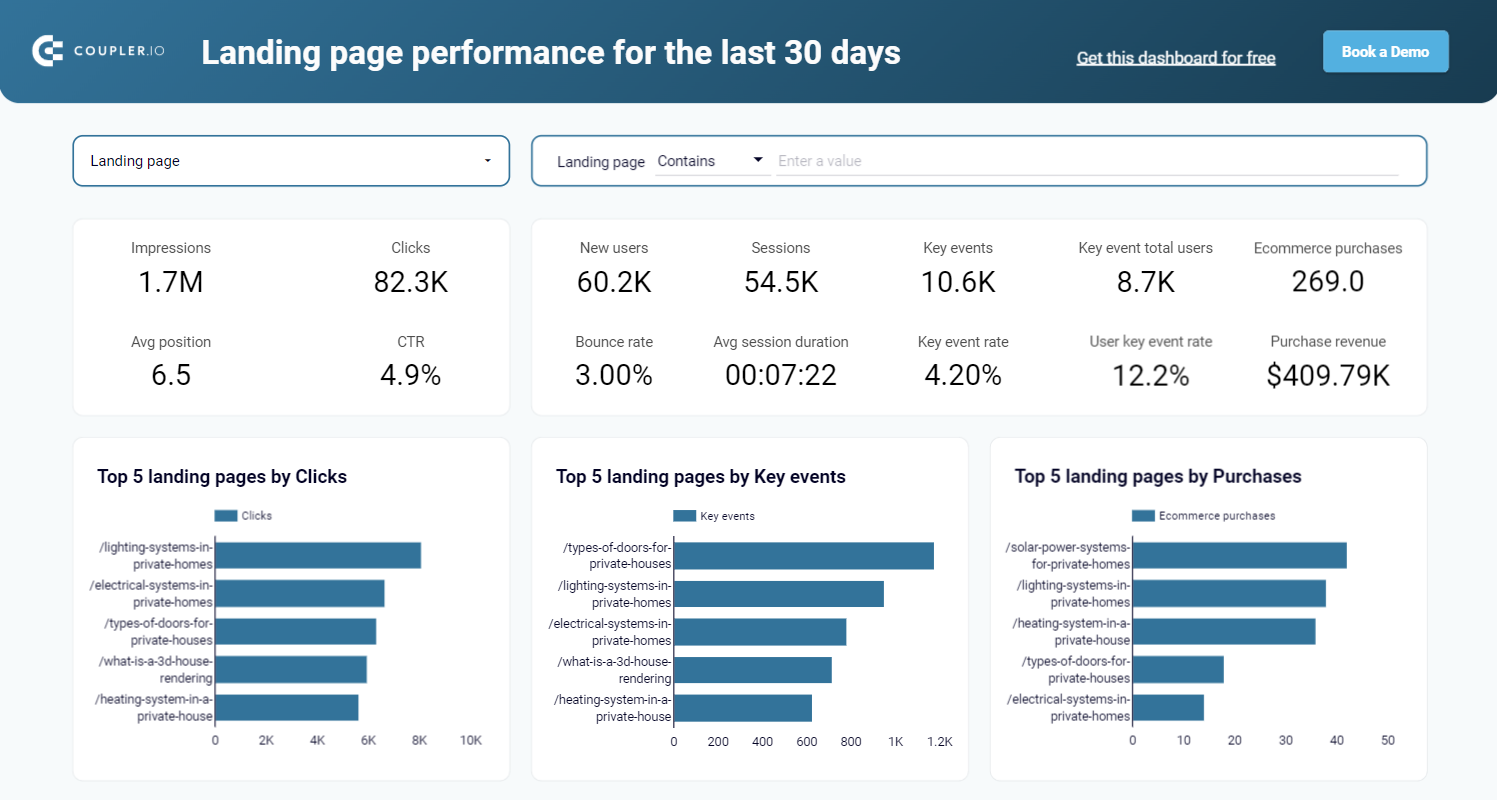
Preview dashboardThe dashboard lets you monitor how much traffic your landing pages receive and how this results in purchases. Since the data is coming from two sources, you have two sets of performance metrics:
| GSC performance metrics | GA4 performance metrics |
|---|---|
| – Impressions – Clicks – Average position – CTR | – New users – Sessions – Key events – Bounce rate – Average session duration – Ecommerce purchases – Purchase revenue |
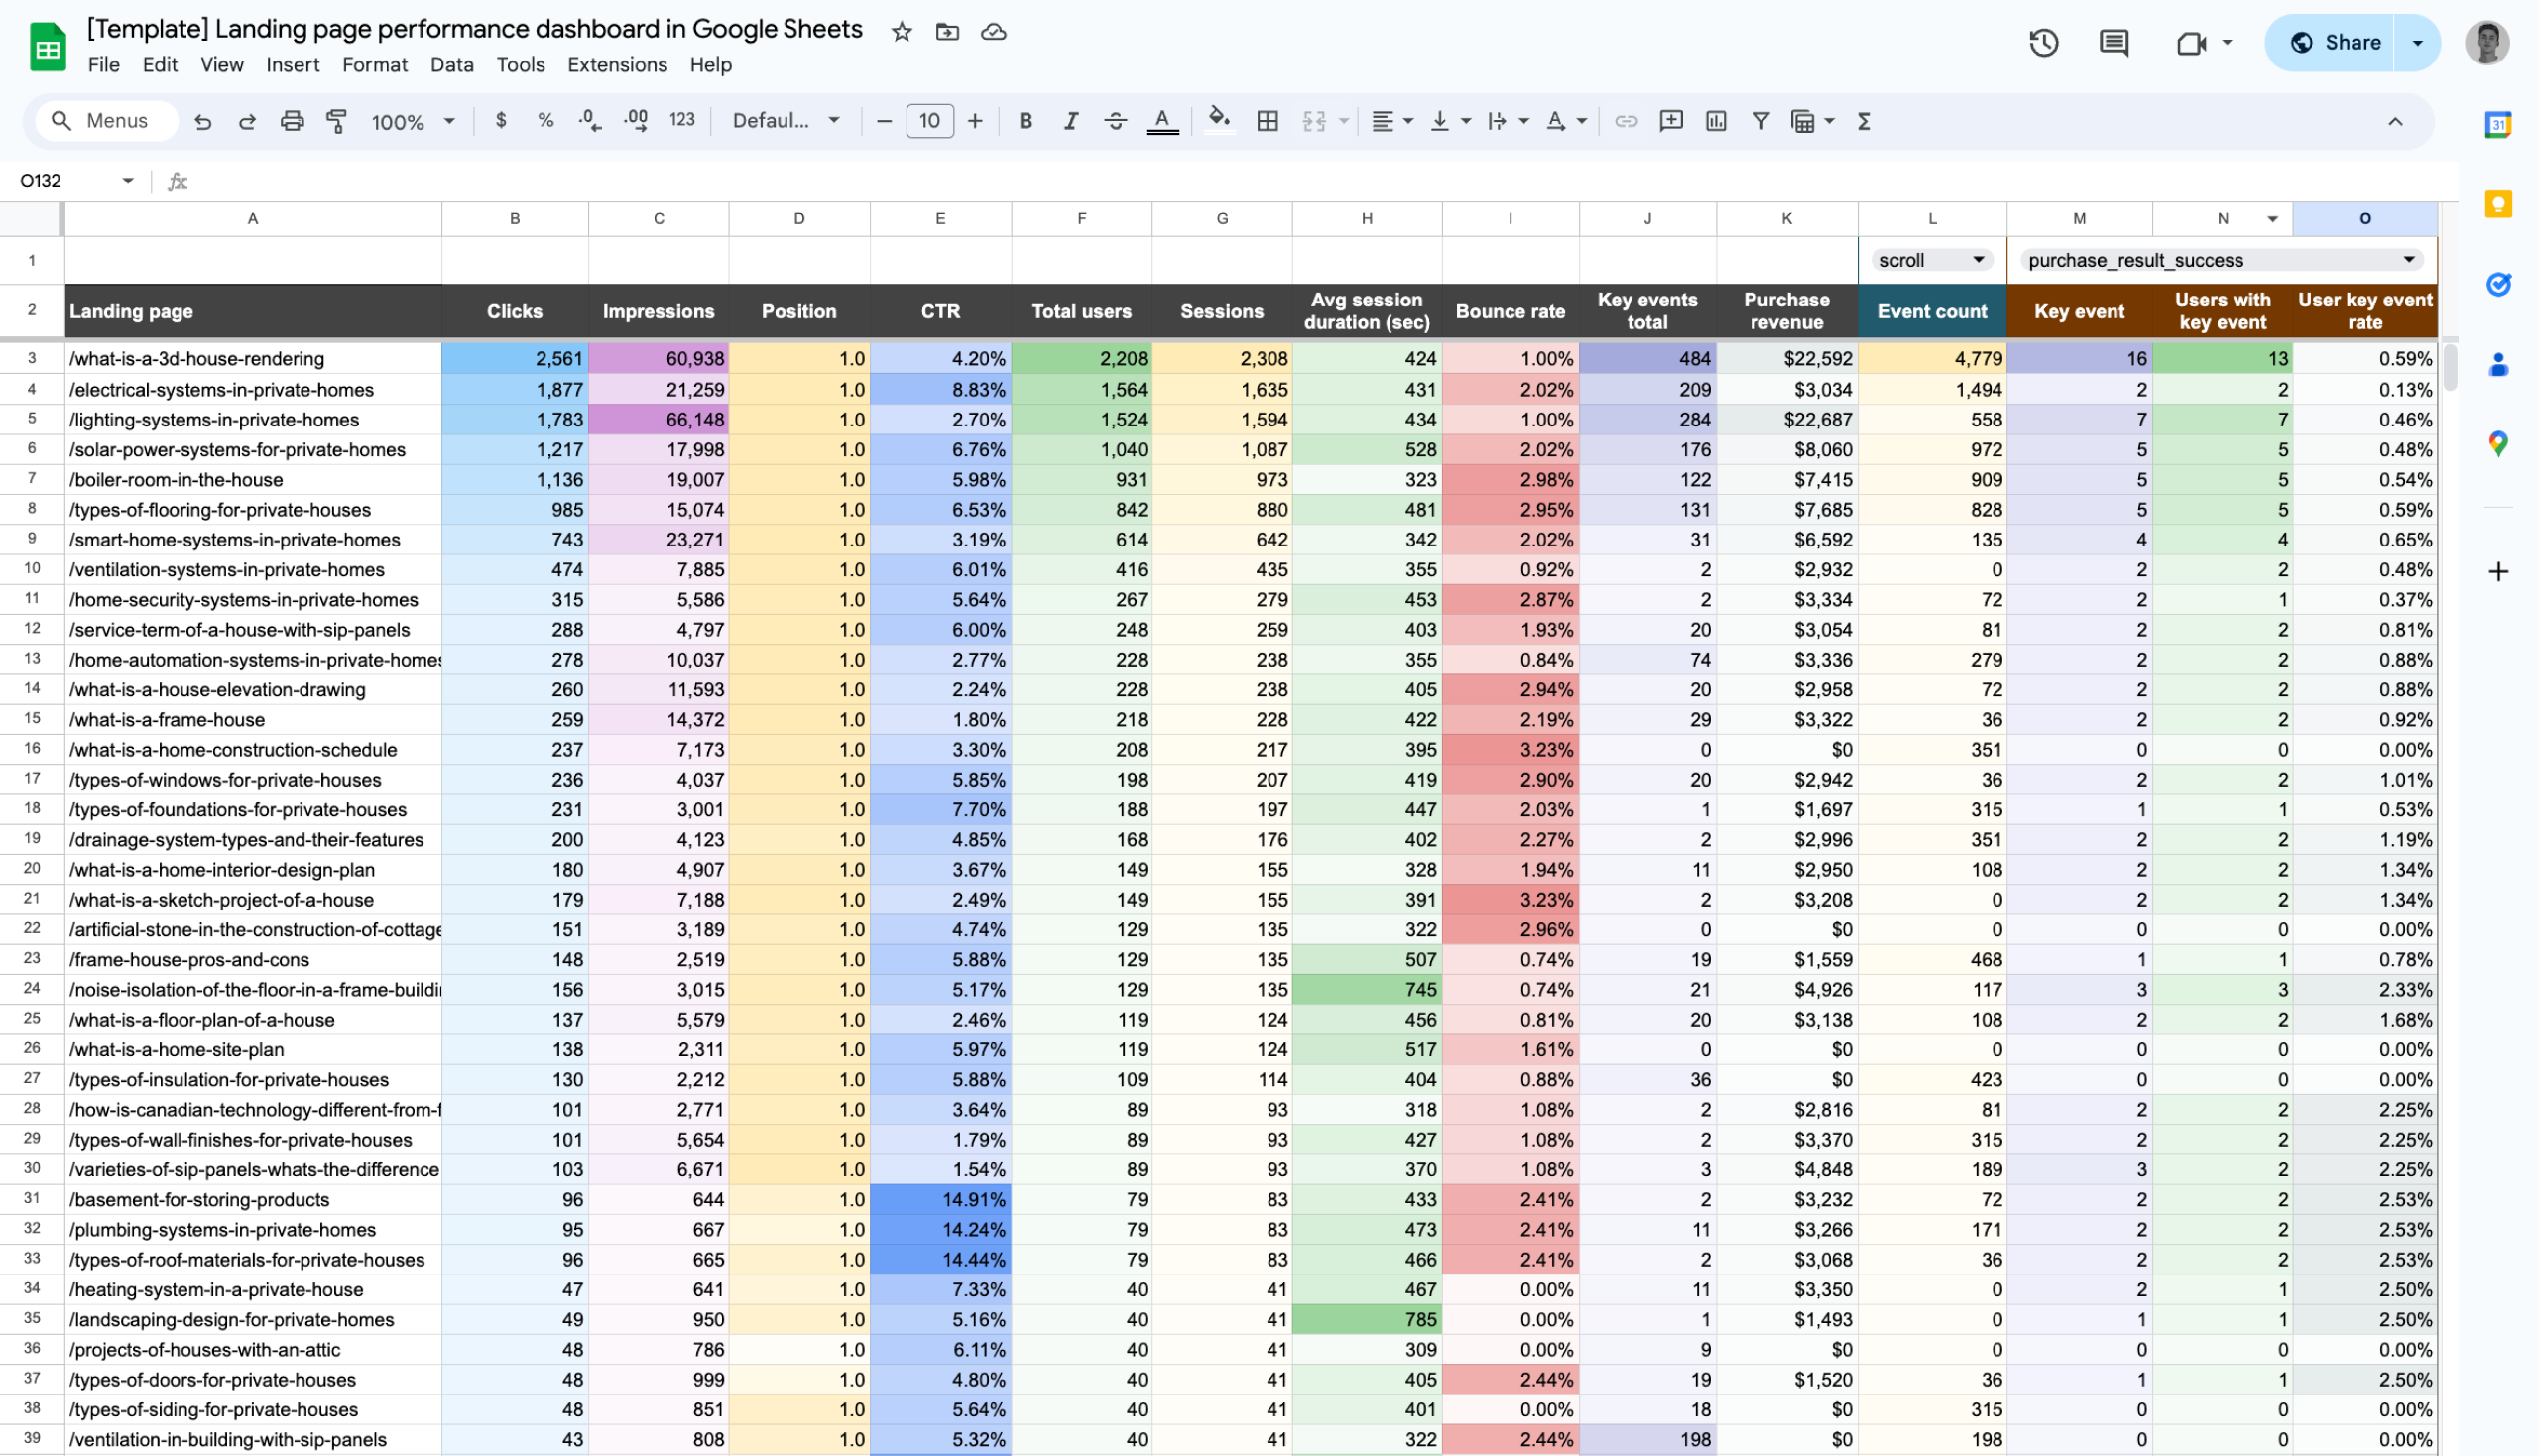
The GA4 dashboard template is available in Coupler.io, Looker Studio, and Google Sheets. Simply connect your Google account that you use for Google Analytics 4 and Search Console, and the dashboard will be populated with your data.

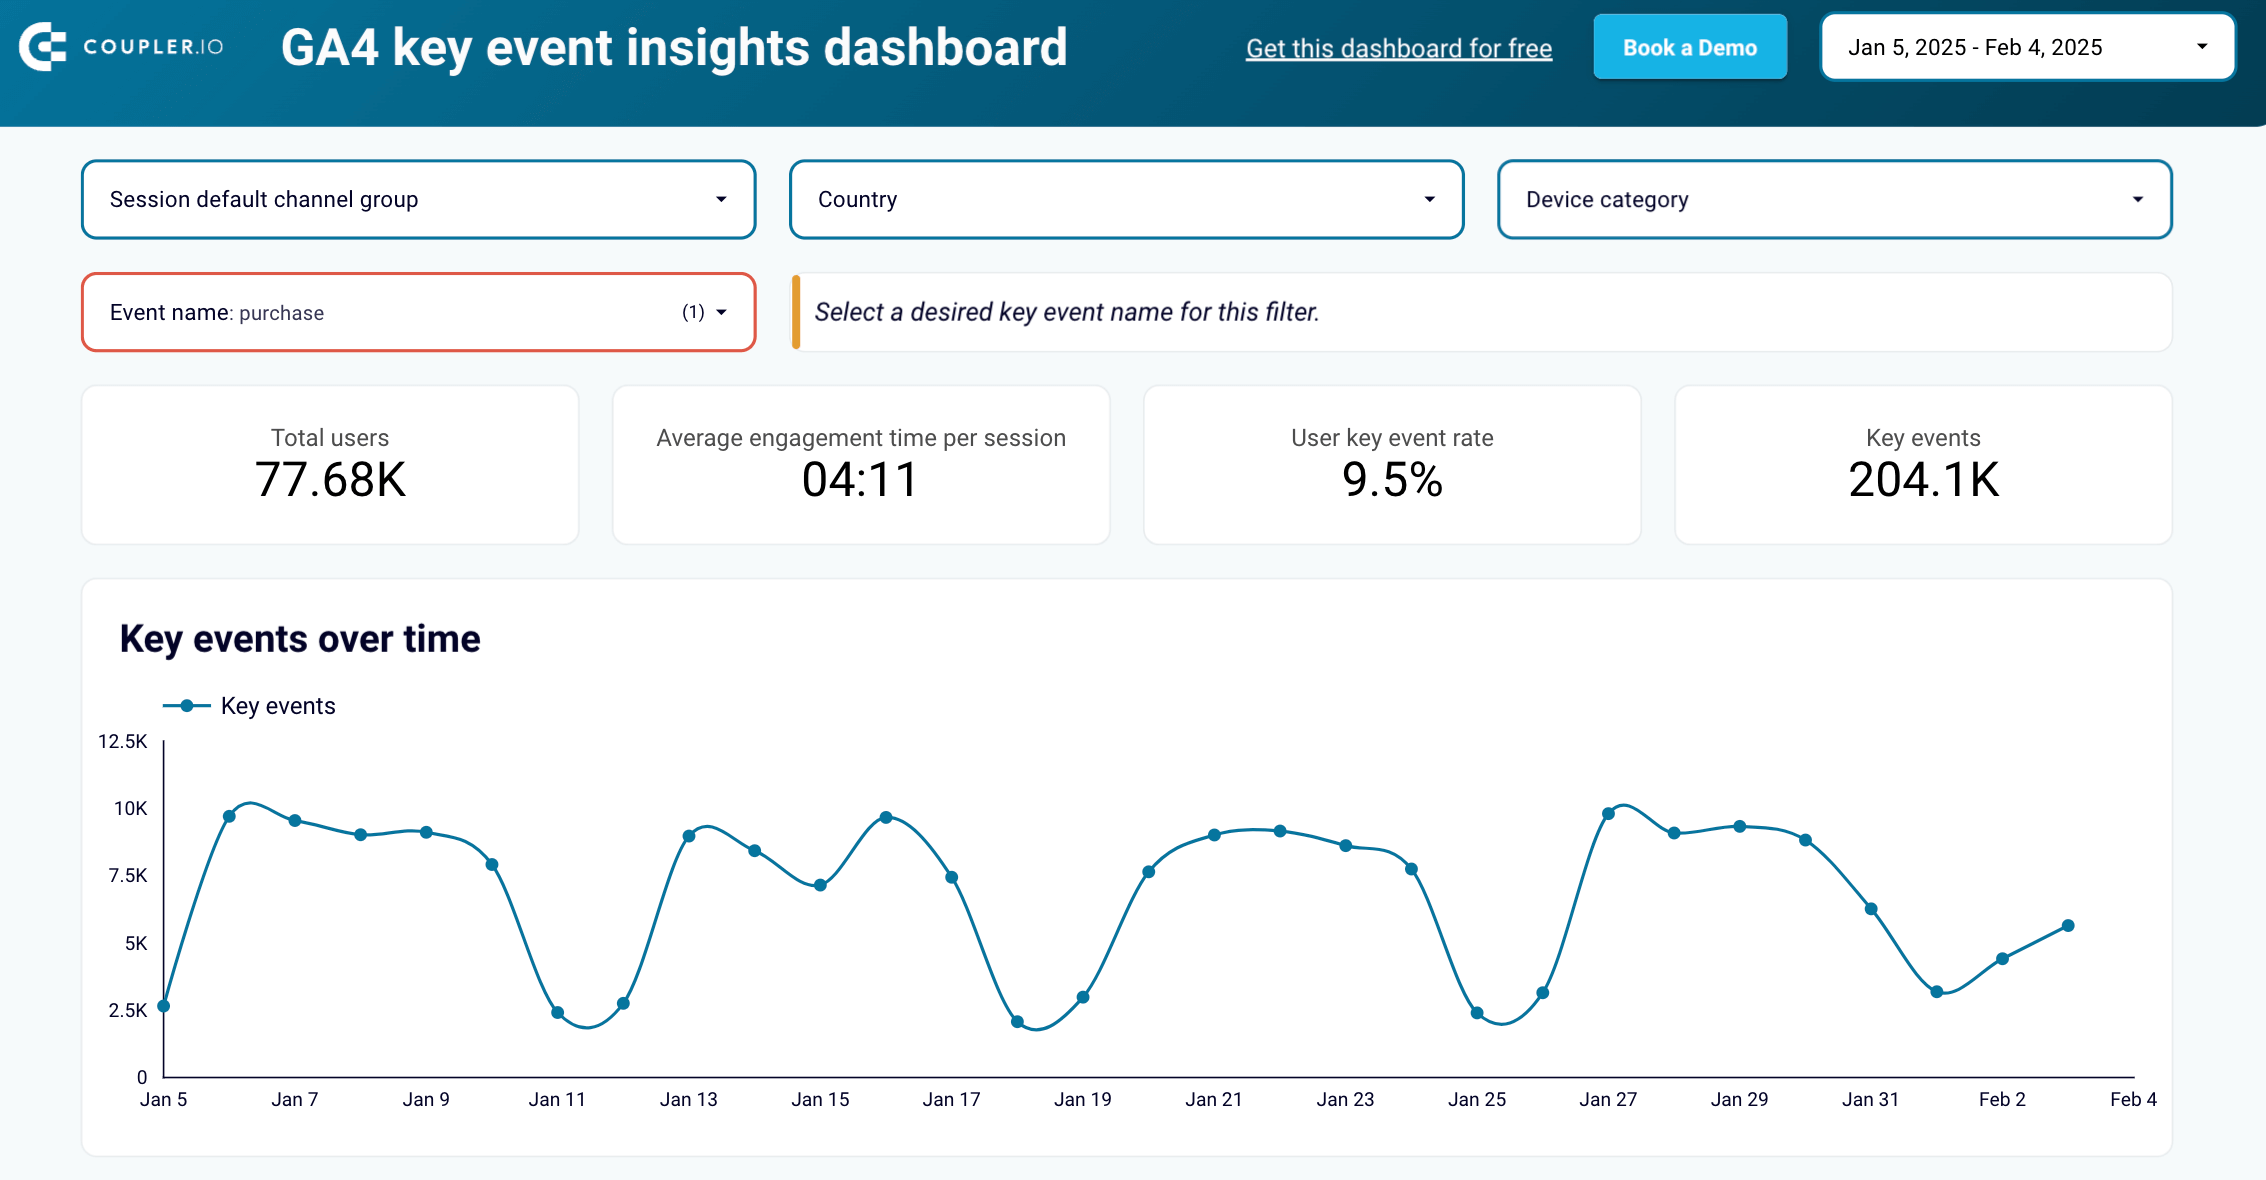
GA4 key event insights dashboard
This dashboard provides a clear overview of key events like purchases, sign-ups, and downloads. It helps to track how users complete key actions, identify high-converting traffic sources, and analyze engagement trends over time.
GA4 key event insights dashboard
 Preview dashboard
GA4 key event insights dashboard
Preview dashboardBy leveraging insights from this dashboard, businesses can see which marketing channels drive the most valuable users, which devices are most commonly used for conversions, and how engagement varies across locations. With this data, they can make informed decisions to optimize website performance, adjust marketing strategies, and improve conversion rates.
The GA4 key event insights dashboard is available in Looker Studio and has a built-in Coupler.io connector, so your reports are always up-to-date with the latest data.
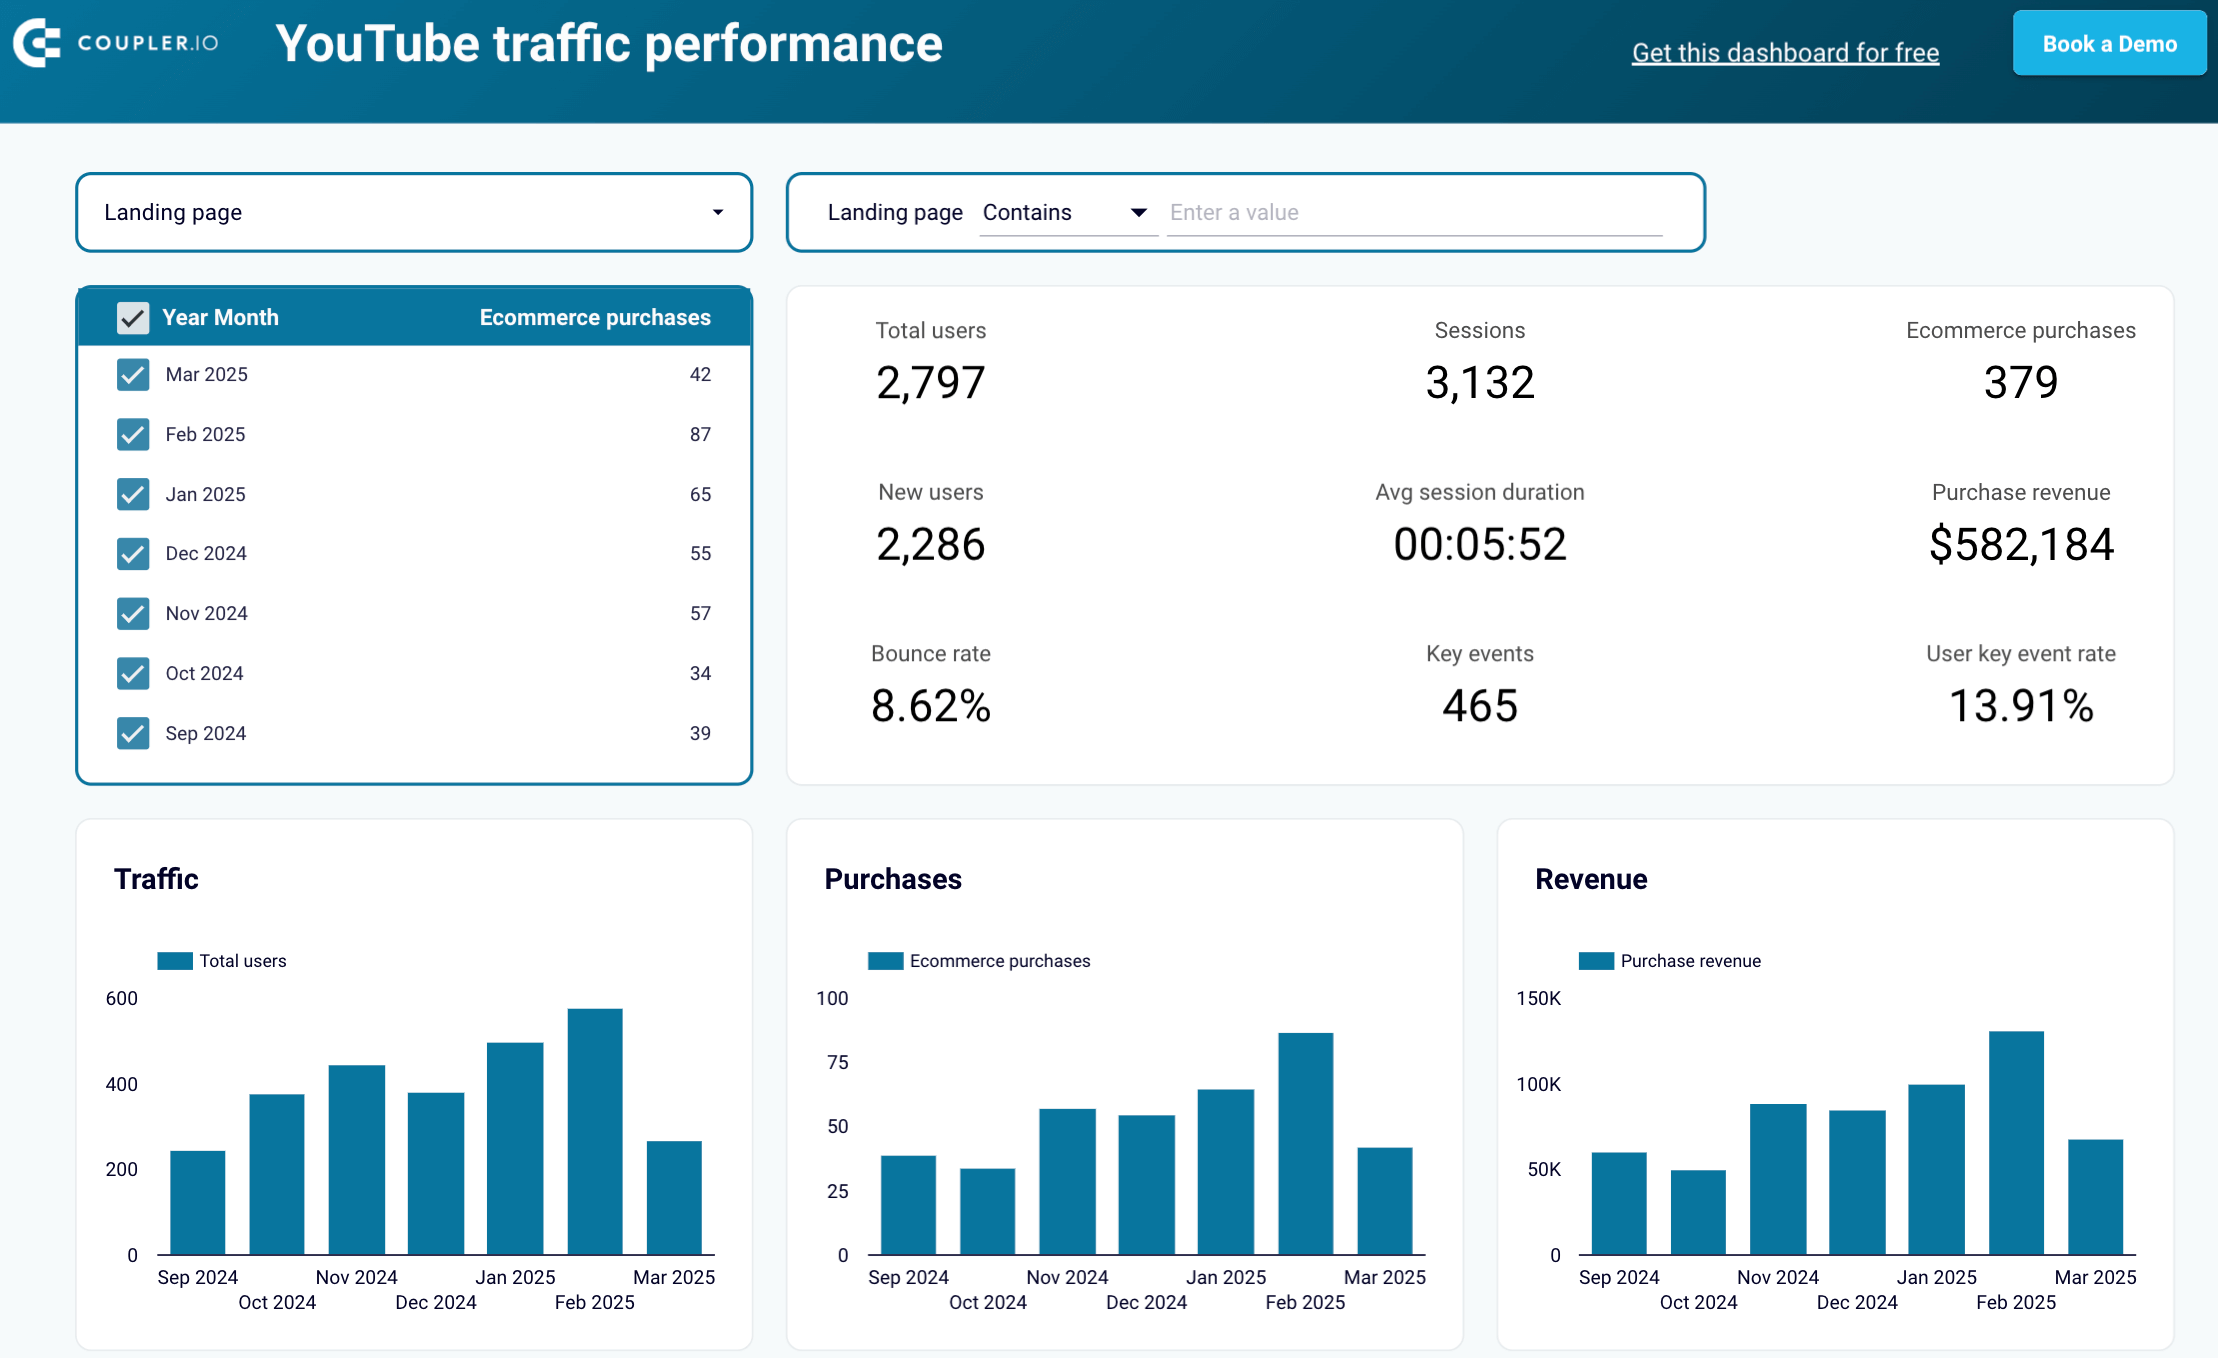
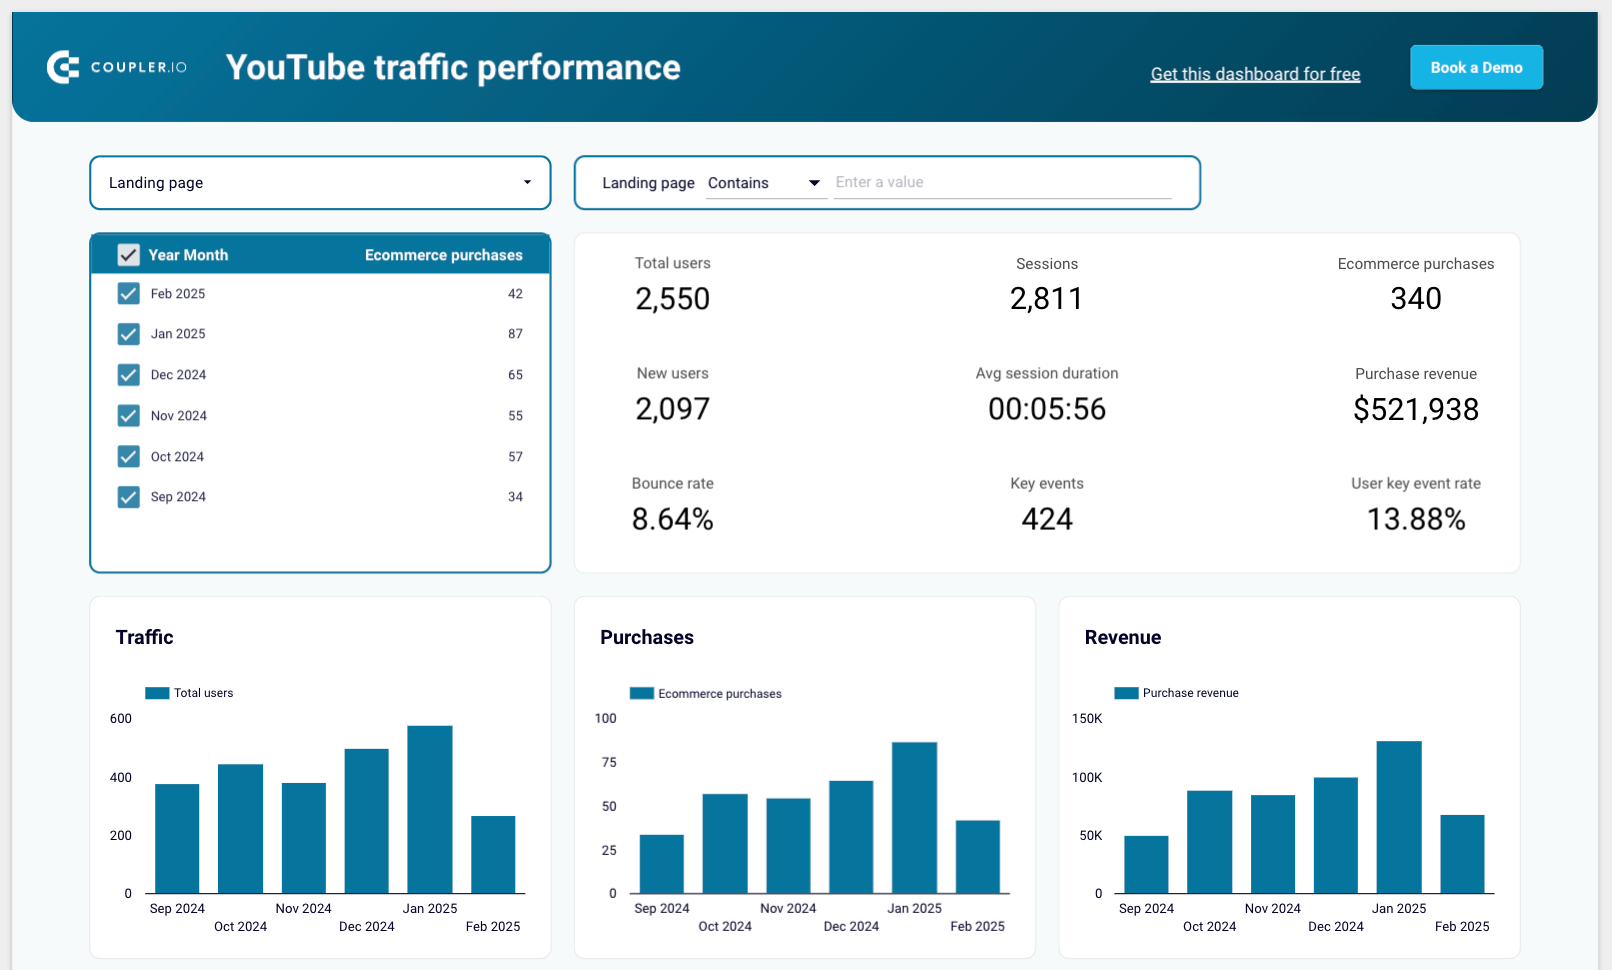
Website traffic from YouTube – performance analysis dashboard template
Use this dashboard to monitor and analyze the traffic coming to your website from YouTube. It’s a very useful solution for users who have a website and a YouTube channel.
Website traffic from YouTube dashboard
 Preview dashboard
Website traffic from YouTube dashboard
Preview dashboardThe dashboard allows you to monitor the performance of your videos, including how many users they bring to webpages, how many purchases they generate, and how much revenue you eventually get.
The template is available in Looker Studio and Google Sheets. Both versions are equipped with the Coupler.io connector to automate data load from GA4. Try it right away for free!

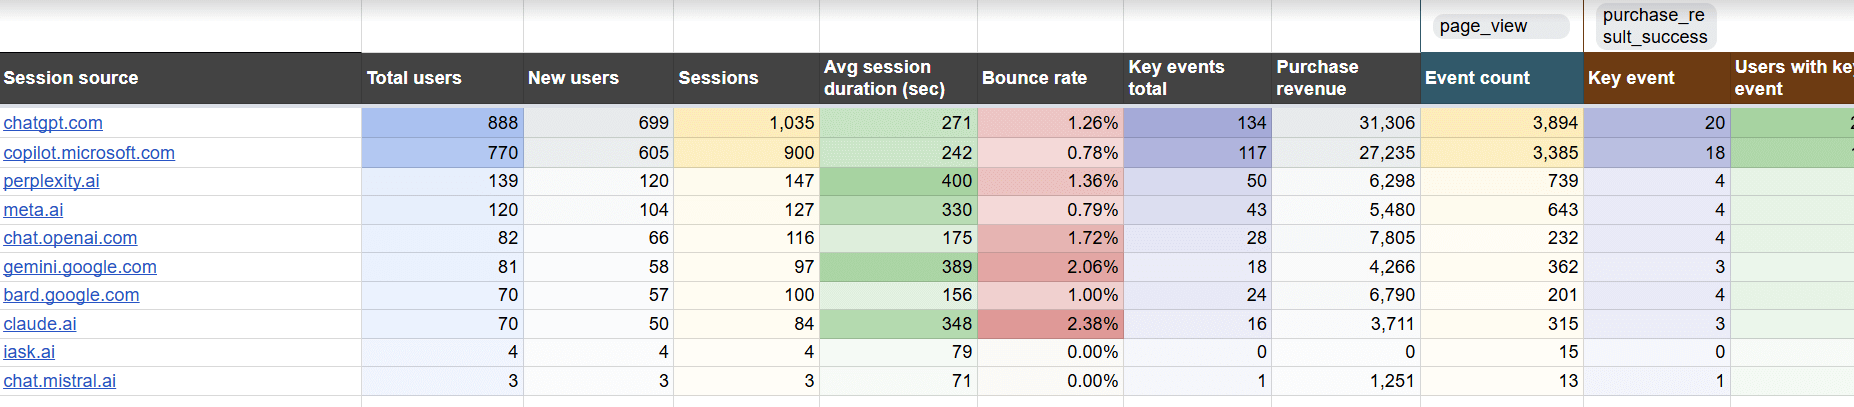
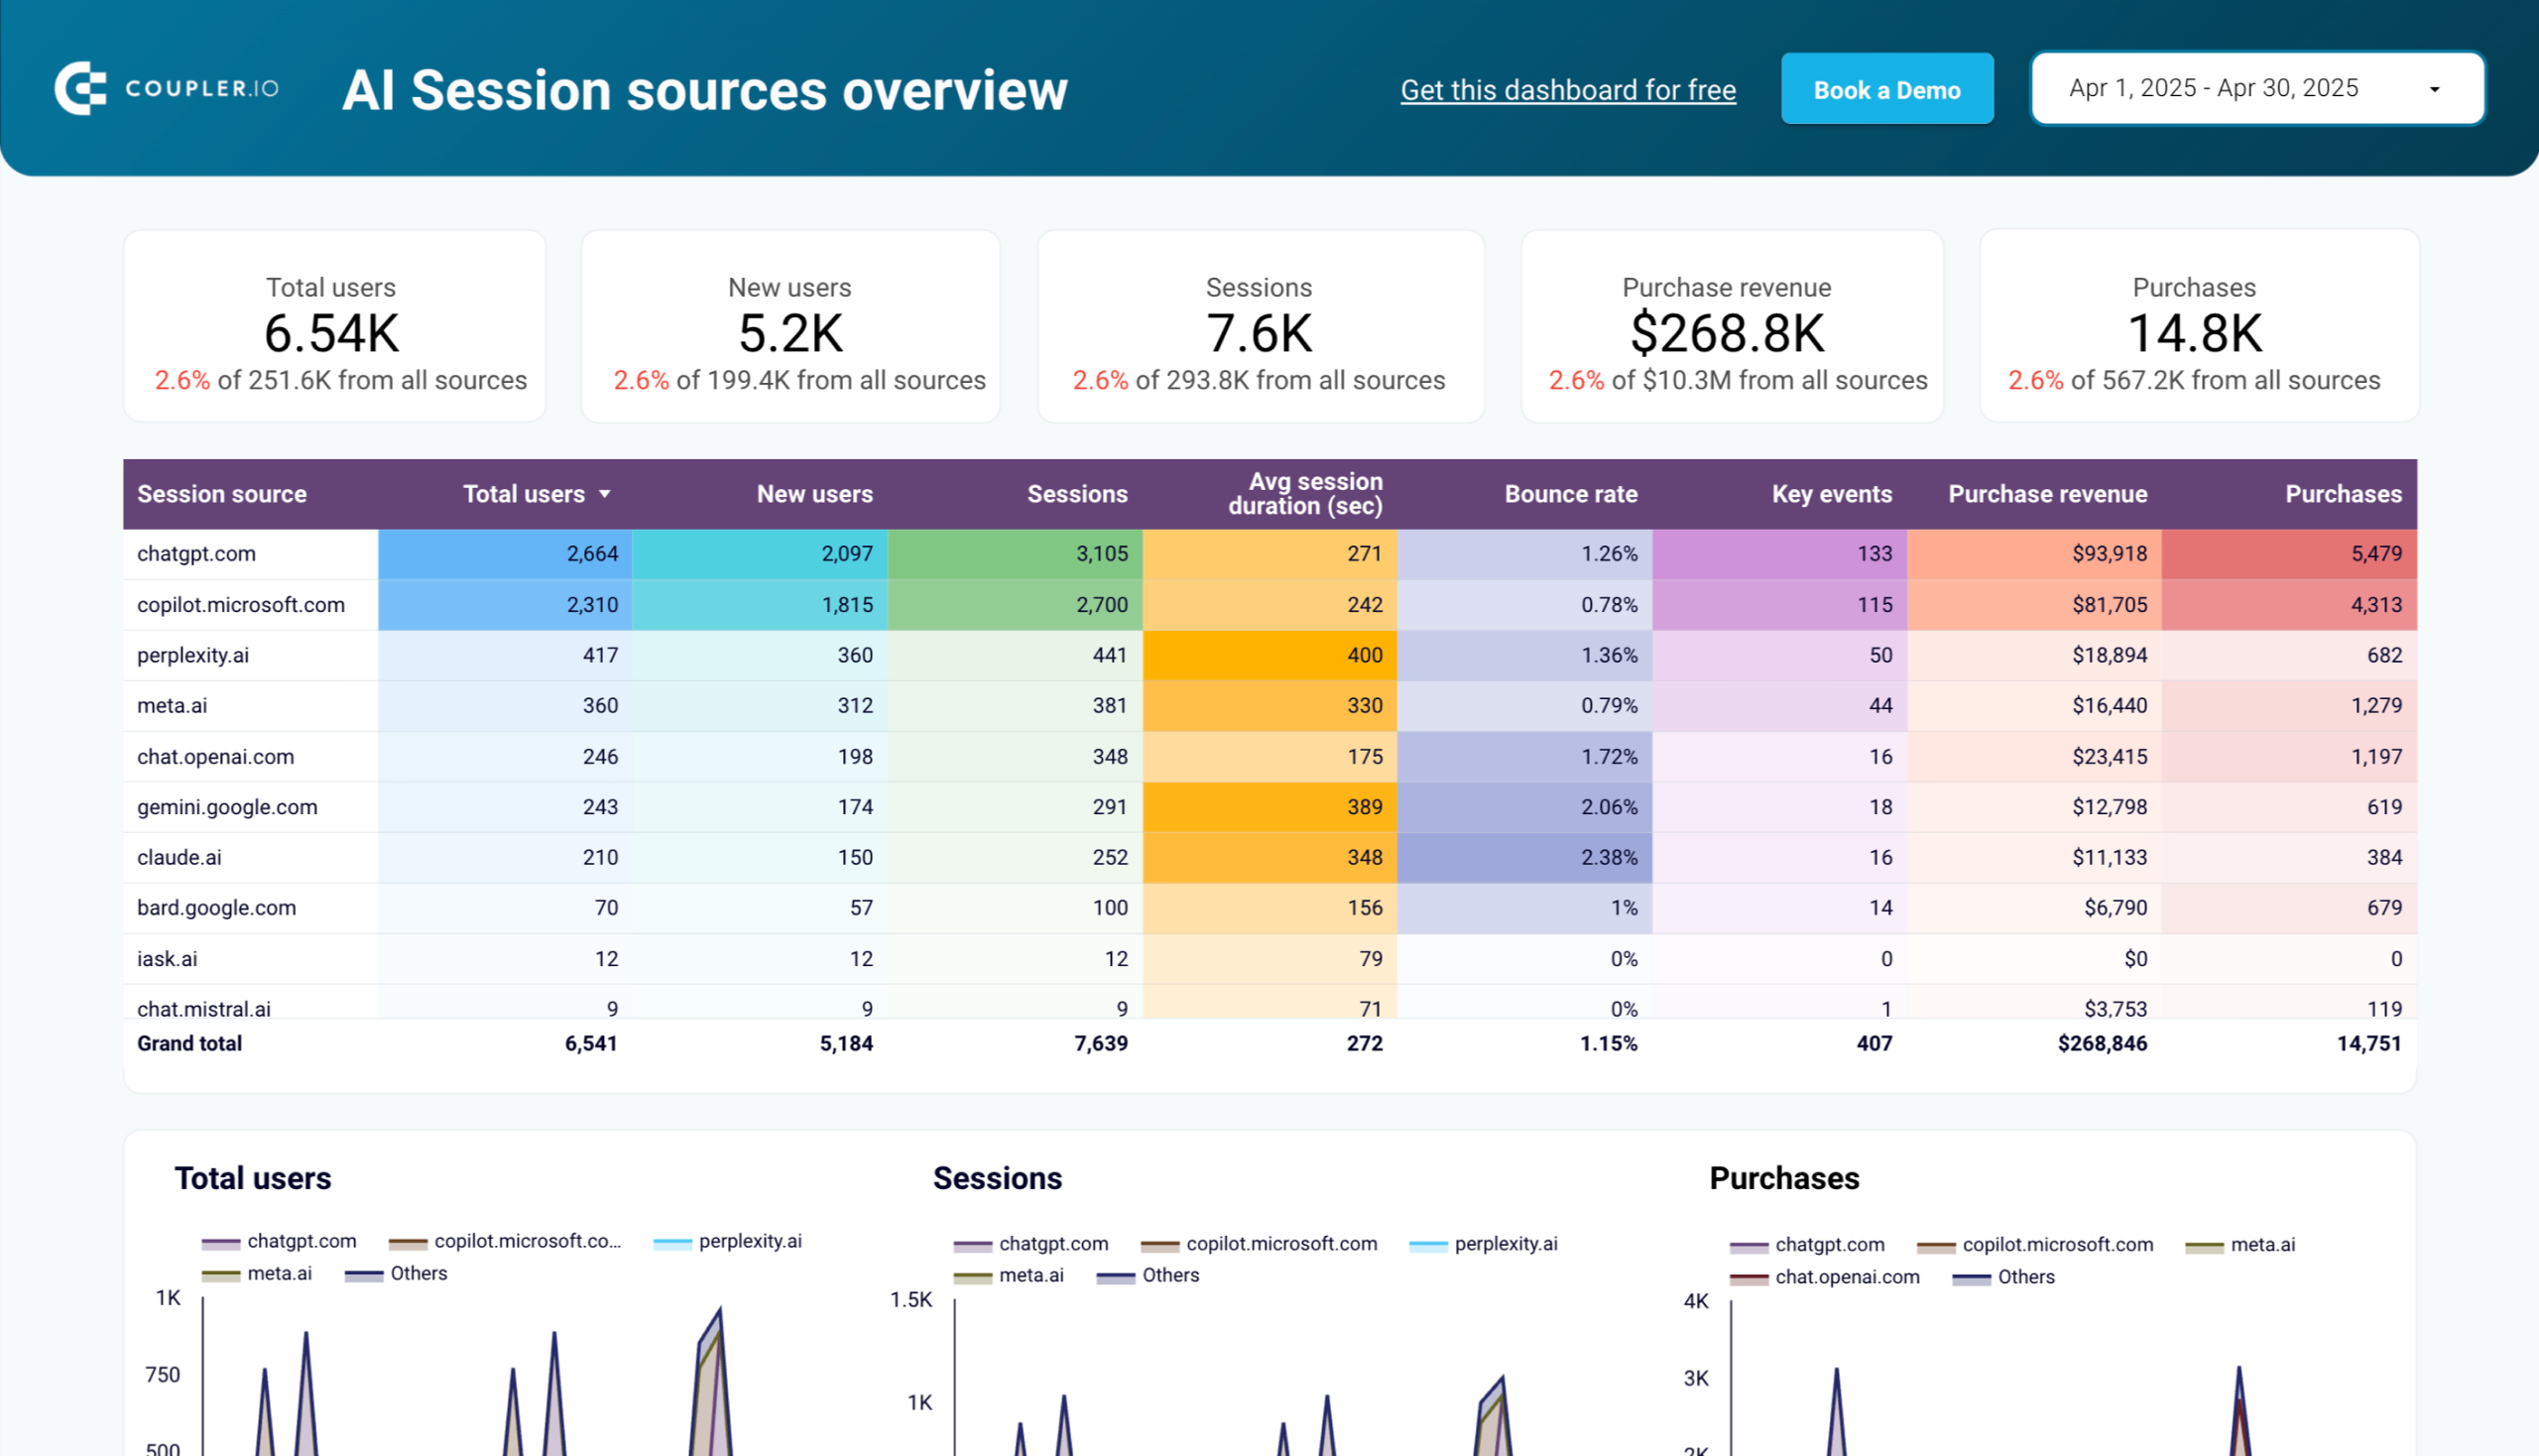
AI traffic performance dashboard
This dashboard provides focused insights into how AI tools like ChatGPT, Claude, and Perplexity are driving traffic to your website. Built in Google Sheets and Looker Studio, it automatically pulls data from GA4 to help you understand which AI platforms are delivering the most valuable visitors.
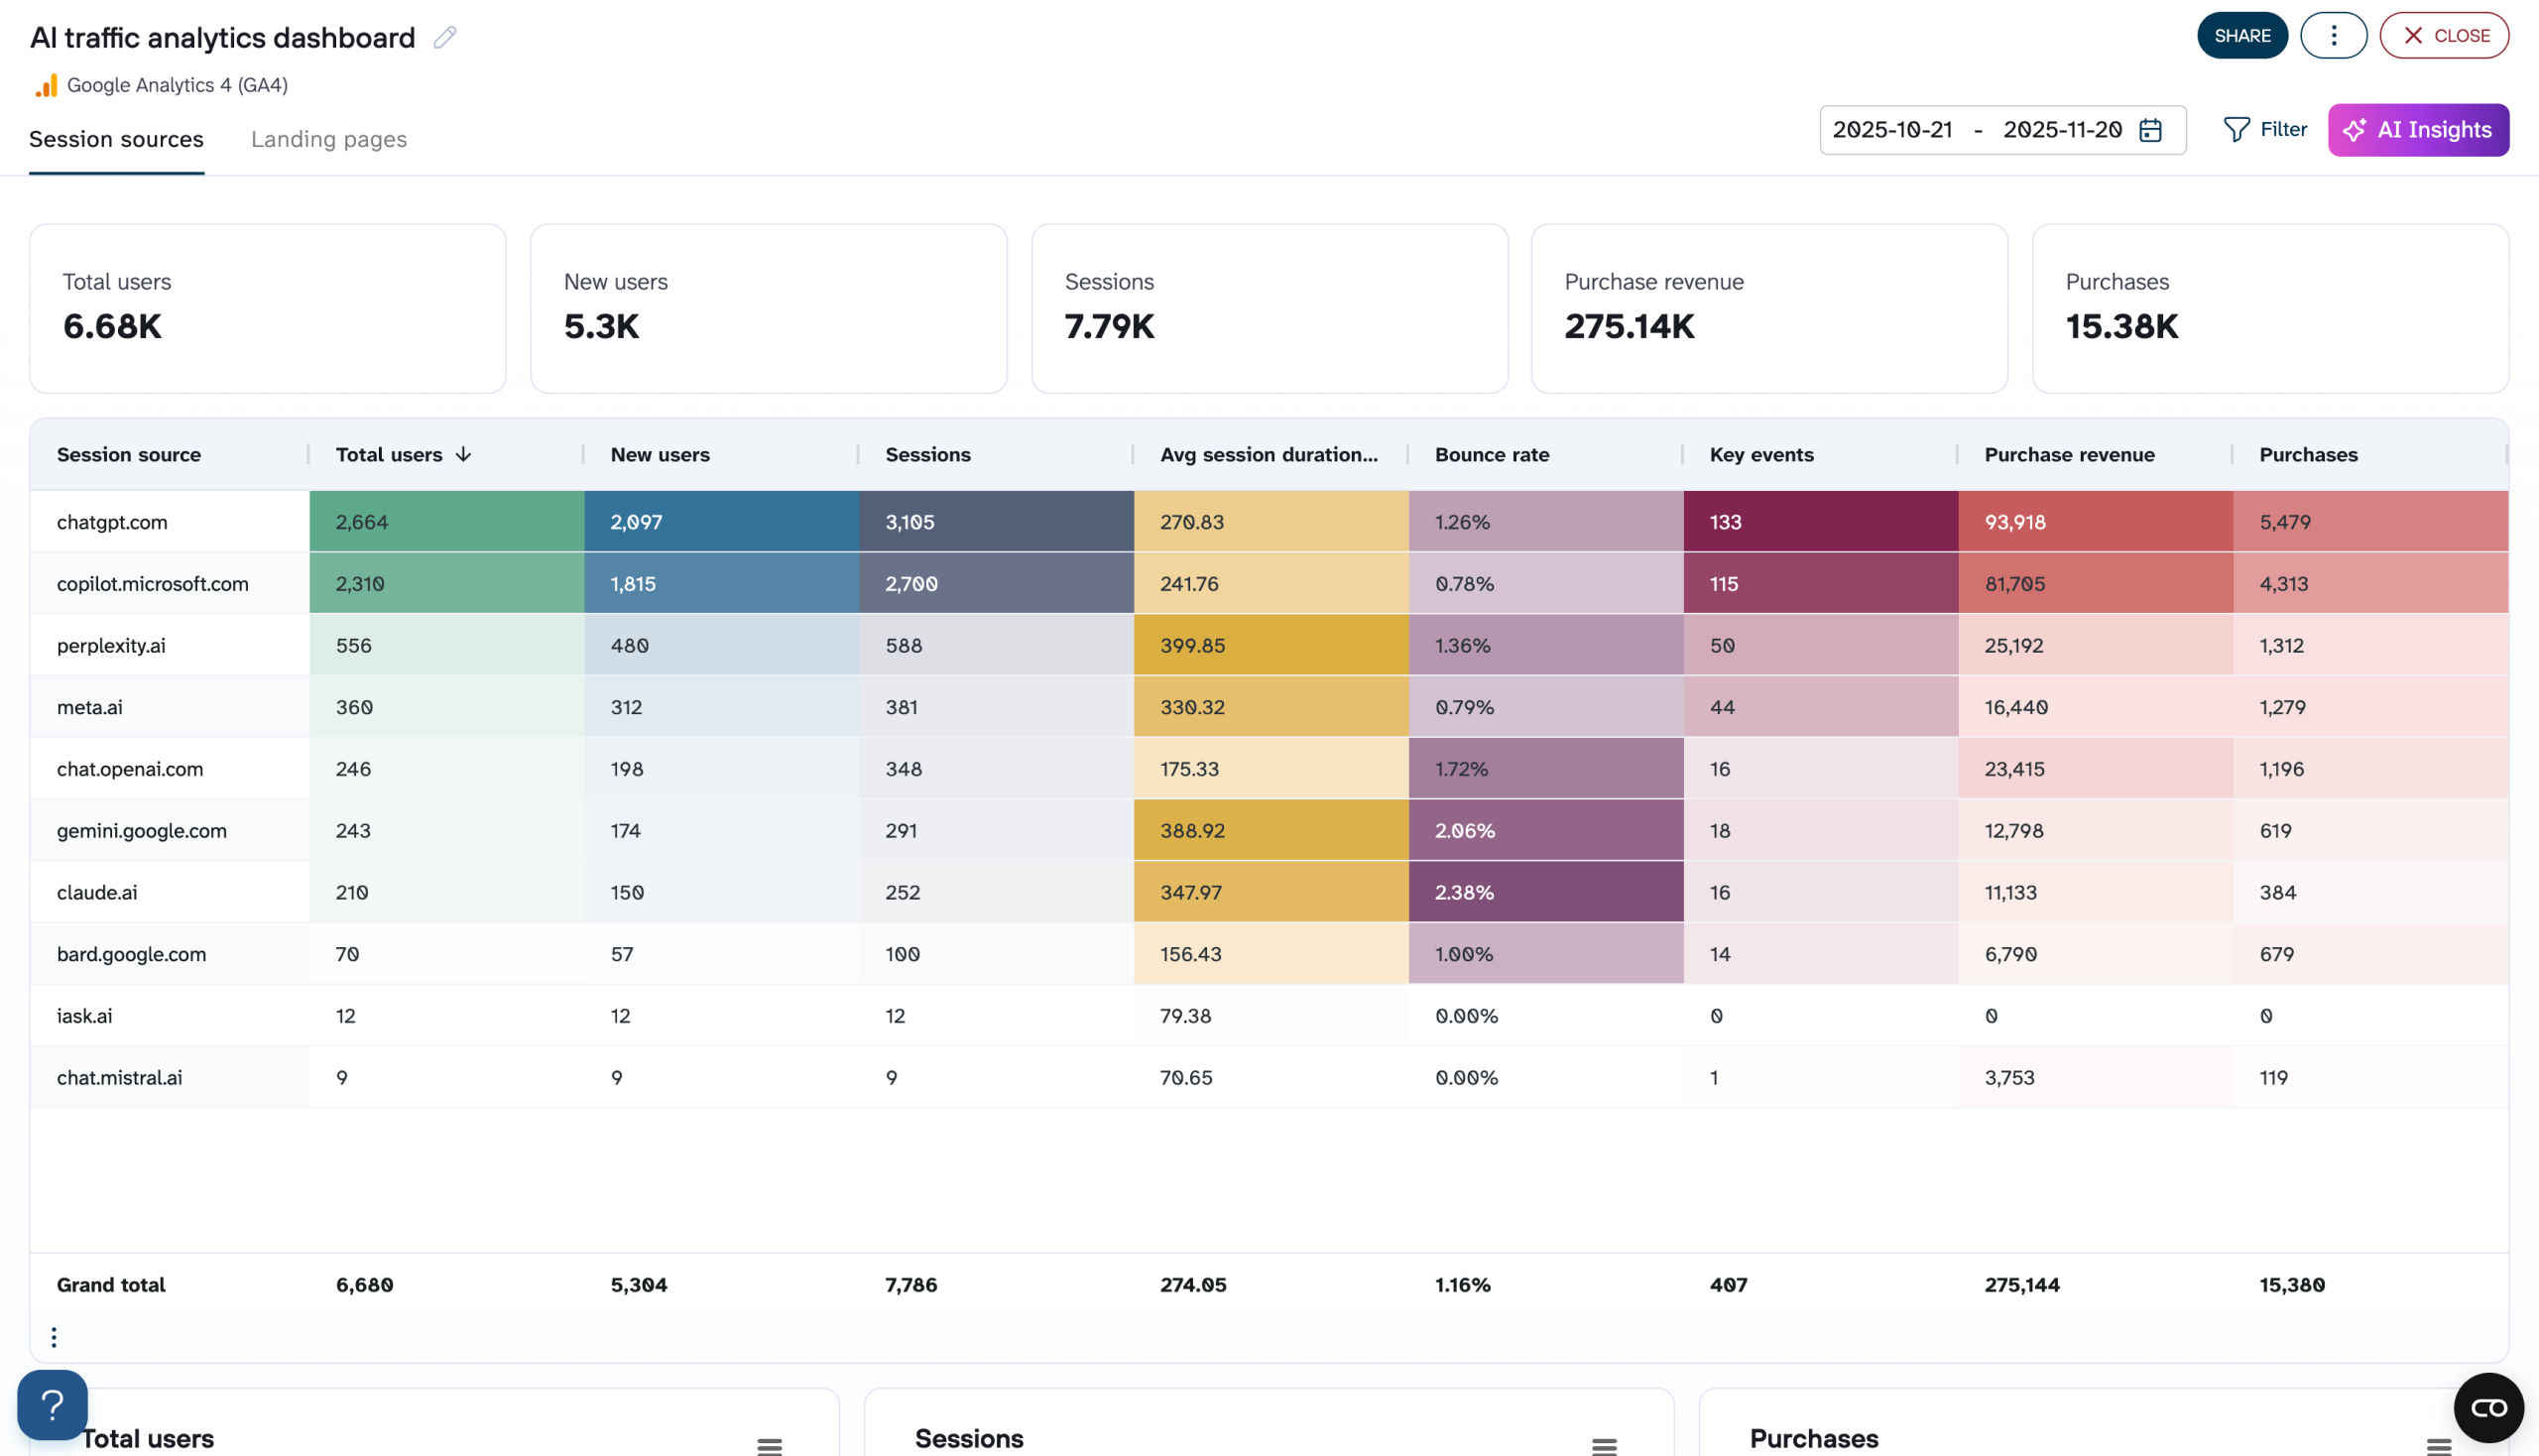
The dashboard is available in Coupler.io, as well as a template in Google Sheets and Looker Studio. Use the instructions to automate data load from GA4 using the Coupler.io connector and enjoy the live dashboard.
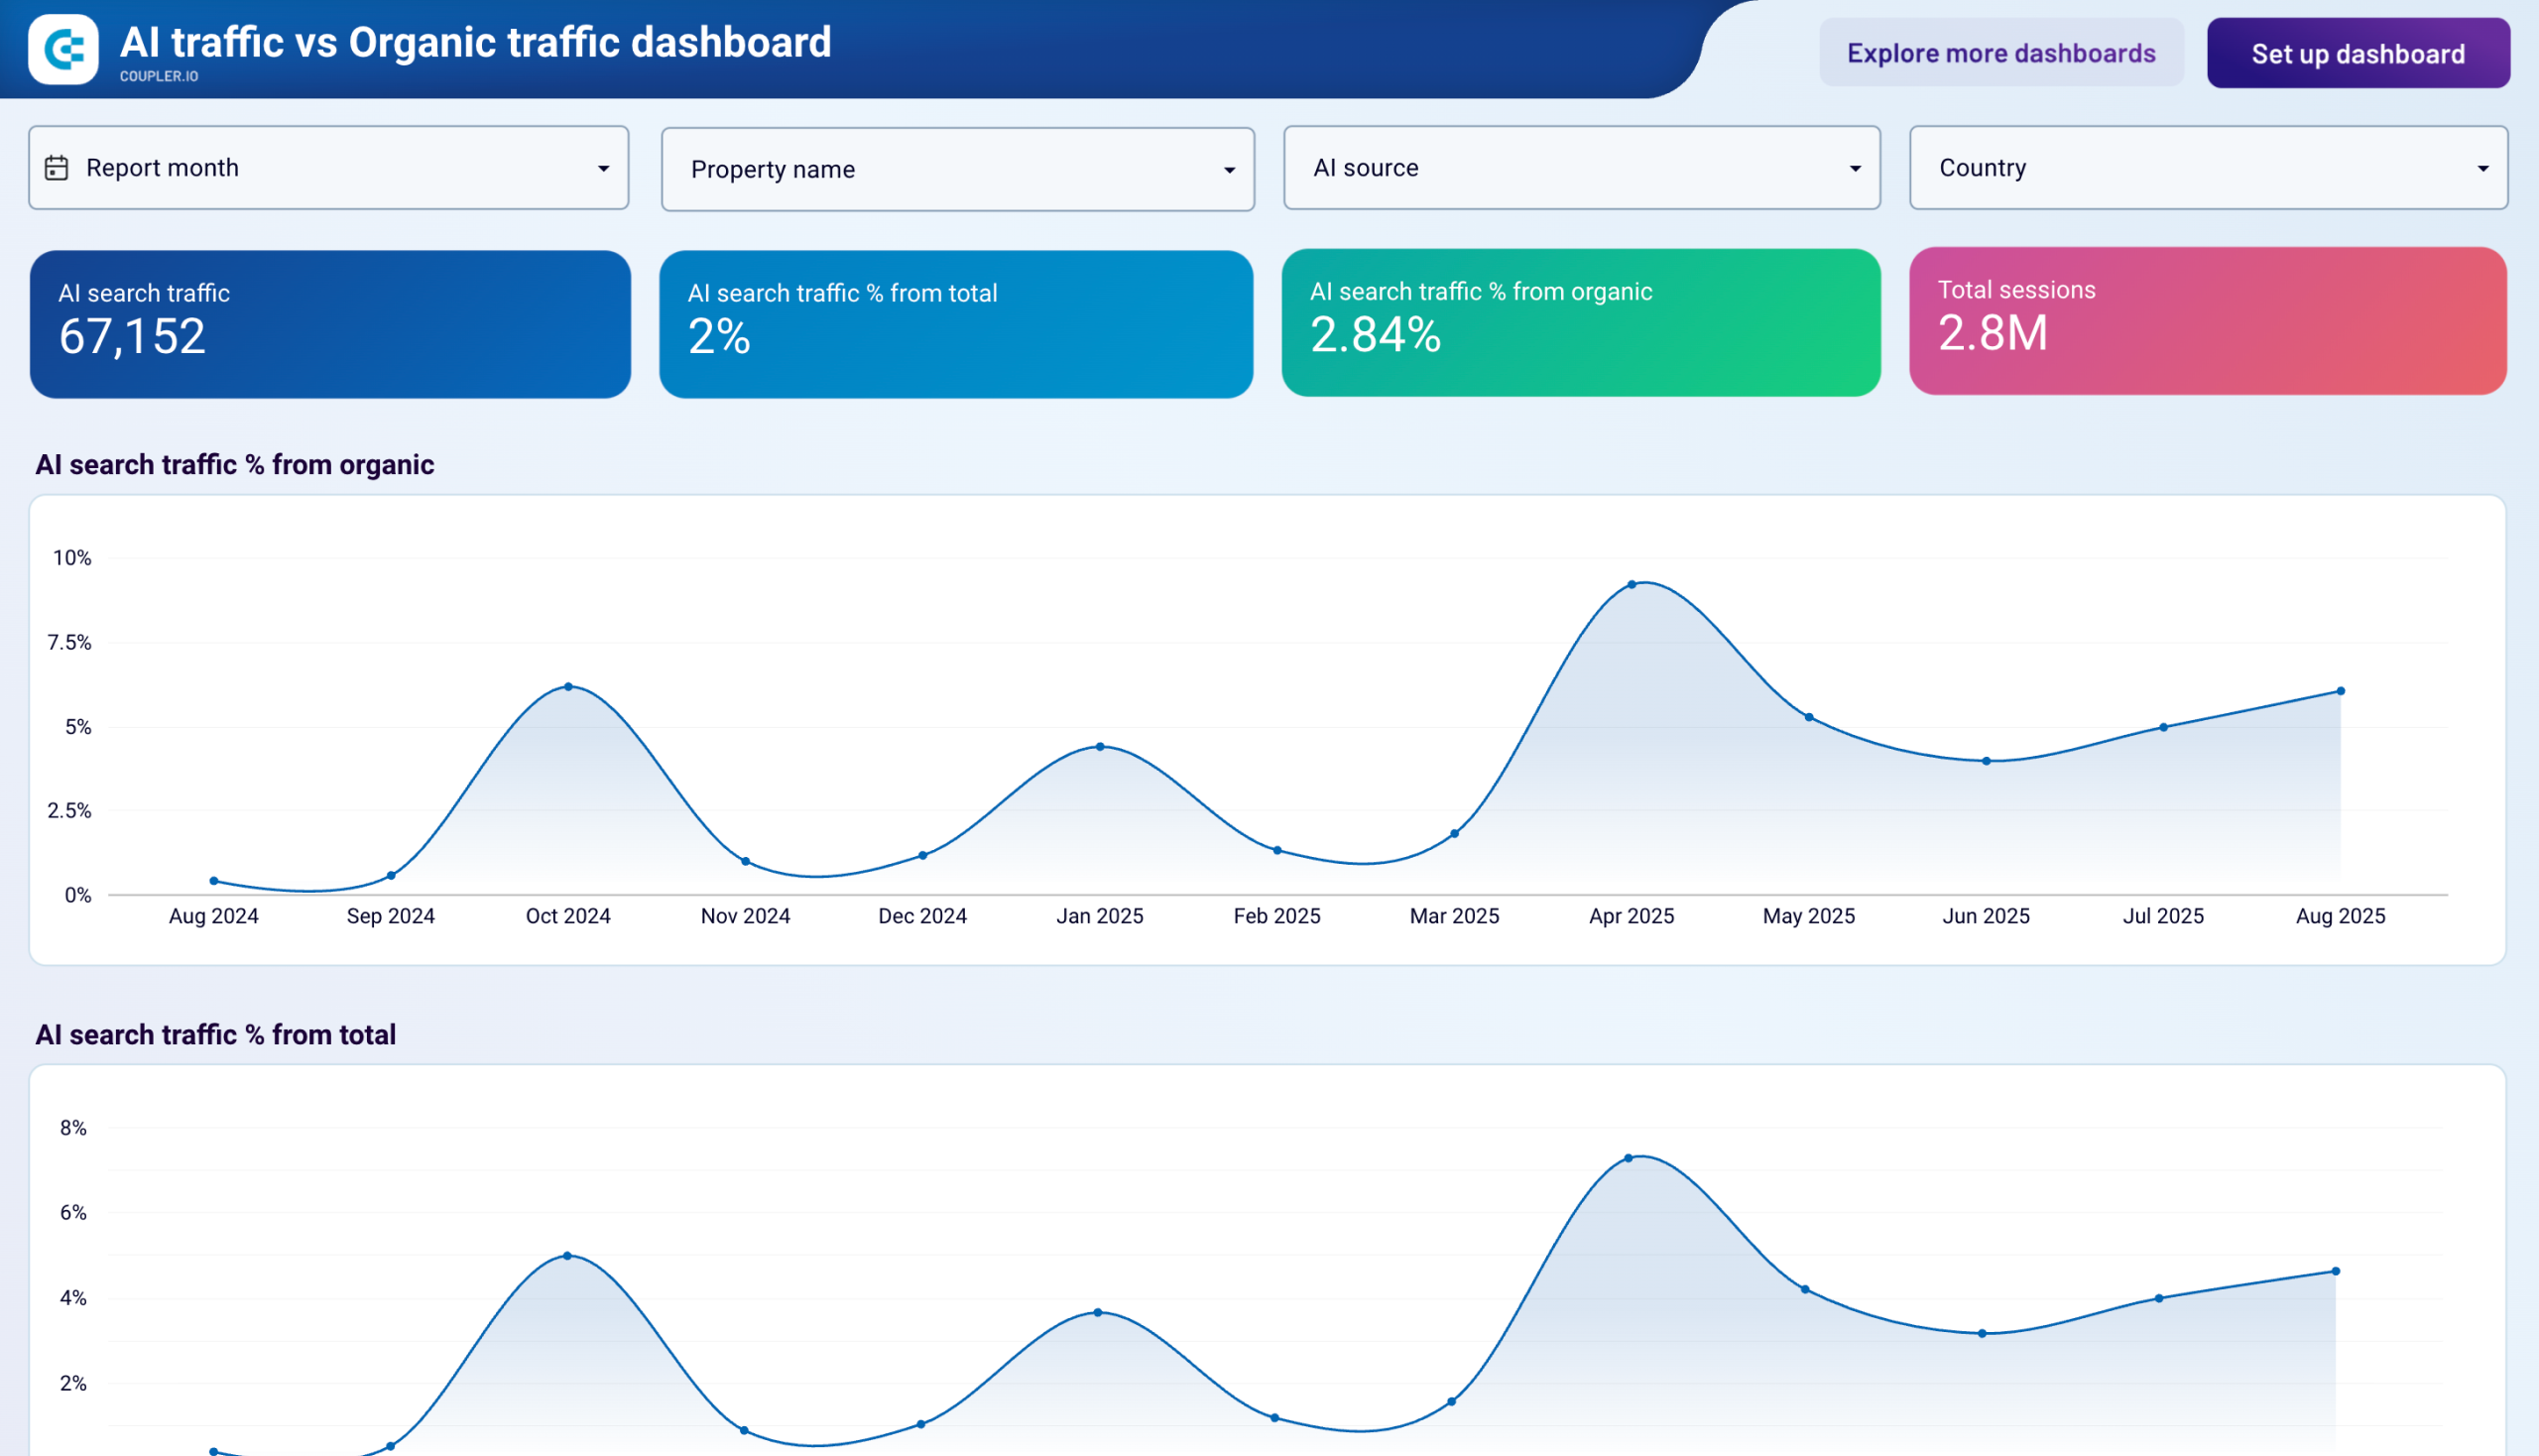
AI traffic vs Organic traffic dashboard
Understanding how AI-driven traffic compares to traditional organic search is becoming essential as AI tools like ChatGPT, Claude, and Perplexity change how users discover content. This dashboard provides the comparative analysis needed to make strategic decisions about content optimization priorities.
AI traffic vs Organic traffic dashboard
 Preview dashboard
AI traffic vs Organic traffic dashboard
Preview dashboardUse this dashboard to answer critical strategic questions: Should you shift resources from SEO to AEO? Are AI tools complementing your organic search strategy or competing with it? Which traffic source provides better ROI for your content creation efforts? As AI traffic continues to grow, this comparative analysis helps you stay ahead by understanding how these emerging sources perform relative to your established organic search strategy.
This dashboard is available as a Looker Studio template, automatically pulling comparative data from GA4 using the Coupler.io connector. The ‘Readme’ tab provides setup instructions and guidance on interpreting the comparative metrics.
How to export Google Analytics data manually from UI
We’ve covered the part about exporting Google Analytics 4 with Coupler.io. The automation is an advanced approach but we understand that it’s not always what you need. So, it’s time to export the native approach to Google Analytics data export.
Google Analytics 4 provides multiple reports for acquisition, engagement, monetization, and so on. To export reports, you need to find the Share this report button.
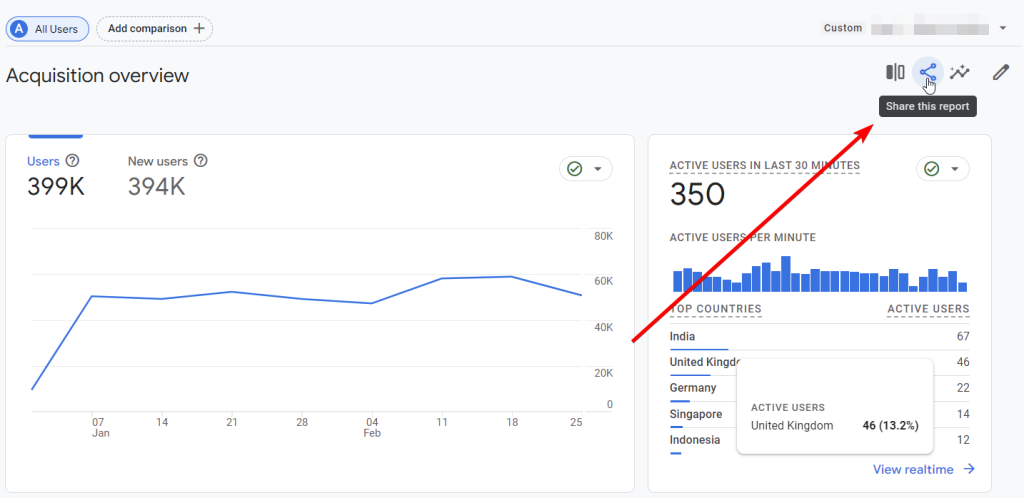
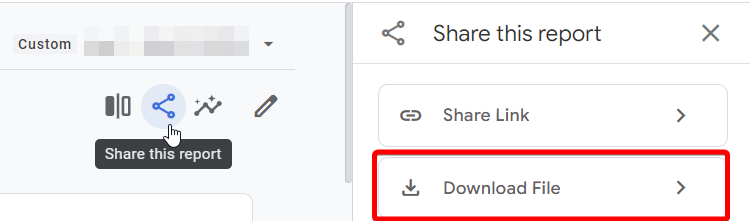
It will expand two options:
- Share Link – you can share the report with the users that have access to your property.
- Download File – you can export the report in different formats, such as PDF, CSV, or Google Sheets.
So, click Download File and pick the desired file format. For CSV and PDF, your file will be downloaded to your computer. For Google Sheets, it will open in a new tab.
Export exploration reports in GA4
For most of the reports that are not an overview, you will see the Export this report to analysis button next to the one for sharing it.
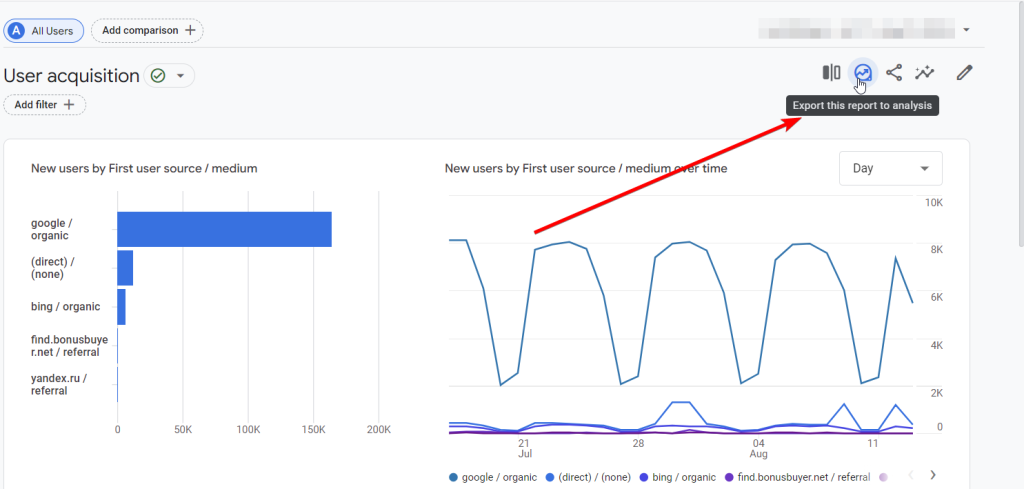
If you click it, your report won’t be downloaded or exported outside of Google Analytics. Instead, this will create a new exploration report that you can customize by adding metrics, dimensions, visualizations, etc.
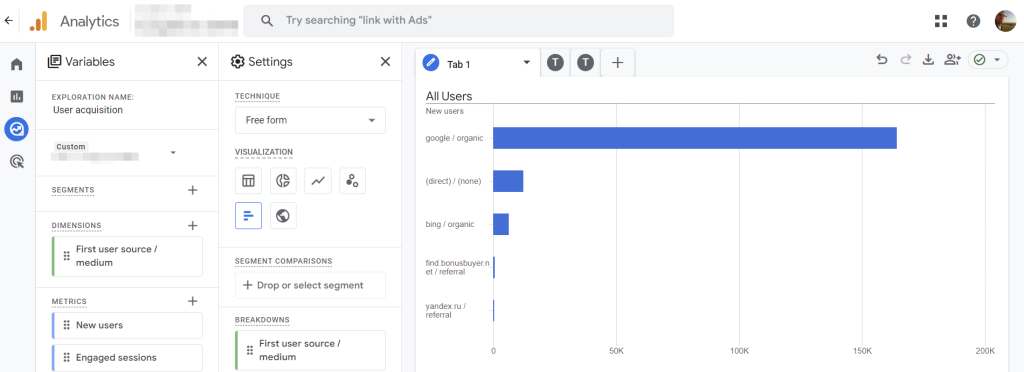
This report can later be exported. You need to click the Export data button and select the desired file format.
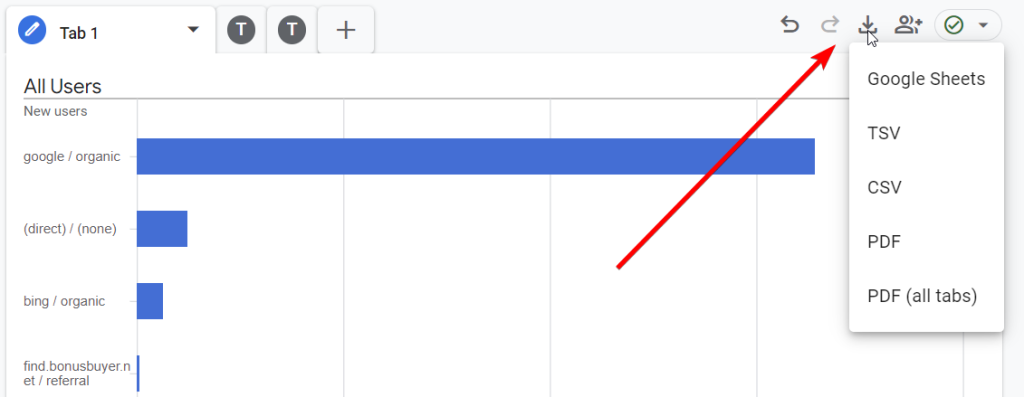
Keep in mind that exploration reports may contain several tabs, and you need to export each tab separately. Except for the case when you select PDF (all tabs).
What standard reports you can and cannot export from Google Analytics
| Report | Exportable |
|---|---|
| Reports snapshot | ? |
| Realtime overview | ? |
| Realtime pages | ? |
| Lifecycle reports | |
| Acquisition reports | ? |
| Engagement reports | ? |
| Monetization reports | ? |
| Retention report | ? |
| User reports | |
| User attributes reports | ? |
| Tech reports | ? |
| Games reporting | |
| Acquisition report | ? |
| Retention report | ? |
| Engagement reports | ? |
| Monetization report | ? |
| Other GA4 reports | |
| App developer | ? |
| Search console | ? |
How to export data from GA4 with BigQuery Links
Google Analytics 4 offers a straightforward way to export your data to BigQuery for backup and analytics. It’s called BigQuery Links or BigQuery Export and is accessible via the GA4 UI.
It’s not a scheduled or on-demand export of GA4 to BigQuery. With this method, you activate the daily stream of data from the analytics platform to the data warehouse. As a result, you get all data from your GA property to a separate table in BQ.
To connect GA4 to BigQuery using BigQuery Links, make sure that:
- You’re logged into a GA account with Owner access to the relevant BigQuery project.
- Your GA account has Editor-level or higher access to the property whose data you wish to export.
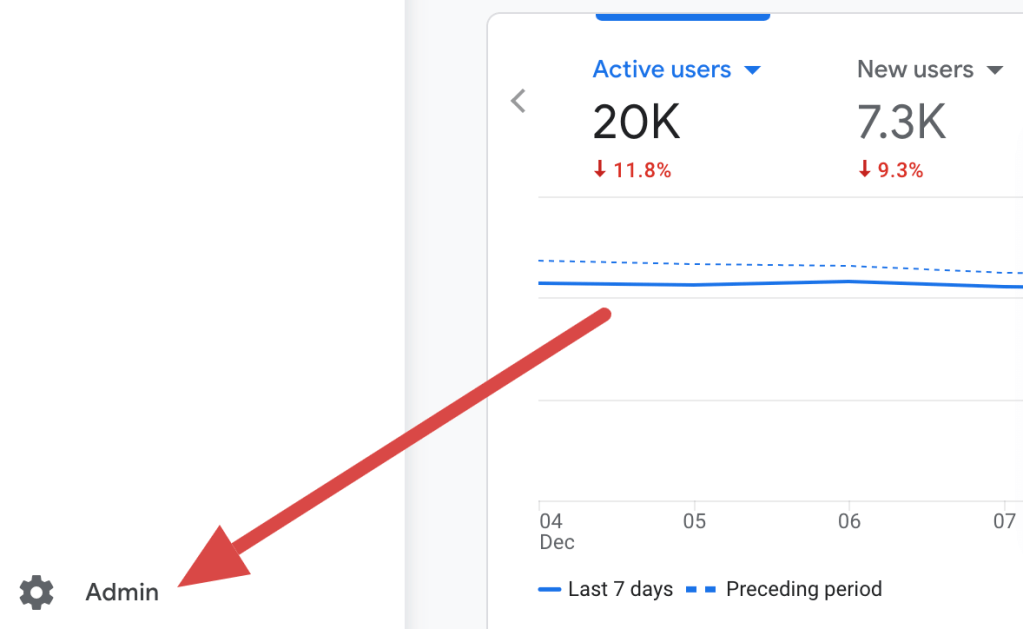
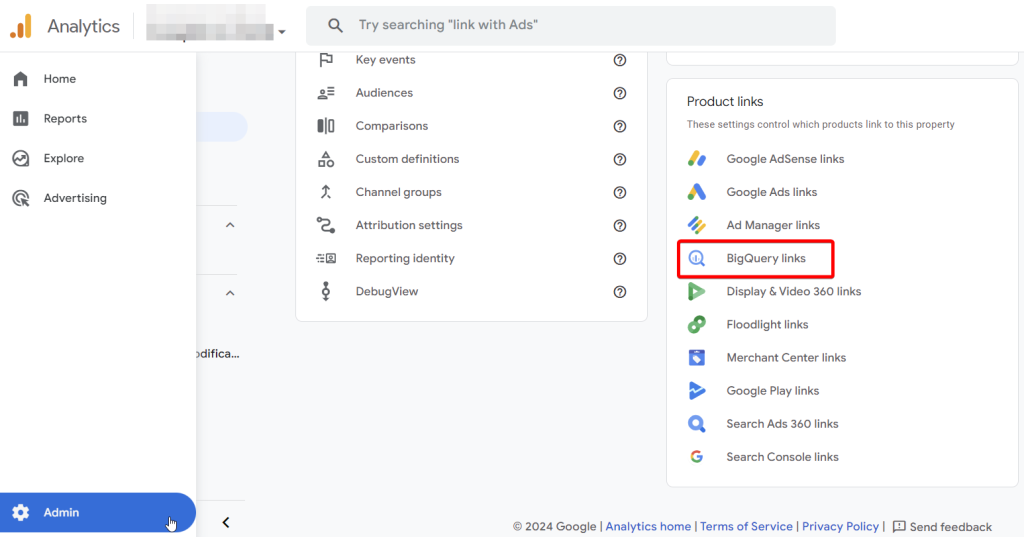
- Then, in your GA4 account, click the Admin gear icon at the bottom-left corner.
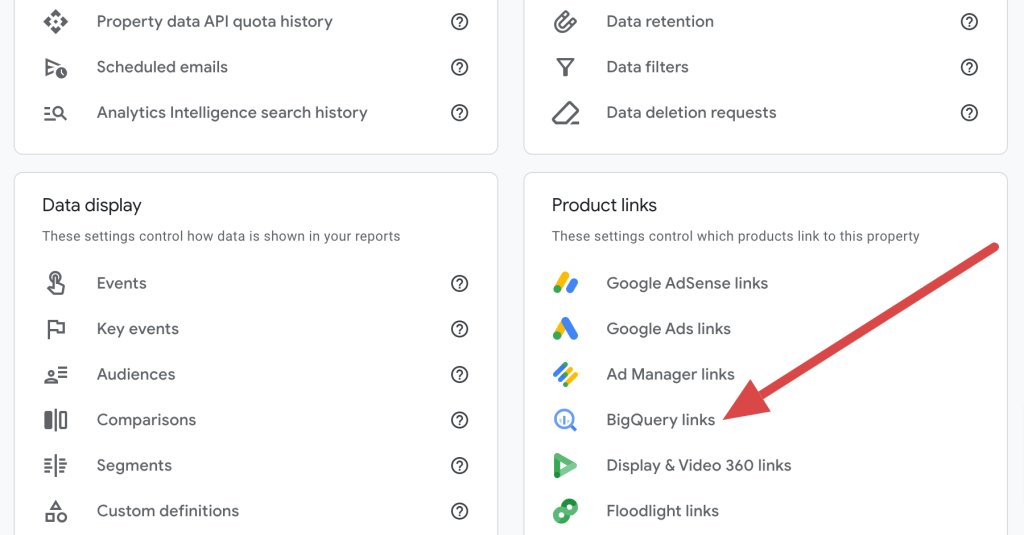
- Scroll down to the Product Links section and select BigQuery Links.
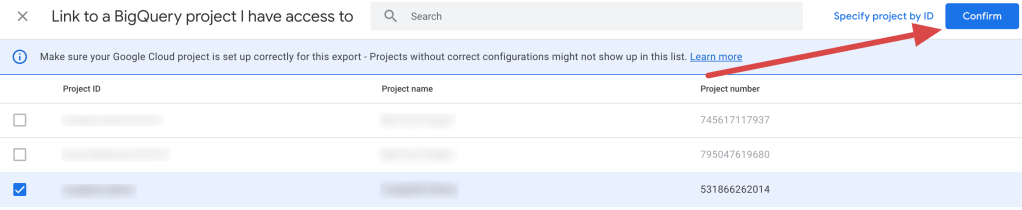
- Click the Link button on the right. Next, select the BigQuery project where you want to export the data, tick the box for the chosen project, and confirm your selection.
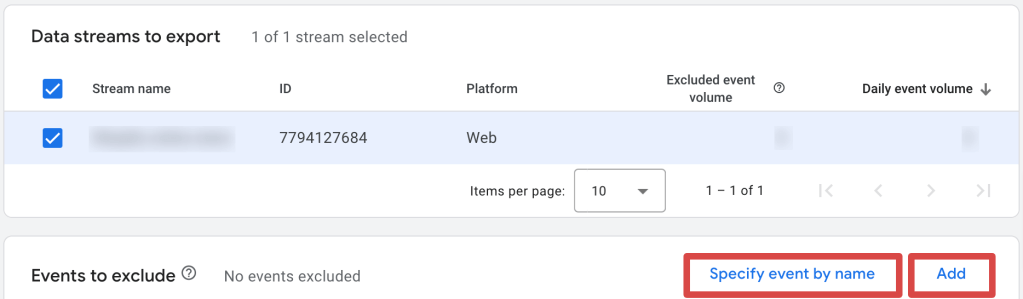
- Specify the Data location and click Next. Then decide which data streams to include in the export and identify any specific events to exclude.
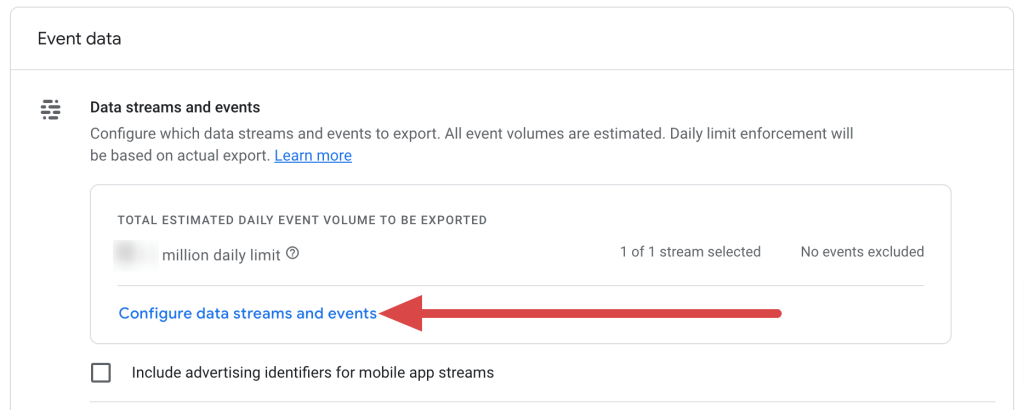
- To exclude events, click Add and select from existing ones. Alternatively, choose Specify event by name to exclude events by name or preemptively define event names not yet collected.
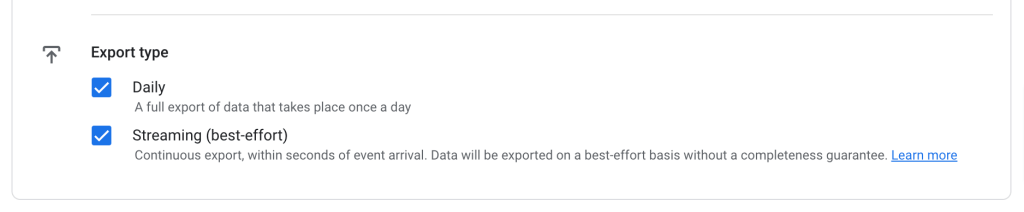
Once you’ve configured the streams and exclusions, click Apply in the top right and proceed to choose the export type for event data:
- Daily Export: Transfers all data from the previous day, typically in the afternoon or the following day. A table named
events_YYYYMMDDis generated. This option is useful for complex queries like user attribution. - Streaming Export: Provides near real-time data (updated within minutes) in a table named
events_intraday_YYYYMMDD. The intraday table is deleted once the daily table is complete. Streaming isn’t ideal for queries targeting specific dates due to its exclusions (e.g., new user/session traffic source data).
For Analytics 360 users, there is one more option available – Fresh Daily Export. It offers faster updates, with data usually available by 5 a.m. and further updates arriving throughout the day.
Click Next to review the configuration details, then press Submit to finalize the setup. Once completed, your BigQuery link will be active, and GA4 data will start exporting according to your selected settings.
Google Analytics export FAQs
Can Google Analytics export all data?
If you use Coupler.io for data export, you need to select metrics and dimensions to include in your custom report. The manual export from GA4 only allows you to export reports. And is it possible to export all the data from Google Analytics? Yes, if your data destination is BigQuery.
GA4 provides a direct connection to this data warehouse – BigQuery links also known as BigQuery Export. You can find it under the Product links section of the Admin panel.
To use it, you need a BigQuery project with the BigQuery API enabled. You can learn more about this and the steps to complete the connection in our article about data export from Google Analytics to BigQuery.
Can you still export data from Google Analytics Universal?
Unfortunately, you can’t. July 1, 2024, was the last day you had access to Universal Analytics data in the interface, API, and through the advertiser, publisher, or other product integrations. So, if you haven’t downloaded your data before this deadline, you’ve lost it.
Google Analytics Universal stopped processing new data. The new king, Google Analytics 4, has ascended to the throne.
Where you can export data from Google Analytics
Spreadsheet apps
Exporting data to spreadsheet apps is a good option to quickly share insights from GA4 with your teammates or other stakeholders.
Options for export
- Coupler.io supports Google Sheets and Microsoft Excel as destinations. You won’t need to download or upload the files. Just select the desired files on GDrive or OneDrive and automate data refresh with a few clicks.
- Alternatively, you can manually export GA4 data to Google Sheets or download it as a CSV file to your computer.
Data warehouses
Exporting GA4 data to a data warehouse allows you to back up and centralize your analytics data. This option is good for advanced analysis and integration with other business tools.
Options for export
- Google Analytics can be natively integrated with BigQuery for daily streaming.
- With Coupler.io, you can customize exports to BigQuery. This includes the selection of metrics/dimensions, filtering & sorting, aggregation, and merging data with information from other sources. Moreover, the supported data warehouses include BigQuery, Amazon Redshift, and PostgreSQL. You can automate exports of Google Analytics data to any of these destinations without coding.
BI tools
Loading GA4 to a BI tool is required for creating custom reports and dashboards such as Google Analytics reports for clients in Looker Studio.
Options for export
With Coupler.io, you can connect GA4 to a few data visualization tools including Looker Studio, Power BI, Tableau, and Qlik. This option works well for advanced data reporting since you can create interactive dashboards based on GA4 data. Moreover, Coupler.io provides white-label dashboard templates, some of which we’ve introduced earlier in the article.
Learn more how to connect Google Analytics 4 to Tableau.
Other destinations
Coupler.io also allows you to export your GA4 data as a cloud-based JSON file. This way, you can share your information in JSON format, which can be used for other apps.
The last available destination option is Monday.com. Connect your GA4 account to it if you want to automate data exports to this project management platform.
Is it worth using Google Analytics API for exporting data?
Let me be honest. Yes, Google Analytics provides the API for exporting data. If you’re a seasoned data analyst or software engineer, you’d probably have no issues with creating and maintaining a custom GA4 integration. On the other hand, were you one of these persons, you’d unlikely read my words here now ?
If you have the resources to create an integration that will load data from Google Analytics to your destination, I’m happy for you.
If you don’t, I can only advise try Coupler.io. It rests on the Google Analytics API but no coding is involved. You only need to connect your account, select the metrics & dimensions, and specify where to export data from GA4. It supports multiple destinations and lets you connect Google Analytics 4 with Looker Studio, Power BI, Google Sheets, and more.
And that’s not all. Having this reporting automation tool means that you can create cross-app reports. For instance, export data from Google Search Console and join it with information from GA4 to create a self-updating SEO performance report. Put your doubts aside and get started with Coupler.io for free.

Automate GA4 data export with Coupler.io
Get started for free