Mondays are the worst weekday for me historically but I could not understand why. However, after the analysis of my Google Calendar, it turned out that Monday was the weekday with the biggest number of meetings. So, now I try to balance meetings along other weekdays and make Mondays less clogged with calendar events.
This is just one insight, however, you can derive more. Proper Google Calendar analytics will help you assess your time and improve your productivity based on these insights. Our guide is just about that – how you can analyze your calendar data to reach a so-called work-life balance.
What are the options to analyze Google Calendar data?
You can analyze Google Calendar data in 4 different ways:
- Custom Google Calendar dashboard templates by Coupler.io
Coupler.io offers predesigned report templates to provide time insights into your schedule. They have a built-in connector to load information about your Google Calendar events and meetings. The templates are free, and you can get them up and running in a couple of minutes.
- Time Insights
It’s a built-in Google Calendar feature that displays insights into your calendar meetings in the form of a few charts.
- Calendar analytics extension
It’s a free Chrome extension that allows you to analyze your time and access your team’s internal and external meeting insights.
- Custom-made report with Coupler.io
You can create a custom analytics report in Google Sheets based on your Google Calendar data. For teams using AI assistants, there’s also the Google Calendar MCP that enables direct calendar analysis through natural language conversations in Claude or ChatGPT.
However, which option should you choose? Well, I’ll demonstrate each of them in turn and then you can decide what works best for you. Let’s go!
Google Calendar analytics with dashboard templates
1. Your last 12-month Google Calendar dashboard in Looker Studio
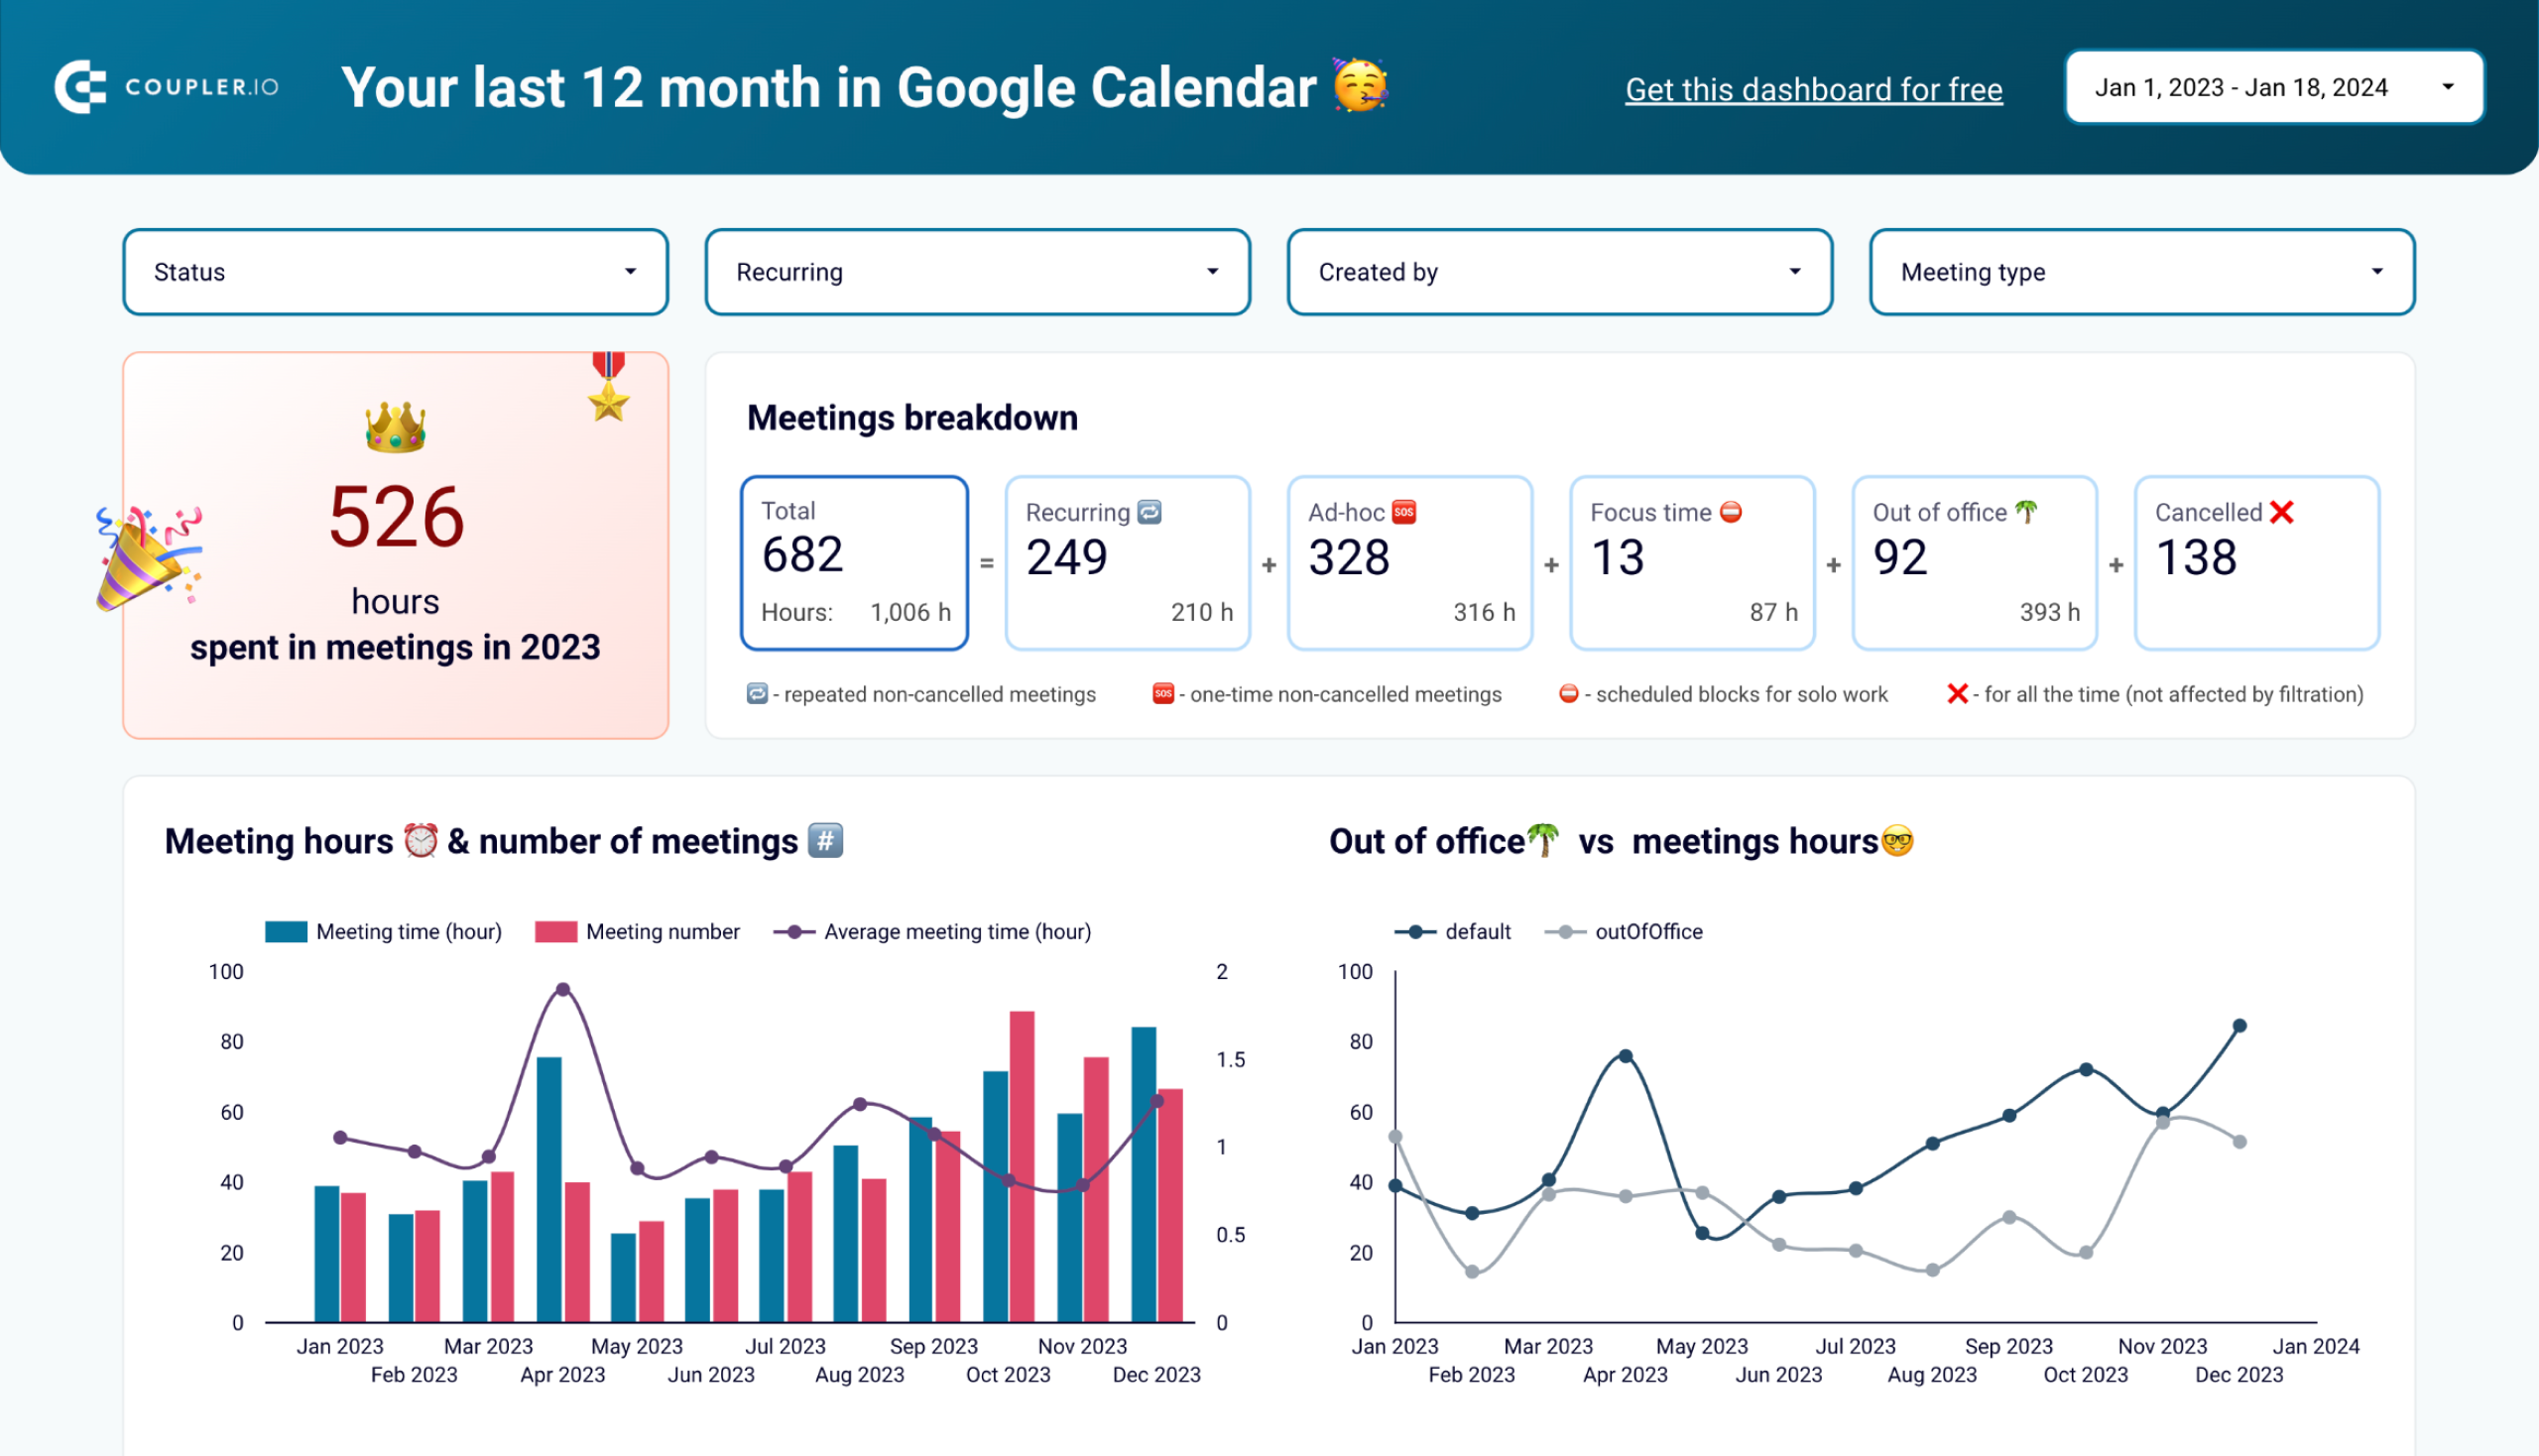
The dashboard allows you to get a recap of scheduling for the last 12 months. This date range is set by default but you can easily tune it if necessary.
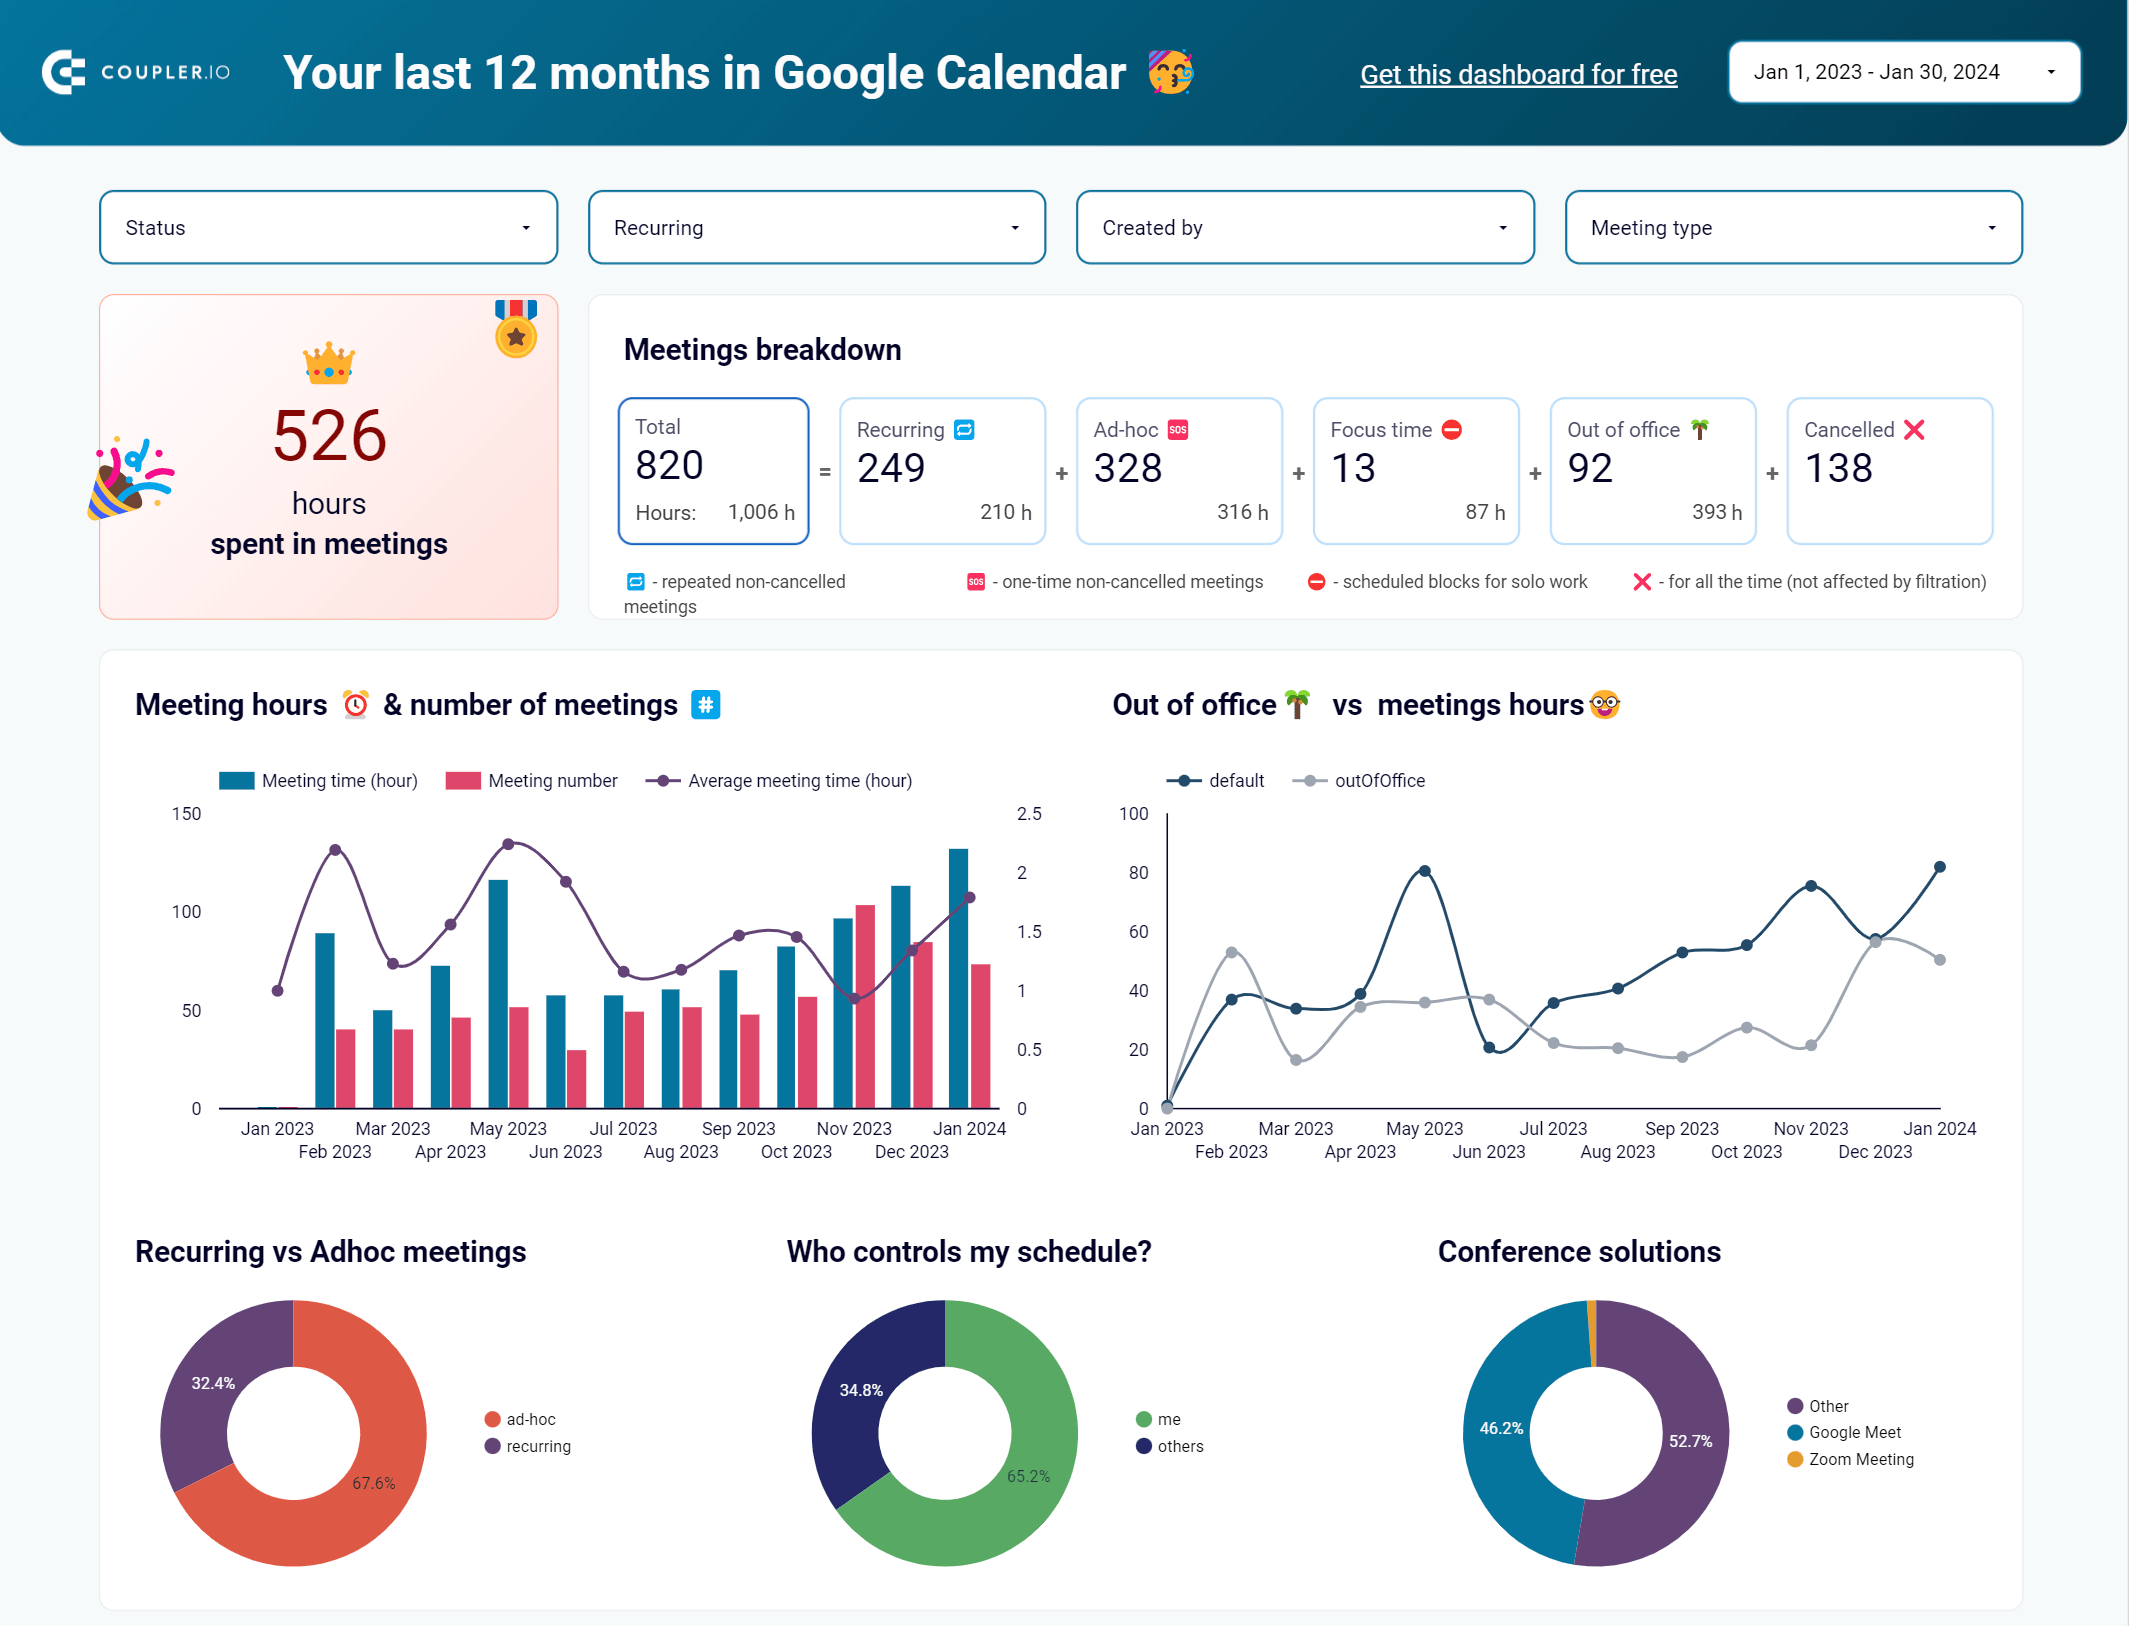
What you can learn from this Google Calendar analytics dashboard
This recap includes the following calendar analytics insights:
- How much time you spent in meetings
The dashboard tells you how much time you spent in meetings for the specified period. In addition, you get an understanding of what types of meetings these were: recurring or ad-hoc, scheduled focus time, time out of the office, and canceled meetings.
- How many meetings you have had throughout the year
Next, you’ll see a section with insights into your meeting scheduling throughout the year. You will see the average meeting time, as well as the comparison of out-of-office time vs. meeting hours.
In addition to this information, you will find charts with the meeting hours split by the day of the month and the weekday.
- Who created most of the meetings on your calendar
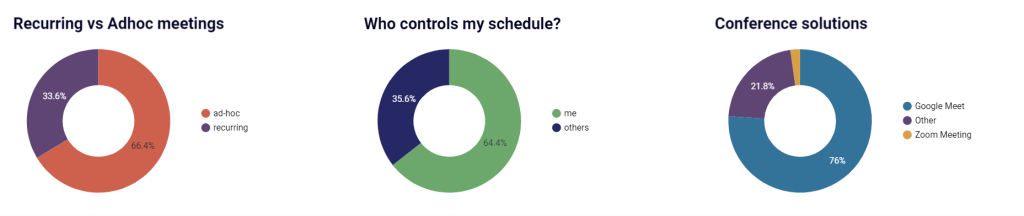
This section provides three pie charts dedicated to:
- The ratio of recurring to ad-hoc meetings
- Who has the biggest influence on your meeting scheduling – you or your team members.
- Top conference tools like Google Meet, Zoom, Slack, etc.
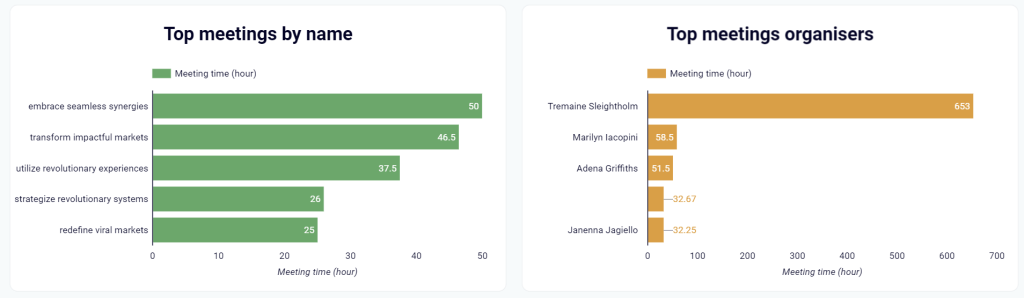
- Top meetings by name and top meeting organizers
Top meetings by name and top meeting organizers are also available on the dashboard.
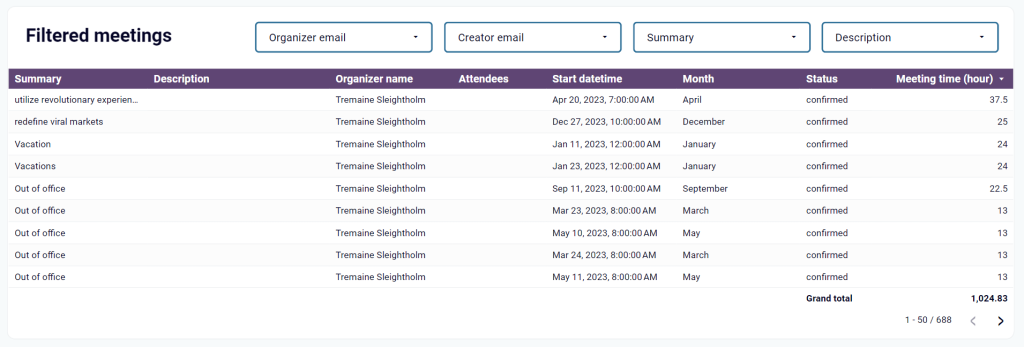
At the bottom of the calendar dashboard, you’ll see a table with meeting details and a few filters to apply (organizer, creator, meeting name, and description).
How to start using the Google Calendar analytics dashboard
The Google Calendar dashboard template is designed in Looker Studio and is easily connected to your Google Calendar thanks to the built-in Coupler.io connector. To start using the dashboard, follow the instructions on the Readme page. You’ll be offered to create a free Coupler.io account (no credit card required) and connect your Google calendars to load data from.
Note: the Google Calendar dashboard loads the data for the last 12 months by default. If you want to change this default parameter, click Edit and specify the required data range in the Basic settings.
In a moment, you will be redirected to the dashboard copy populated with your Google Calendar analytics data. The dashboard will be updated automatically every day by default. If you want to change this value, go back to Coupler.io and tweak the schedule to your liking.

With the help of this Google Calendar analytics dashboard, I learned that I spent 387 hours in meetings in 2024. This is almost 16 days (387/24) I spent talking or listening to other people talking.
The next step I’m gonna do is to make sure that this time was spent effectively. Maybe instead of a 30-minute conversation, it would have been more feasible to have a chat in Slack or another messenger.


2. Google Calendar availability & meeting hours dashboard in Google Sheets
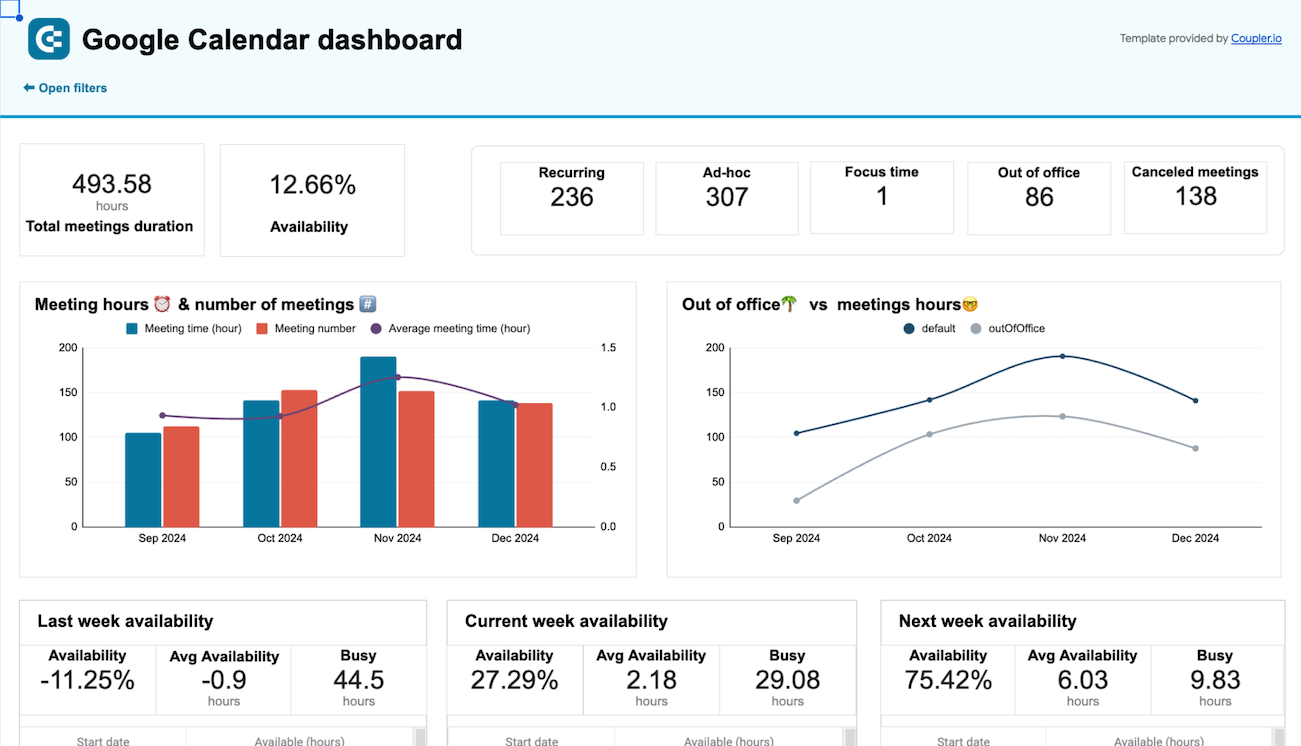
With this dashboard, you can derive insights into your meeting hours and the availability of your calendar. It provides an overview of your schedule to balance your available time.
Google Calendar availability & meeting hours dashboard
 Preview dashboard
Google Calendar availability & meeting hours dashboard
Preview dashboardWhat you can learn from this Google Calendar analytics dashboard
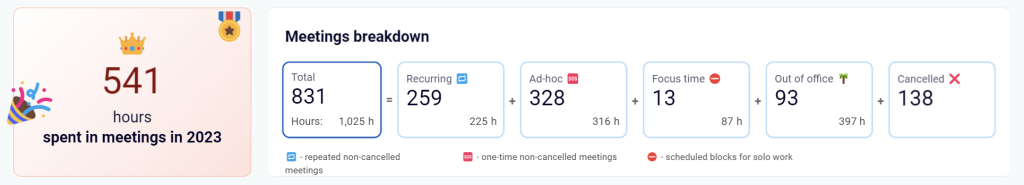
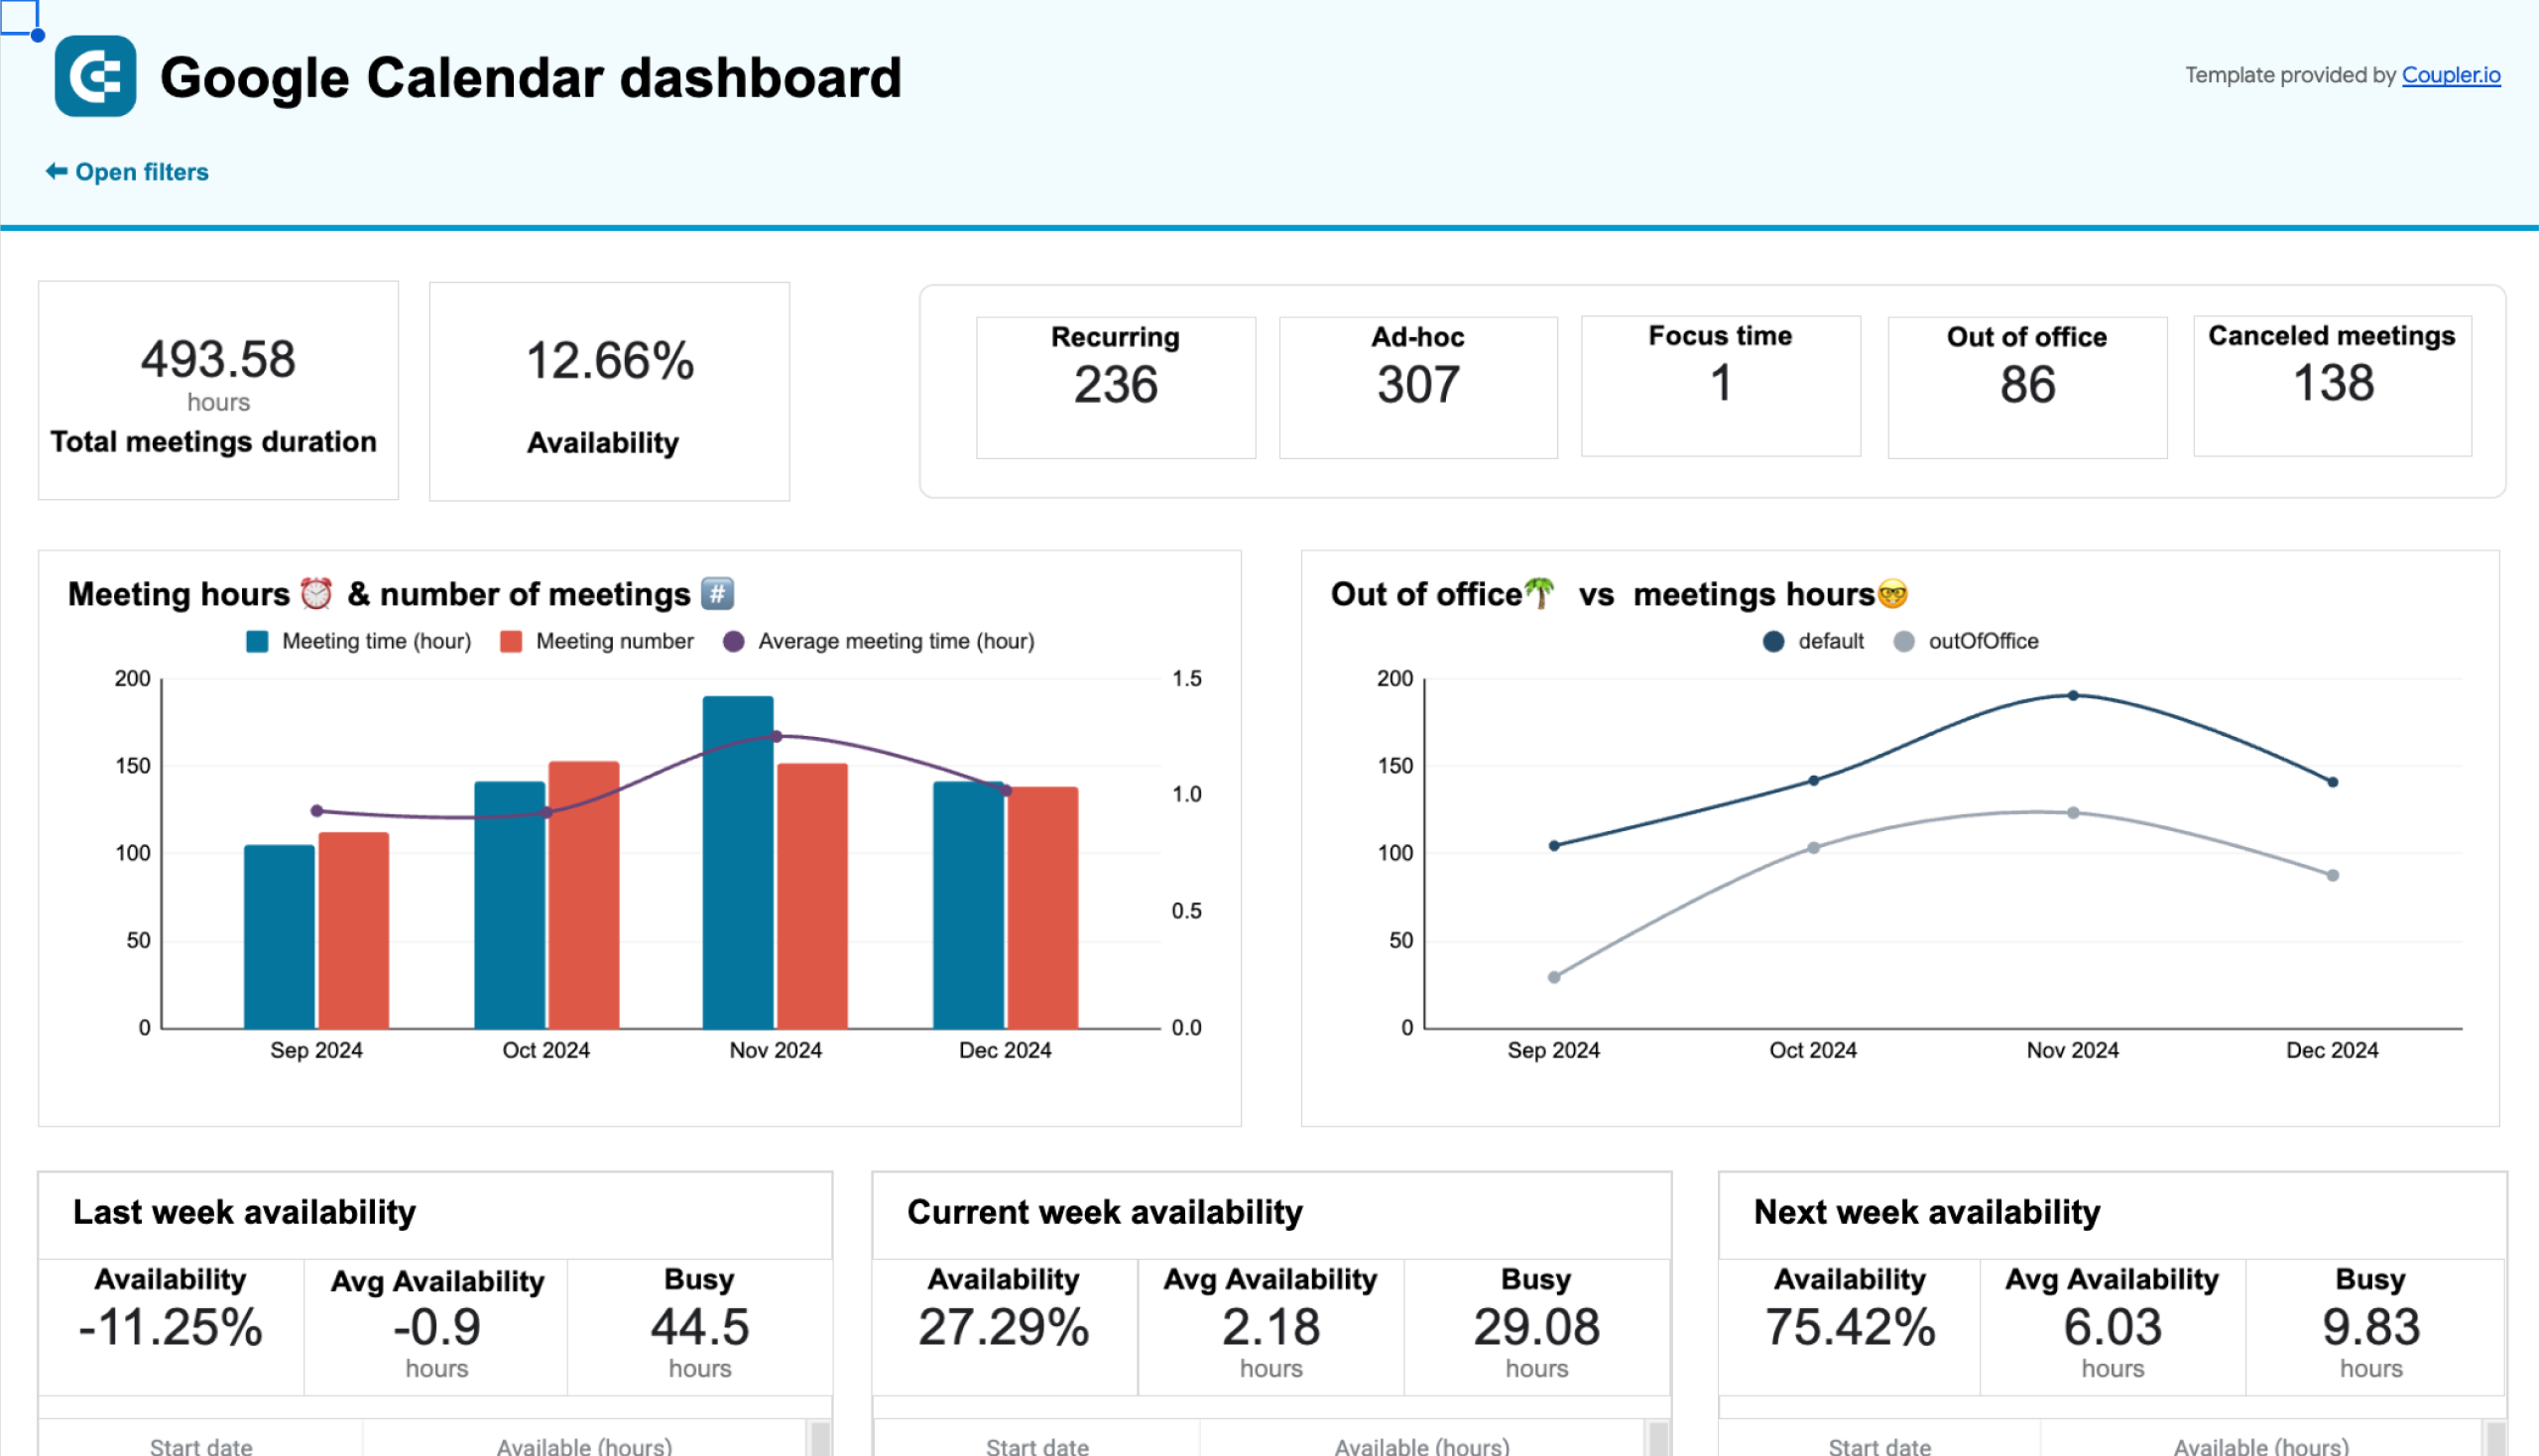
- How many meeting hours do you have?
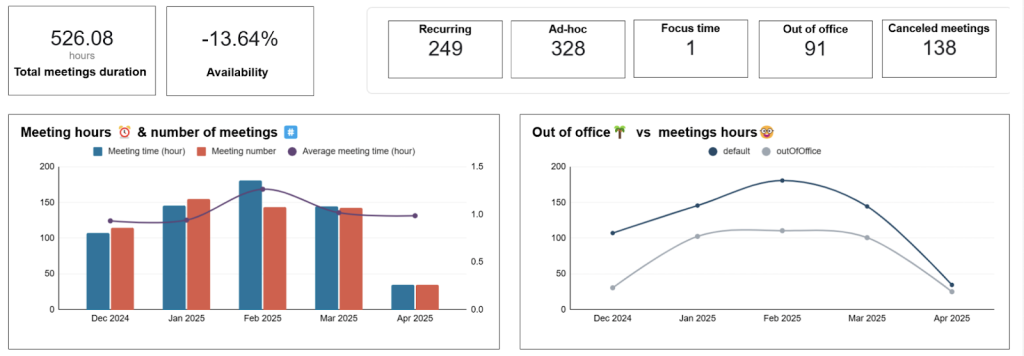
The dashboard lets you understand the overall time spent. Below the scorecards showing total meetings duration, availability, and the number of meetings by type (recurring, ad-hoc, etc.), you get two charts:
- The first one displays the total hours spent in meetings alongside the number of meetings by month. It’s useful to identify patterns in your workload and highlight opportunities for optimization.
- The second chart compares time spent out of the office to meeting hours by month. It provides insights into how external commitments impact your overall schedule.
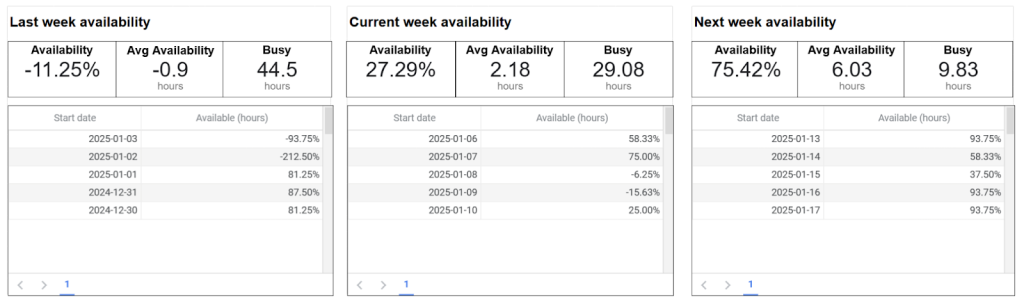
- What is your weekly availability?
Three simple tables on the dashboard show your availability in the last, current, and next weeks. You can see the percentage of available time, the average availability in hours, and your busy hours.
These insights are useful to reflect on your past week’s productivity and allocate time for future important tasks or meetings.
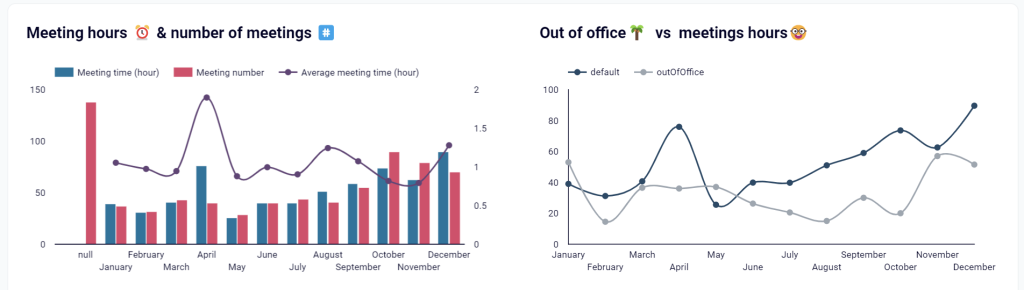
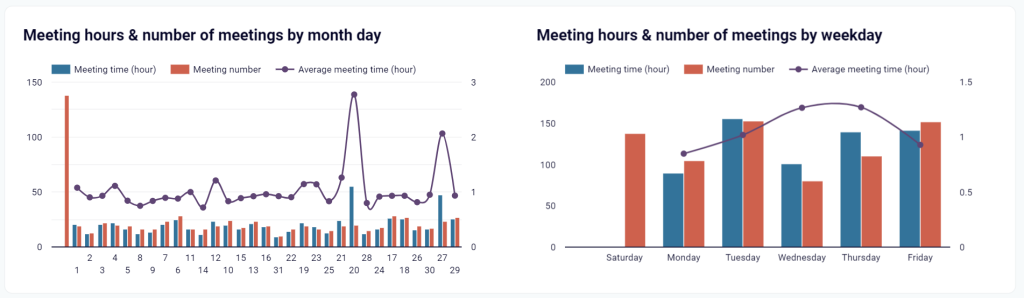
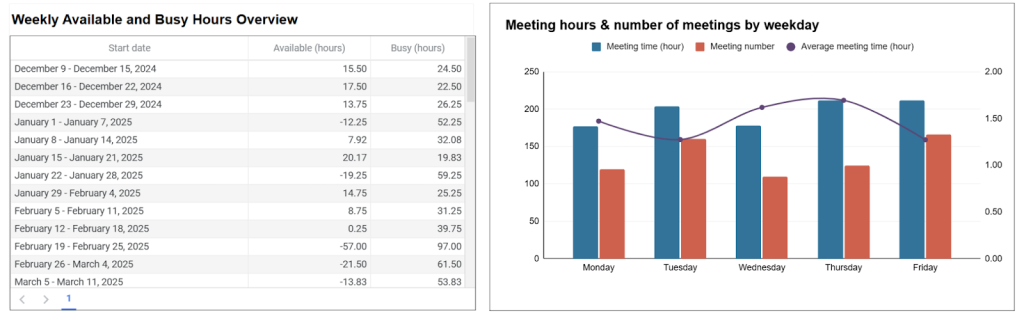
- What are your busy hours and weekdays?
The table summarizes your busy and available hours for each week during the selected period. You get a high-level view of how your time is distributed.
Next to the table, there is a chart showing the correlation between meeting hours and the number of meetings by day of the week. This chart reveals which weekdays are the busiest and helps you manage recurring commitments.
How to start using the Google Calendar availability dashboard
This dashboard is available as a template in Google Sheets. Follow the enclosed instructions to automate data load from Google Calendar to the dashboard using the built-in Coupler.io connector. (Try for free with no credit card required). In a few moments, your dashboard will provide insights into your availability.

3. Google Calendar team meeting dashboard in Looker Studio
While the previous dashboards help you analyze your own calendar, this template is designed for managers, team leads, and operations professionals who need to understand how their teams spend time in collaborative meetings. The Google Calendar team meeting dashboard analyzes meetings with multiple participants, helping you optimize team collaboration patterns and prevent meeting overload.
Google Calendar team meeting dashboard
 Preview dashboard
Google Calendar team meeting dashboard
Preview dashboardWhat you can learn from this Google Calendar team analytics dashboard
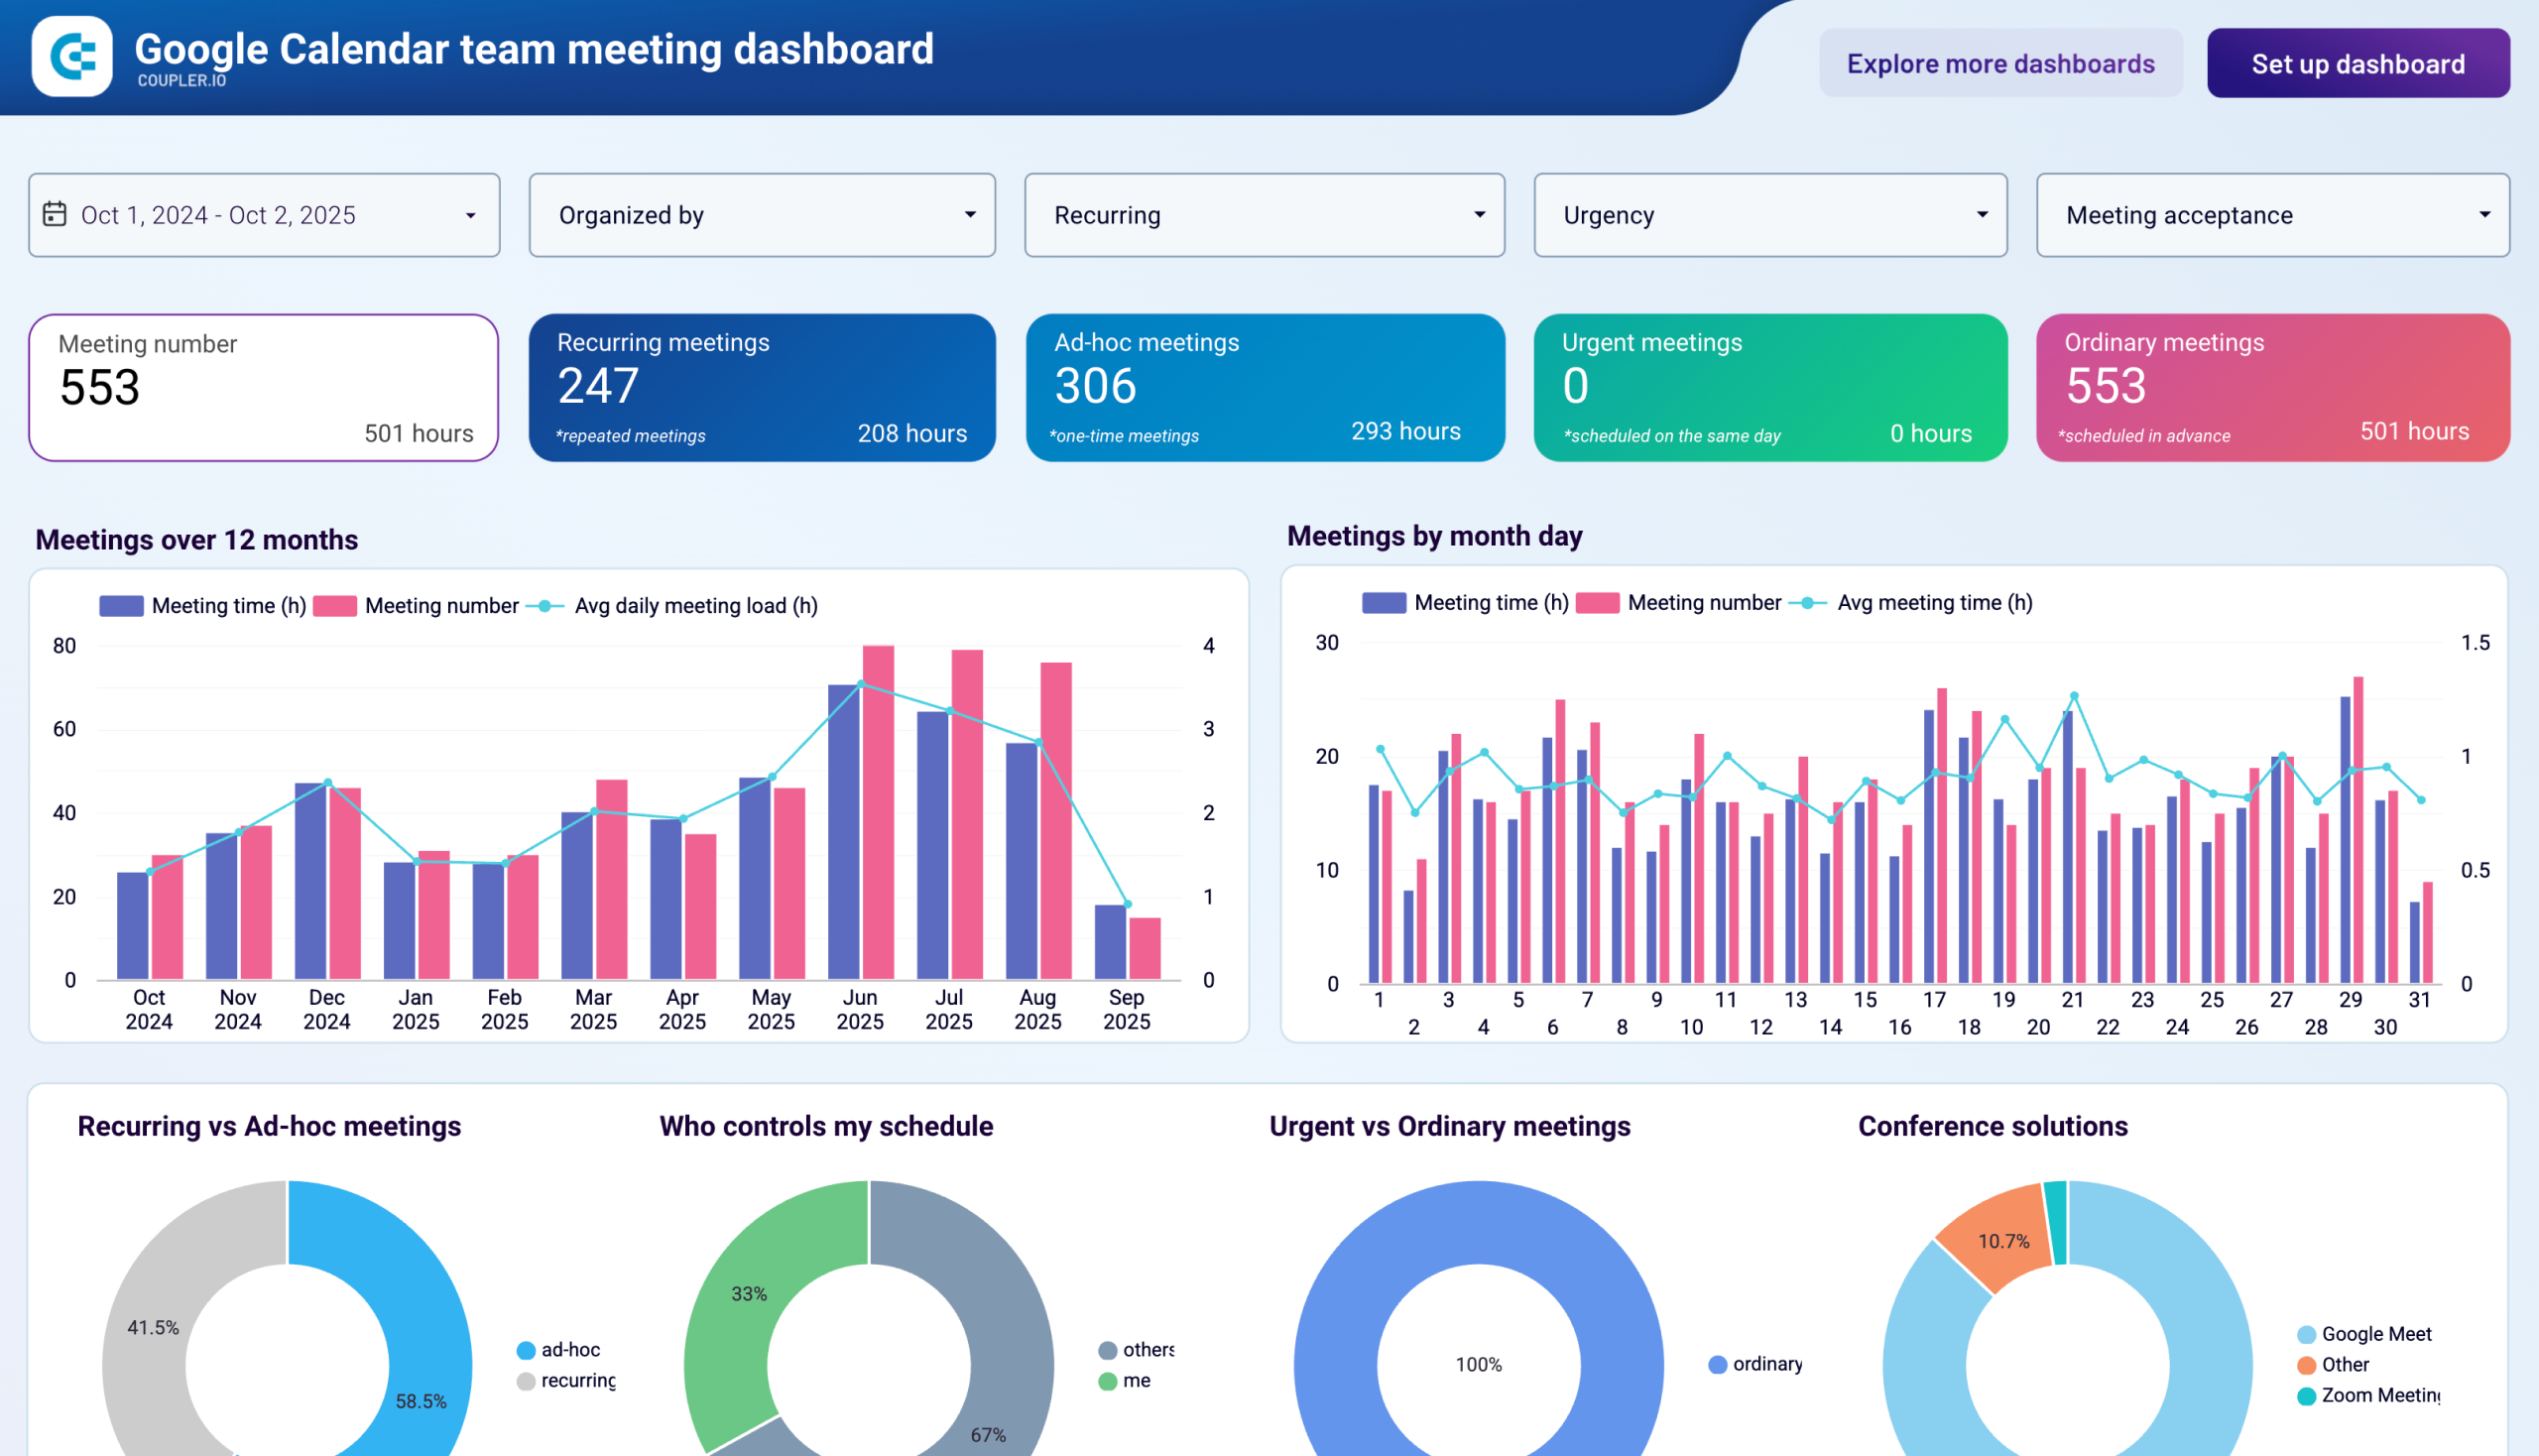
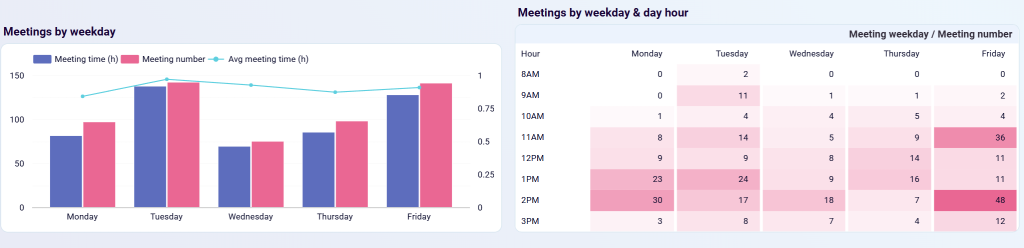
- Meeting scheduling patterns across your team
The dashboard reveals how team meeting loads fluctuate over months and weekdays. You’ll see which periods show the highest meeting density (like quarter-end spikes) and which days of the week carry the heaviest collaboration burden. This helps you avoid scheduling important meetings during already-packed periods.
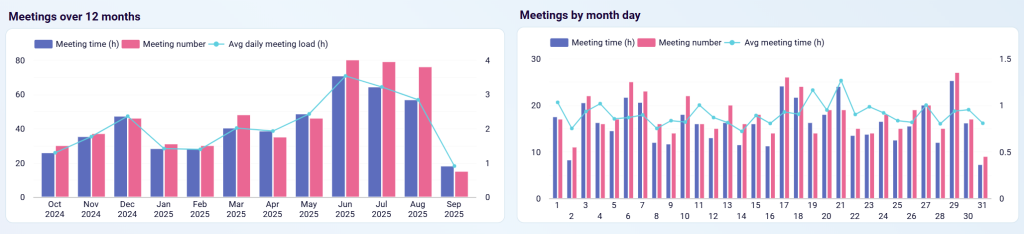
- Meeting patterns and optimal time slots
The weekday distribution chart and hour-by-hour heatmap show when your team meetings are concentrated. This helps you find capacity for new meetings, identify overloaded days, and pinpoint exact time slots with minimal conflicts for scheduling critical discussions.
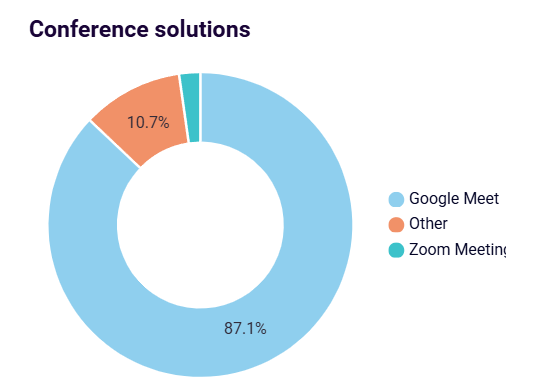
- Team collaboration tool usage
Identify which video conferencing platforms your team actually uses versus what’s officially standardized. The conference solutions breakdown helps you make tool consolidation decisions that reduce technical friction and improve meeting efficiency.
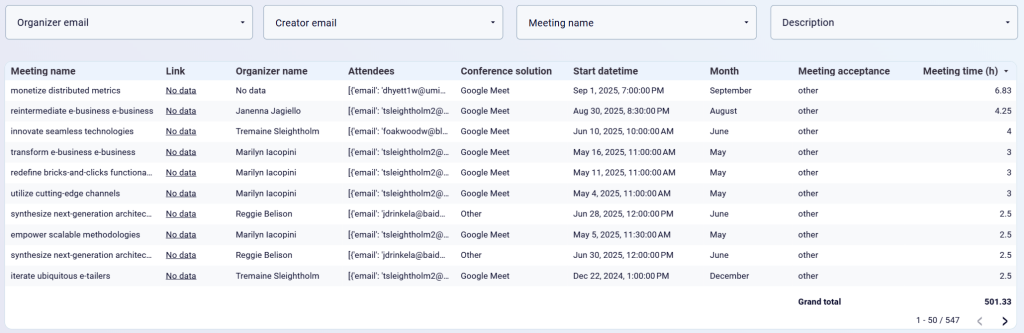
Comprehensive meeting audit capabilities
Access complete details for every team meeting, including organizers, attendees, platforms used, acceptance status, and duration. Filter by any dimension to audit meeting practices, identify recurring meetings consuming significant time, or enforce meeting policy compliance.
How to start using the Google Calendar team meeting dashboard
The dashboard is available as a Looker Studio template equipped with the Google Calendar connector by Coupler.io. Navigate to the Setup guide tab and follow the instructions to create a free Coupler.io account and load data from your Google Calendar (with appropriate team calendar access).
Google Calendar Time Insights for analytics
Time Insights is an analytics functionality built into the interface of Google Calendar. It gives you the ability to better understand how you’re spending your time in Google Calendar.
Although the Time Insights feature was launched in 2021, it is only available to users on most paid Google Workspace and Education plans. At the same time, this Google Calendar analytics feature is not available on personal Google accounts, Business Starter, Enterprise Essentials, Education Fundamentals, and other subscription plans.
How to use Time Insights in Google Calendar
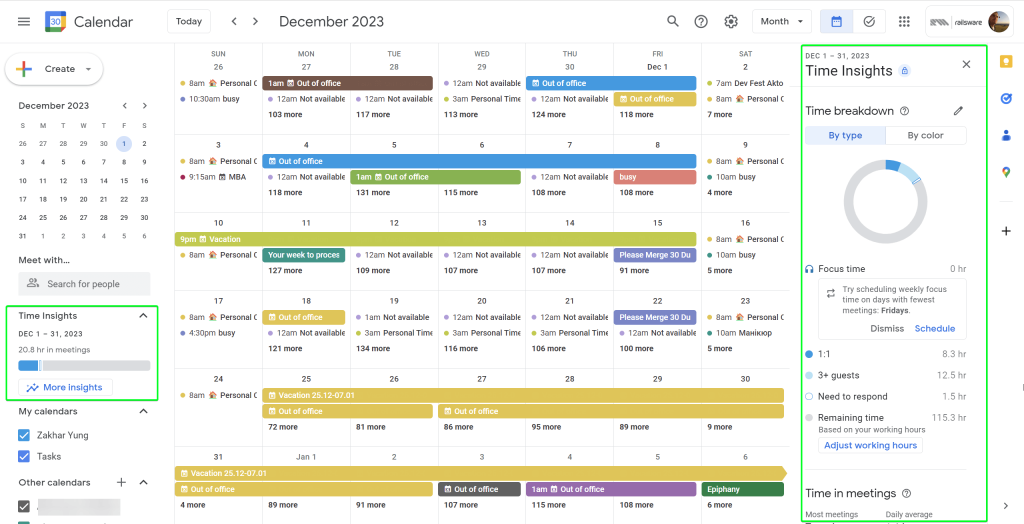
Let’s say you’re lucky enough to have Time Insights on your Google Calendar. You’ll notice its minimized panel on the left-hand side of the calendar app.
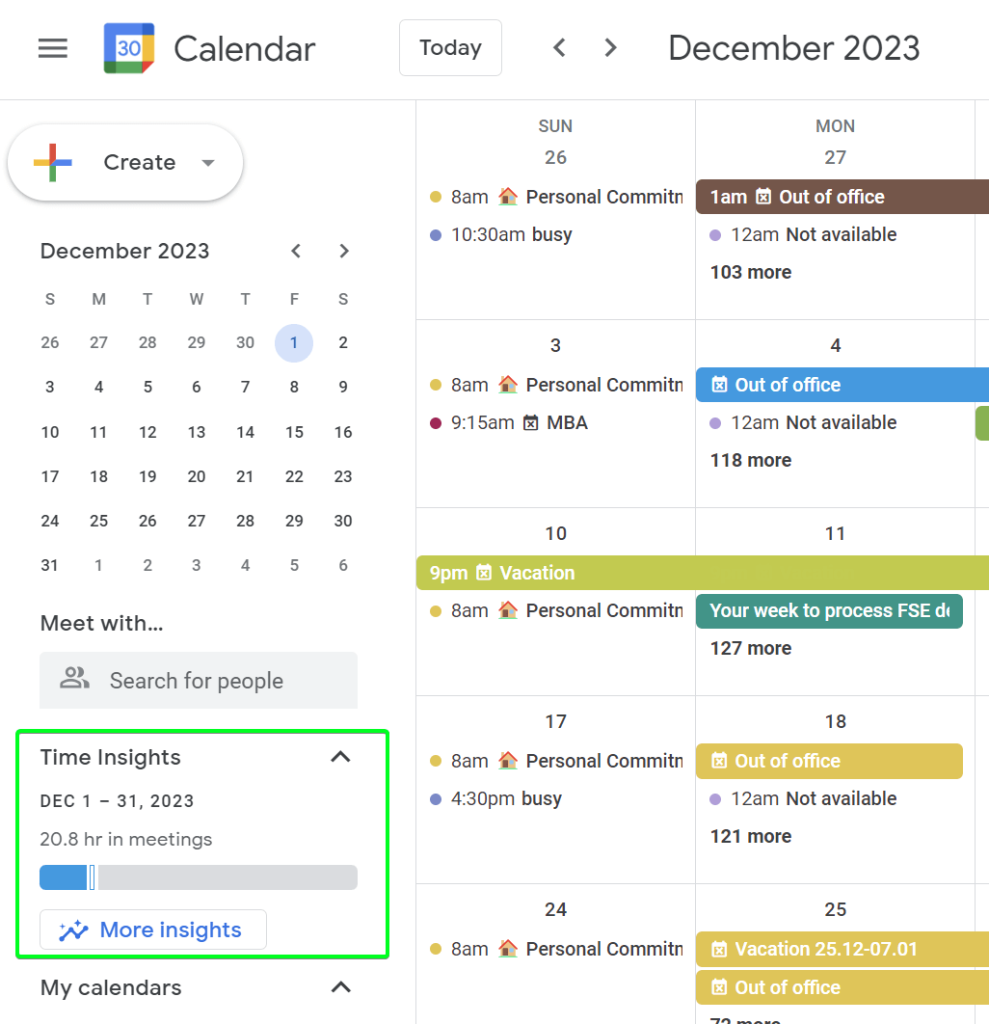
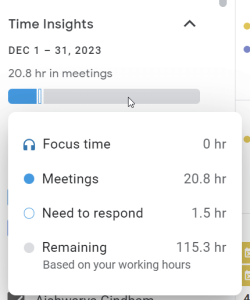
It displays the total number of working hours and the share of meetings, focus time, and other events. Hover over the line to see the details.
If you click the More insights button, a larger panel will open on the right-hand side of the calendar app. It contains a few sections:
- Time breakdown (by type or by color)
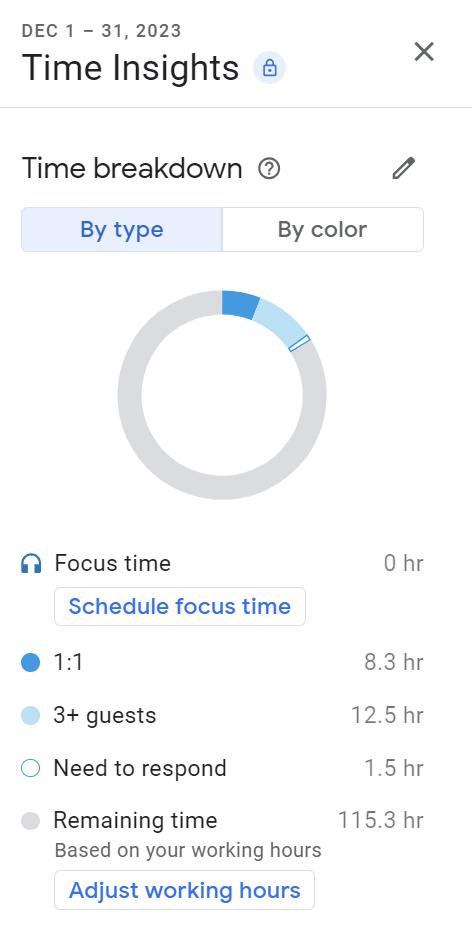
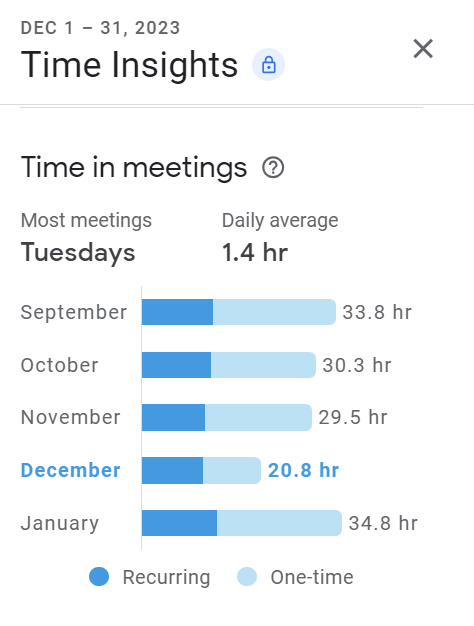
- Time in meetings
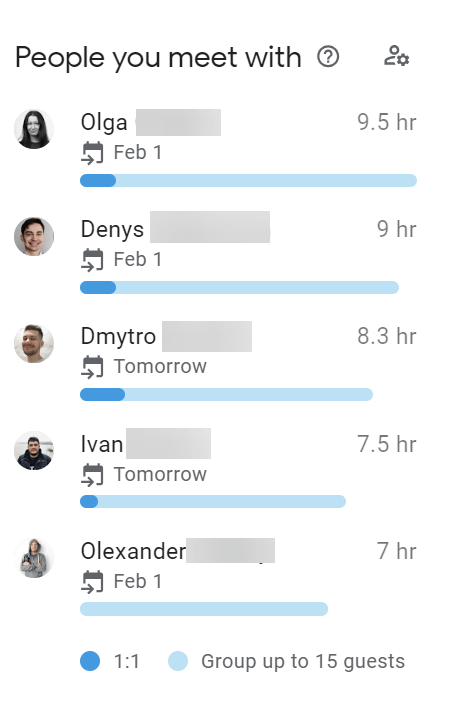
- People you meet with
Is Time Insights good for Calendar Analytics?
Time Insights definitely provides good insights, however, they are not enough to make a thorough analysis of your meeting time.
Time breakdown is rather shallow. For example, you won’t get information about cancelled meetings or time off. Time in meetings looks very good and I enjoyed playing with it for different ranges in my calendar. And the block People you meet with was of no use to me in terms of time analysis.
Let’s move on.
Google Calendar analytics with Chrome extension
On Google Workspace Marketplace, I stumbled upon a Chrome extension named Calendar Analytics. ‘This should be it’ was my first thought. However, things are not that straightforward.
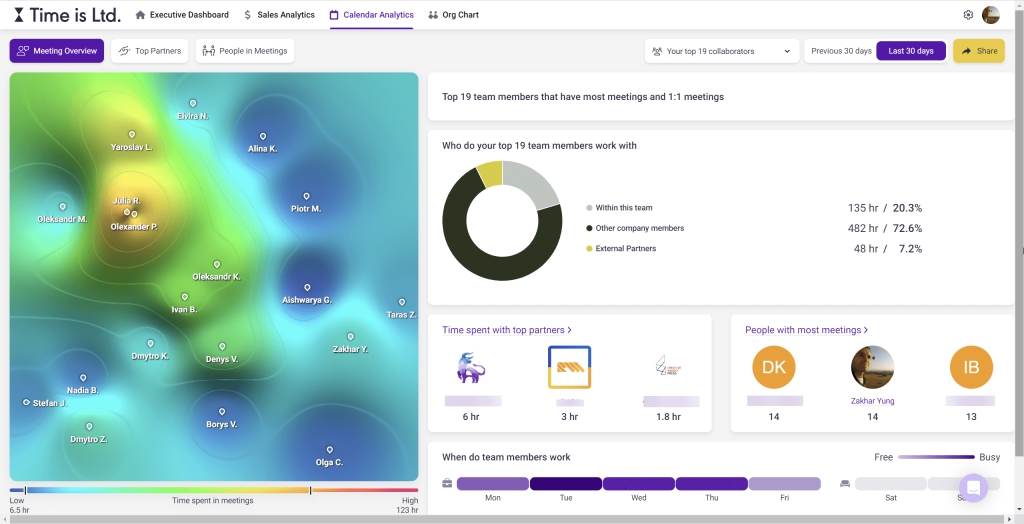
This is a free tool designed for sales team leaders to optimize their teams and close more deals. So, it’s not quite a fit for personal Google Calendar analytics. Here is what the analysis of my Google Calendar looks like with this app.
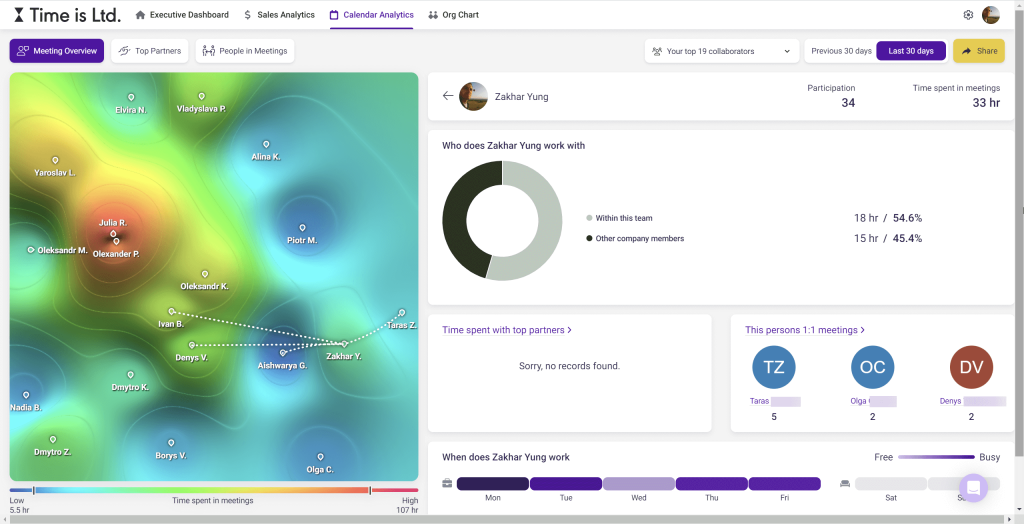
The first thing to begin with is that this analytics dashboard only displays data for the last 30 days or the previous 30 days. No date range customization is available.
I enjoyed the visualization of the colleagues that you had meetings with but it’s not very informative and hence useful for analysis.
The breakdown of business days looks not bad but still, you need to hover over each day to learn how much time you spent in meetings.
The verdict – this option did not work for me. However, you may find it useful for your needs. So, here is how you can start using it.
How to use Calendar Analytics browser extension
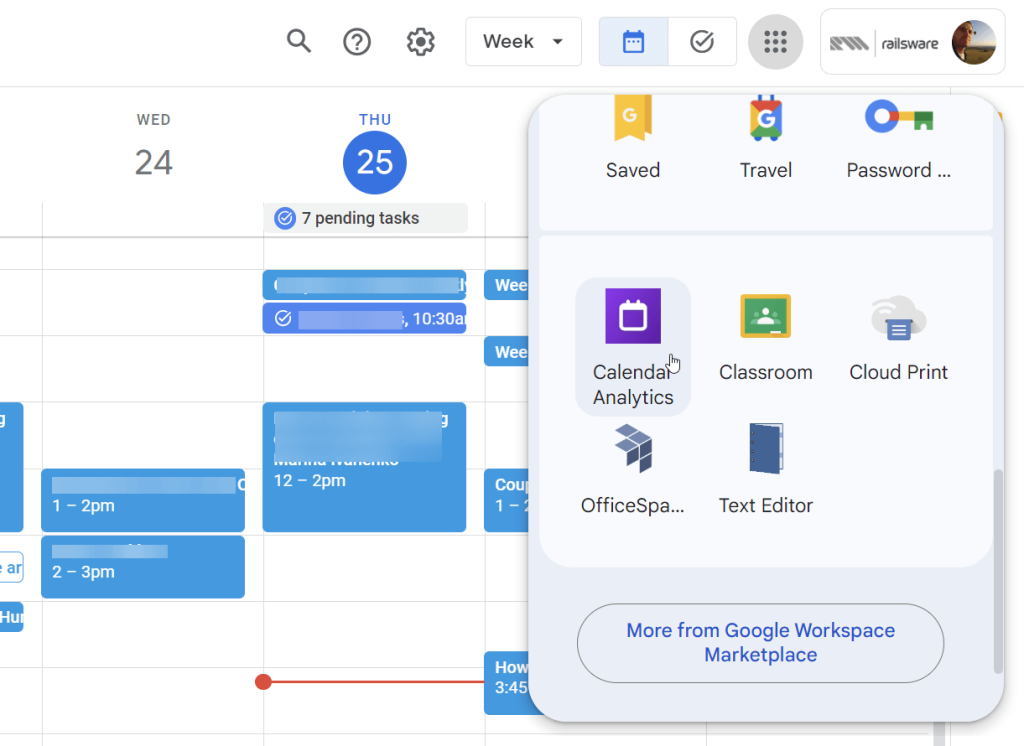
Install the app first from Google Workspace Marketplace. After the installation, you can access the extension in the Google Apps menu.
When you click on it, you’ll need to sign in with Google to start using it. Grant the required permissions to use data from your Google Calendar. Then wait a few moments for the app to collect data from it and prepare the dashboard.
Bonus: create a Google Calendar analytics report yourself
If none of the options above look engaging to you to analyze Google Calendar data, there is another method – create a Google Calendar analytics report yourself. I’m gonna show you an example of how you can do this with the help of Coupler.io. It’s a reporting automation solution that allows you to connect Google Calendar to different destinations, including Google Sheets. Here is what it looks like.
Step 1. Collect data
Click Proceed in the form below to create a connection between your Google Calendar and Google Sheets. You’ll need to sign up with your Google account for free.
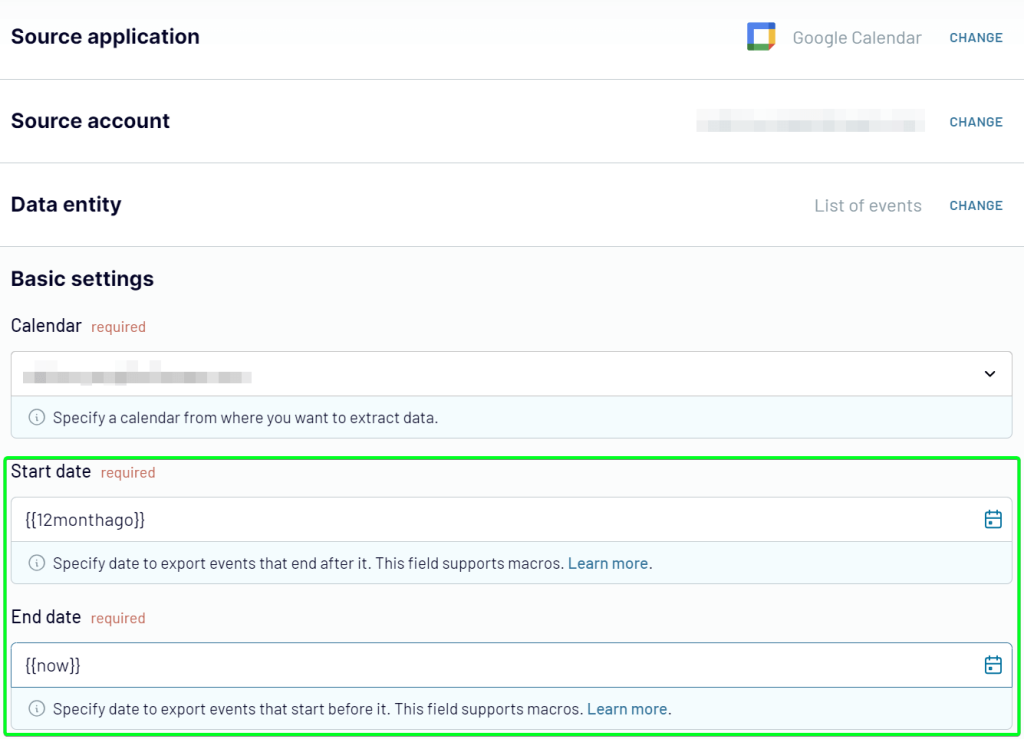
Once an importer is created, connect your Google Calendar account, select the calendar you want to analyze, and choose List of events as a data category to export.
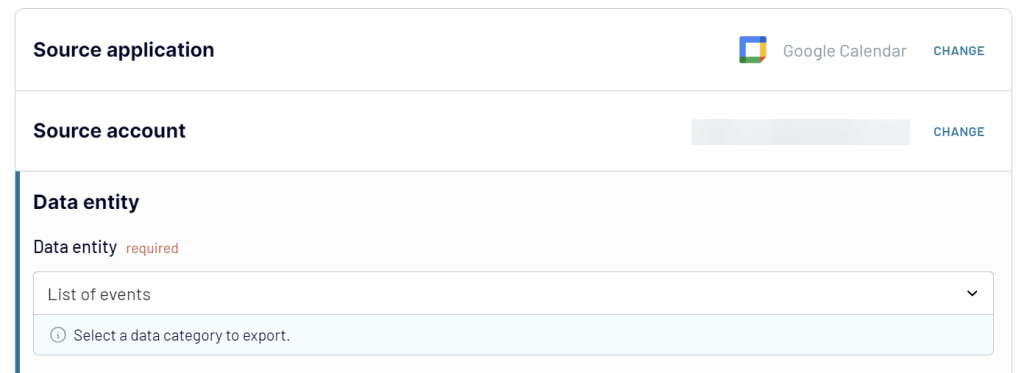
You’ll also need to specify the start and end dates for your report.
Step 2. Organize data
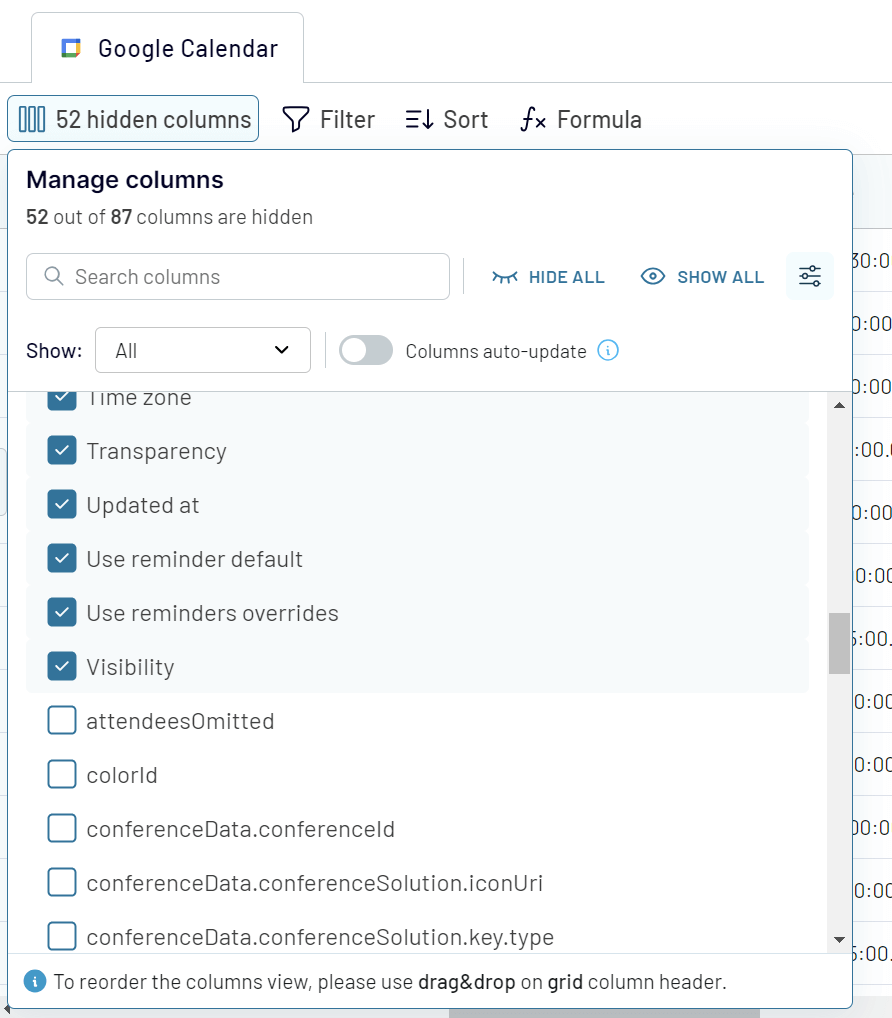
When you get to the Transform data step, you’ll be able to preview the calendar data. Not all of the columns would be useful for your report, so feel free to hide the unnecessary ones and keep those that are needed.
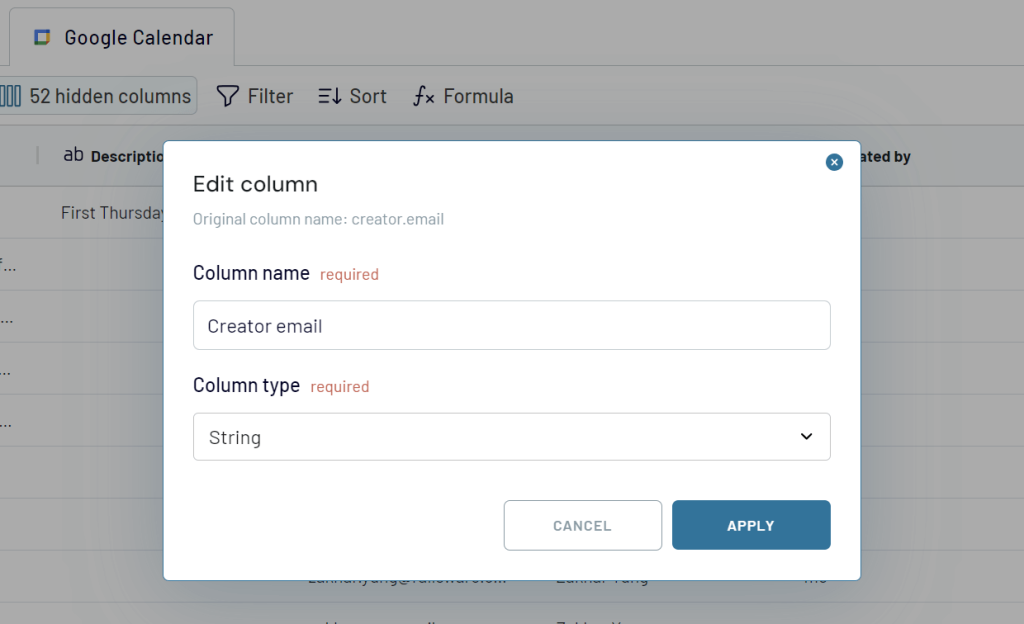
It also makes sense to update column names since some of them won’t look good in your report. You can do this by clicking Edit column and entering the wanted column name. Here you can also change the column type if needed.
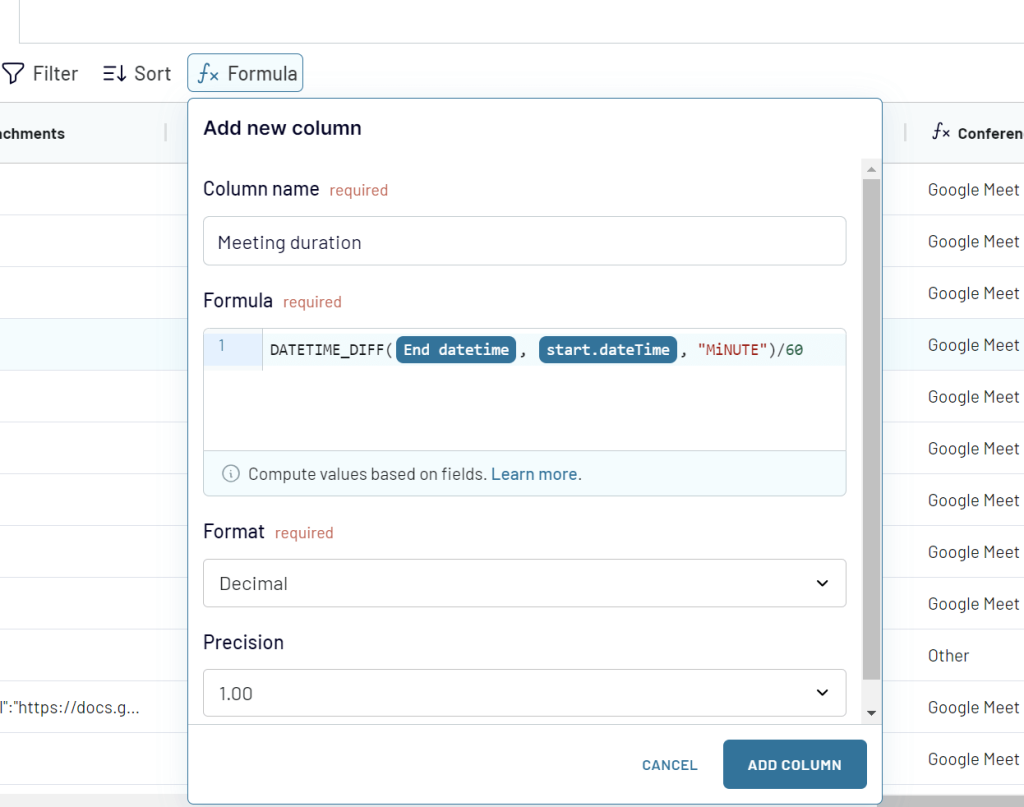
Is this it? Nah. The thing is that not all metrics that would make your Google Calendar analytics report great are available out of the box. For example, the meeting duration is not returned from Google Calendar API, so you won’t see it. However, you can add it as a custom column using the calculation formula. For this, click Formula and enter the required formula. In our case for the meeting duration, the formula will look like this:
DATETIME_DIFF({end.dateTime}, {start.dateTime}, "MiNUTE")/60
end.dateTime and start.dateTime are the columns that are available when you load data from Google Calendar API.
Depending on what you want to include in the report, you may need to create several custom columns. You can learn more about this in our knowledge base.
Once all the transformations with data are ready, you can load your report to the chosen destination. In our example, this is Google Sheets.
Step 3. Load report
You’ll need to connect your Google account and specify a spreadsheet and a sheet where to load your Google Calendar analytics report.
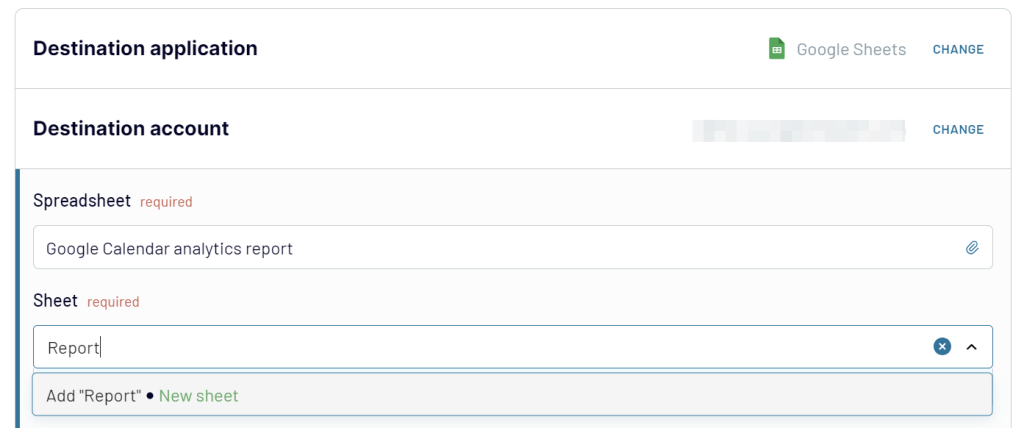
That’s basically it. However, we do recommend that you toggle on the Automatic data refresh feature to make your report live.
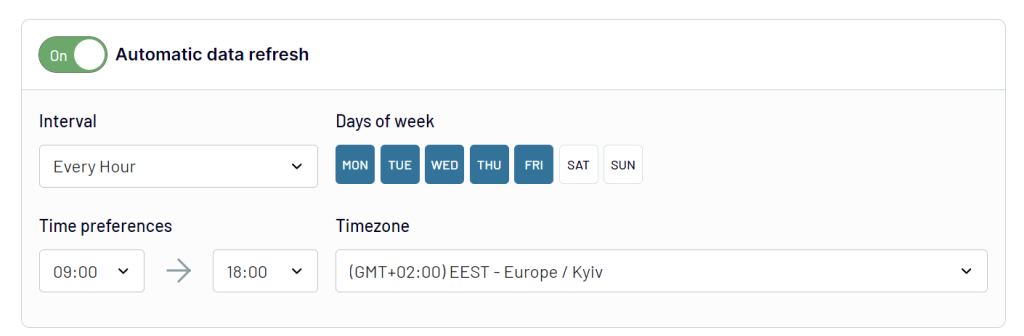
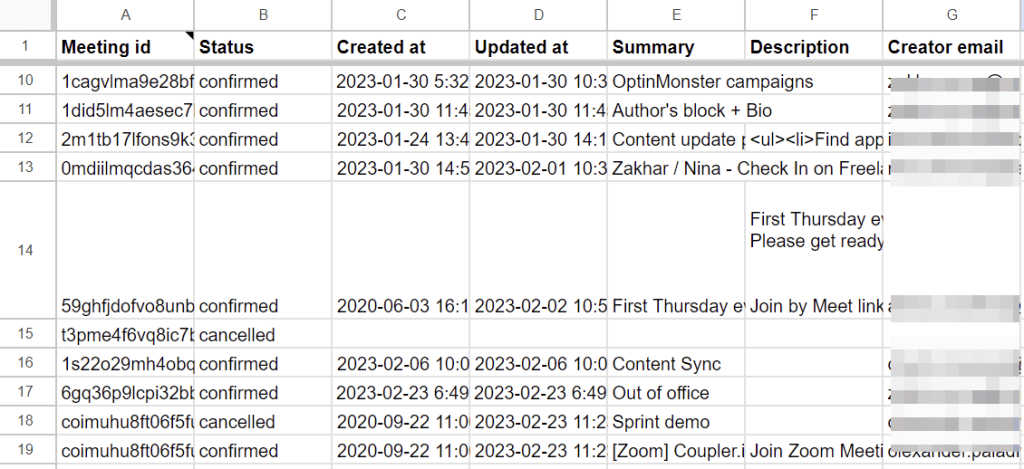
Eventually, click Run importer and welcome your Google Calendar data in spreadsheets.
With Coupler.io, you’re not limited to Google Calendar data for analytics. This solution allows you to export data from Calendly, Clockify, Harvest, and many other applications. For example, you can combine first-party data from your CRM with calendar data to understand how meetings translate to sales performance.
Why you should analyze Google Calendar data
Google Calendar analytics is not obligatory, of course. But for those of you who care about their time management, you’ll understand the value of these insights. Here are a few key takeaways that I took into account based on last year’s calendar analytics.
Bring order to chaotic schedules
Almost half of my meetings in 2023 were ad-hoc. At the same time, statistics show that employees are only excited about the meetings that were planned ahead of time. We can’t do without ad-hoc events, of course, but the share of those should be much less.
Replace inefficient meetings to increase productivity
Last year, I spent 374 hours in meetings. However, am I sure that this amount of time was spent efficiently? After some pondering, I realized that I could make a few improvements to my meeting attendance:
- Assess whether some events could be substituted for a short chat in messenger.
- Evaluate planned meetings ahead to prioritize them. For example, it makes sense to catch up on recordings of specific group meetings later if my contribution there is not significant.
- Analyze the scheduled meeting time vs. the time actually spent on these meetings to make well-balanced scheduling in the future.
Spread the meeting load along the weekdays
At the beginning of the article, I shared that Mondays are the weekdays with most meetings on my calendar. And that’s a bad move. Statistically, Tuesdays are considered the most productive workdays for meetings. They are followed by Wednesdays and Mondays are only in the third place.
So, my focus should be on balancing meetings across the week so there aren’t a bazillion calls on Monday but no calls on other days at all.
These are the takeaways that will help me improve my Google Calendar scheduling. Yours are likely to be different but still, they will be very valuable. Good luck!
