You know how important it is to have visibility into the performance of your campaigns, right? A marketing dashboard can provide that insight. It’s an invaluable tool for understanding what works, tracking progress against goals, and identifying areas for improvement. We’ve collected top marketing dashboards to cover everything you need and grouped them into dedicated categories to ease your search.
Multi-channel PPC dashboard marketing dashboard examples
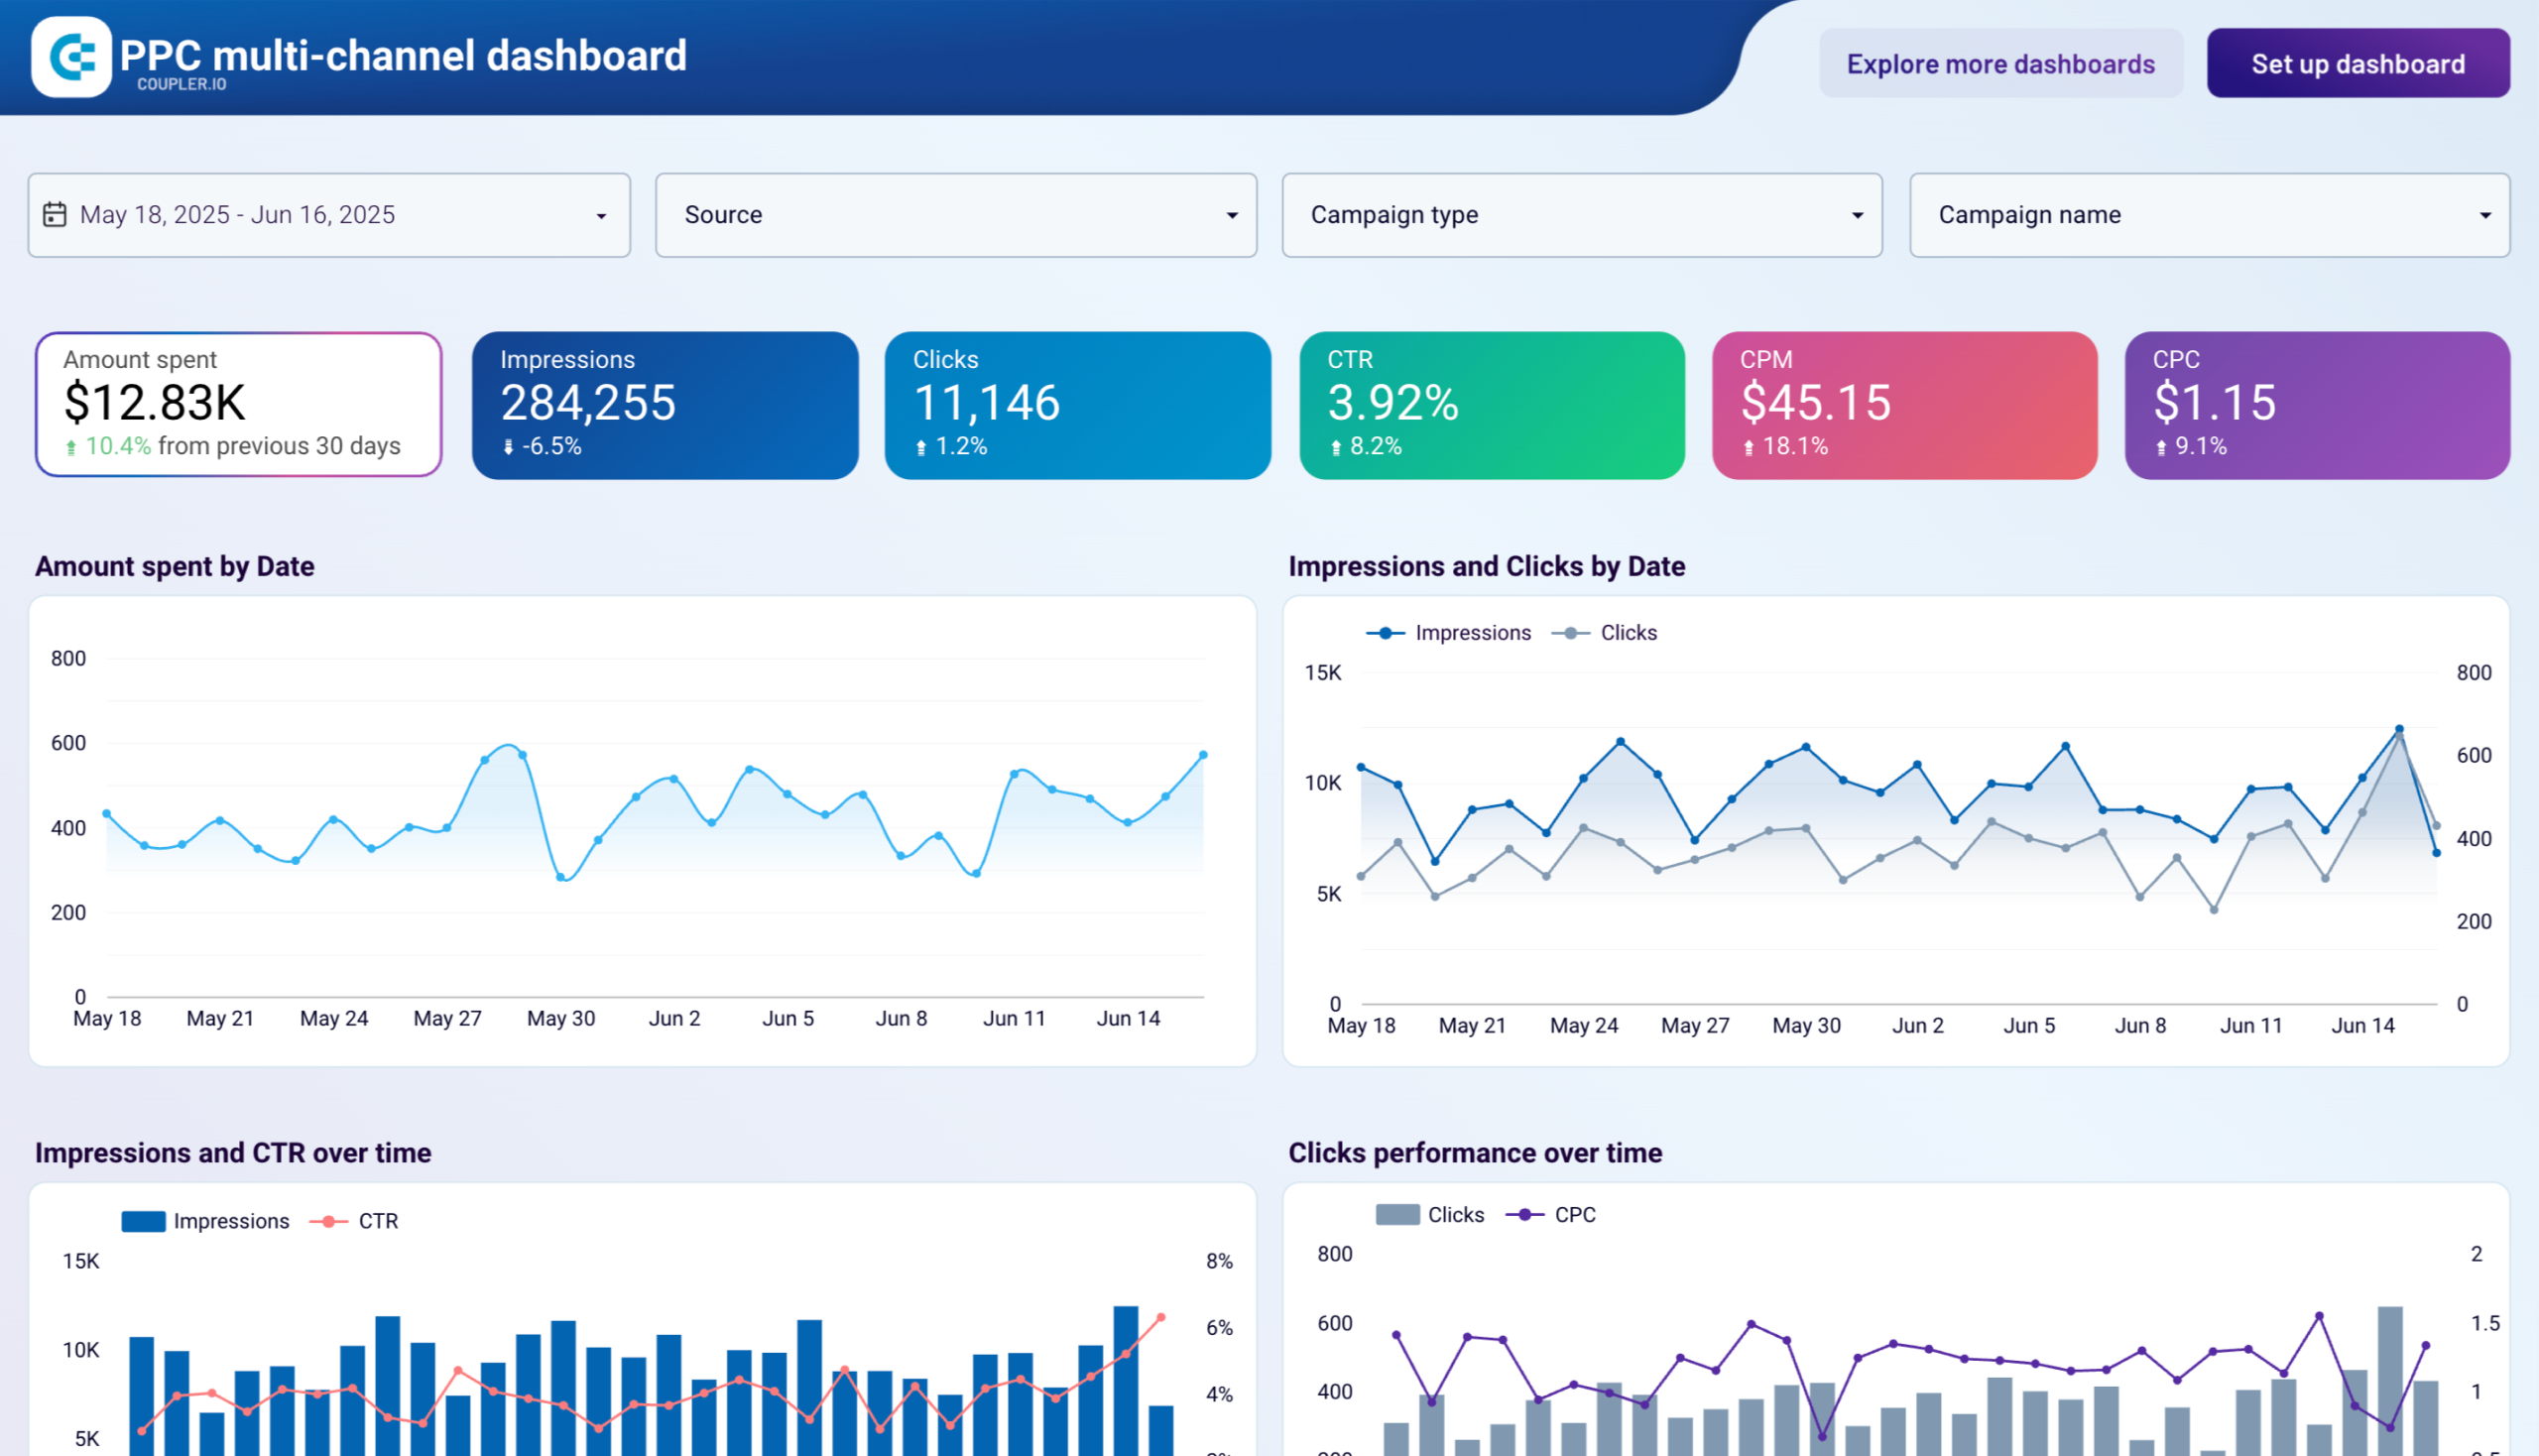
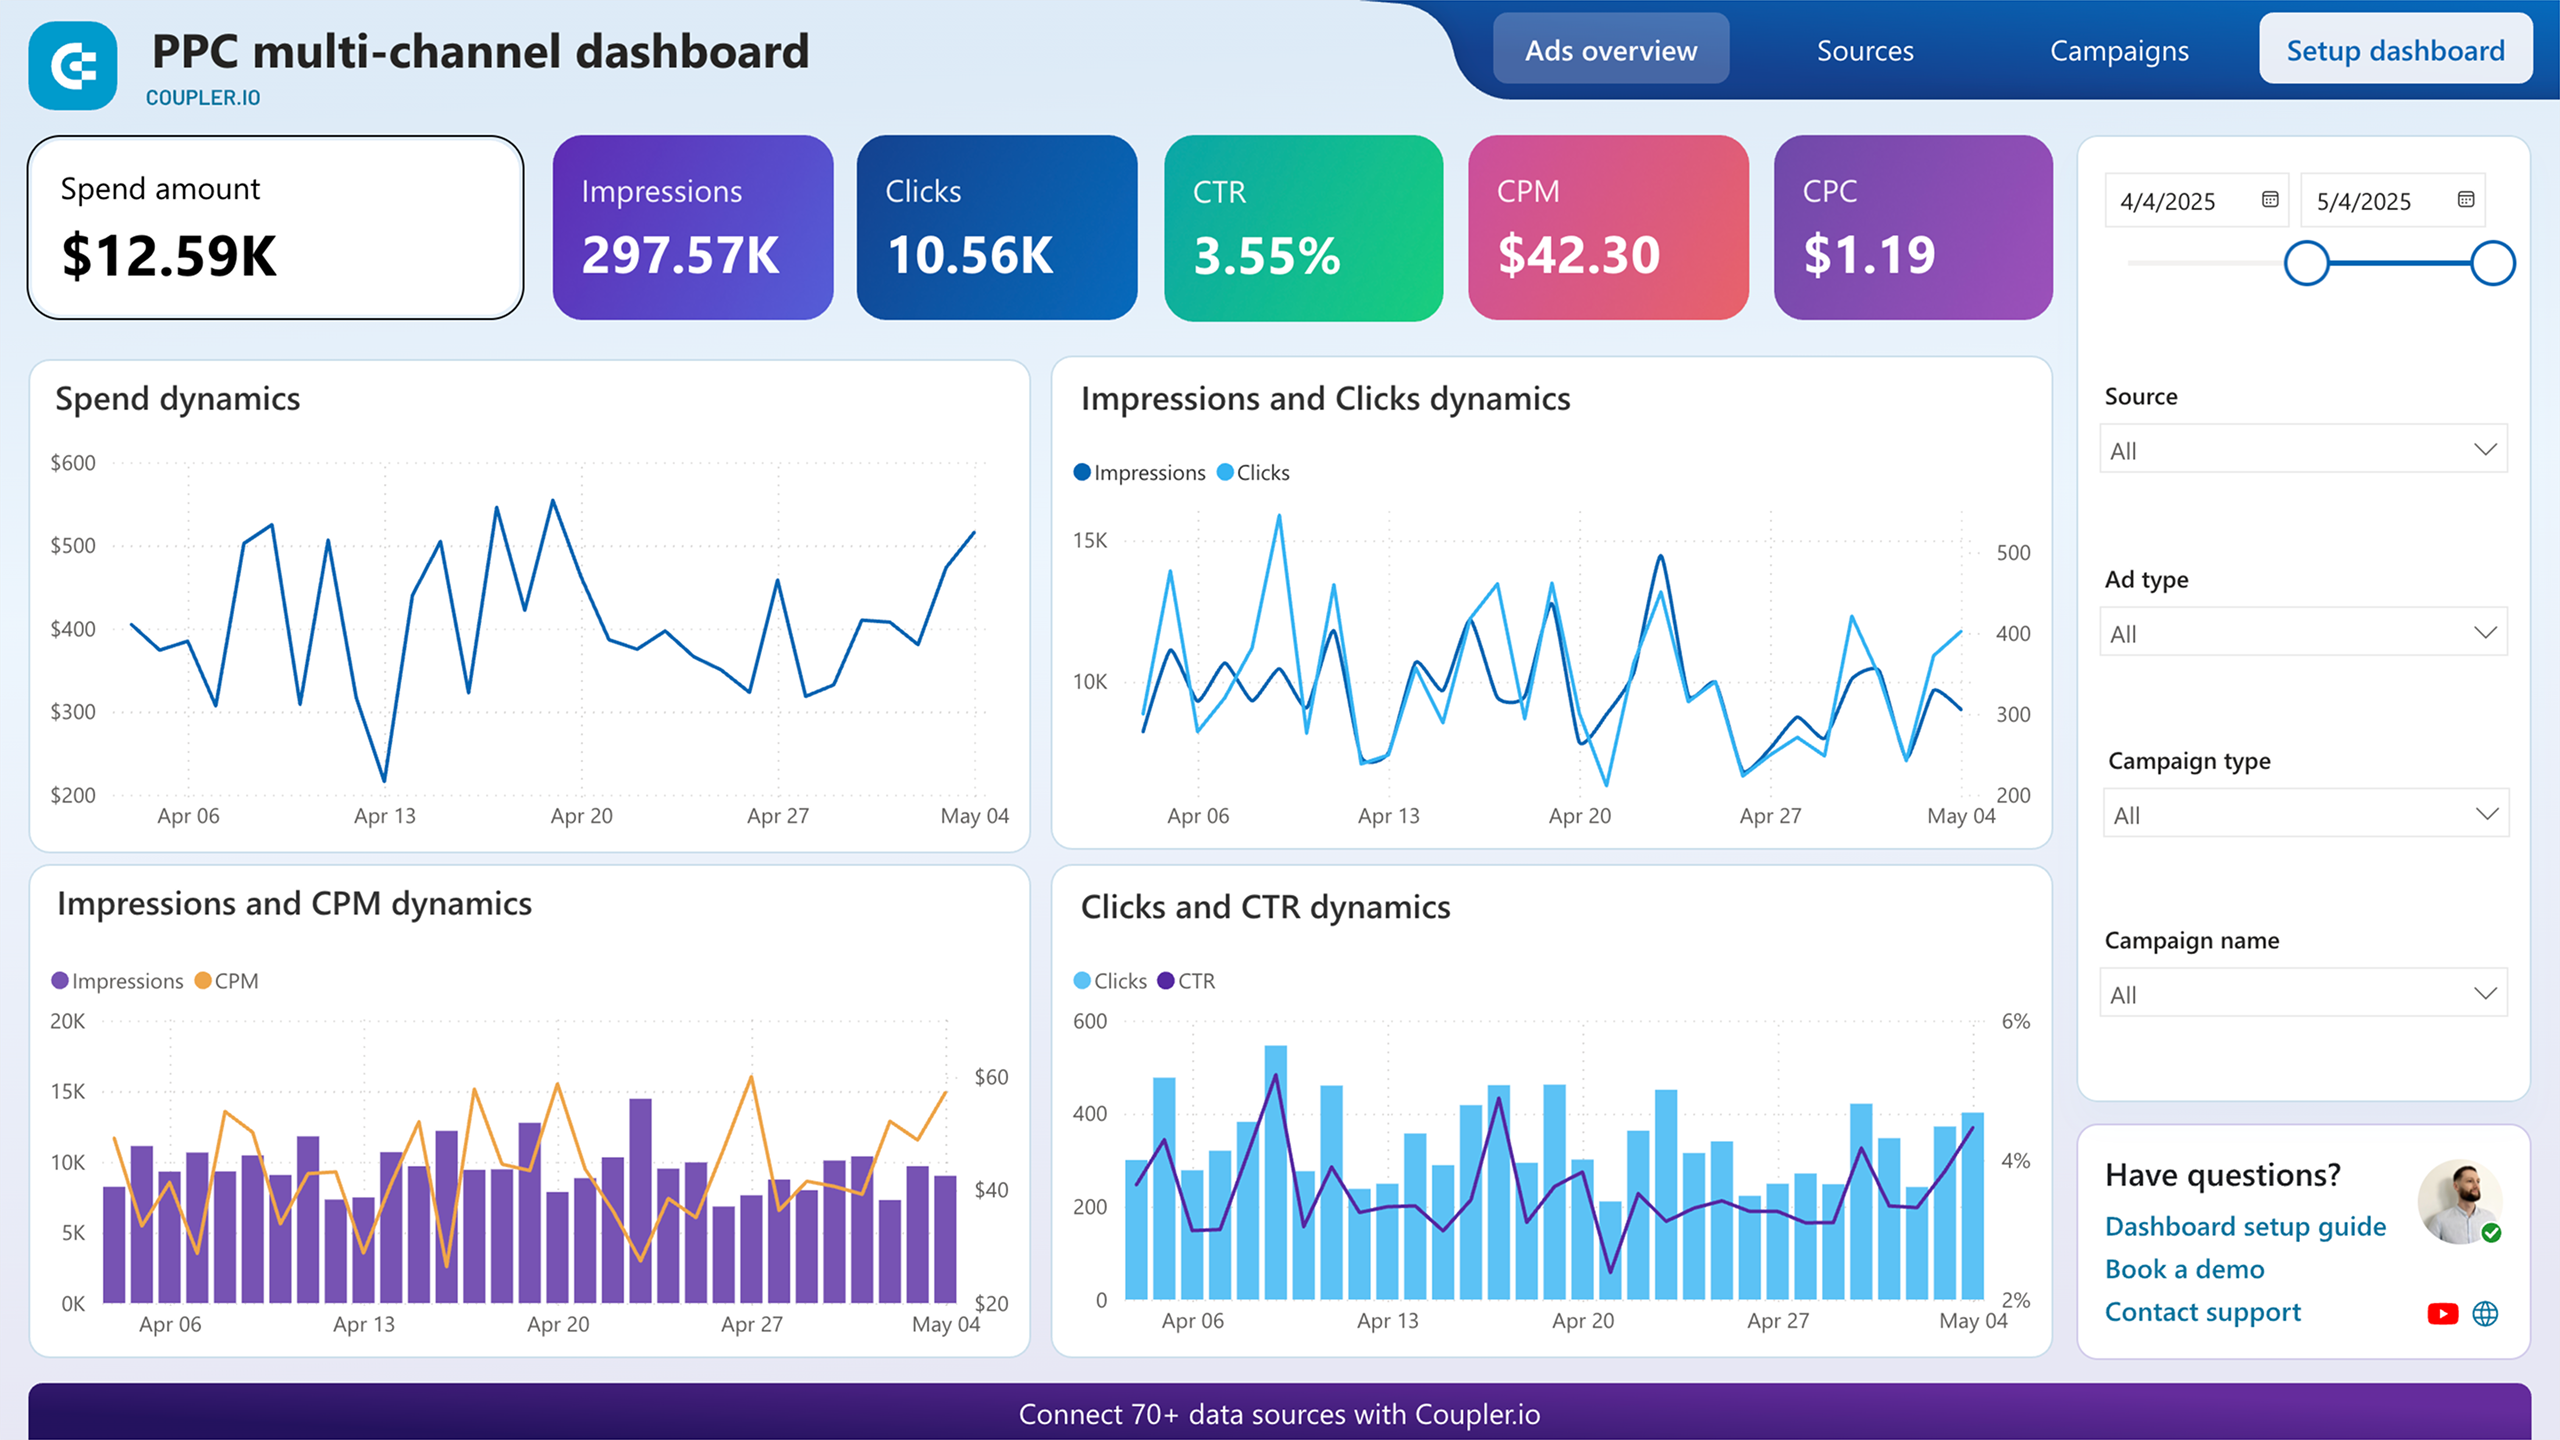
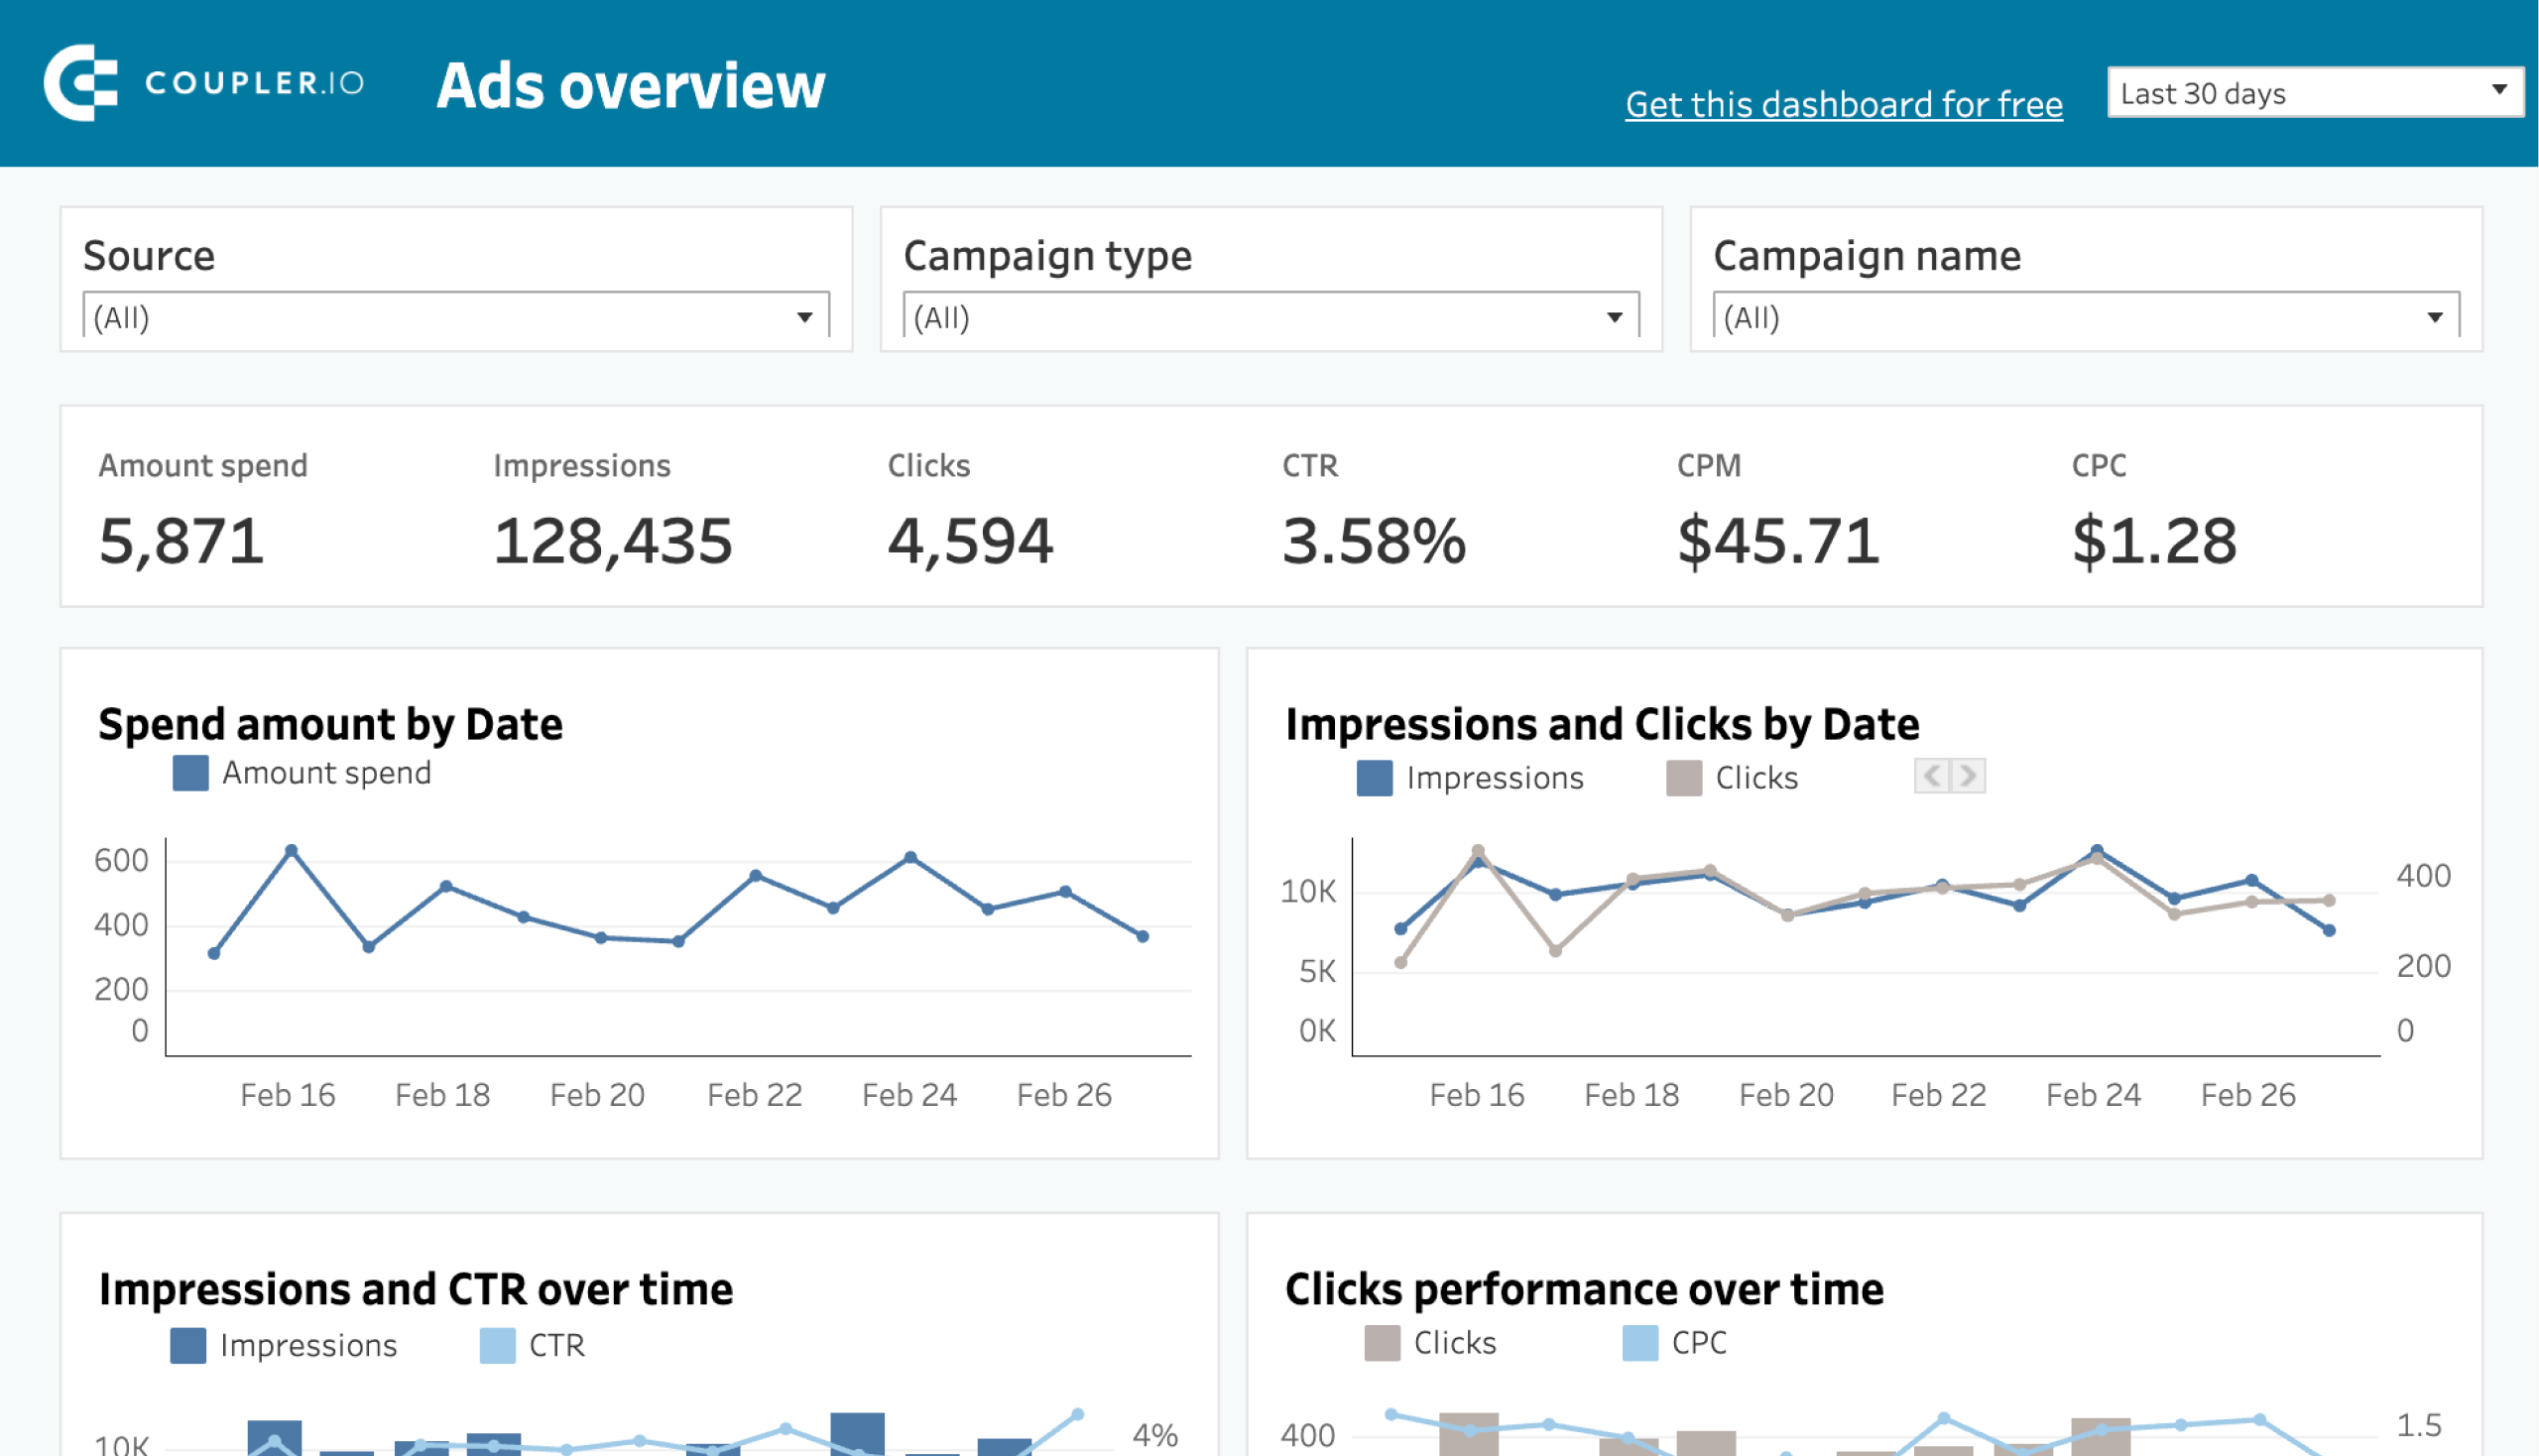
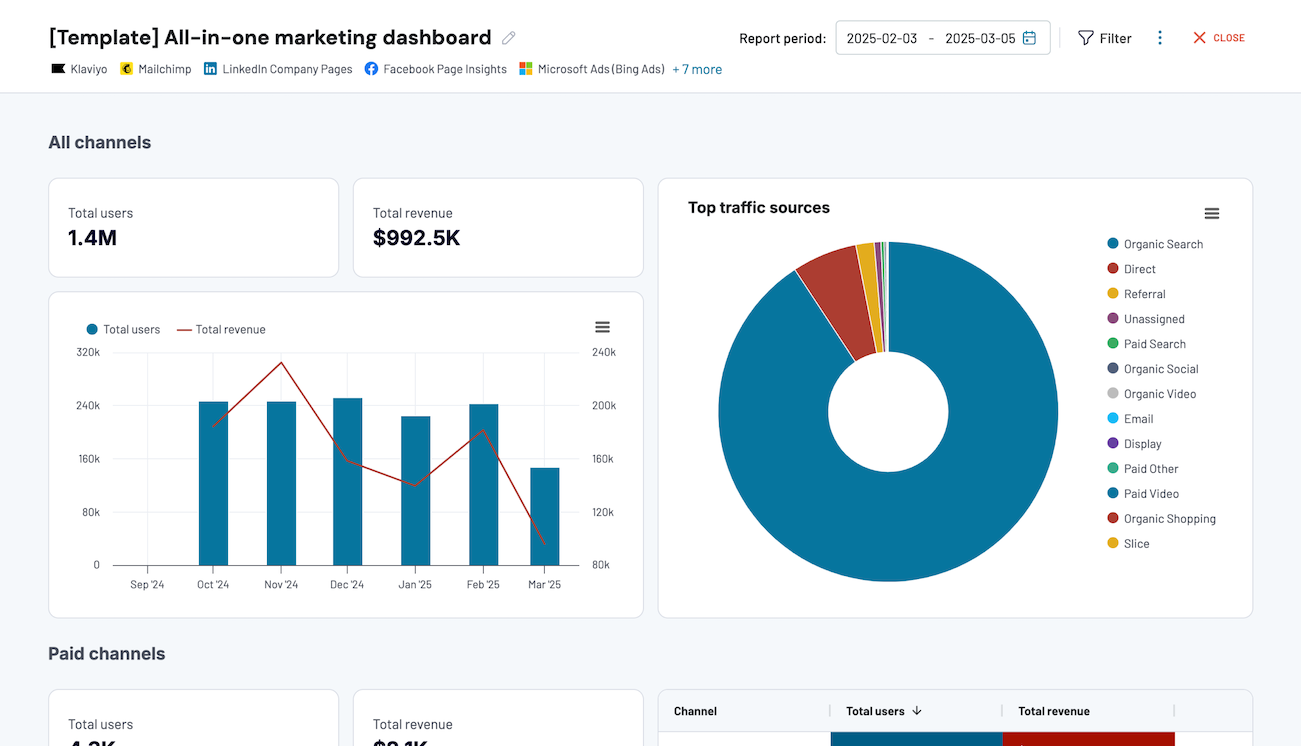
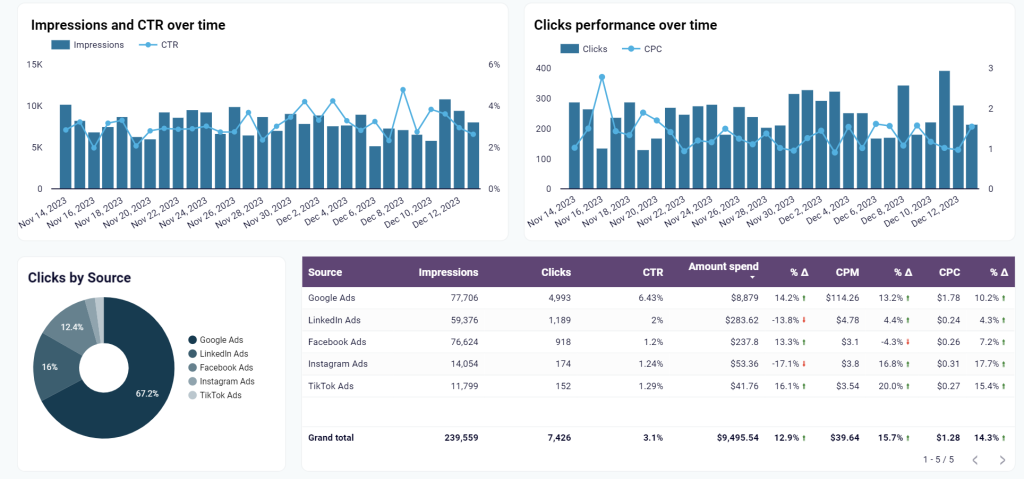
1. PPC dashboard for omnichannel advertising (+ template)
Why look at every advertising channel separately if you could merge all data into a single dashboard? Such a PPC multi-channel dashboard gives you a complete overview of all ads running across different platforms.
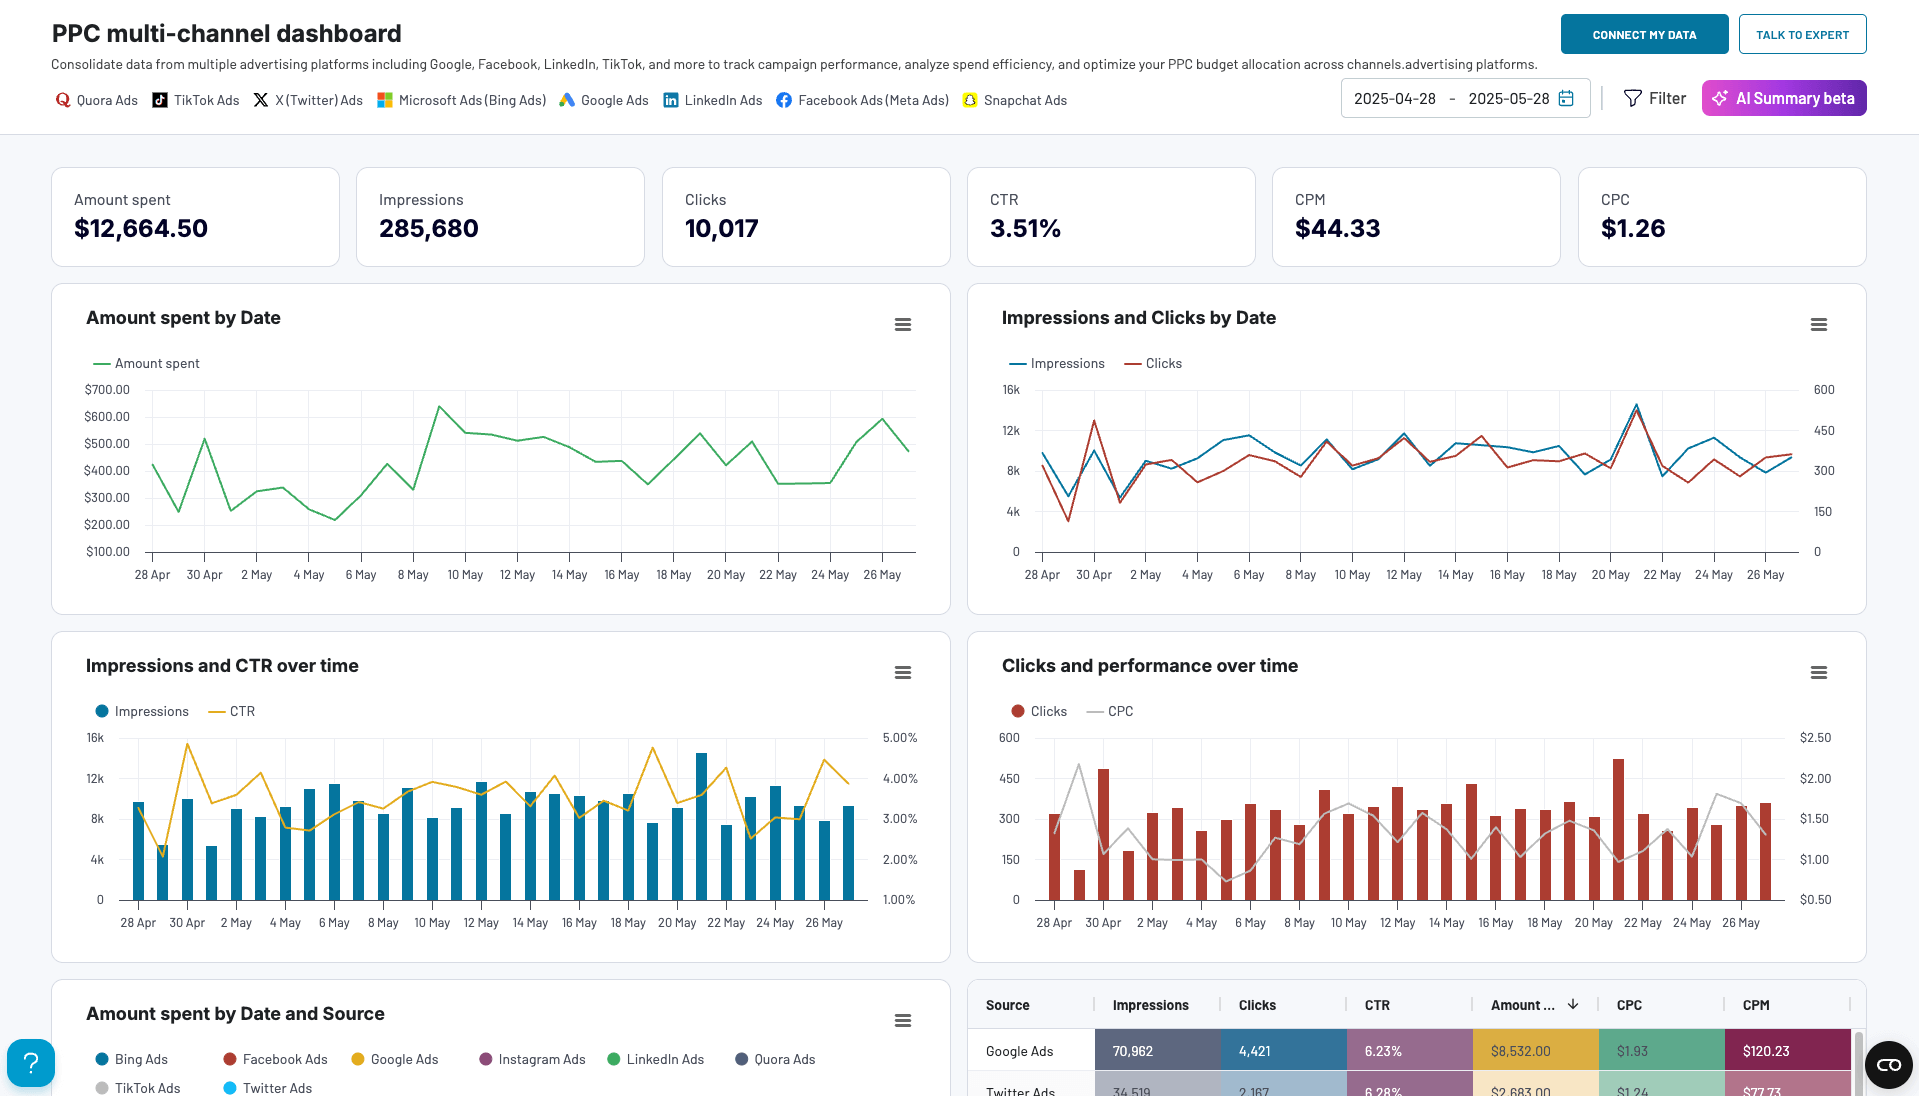
The data from Facebook Ads, Google Ads, LinkedIn Ads, Microsoft Ads, and other platforms is blended and shown together on charts. This makes it easy to compare what works best and what underperforms.
This CEO dashboard is designed by Coupler.io, and you can easily connect your data sources using its built-in connector. It won’t cost you a penny to preview and try the dashboard with your data!
At the same time, it’s also available as a template for multiple destinations, including Google Sheets, Looker Studio, Power BI, and Tableau. If you’re interested in any of those, pick the one you would like to get started.
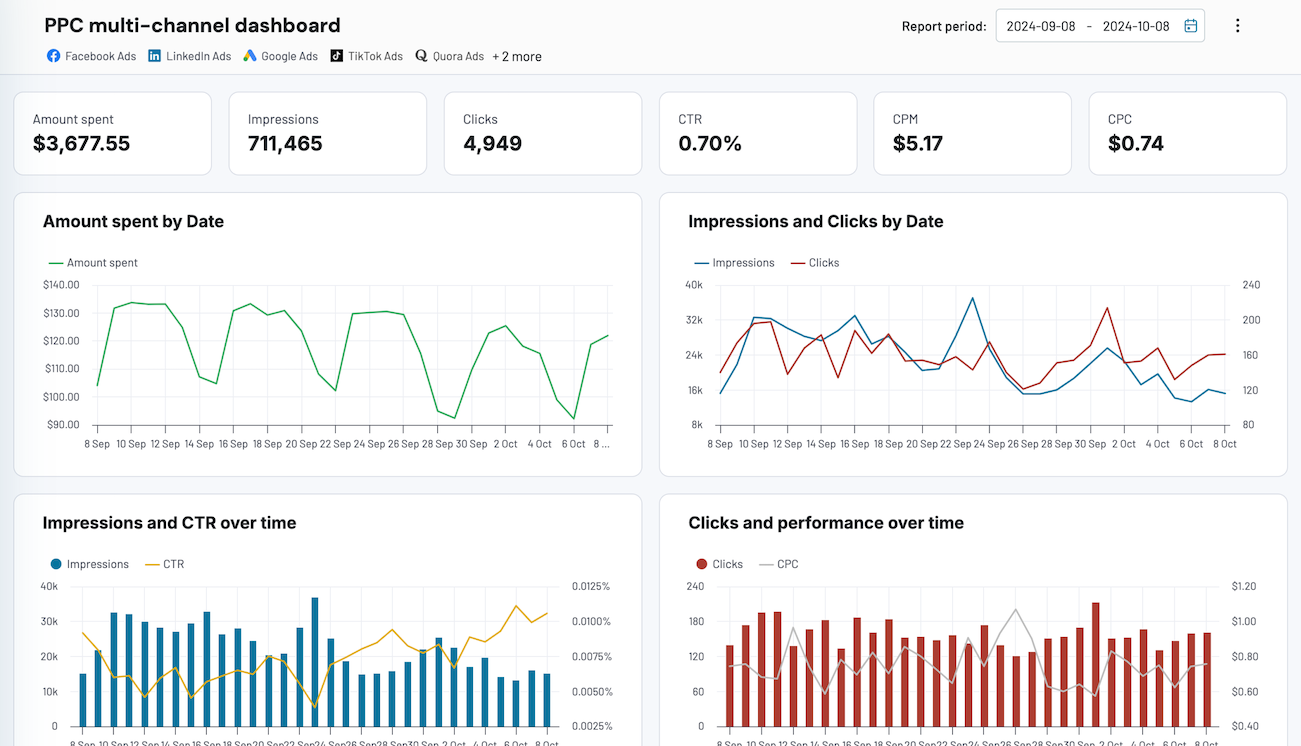


2. PPC monthly budget in Google Sheets (+ template)
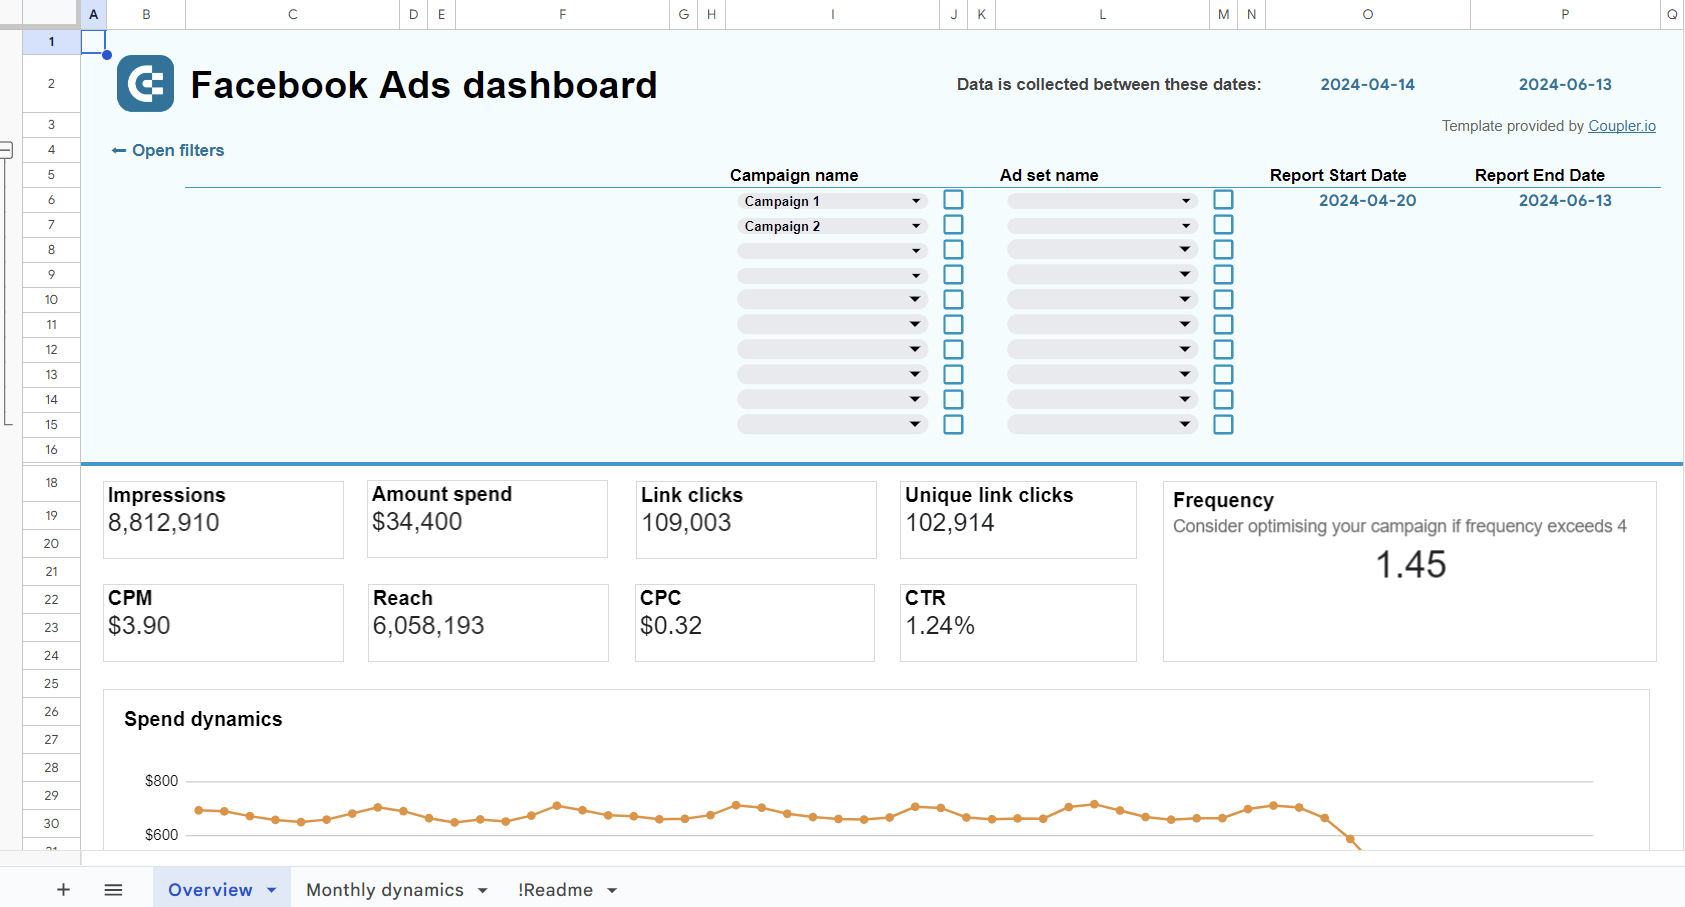
This dashboard template also lets you accumulate data from multiple ad platforms. However, it’s designed in Google Sheets and focuses on insights related to budgeting and ad expenses.
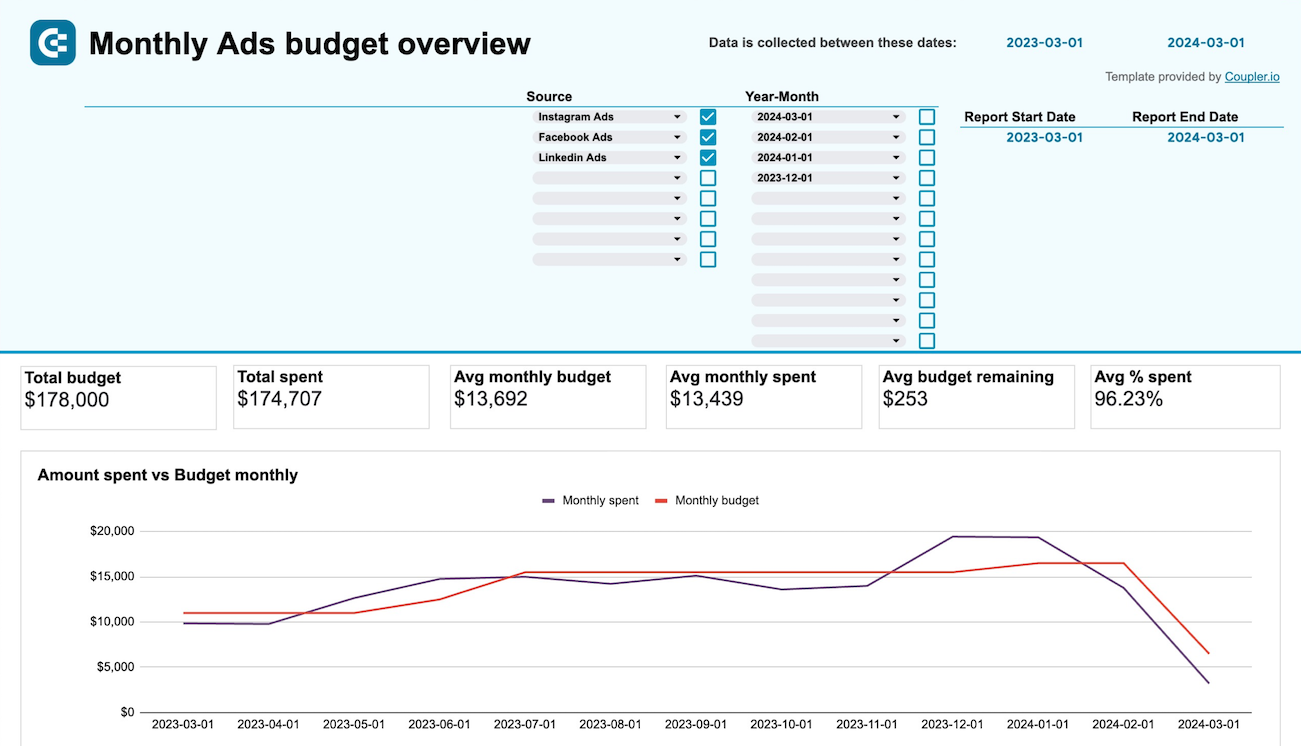
The PPC monthly budget dashboard provides a budget overview for the current month. It also displays spending predictions and alerts which are quite helpful to avoid budget overspending. With the dashboard, you can track the dynamics of ad expenses across common platforms including Facebook, Google, LinkedIn, Instagram, and others. The template is designed in Google Sheets and lets you connect multiple ad source accounts to the dashboard.
By the way, this dashboard was featured in our blog post about latest marketing trends. Check it out!
Platform-specific PPC marketing dashboard examples
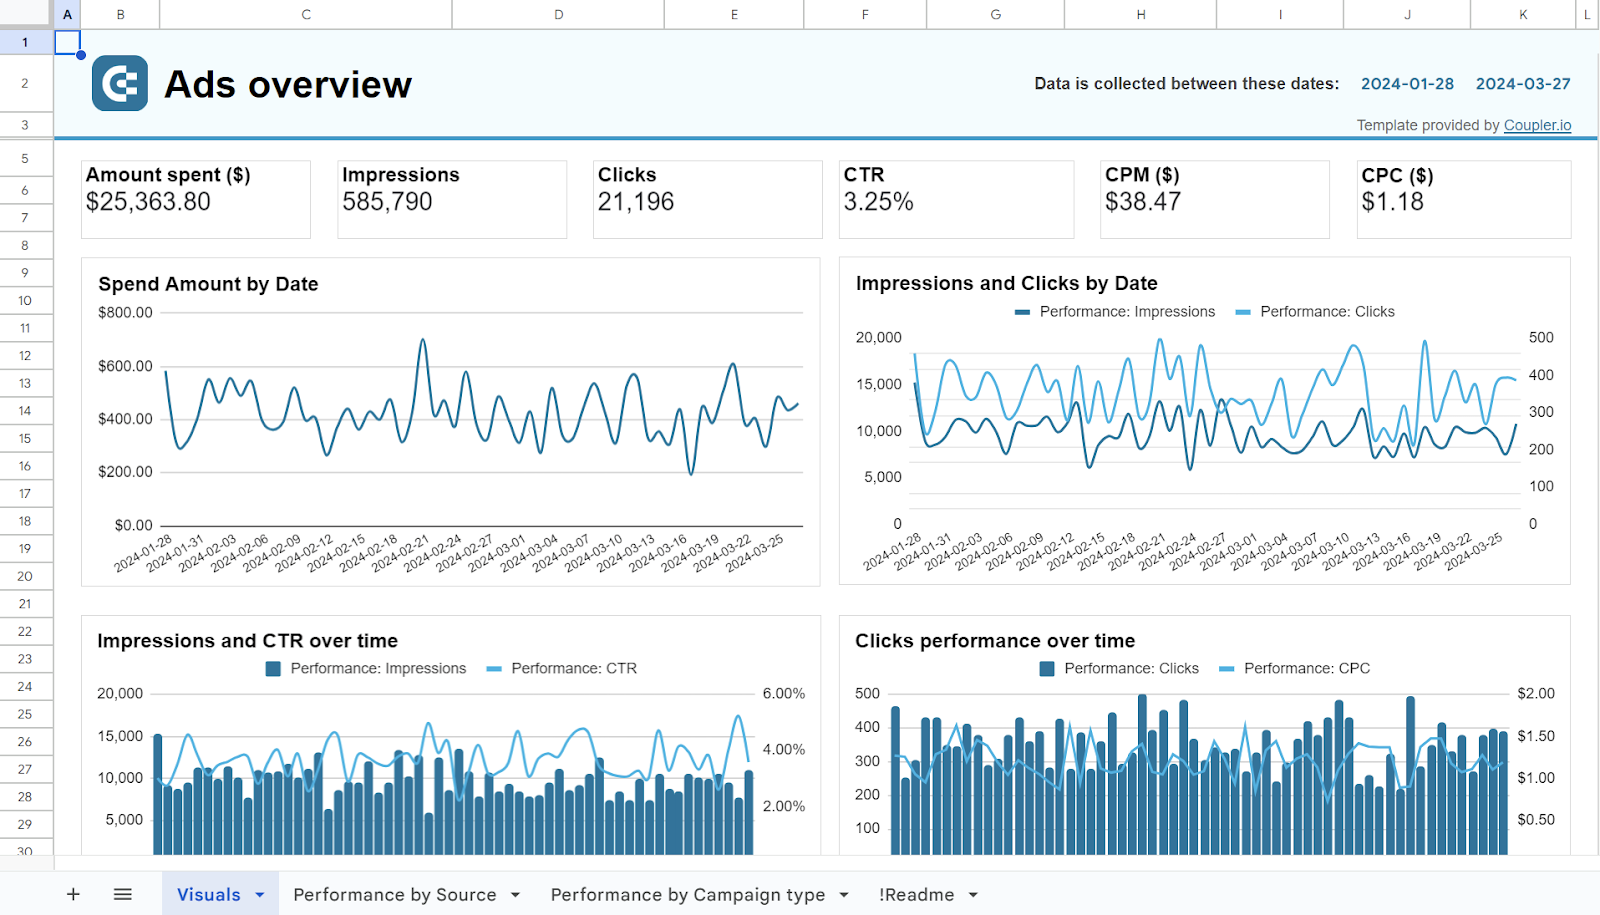
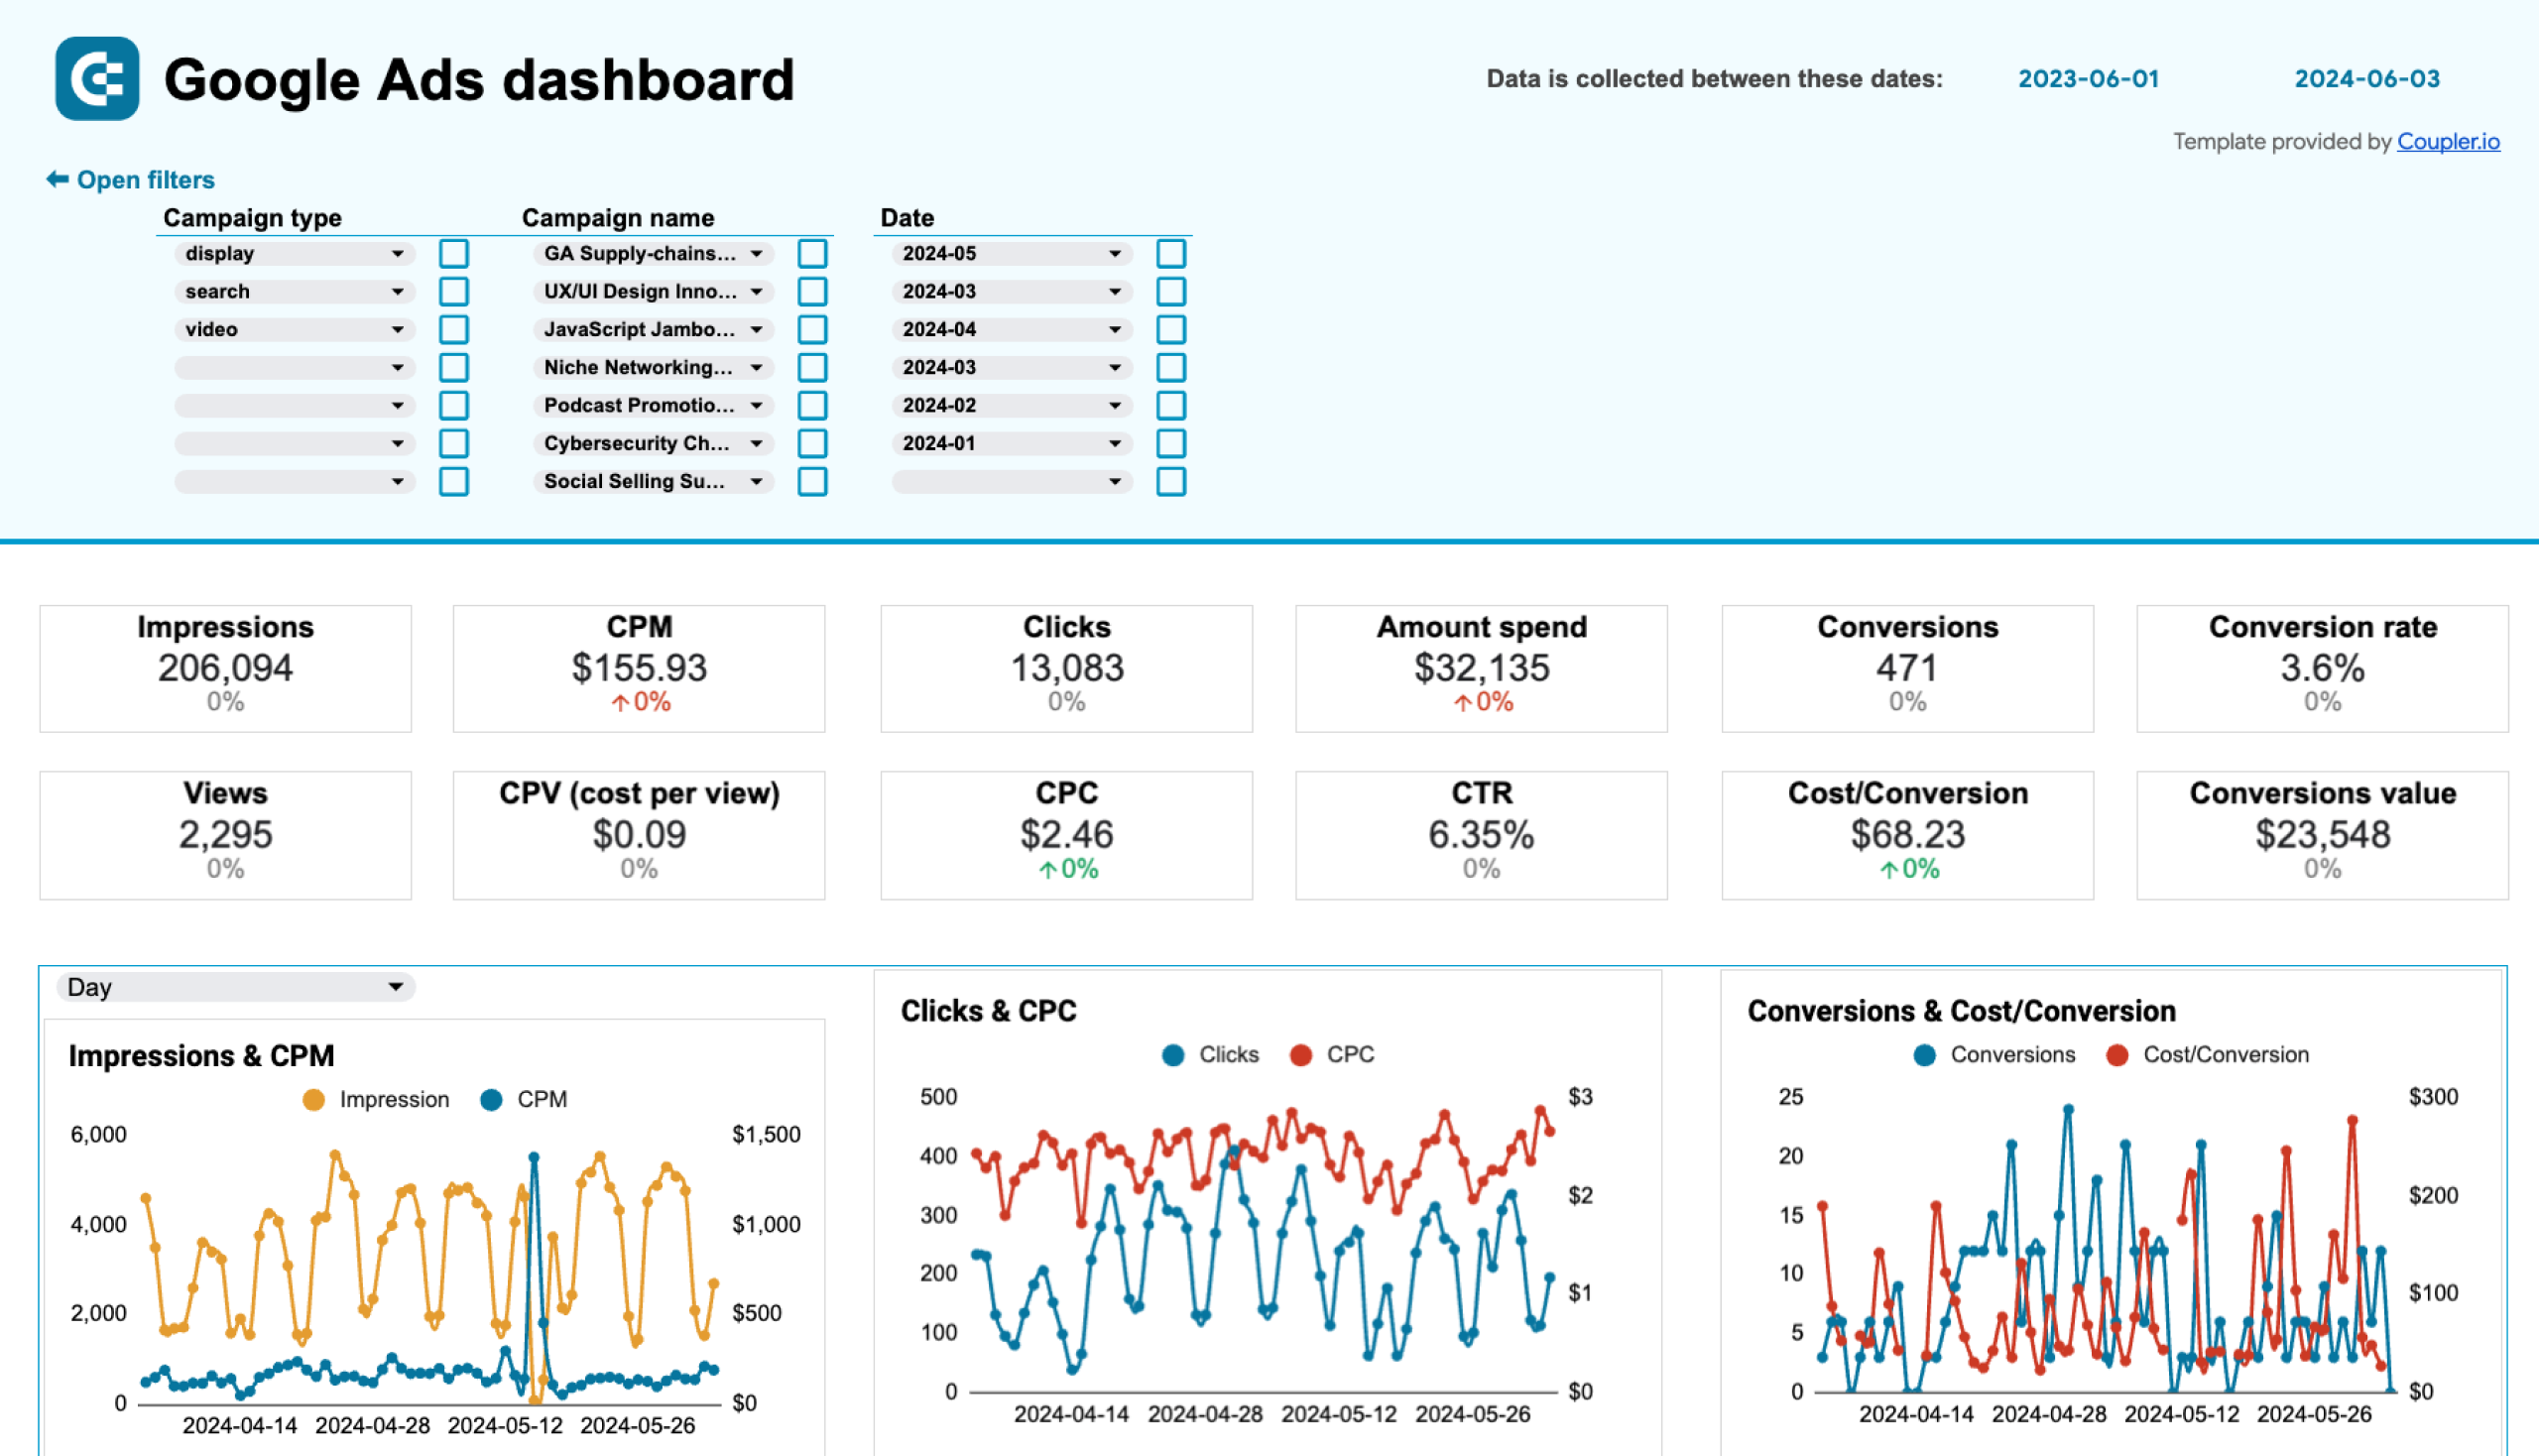
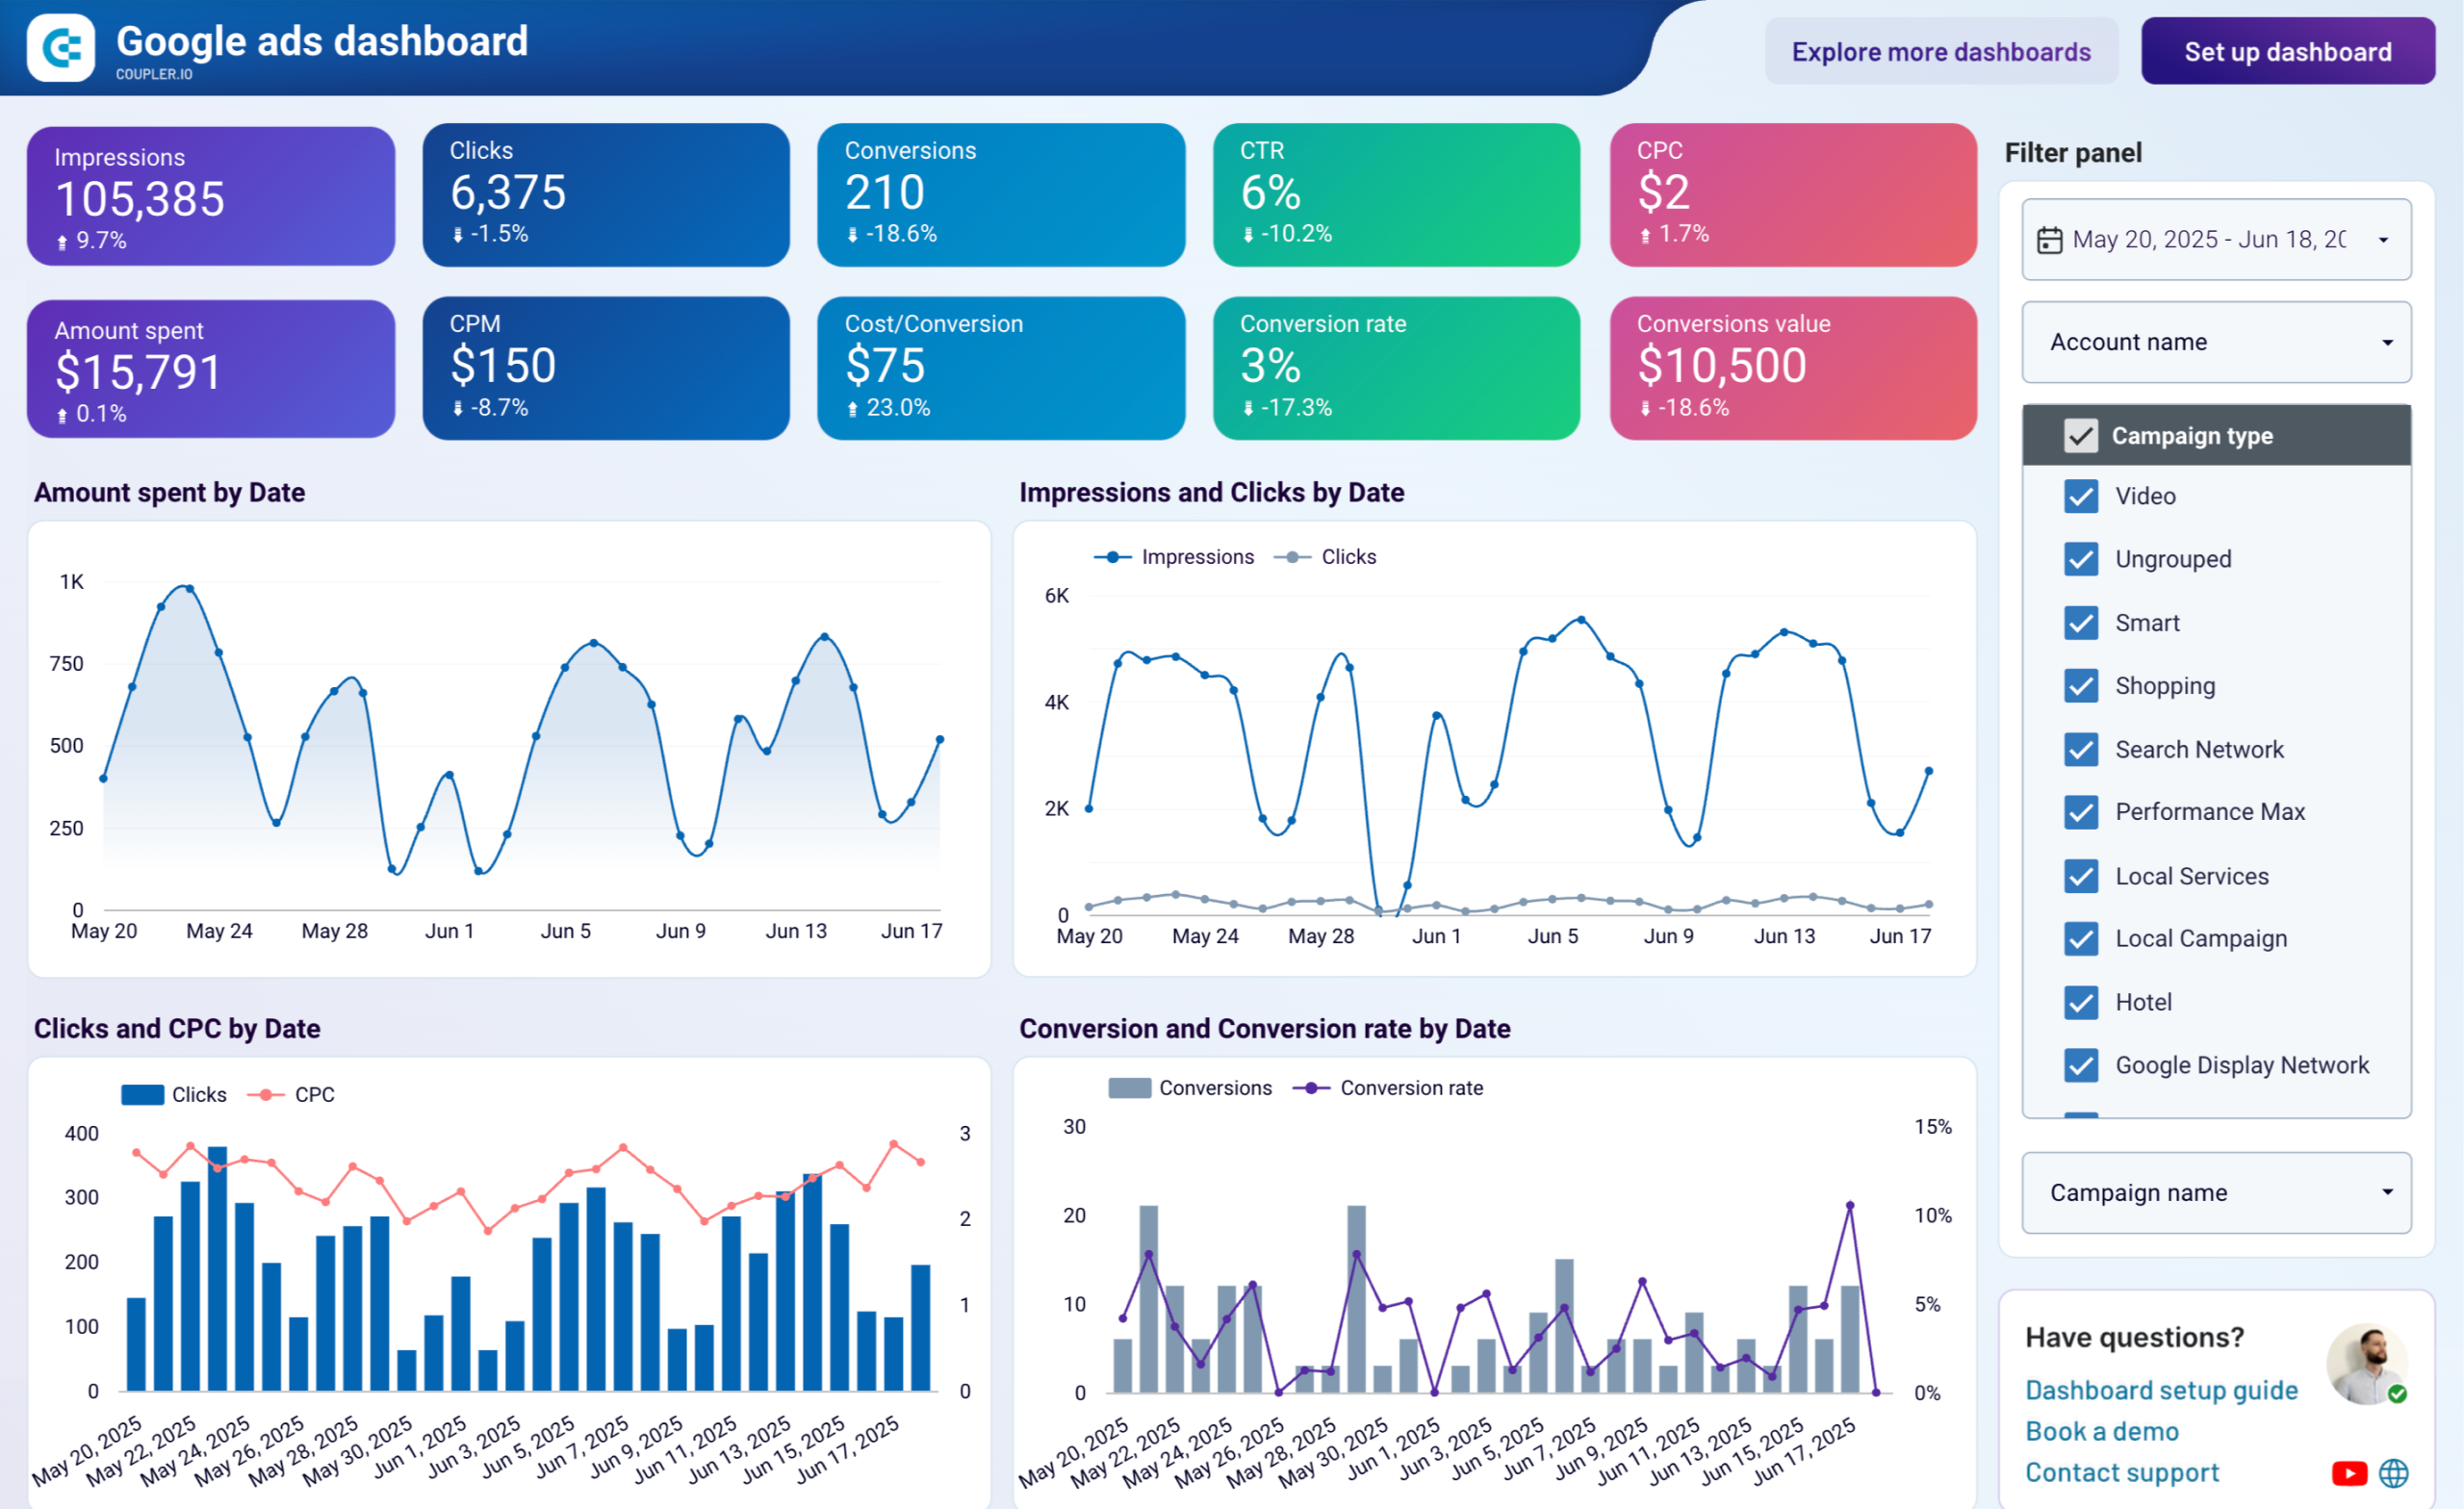
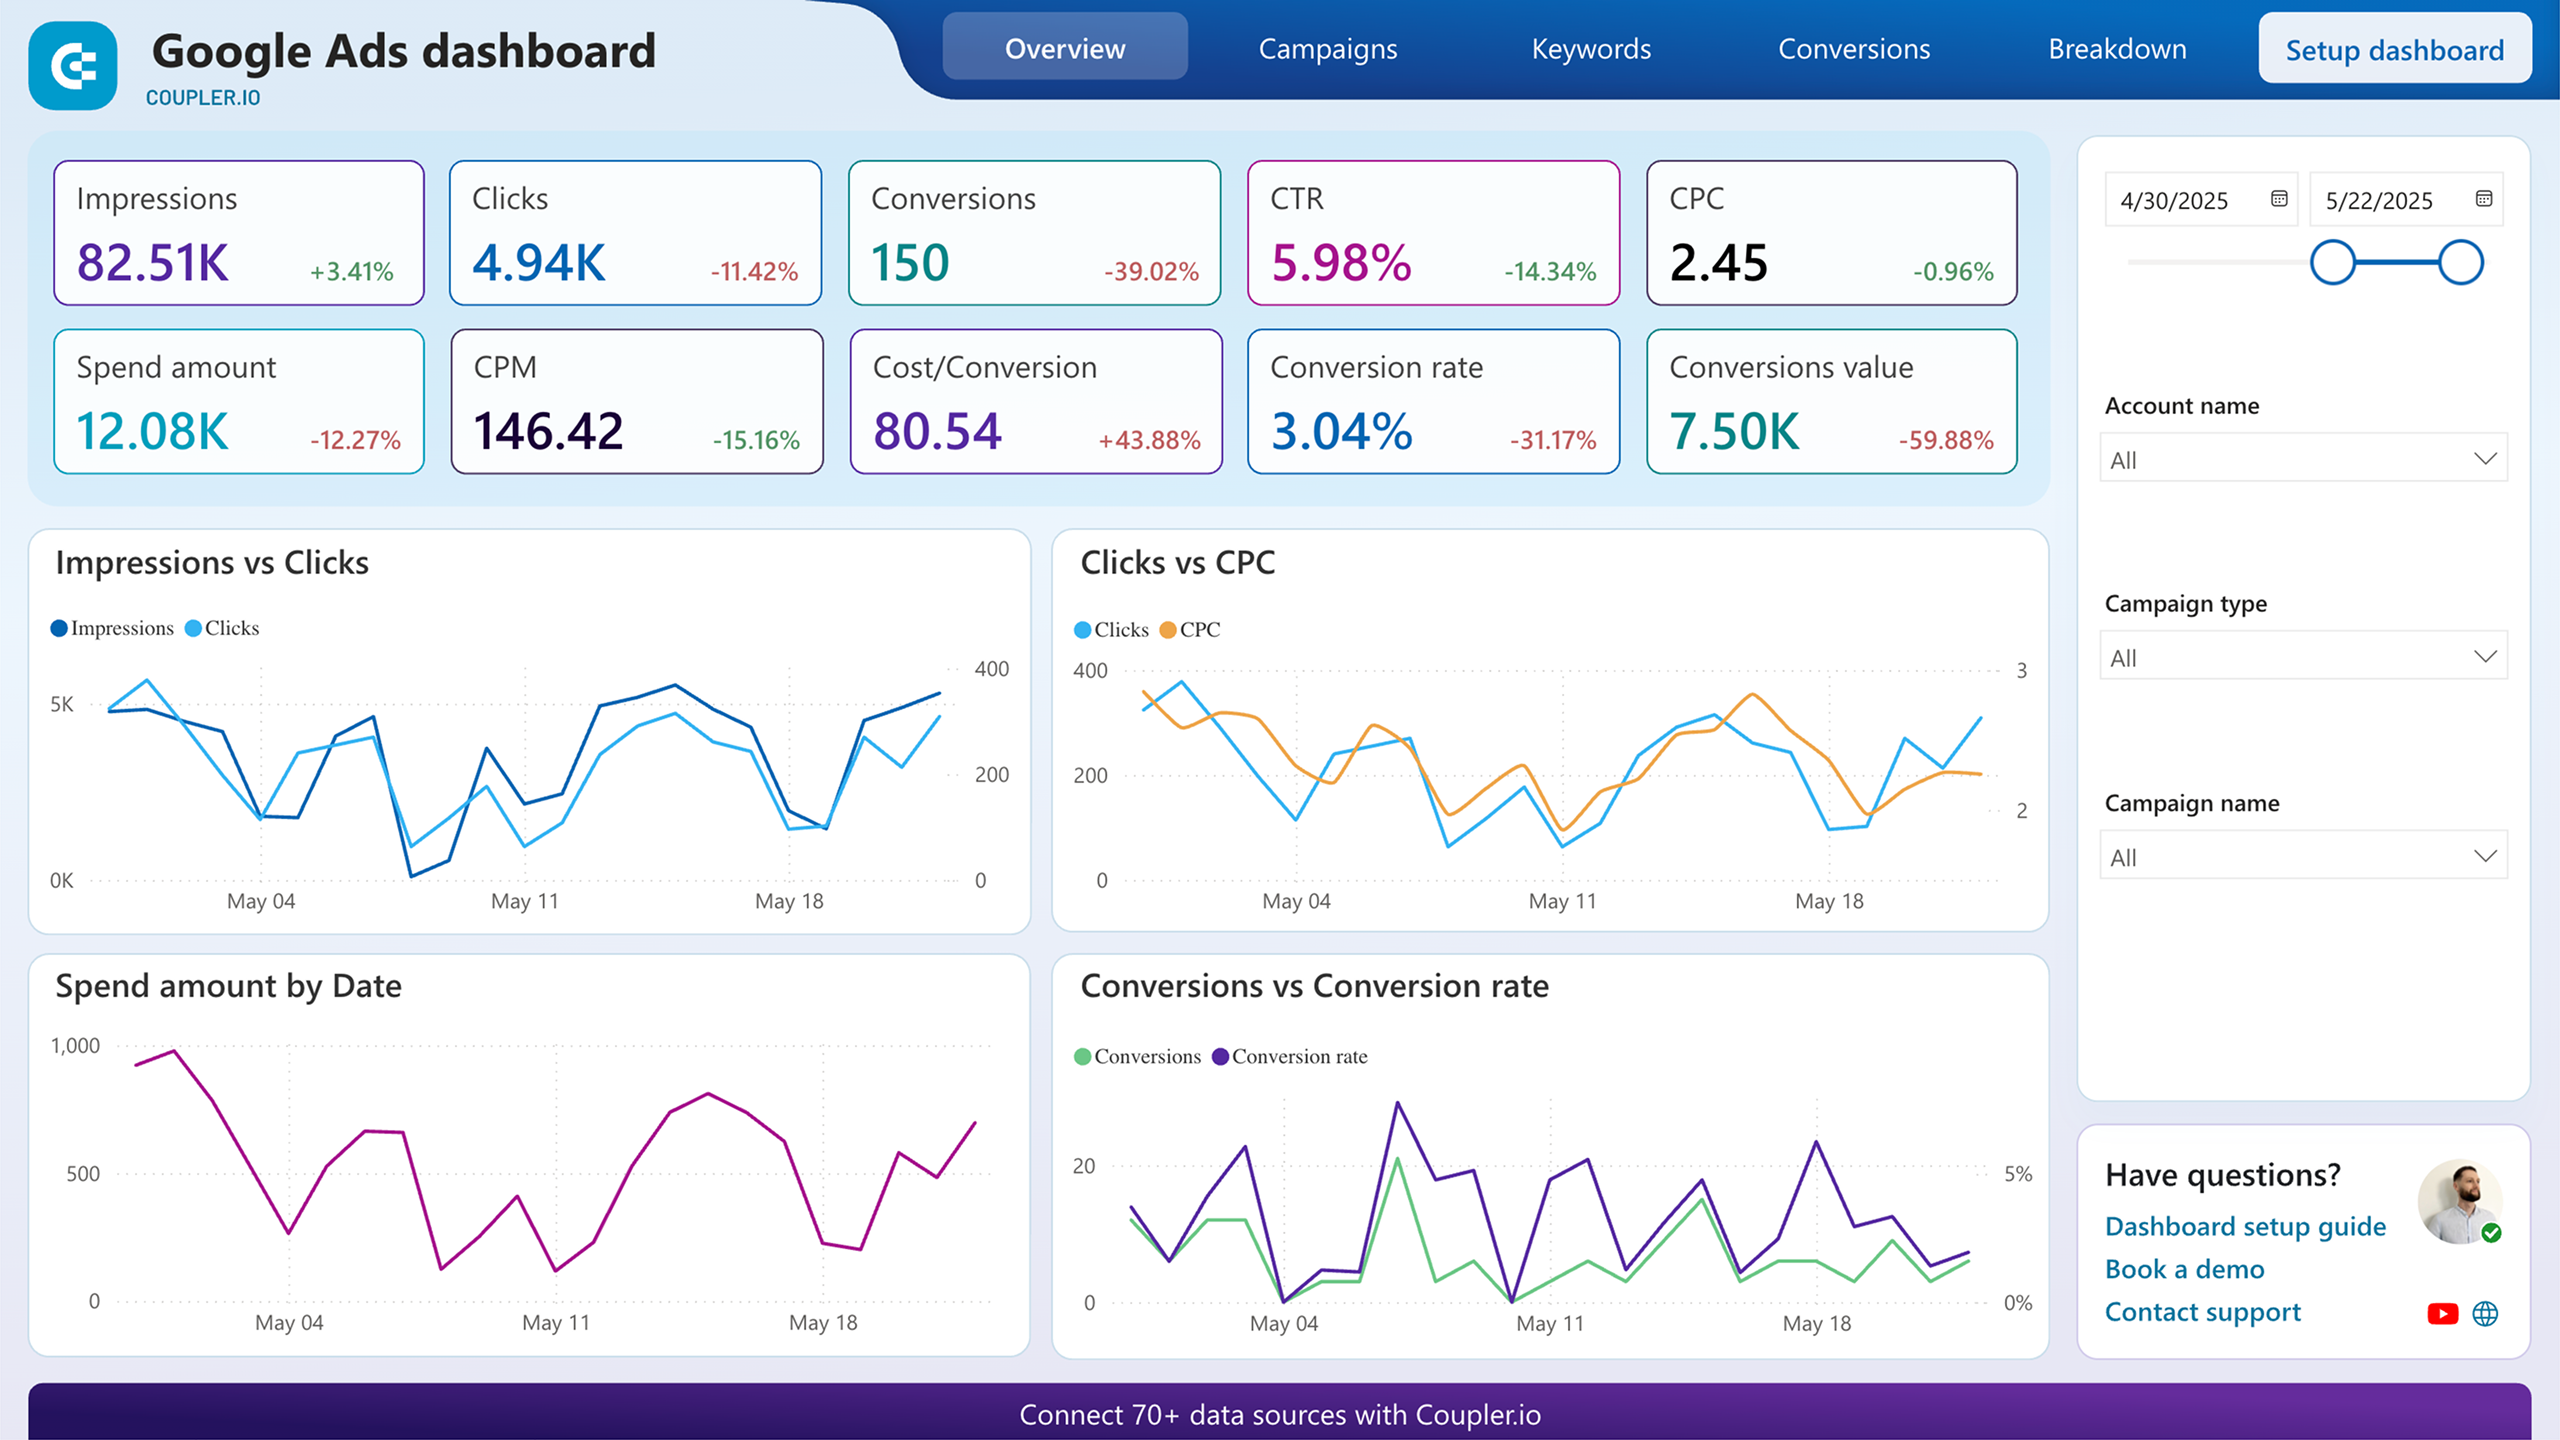
3. Google Ads dashboard (+ template)
PPC dashboards can cover multiple advertising platforms. At the same time, it’s good to have a report or dashboard dedicated to each platform you use for advertising campaigns. A Google Ads dashboard is meant to provide you with all the essential performance metrics at your fingertips.
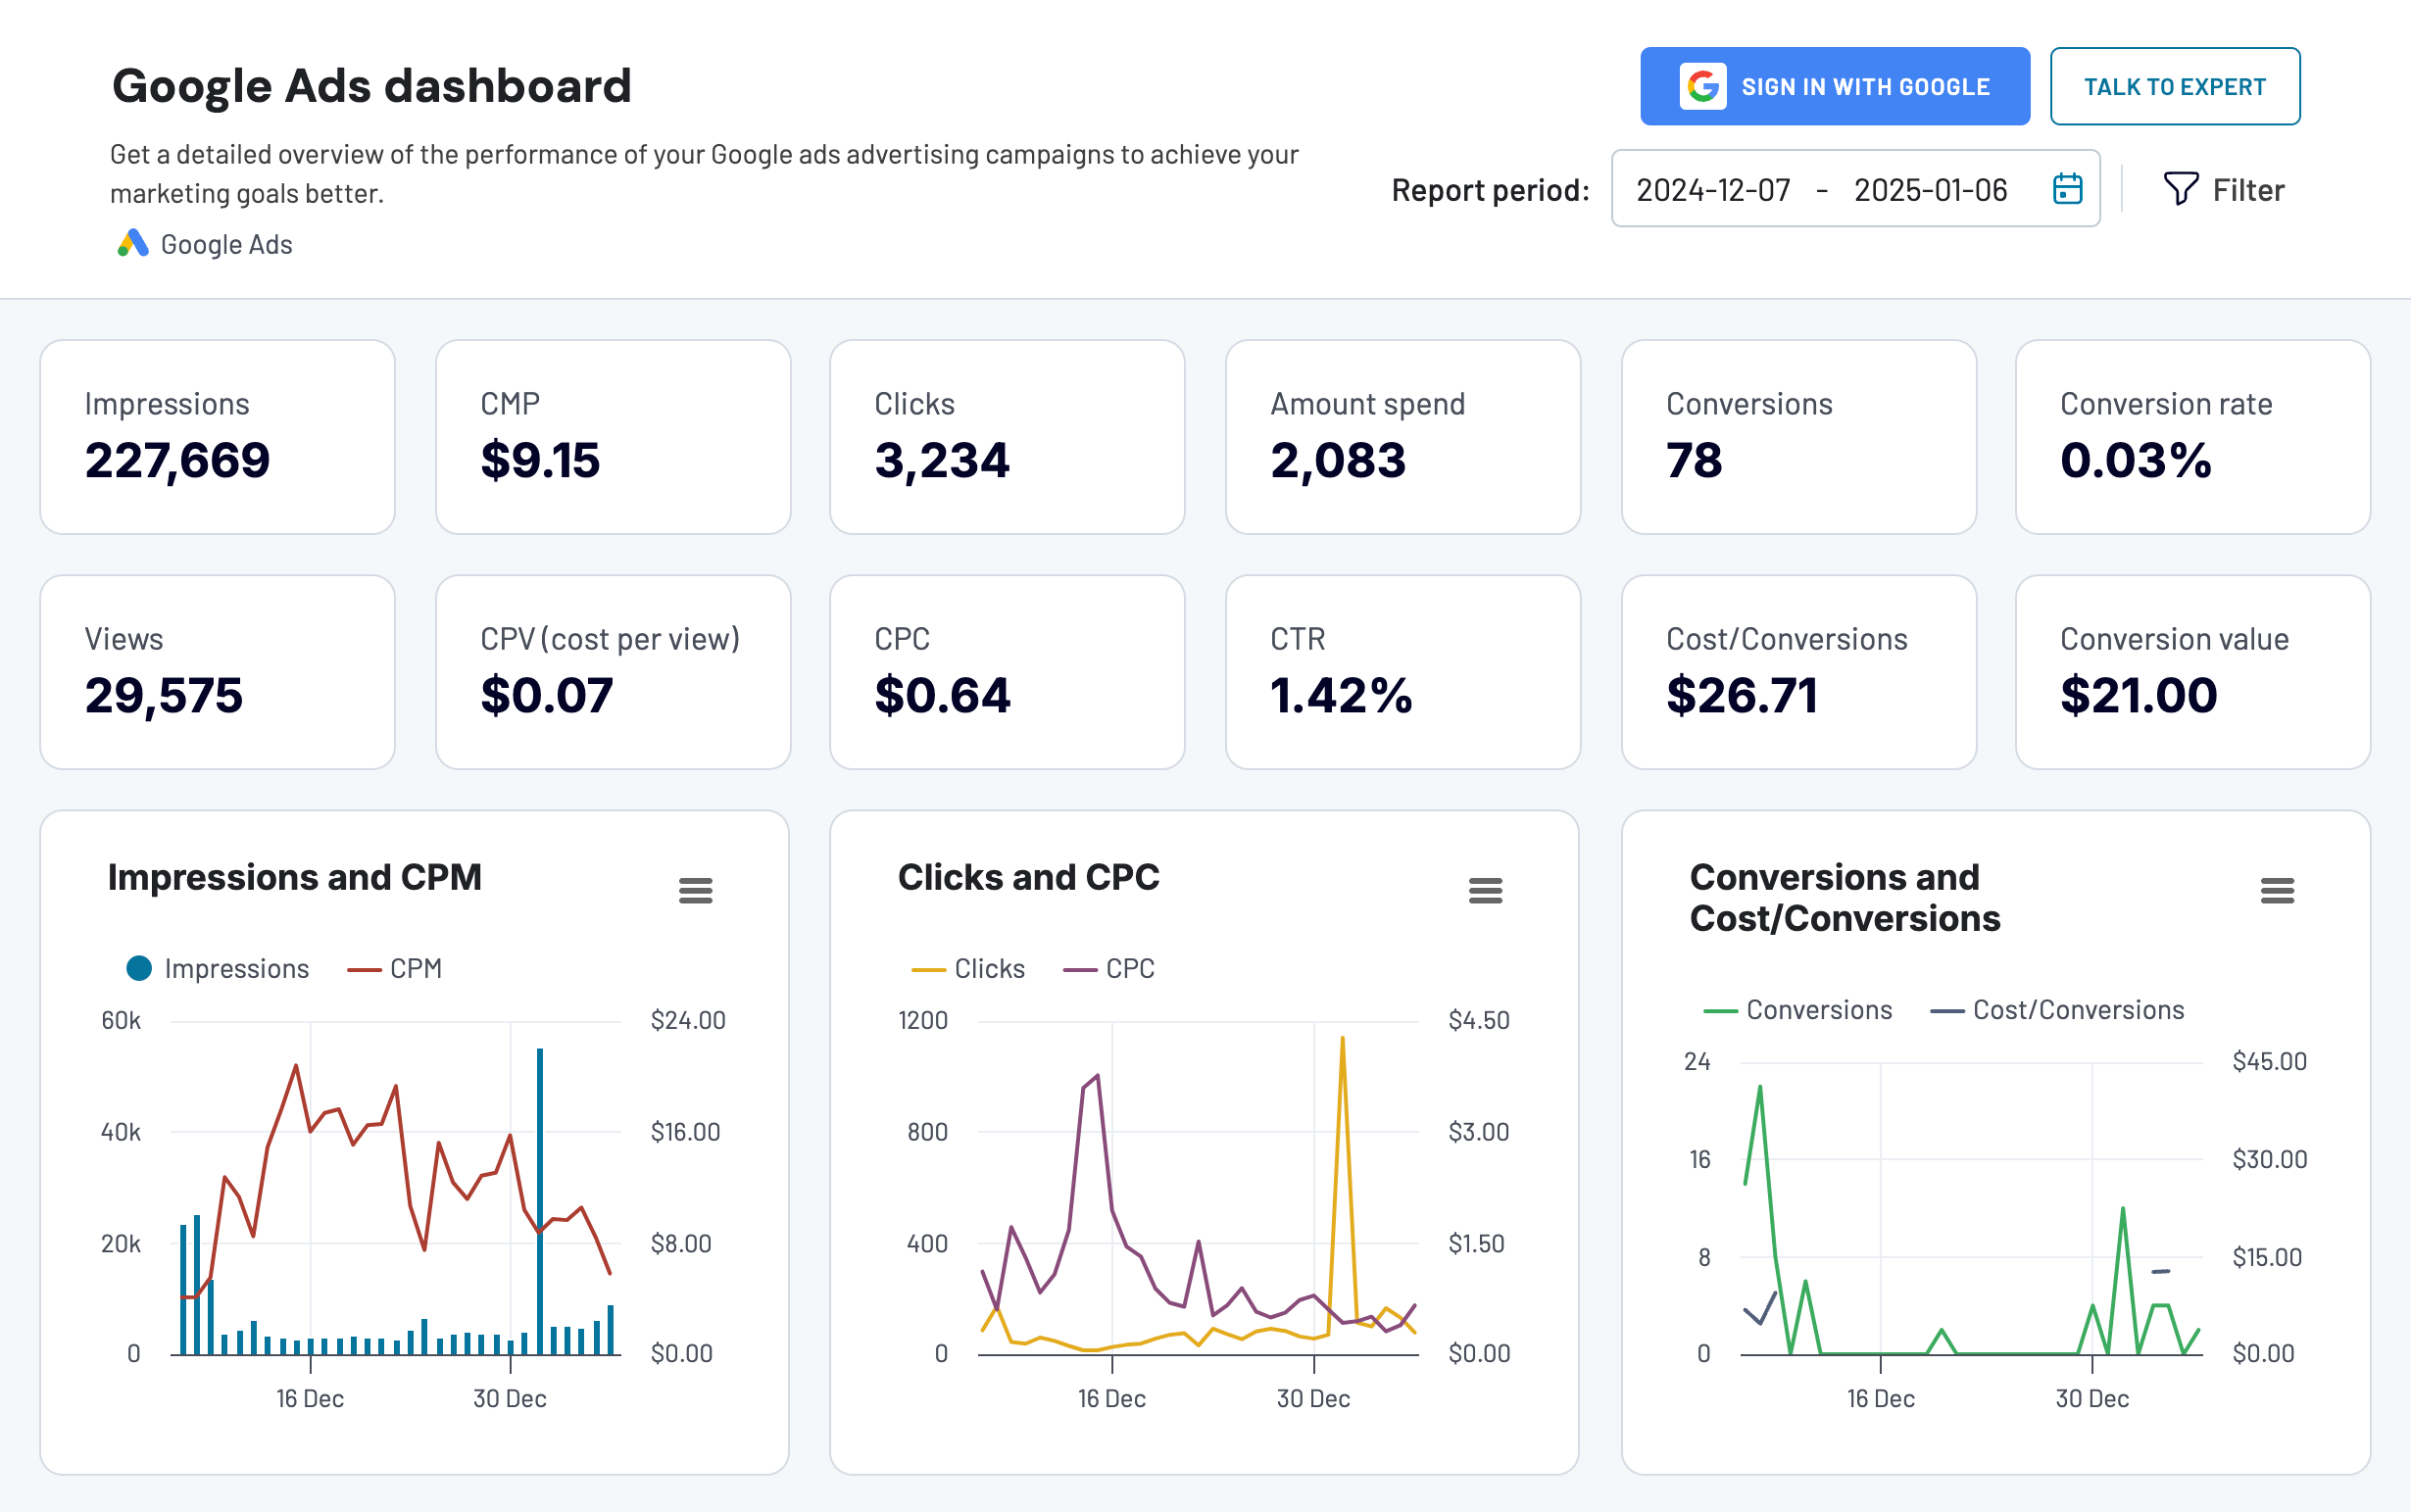
With this dashboard, you can assess the effectiveness of your campaigns in Google Ads and get the insights to make informed decisions. The dashboard is designed by Coupler.io and equipped with a built-in connector to load your data easily. Preview and try it with your Google Ads account connected for free!
The dashboard is also available as a template in Google Sheets, Looker Studio, and Power BI. Pick the version that meets your reporting needs and try it out.
4. Google Ads leads dashboard (+ template)
This dashboard is specifically designed for businesses running lead generation campaigns on Google Ads. It consolidates lead performance data, conversion tracking, and campaign effectiveness metrics to help you optimize your search and display advertising strategy.
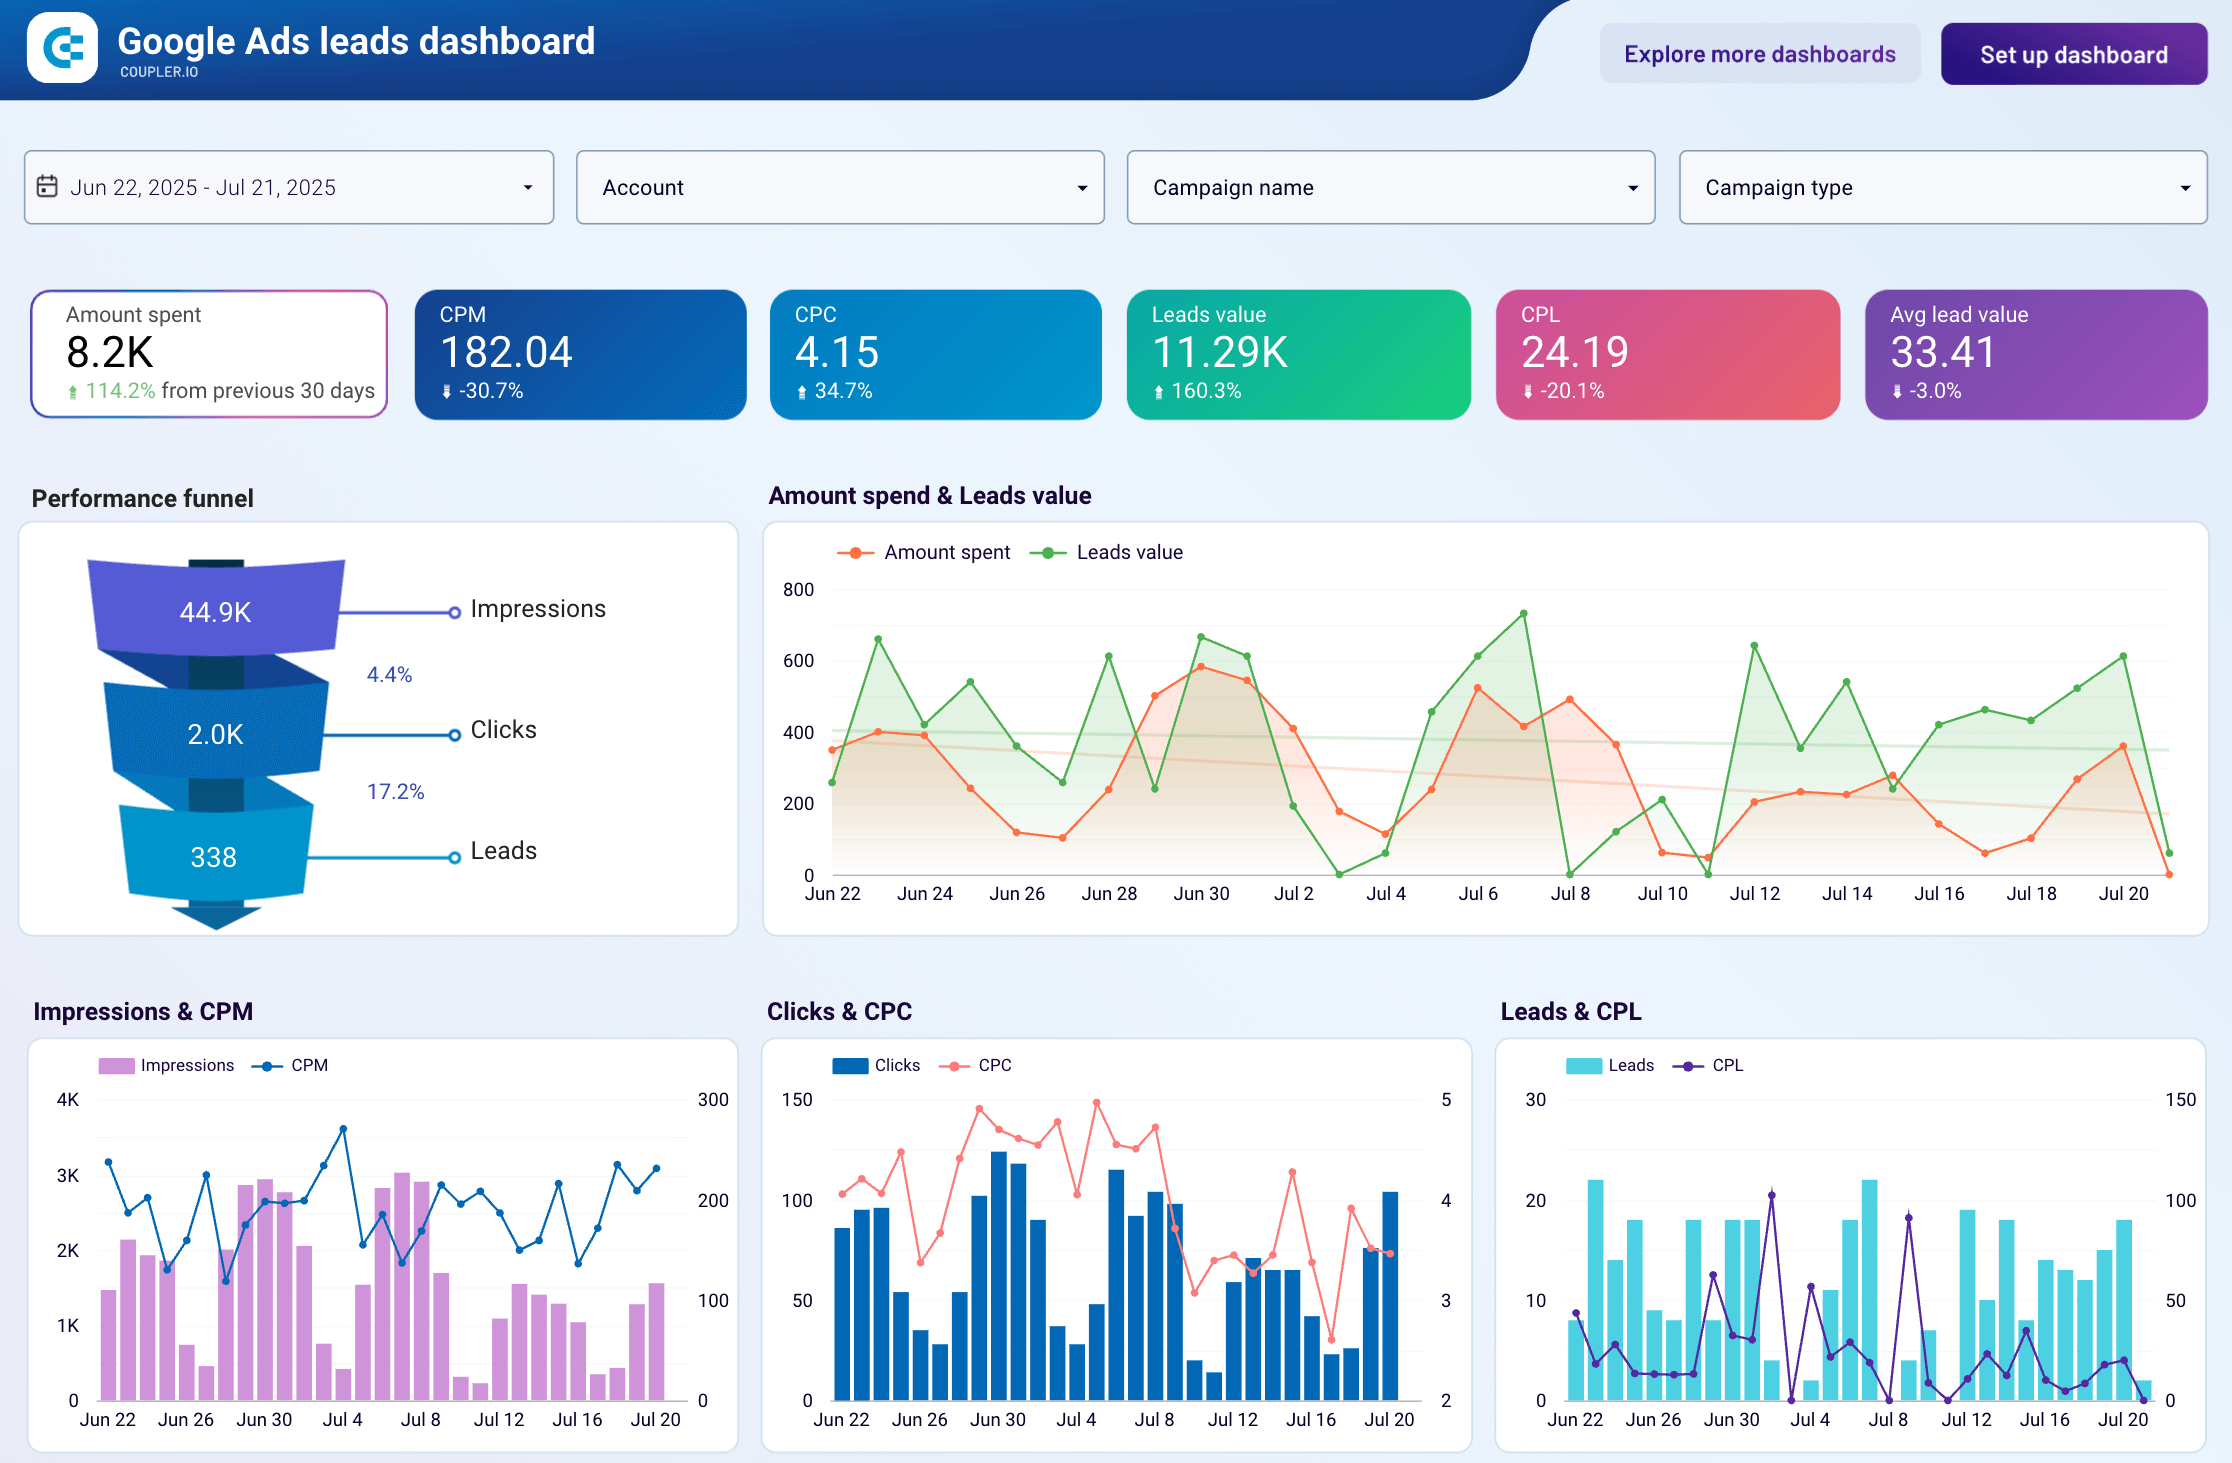
The dashboard provides a detailed analysis of how your ad spend converts into qualified leads. You can visualize the conversion path from impressions to leads, compare campaign performance side by side, and identify correlations between different metrics (clicks & CPC, leads & CPL) in a single screen. Use these insights to optimize your messaging and budget allocation strategy.
You can get a free Looker Studio dashboard template with a Coupler.io account. It only takes a few minutes to create a copy and automatically connect your Google Ads data.
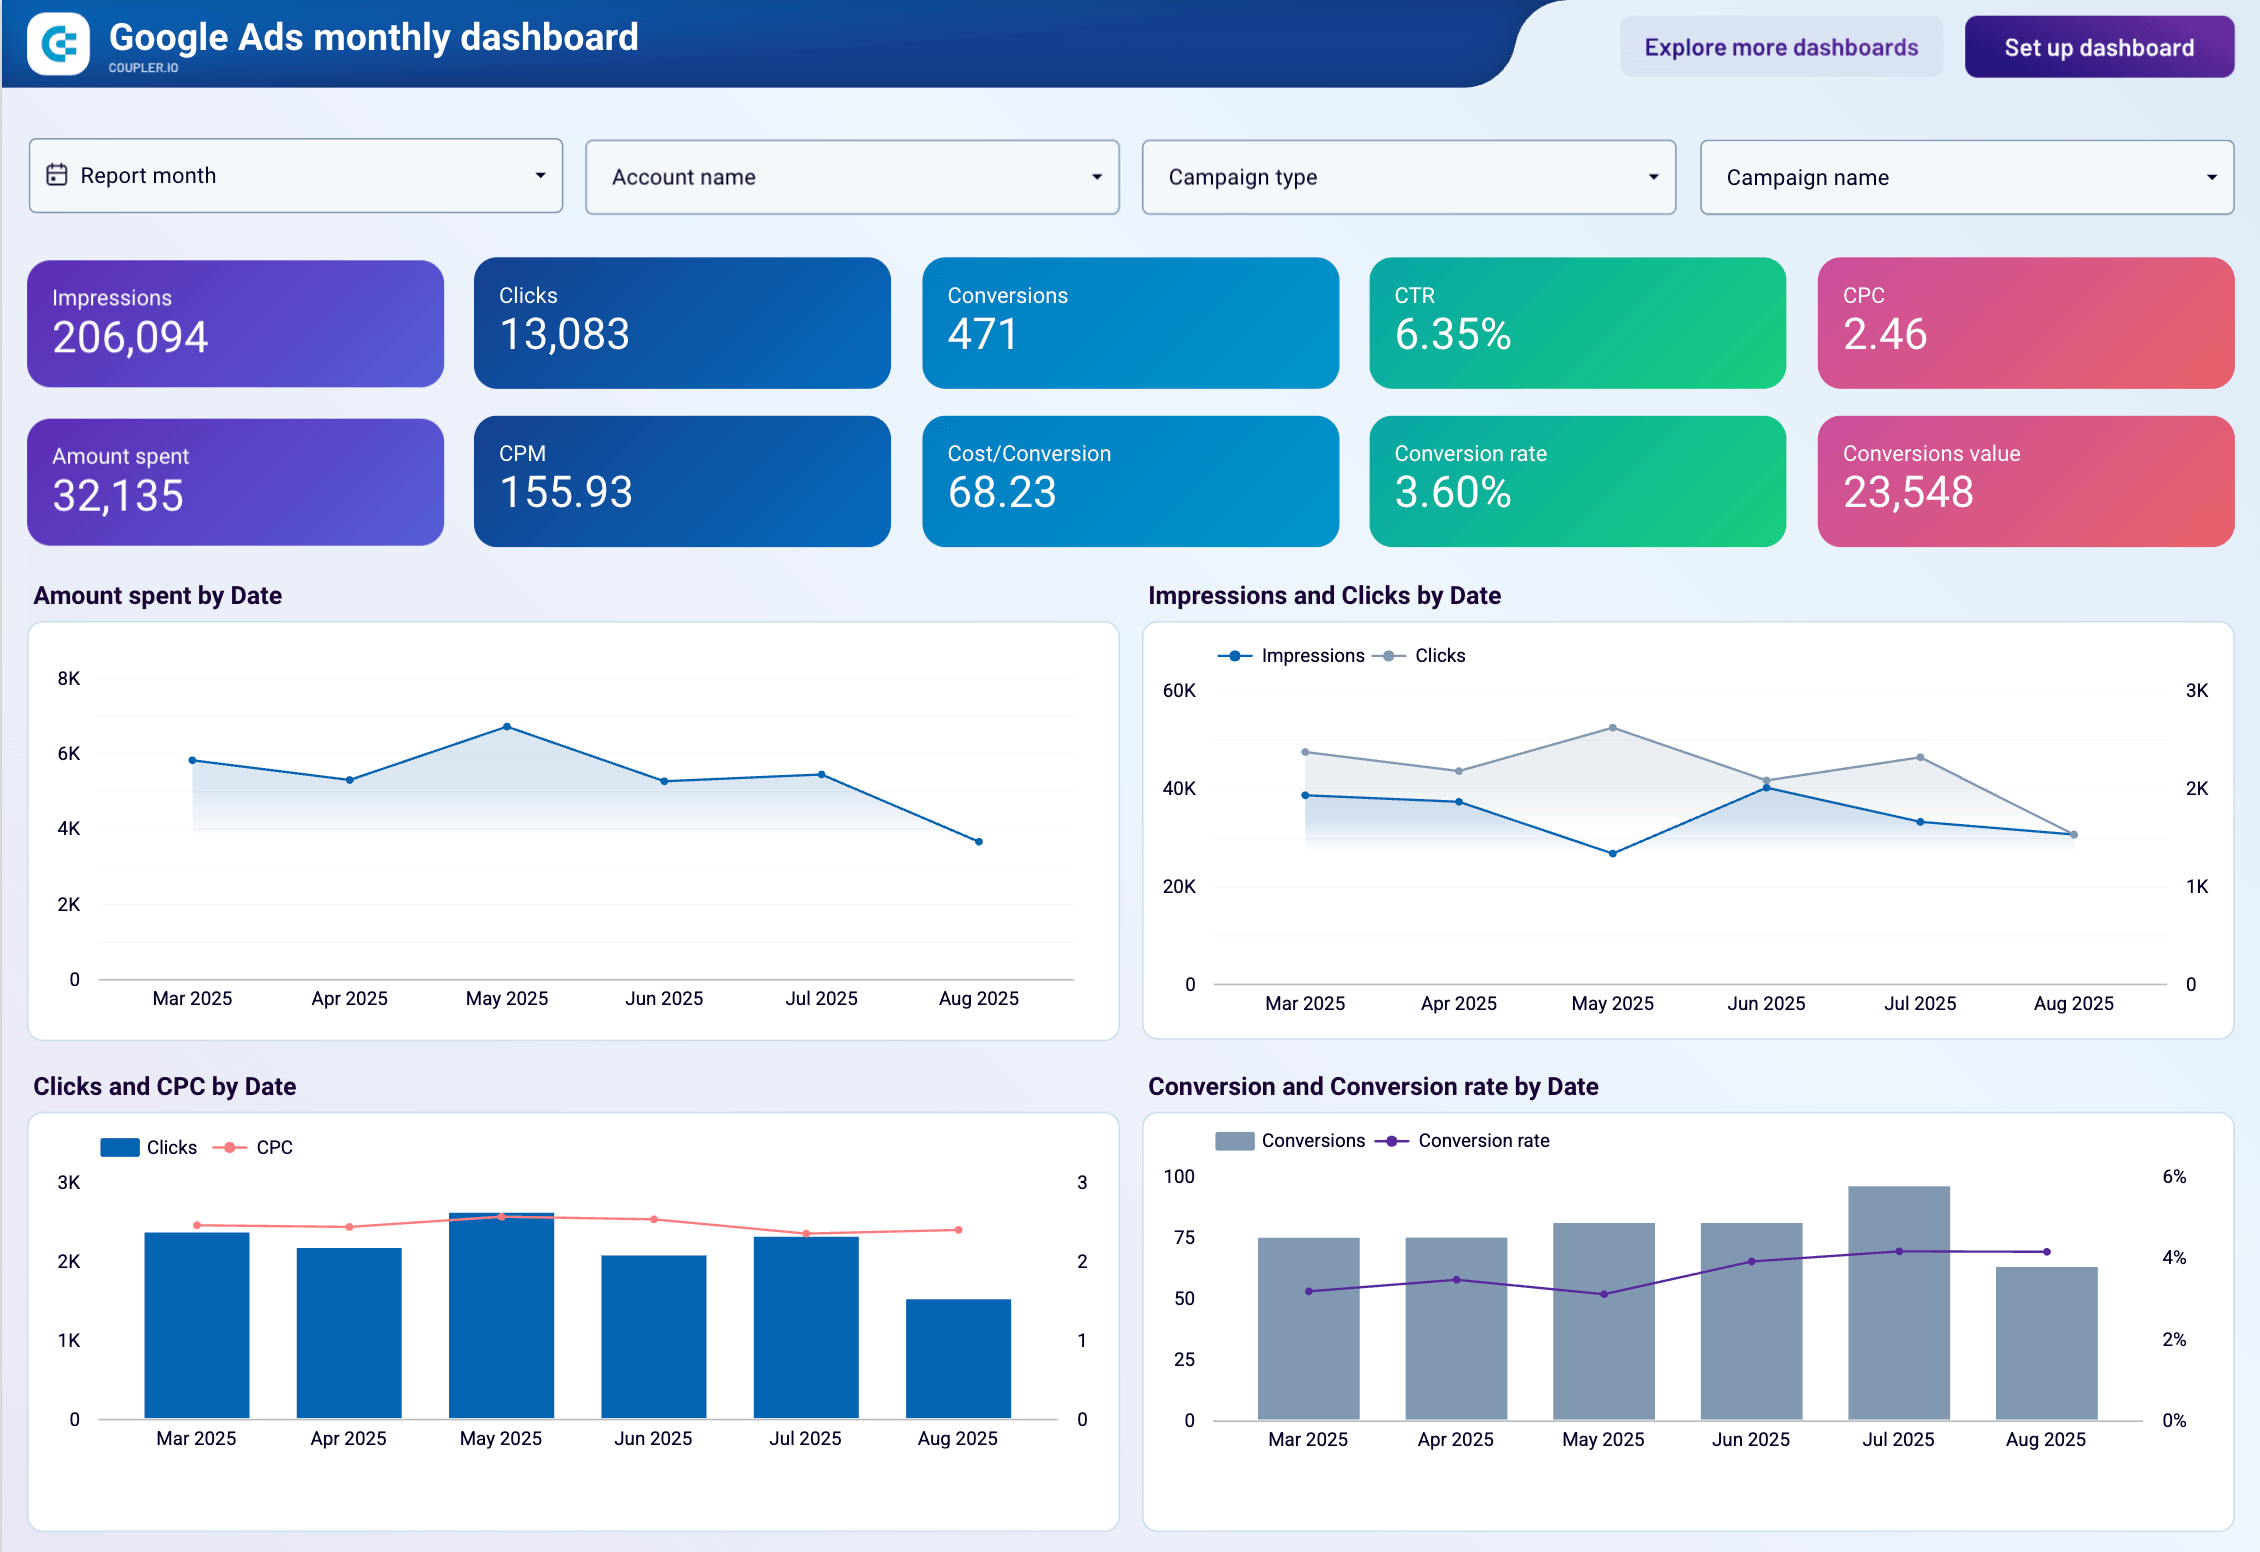
5. Google Ads monthly performance dashboard (+ template)
For marketers who need to analyze Google Ads performance over monthly periods rather than daily fluctuations, this dashboard provides comprehensive insights into budget efficiency, demographic patterns, and seasonal trends. It’s designed to support budget planning, stakeholder presentations, and long-term campaign optimization.
Google Ads monthly performance dashboard
 Preview dashboard
Google Ads monthly performance dashboard
Preview dashboardThe dashboard displays key monthly metrics including impressions, clicks, conversions, and costs across different campaign types. You can compare spend distribution against conversion distribution using dual pie charts to quickly identify budget misallocations. Geographic heat maps show country-level performance trends, while demographic breakdowns reveal cost-per-conversion differences by device type. The keyword performance table aggregates monthly data to help you distinguish consistent performers from seasonal keywords.
This dashboard template is designed by Coupler.io for Looker Studio and equipped with a built-in connector. You can easily connect your Google Ads account and start analyzing your monthly advertising performance.
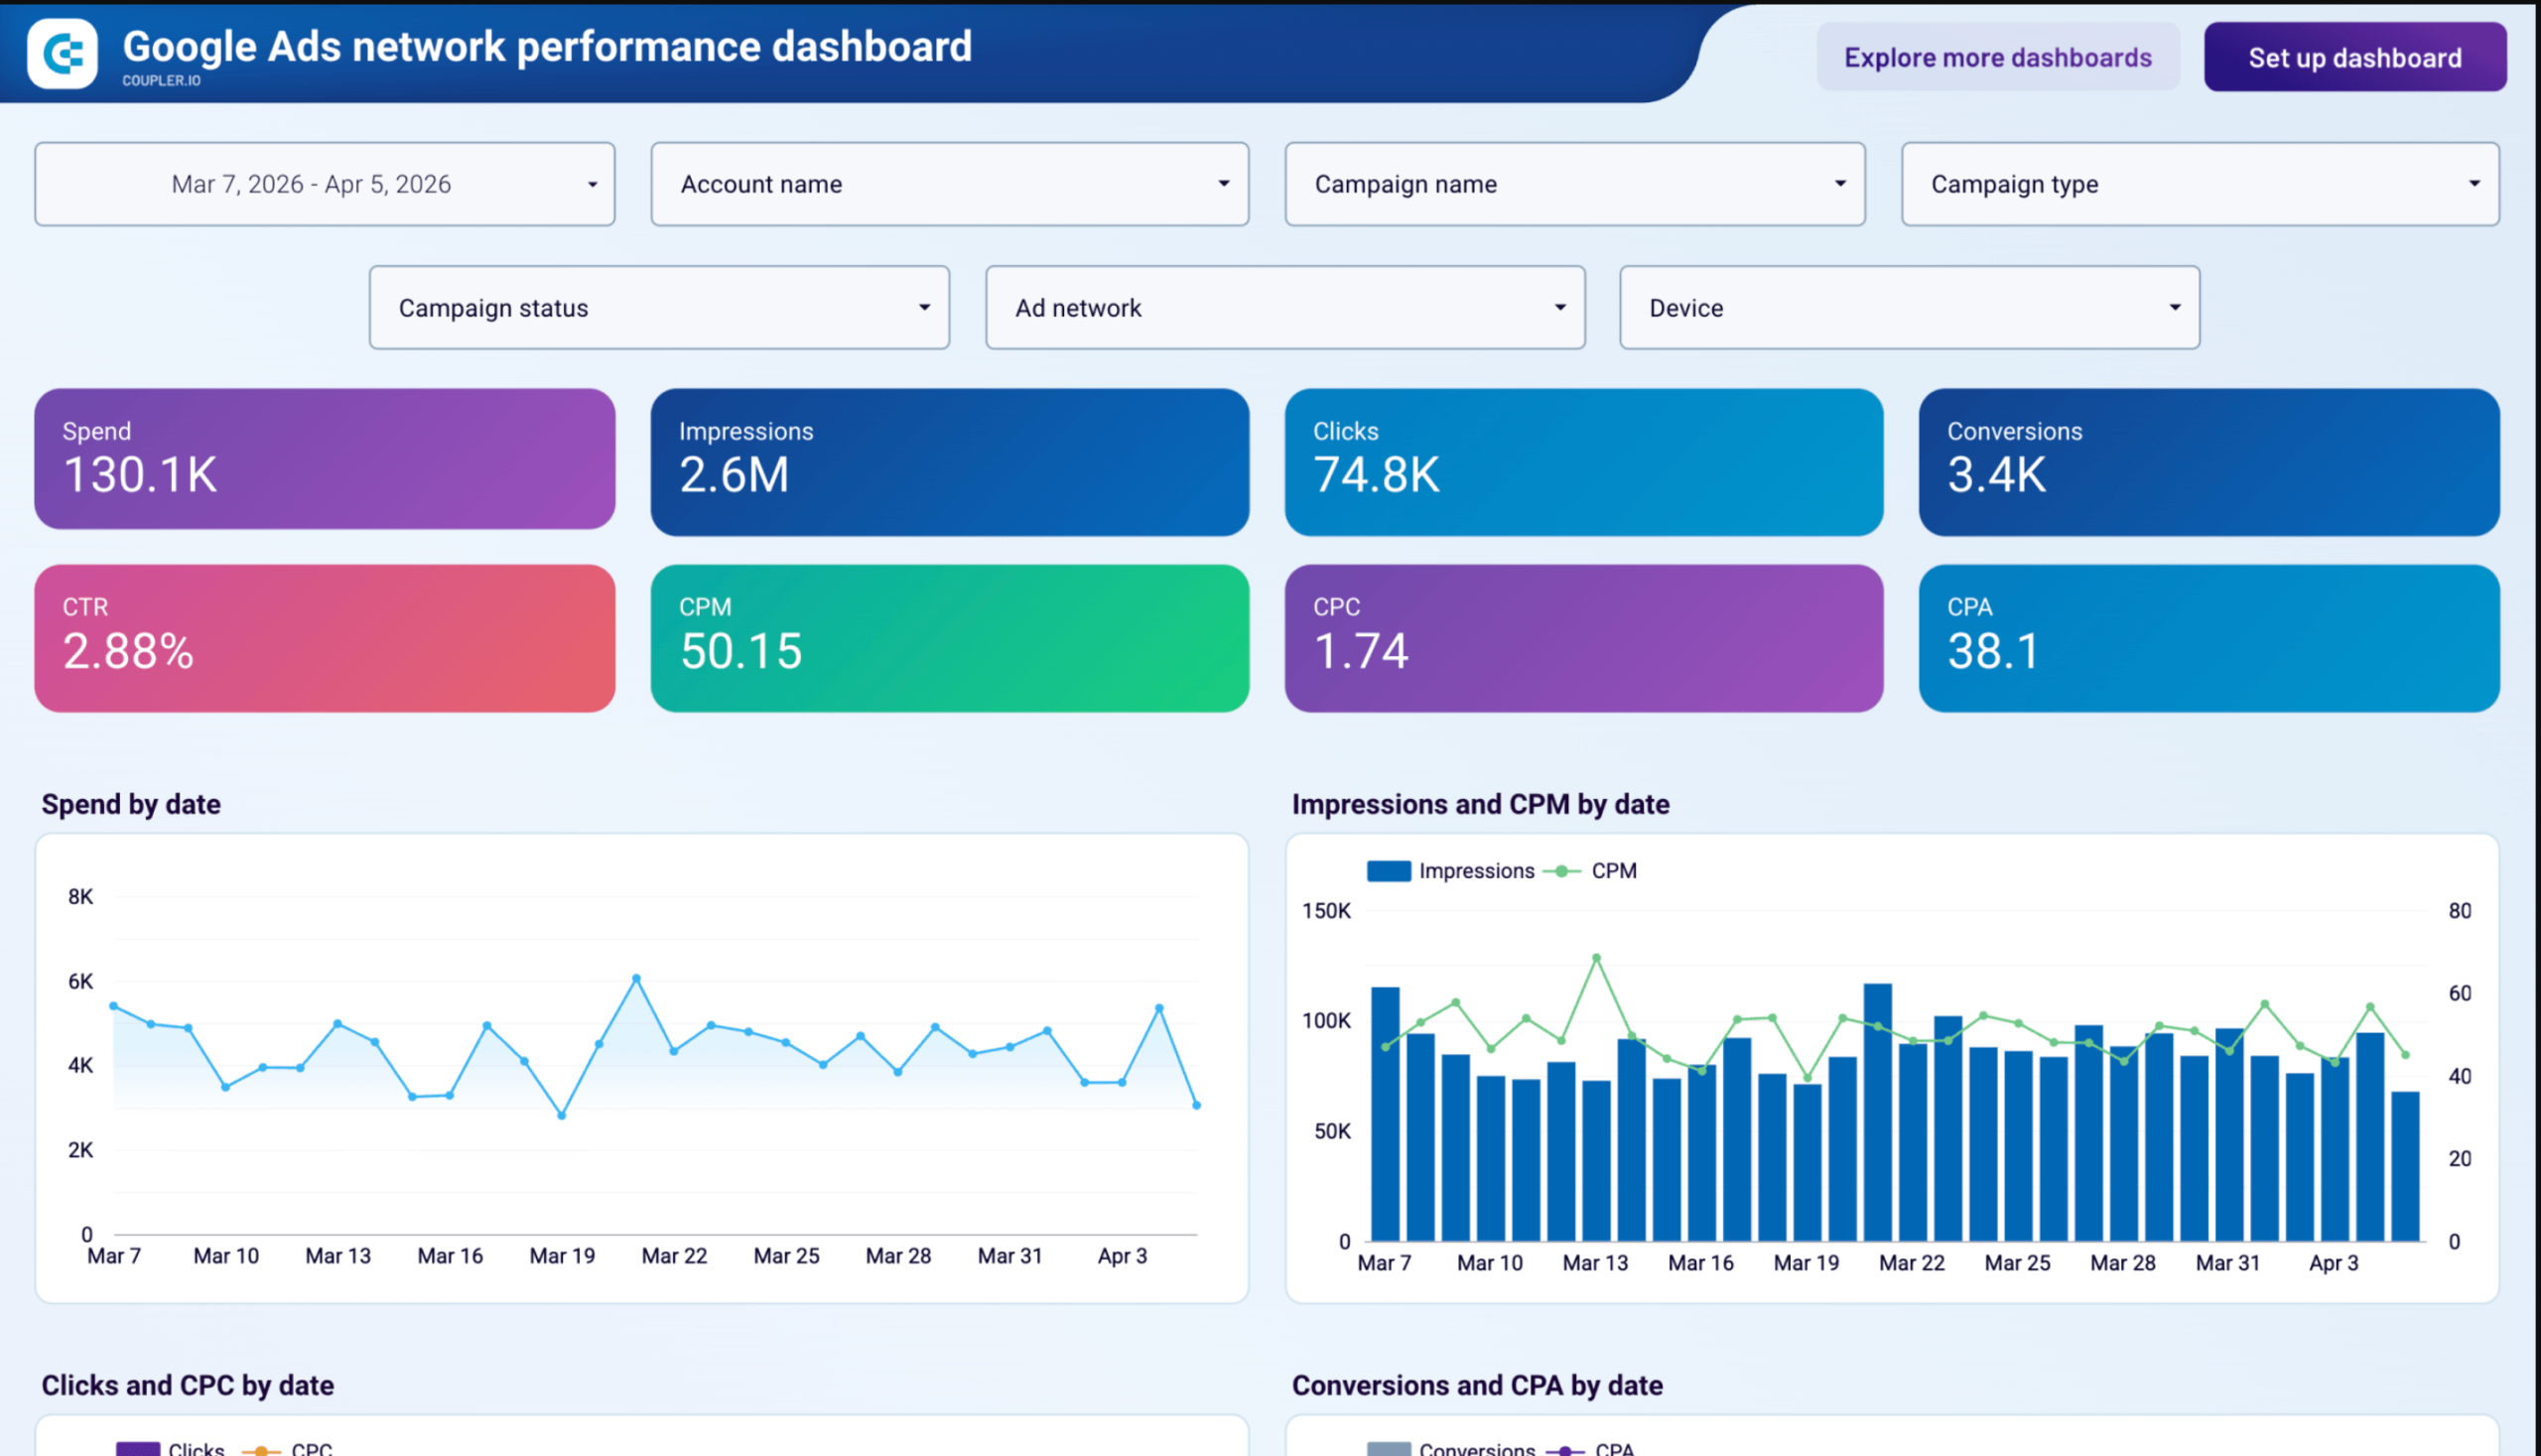
6. Google Ads network performance dashboard (+ template)
PPC managers often discover that their Google Ads CPA looks acceptable in aggregate until they split it by ad network. The Google Ads network performance dashboard by Coupler.io breaks down spend, impressions, clicks, and conversions across Search, Content, YouTube Watch, YouTube Search, and Search Partners so you can see exactly where your budget converts and where it doesn’t.
Google Ads network performance dashboard
 Preview dashboard
Google Ads network performance dashboard
Preview dashboardBeyond network-level splits, the dashboard includes device and geographic breakdowns, an impression share audit showing where you lose visibility (budget vs. rank), video creative performance with view completion rates, and a Performance Max asset breakdown with Google’s quality ratings for each headline, image, and video.
The dashboard connects to Google Ads through Coupler.io and refreshes on a schedule you configure. It’s available as a free Data Studio template.
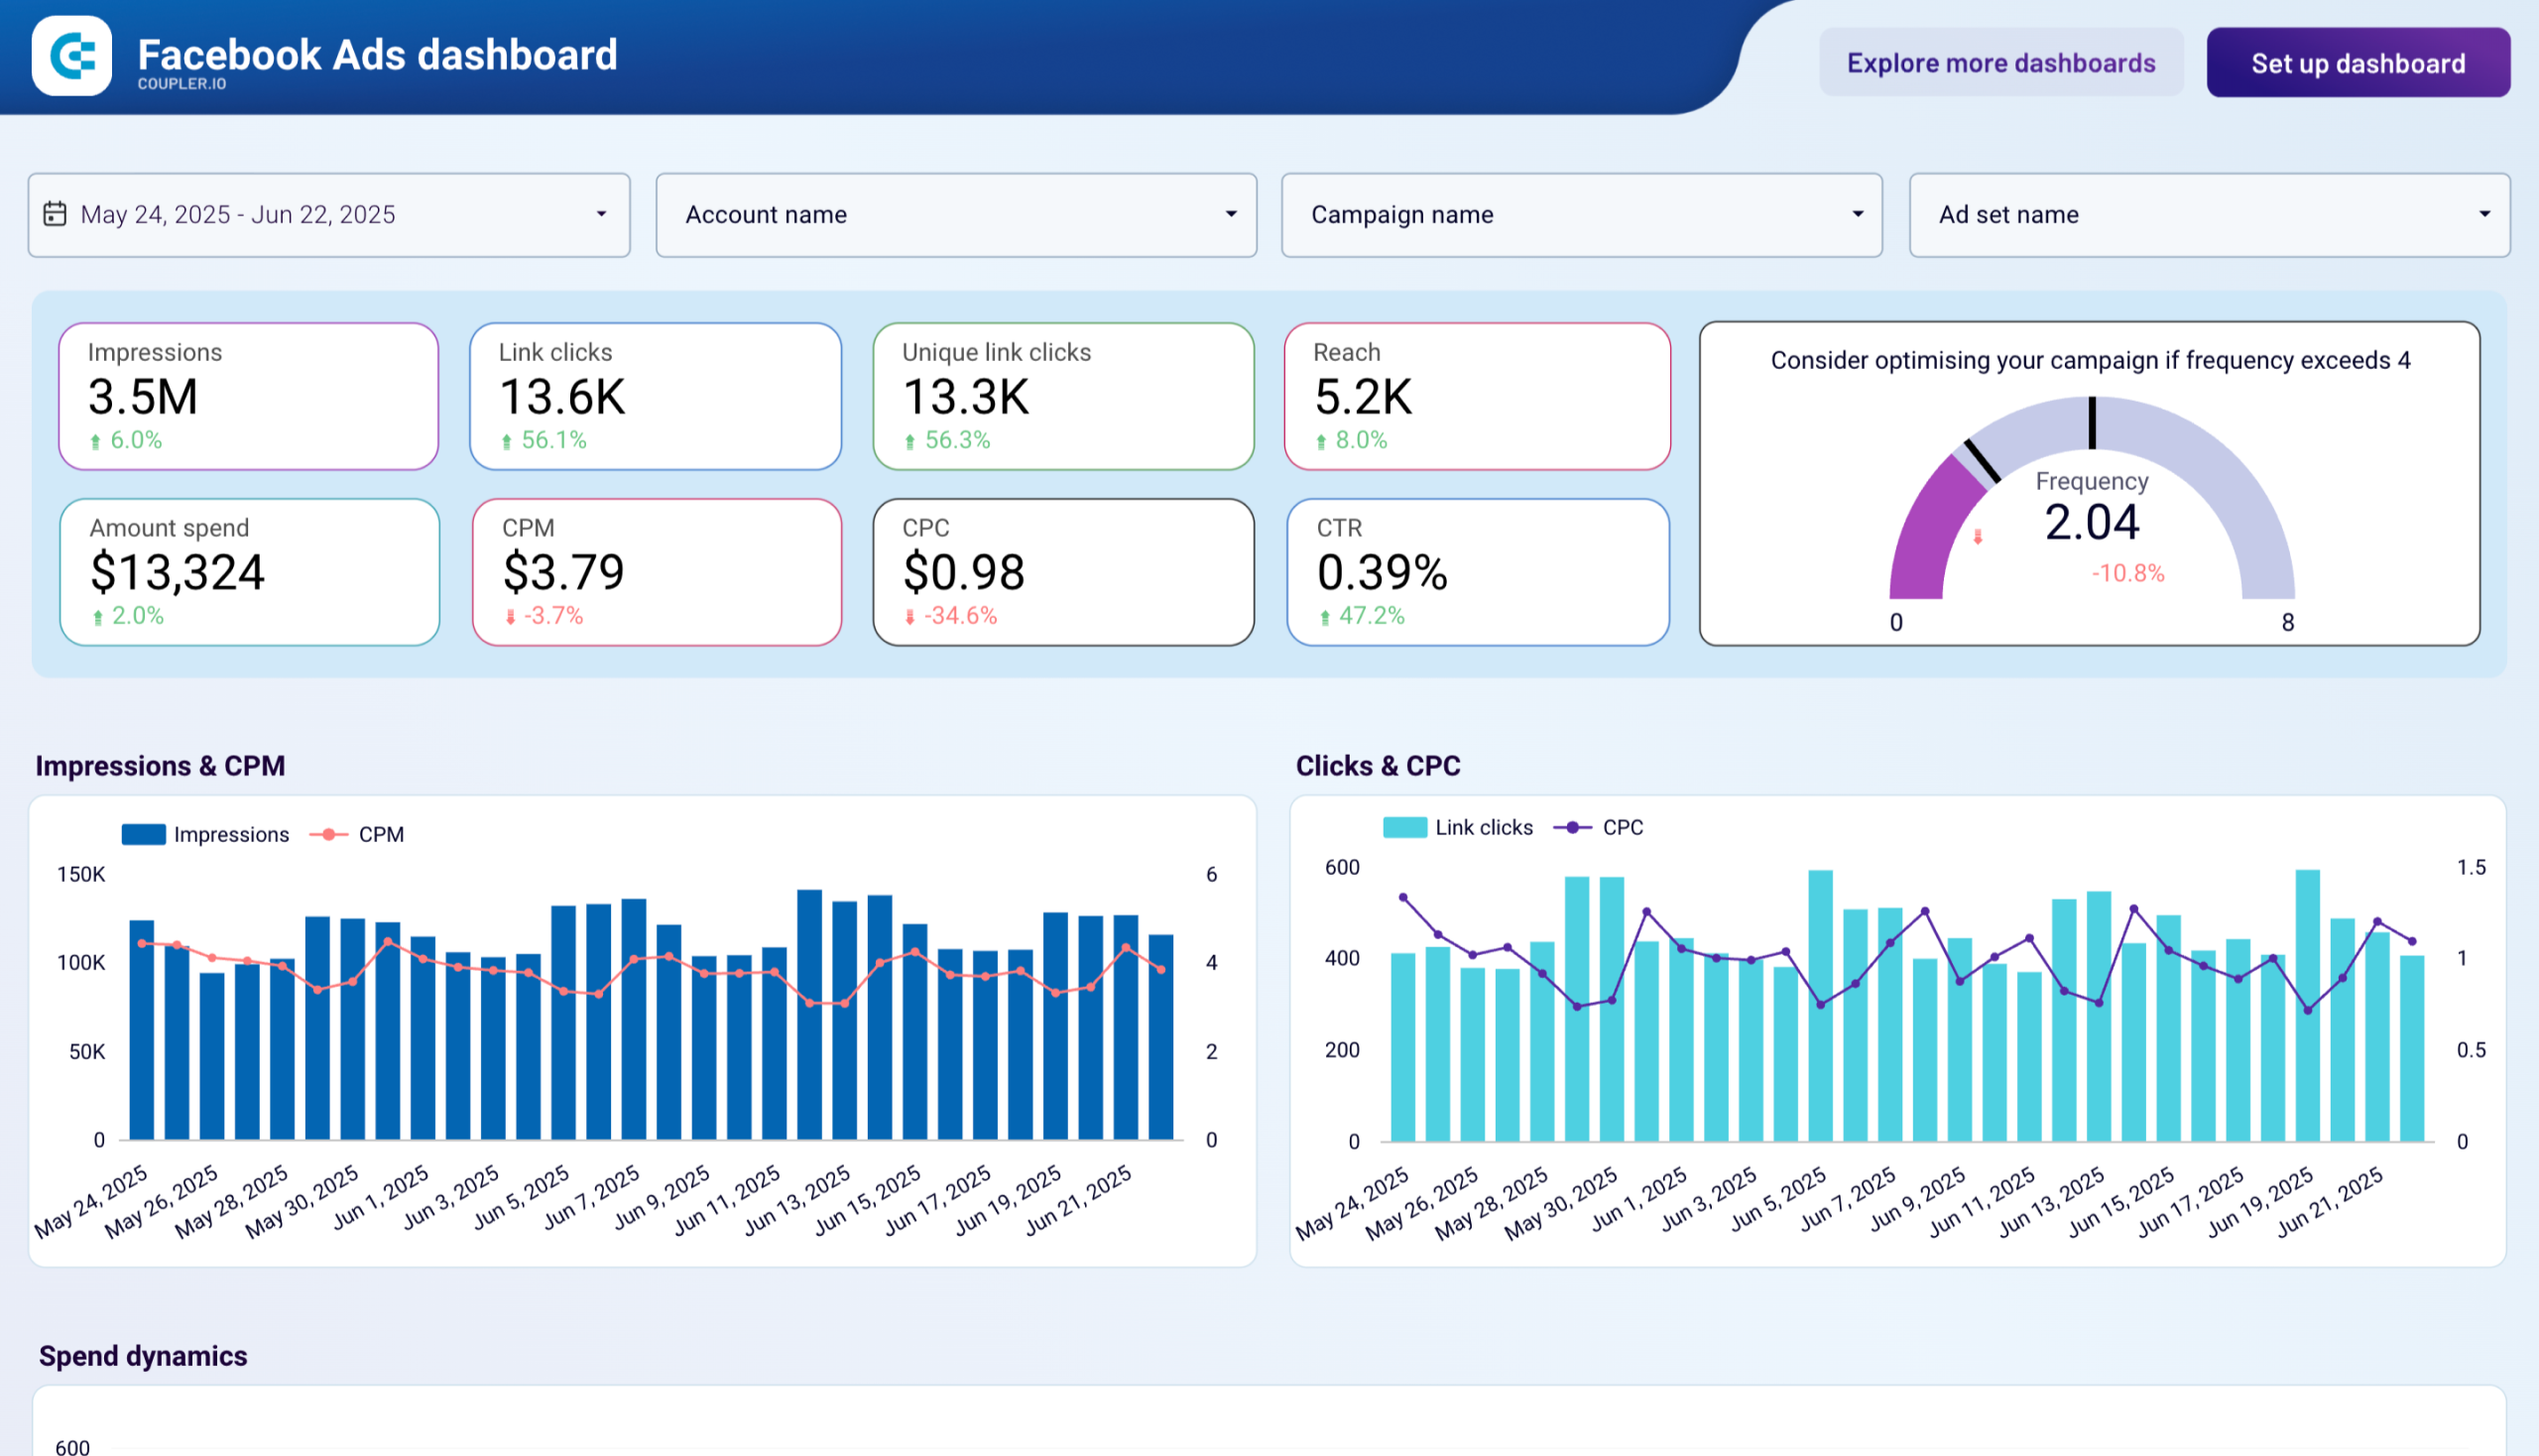
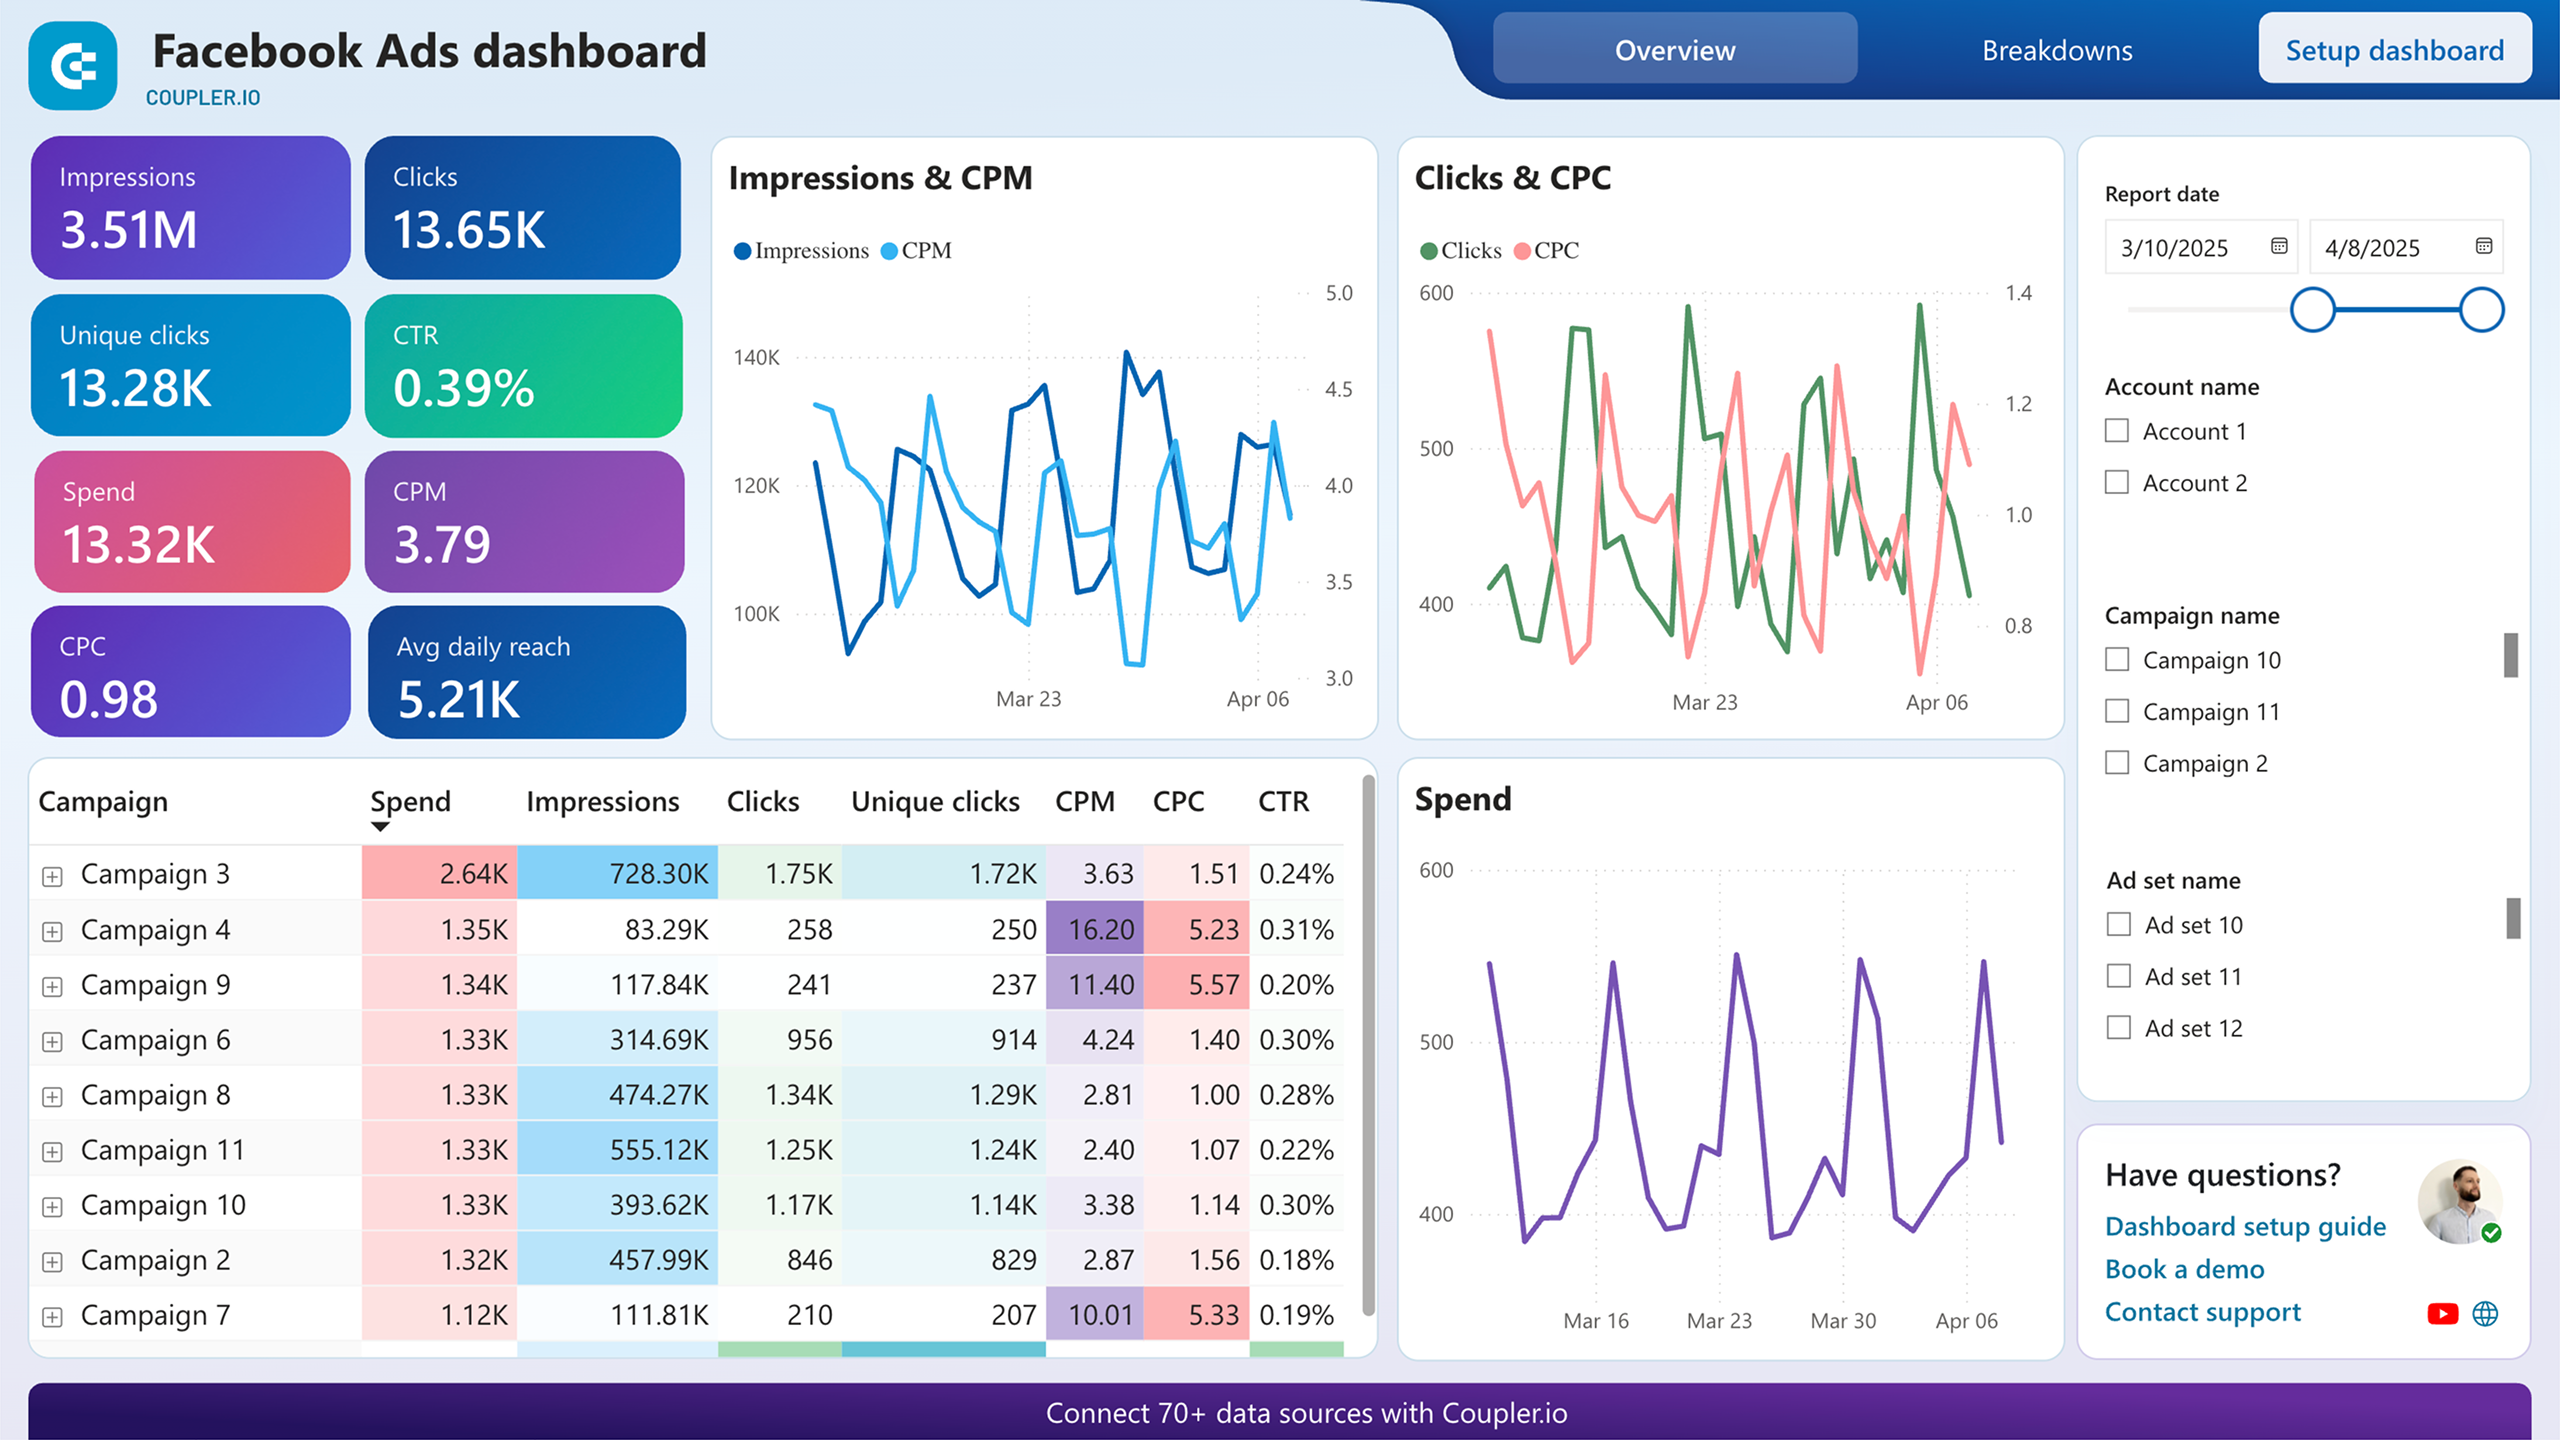
7. Facebook Ads dashboard (+ template)
With a Facebook Ads dashboard, you obtain a set of the most crucial metrics to track and analyze the performance of your campaigns.
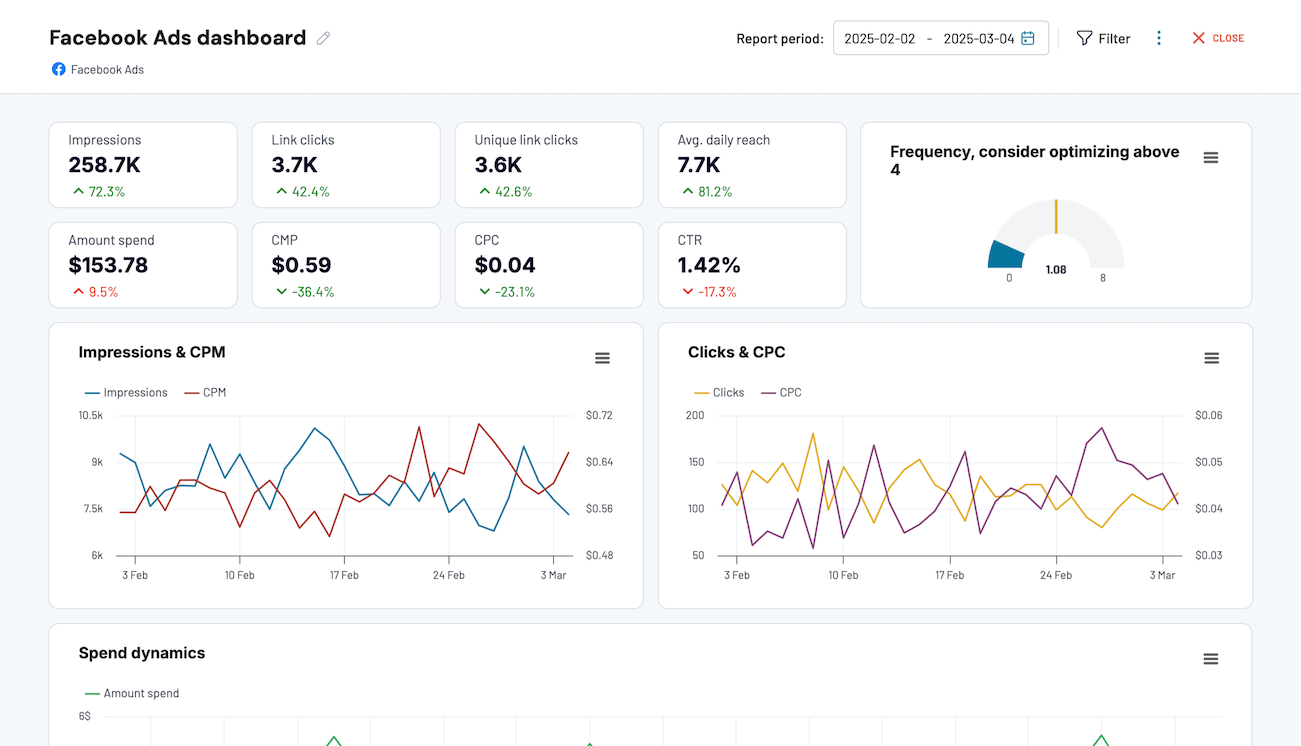
You can not only access, monitor, and understand key metrics and KPIs, but also measure campaign effectiveness, unleash growth opportunities, and do more. The dashboard allows you to get insights essential for Facebook Ads optimization with no additional effort.
You can easily connect your Facebook Ads account and instantly populate the dashboard with your data. with the built-in Coupler.io connector. And it’s absolutely free of charge.
If you prefer managing your reporting in external BI tools, check out the templates available for Looker Studio, Power BI, and Google Sheets. Pick the version that meets your reporting needs and try it out.
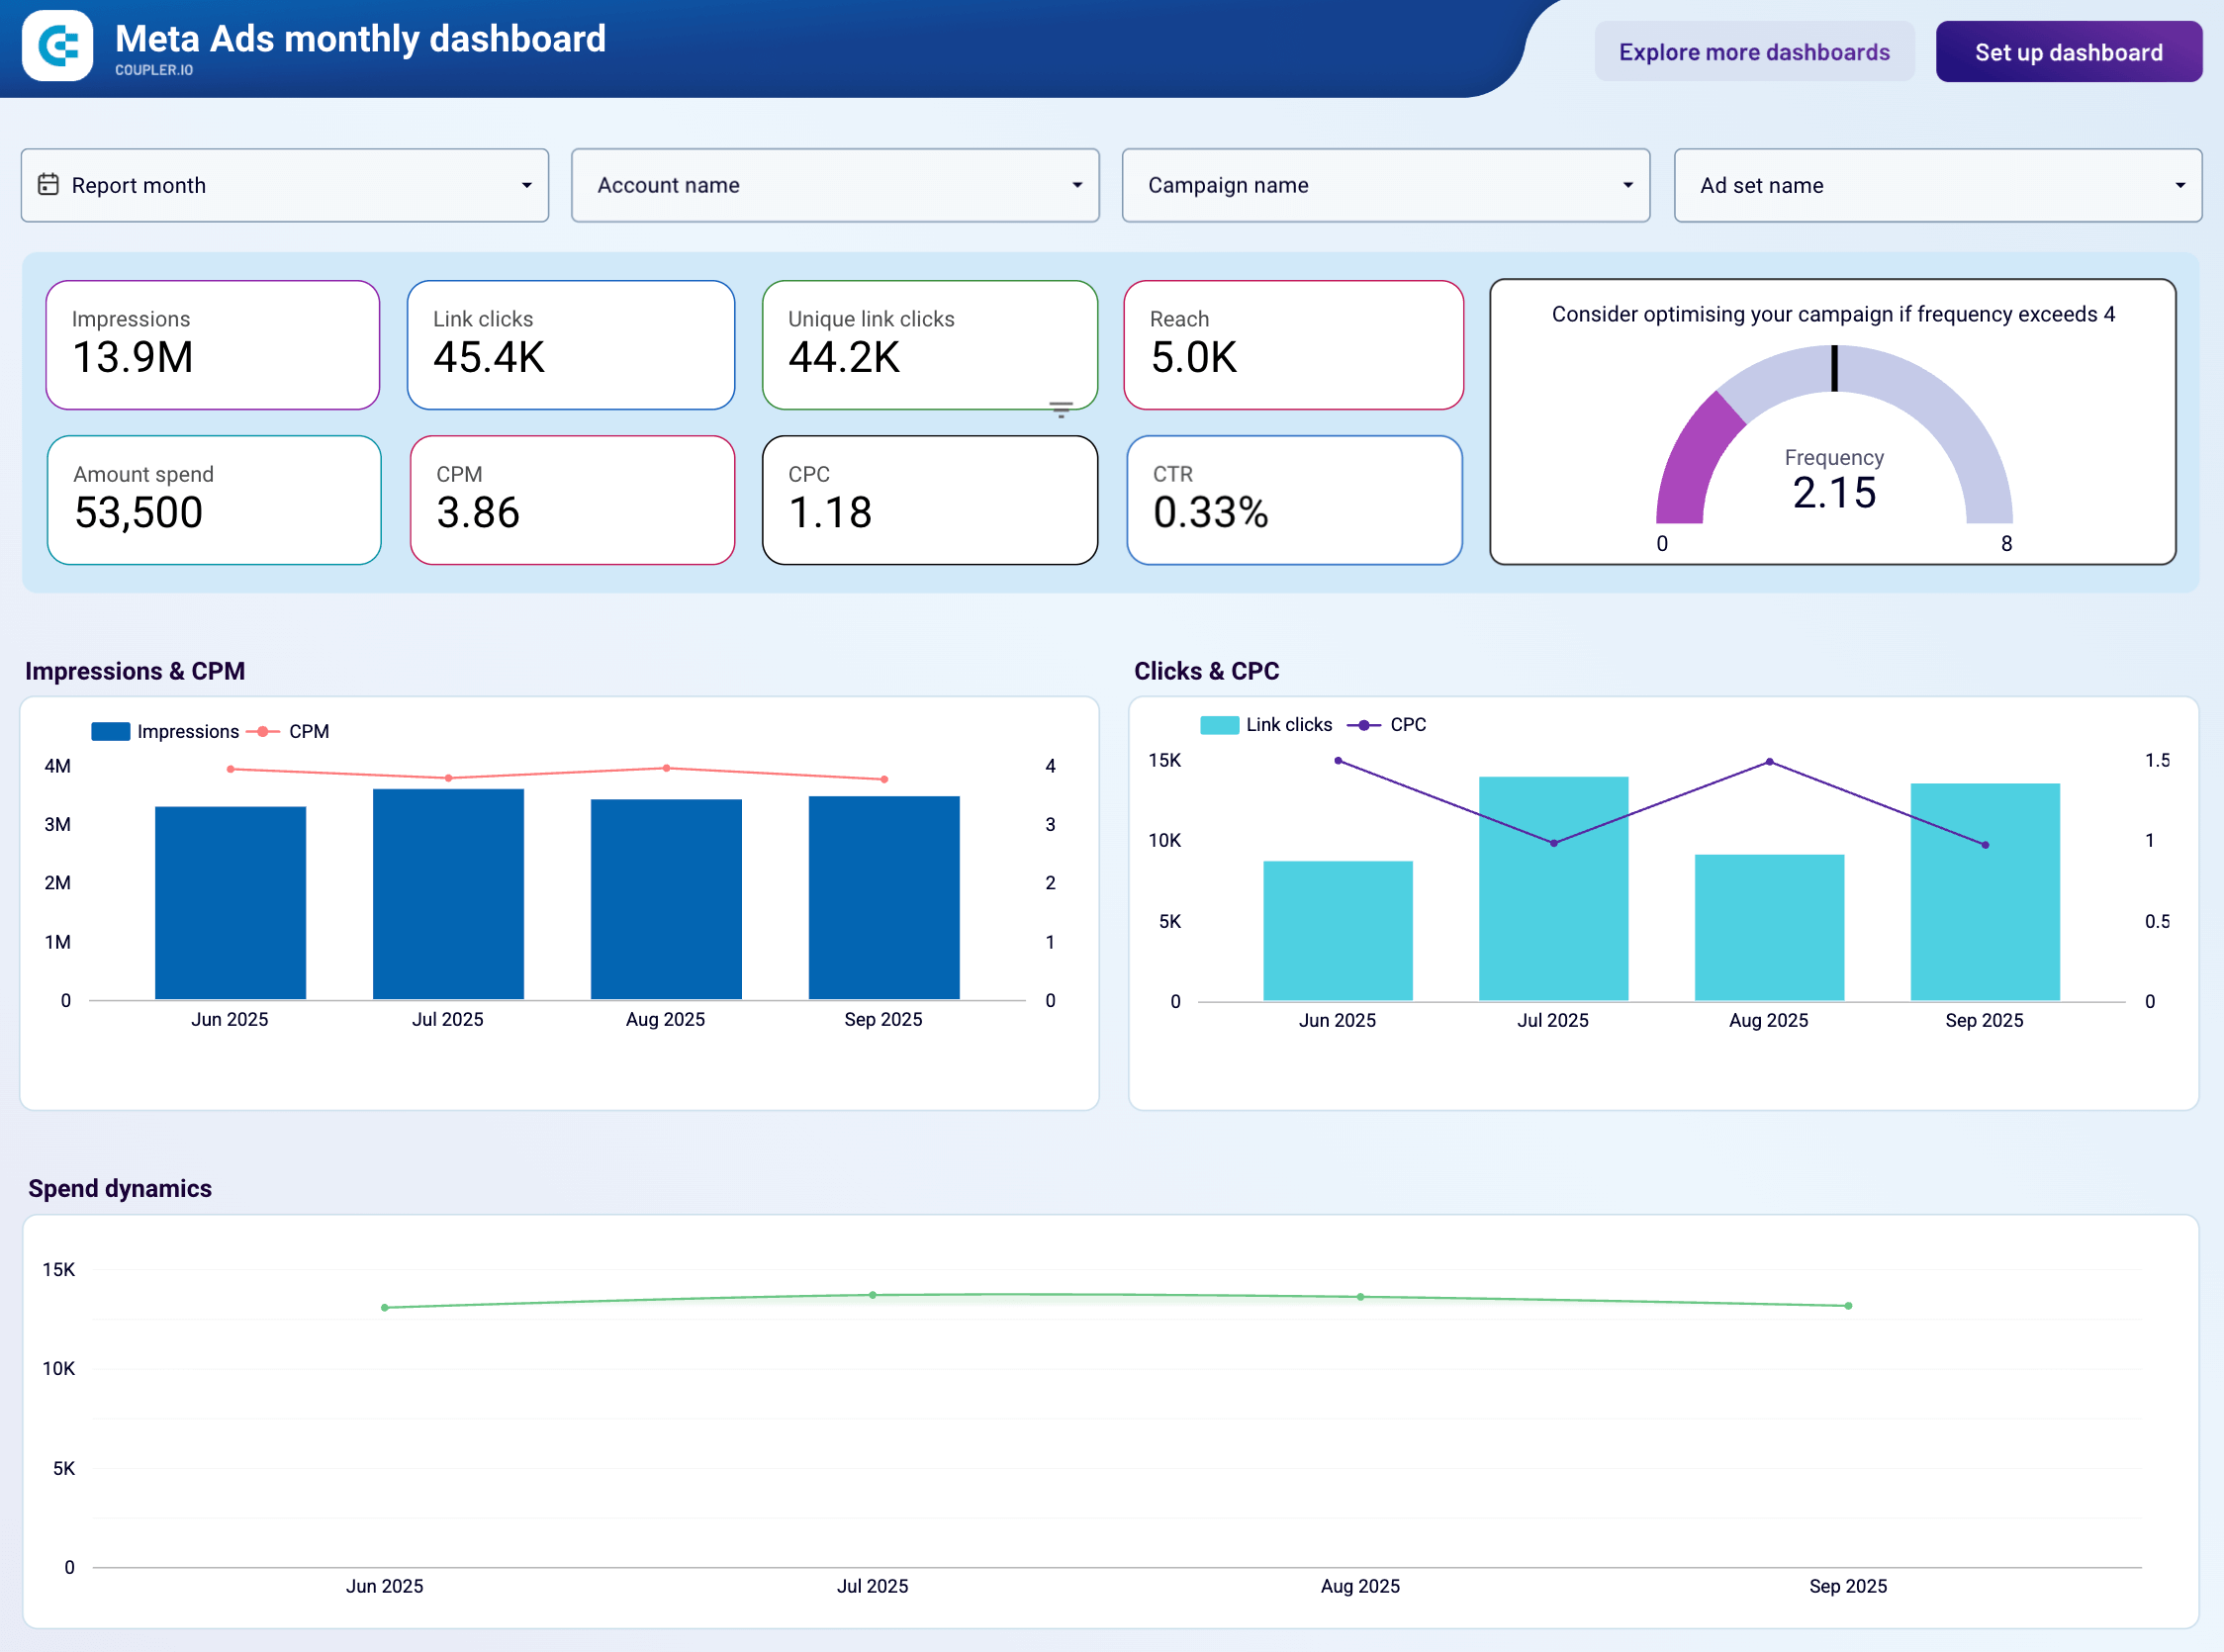
8. Meta Ads monthly performance dashboard (+ template)
This dashboard specializes in audience behavior analysis across Facebook and Instagram advertising campaigns. Unlike daily performance trackers, it focuses on identifying demographic engagement patterns, device preferences, and geographic trends over monthly timeframes to help you optimize targeting and creative strategies.
Meta Ads monthly performance dashboard
 Preview dashboard
Meta Ads monthly performance dashboard
Preview dashboardThe dashboard provides detailed demographic breakdowns showing which age groups and genders deliver the highest engagement rates and lowest costs. Device performance analysis goes beyond mobile-versus-desktop comparisons, revealing specific platform preferences (iPhone, Android phones, tablets). A visual frequency meter indicates when ad exposure reaches optimal levels or risks oversaturation. Geographic heat maps identify emerging international markets, while campaign comparison tables consolidate monthly spend, reach, clicks, and engagement metrics for easy performance reviews.
The dashboard template is available in Looker Studio with a Coupler.io connector. Simply connect your Facebook and Instagram ad accounts to populate the dashboard with your monthly performance data.
9. LinkedIn Ads performance marketing dashboard (+ template)
The LinkedIn Ads performance marketing dashboard is a report template to track metrics related to pay-per-click (PPC) advertising on LinkedIn. The dashboard lets you track impressions, clicks, cost per click (CPC), and other essential metrics to understand your campaign’s performance. In addition to line charts that show the metric dynamics, you have access to a drill-down table to access the performance of each campaign.
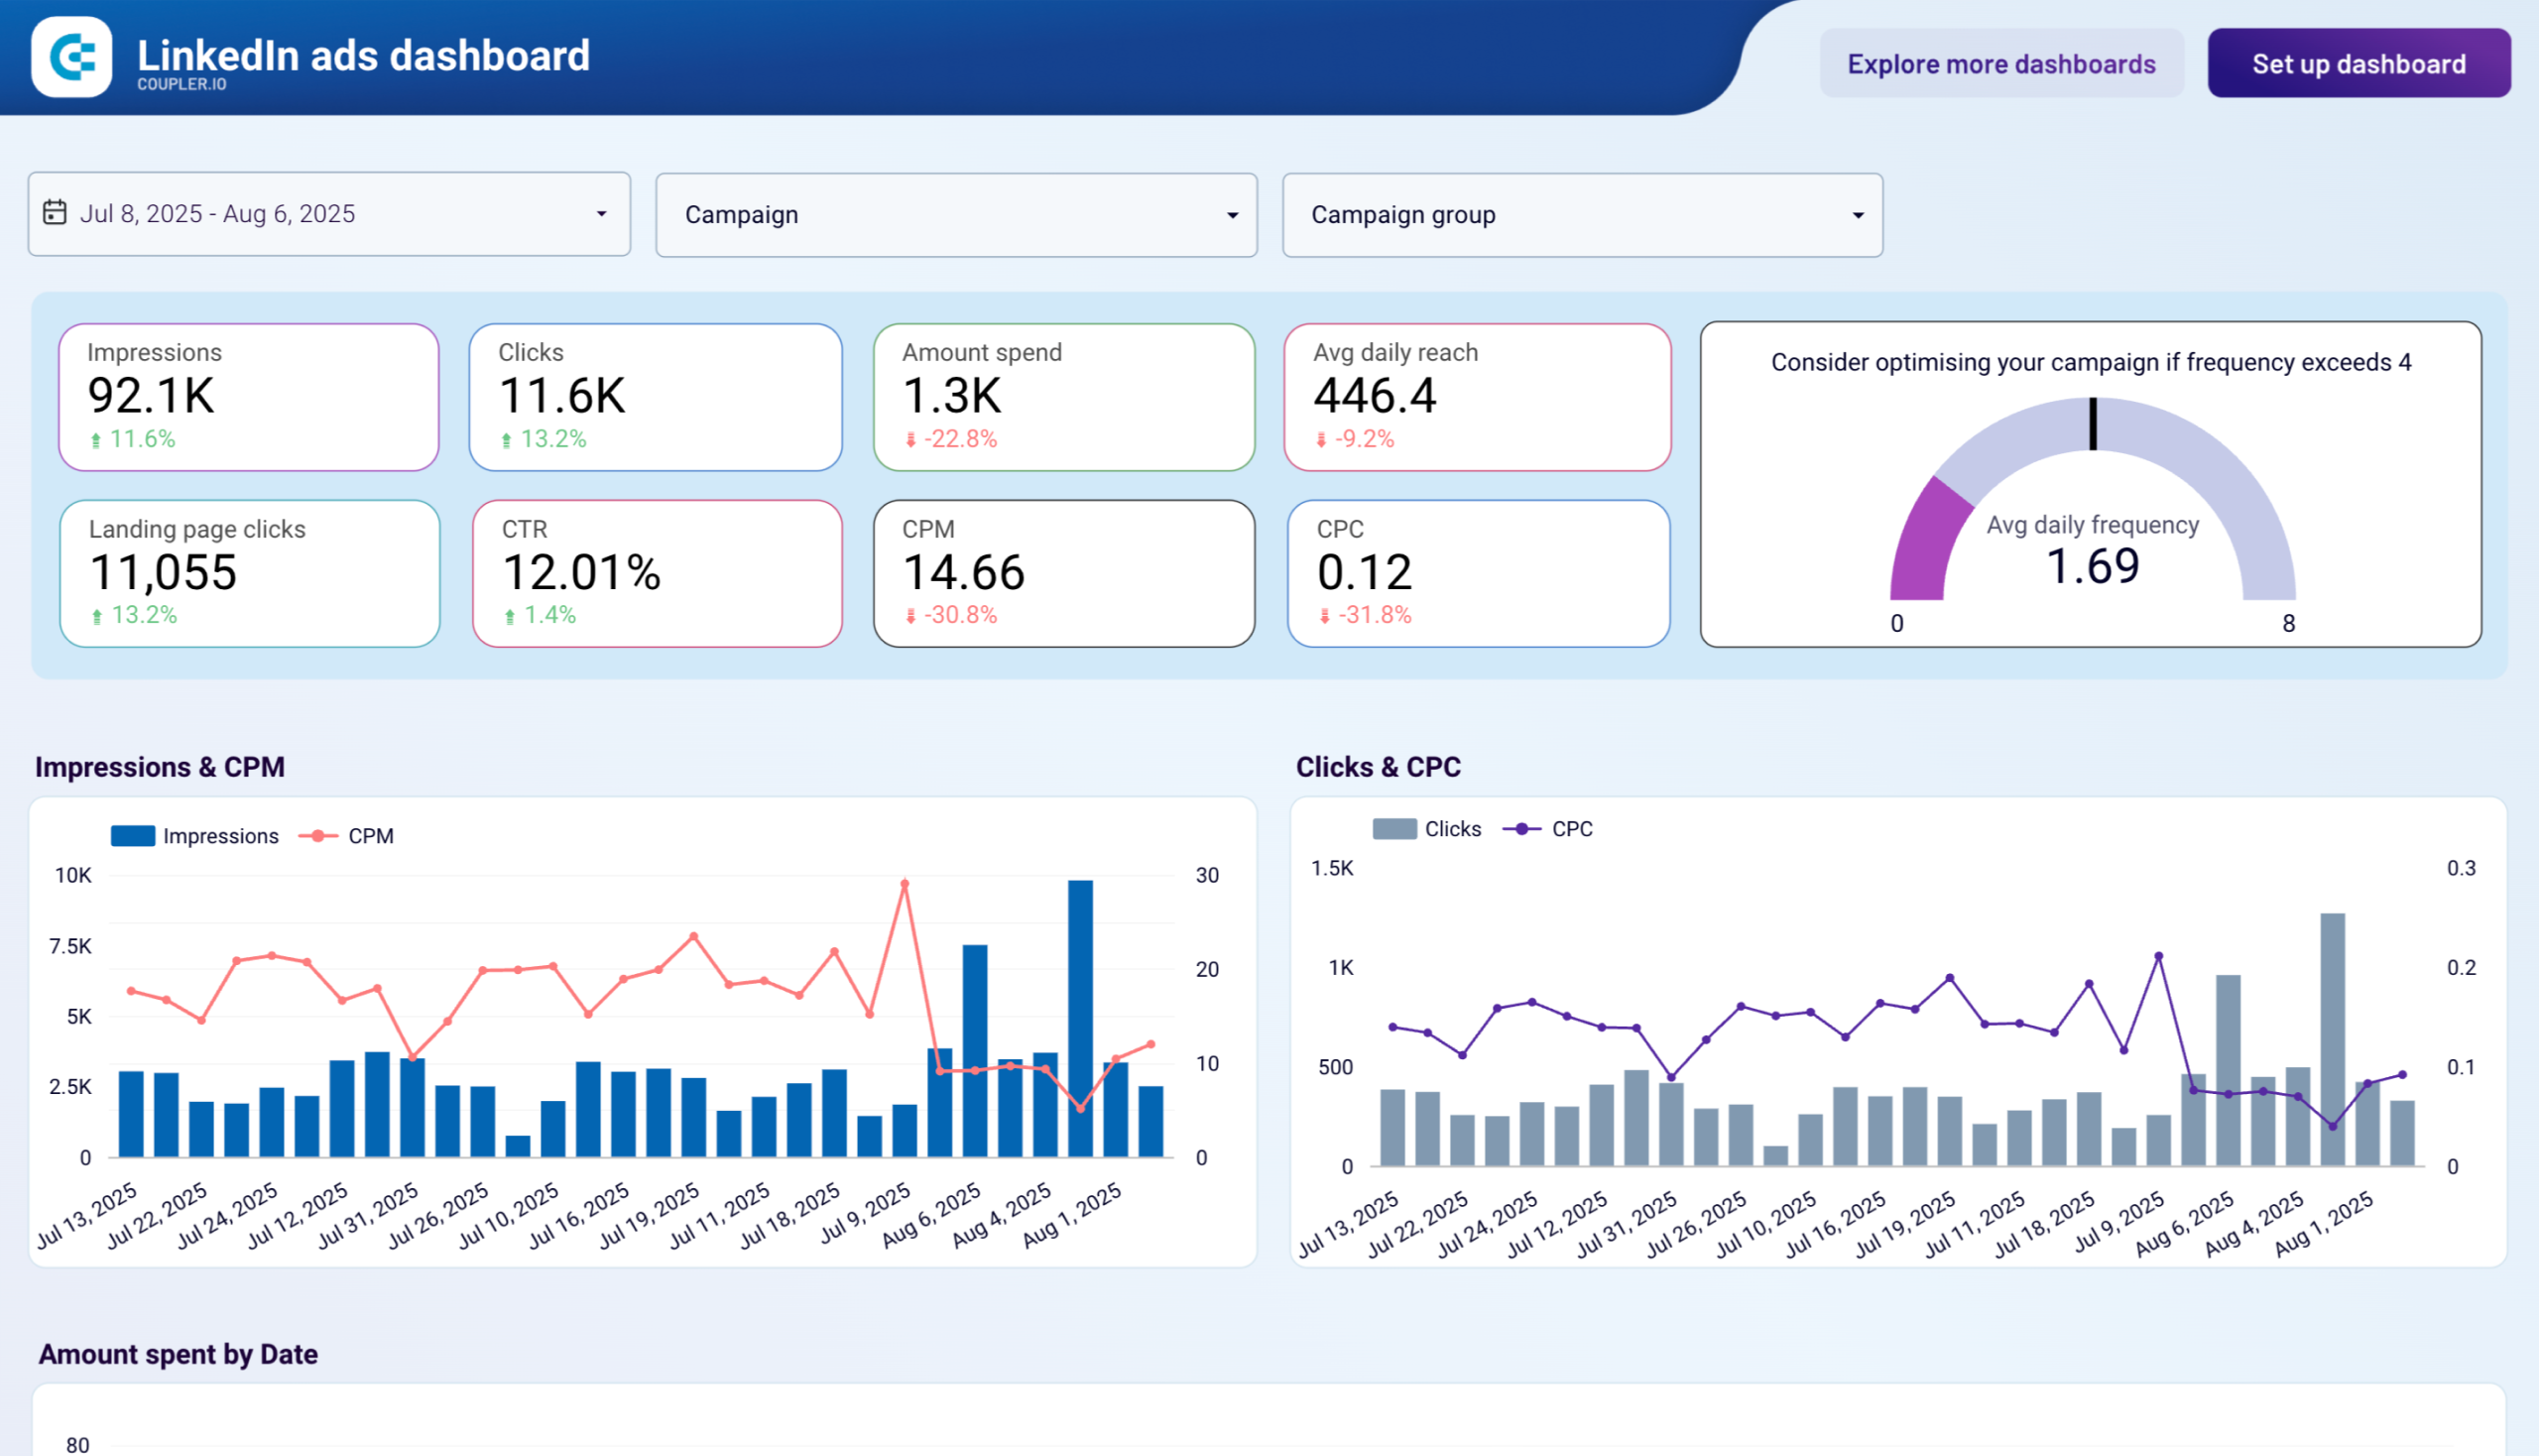
The second page of the LinkedIn Ads dashboard template is dedicated to leads and conversions. It provides a pipeline with three stages: impressions, lead form opens, and leads.
10. LinkedIn Ads leads dashboard (+ template)
The LinkedIn Ads leads dashboard provides comprehensive insights into your lead generation campaigns on LinkedIn’s advertising platform. It helps you understand how your ad spend translates into qualified leads and conversions, so you can make targeted optimizations to your B2B advertising strategy.
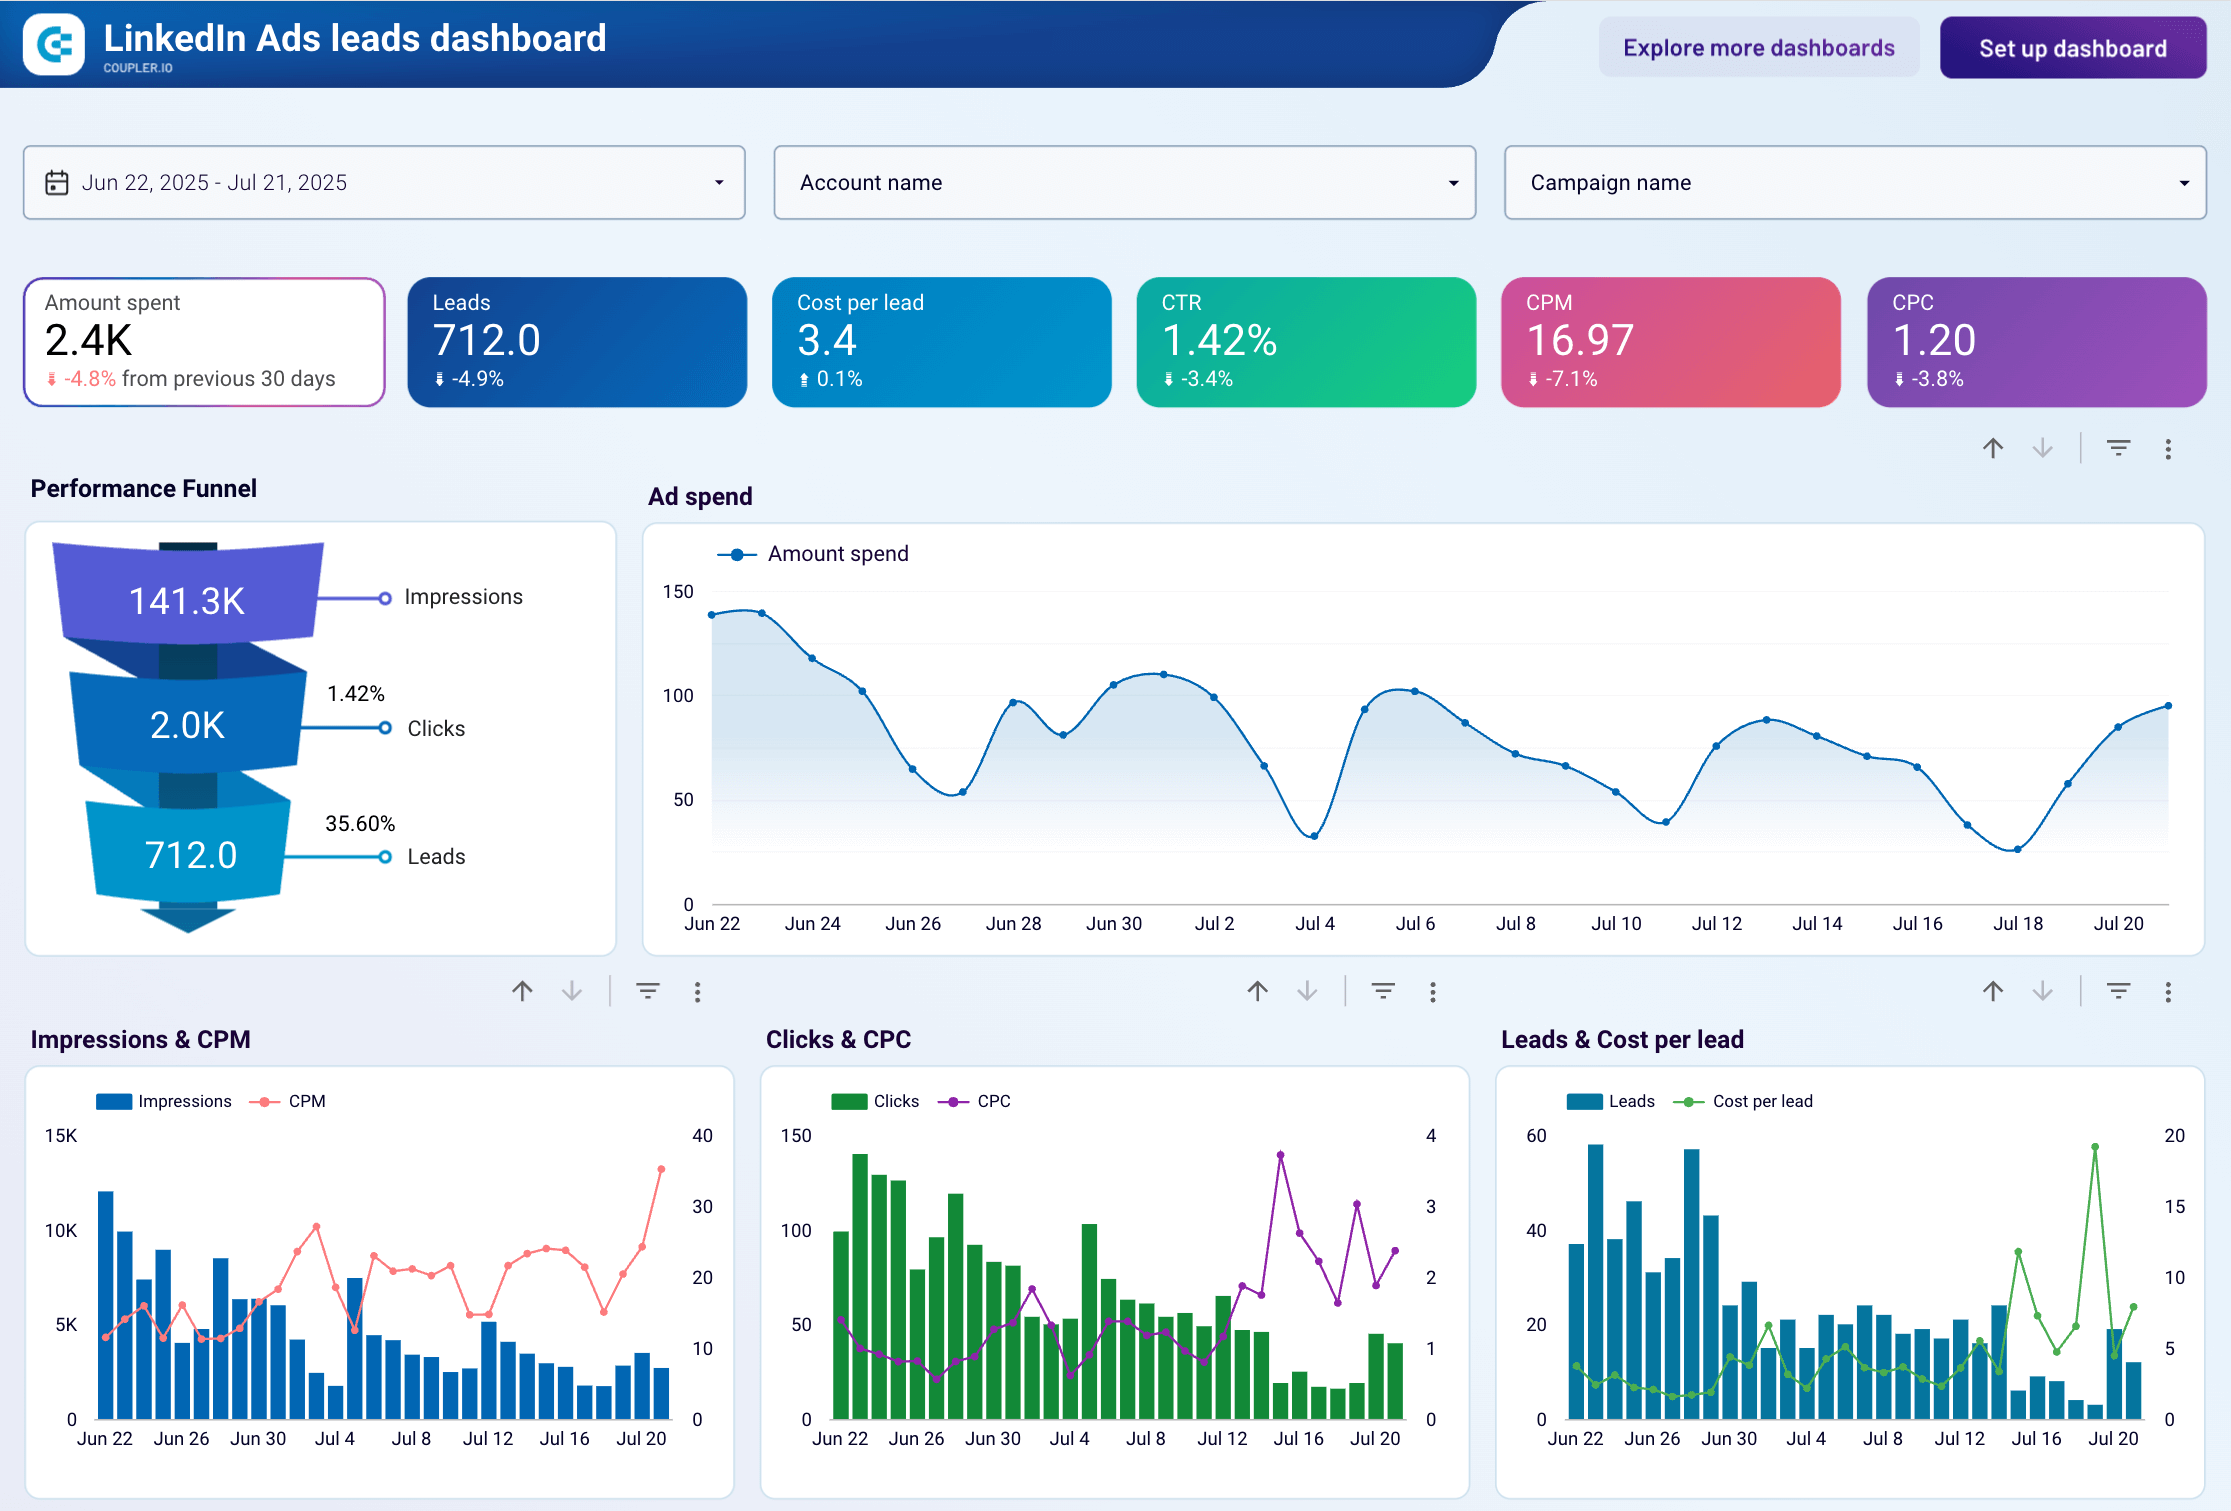
The dashboard features scorecards for tracking business metrics (amount spent, CTR, CPC, etc.) and a funnel to visualize the conversion path from impressions to leads. You can also examine campaign-level breakdowns to identify top performers, track daily spend patterns over time, and analyze correlations between different metrics – like leads & CPL – to improve your bidding strategy.
A free template is available in Looker Studio with a Coupler.io account. Feel free to create a copy and load your LinkedIn Ads data in less than 5 minutes.
11. LinkedIn Ads monthly performance dashboard (+ template)
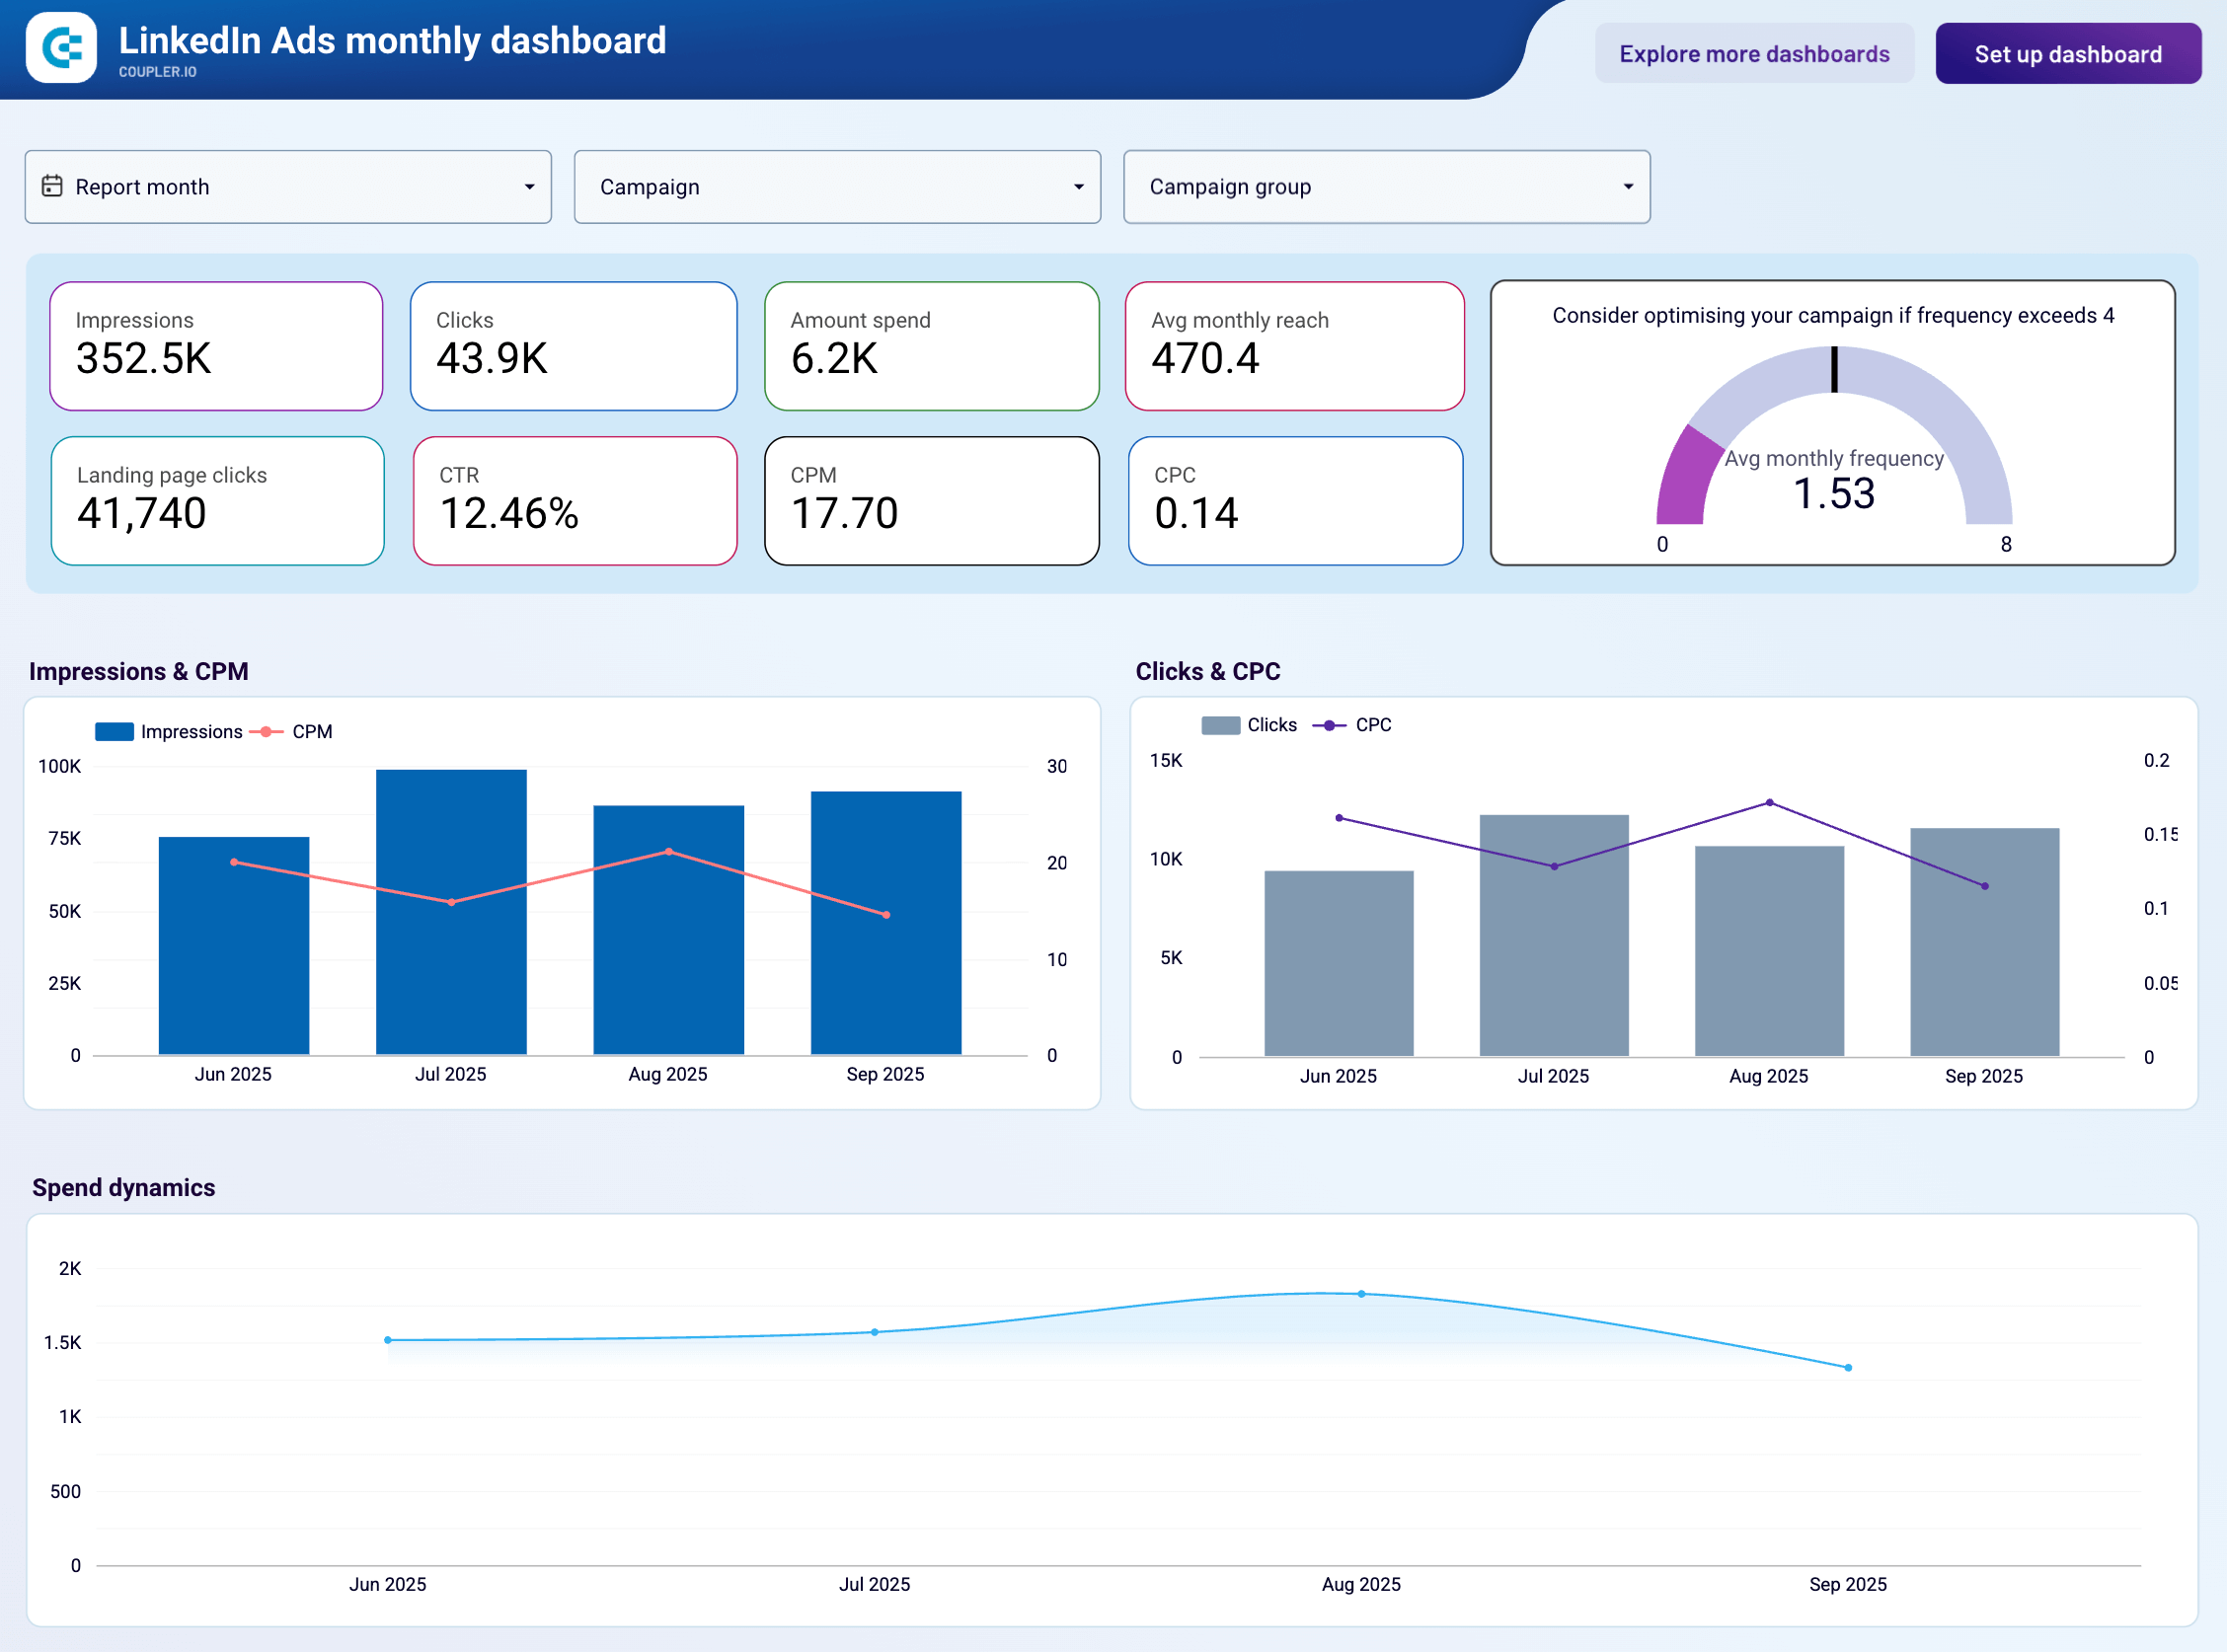
Designed specifically for B2B marketers running LinkedIn advertising campaigns, this monthly dashboard helps you track professional audience engagement, lead generation performance, and campaign effectiveness across timeframes that align with longer B2B sales cycles.
LinkedIn Ads monthly performance dashboard
 Preview dashboard
LinkedIn Ads monthly performance dashboard
Preview dashboardThe dashboard includes a frequency meter that shows whether you’re hitting the optimal exposure range for professional audiences (typically 1.5-2.0). For lead generation campaigns, it tracks the complete funnel from impressions to lead form opens to completed submissions, revealing exactly where prospects drop off. Monthly conversion tracking separates post-click conversions from post-view conversions to help you evaluate campaign objectives and bidding strategies. The campaign performance table displays monthly aggregated data including spend, impressions, clicks, leads, and cost-per-lead for sustainable performance analysis.
This Looker Studio template is built by Coupler.io with an integrated connector. Connect your LinkedIn Ads account to start tracking monthly B2B advertising performance automatically.
12. Meta Ads placement performance dashboard (+ template)
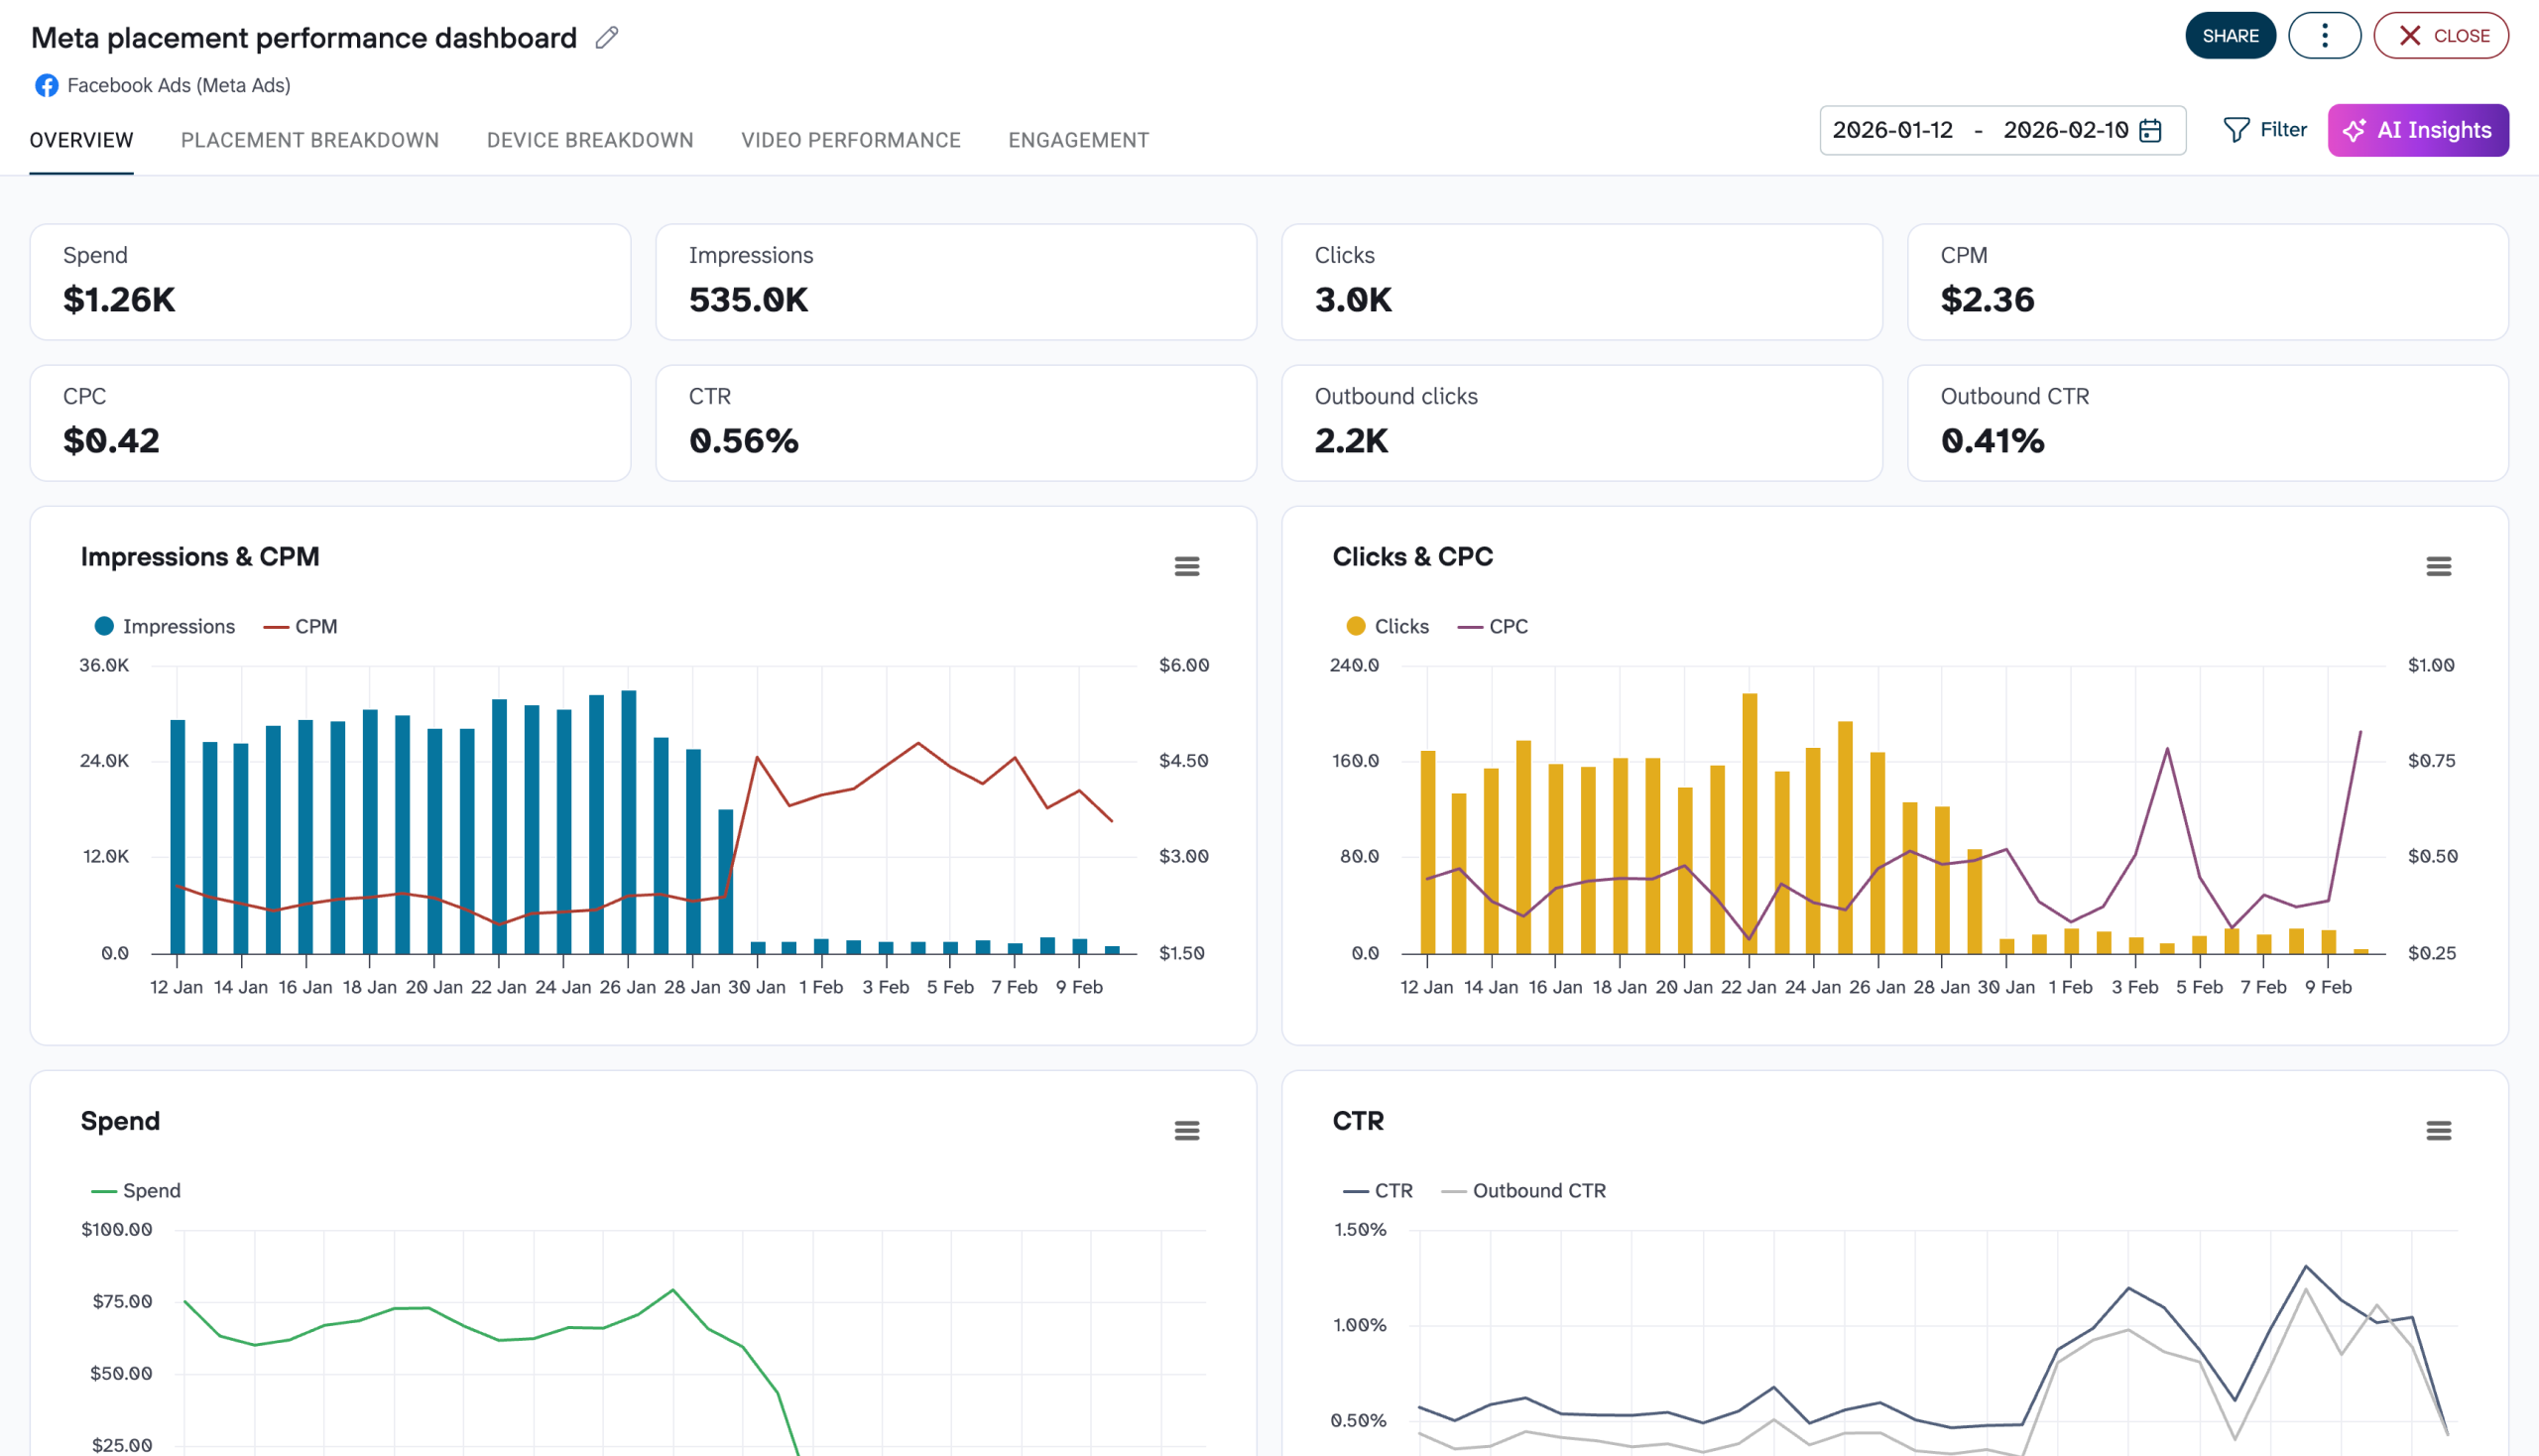
The dashboard segments your Facebook Ads data by placement (Facebook Feed, Instagram Feed, Instagram Stories, Facebook Stories, Facebook Reels, Instagram Reels, Audience Network) and by device type (mobile app, desktop, mobile web). For each combination, you get spend, impressions, clicks, CPM, CPC, CTR, outbound CTR, and engagement rate.
Meta Ads placement dashboard template
 Preview dashboard
Meta Ads placement dashboard template
Preview dashboardWeekly trend views are built in, so you can catch a placement that’s quietly deteriorating before it registers as a meaningful hit to your campaign results. Campaign-level cross-tables let you check whether a placement that works for one campaign fails for another, which is useful when you’re running campaigns with different objectives side by side.
The Coupler.io template is free to use. It pulls your Facebook Ads data and keeps it up to date on a schedule you choose.
13. LinkedIn page and ads analytics dashboard (+ template)
LinkedIn page and ads analytics dashboard
 Preview dashboard
LinkedIn page and ads analytics dashboard
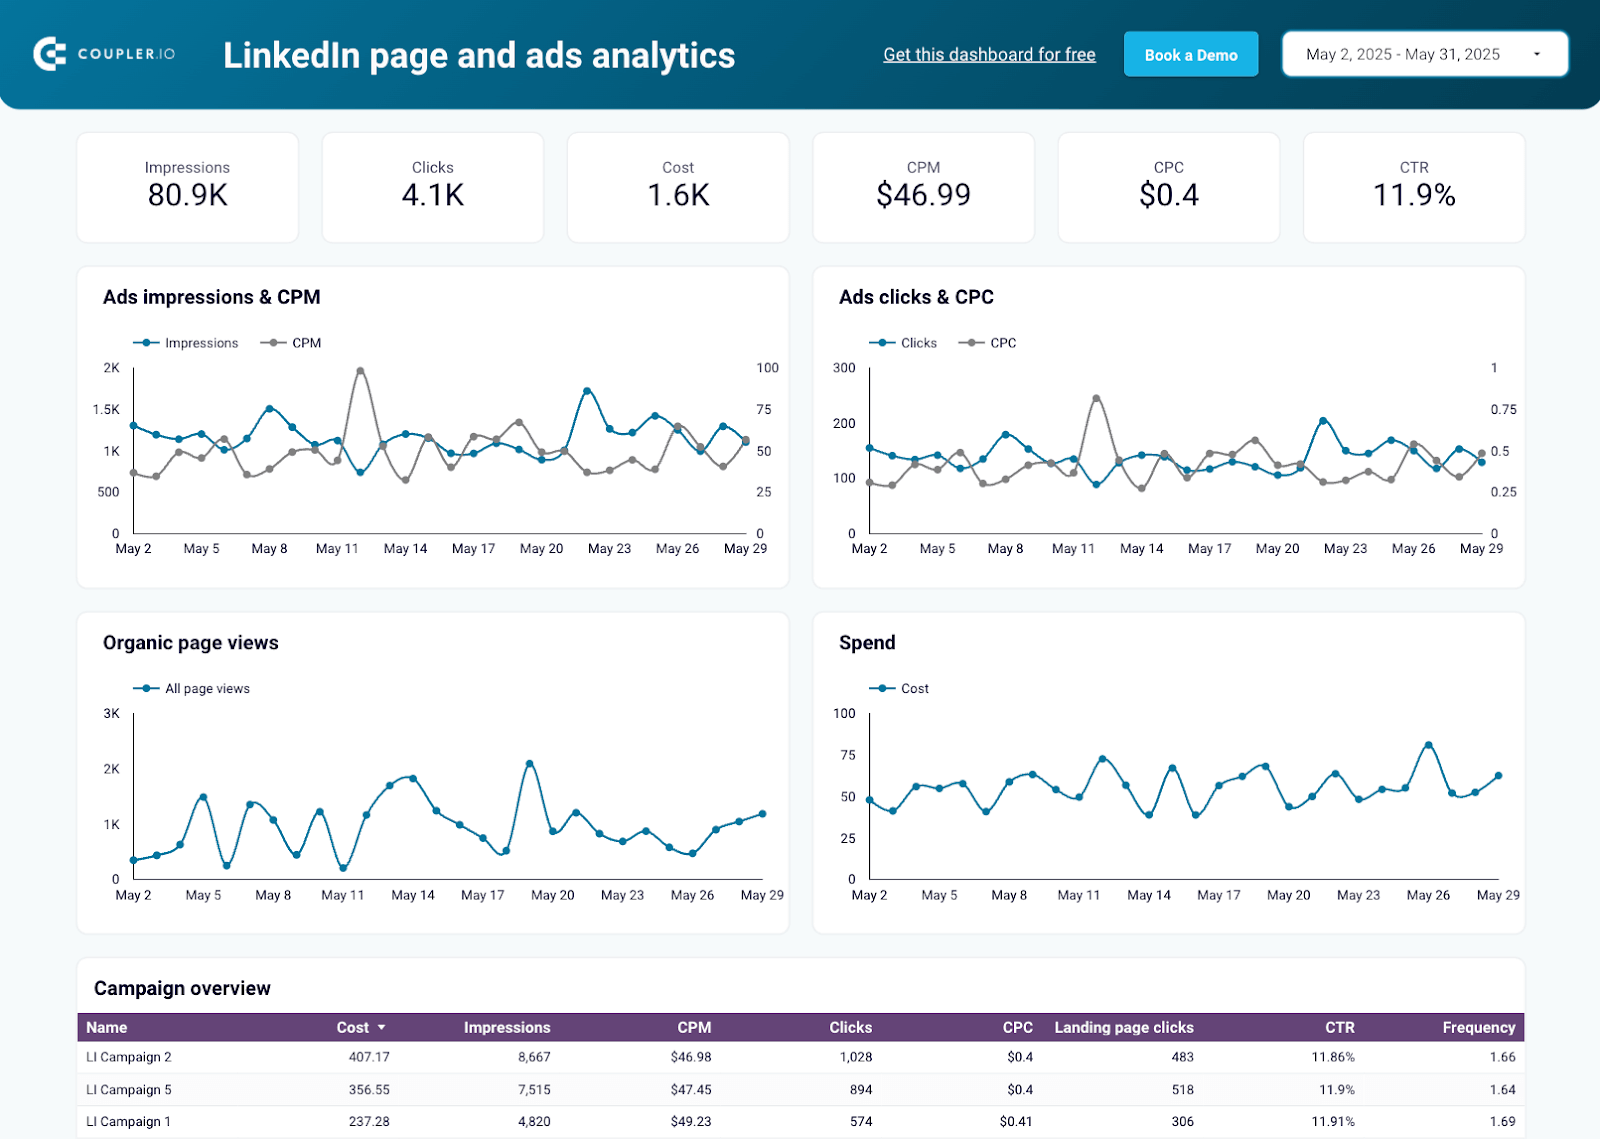
Preview dashboardThis dashboard combines organic and paid performance data to provide a complete picture of your LinkedIn marketing efforts. You can track both your company page content and LinkedIn Ads campaigns in one place, comparing metrics like impressions, clicks, costs, and engagement to understand what’s driving the best results. The dashboard helps you optimize your LinkedIn presence by showing you which content resonates with your audience and how your ad spend translates into engagement.
A free template is available in Looker Studio with a Coupler.io account. You can create a copy and load your LinkedIn data in less than 5 minutes:
14. Bing Ads conversion tracking dashboard (+ template)
This dashboard connects to your Microsoft Advertising (Bing Ads) account and shows how your spend translates into conversions across every campaign. It helps paid search managers identify which campaigns are worth scaling and which are draining budget without producing results.
Bing Ads conversion tracking dashboard
Bing Ads conversion tracking dashboard
Preview dashboardThe most overlooked feature here is goal-level conversion filtering. Many Bing Ads accounts track multiple conversion events, and the total conversion count can look healthy while being inflated by low-value goals like video views. This dashboard lets you isolate purchases or lead submissions from softer events, so you’re making budget decisions based on outcomes that matter. Before a quarterly review, you can sort campaigns by cost per conversion, see which ones are spending heavily without producing results, and build a reallocation case in minutes instead of hours inside the Bing Ads interface.
The template is built in Looker Studio with a Coupler.io connector. Connect your Microsoft Advertising account and start using it for free.
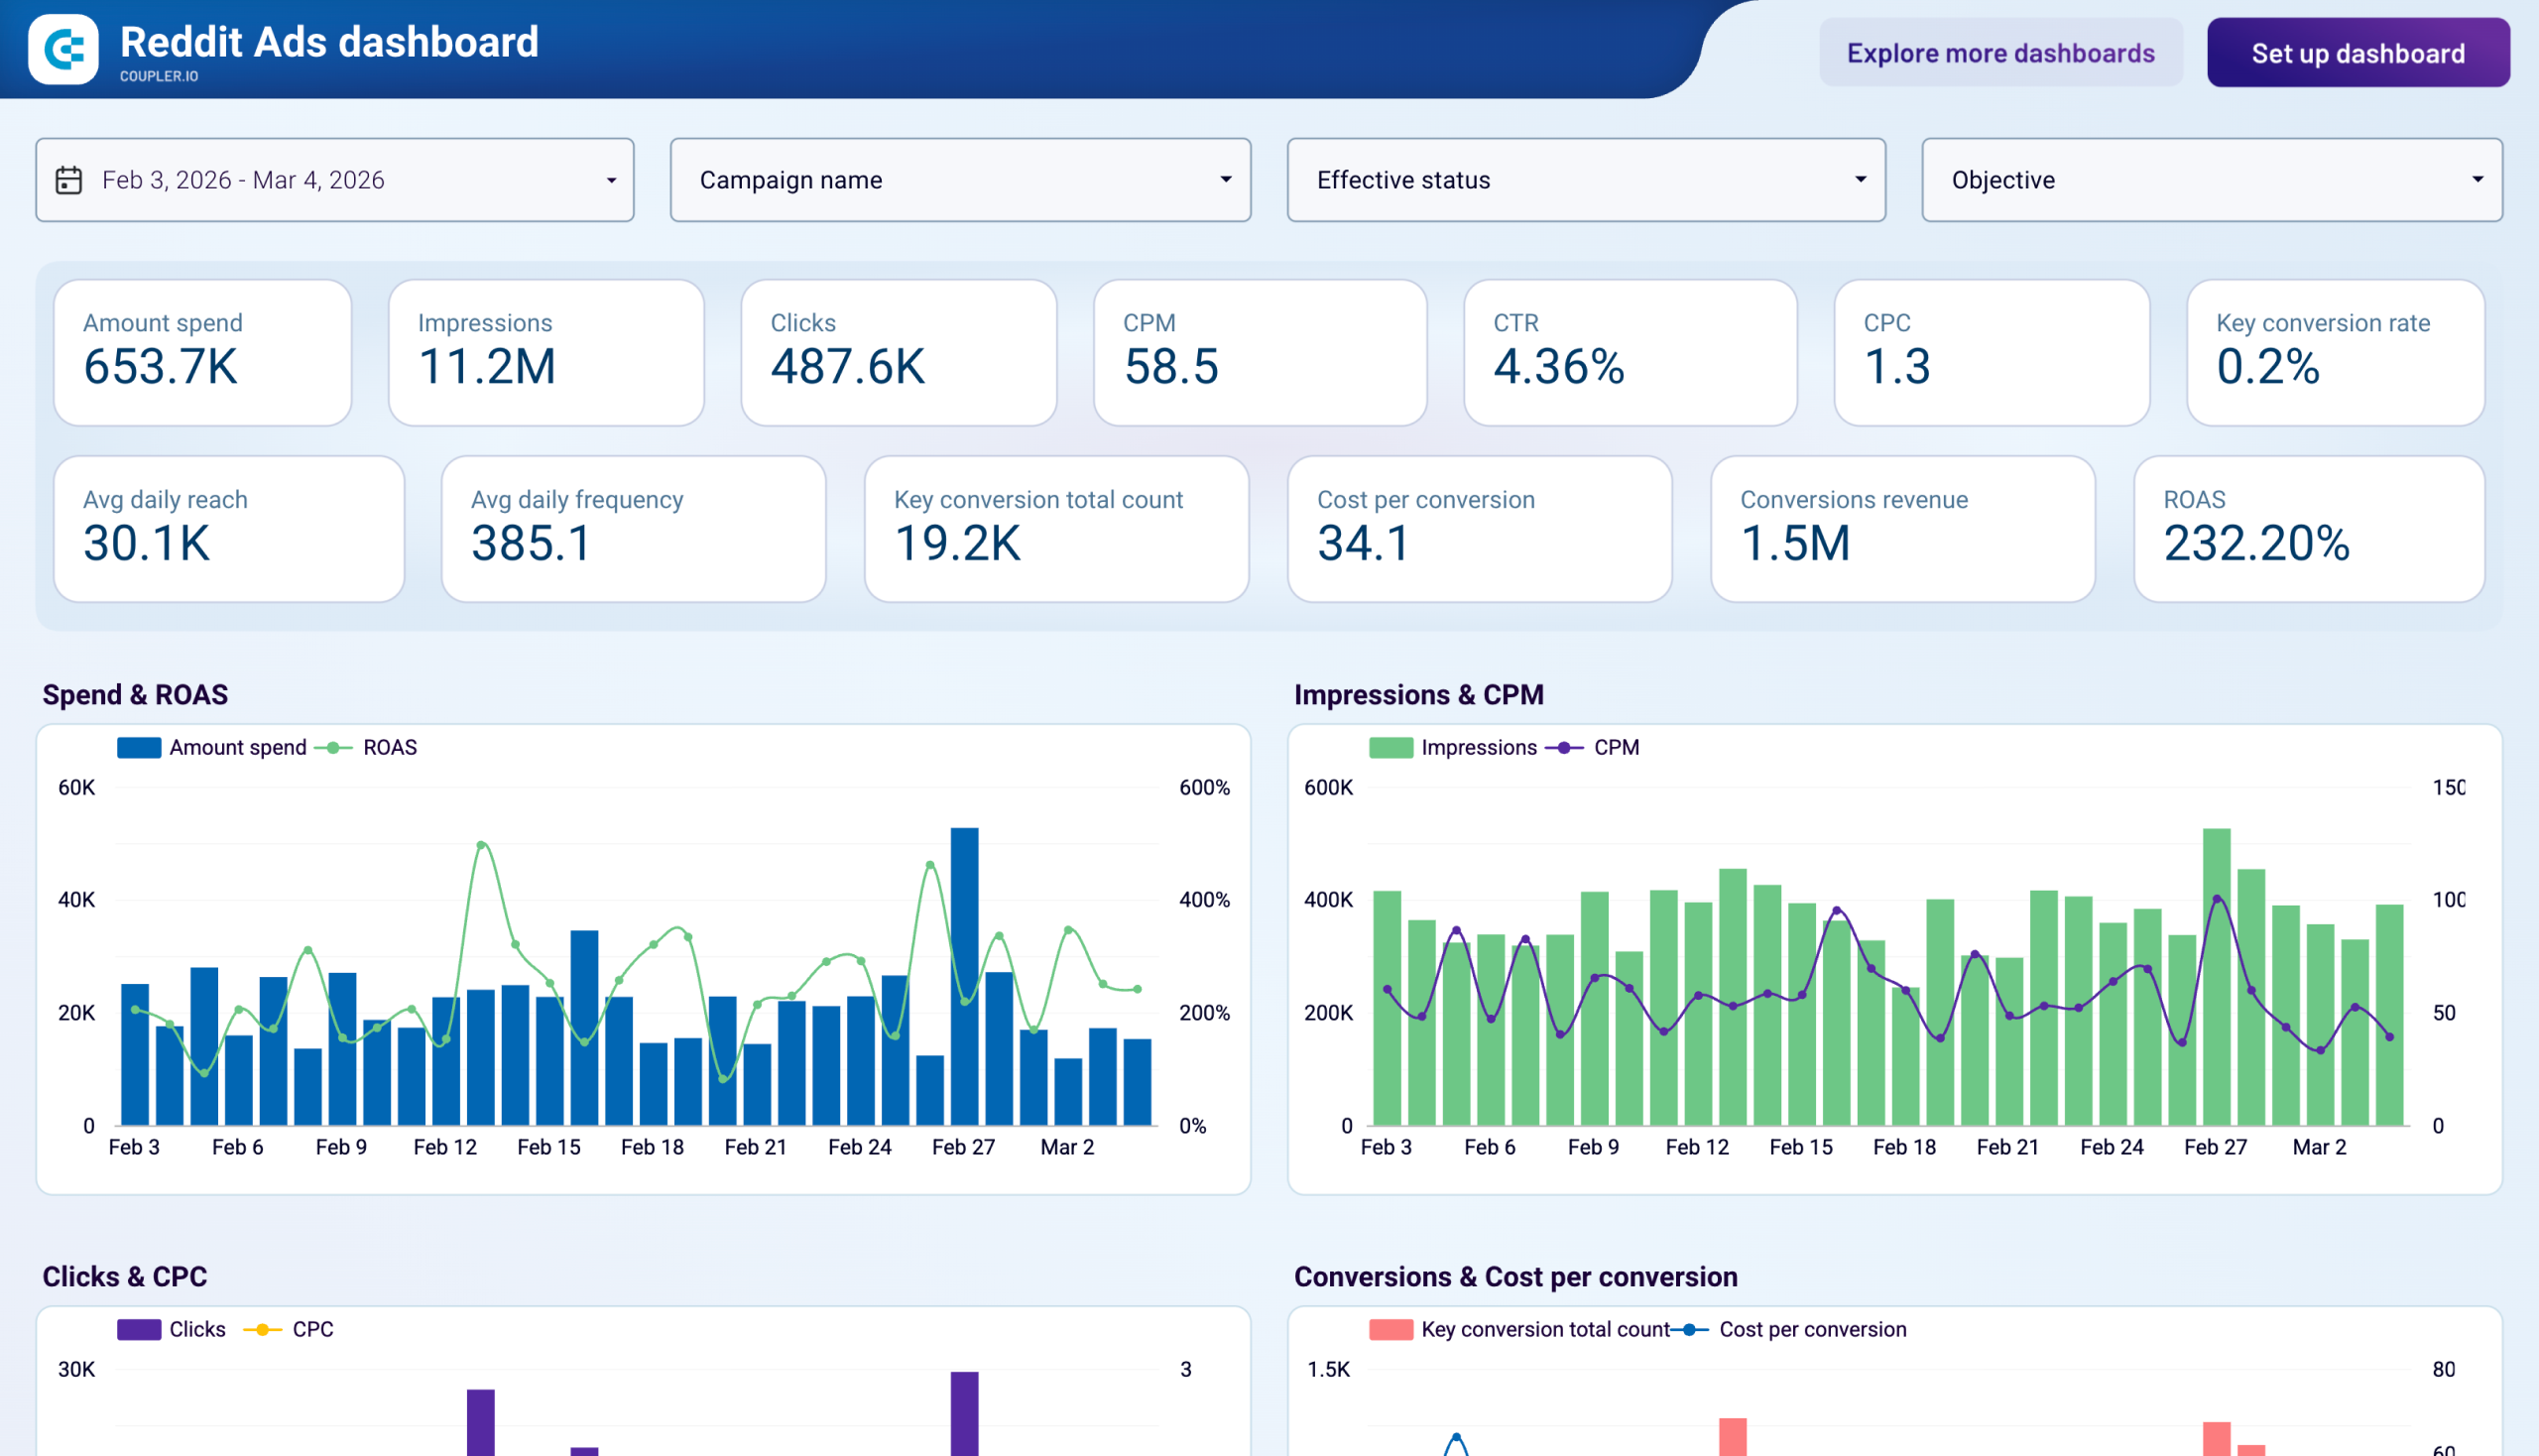
15. Reddit Ads dashboard (+ template)
A dedicated report for your Reddit Ads performance, consolidating spend, reach, engagement, and conversion data into one place. It’s built for performance marketers who need to evaluate Reddit as a channel and make budget decisions backed by data.
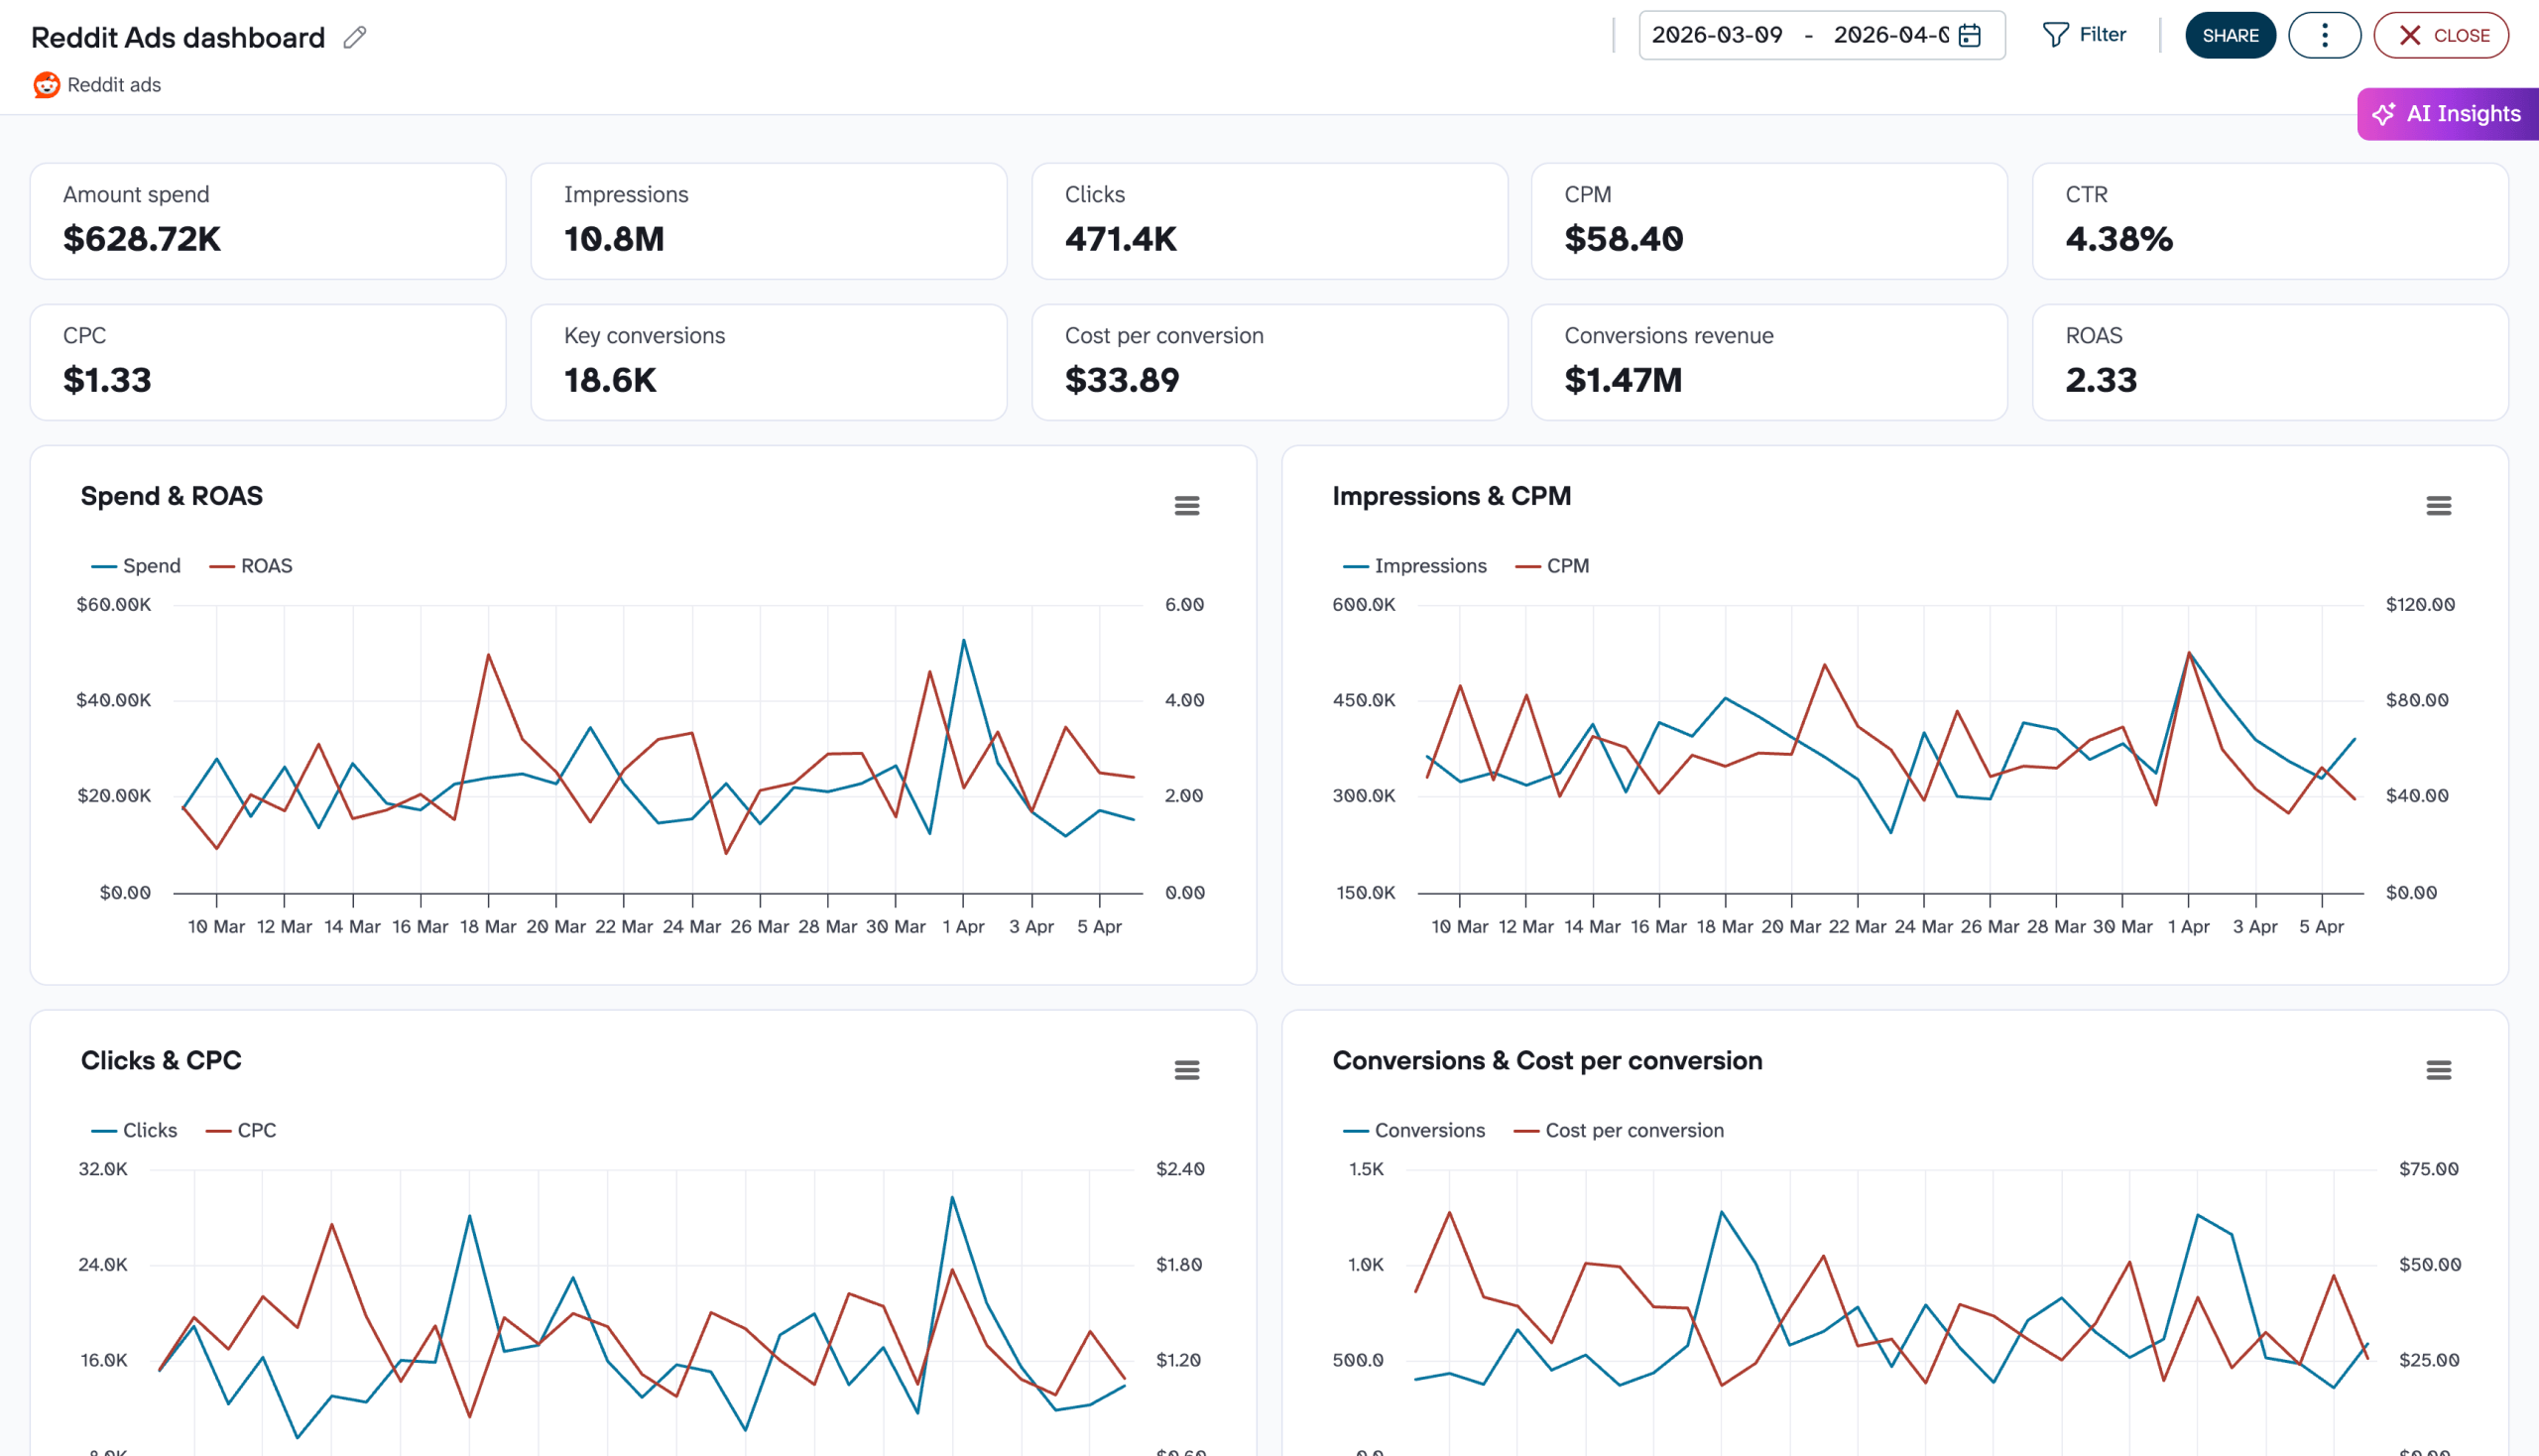
What makes this dashboard practical is the objective-level comparison. Reddit campaigns often span different goals (Traffic, Conversions, Awareness, Video Views), and each one pulls budget in a different direction. Instead of evaluating campaigns in isolation, you can see ROAS per objective and decide whether your Awareness spend is justified or if shifting it to Conversions would produce a better return. The dashboard also helps diagnose a common Reddit Ads problem: CPM creeping up while impressions stay flat. That pattern usually means audience saturation, and catching it early saves you from paying more to reach the same people.
Connect your Reddit Ads account through the built-in Coupler.io connector to get this dashboard in the platform or Looker Studio populated with your data in minutes.


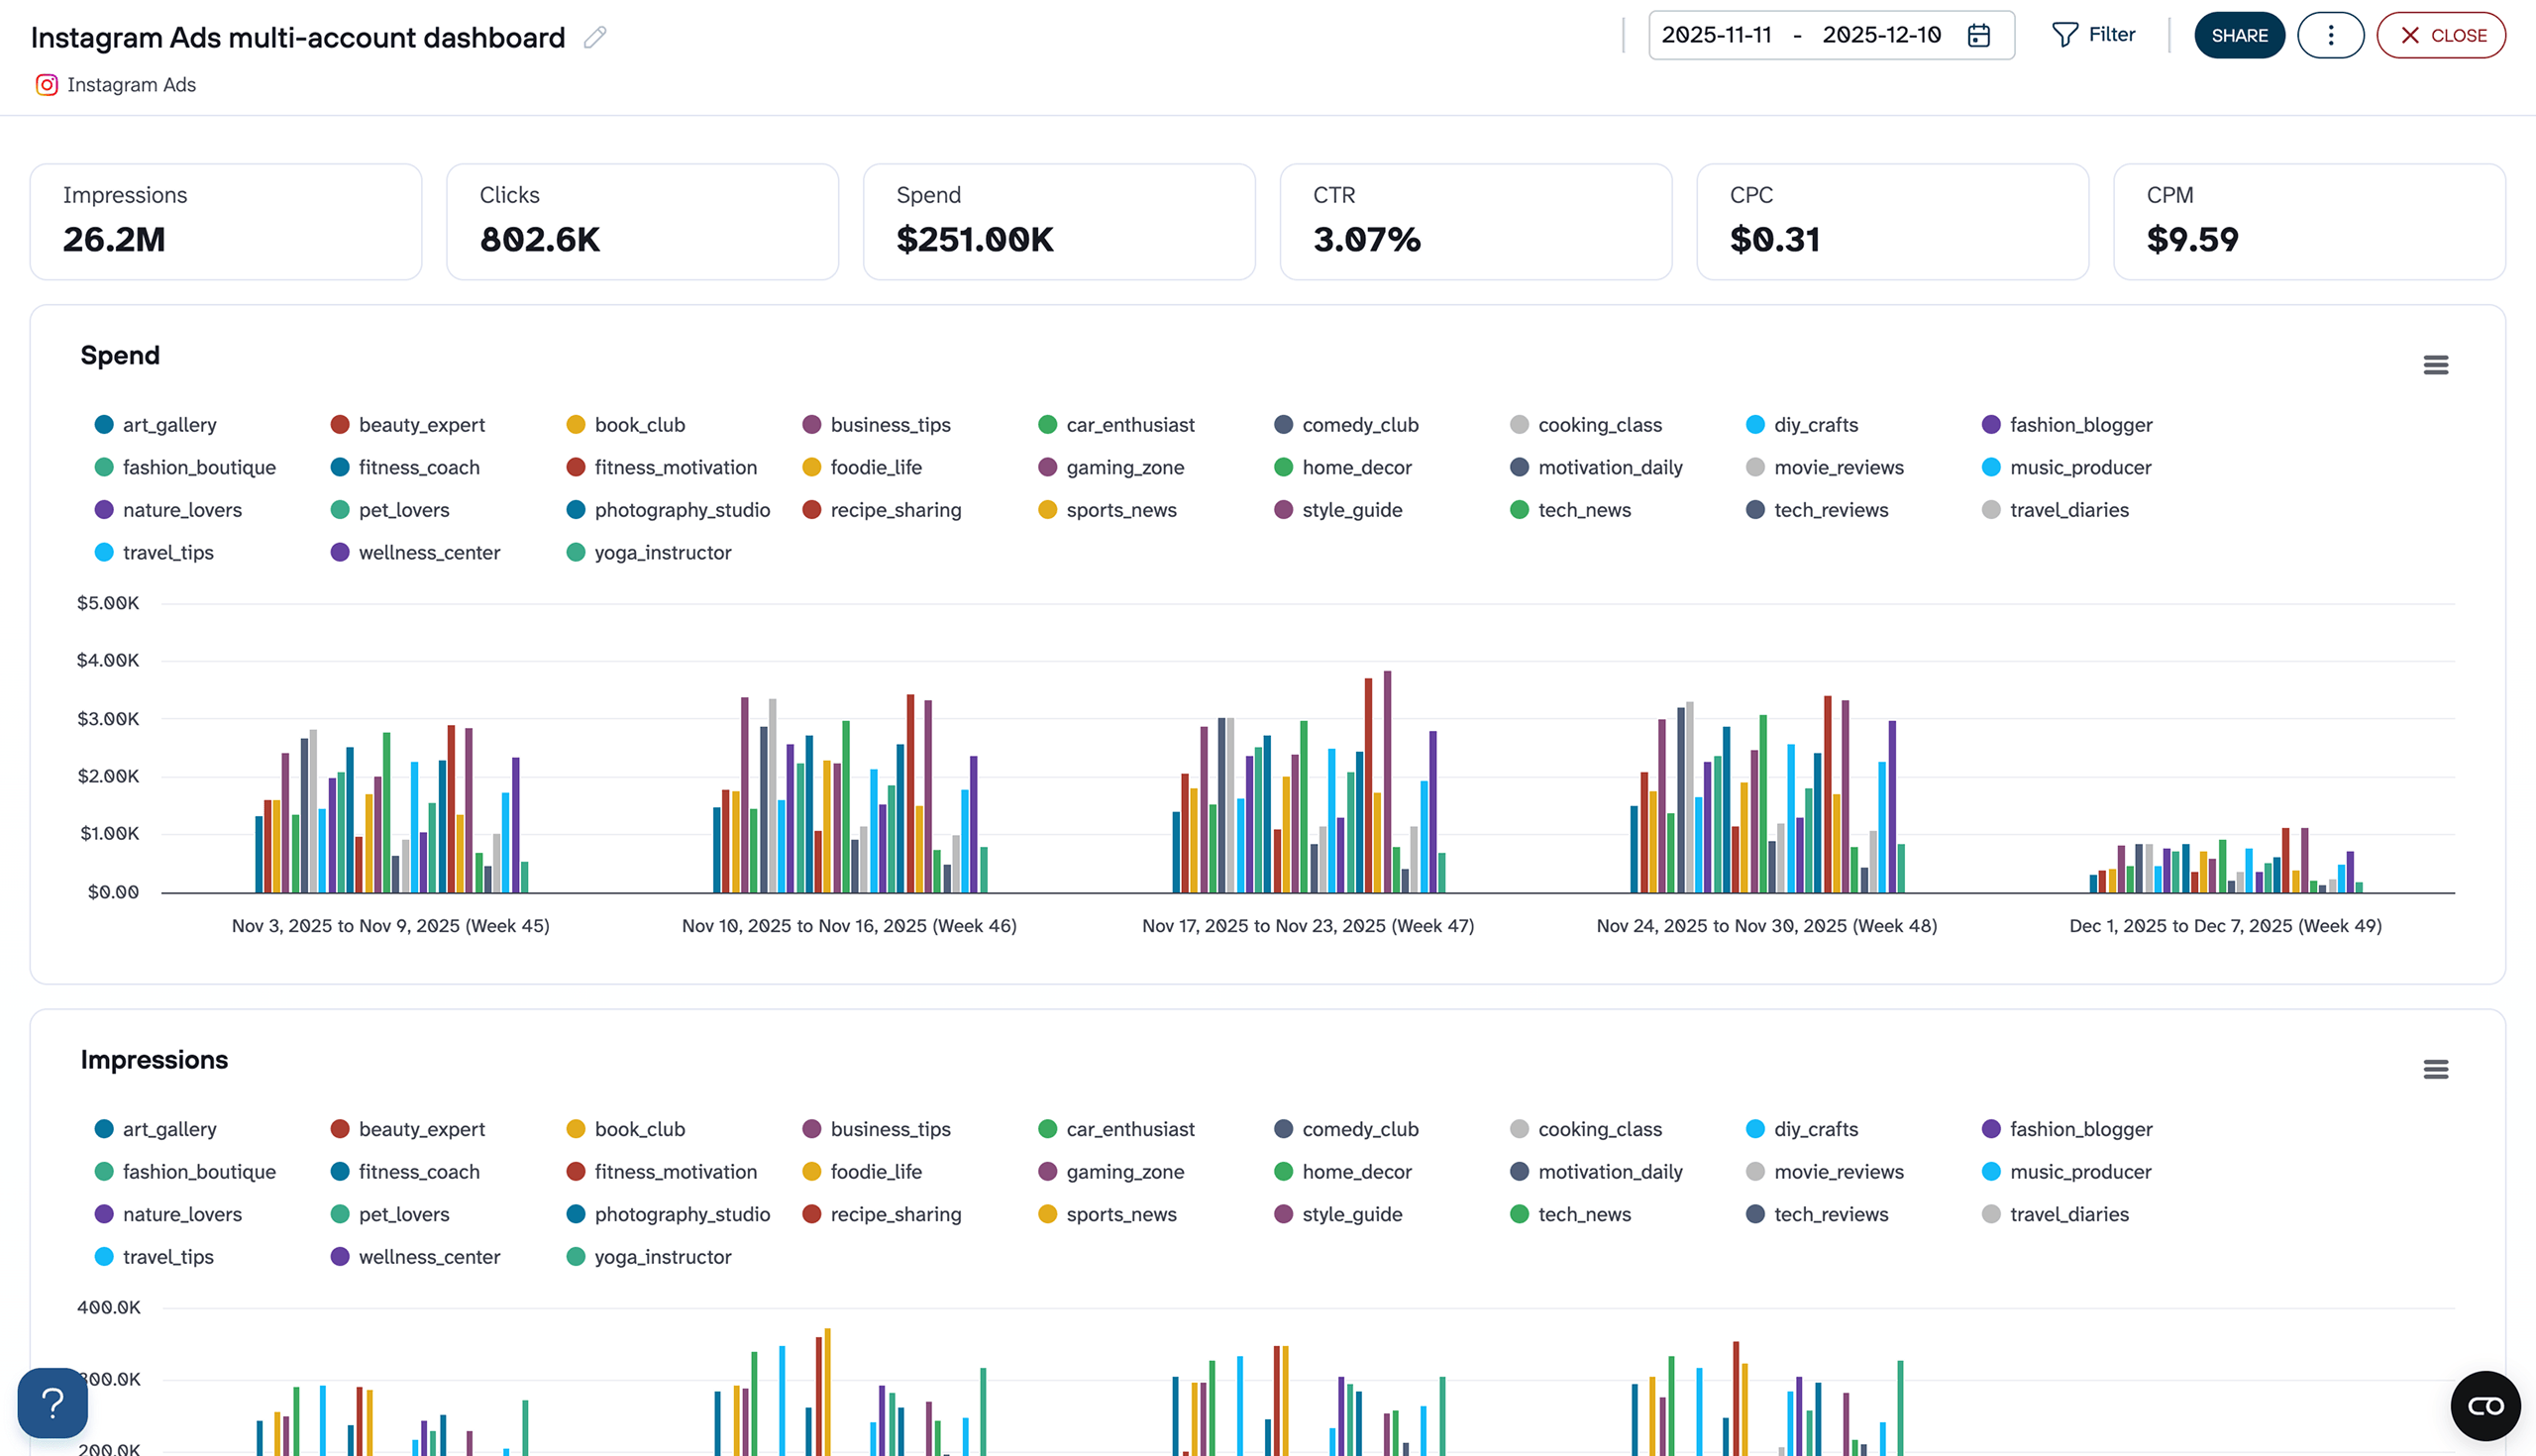
16. Instagram Ads multi-account dashboard (+ template)
If you manage Instagram ads across multiple accounts, comparing performance usually means jumping between ad managers or assembling spreadsheets. This dashboard connects to all your accounts at once and puts their metrics into a single ranked view.
Instagram Ads multi-account dashboard
 Preview dashboard
Instagram Ads multi-account dashboard
Preview dashboardThe biggest blind spot in multi-account management is audience saturation. One account might be showing the same ads to the same people three times a day while another has barely reached its audience. The Instagram Ads multi-account dashboard surfaces that imbalance through per-account frequency tracking. You can also catch budget pacing problems. If an account front-loads spend in the first two weeks and goes dark before month-end, that shows up immediately in the weekly spend charts. For monthly client reviews or internal budget meetings, the account performance table gives you a ranked comparison without any manual assembly.
The dashboard is available in the Coupler.io interface. Connect your Instagram Ads account to start using it for free.
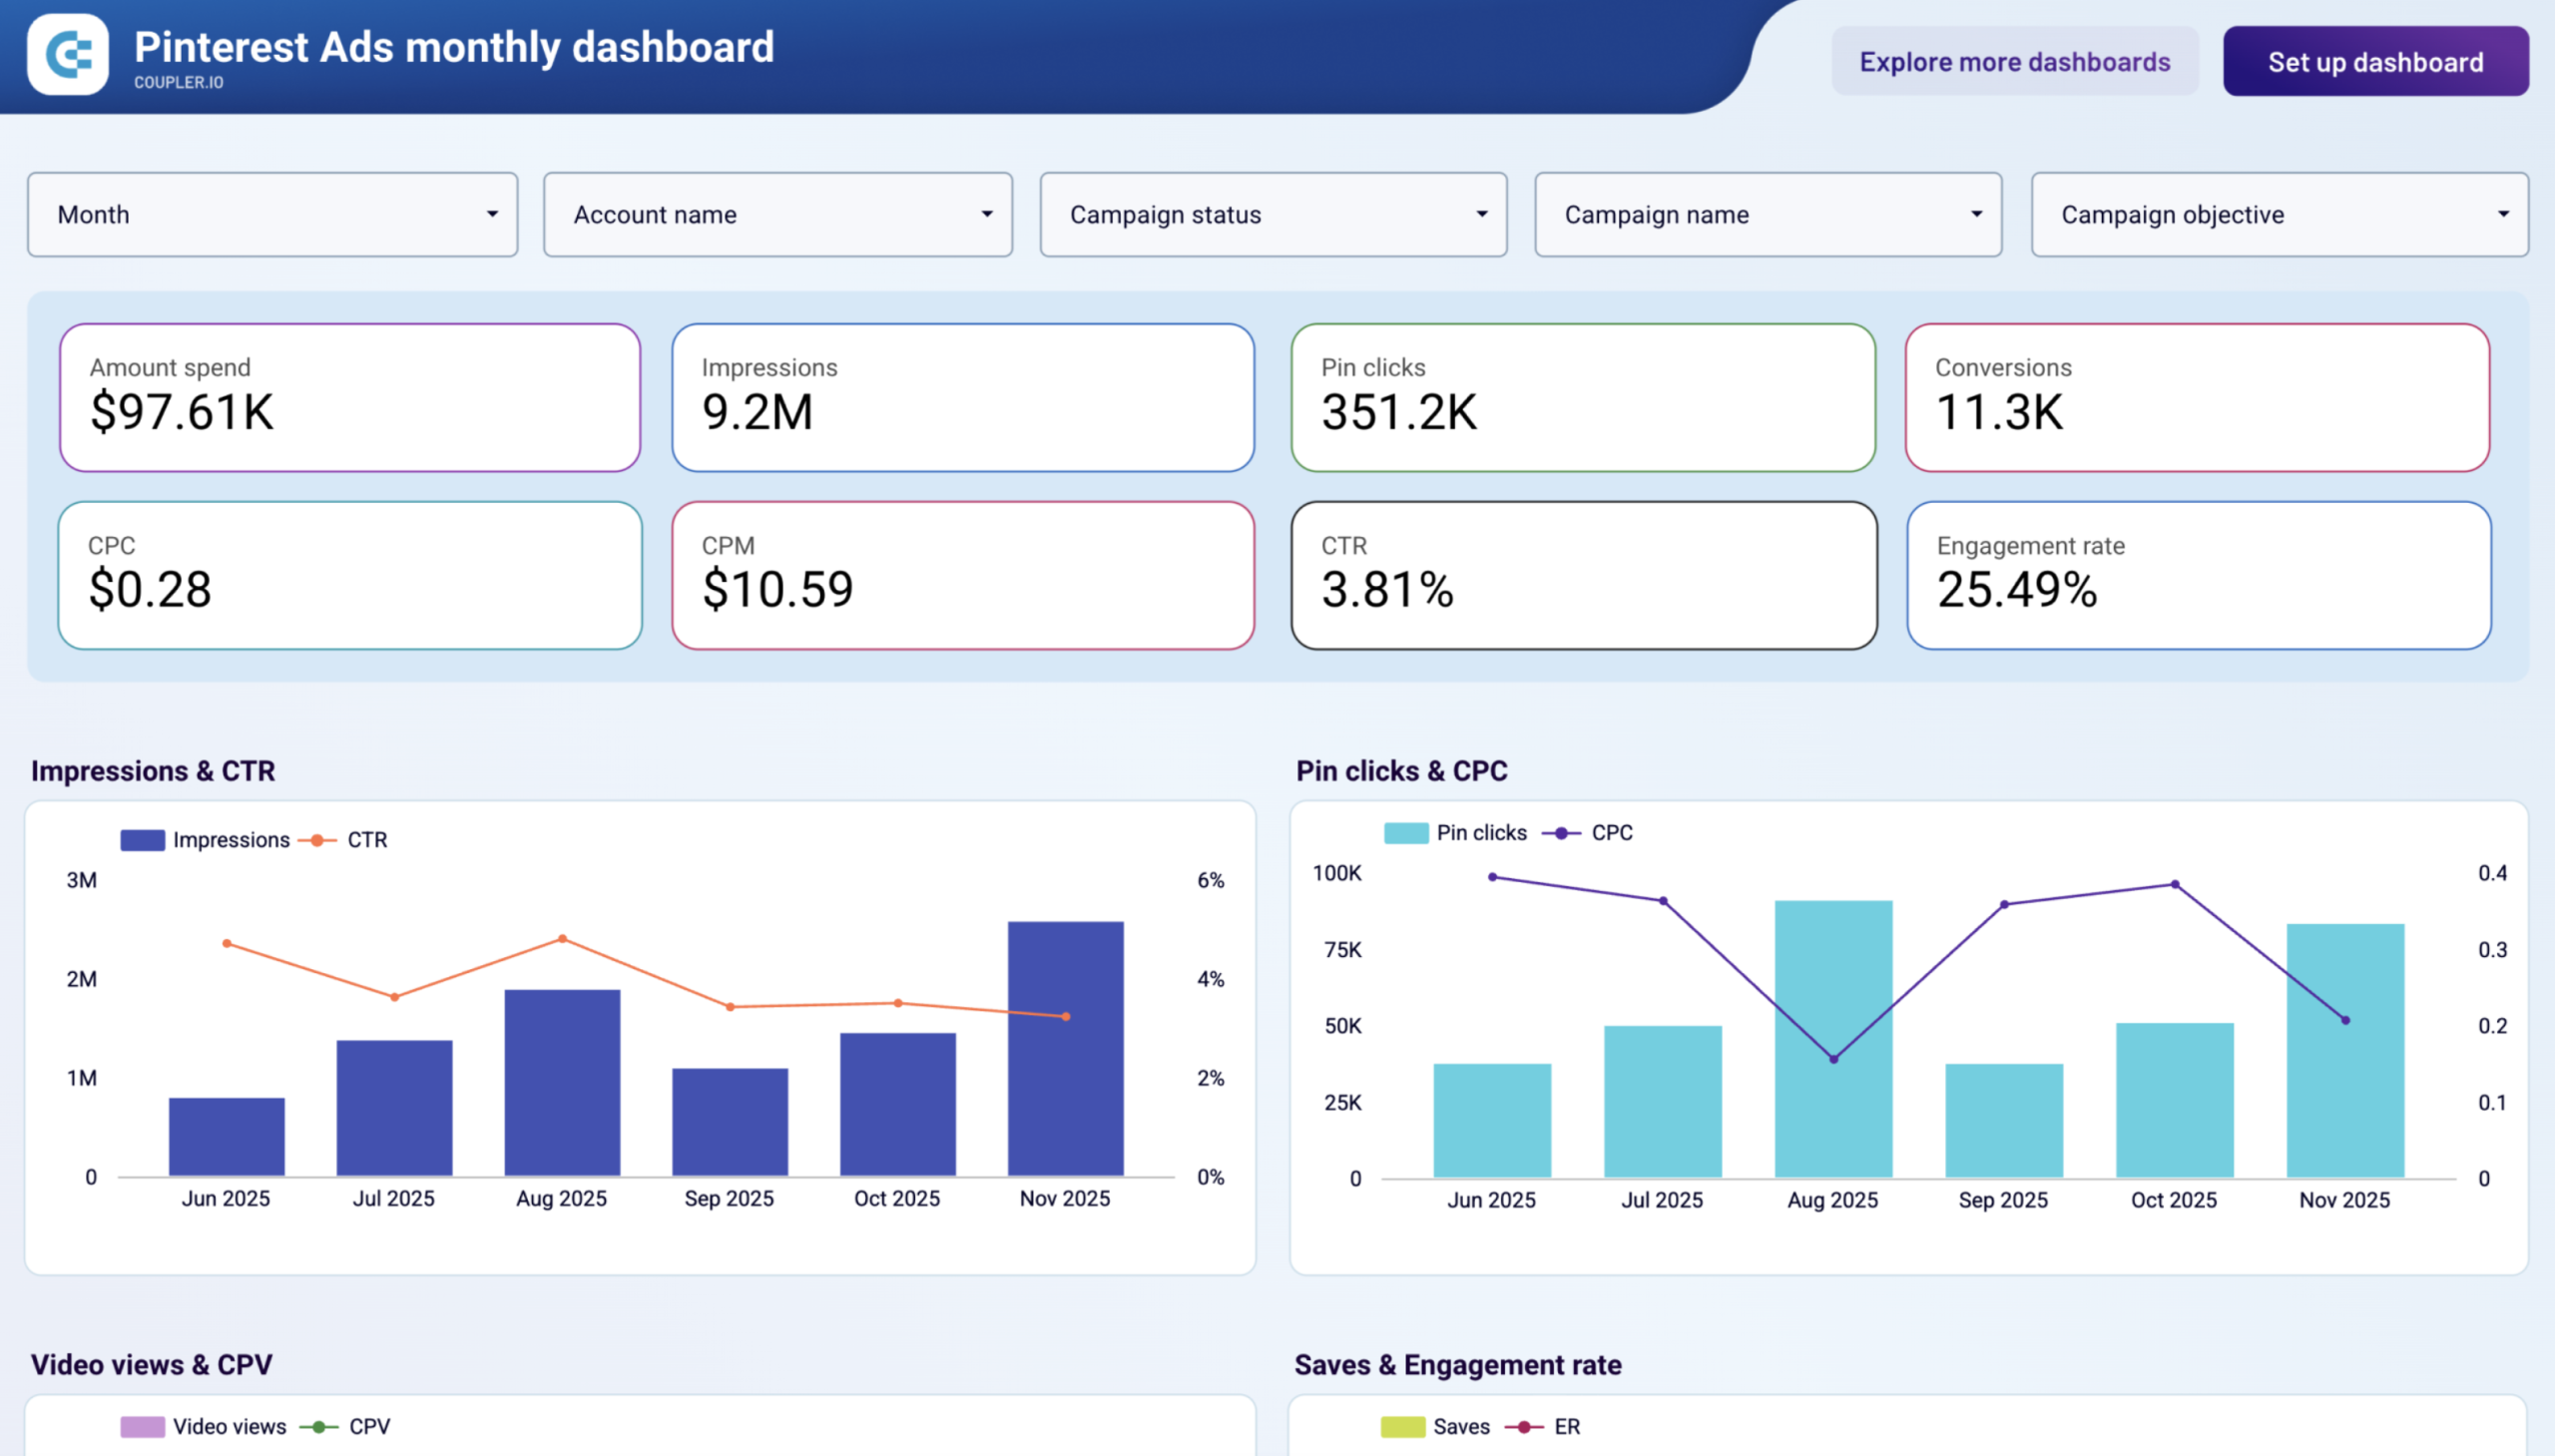
17. Pinterest Ads dashboard (+ template)
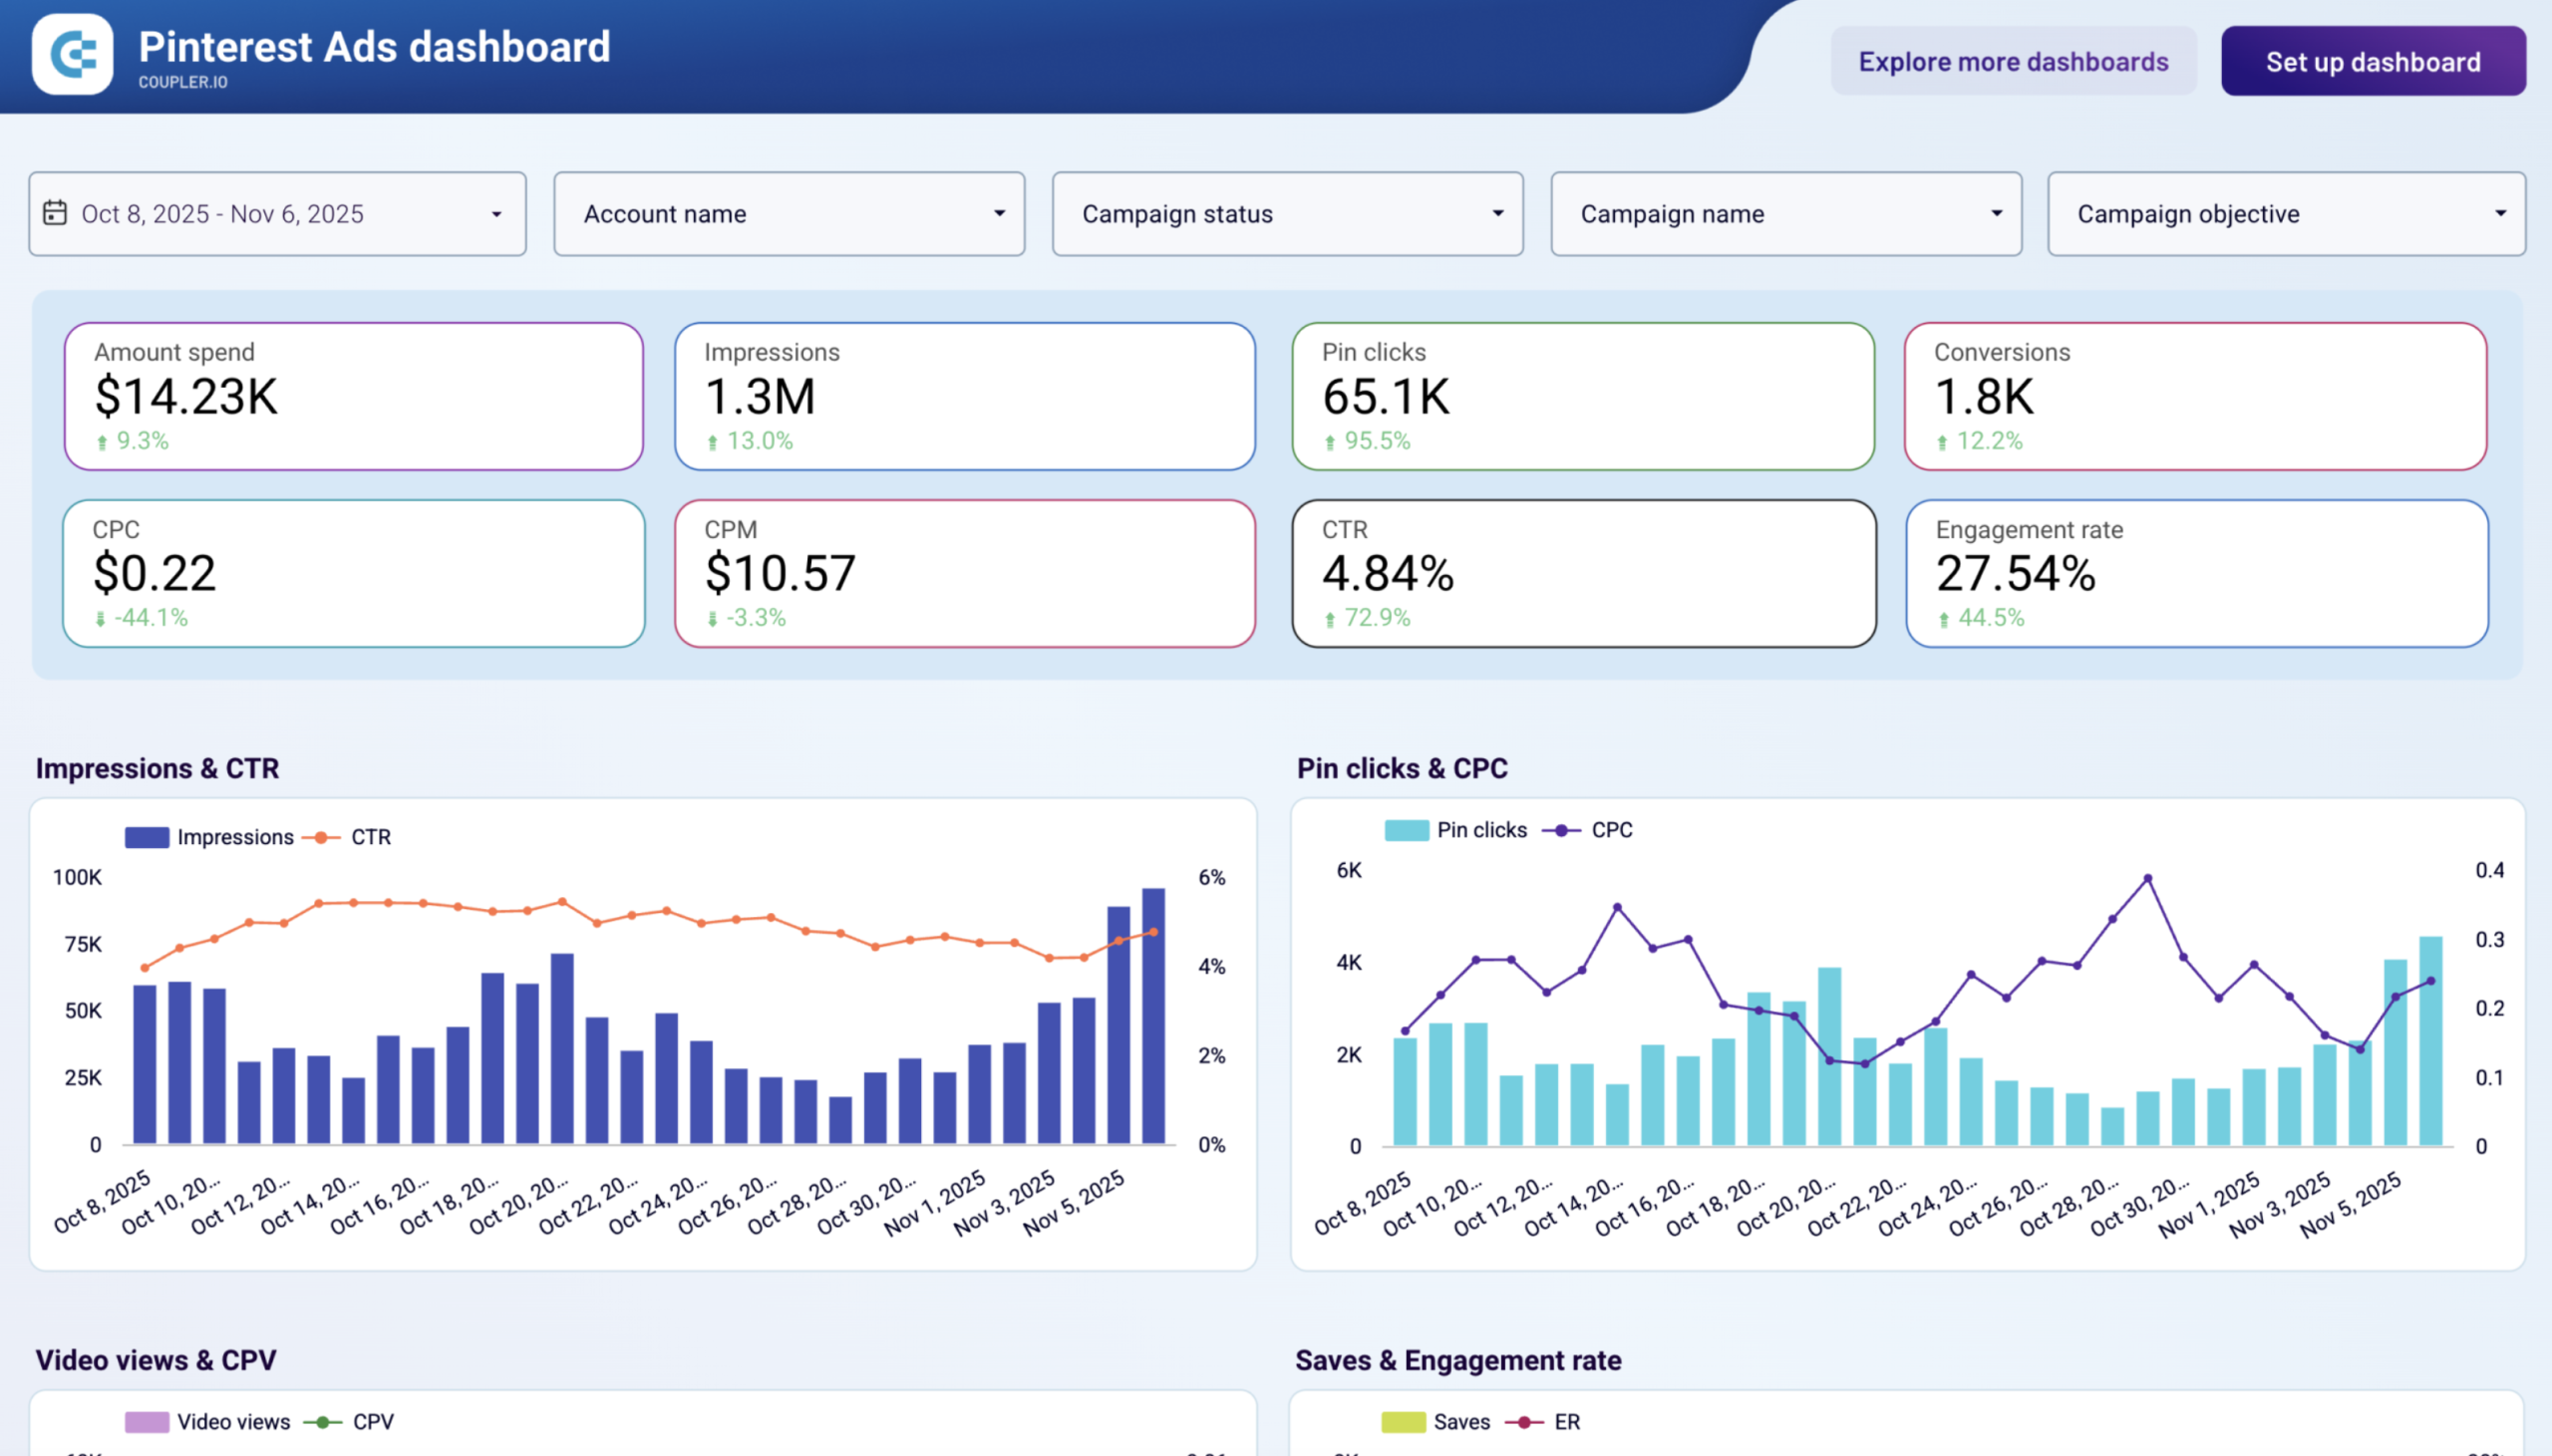
The Pinterest Ads dashboard consolidates performance data from your Pinterest advertising campaigns to show how visual content drives clicks, saves, and conversions. It combines impression and engagement metrics with video performance and cost data to help you identify which creative approaches deliver the best return on ad spend. Here you can track essential metrics, including spend, impressions, pin clicks, conversions, CPC, CPM, CTR, and engagement rate.
The dashboard focuses on Pinterest-specific metrics like saves and outbound clicks that matter for visual content strategy. Use the spend dynamics chart and campaign performance rankings to optimize budget allocation. Besides, the detailed performance table provides complete metrics for each campaign, including CPOC, video views, and saves for direct comparison.
This dashboard is available as a template in Looker Studio. Preview and try it for free.
18. Pinterest Ads monthly performance dashboard (+template)
For businesses running continuous Pinterest advertising who need strategic insights rather than daily fluctuations, this monthly performance dashboard aggregates data by month to reveal seasonal patterns, cost efficiency cycles, and long-term campaign trends for annual budget planning.
Monthly scorecards display key metrics including amount spent, impressions, pin clicks, conversions, CPC, CPM, CTR, and engagement rate with period-over-period comparisons. The spend dynamics chart shows monthly investment patterns, while campaign rankings reveal which campaigns maintain strong performance over extended periods. Additionally, the detailed monthly table provides complete metrics, including outbound clicks, CPOC, and video performance.
This Looker Studio template is designed by Coupler.io with a built-in connector. Try it right away for free!
Marketing dashboards for brand awareness
19. Facebook Ads and brand awareness dashboard (+ template)
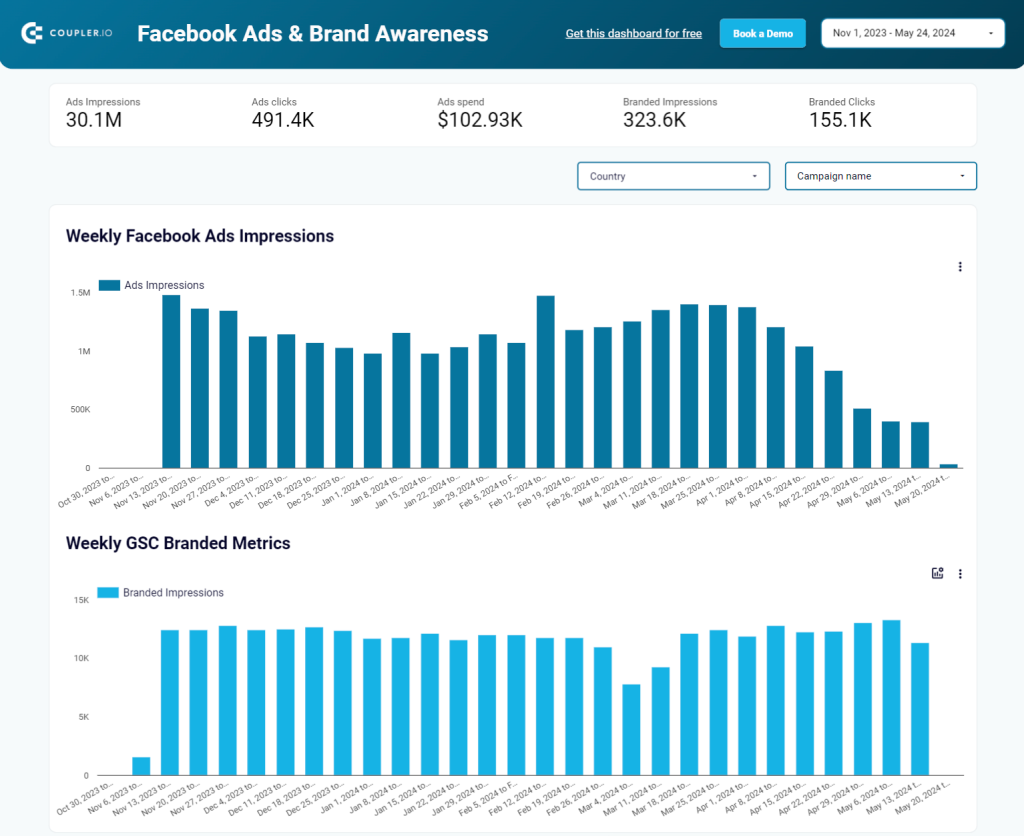
The next dashboard lets you evaluate how your Facebook Ads campaigns influence branded searches and increase brand awareness. The template visualizes data from Facebook Ads and Google Search Console in Looker Studio. To use this dashboard, you need to select the specific region where you run plenty of ads on Facebook. Then, by comparing the two graphs, you can determine if there is a correlation between your ad efforts and changes in brand awareness.
20. Brand awareness dashboard in Power BI (+ template)
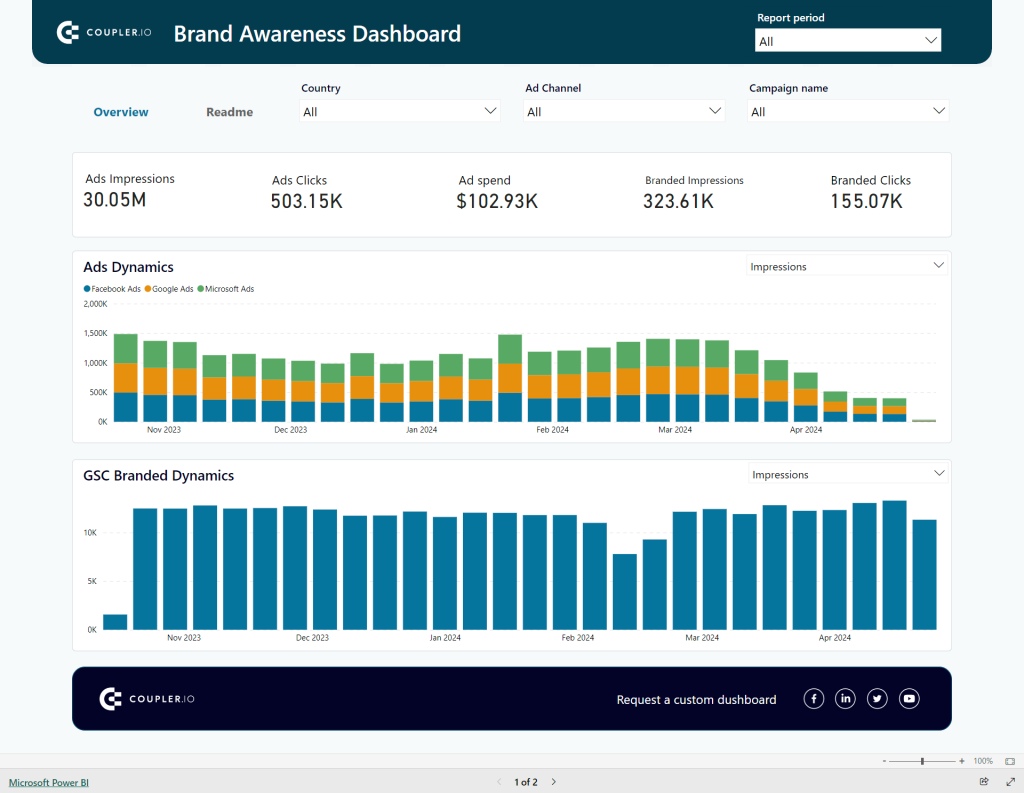
This dashboard is similar to the previous one, but it uses data from more ad sources – Google Ads, Microsoft Ads, and Facebook Ads. Another difference is that the template is built in Power BI. By analyzing the graphs, you can determine the correlation between your ad campaigns and branded dynamics registered in Google Search Console. Apart from that, in the stacked bar graph, you can also estimate the impact of specific ad channels on the end result.
Website analytics and SEO dashboards
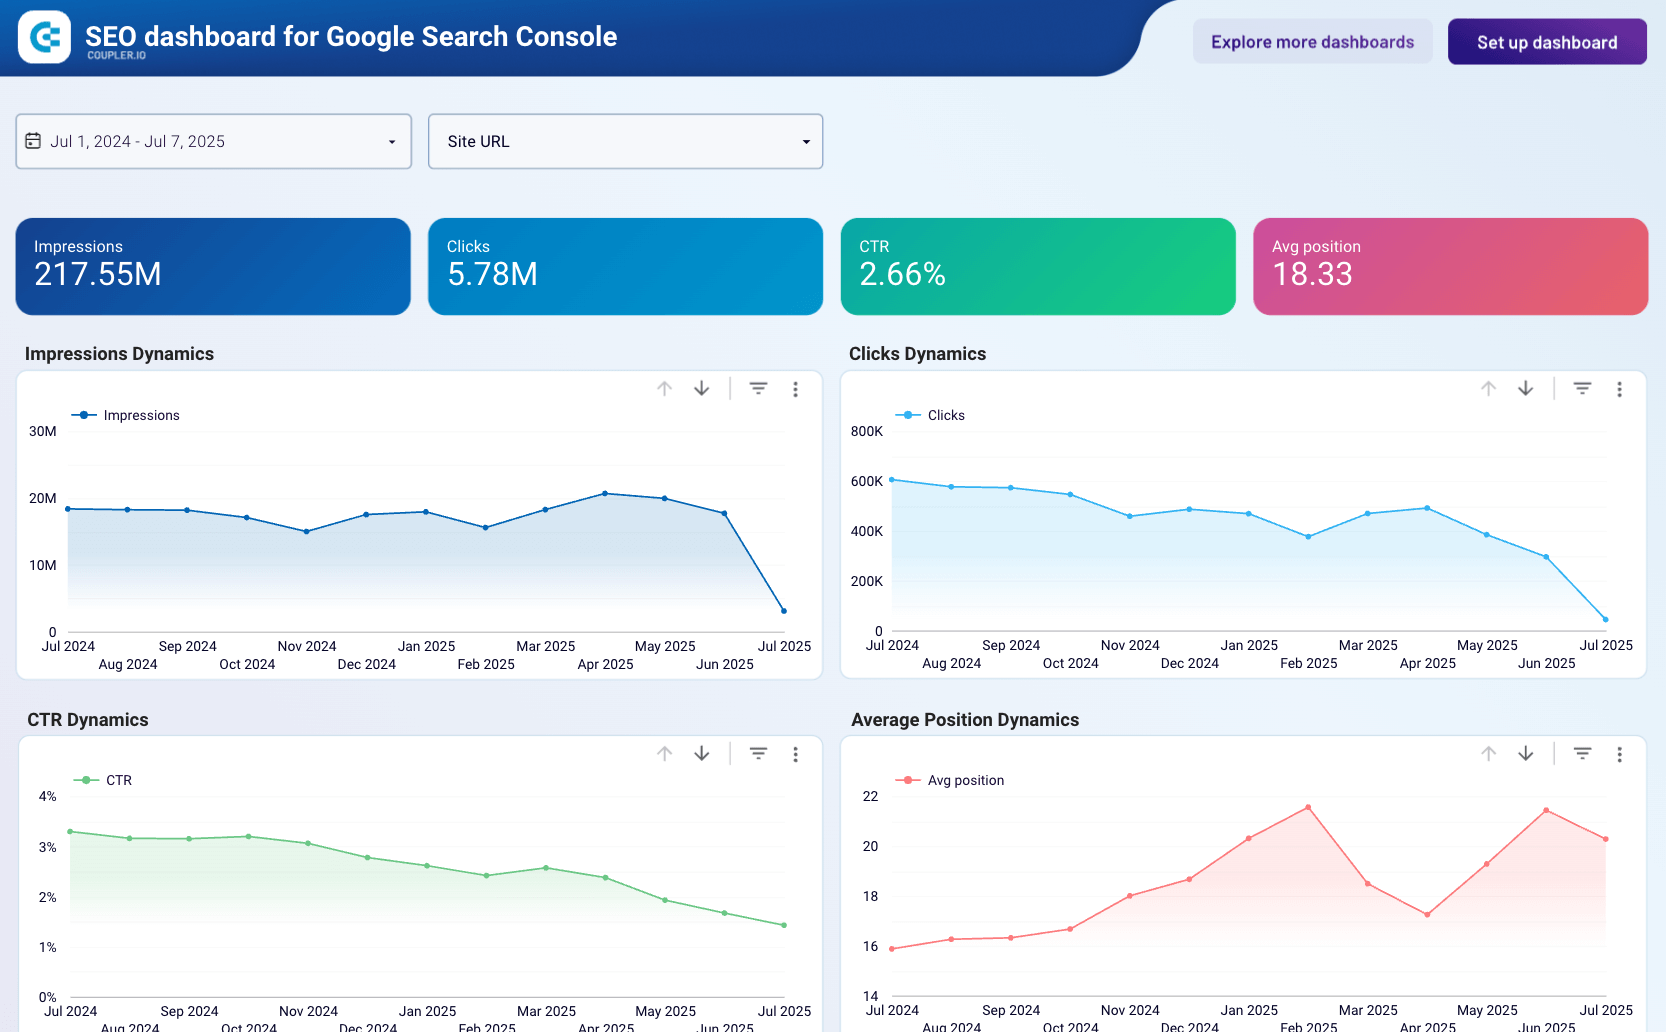
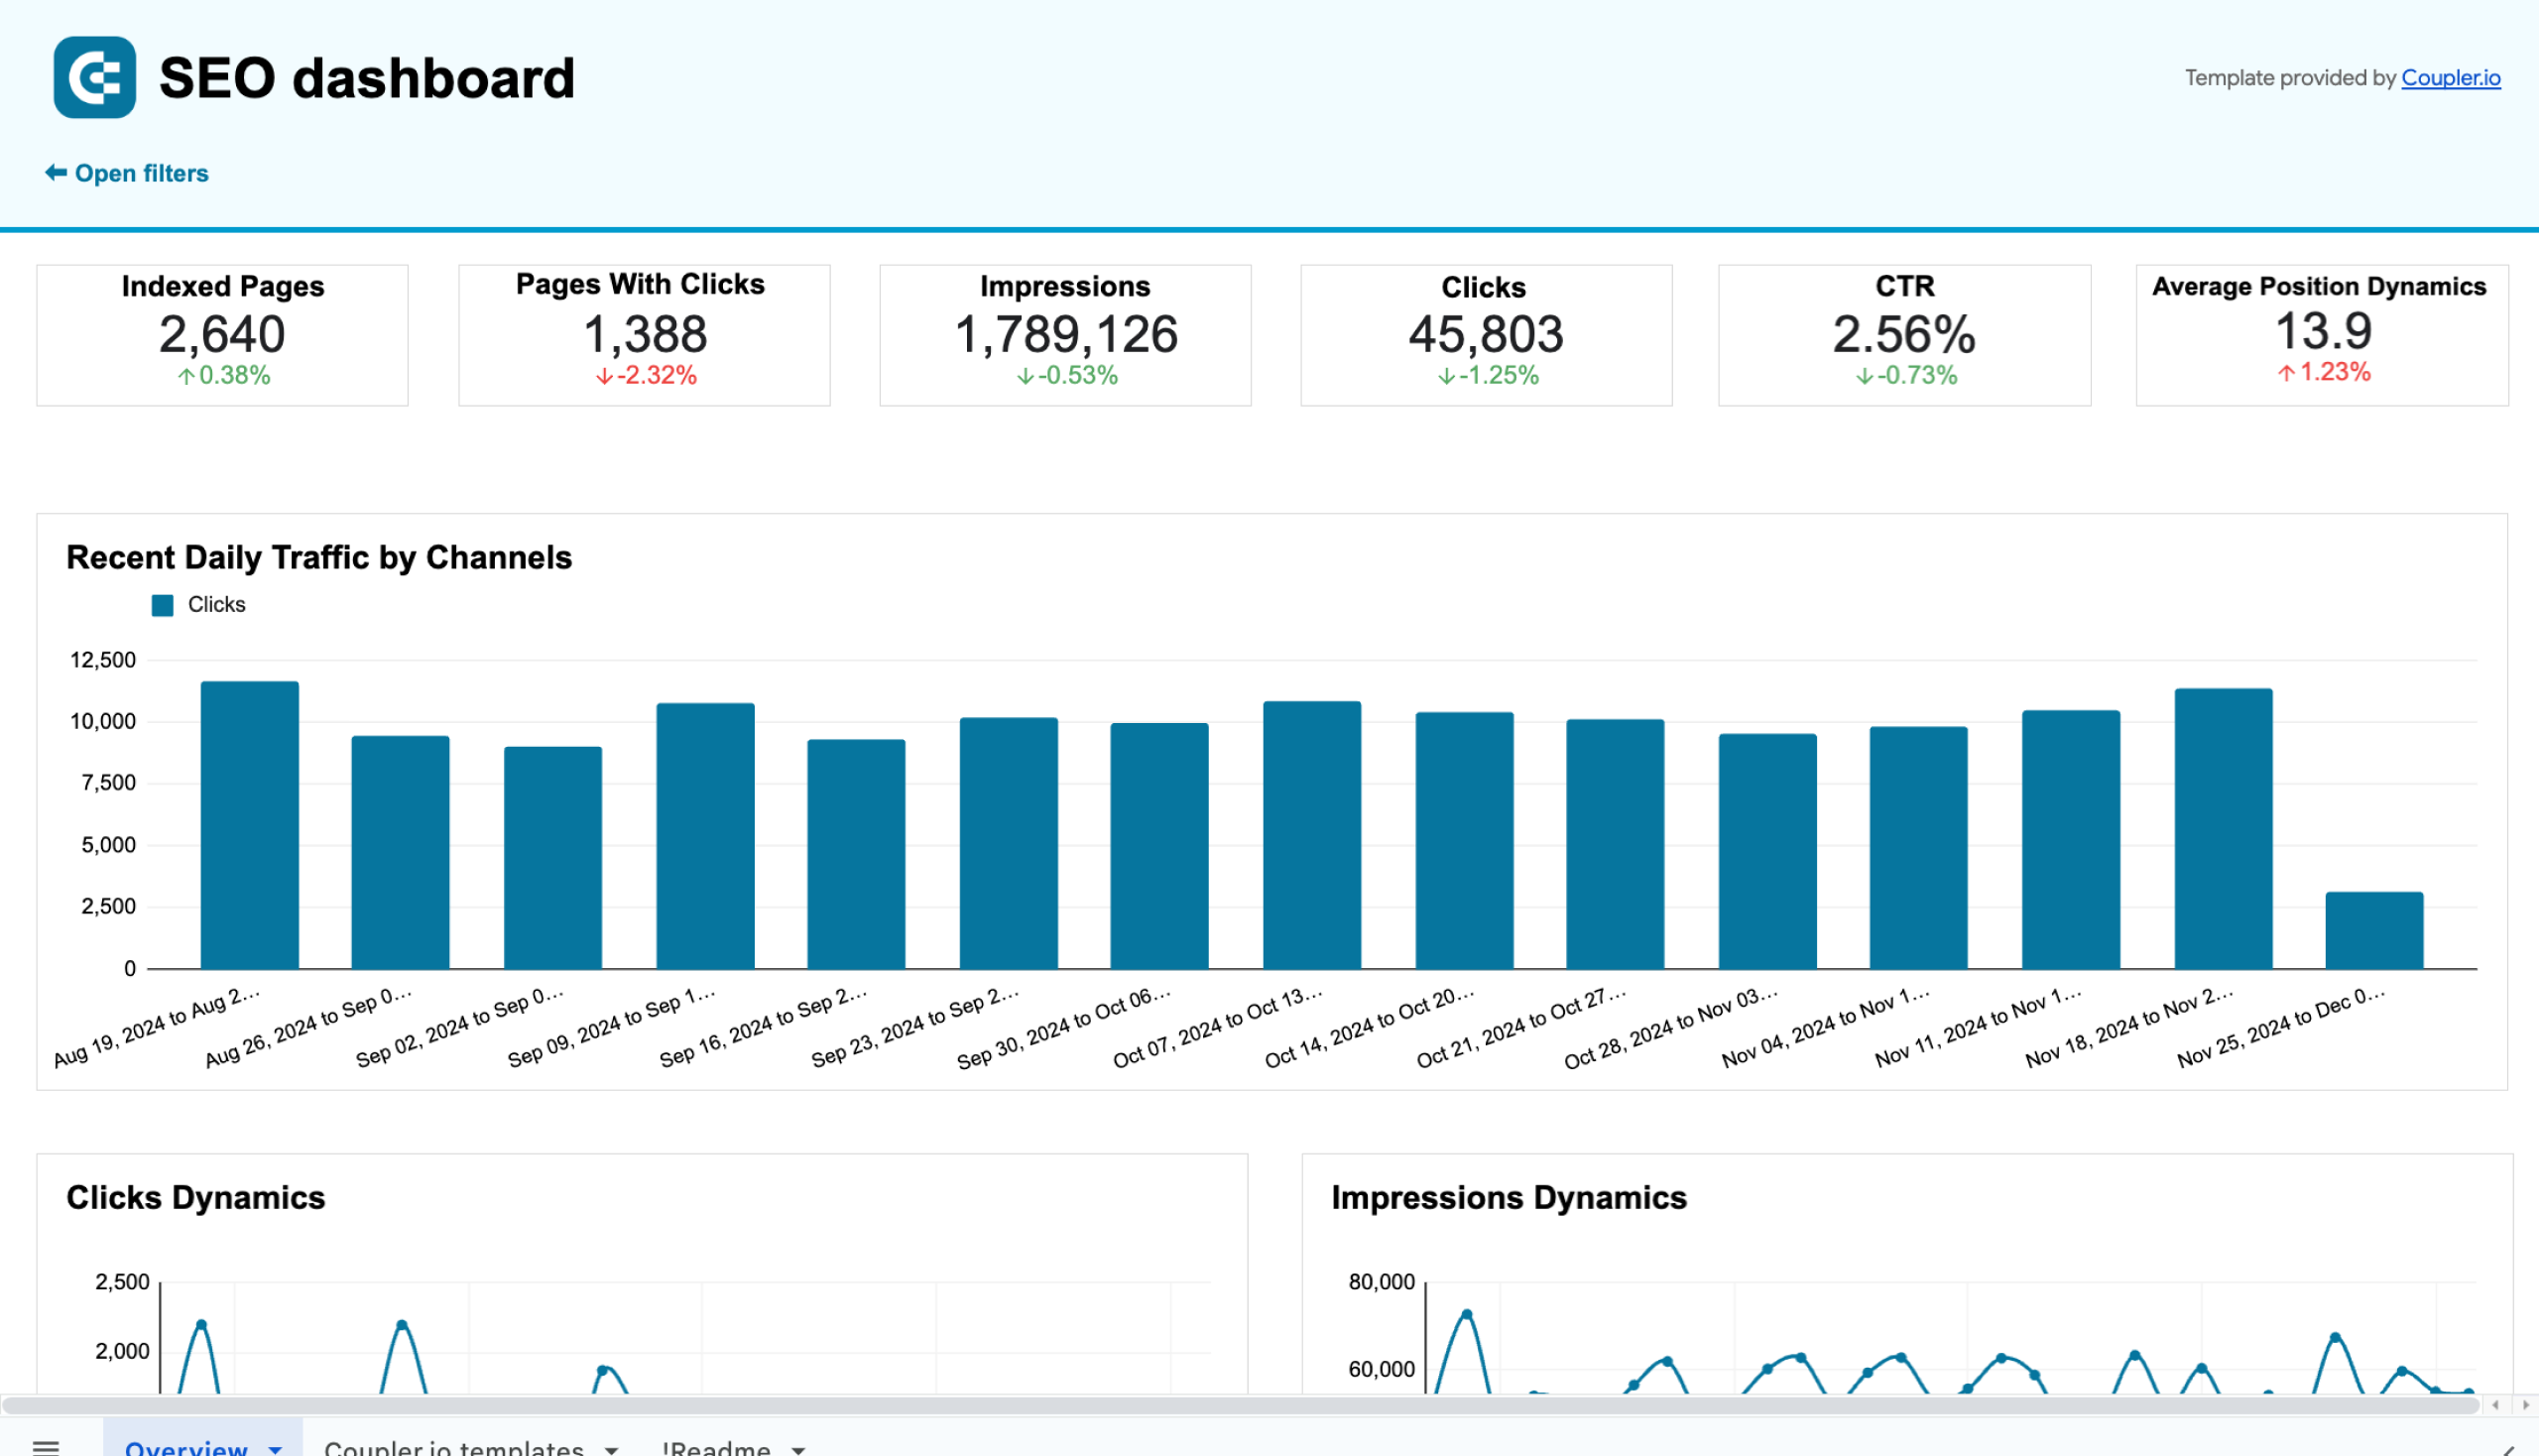
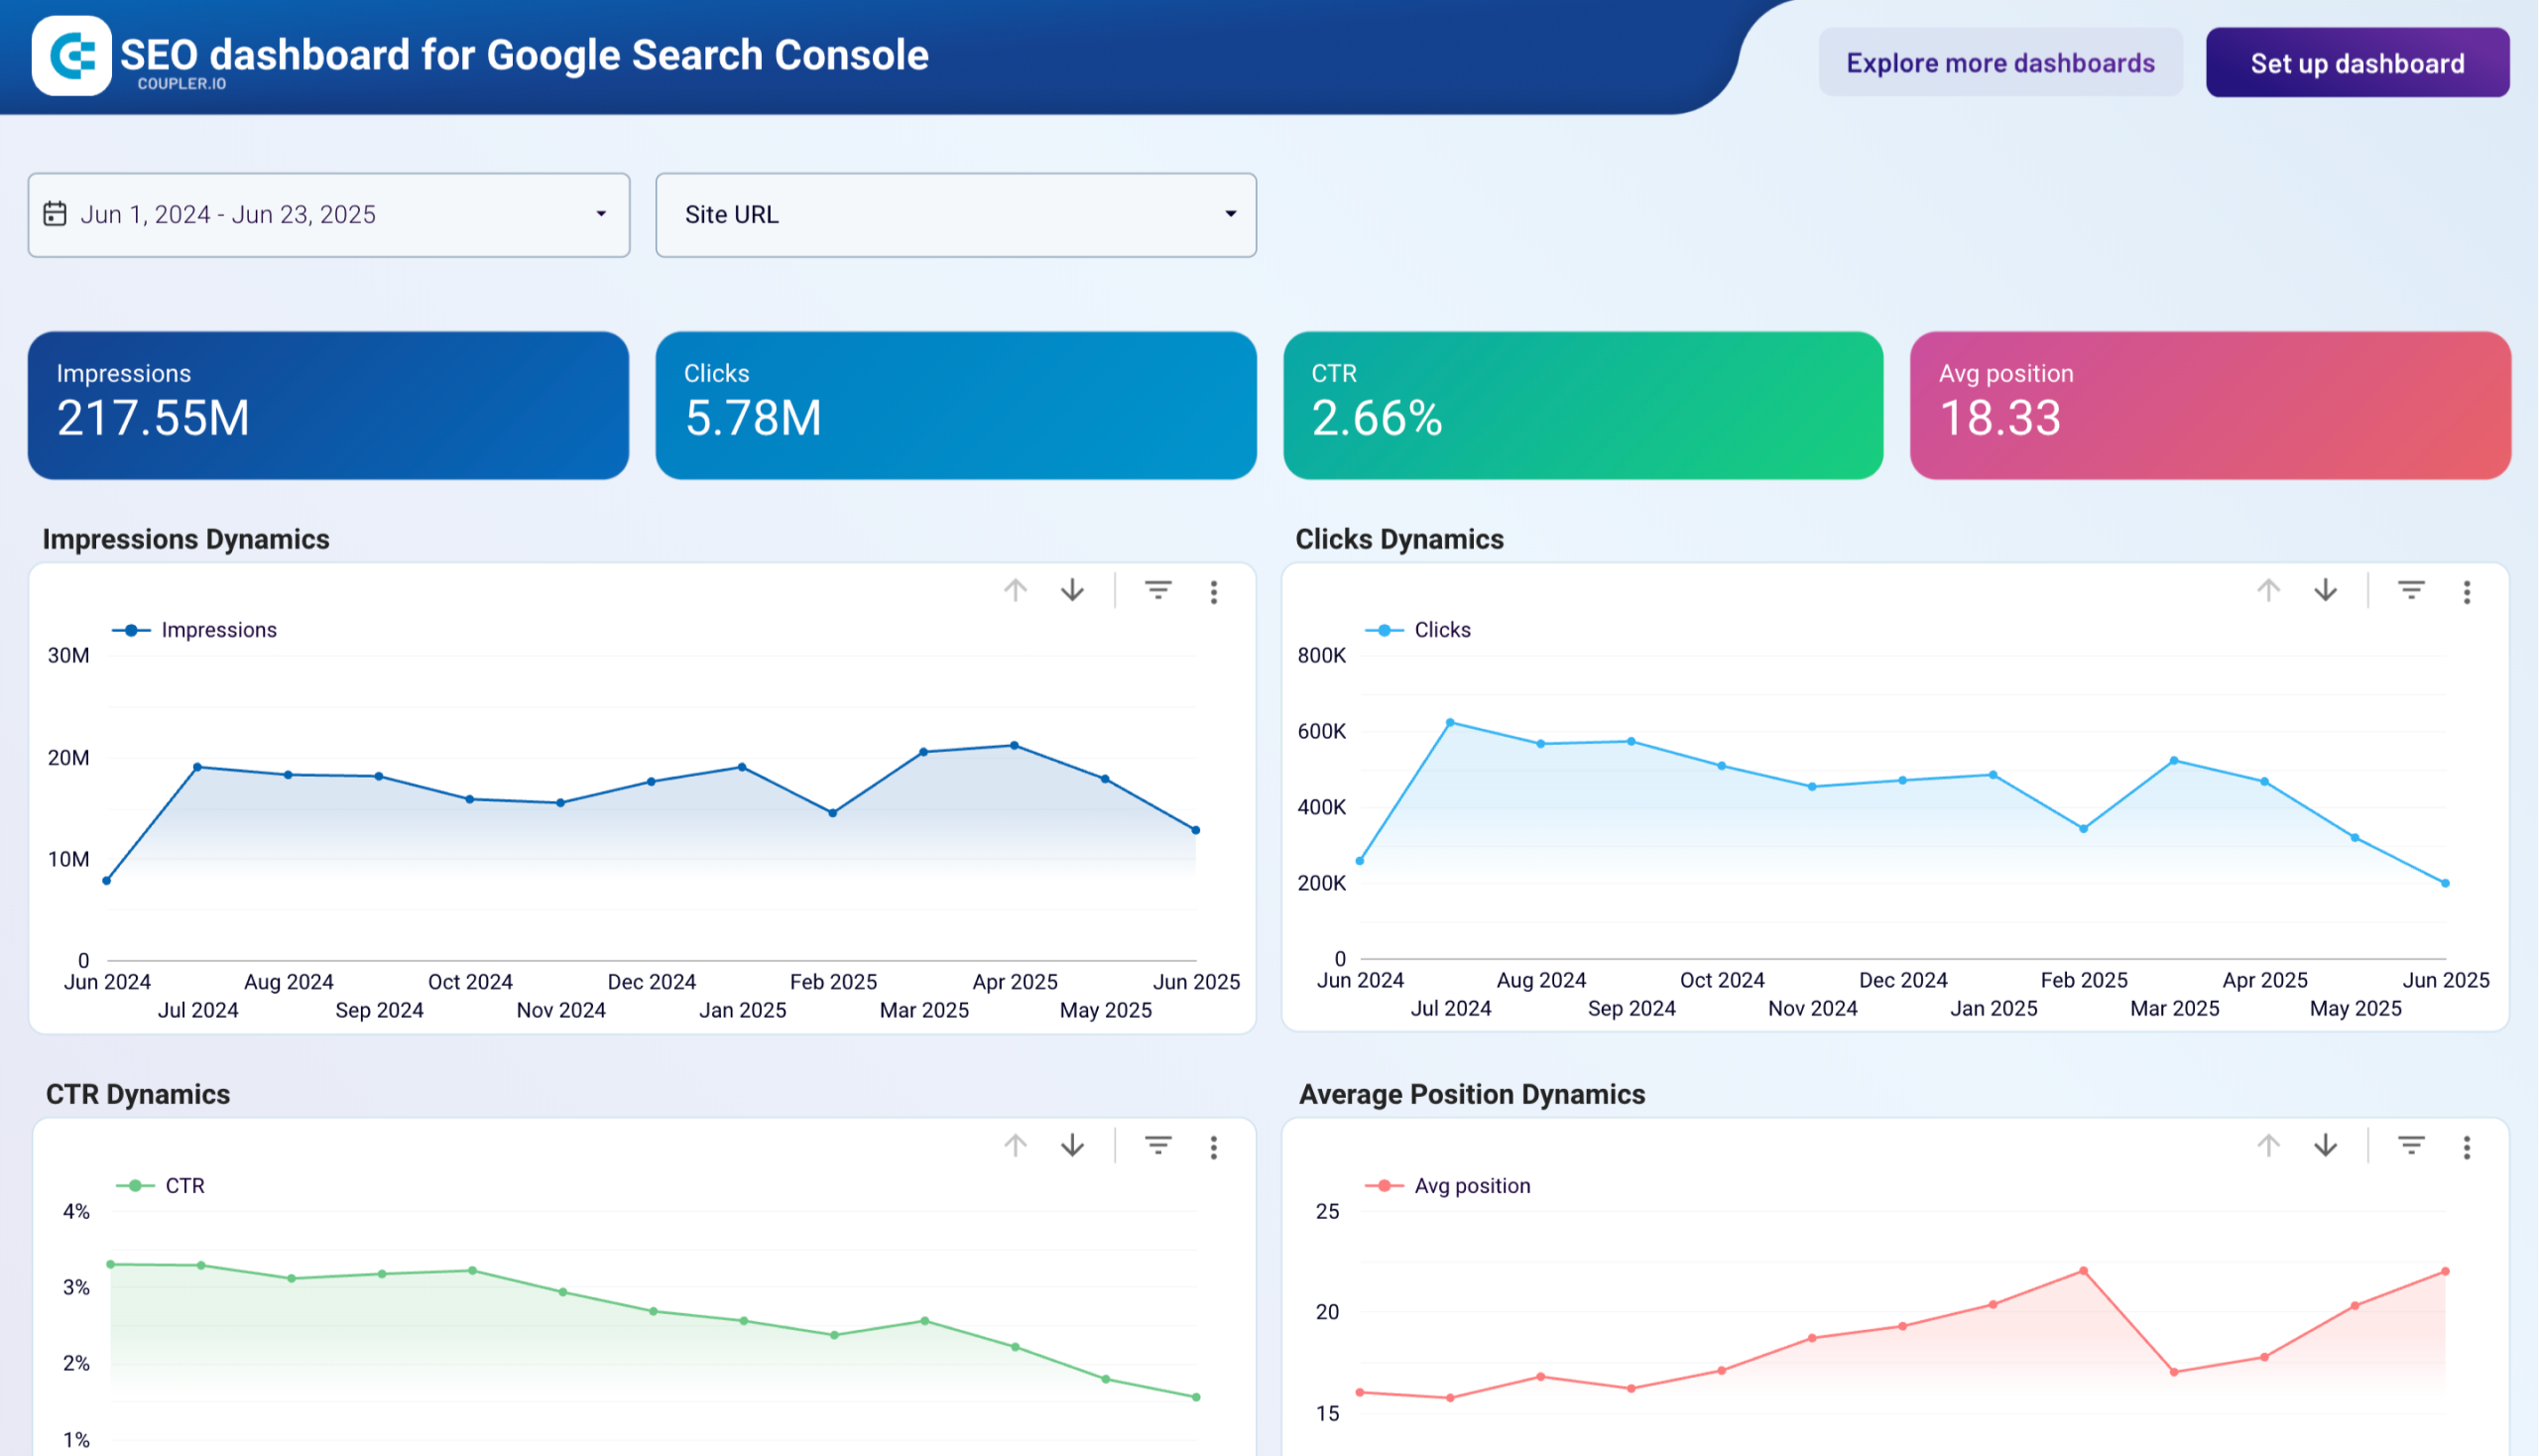
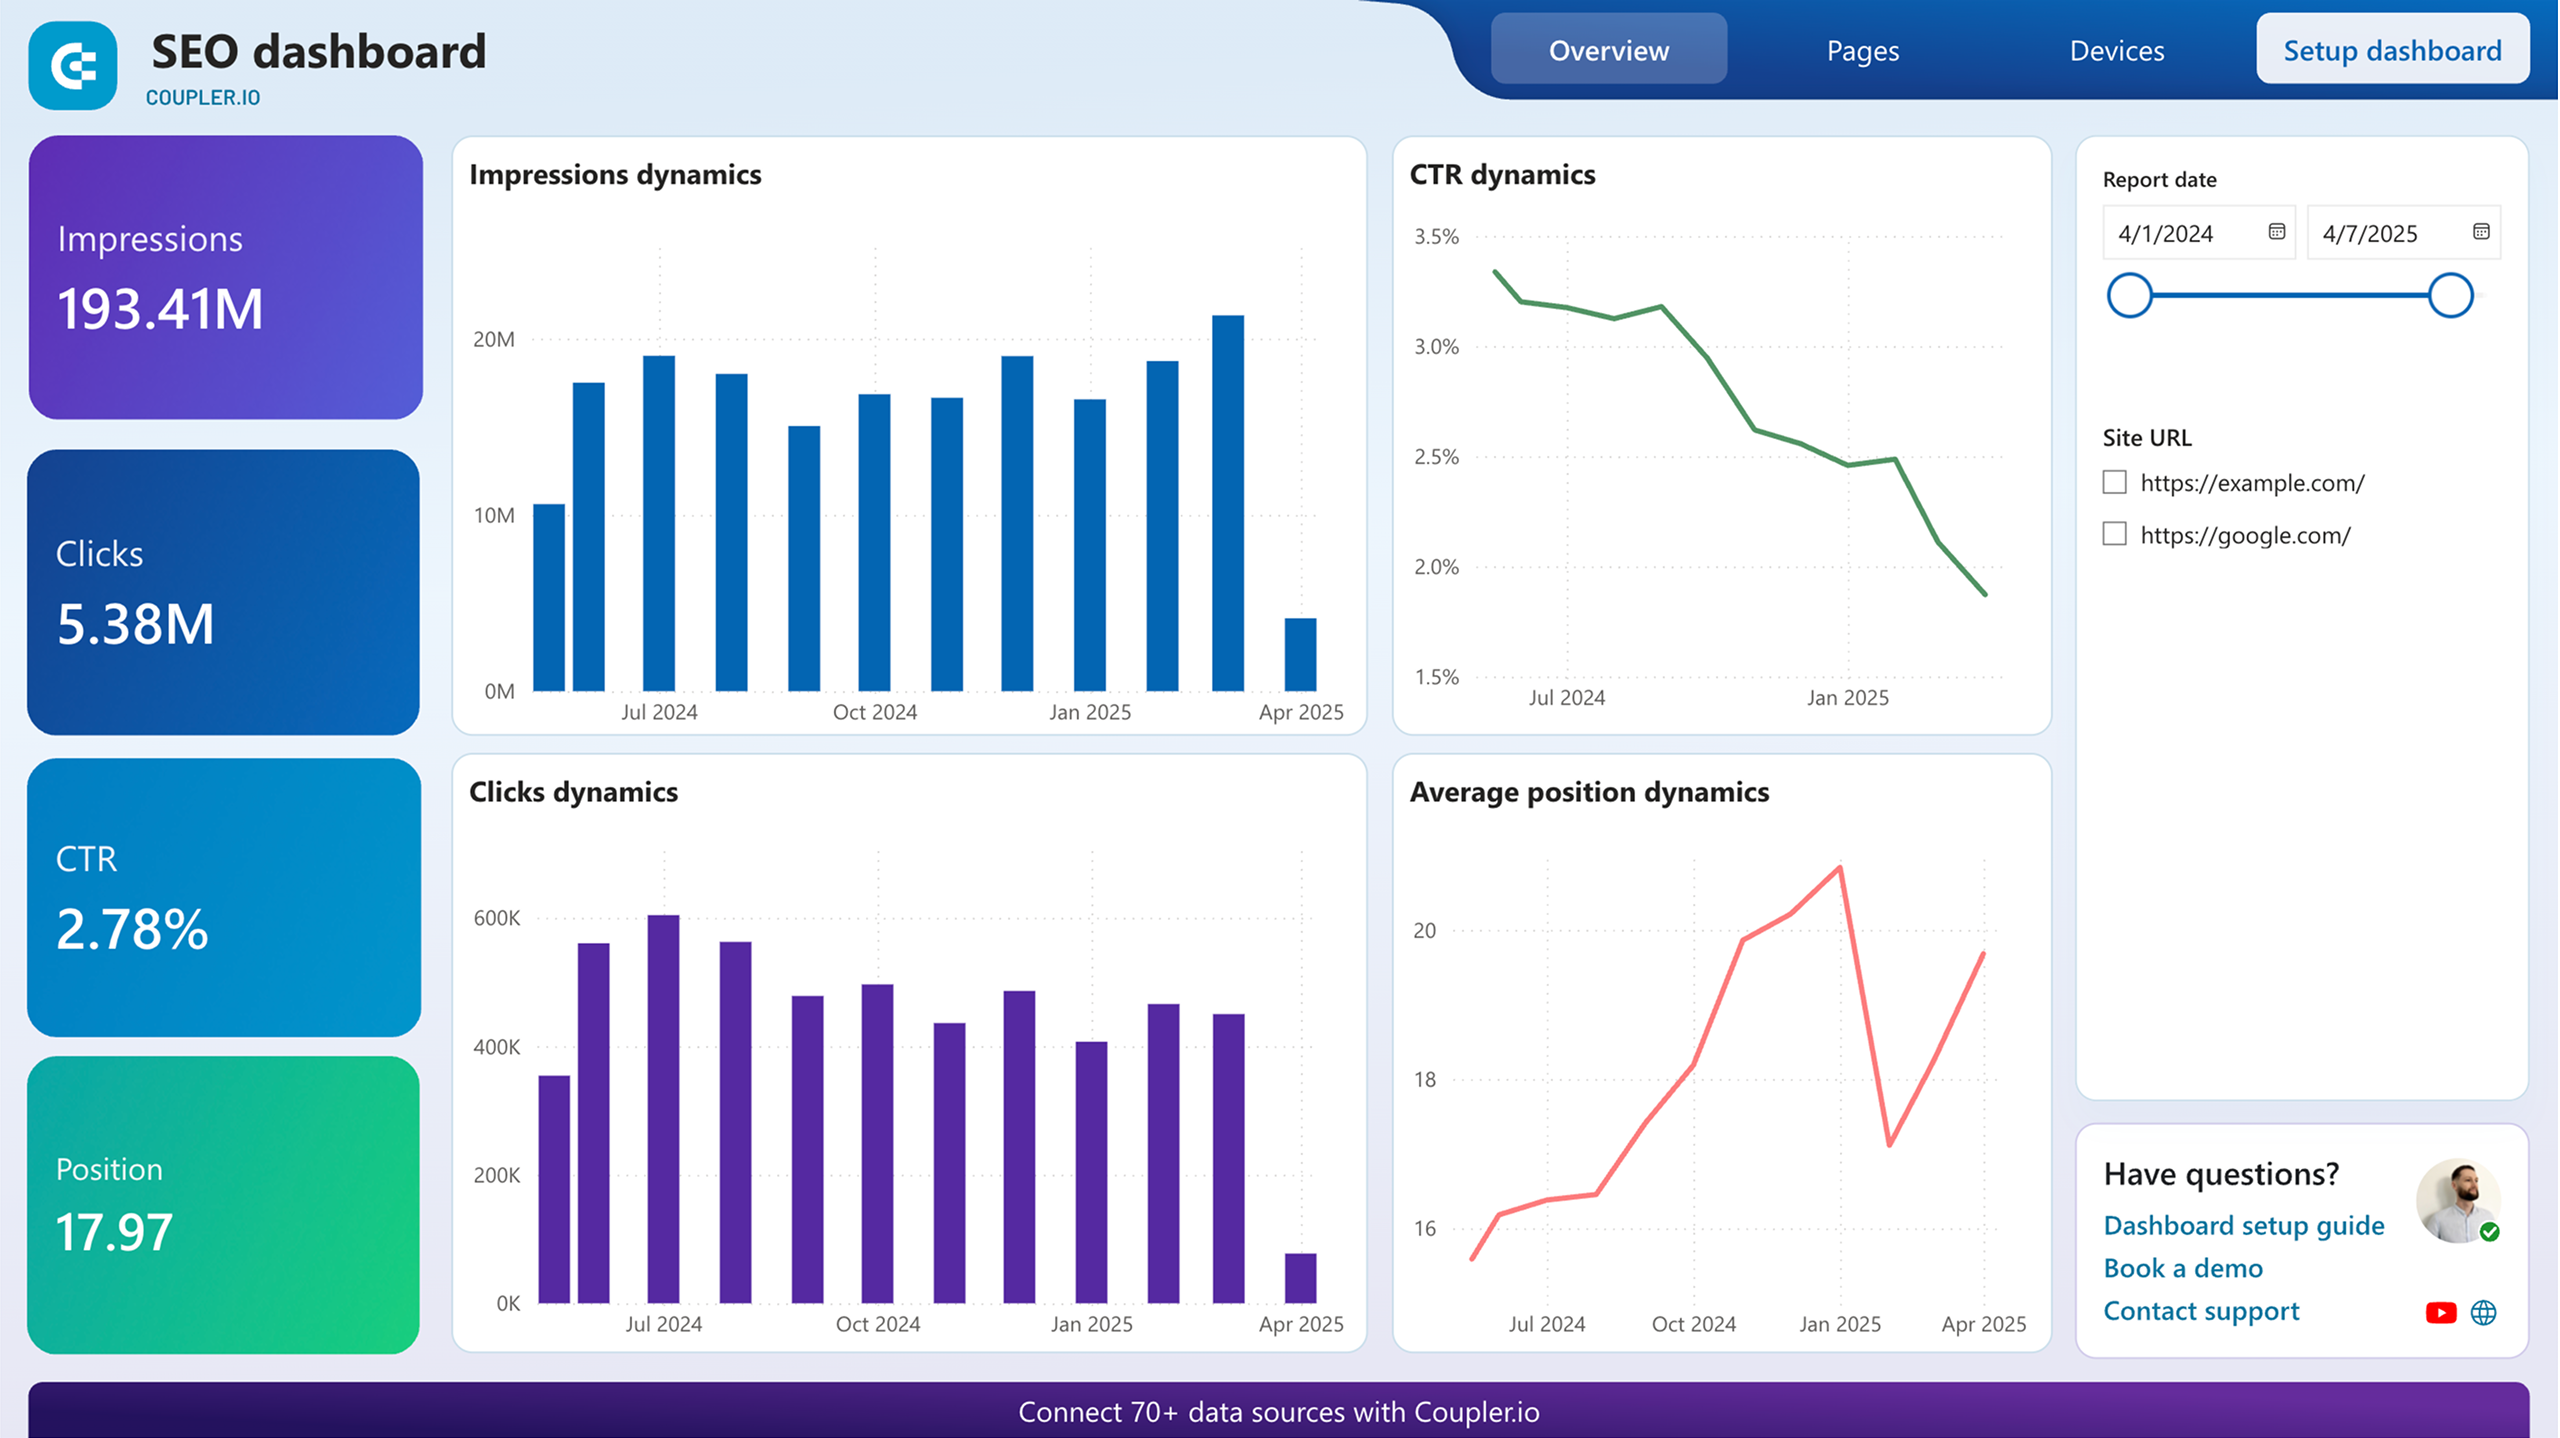
21. SEO dashboard for Google Search Console (+ template)
SEO dashboard for Google Search Console
 Preview dashboard
SEO dashboard for Google Search Console
Preview dashboardAn SEO dashboard is a way to track how well your website is doing in search engines like Google. It includes metrics such as how many people visit your website, how many clicks they generate, what keywords they use, and so on. Metrics like these help you understand the performance of your content and how you can improve it. We introduced an example of an SEO dashboard based on the data from Google Search Console but there can be many other variations.
The dashboard template is available for Google Sheets, Looker Studio, and Power BI. Pick the version that meets your reporting needs and try it out.

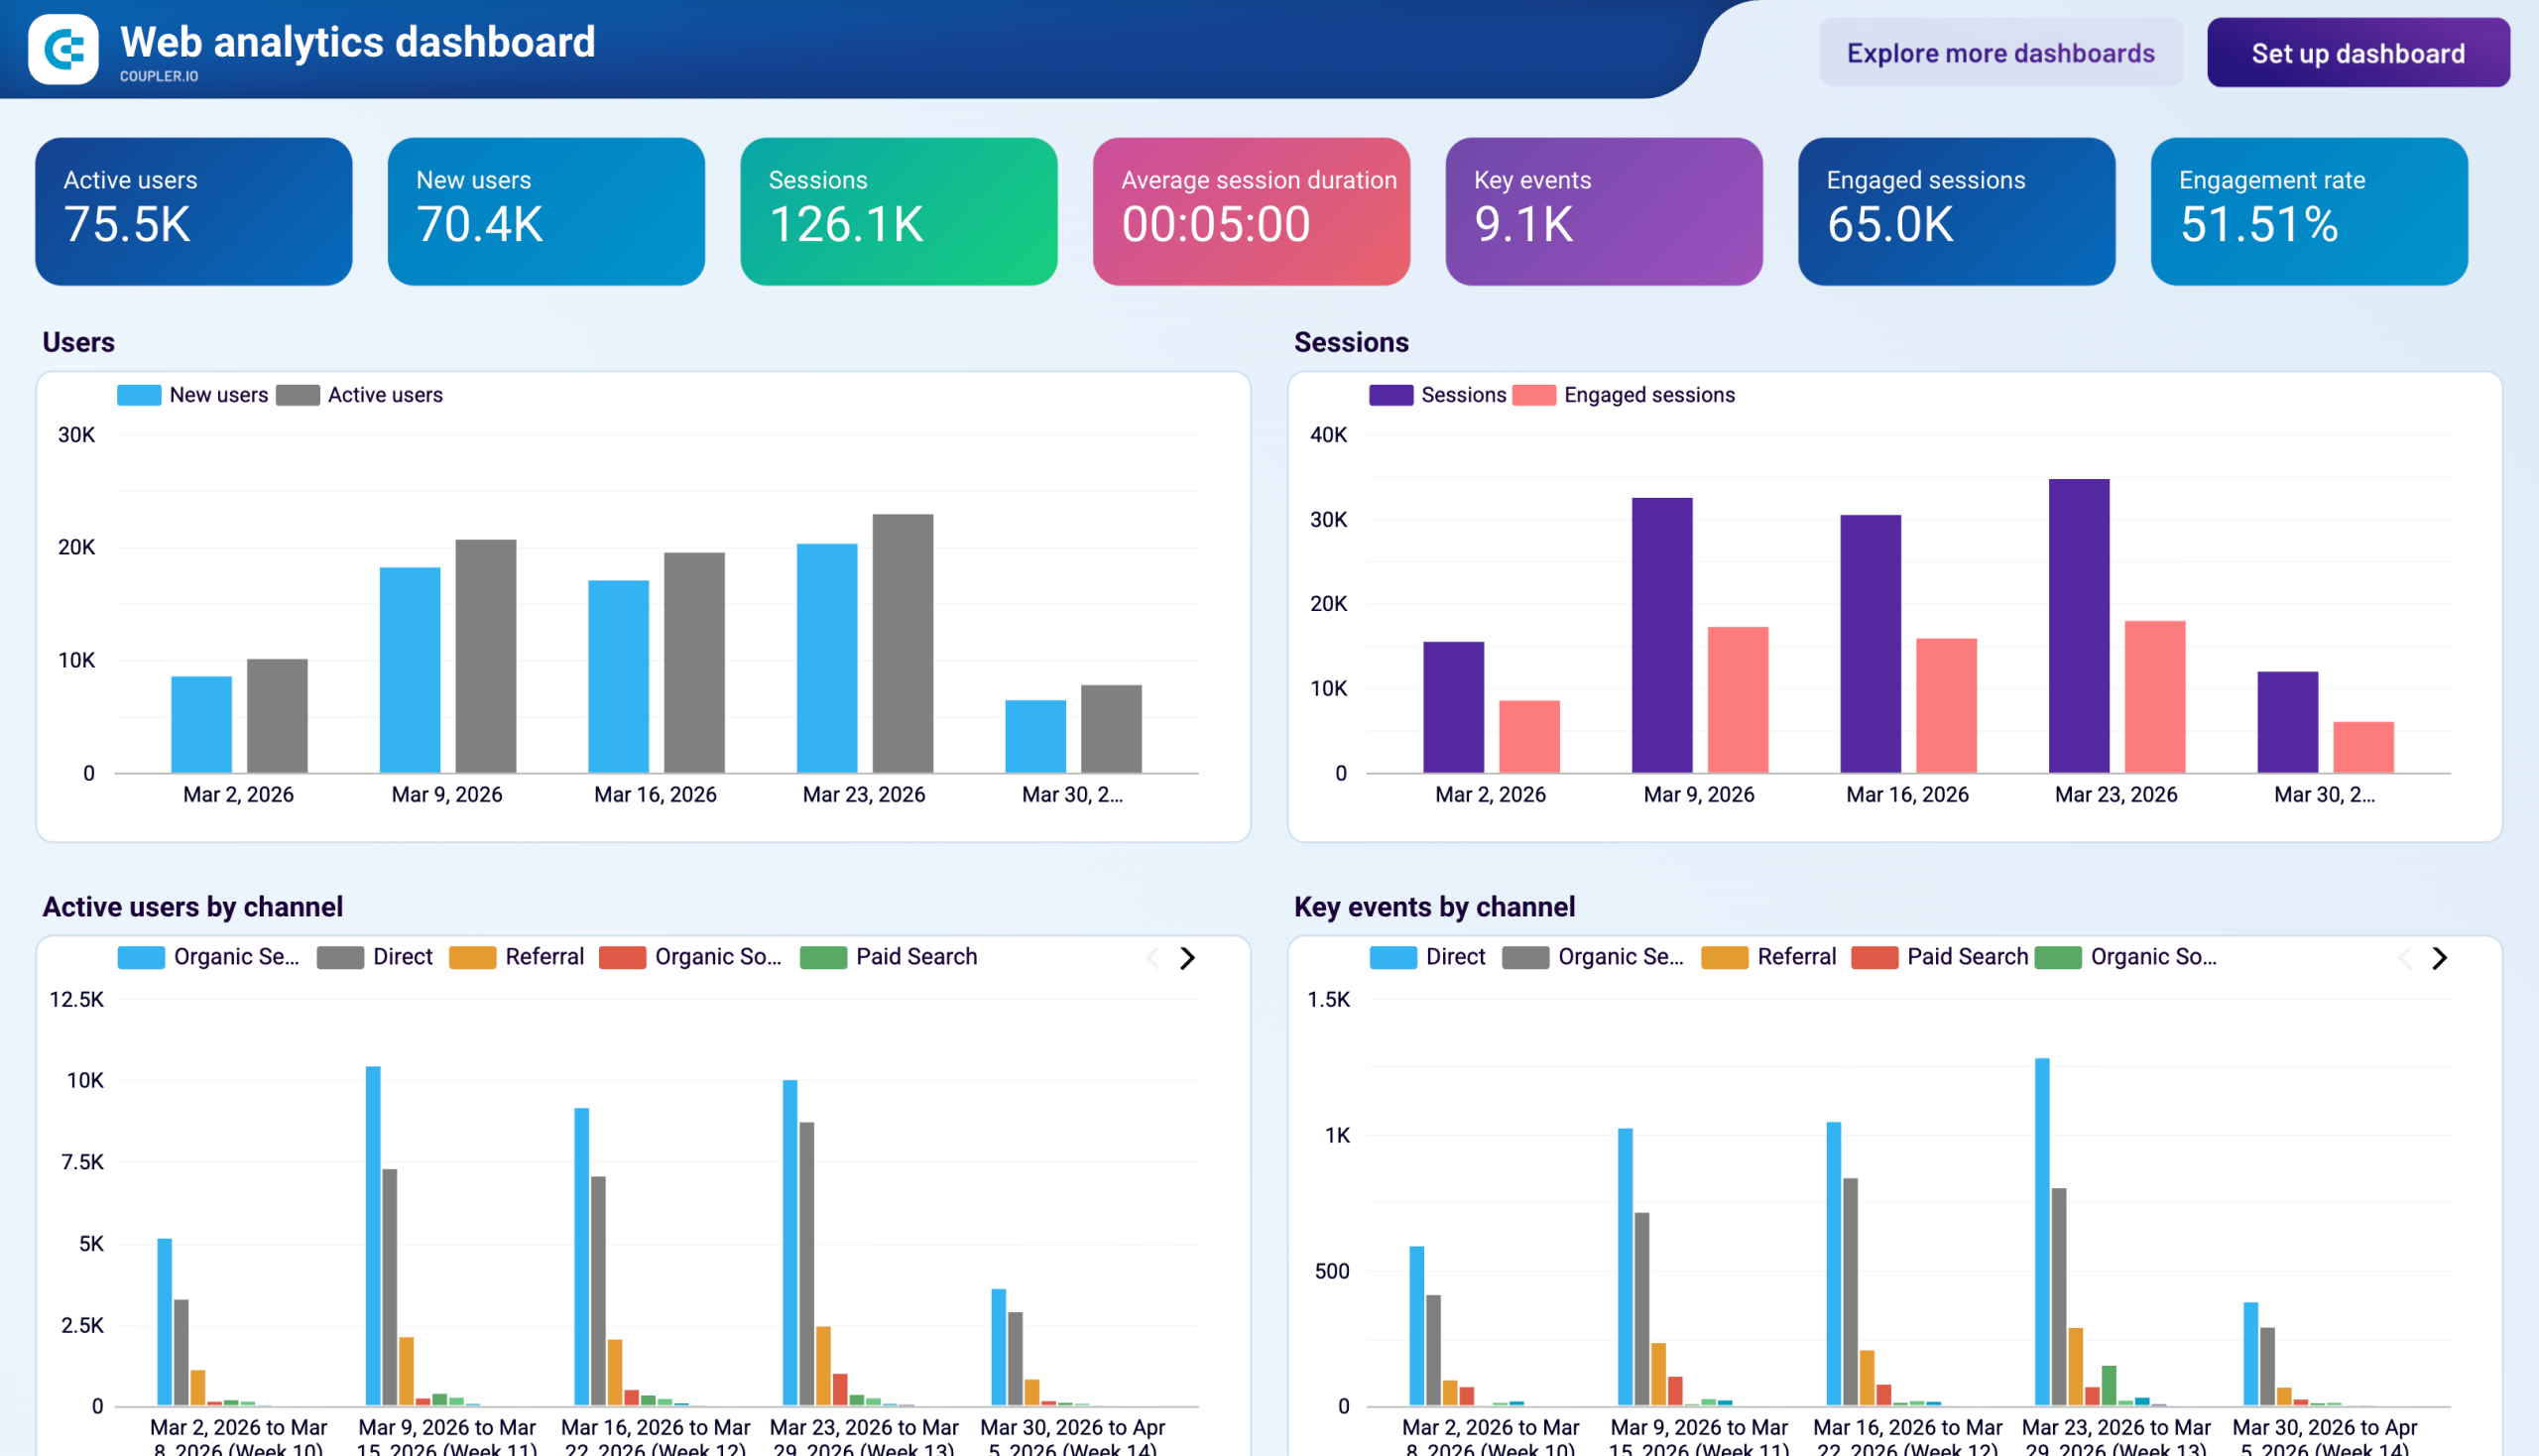
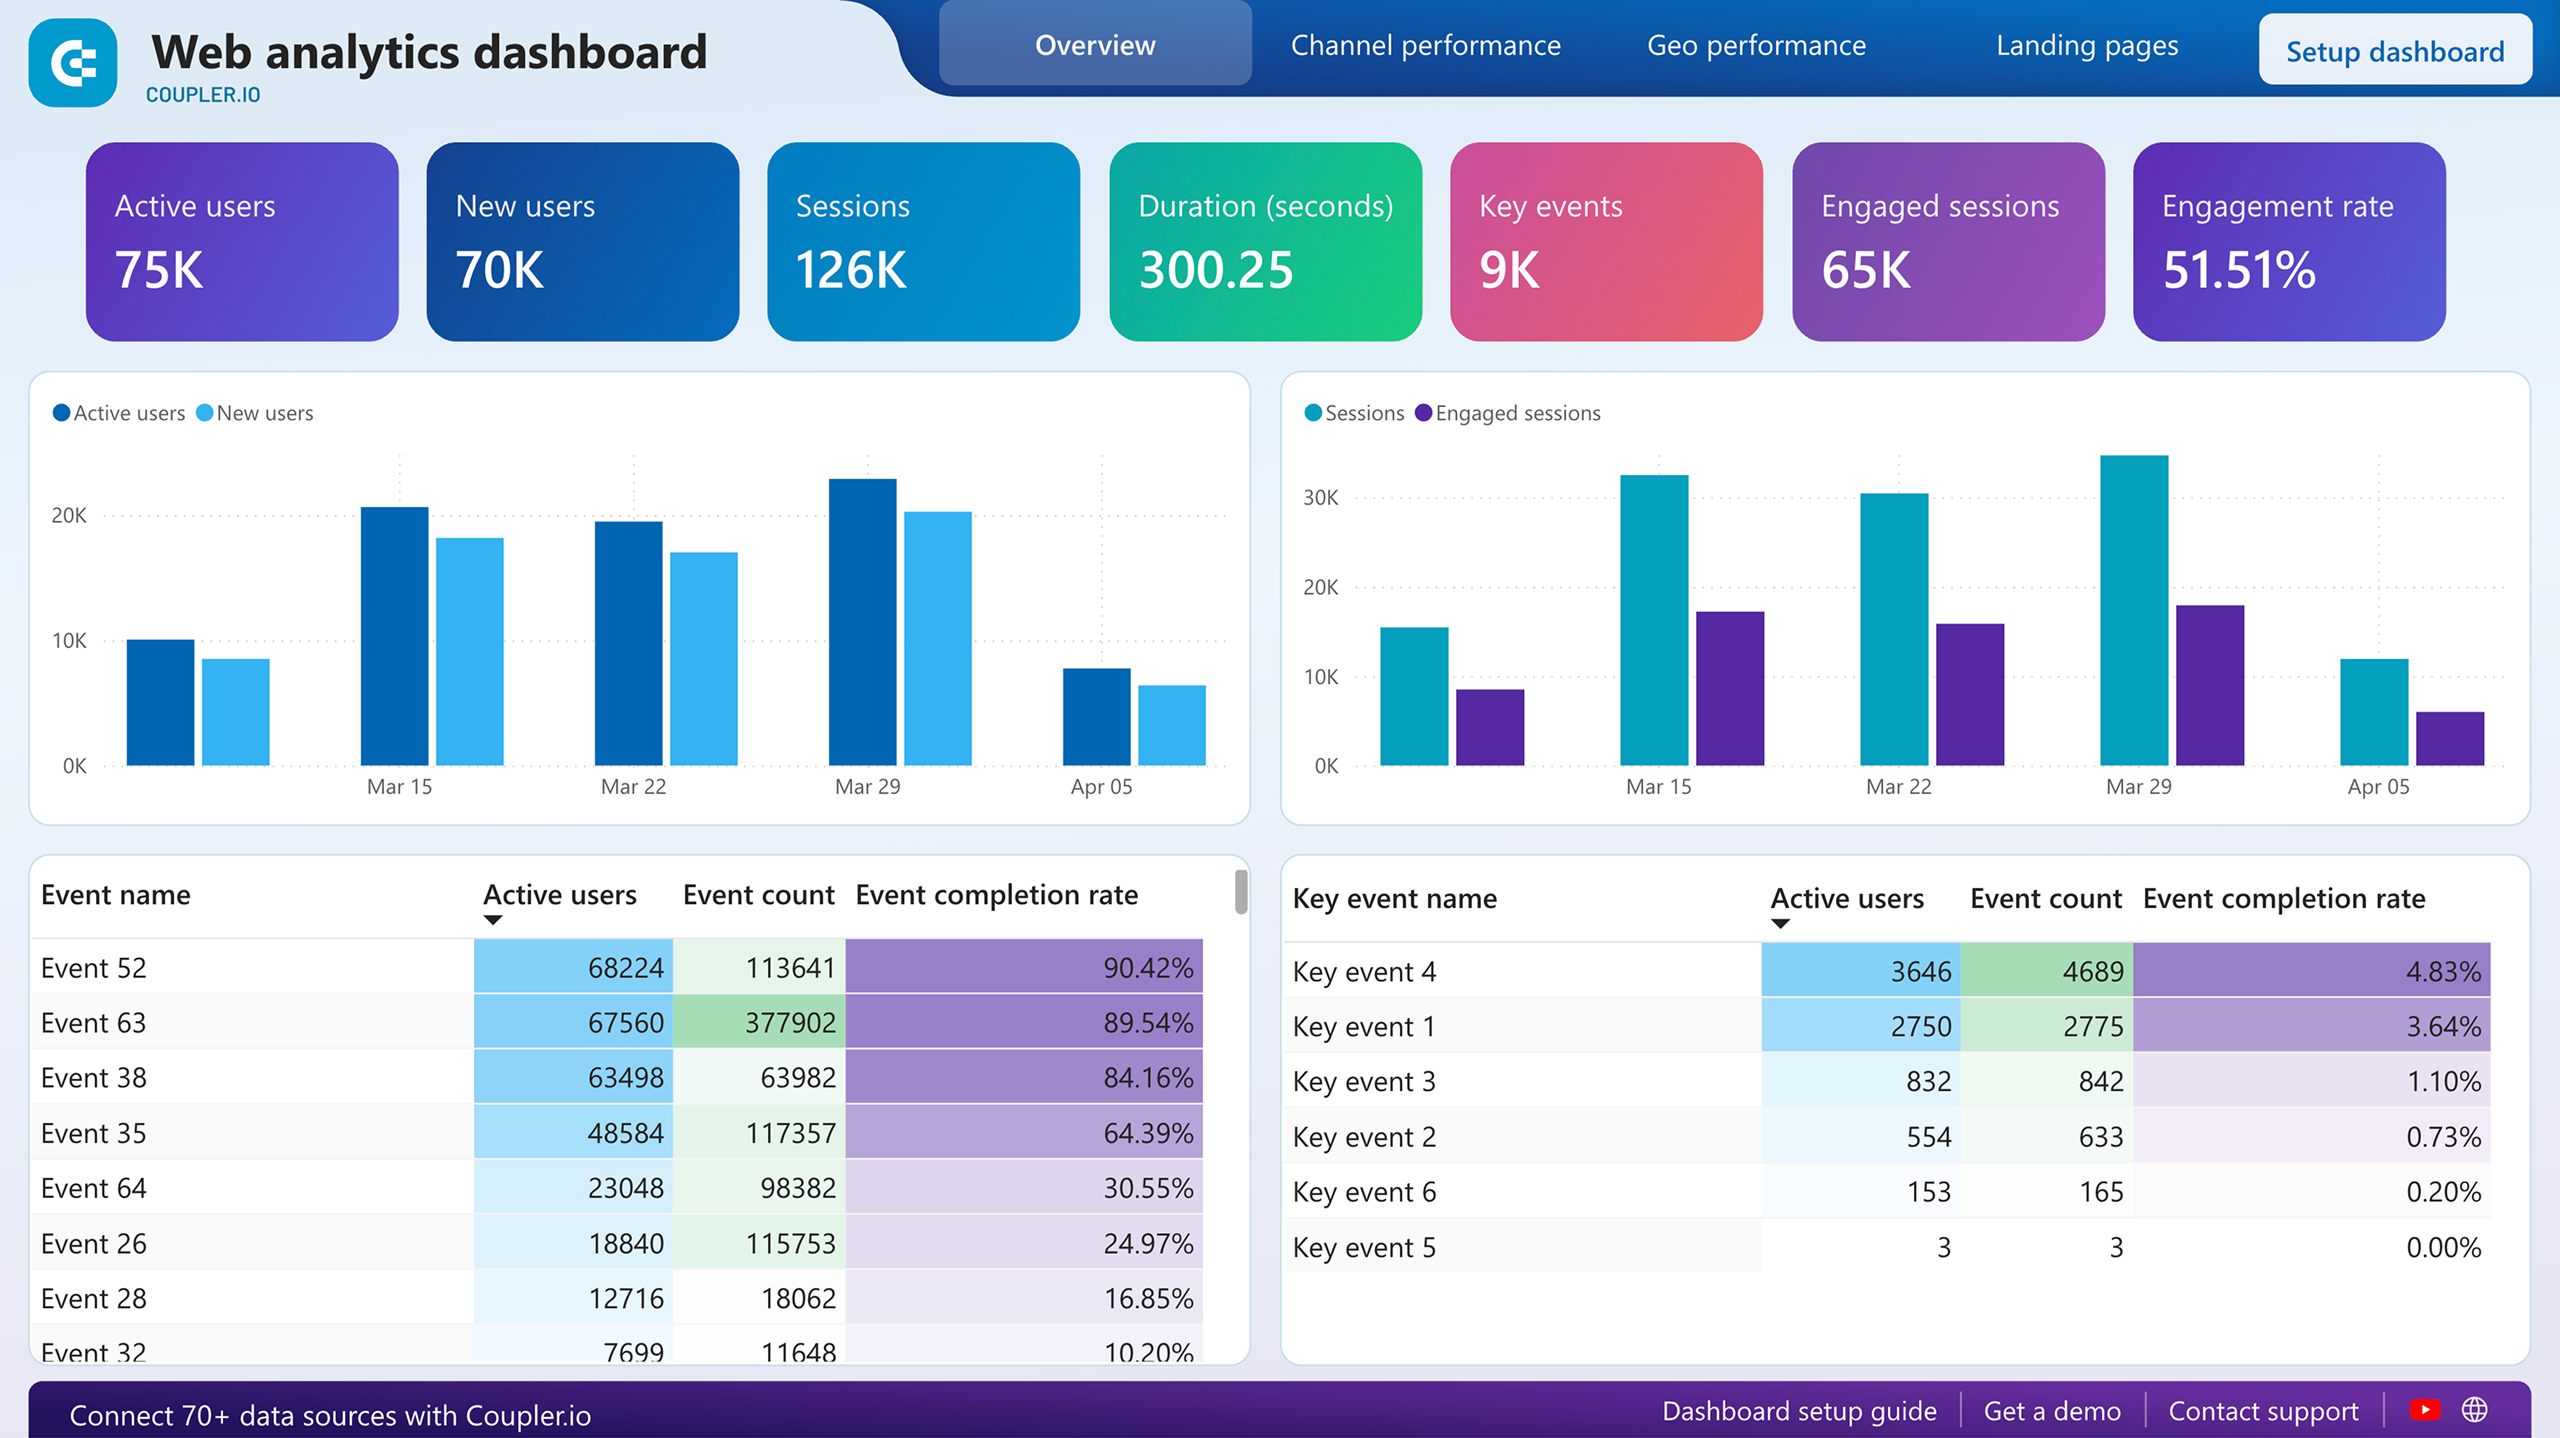
22. Web analytics dashboard (+ template)
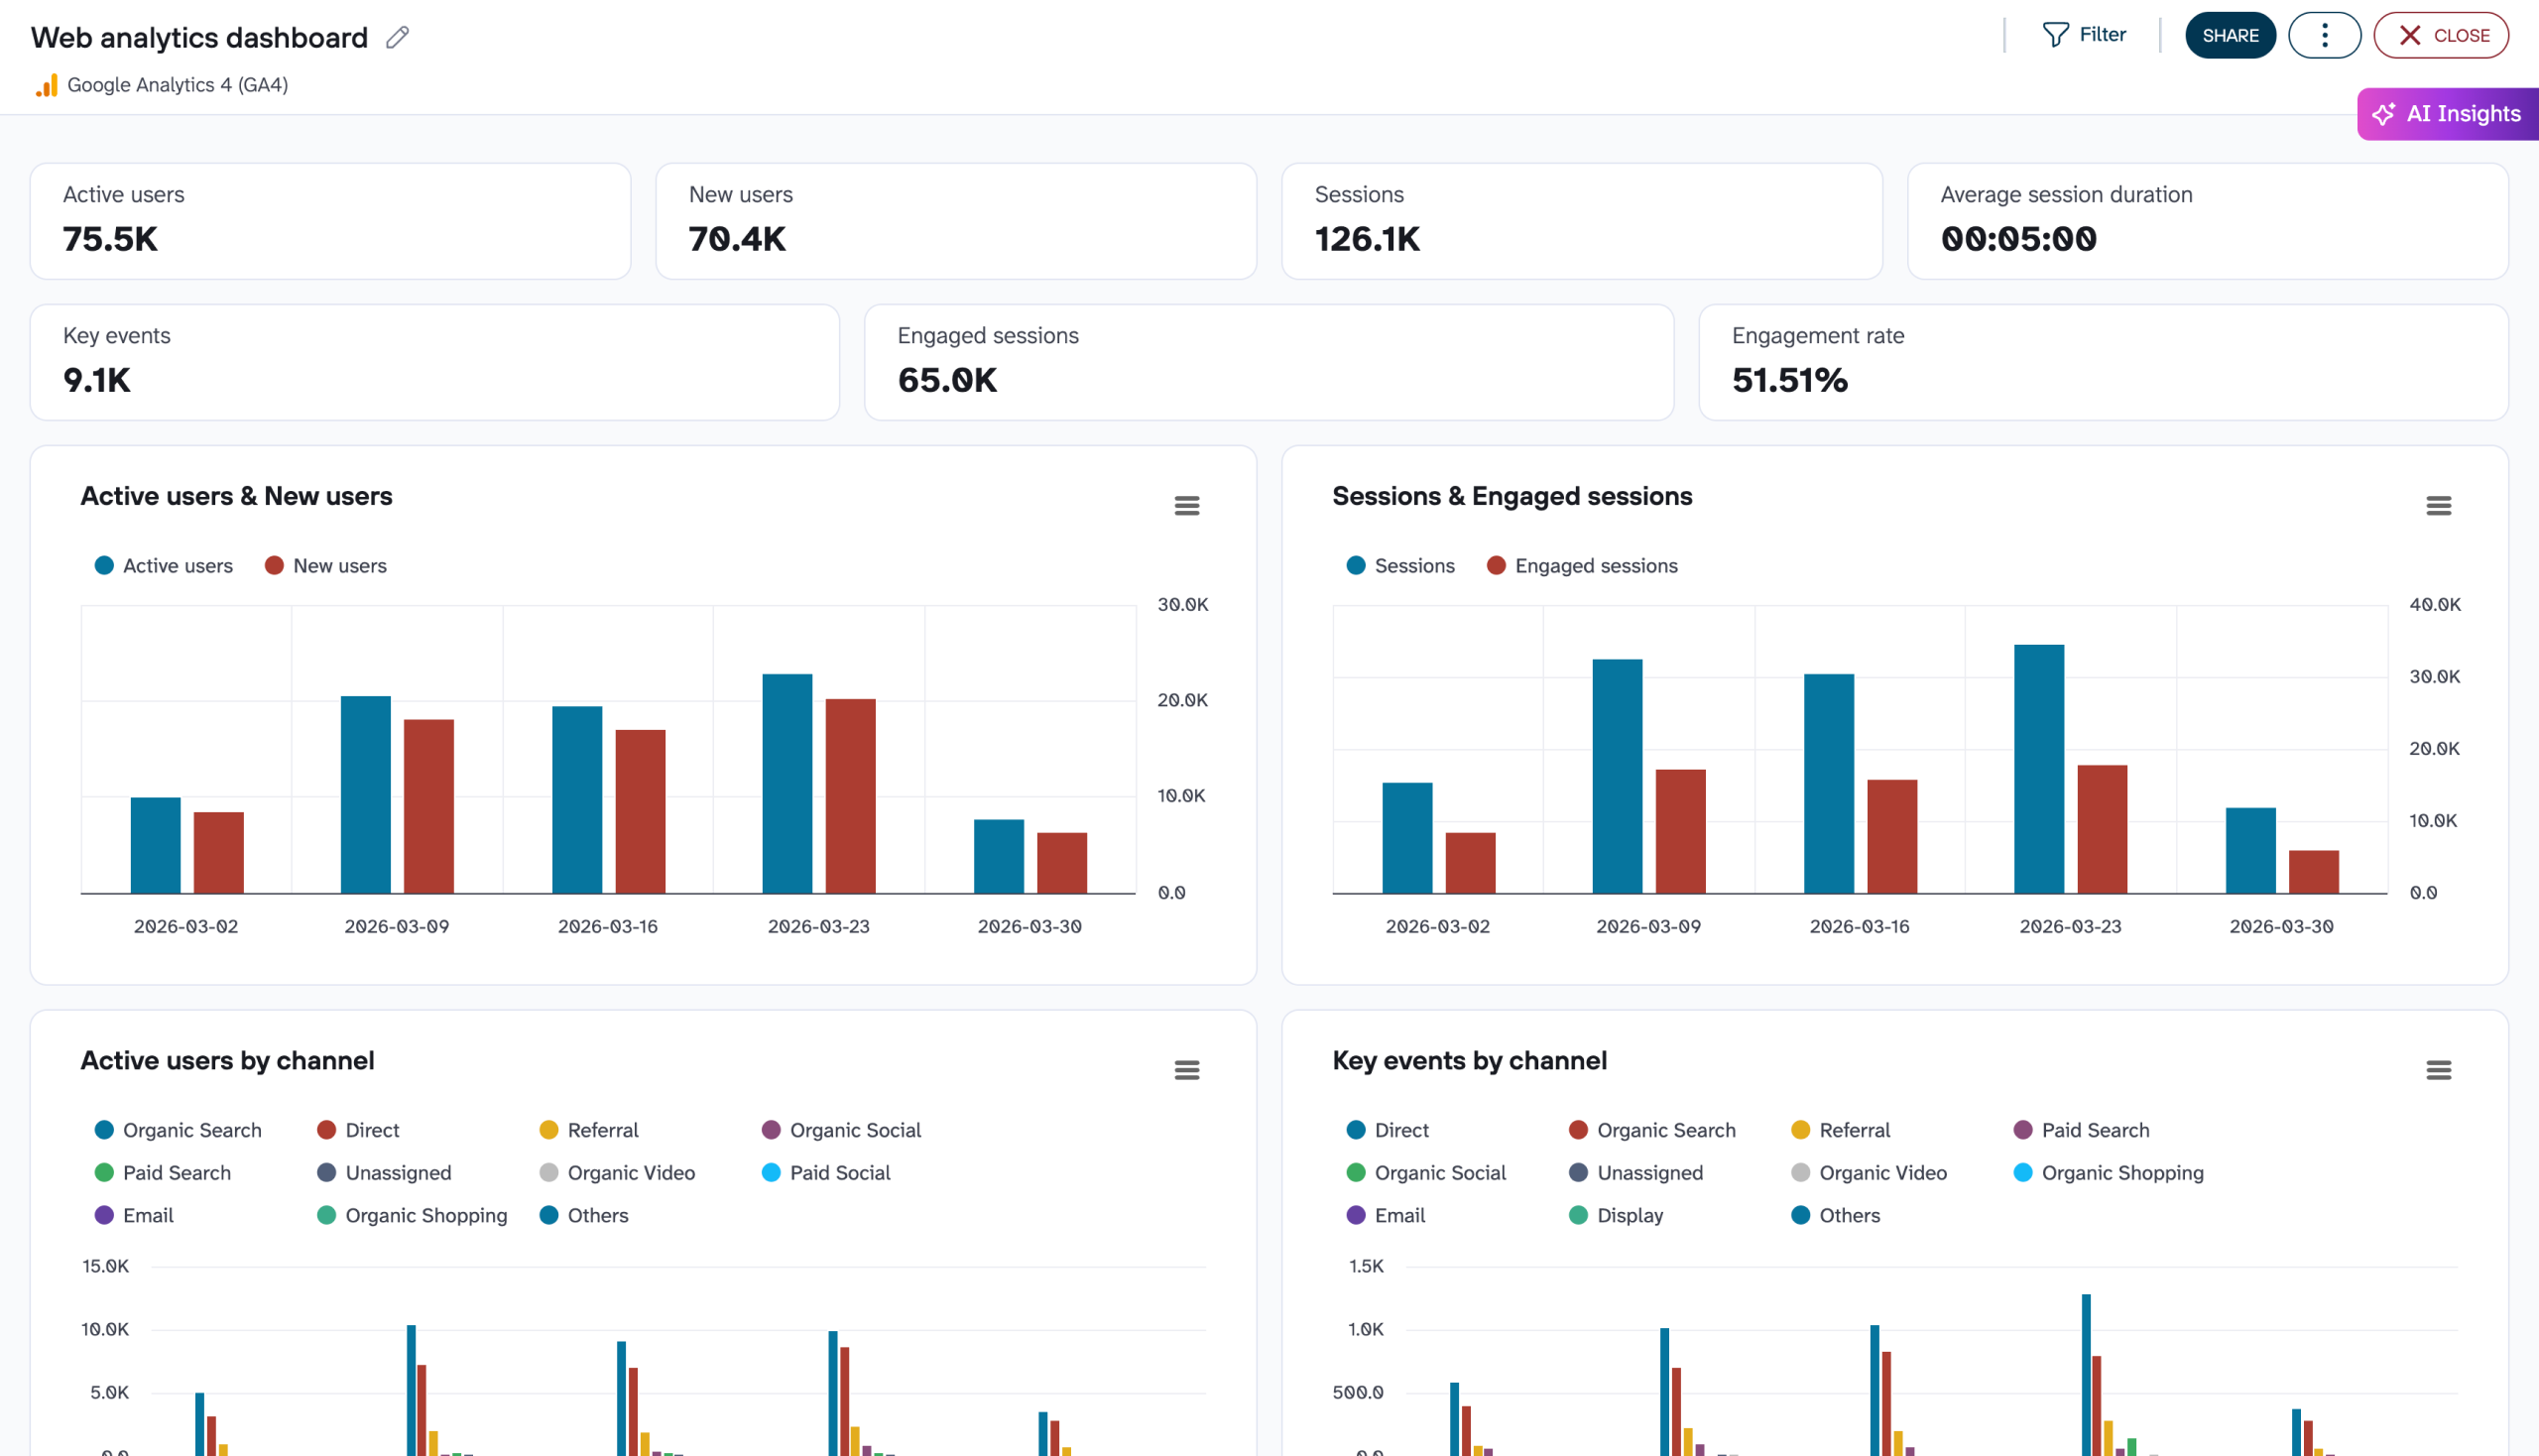
A web analytics dashboard lets you see how people find your website and what they do when they get there. The metrics that are typically included in a web analytics dashboard are traffic sources, most visited pages, page views, and bounce rates. By tracking these metrics, you can better understand how people interact with your website and make changes to improve it.
The dashboard template is available in Coupler.io, Google Sheets, Data Studio, Tableau, and Power BI. Pick the version that meets your reporting needs and try it out.

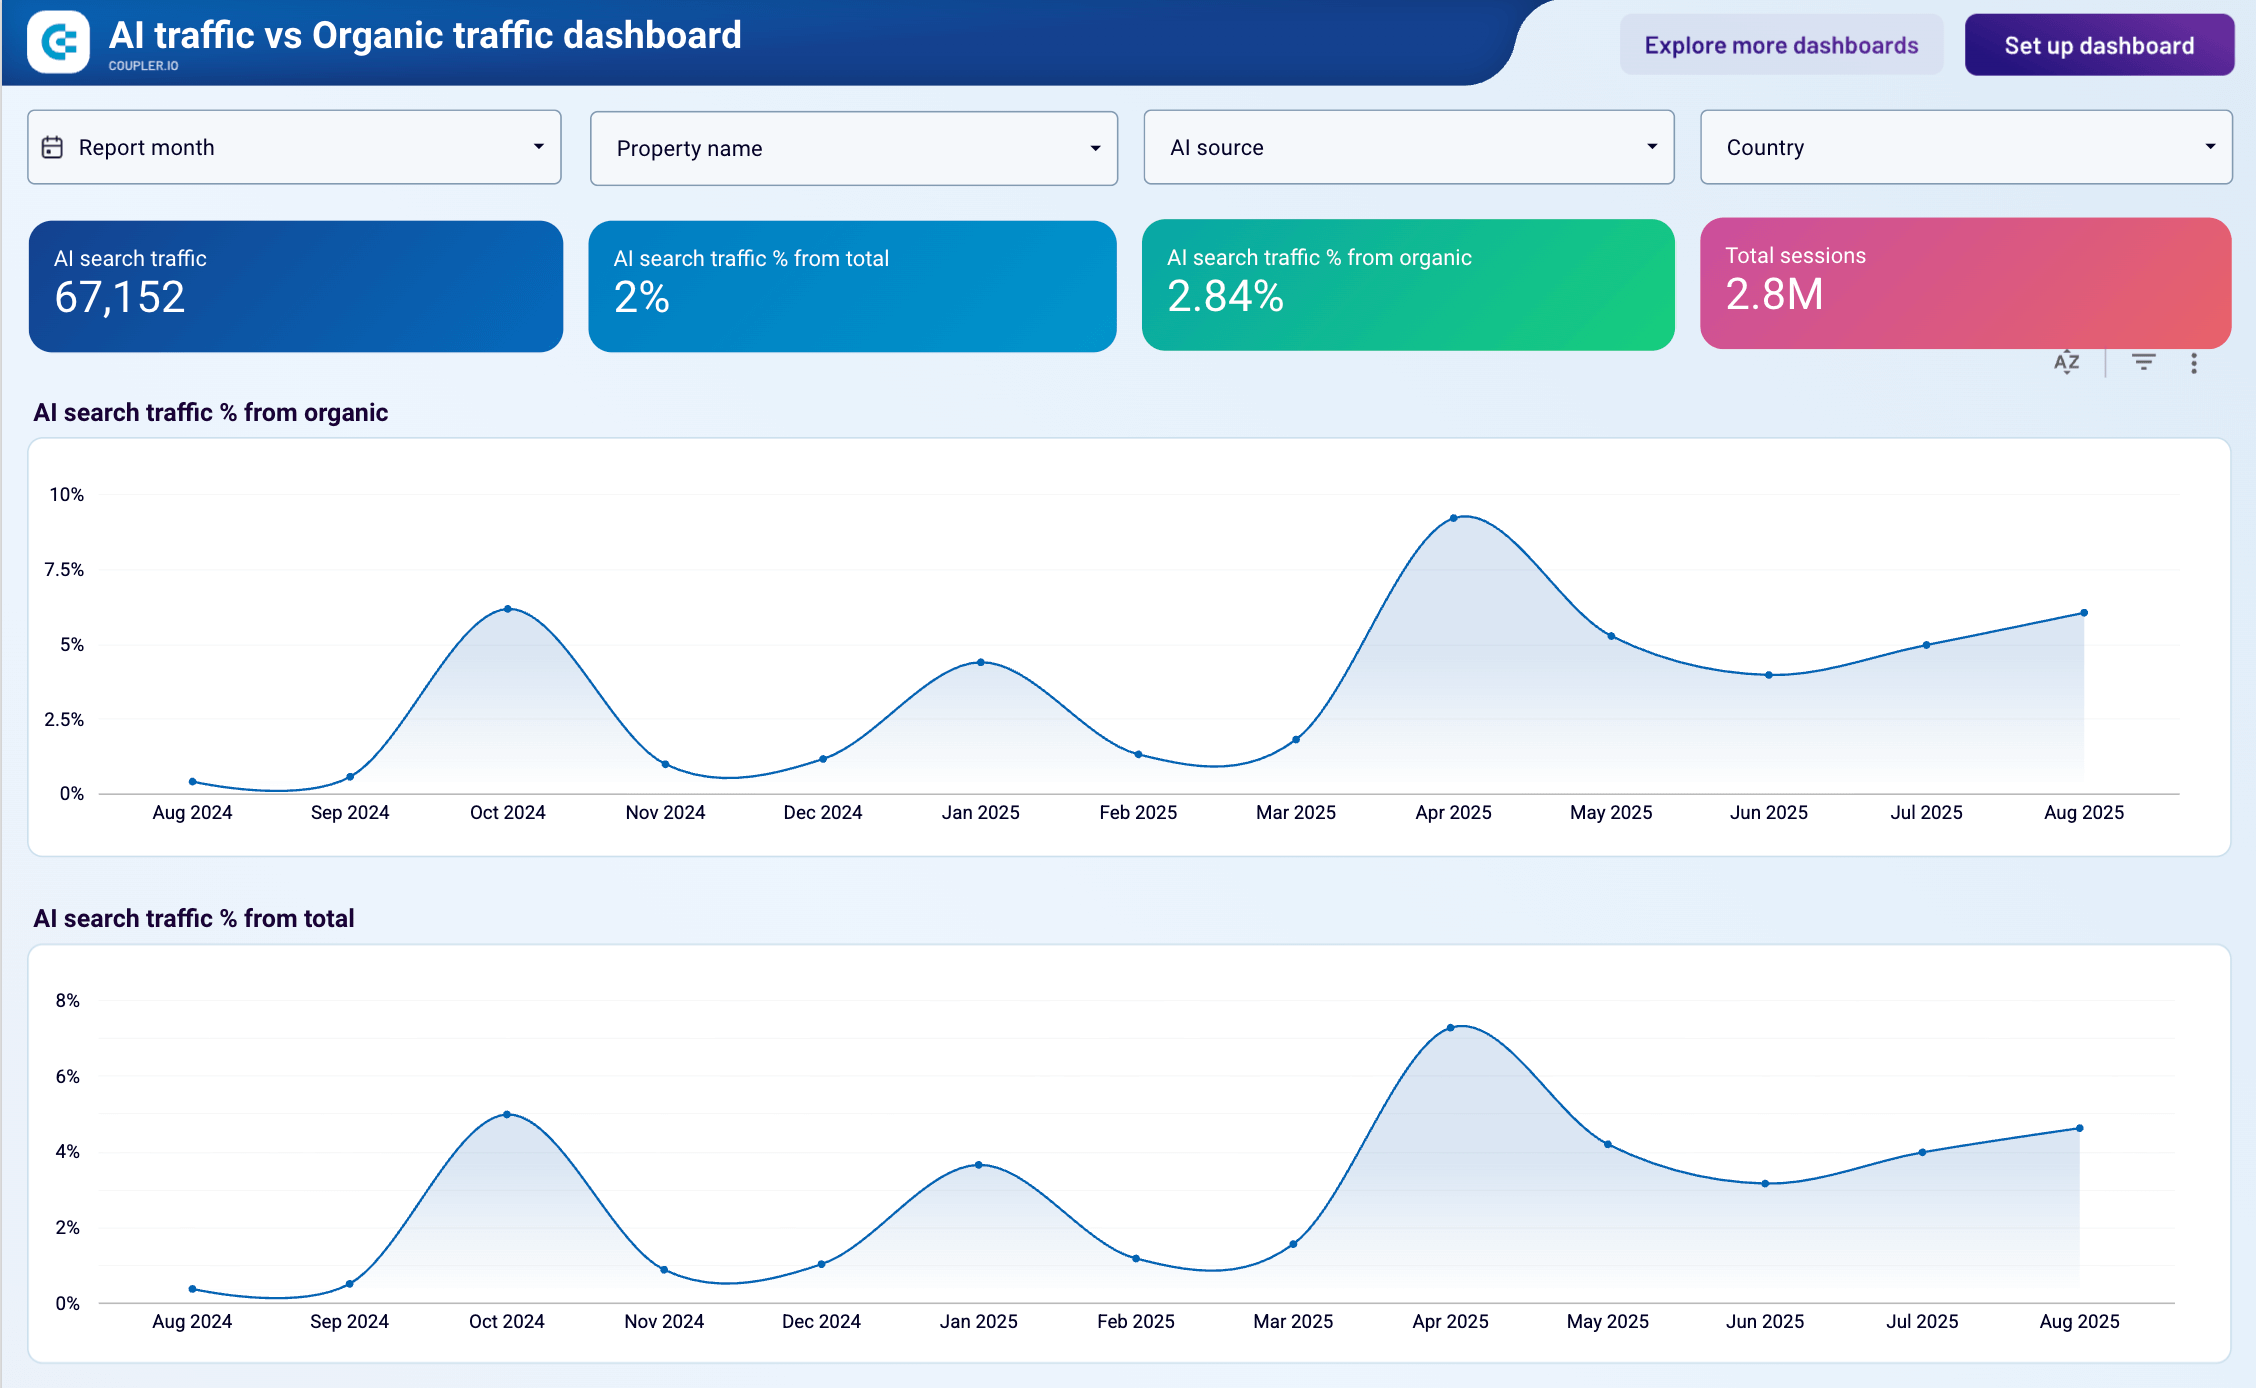
23. AI traffic vs organic traffic dashboard (+ template)
As AI tools like ChatGPT, Claude, and Perplexity increasingly reference websites in their responses, they’re creating a new traffic channel that traditional analytics don’t distinguish from organic search. This dashboard helps you understand how AI-driven referrals compare to search engine traffic in terms of volume, engagement quality, and conversion performance.
AI traffic vs organic traffic dashboard
 Preview dashboard
AI traffic vs organic traffic dashboard
Preview dashboardThe dashboard separates AI tool referrals from traditional organic search traffic using GA4 data. Monthly trend charts show whether AI traffic is growing as a percentage of your total visits. Platform breakdowns reveal which specific AI tools (ChatGPT, Claude, Perplexity, others) send the most visitors and which deliver the highest engagement. The dashboard compares session duration, bounce rates, and key event completion rates between AI-referred visitors and organic search traffic. A dedicated conversion tracking section lets you switch between different events to see how AI traffic converts for various business objectives.
This Google Sheets template is designed by Coupler.io with a built-in GA4 connector. Follow the setup instructions to start tracking this emerging traffic channel.
24. Technical SEO dashboard (+ template)
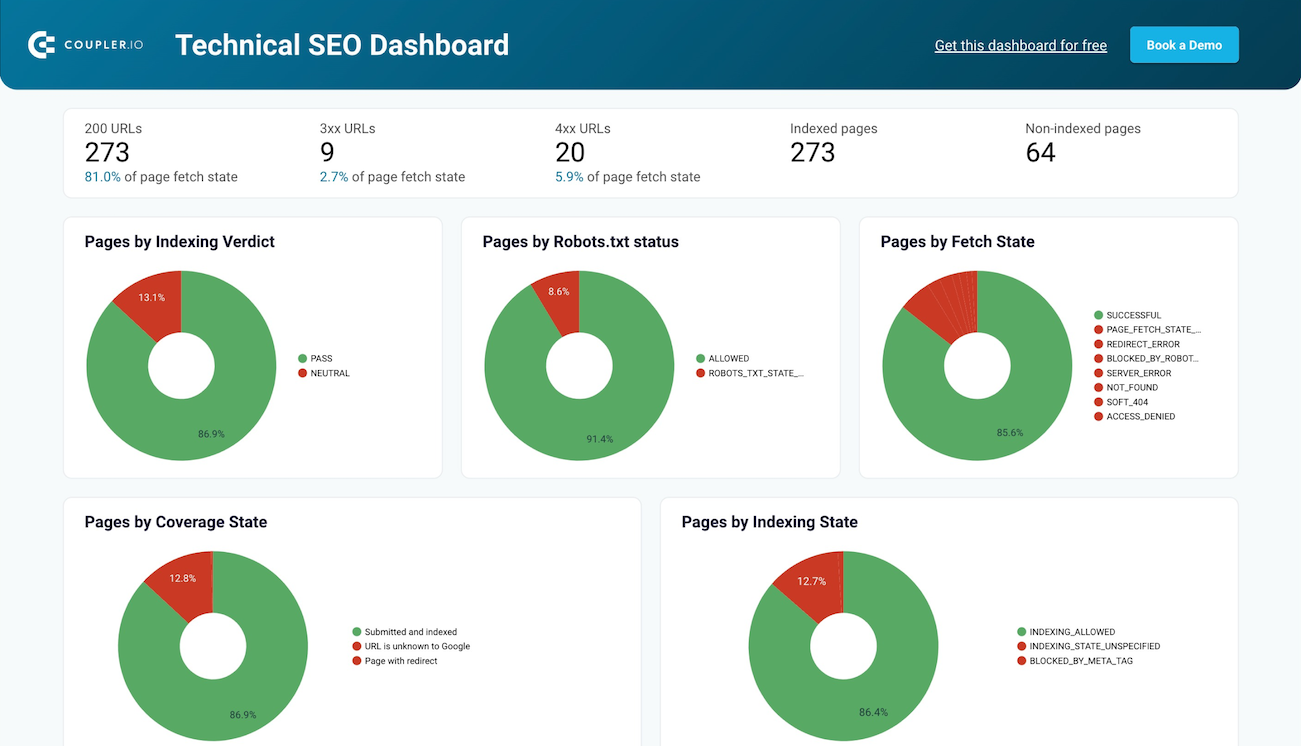
This dashboard pulls data from Google Search Console and allows you to quickly check your website’s tech health. Once you see a red wedge on the pie chart, it’s a sign there’s an issue that needs your attention. You can use this dashboard to identify pages blocked by Robots.txt and robot tags, monitor page rendering status, see the list of submitted and un-indexed pages, check the AMP status, and more.
The dashboard template is designed for Looker Studio and Google Sheets. Pick the version you like and try it right away!
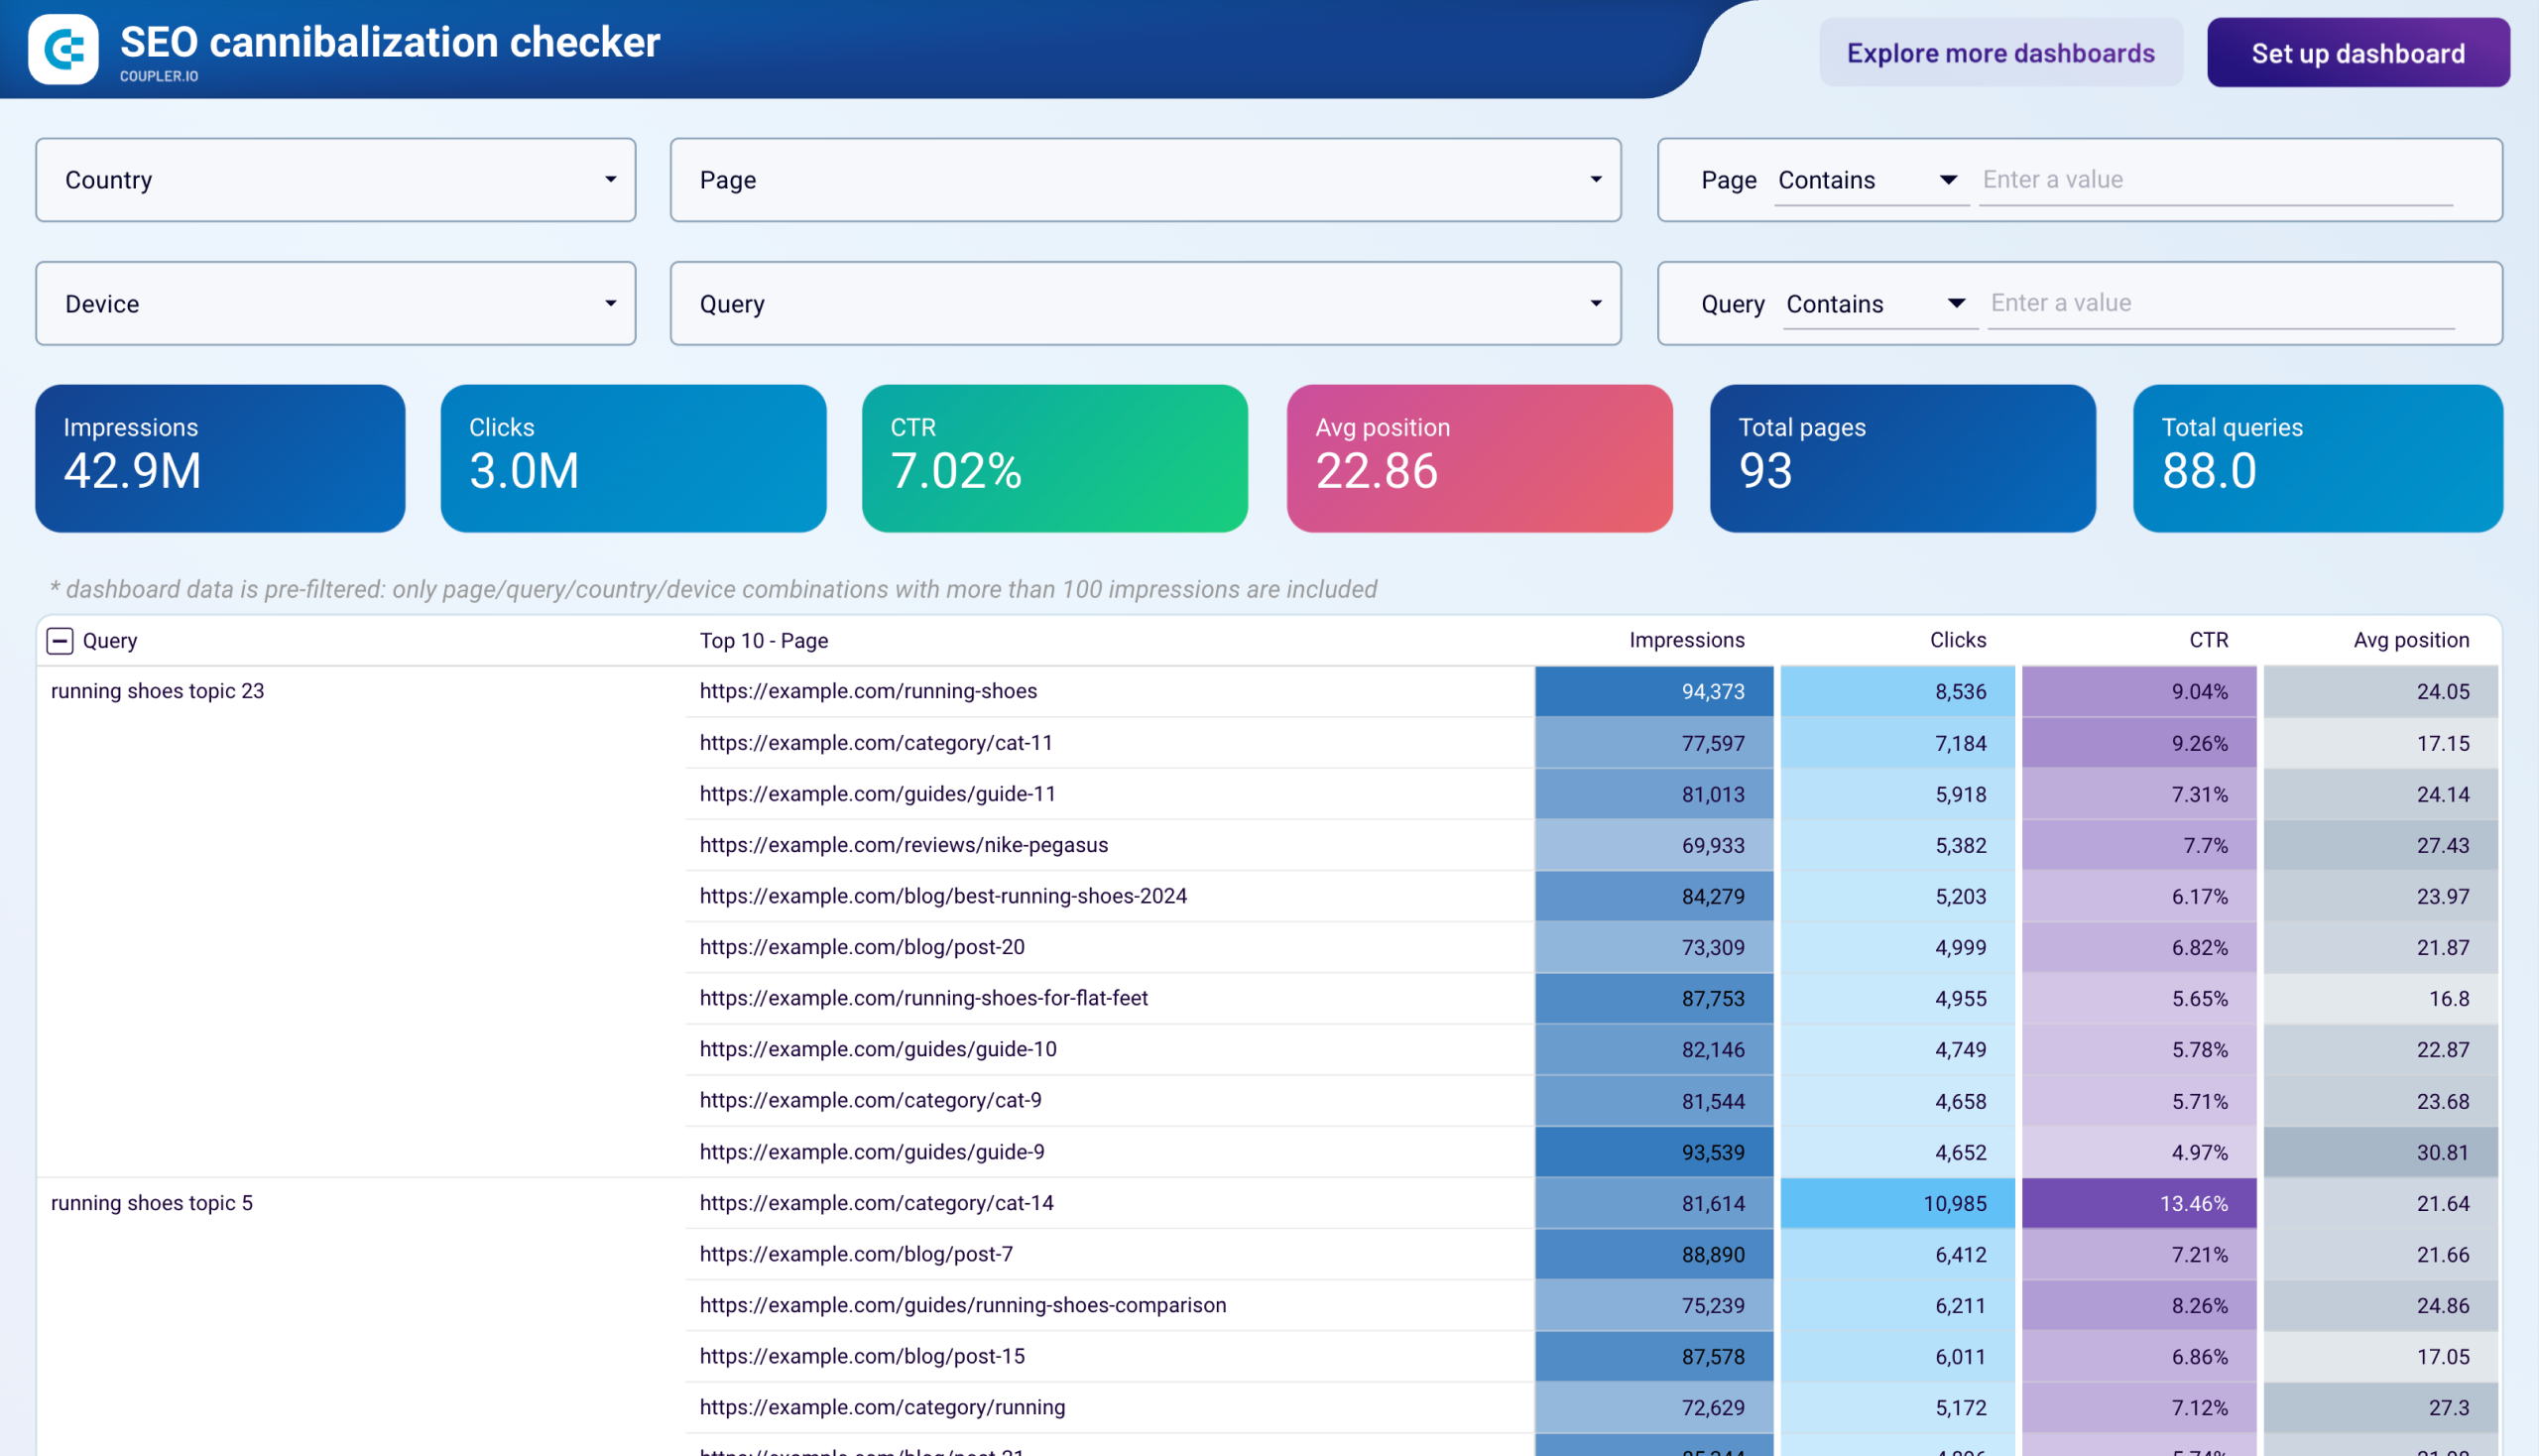
25. SEO cannibalization checker dashboard (+template)
A common problem that goes unnoticed during routine SEO reporting: several pages on your site are ranking for the same keyword, and none of them rank well. Instead of one page building authority, Google cycles through competing URLs, spreading impressions thin and keeping all of them buried. The SEO cannibalization checker dashboard by Coupler.io pulls Google Search Console data and groups your URLs under each query they share.
SEO cannibalization checker dashboard
 Preview dashboard
SEO cannibalization checker dashboard
Preview dashboardFor every query group, you see impressions, clicks, CTR, and average position per URL side by side. That comparison reveals which page actually earns clicks versus which one Google shows most often. Dropdown filters for country and device let you narrow the view, while “Page Contains” and “Query Contains” fields help you audit one site section at a time (e.g., /blog/ vs. /products/). KPI cards at the top show total pages and total queries in the filtered dataset, so you can gauge whether cannibalization is an isolated issue or a site-wide pattern before digging into individual query groups.
The template is free and connects through a built-in Coupler.io connector. You’ll have a working dashboard with your own Search Console data in a few minutes.
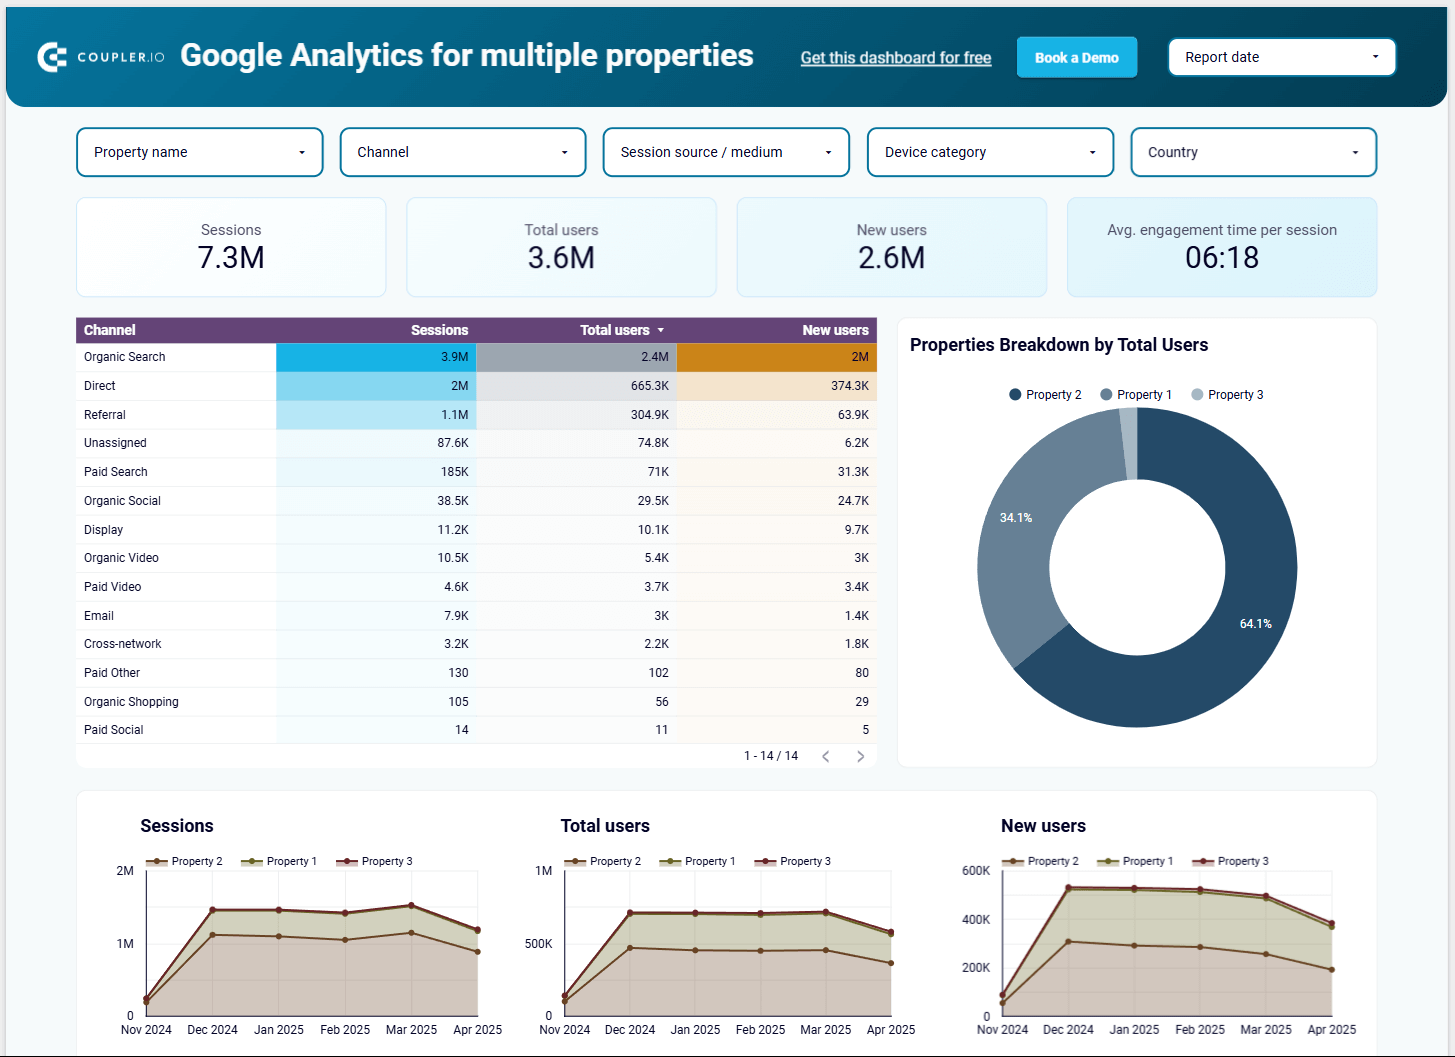
26. GA4 dashboard for multiple properties (+ template)
GA4 dashboard for multiple properties
 Preview dashboard
GA4 dashboard for multiple properties
Preview dashboardIf you have multiple properties connected to Google Analytics 4, this dashboard template will be very useful to you. In your GA4 account, you can only see data for one property at a time. But this dashboard lets you gather information about all your websites on one page. It’s very convenient when you want to compare results for different websites and analyze engagement, track channel performance across all your websites, or estimate total awareness and traffic. The template is designed in Looker Studio and you can use it for free.
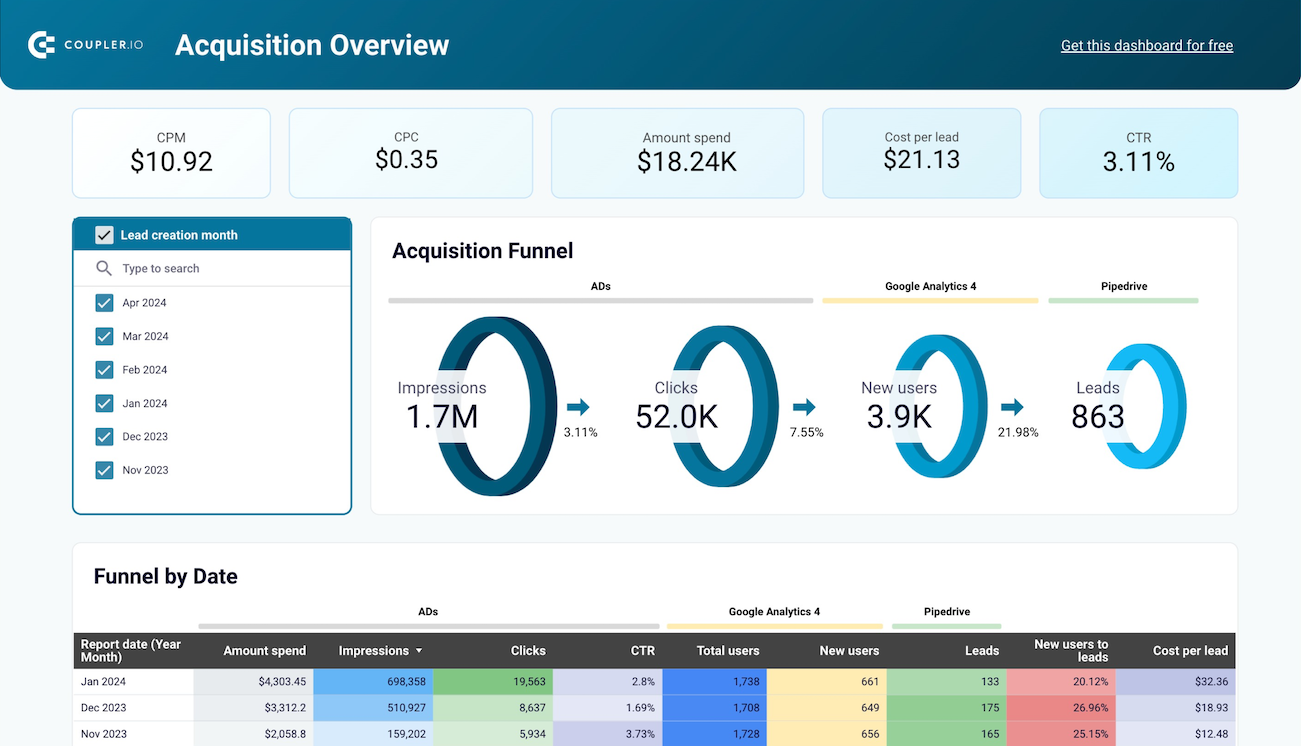
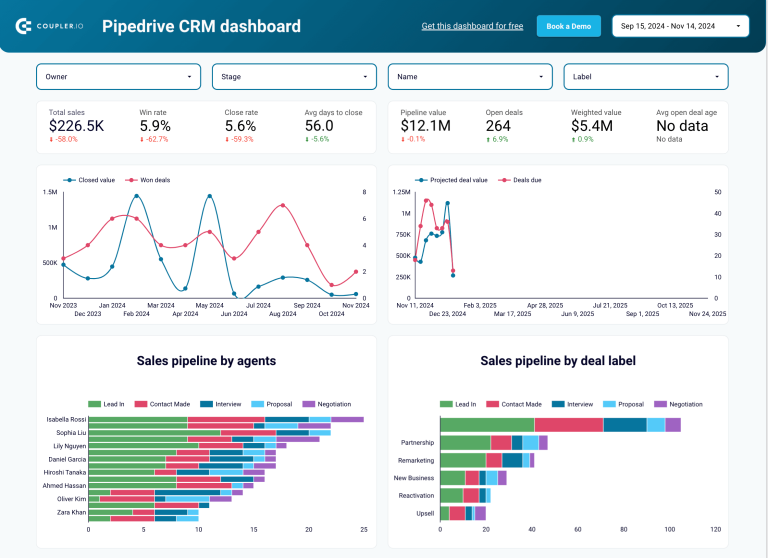
27. Customer acquisition dashboard for Pipedrive (+ template)
Customer acquisition dashboard for Pipedrive
 Preview dashboard
Customer acquisition dashboard for Pipedrive
Preview dashboardThis customer acquisition dashboard for Pipedrive provides insights into the performance of your paid ads and organic traffic. You get information about impressions, clicks, new users, and expenses you incur to generate Pipedrive leads. In addition to Pipedrive, the dashboard collects data from GA4 and the advertising platforms you use. So, if you run ad campaigns on Facebook or LinkedIn, you’ll be able to see how many clicks they’ve brought and what is the amount spent on them.
The dashboard template is built in Looker Studio, and you can start using it right away.
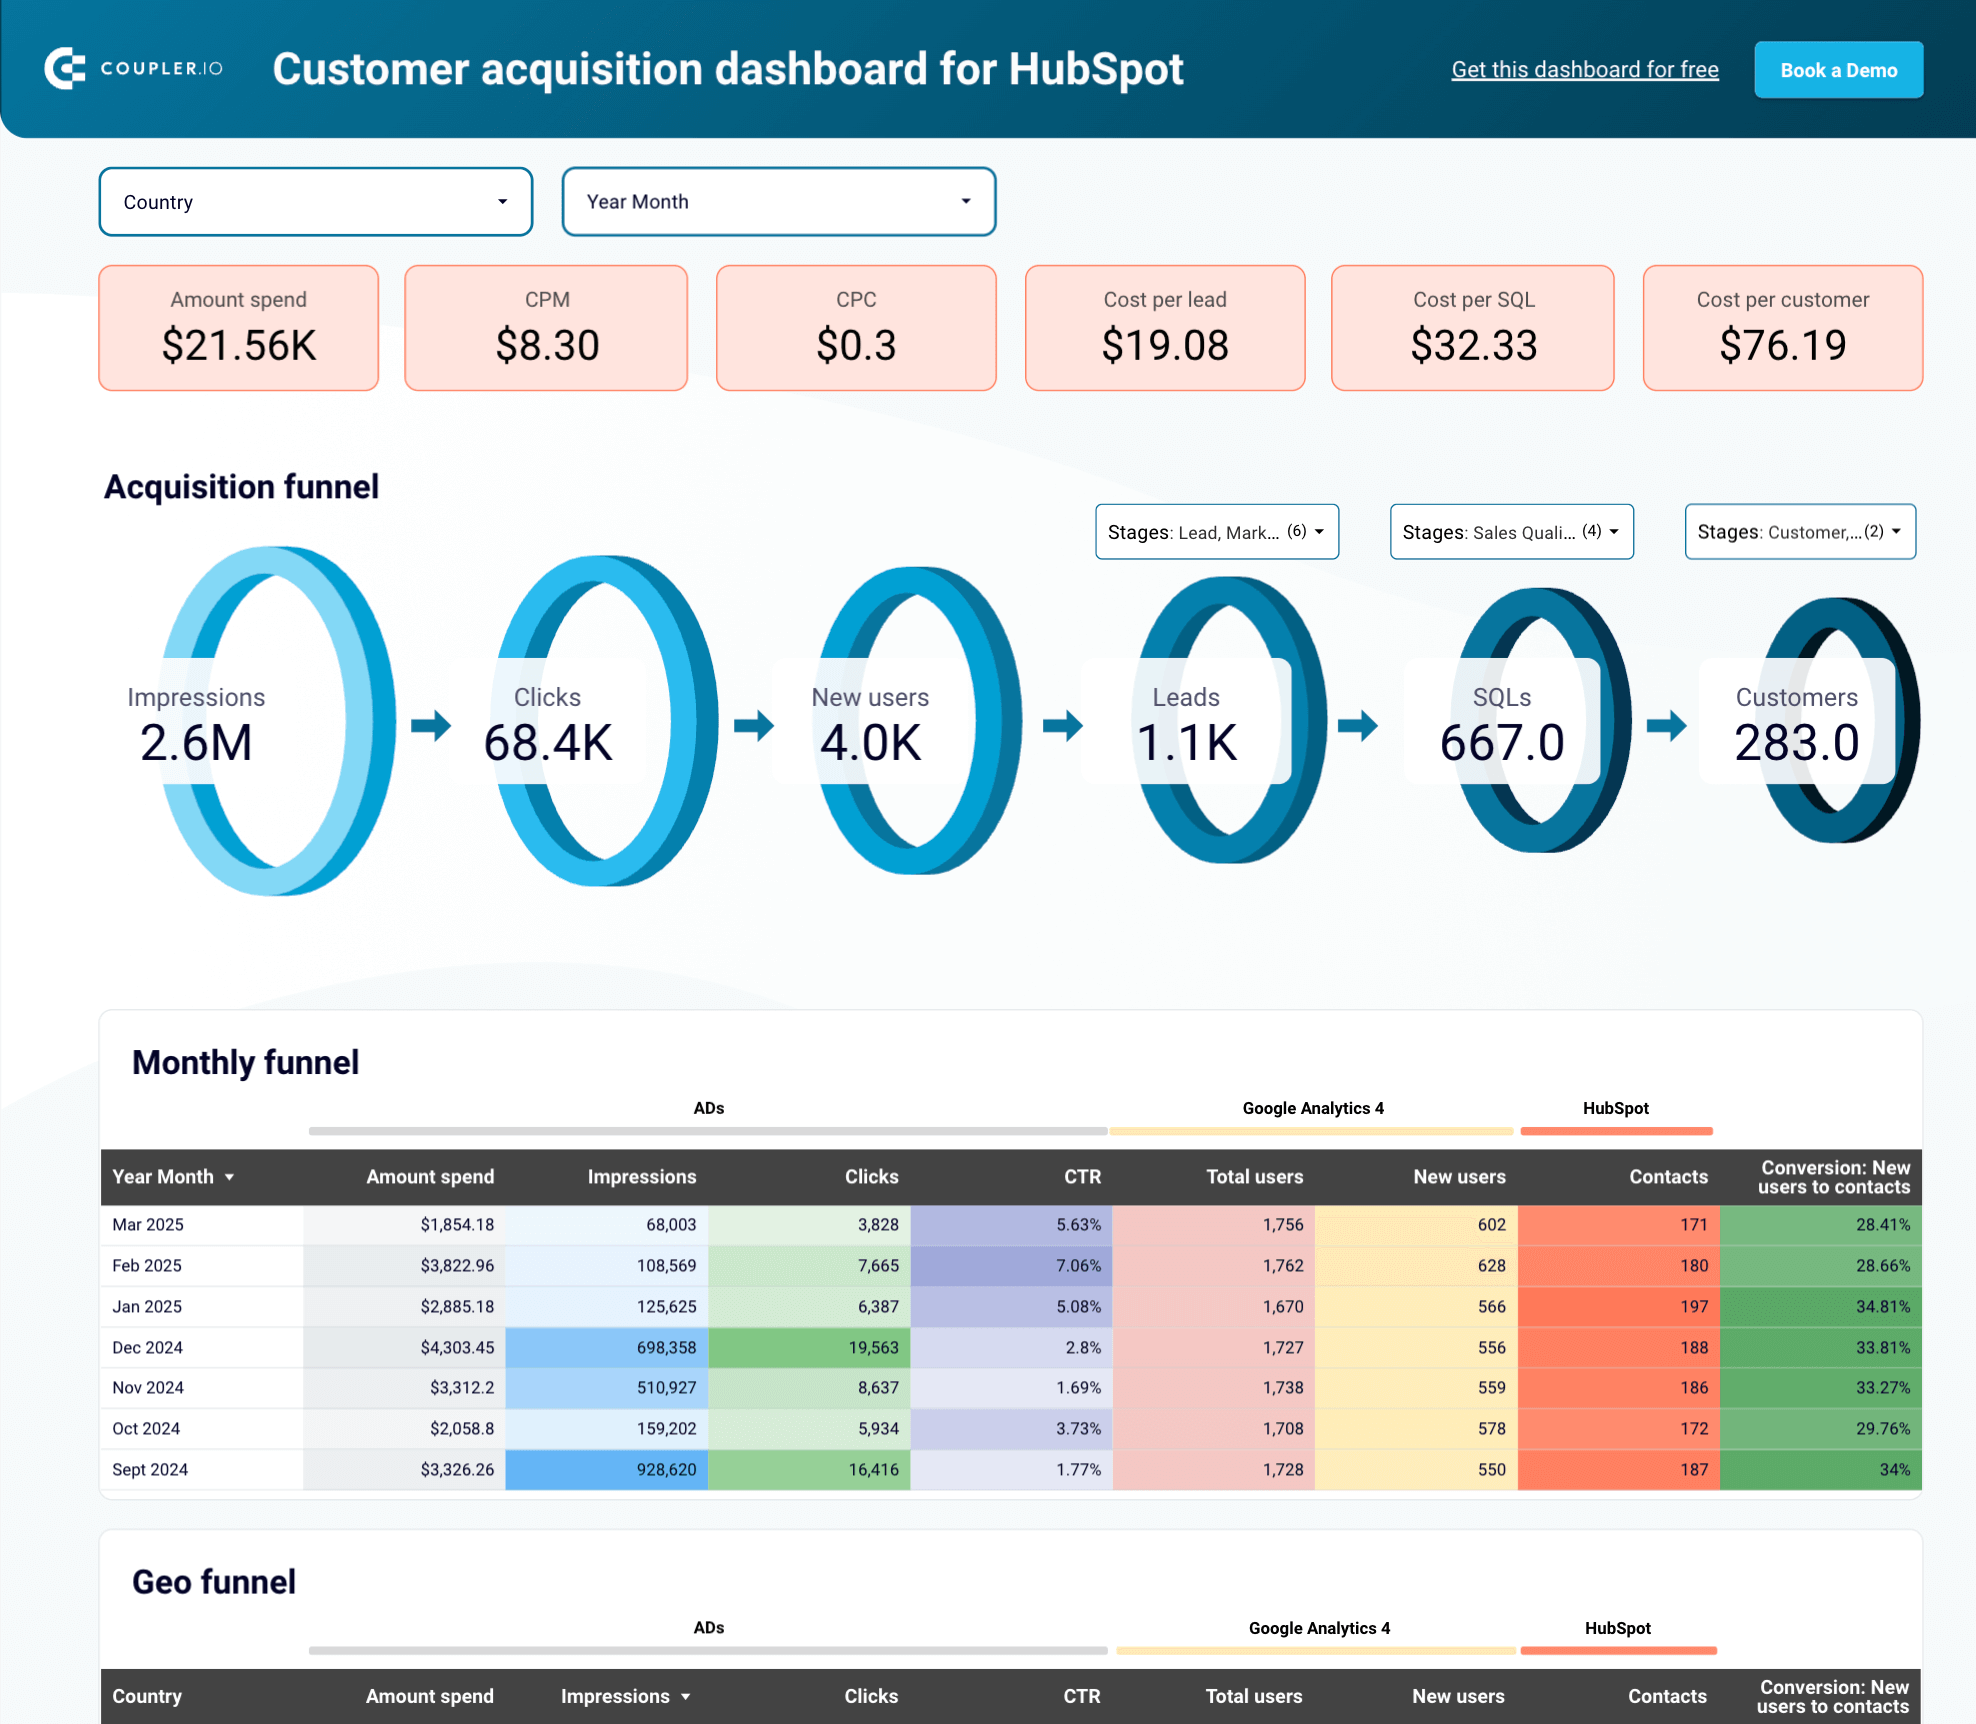
28. Customer acquisition dashboard for HubSpot (+ template)
Customer acquisition dashboard for HubSpot
 Preview dashboard
Customer acquisition dashboard for HubSpot
Preview dashboardThis dashboard template automatically collects data from various PPC sources, Google Analytics 4, and HubSpot. The obtained data is then used to build an acquisition funnel. It allows you to monitor how users go through different stages and identify areas for improvement. The dashboard shows how impressions convert into clicks, new users, leads, and, eventually, customers. It also includes a set of key performance indicators, such as CPM, CPC, and cost per customer.
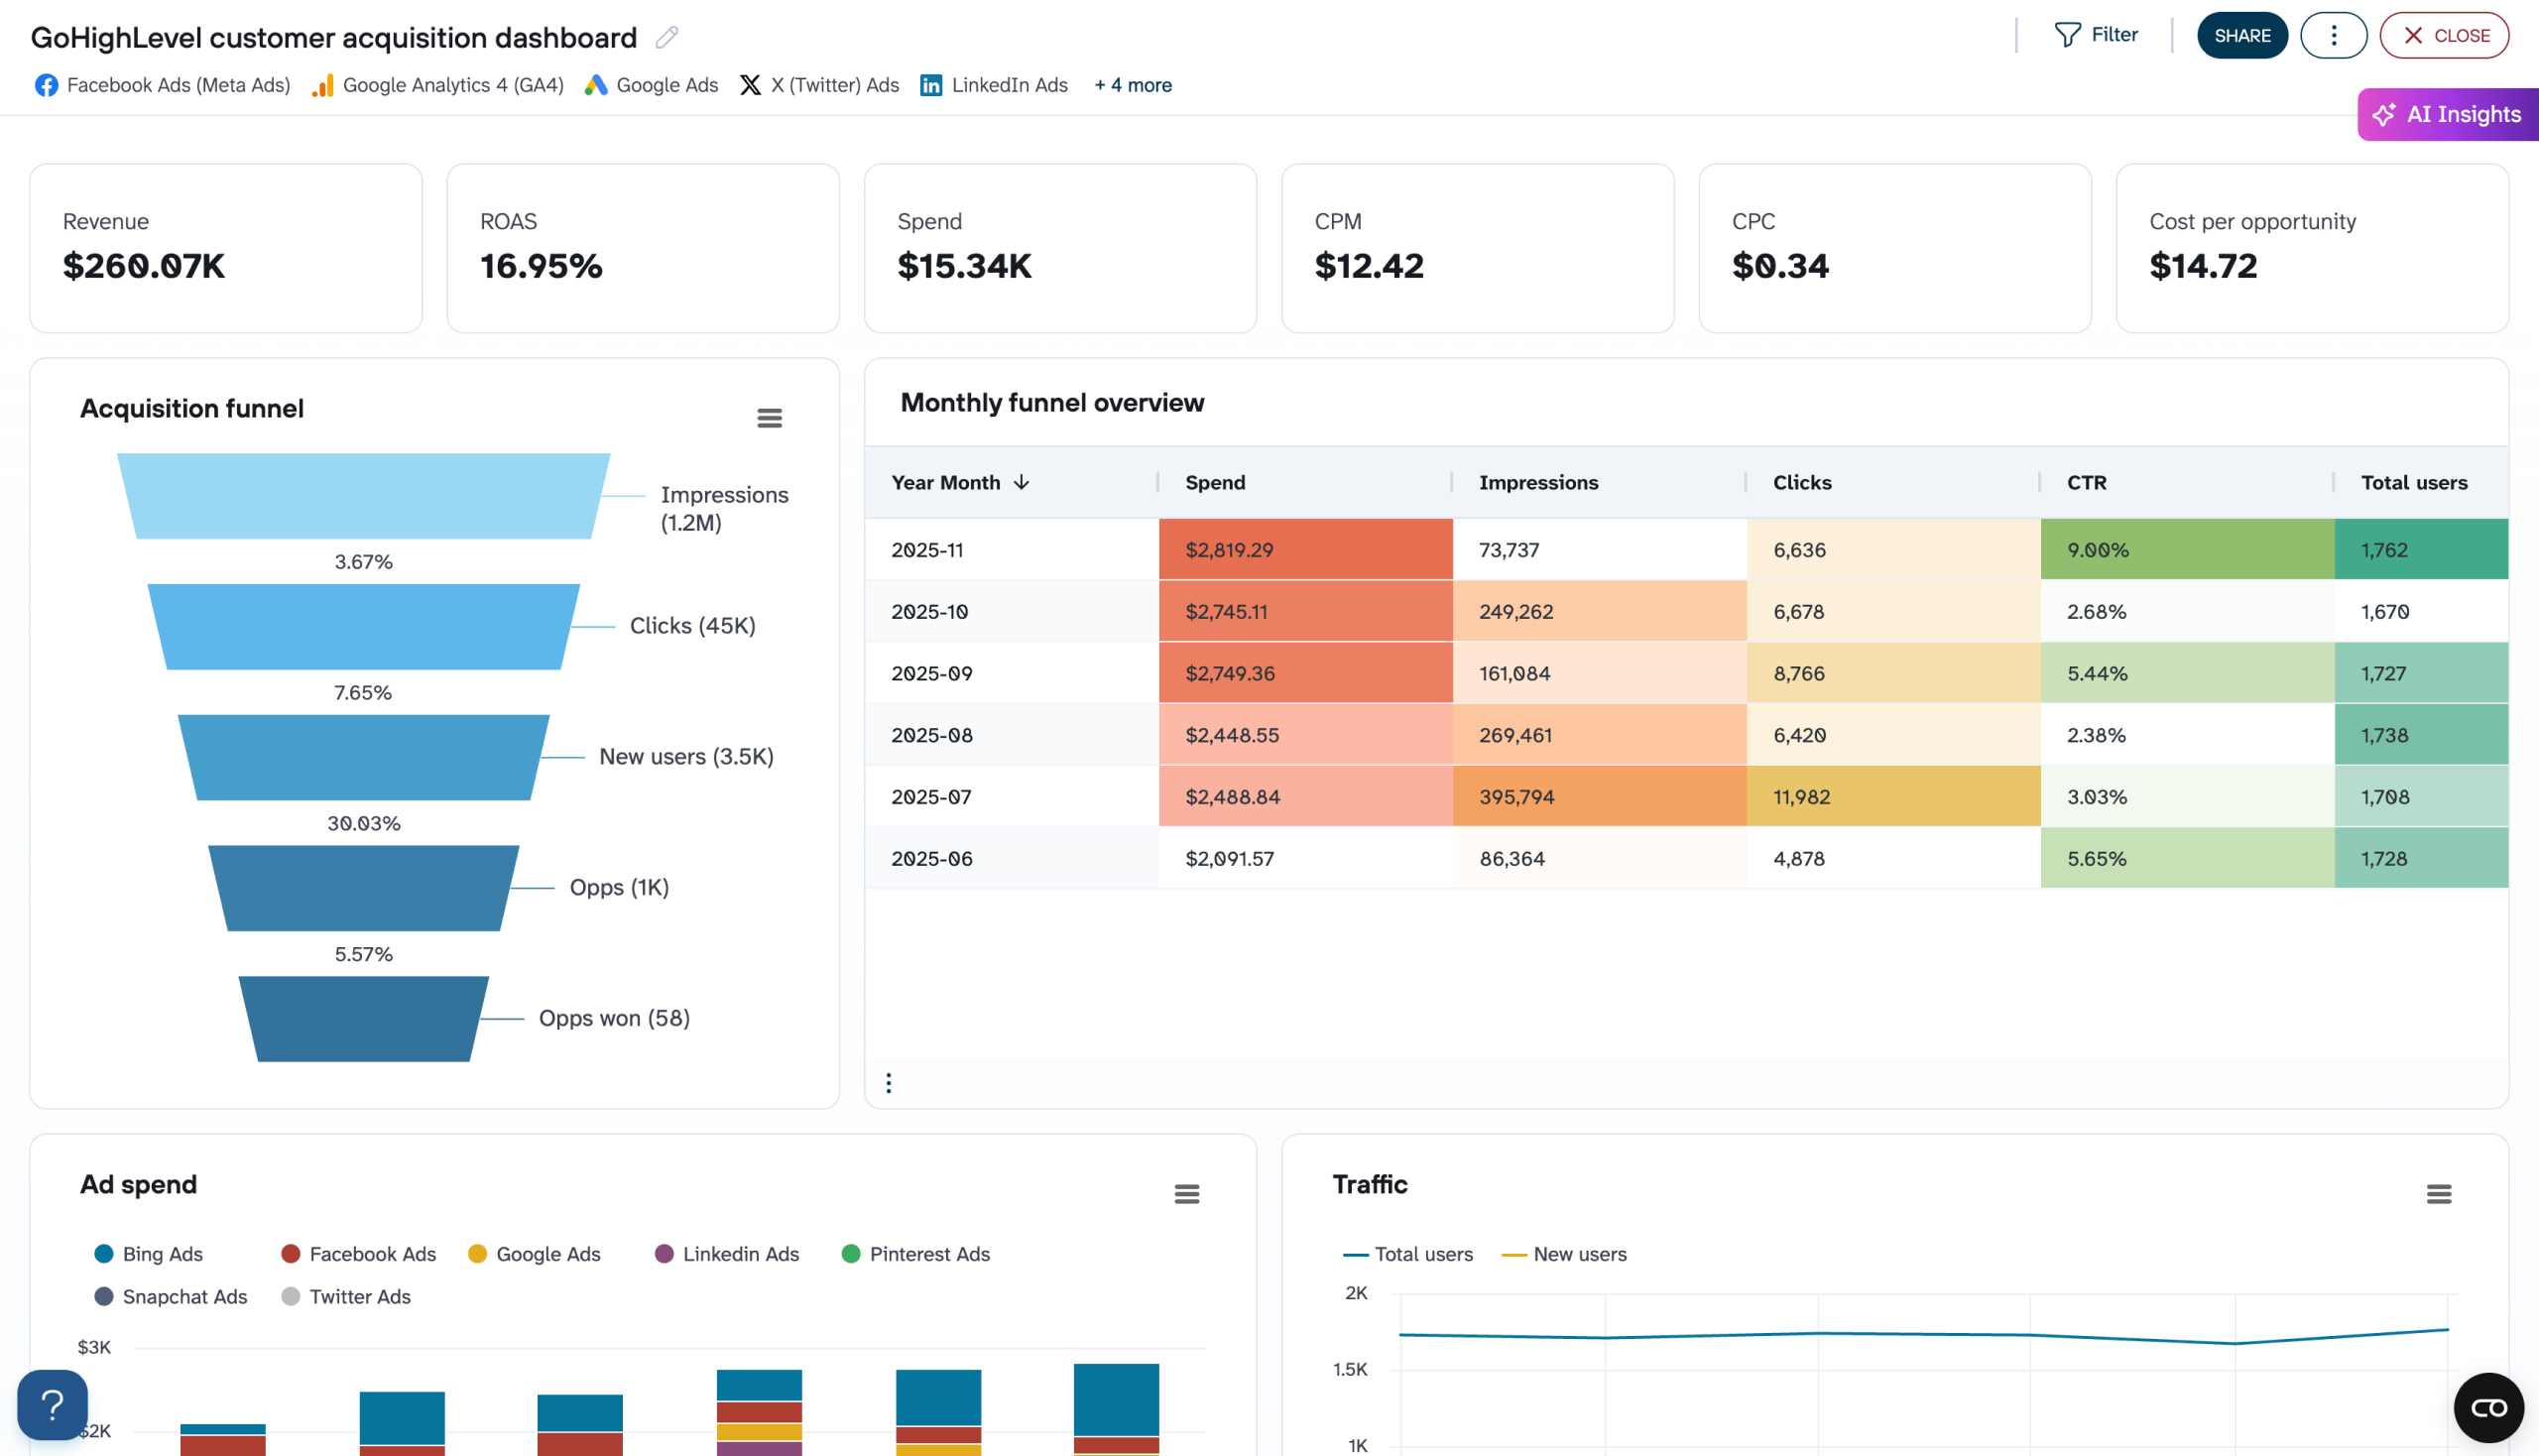
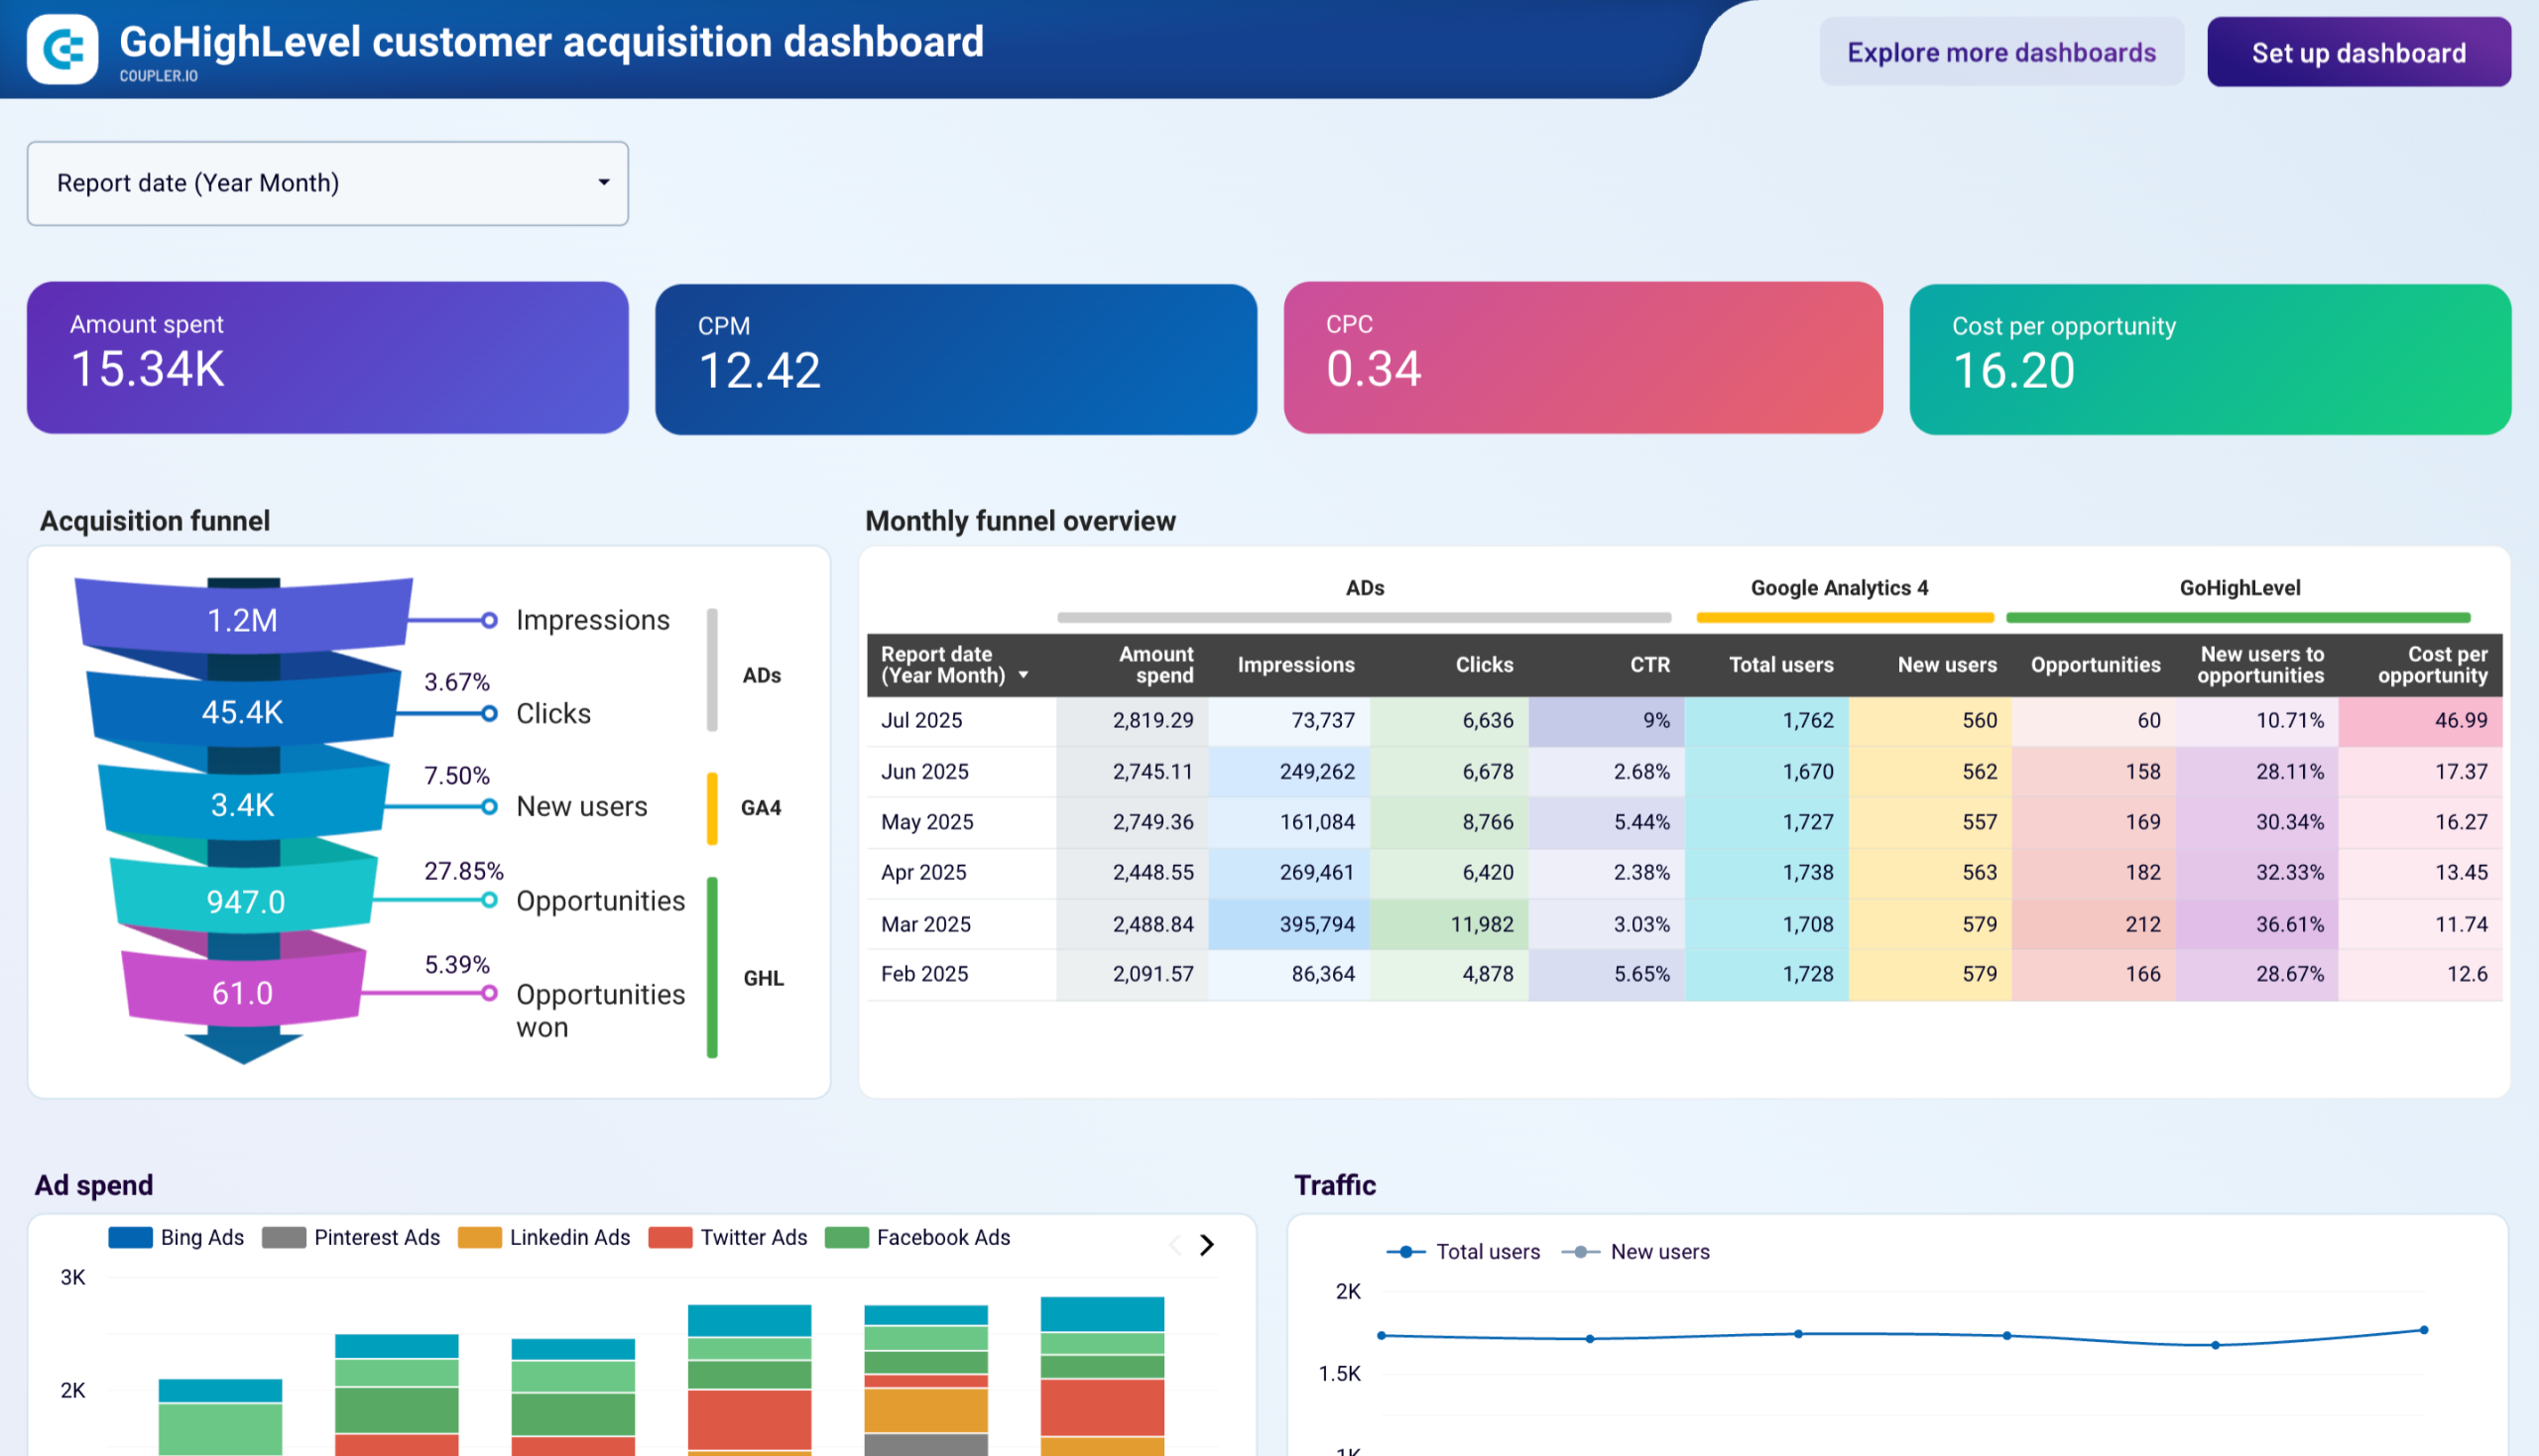
29. Customer acquisition dashboard for GoHighLevel (+ template)
Customer acquisition dashboard for GoHighLevel
 Preview dashboard
Customer acquisition dashboard for GoHighLevel
Preview dashboardThis dashboard integrates data from multiple advertising platforms (Facebook, LinkedIn, Twitter, Bing, and Pinterest Ads) with Google Analytics 4 and GoHighLevel CRM to provide a complete view of your customer acquisition funnel. It tracks the full conversion path from initial impressions through to closed deals, providing monthly breakdowns of spend, traffic, opportunities, and conversion rates across all channels.
You can use these insights to optimize budget allocation among advertising platforms, identify which ones deliver the best ROI, and improve your cost-per-opportunity.
The dashboard is available right in Coupler.io or as a Looker Studio template. Choose the version you like and try it out for free.

Social media dashboards
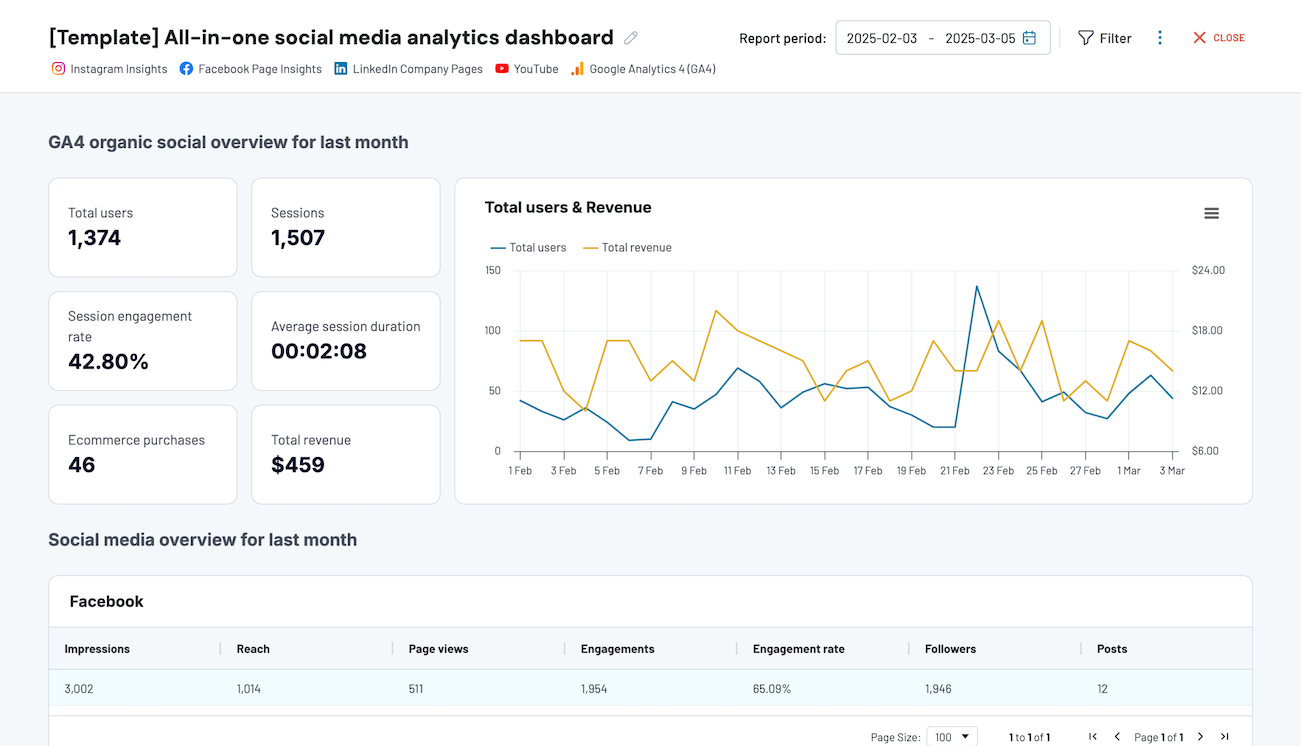
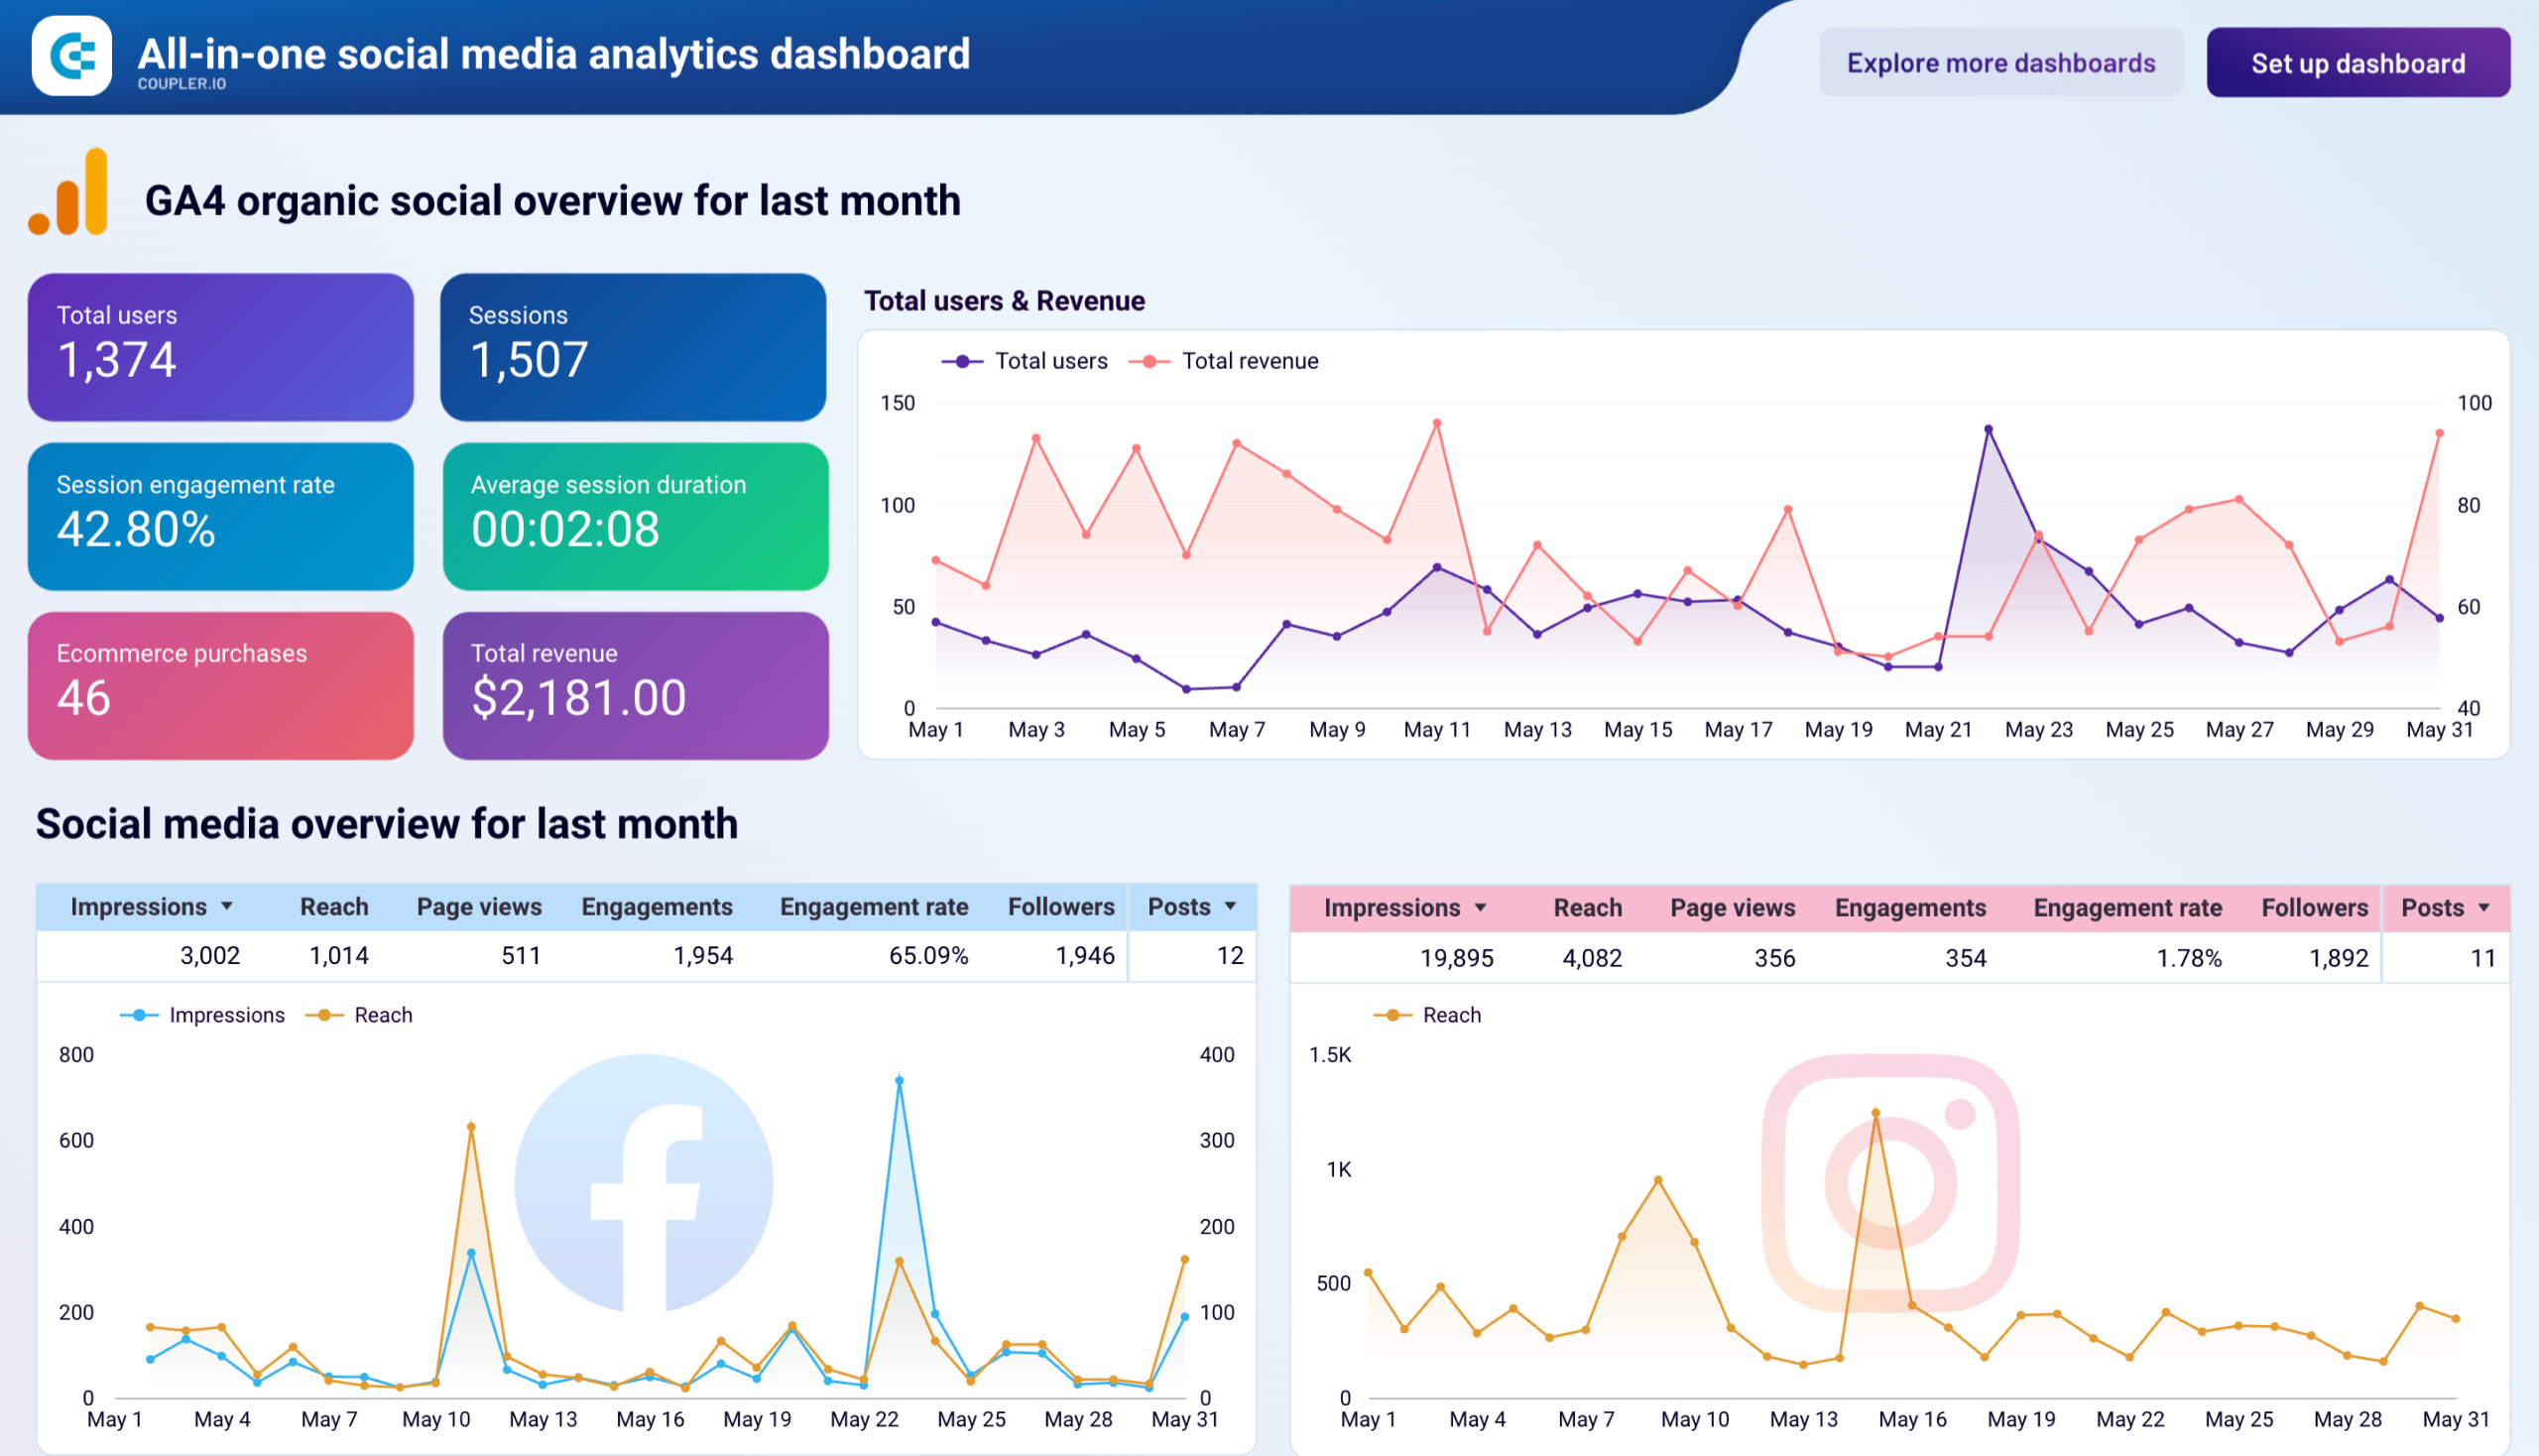
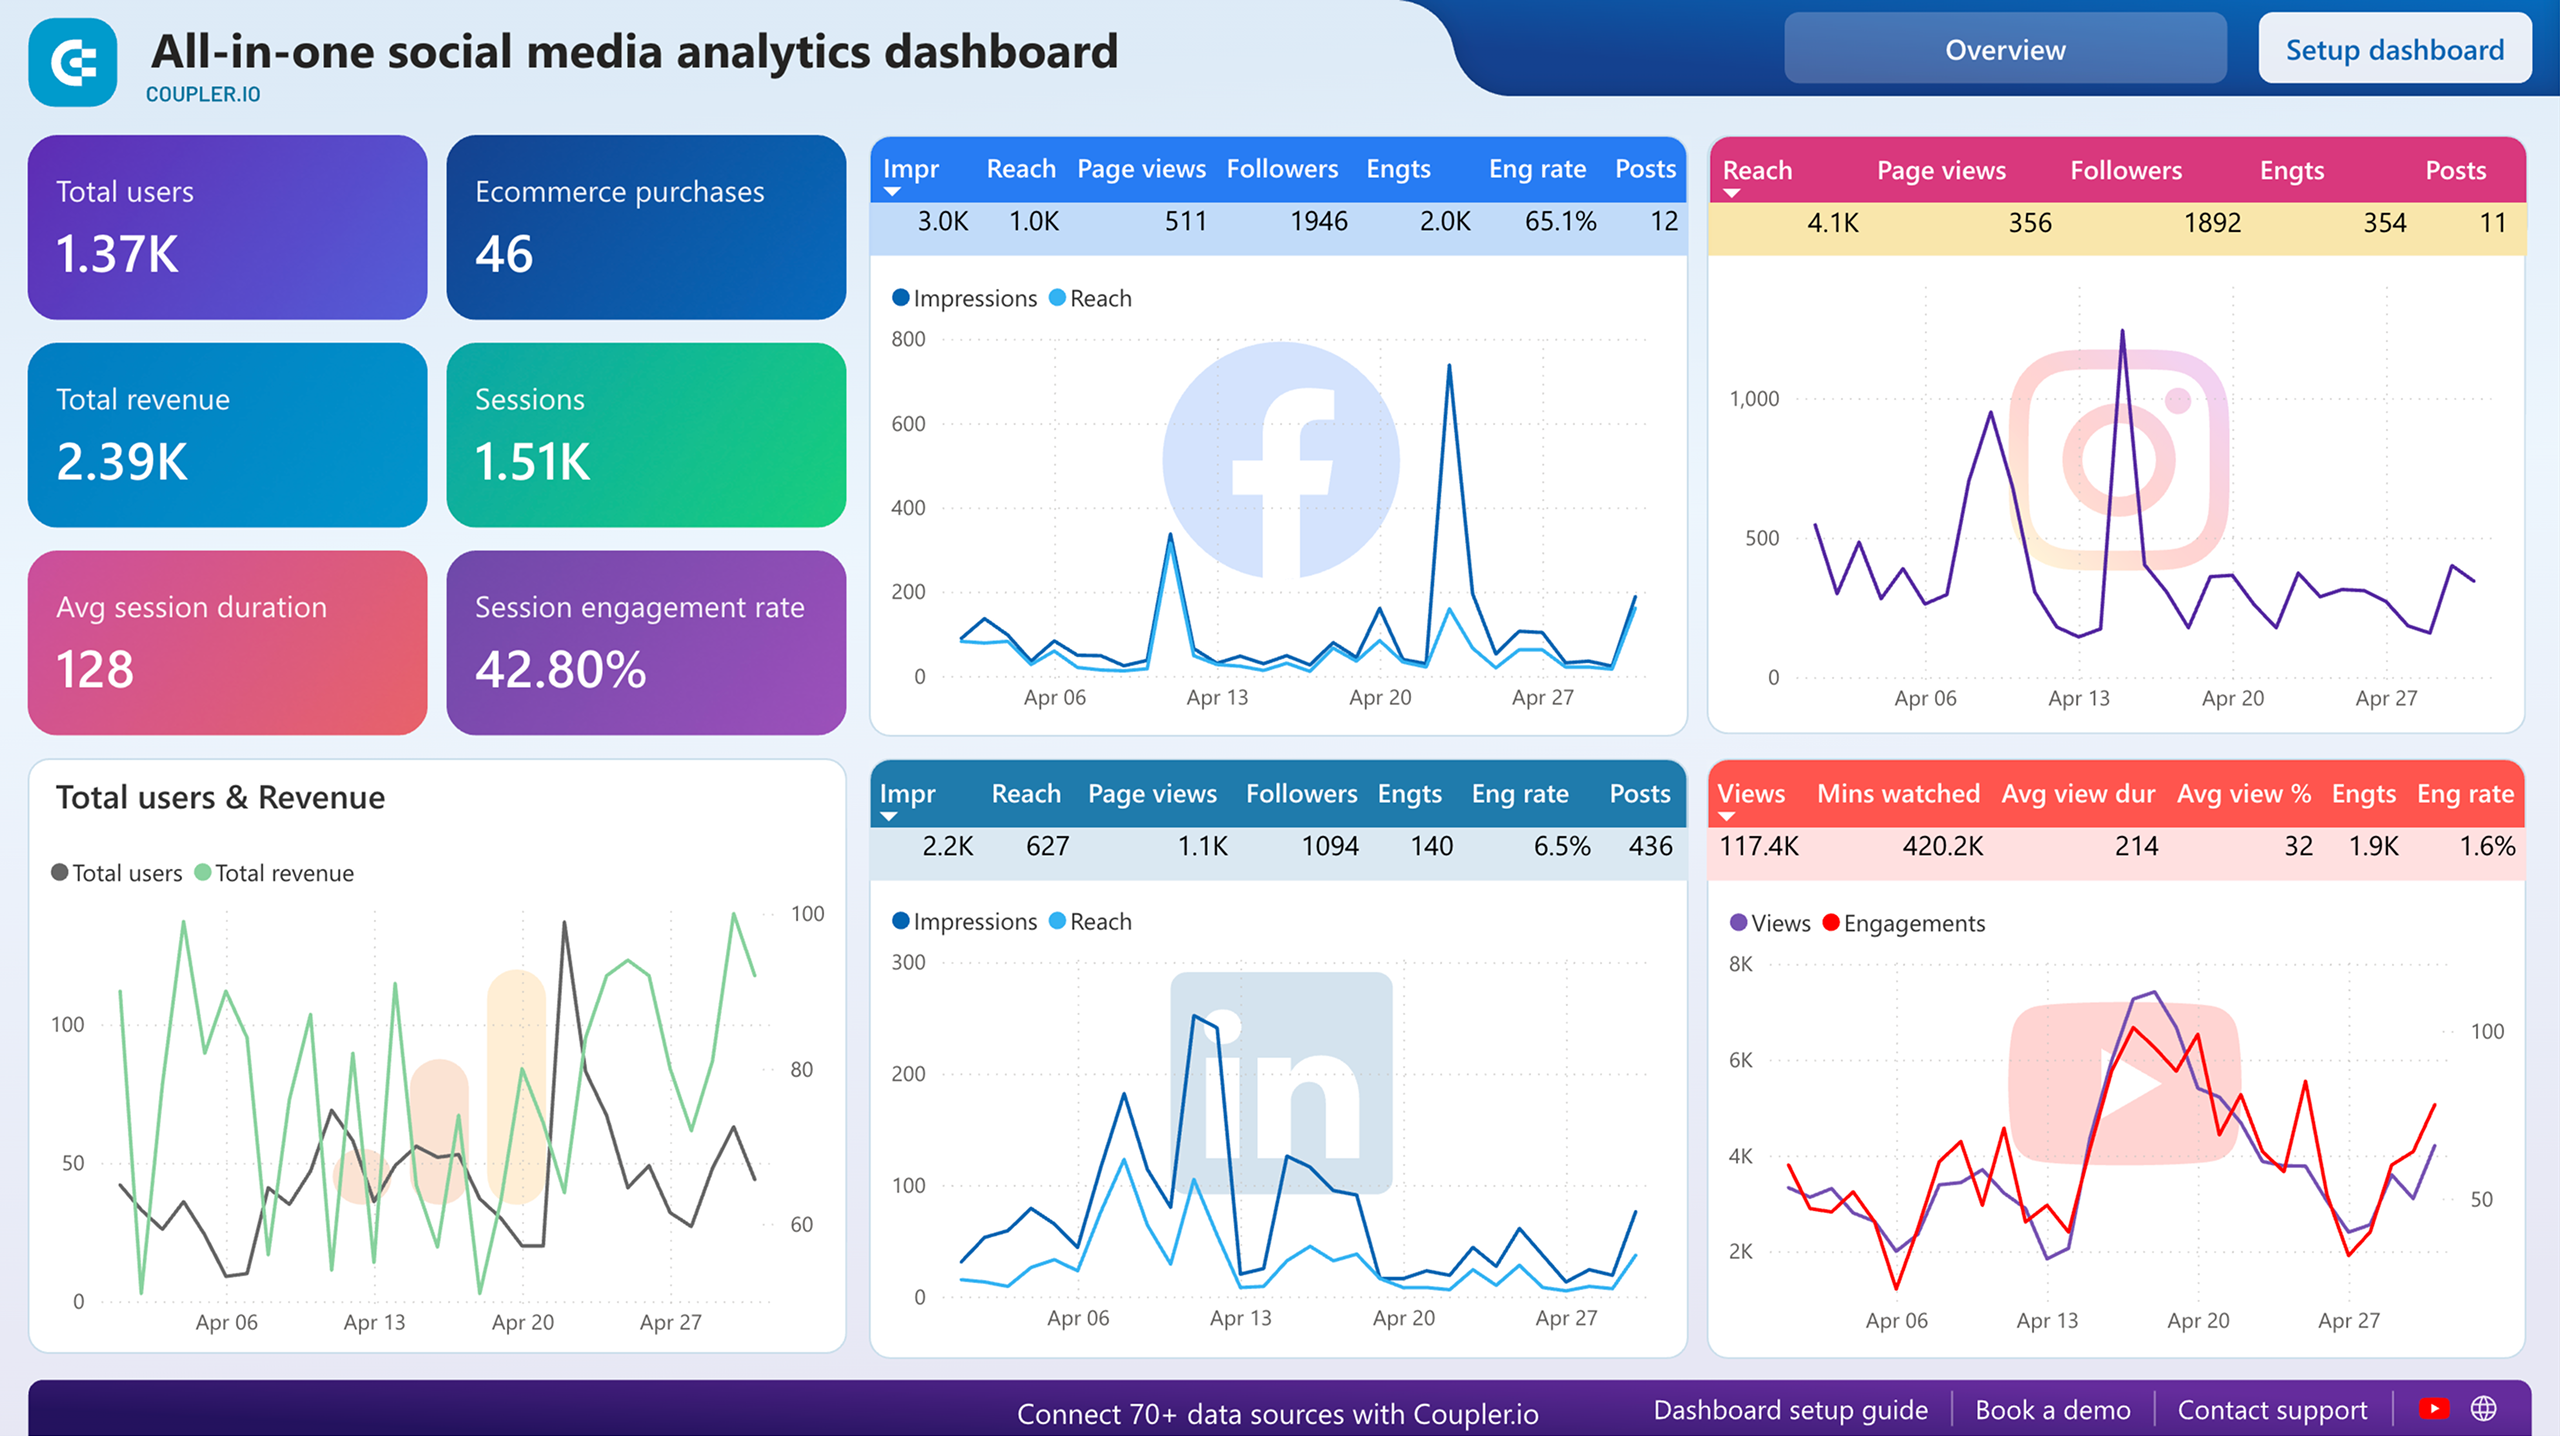
All-in-one social media analytics dashboard
 Preview dashboard
All-in-one social media analytics dashboard
Preview dashboardThis dashboard allows you to overview the performance of major social media platforms: Facebook, Instagram, LinkedIn, and YouTube. With integrated data from GA4, you can analyze how these social channels contribute to your website traffic and overall results. Additionally, the dashboard offers detailed insights into last month’s dynamics for each platform.
The dashboard is available in the Coupler.io interface and as a Looker Studio or Power BI template. Choose the version you prefer and try it right away for free!


31. LinkedIn company pages dashboard (+ template)
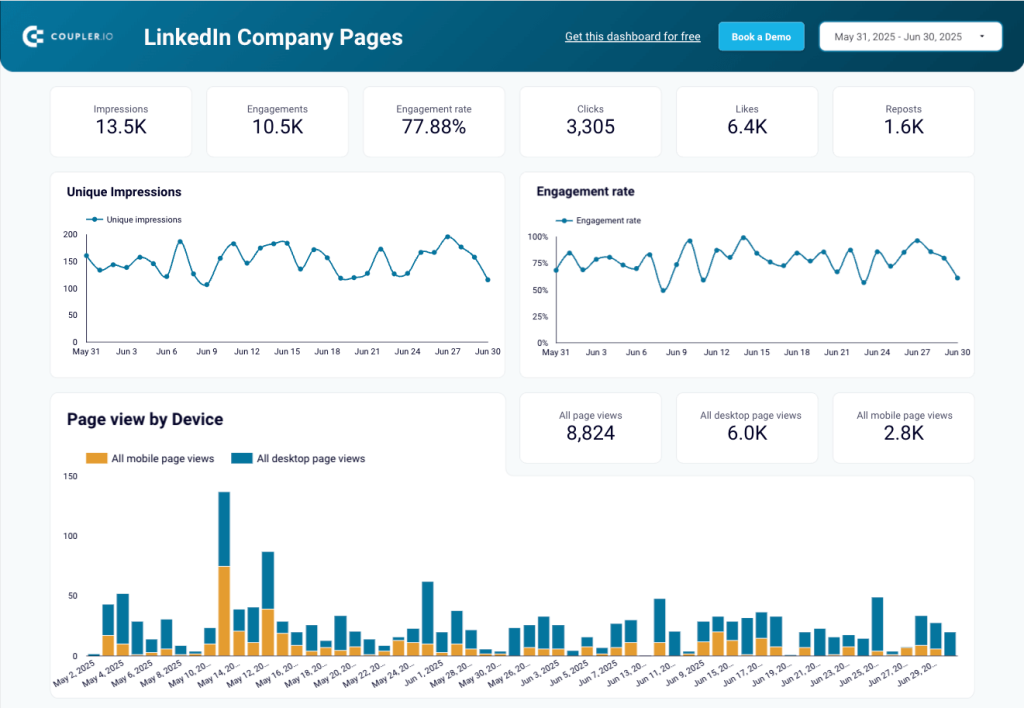
This dashboard displays key metrics to understand the performance of your company’s presence on LinkedIn. These include unique impressions, engagement rate, page views by device/country, followers breakdowns, or even stats for individual posts. You can use the dashboard to monitor your content performance and audience behavior, track follower base, and refine targeting. All to gain valuable insights and trends that let you optimize your content and marketing efforts on LinkedIn.
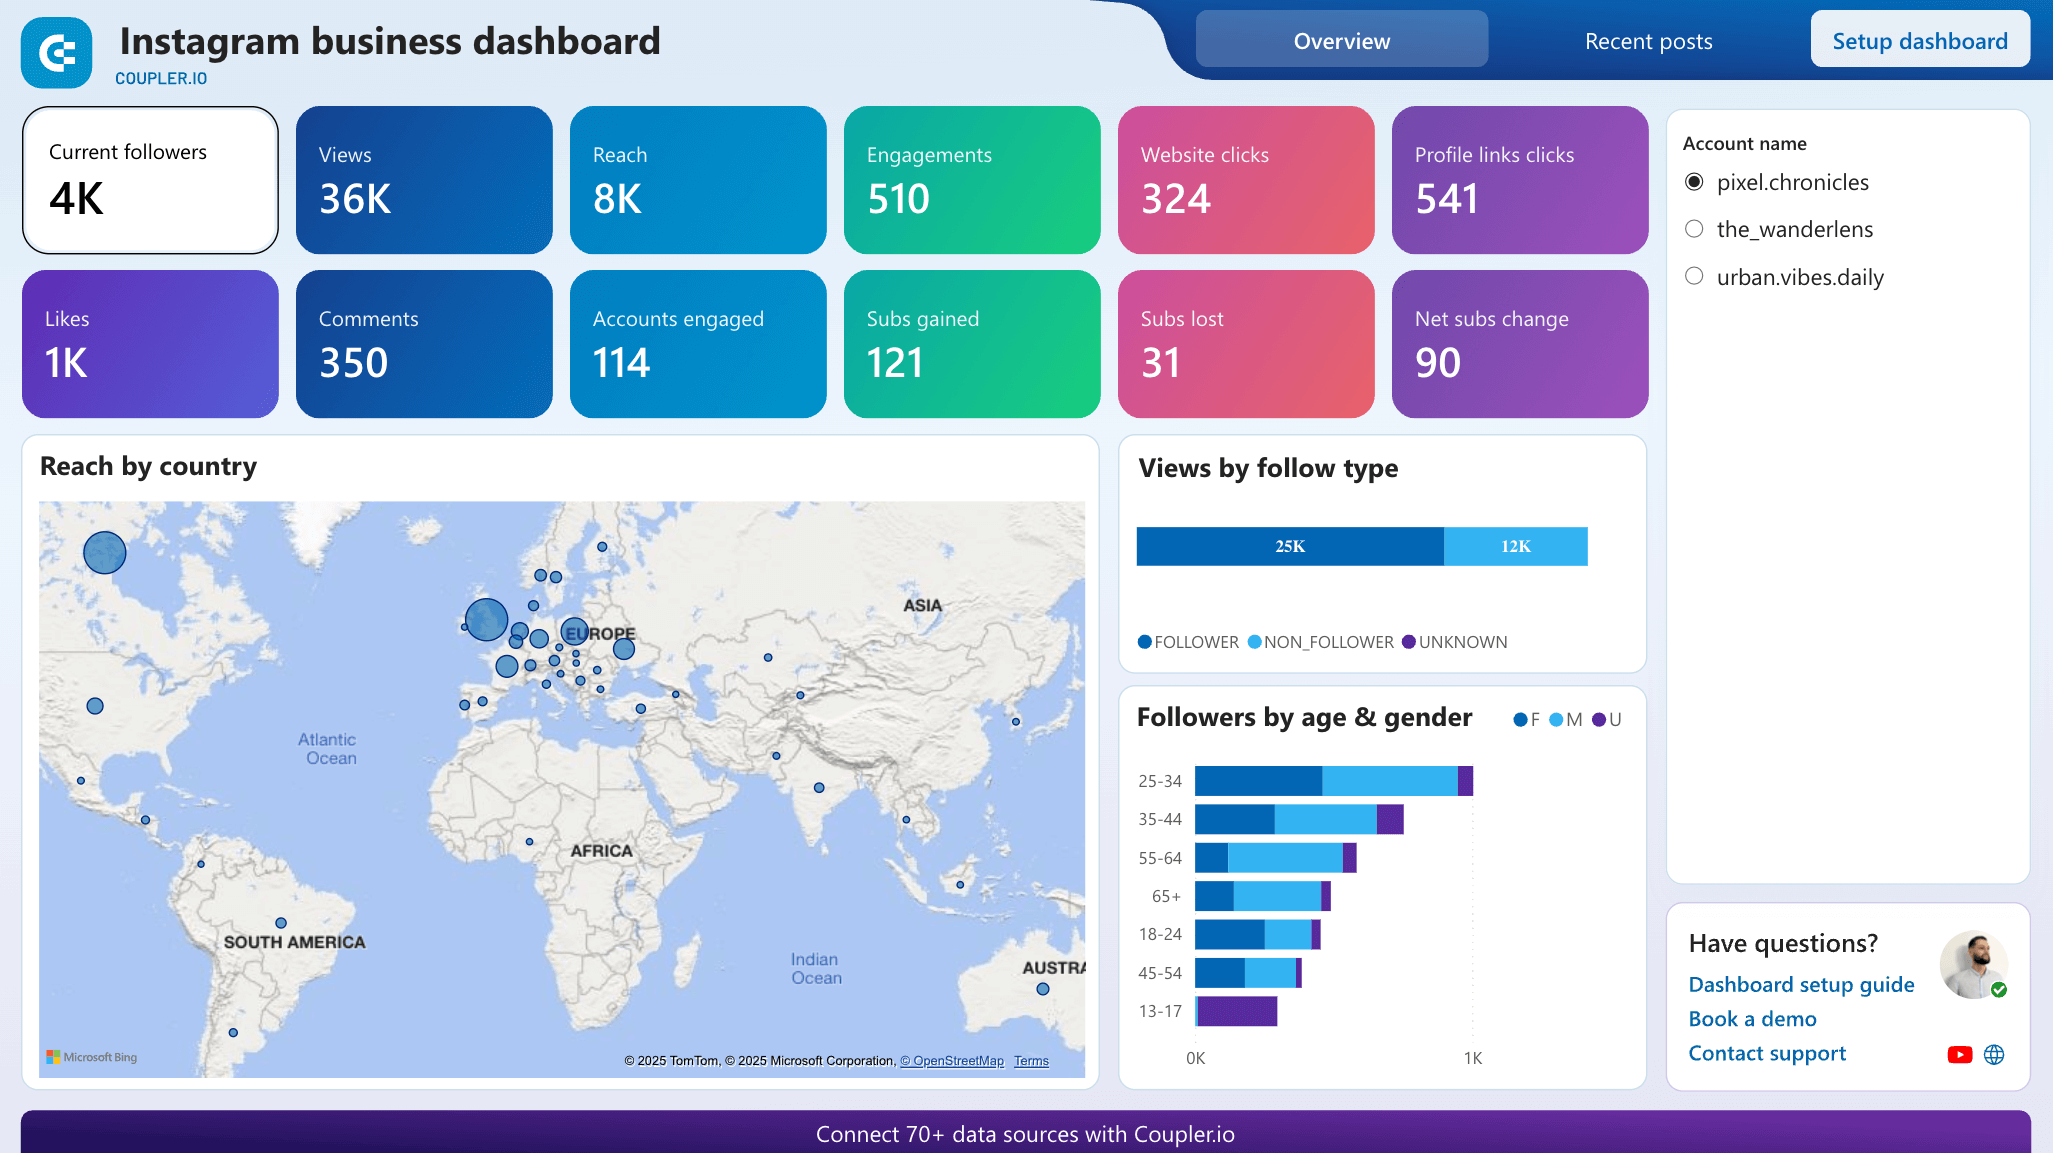
32. Instagram business dashboard (+ template)
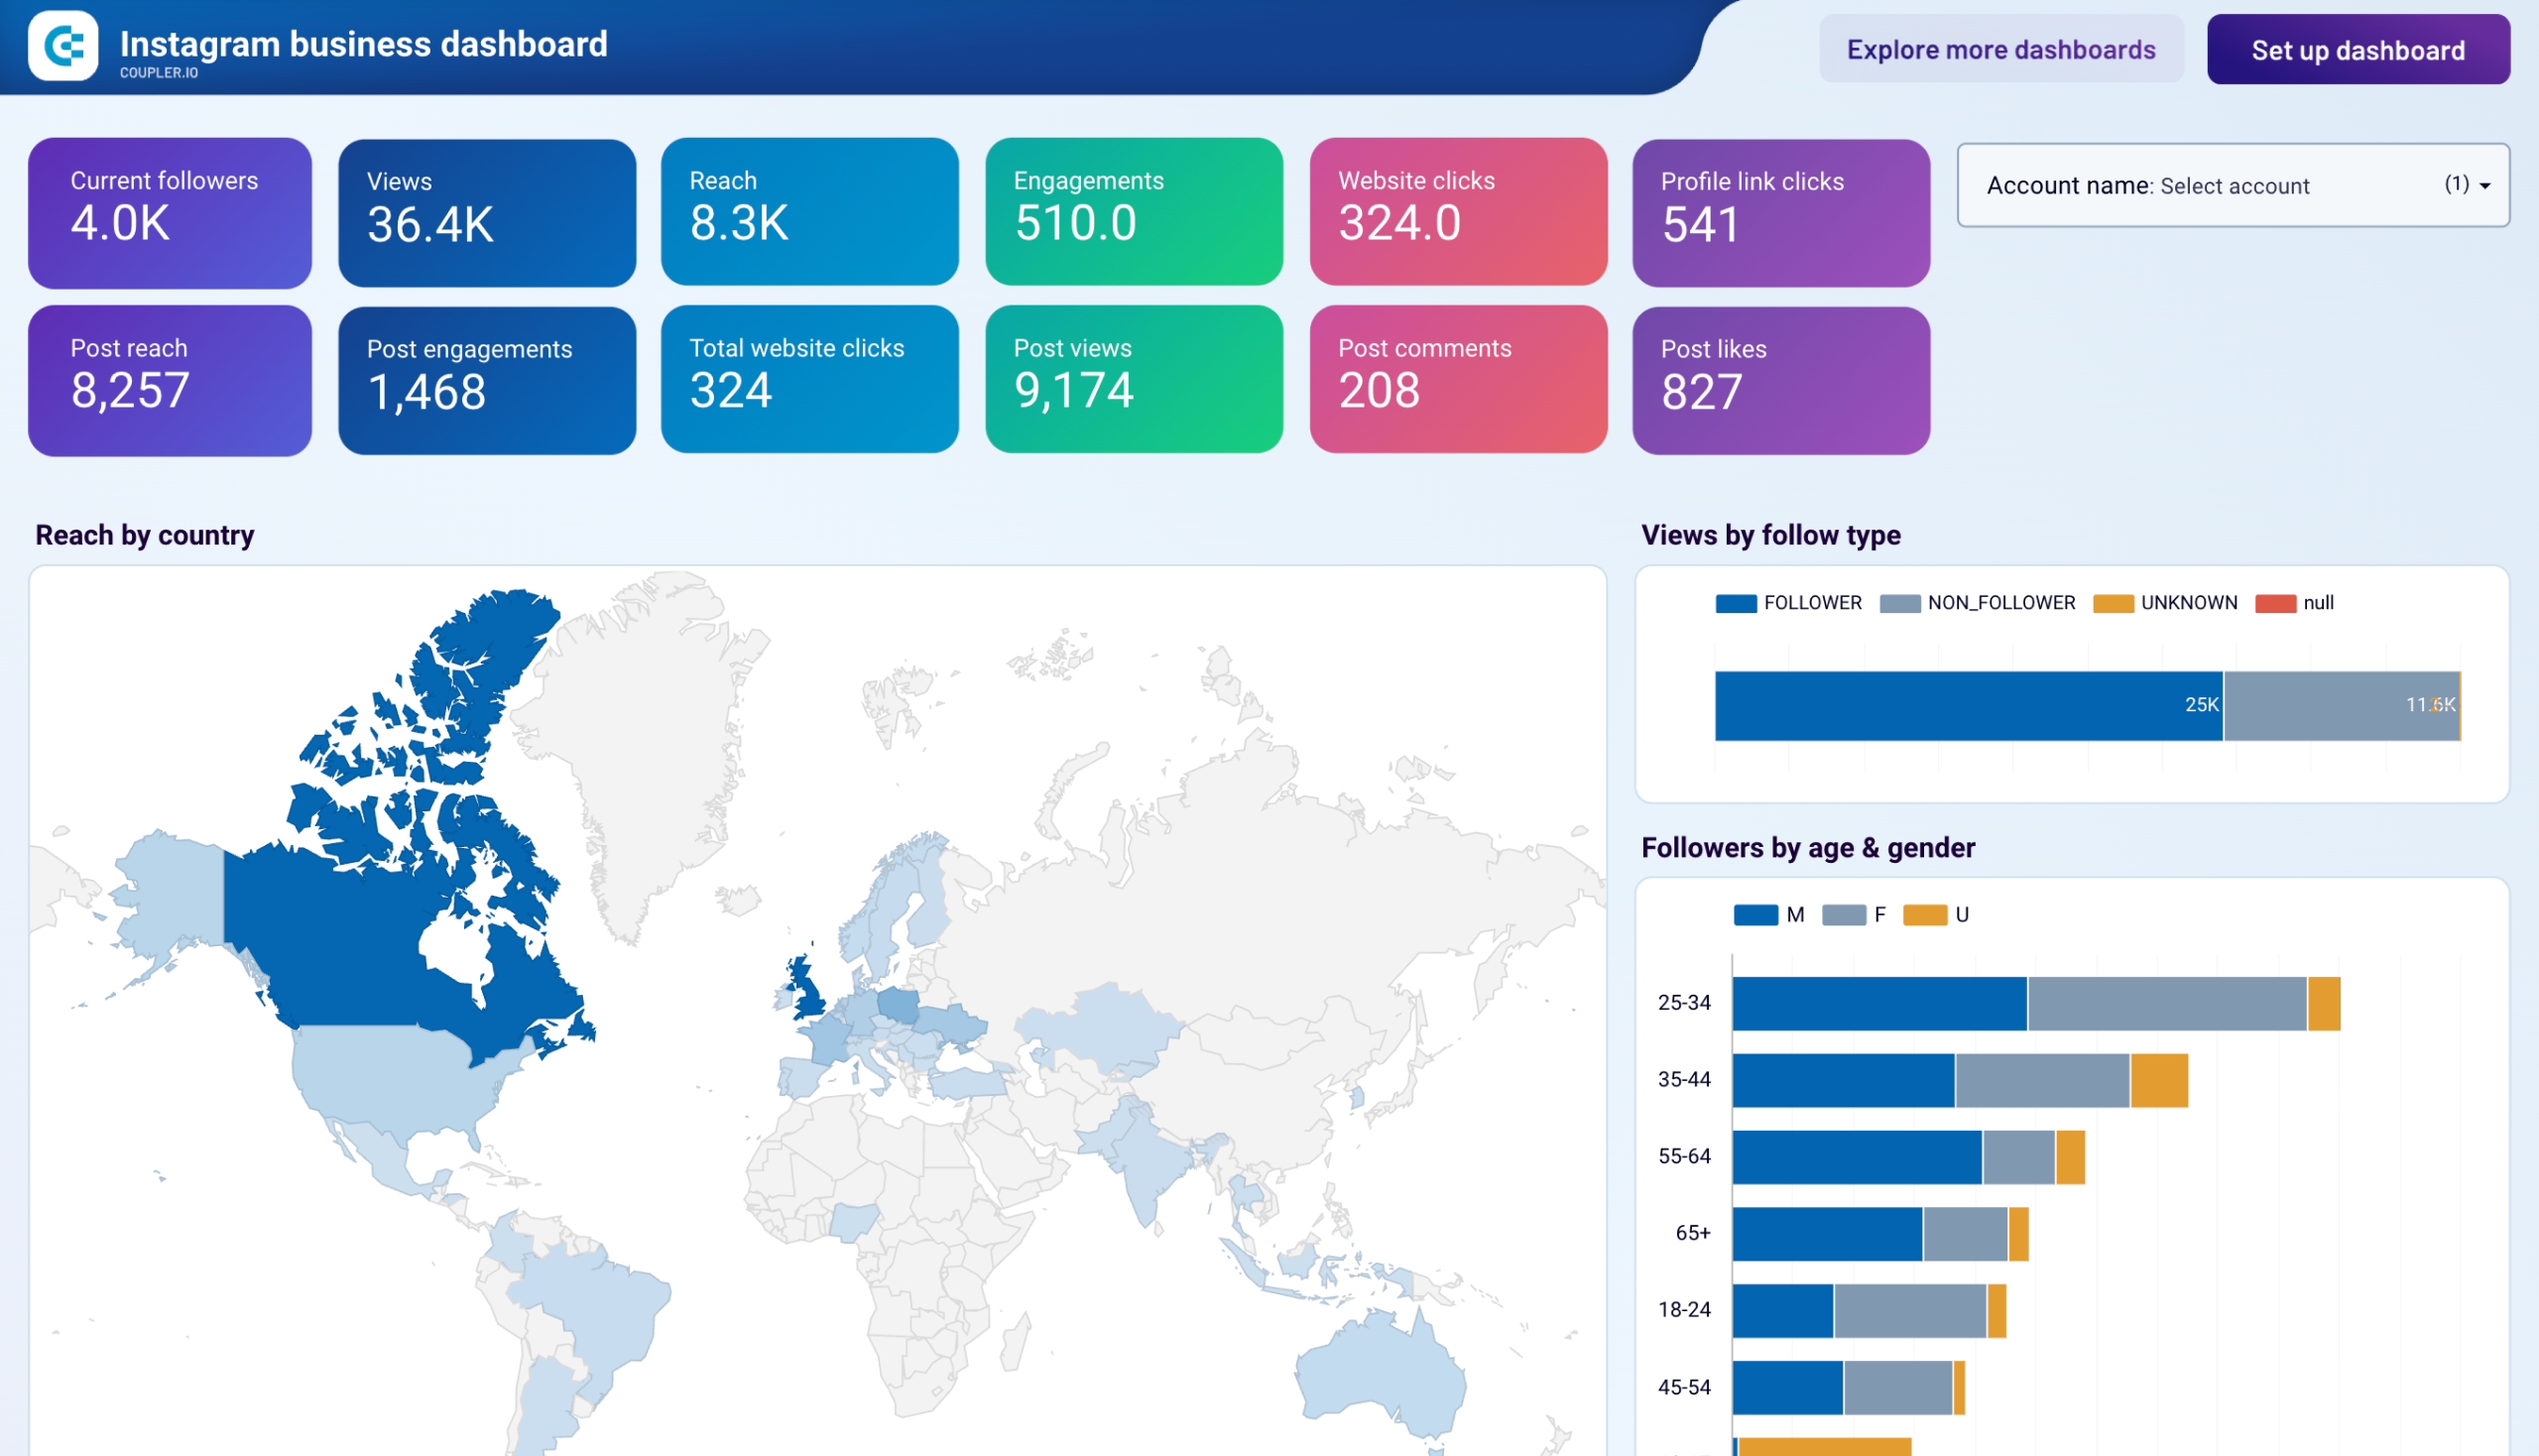
The Instagram business dashboard provides detailed insights into the performance of your company’s Instagram page. You can monitor your content’s reach and engagement across different post types (feed vs reels), analyze follower growth trends, and track how your Instagram presence drives business outcomes through website clicks and profile actions. The dashboard also offers demographic breakdowns of your audience, helping you make improvements to your content and targeting strategies.
You can generate a copy of this dashboard template in Looker Studio or Power BI, and populate it with your data in minutes. Simply sign up for a free Coupler.io account.
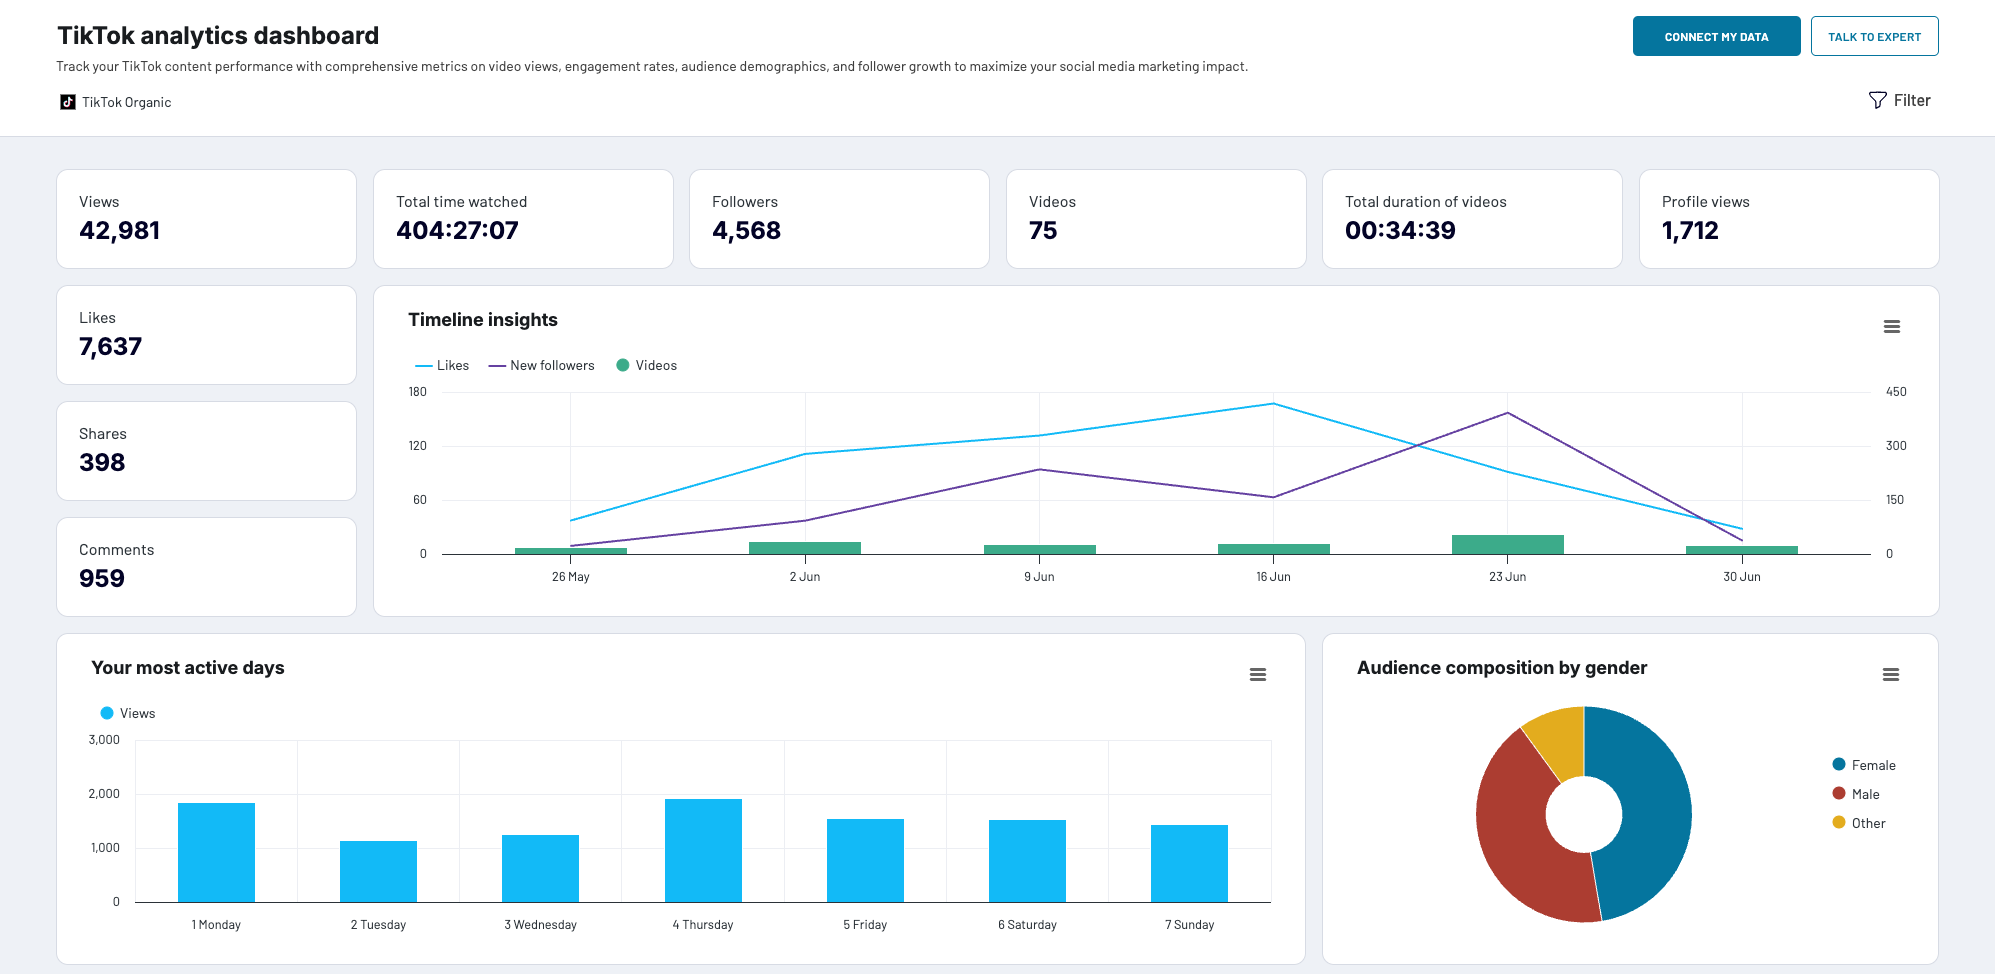
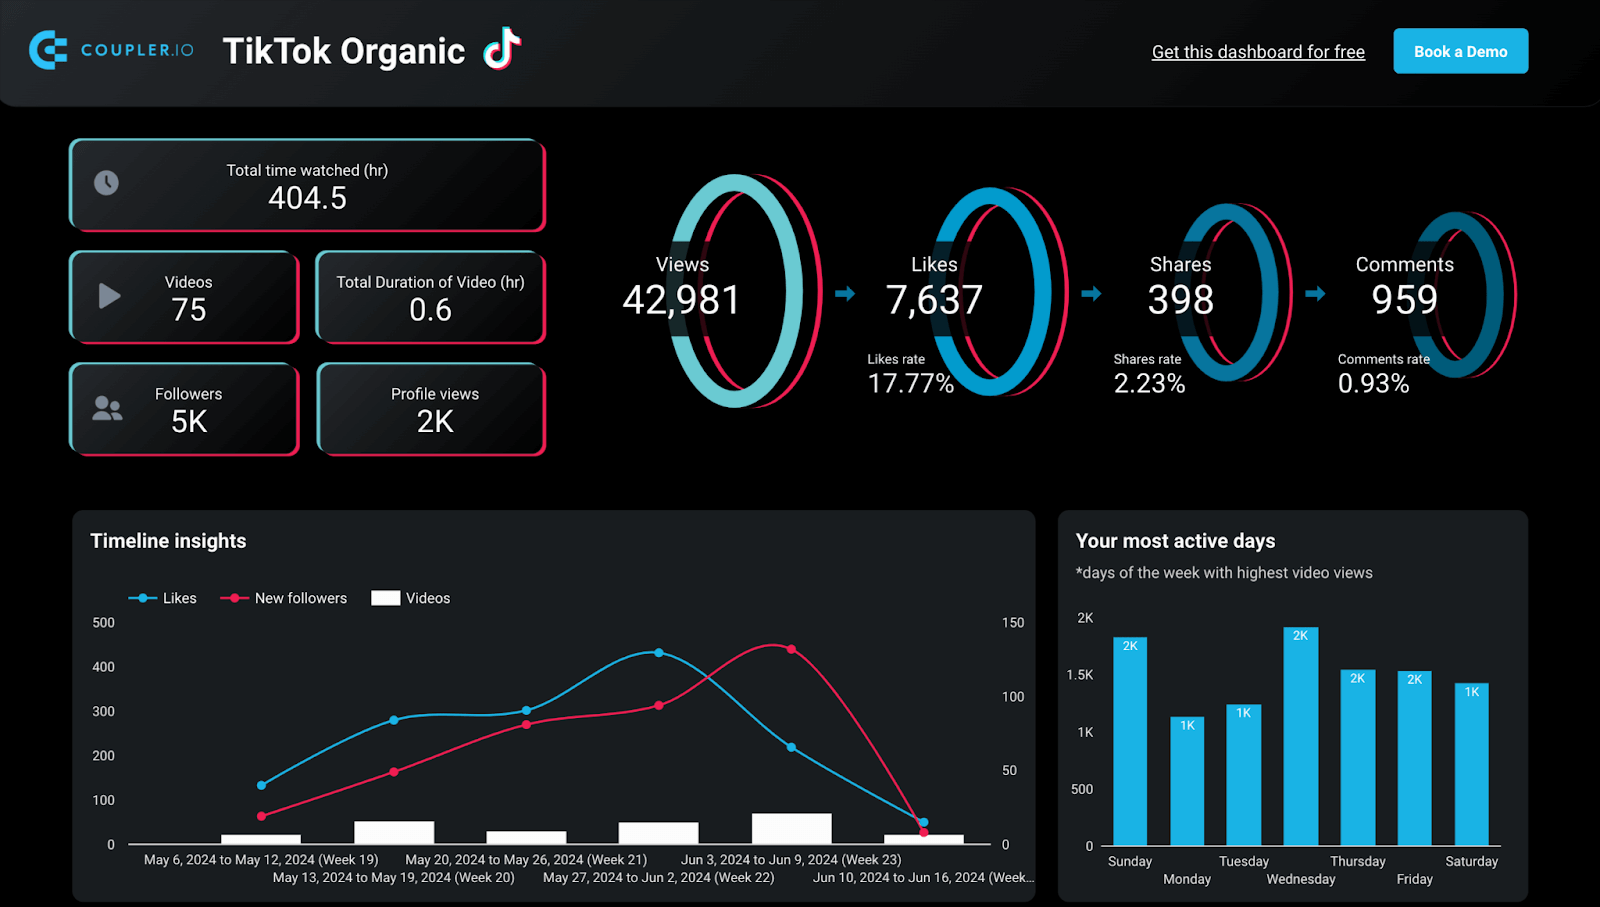
This template is one of a few influencer marketing dashboards available at Coupler.io. It was designed to monitor and analyze organic content performance. You get timeline insights into likes, new followers, views, and other essential metrics. The TikTok analytics dashboard also shows your audience composition by gender and top countries by views.
At the bottom, there is a table showing the performance of your videos including views, likes, shares, and comments. The dashboard template is designed in Coupler.io and Looker Studio, and you only need to connect it to your TikTok account.
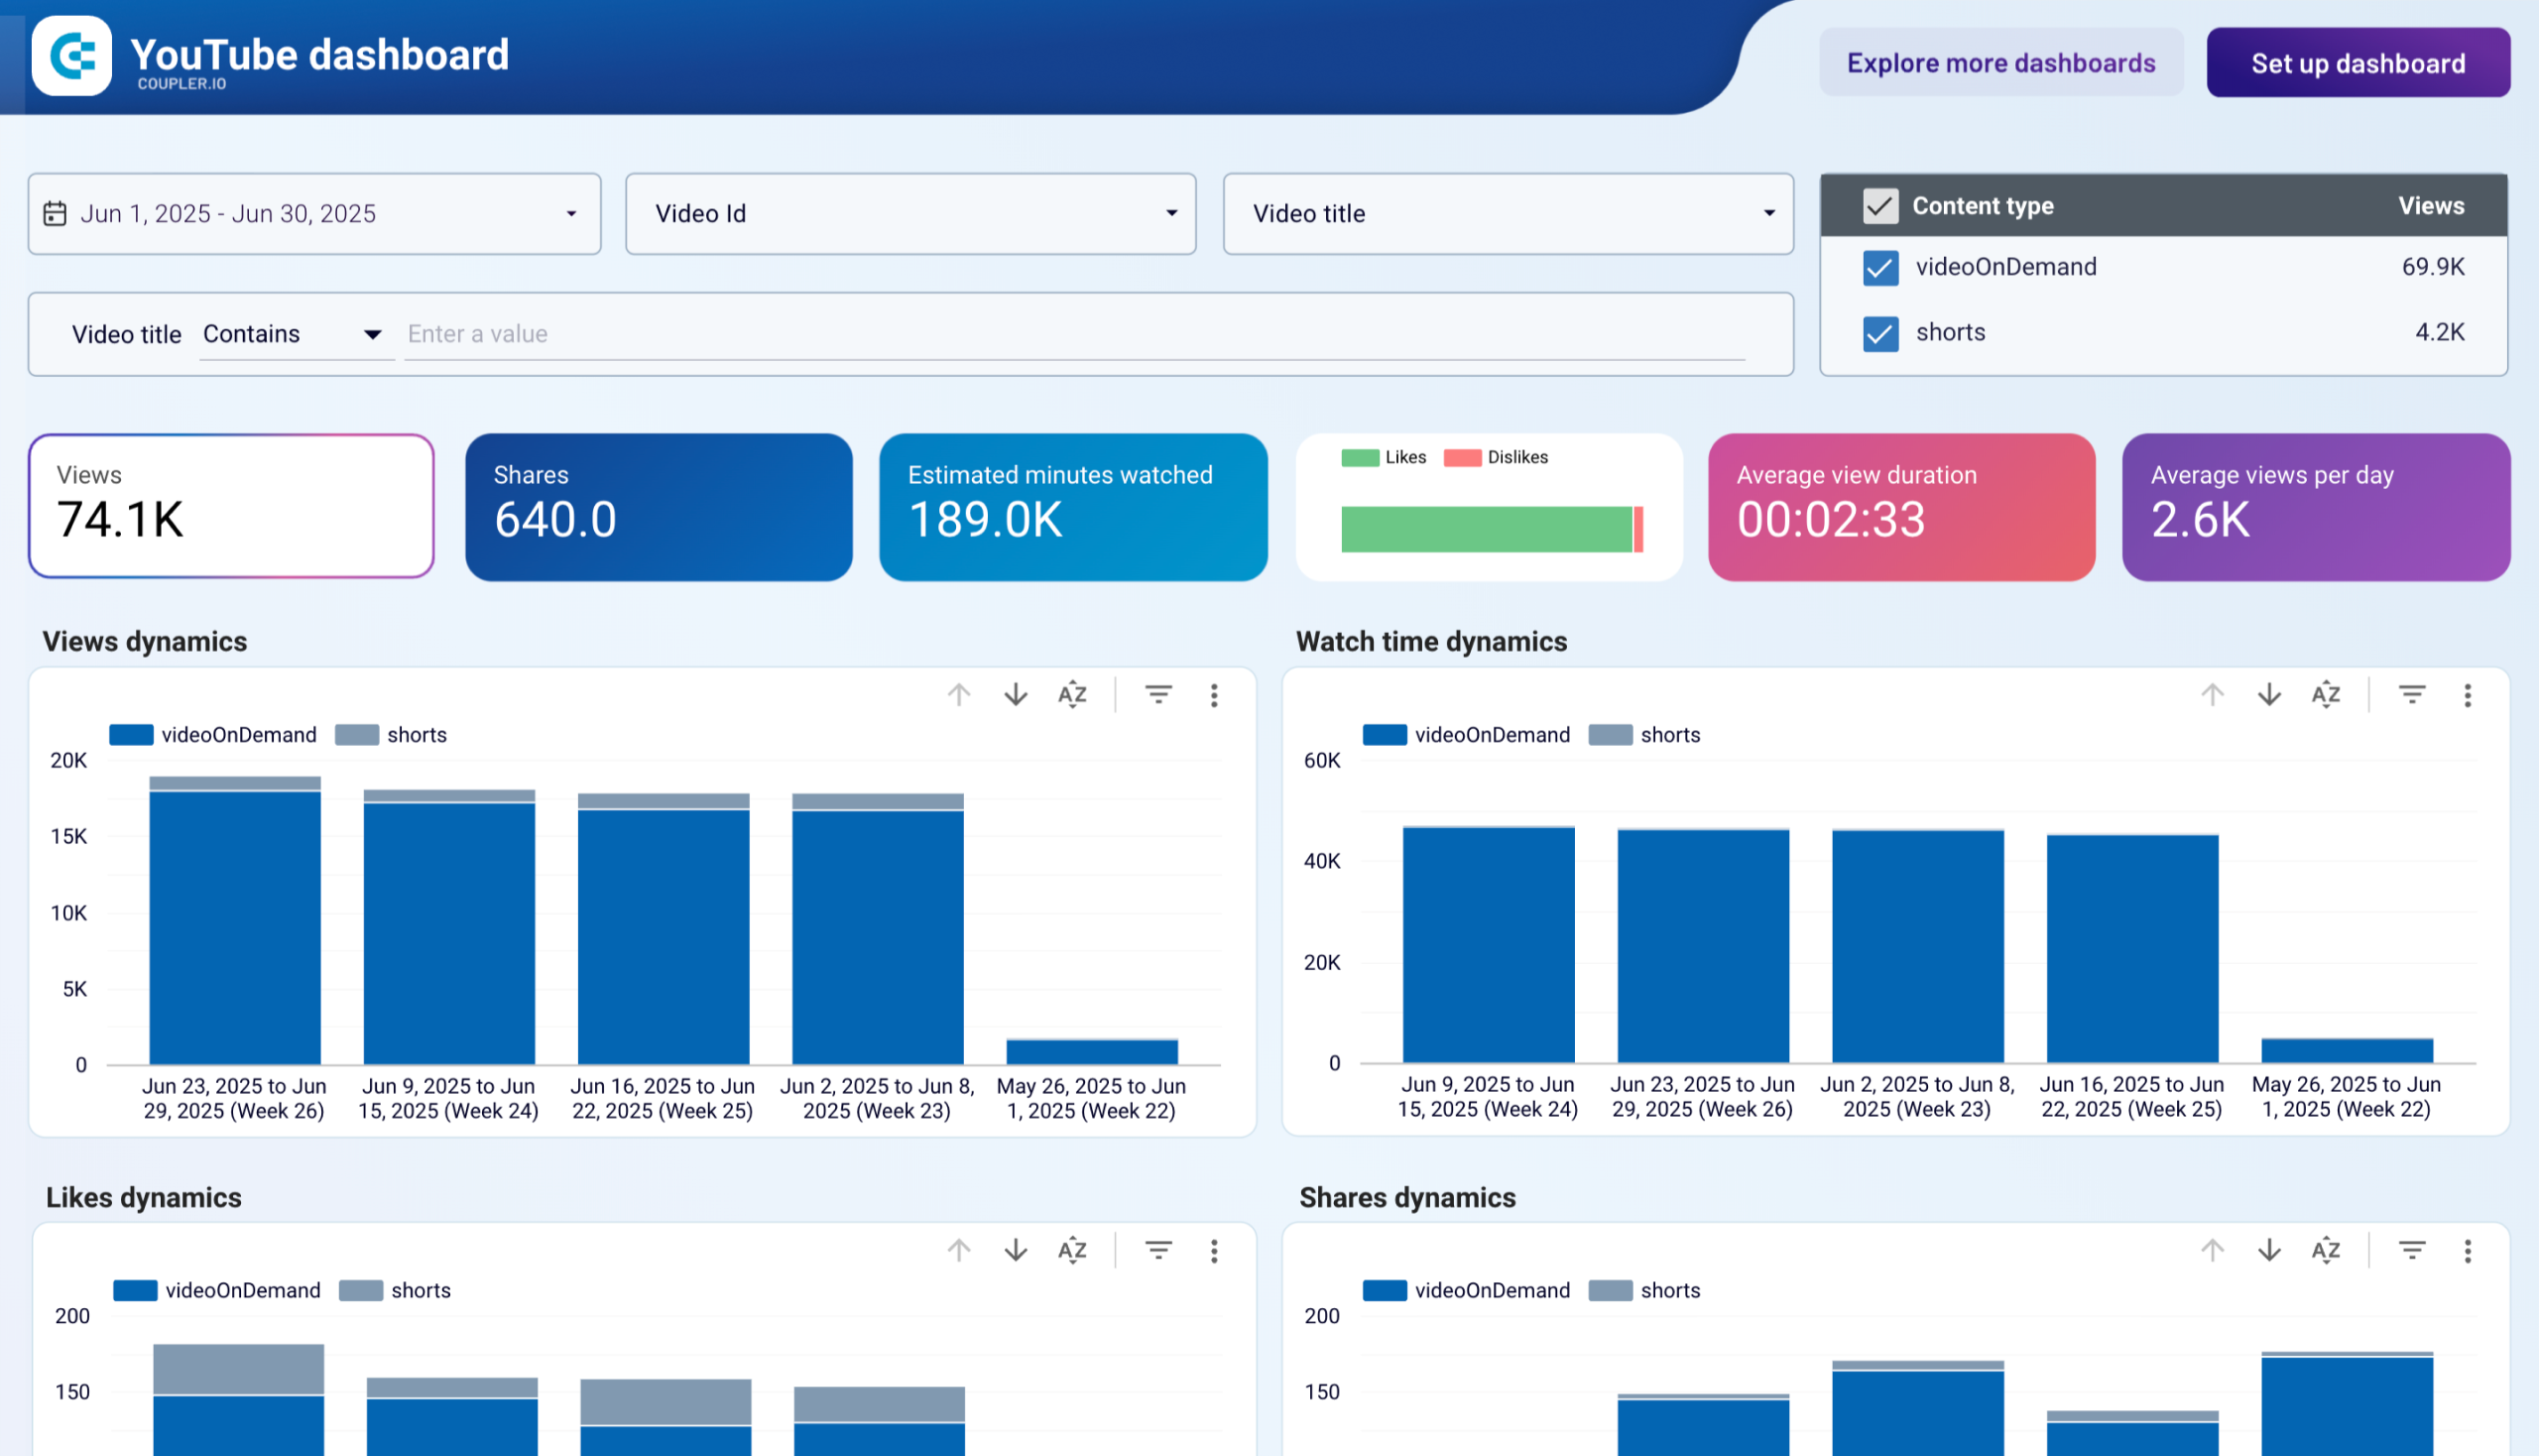
34. YouTube channel overview dashboard (+ template)
YouTube channel overview dashboard
 Preview dashboard
YouTube channel overview dashboard
Preview dashboardA YouTube dashboard is meant to provide you with a comprehensive overview of your YouTube channel’s performance. You can track crucial metrics such as views, engagement, subscription dynamics, and much more. With the insights derived from YouTube analytics, marketers can take a data-driven approach to drive the success of their YouTube marketing efforts.
Check out what social media dashboards you should consider in 2026.
Email marketing dashboards
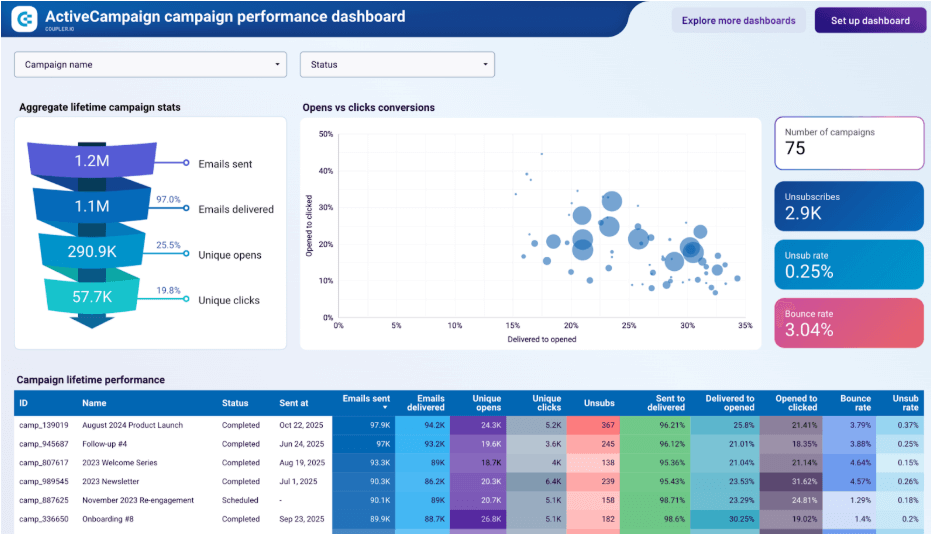
#35. ActiveCampaign campaign performance dashboard (+ template)
ActiveCampaign provides campaign reports, but they’re scattered across individual sends. This dashboard aggregates everything into a single view, so you can evaluate your email program as a whole rather than one campaign at a time.
ActiveCampaign campaign performance dashboard
 preview dashboard
ActiveCampaign campaign performance dashboard
preview dashboardWhat makes this template practical is the ability to see your entire sending history in one table and sort it by any metric — delivery rate, open rate, click rate, or unsubscribes. If you’re preparing for a product launch and need to set realistic KPI targets, you can pull up past campaigns of a similar type and use their performance as a baseline. The dashboard also highlights the gap between opens and clicks for each campaign, which tells you whether your audience finds the emails worth opening but not worth acting on.
The template is built in Looker Studio with a Coupler.io connector. Connect your ActiveCampaign account to get started in about 2 minutes.
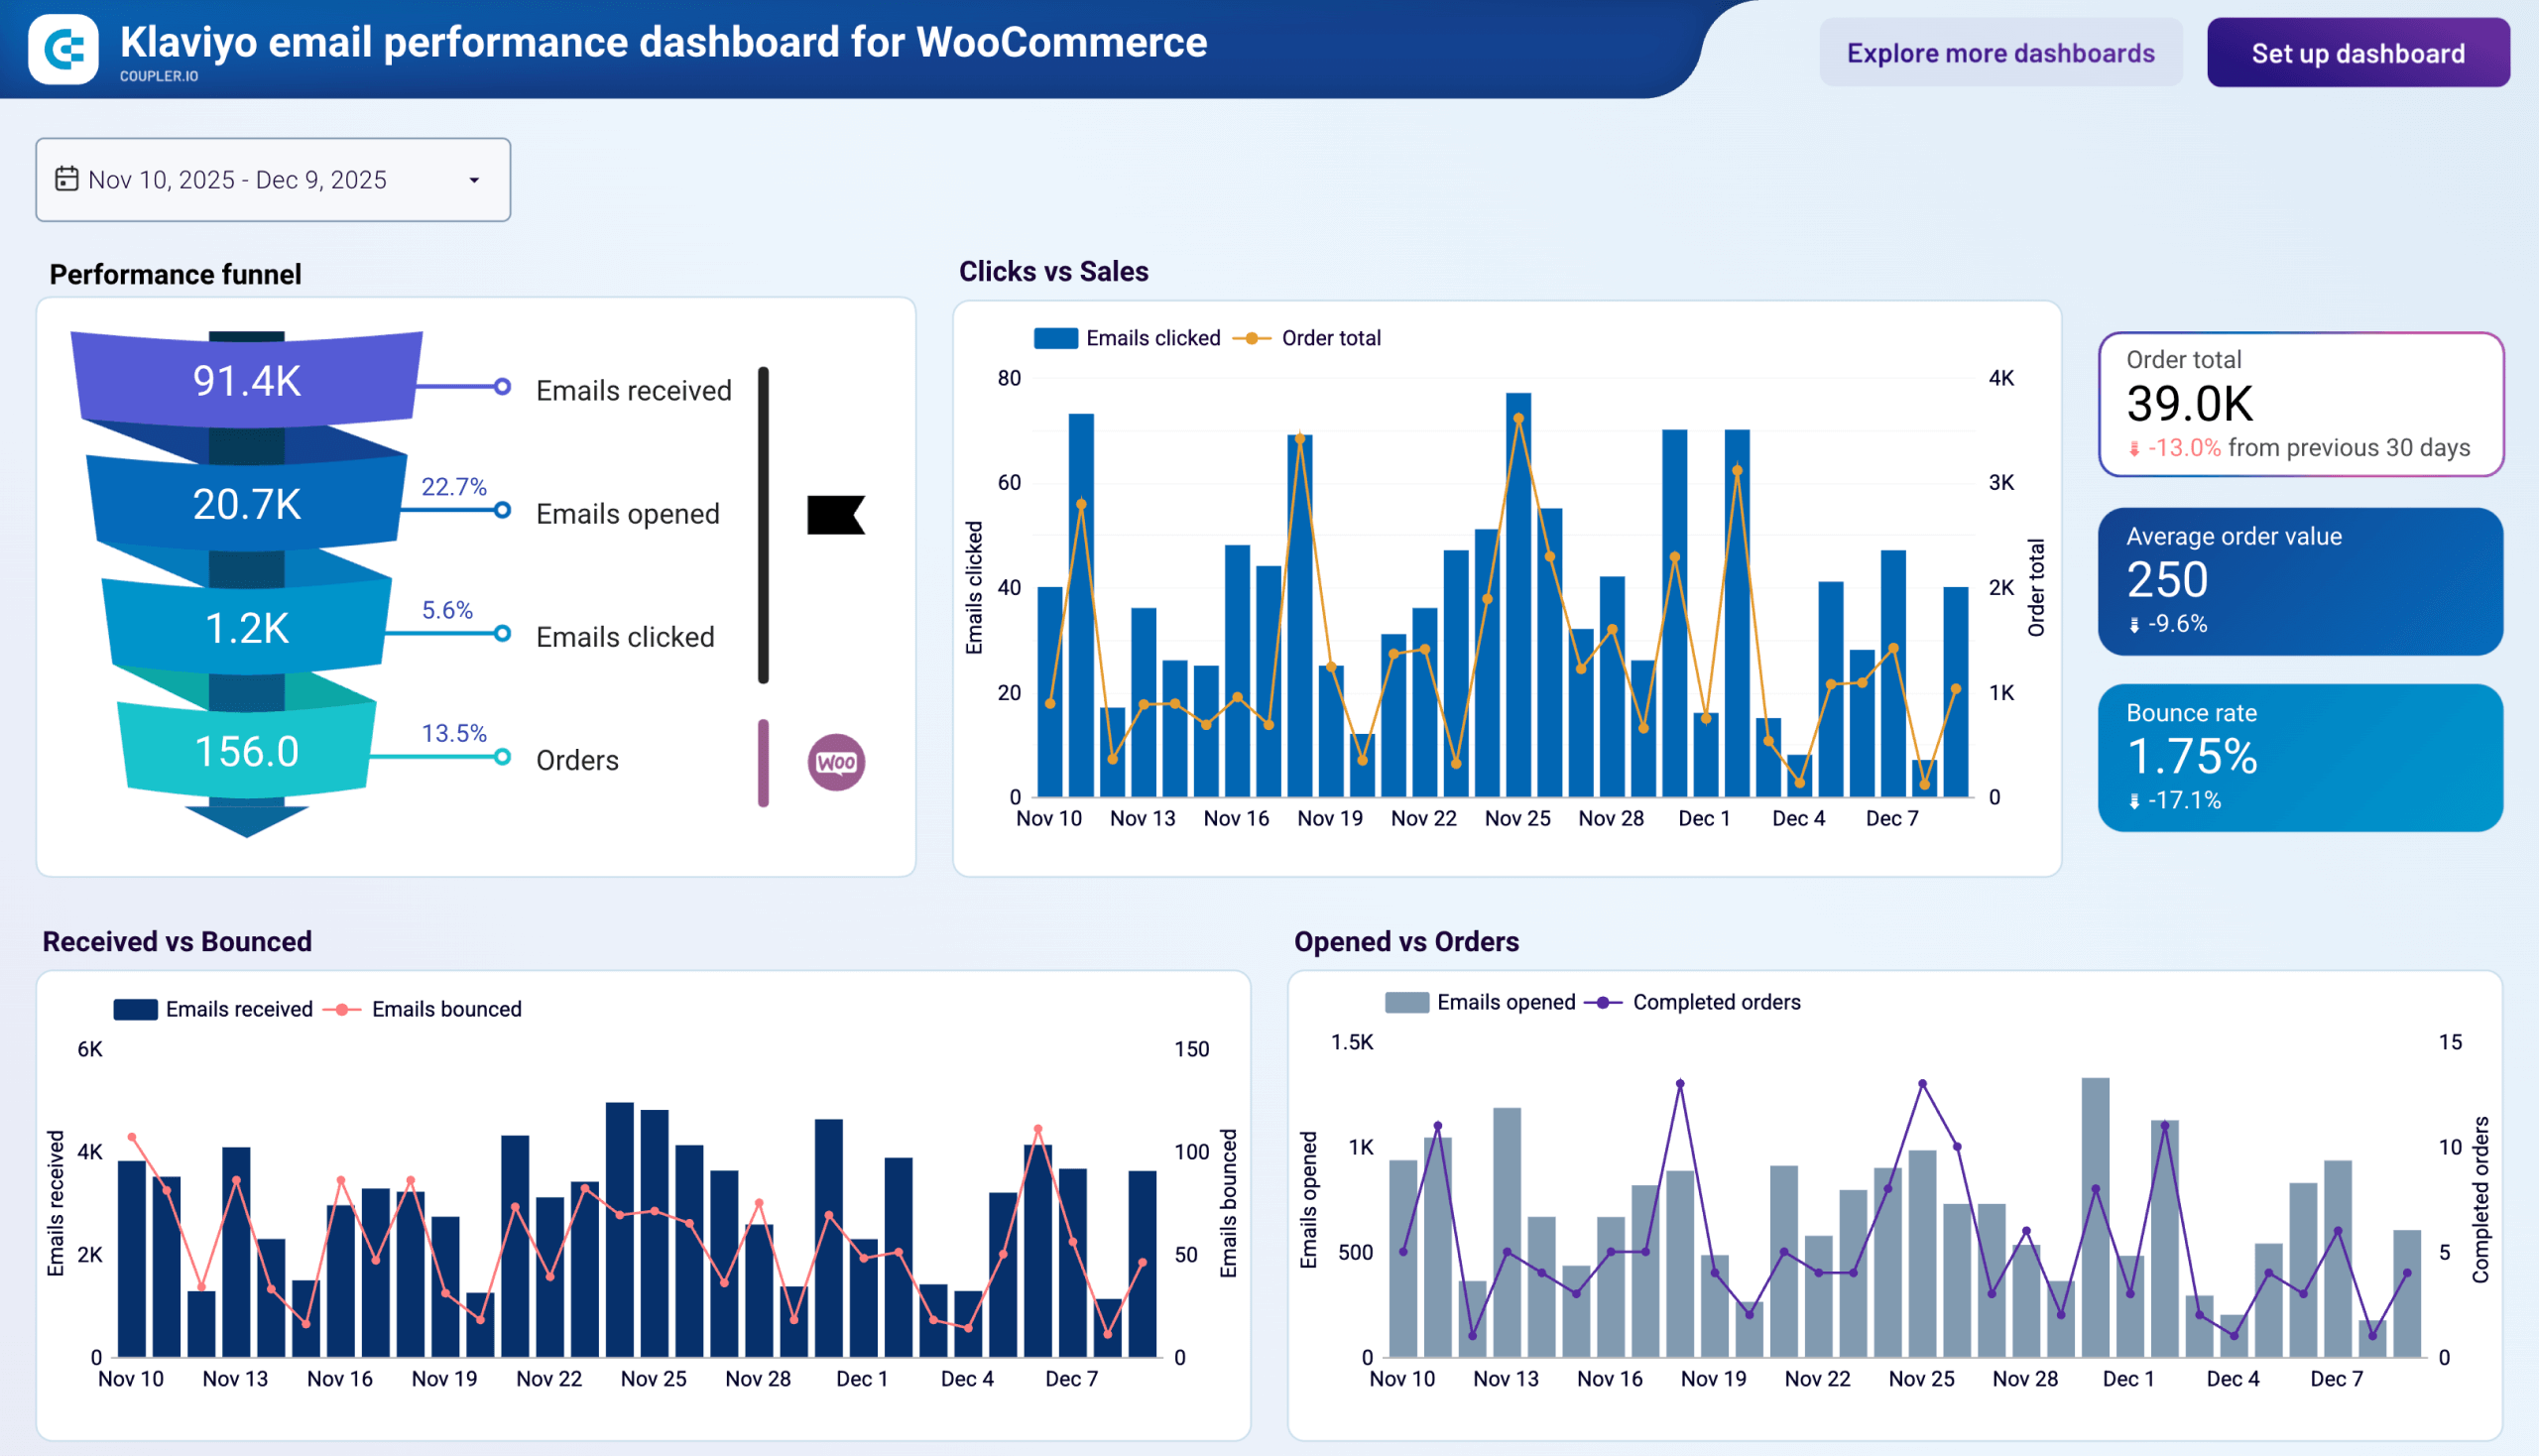
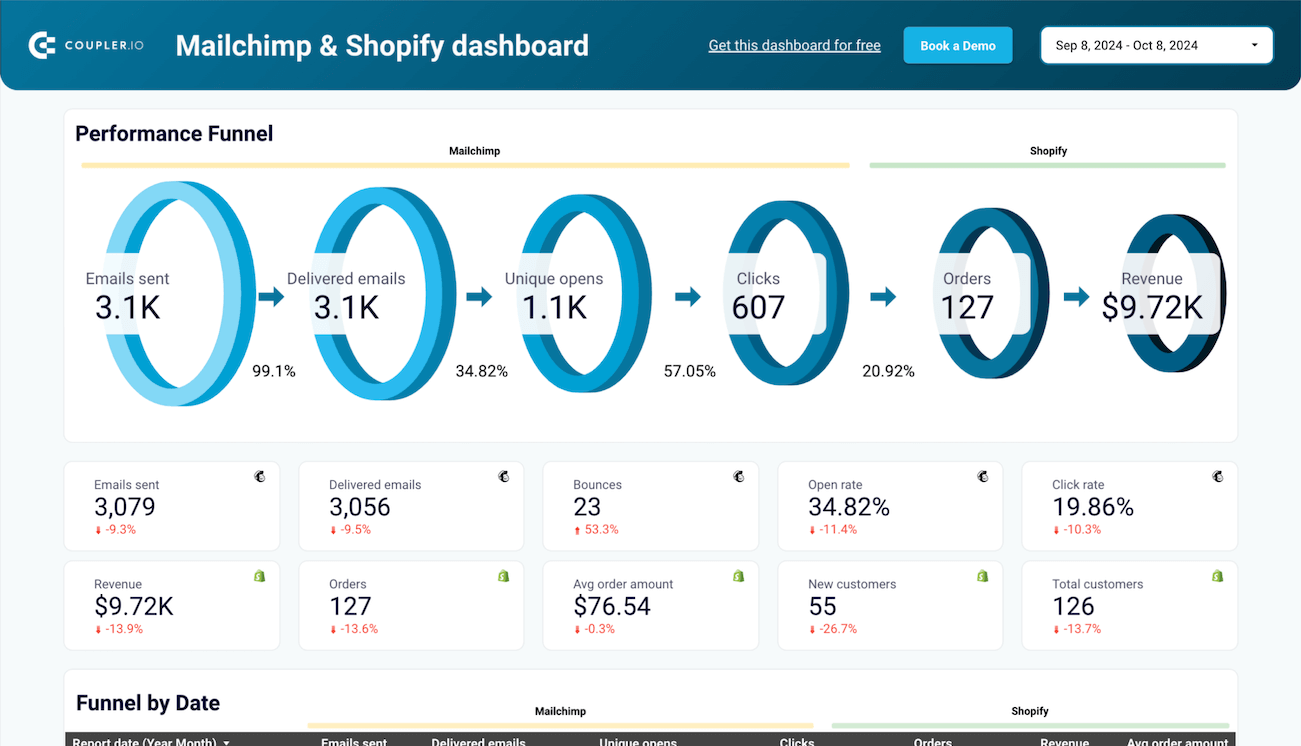
#36. Klaviyo email performance dashboard for WooCommerce/Shopify (+ template)
Klaviyo shows you email engagement. WooCommerce shows you orders. But neither platform shows you both together. This dashboard combines data from Klaviyo and WooCommerce into one report, so you can trace the line from an email send all the way through to a completed purchase.
Klaviyo email performance dashboard for WooCommerce
 Preview dashboard
Klaviyo email performance dashboard for WooCommerce
Preview dashboardThe template is especially helpful for spotting mismatches between engagement and revenue. You might have a campaign with strong open rates that generates almost no orders. The dashboard also tracks daily bounce counts alongside delivery volume, so you can catch list hygiene issues before they snowball into deliverability problems. If you’re trying to optimize your send calendar, a day-of-week open rate breakdown shows which days your subscribers are most responsive.
In addition to WooCommerce, Coupler.io also provides a Klaviyo dashboard for Shopify.


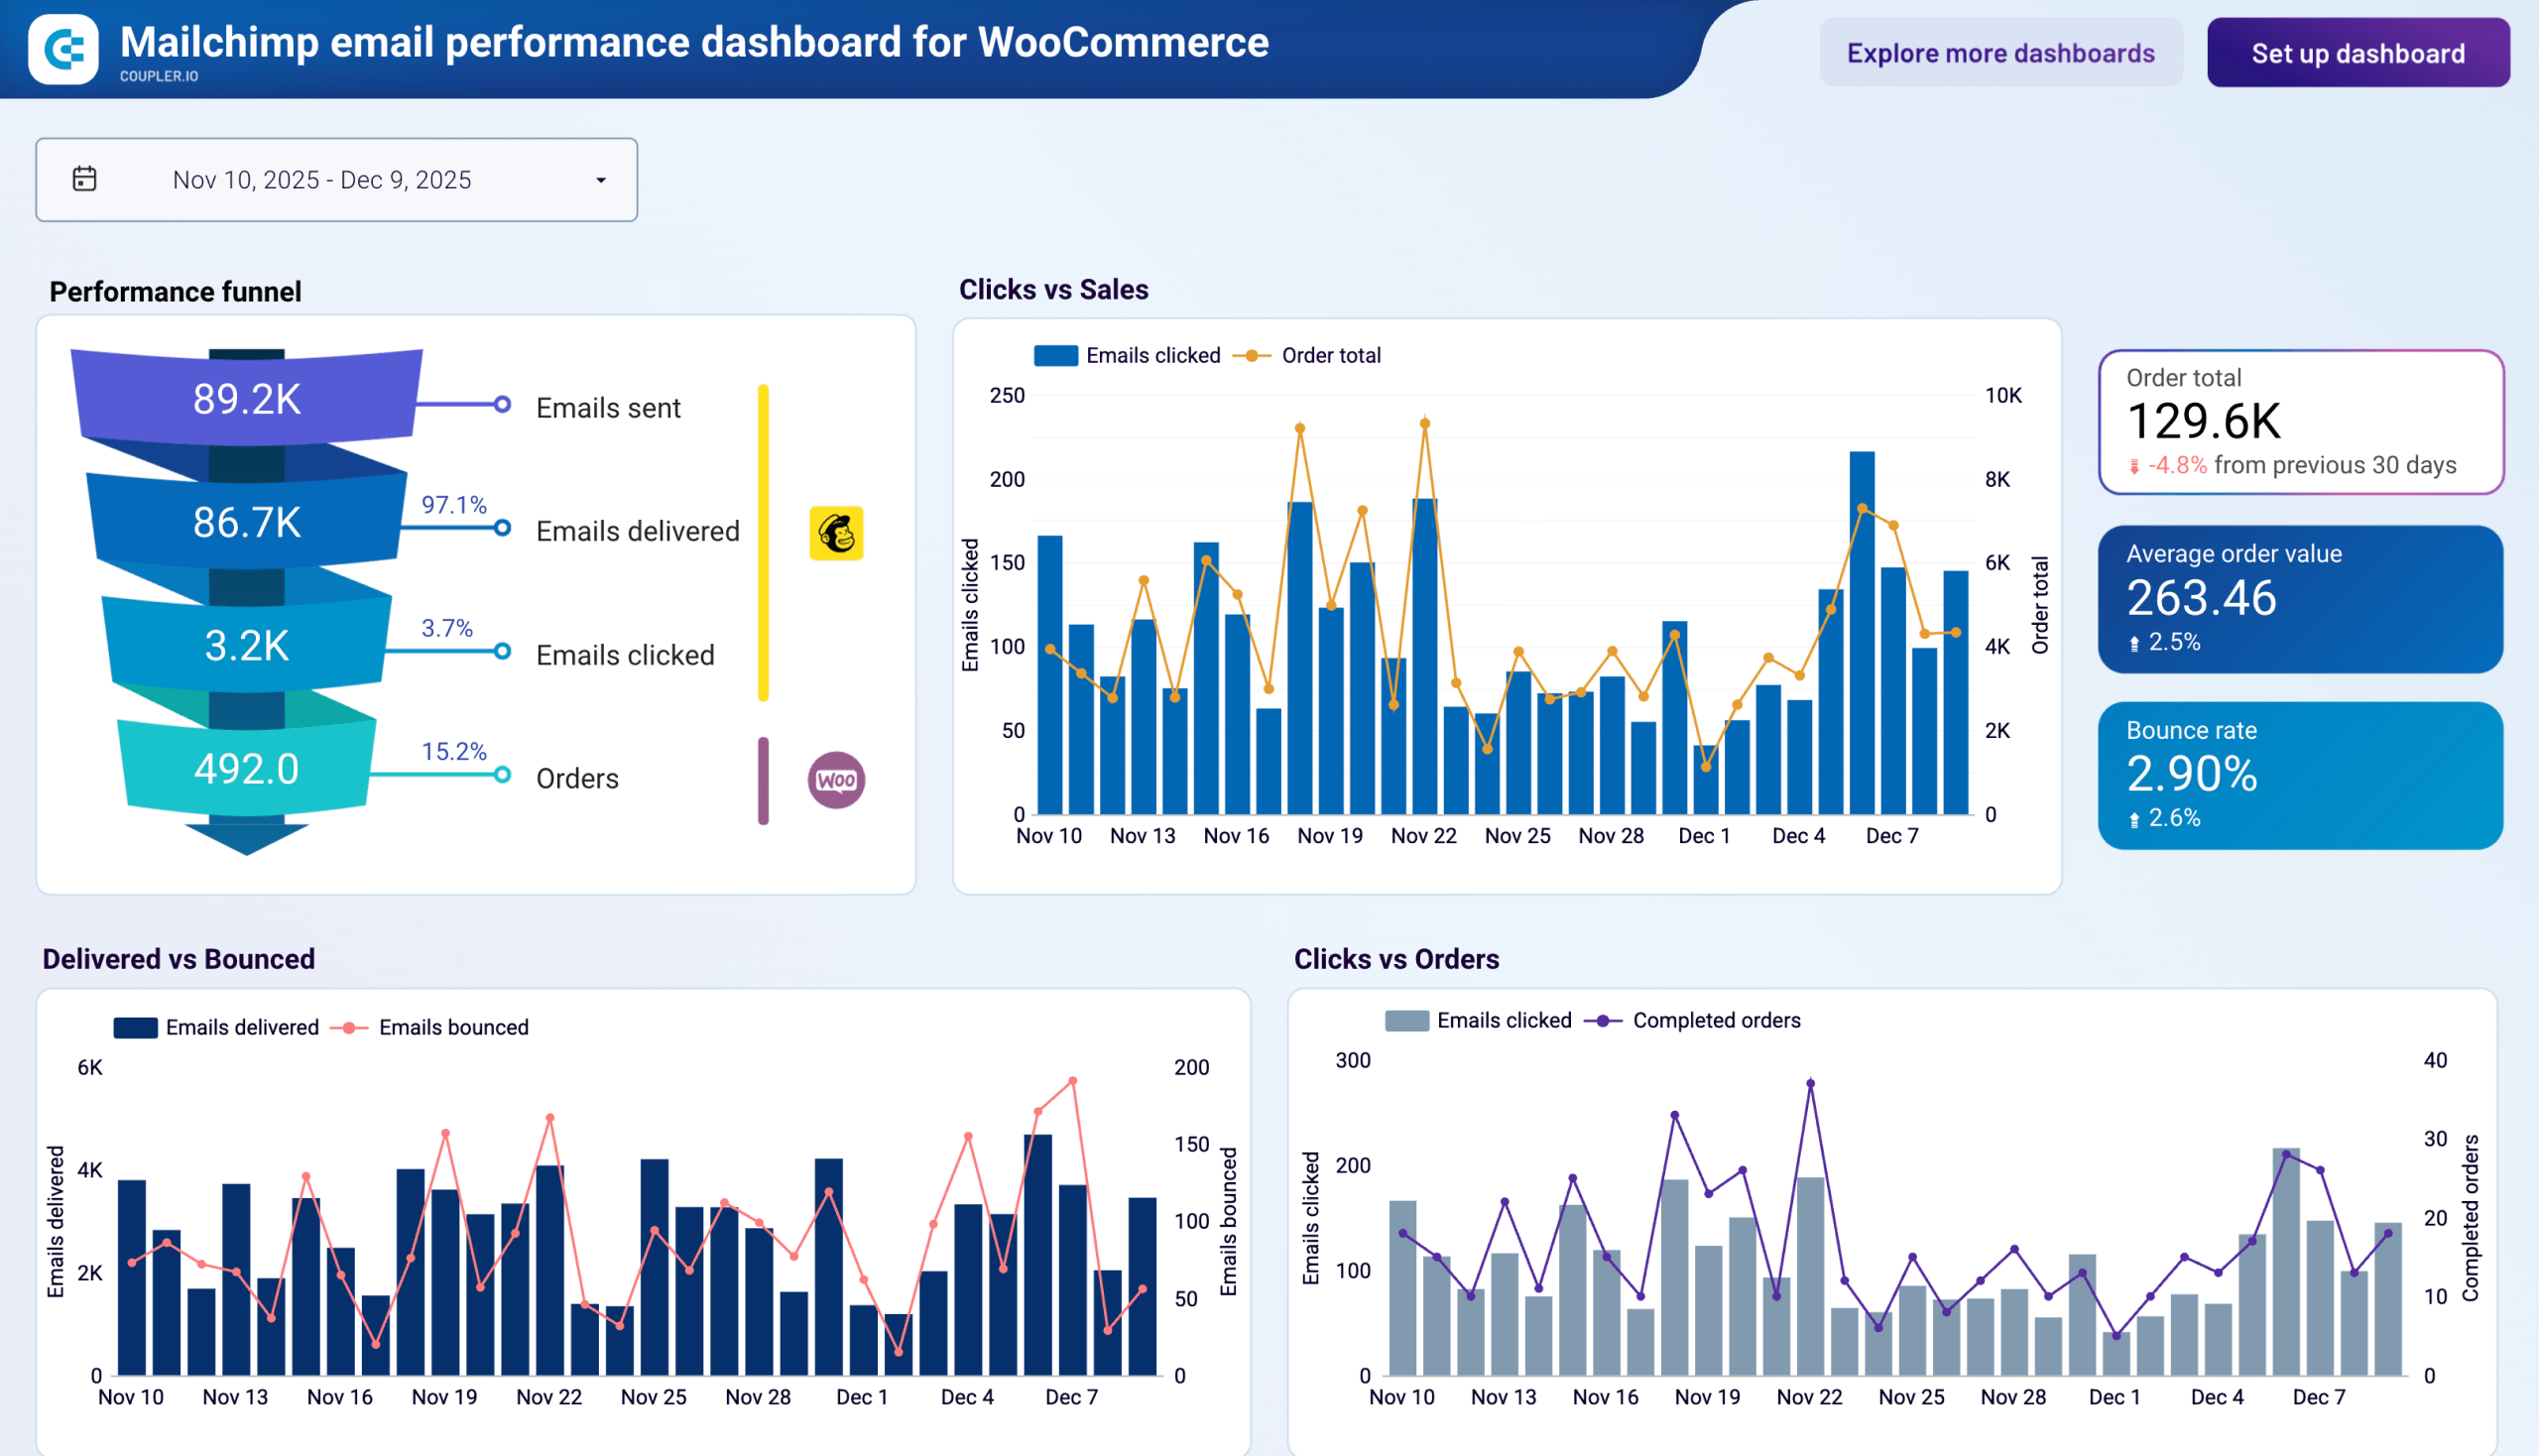
#37. Mailchimp email performance dashboard for WooCommerce/Shopify (+ template)
If you run a WooCommerce store and use Mailchimp for email campaigns, this dashboard ties the two together so you can see how email activity drives actual store revenue. It’s worth noting that Mailchimp’s API handles open data differently than other ESPs, so the dashboard is built around delivery, clicks, and order outcomes — the metrics you can trust.
Mailchimp email performance dashboard for WooCommerce
 Preview dashboard
Mailchimp email performance dashboard for WooCommerce
Preview dashboardThe dashboard also plots daily clicks against daily order totals on the same timeline, which can reveal patterns you wouldn’t notice in either platform alone. For example, if order peaks consistently trail click peaks by a day or two, your revenue attribution window might be set too tight — and you could be undervaluing campaigns that actually pay off.
In addition to WooCommerce, Coupler.io also provides a Mailchimp dashboard for Shopify.

38. MailerLite campaign performance dashboard (+ template)
A consolidated view of engagement, deliverability, and content performance across all your MailerLite campaigns in one MailerLite campaign performance dashboard. It replaces the need to check campaign results one at a time inside the platform.
MailerLite campaign performance dashboard
 Preview dashboard
MailerLite campaign performance dashboard
Preview dashboardThe dashboard ranks your top campaigns by open rate and click rate side by side, so you can tell when a strong subject line masks weak body content. It also breaks down results by campaign type (Regular, Resend, A/B Split), which is useful for evaluating whether your resend strategy actually recovers missed opens. Sends with elevated bounce or spam rates are flagged automatically, giving you time to act before deliverability takes a hit.
The template is built in Looker Studio with a Coupler.io connector. Connect your MailerLite account to get started in a few minutes.
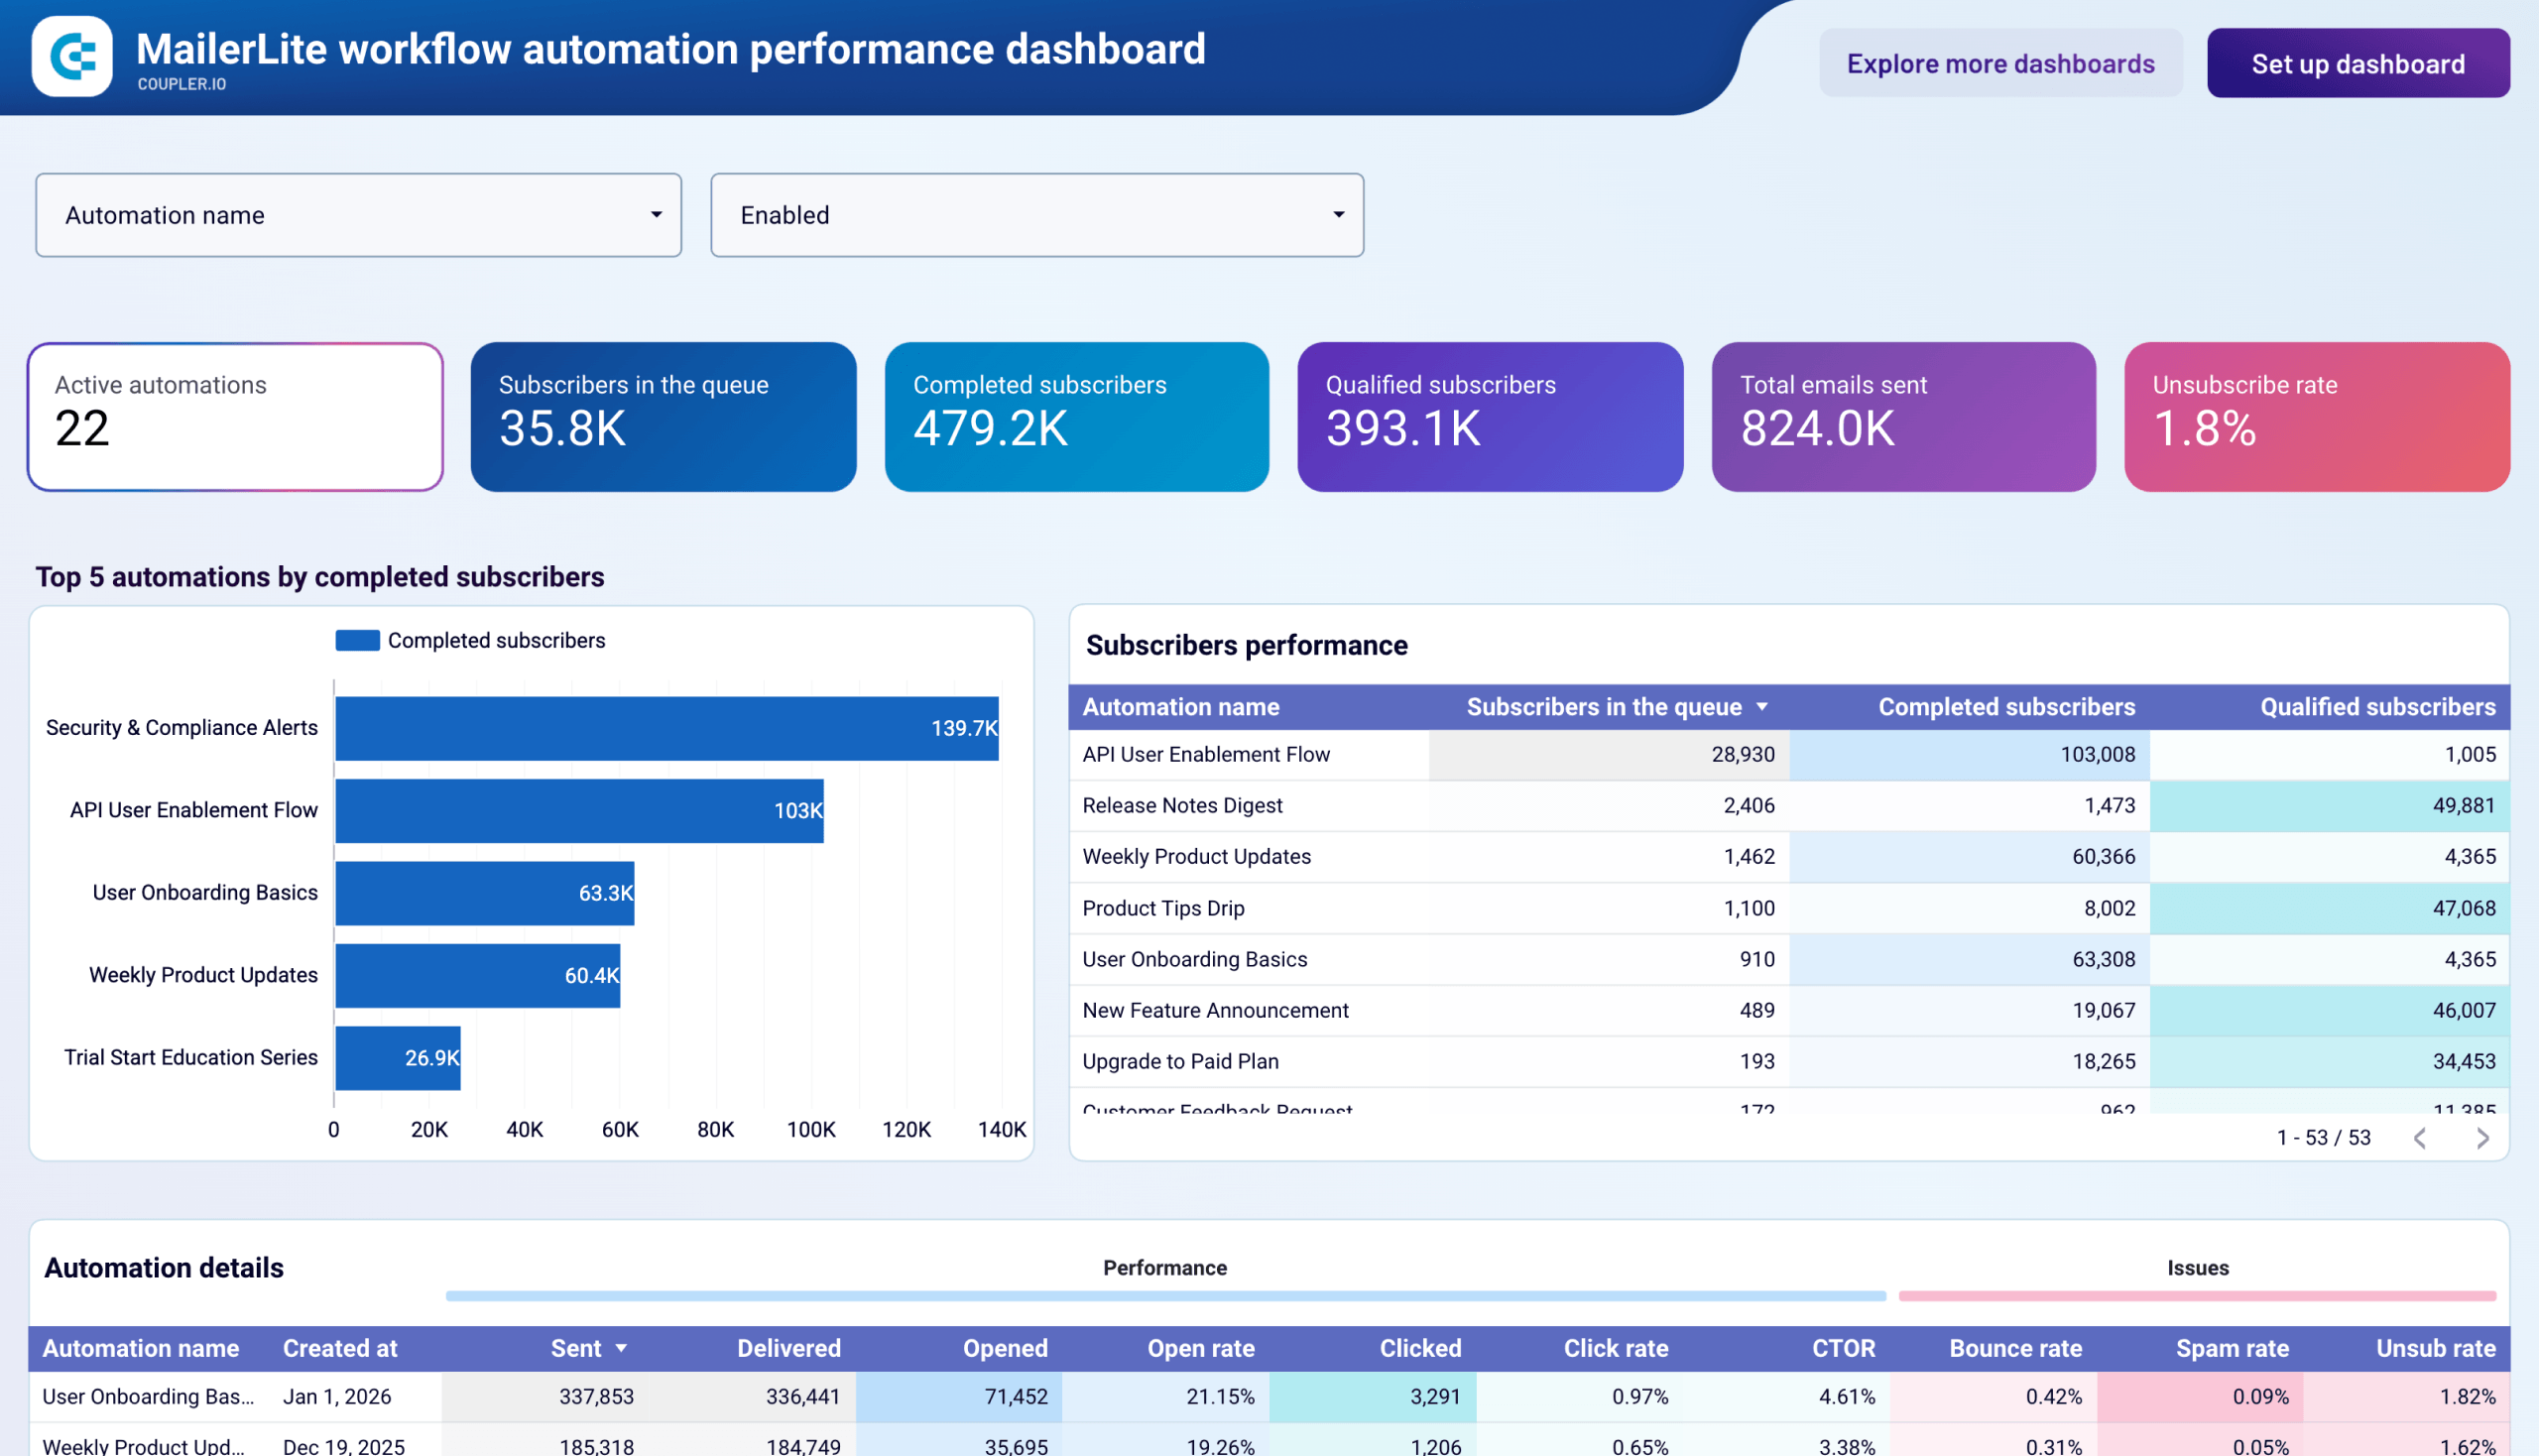
39. MailerLite workflow automation performance dashboard (+ template)
While campaign dashboards cover individual sends, the workflow automation performance dashboard monitors all your active MailerLite automations in one place. It tracks subscriber flow, engagement, and deliverability across every workflow so you can catch broken sequences and prioritize optimization.
MailerLite workflow automation performance dashboard
 Preview dashboard
MailerLite workflow automation performance dashboard
Preview dashboardThe dashboard lets you see which automations move subscribers toward a goal and which ones lose them mid-sequence. You can compare completion and qualification rates across all workflows to decide where your team’s optimization effort will have the most impact. The MailerLite dashboard also audits deliverability per automation, so a single problematic sequence doesn’t quietly damage your sender reputation.
The template is available in Looker Studio with a Coupler.io connector. Connect your MailerLite account to start monitoring your automations.
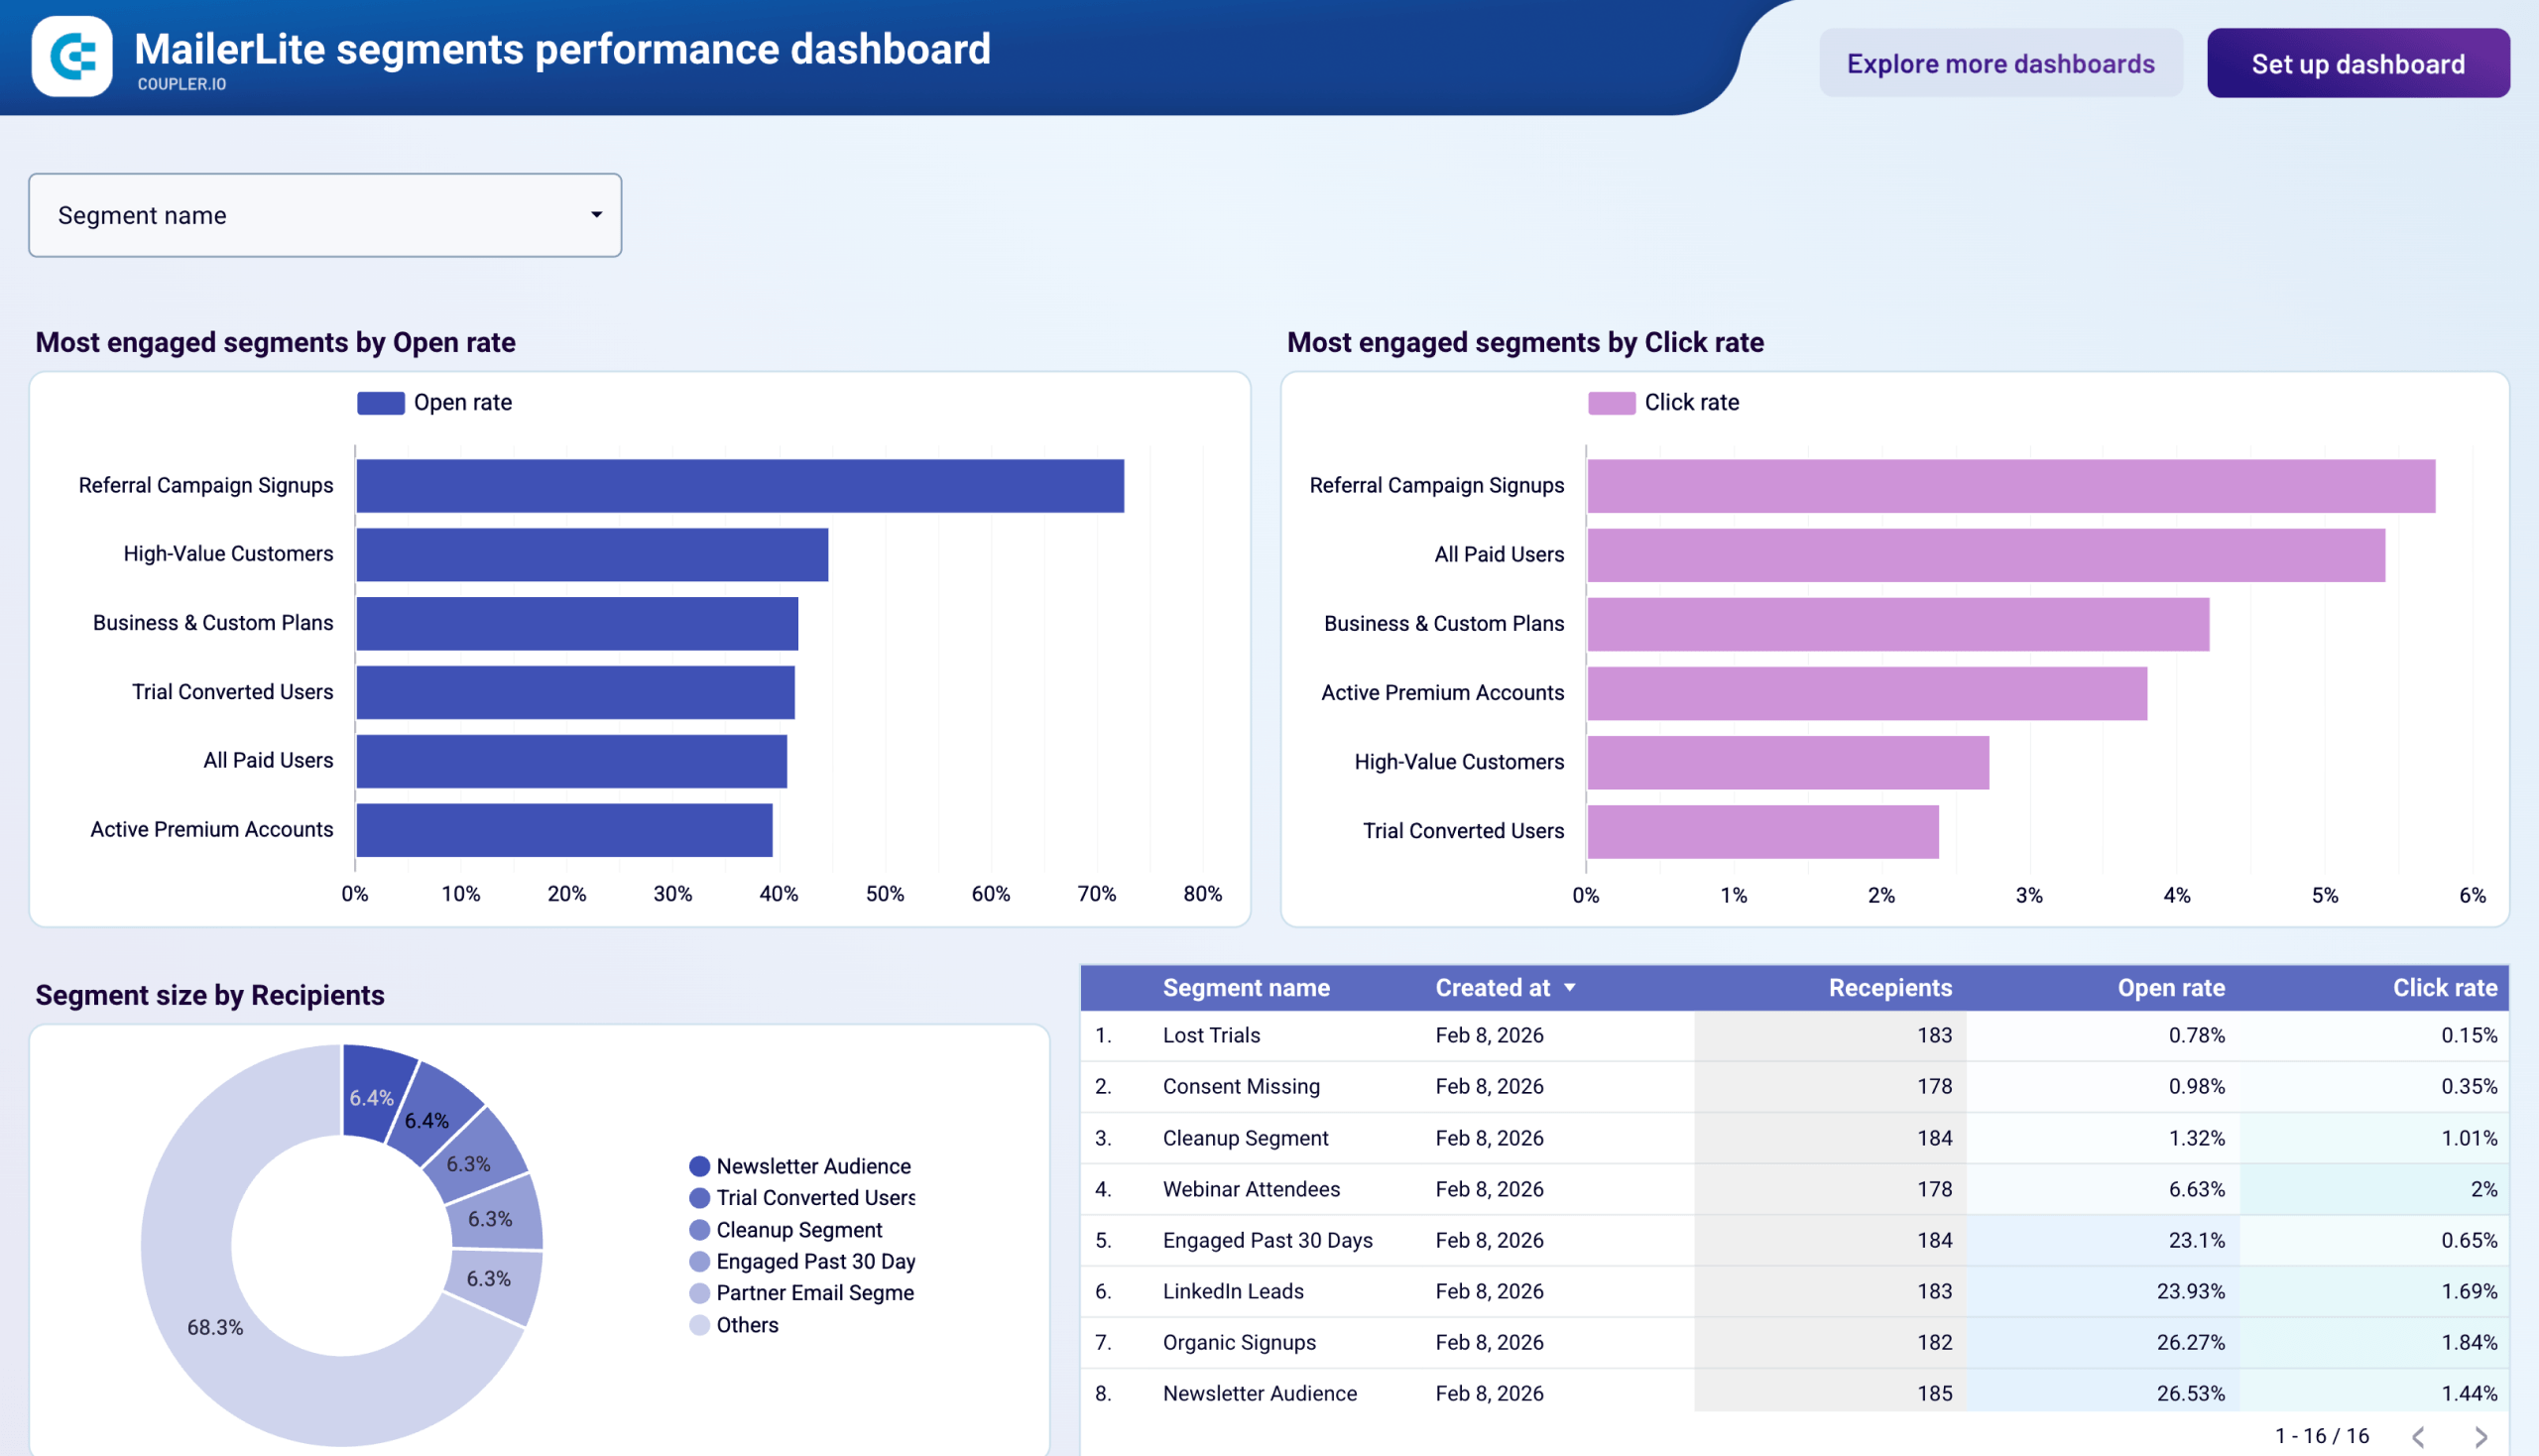
40. MailerLite segments performance dashboard (+ template)
This dashboard connects to MailerLite and shows how different subscriber segments respond to your email campaigns. Use it to separate your most engaged audiences from those that need re-engagement or list cleanup.
MailerLite segments performance dashboard
Preview dashboard
MailerLite segments performance dashboard
Preview dashboardYou can rank all segments by open rate and click rate and quickly spot which groups are worth dedicated content and which are hurting deliverability. The size breakdown prevents misleading conclusions: a tiny segment with a 60% open rate has less impact on your program than a mid-sized one at 30%. Filtering to a single segment is useful for tracking how a newly created audience performs over its first few campaigns.
Other marketing dashboard examples for experienced and newbie marketers
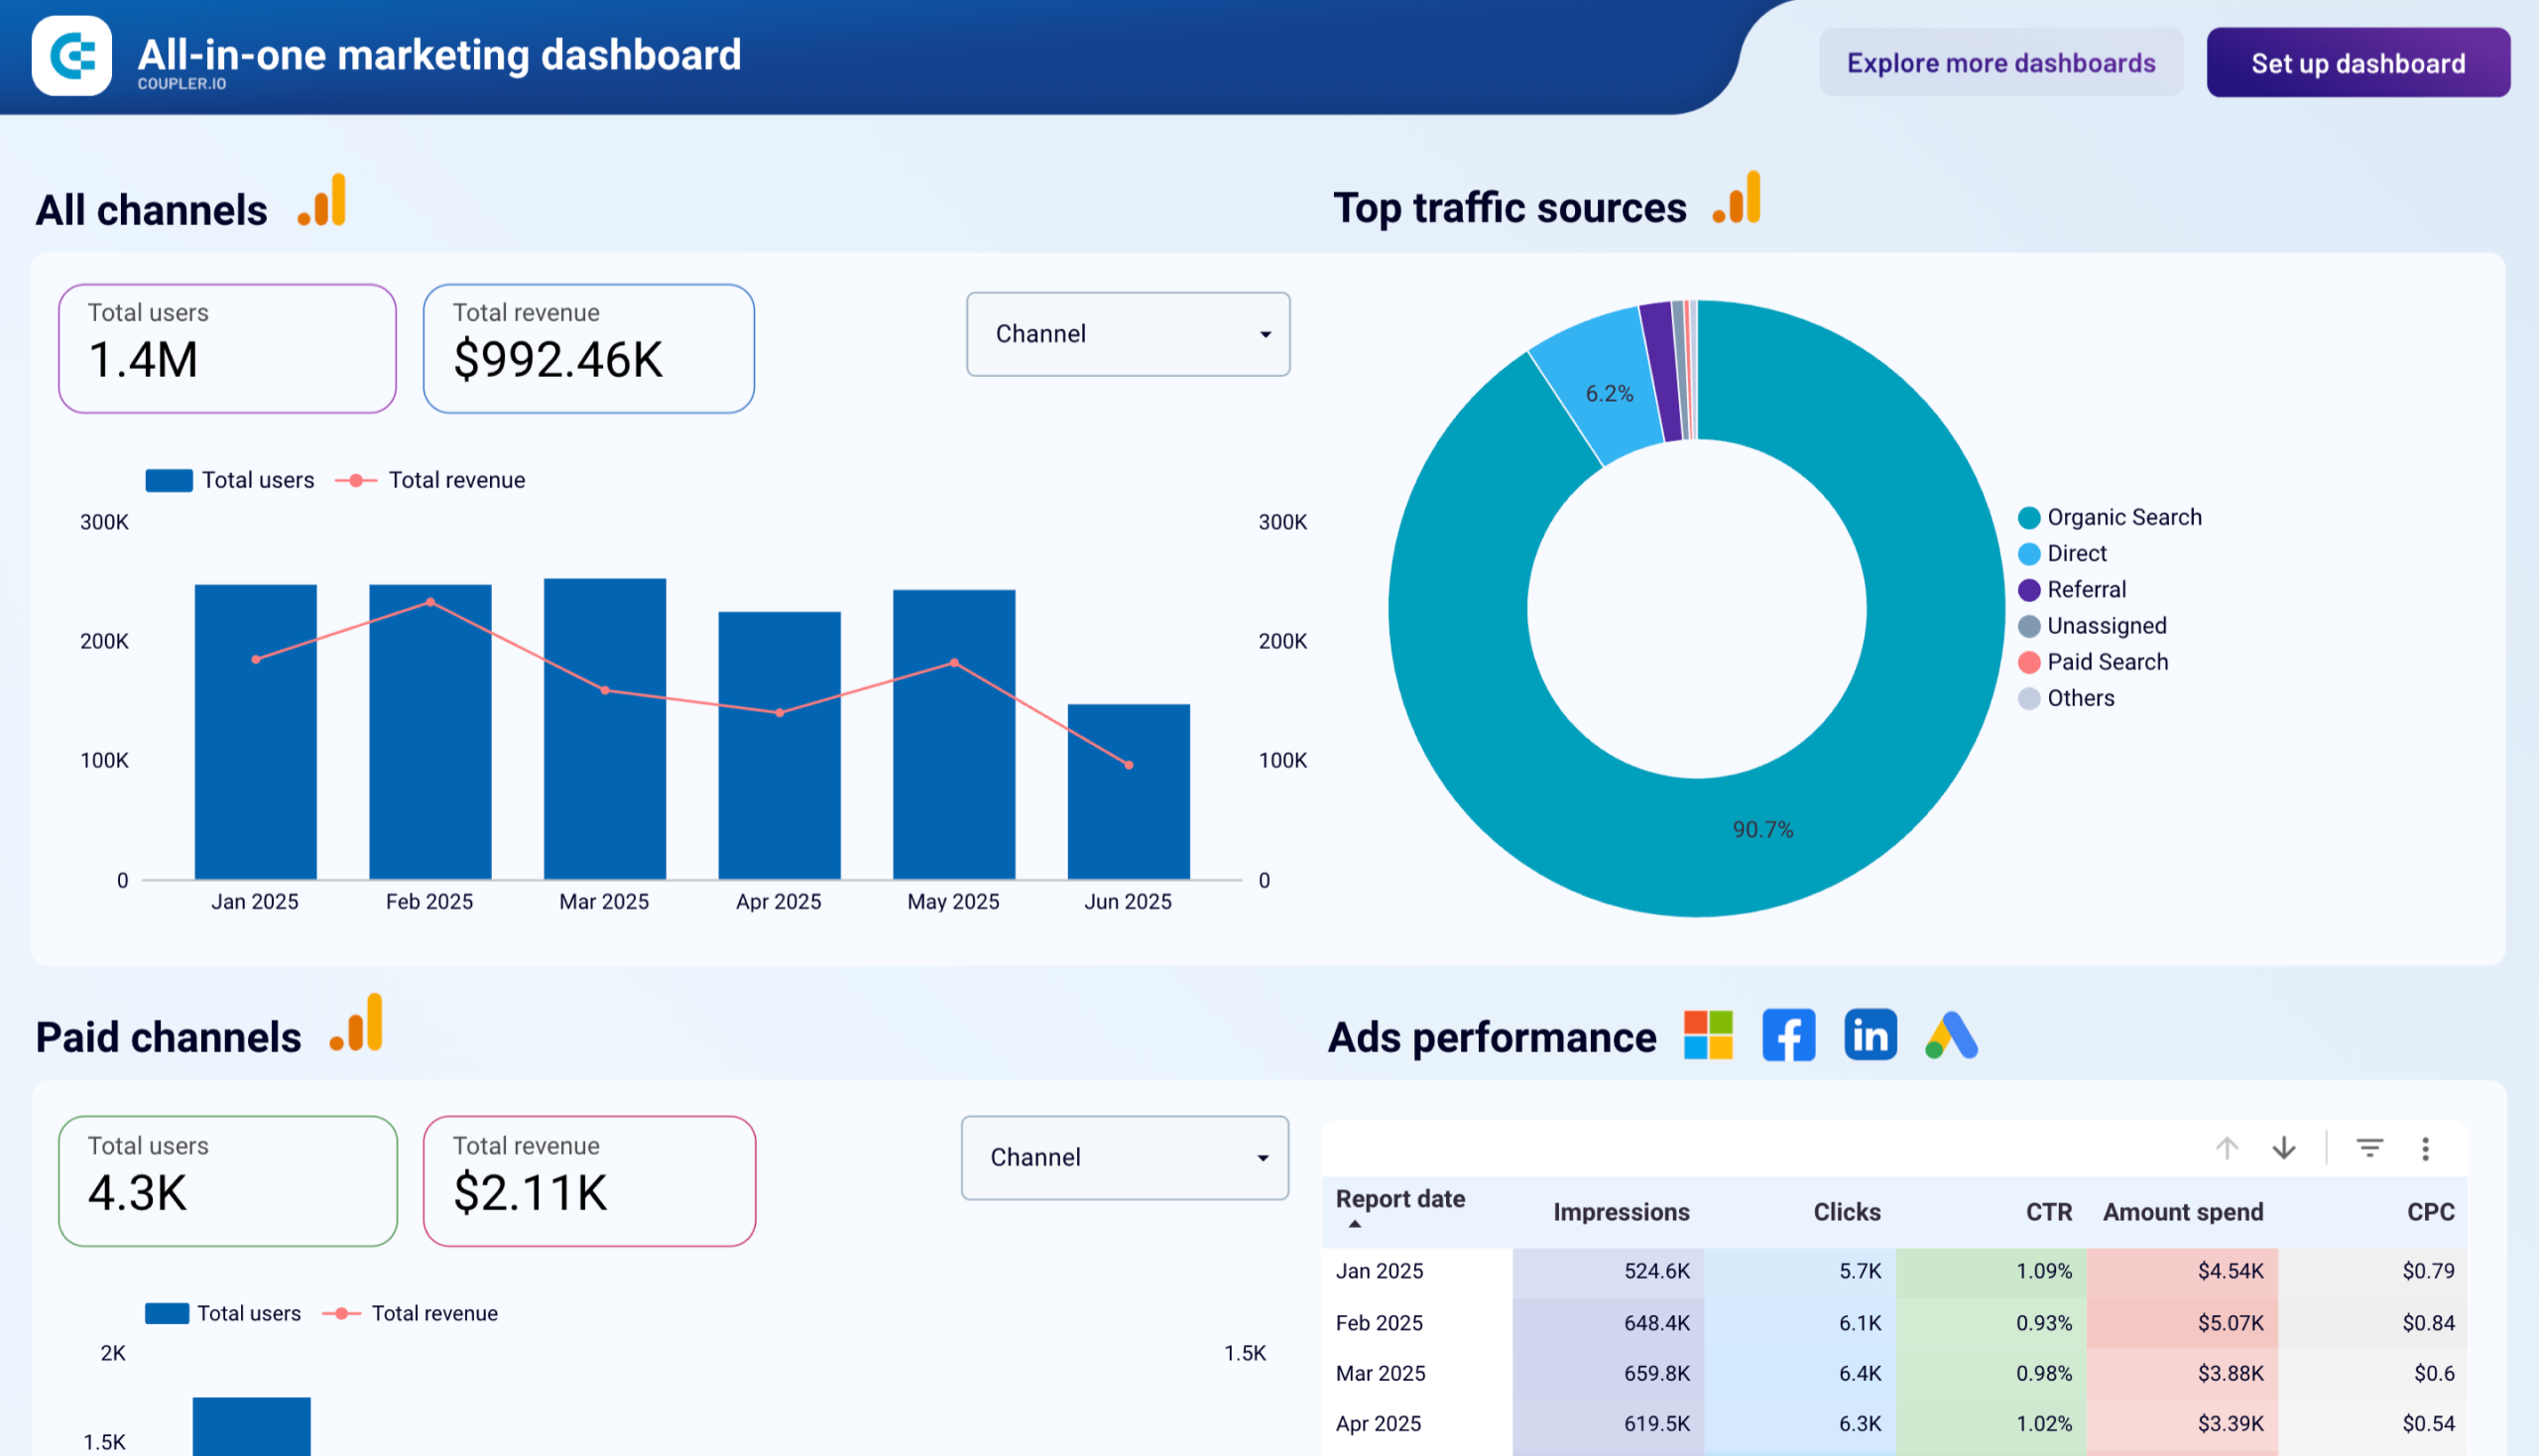
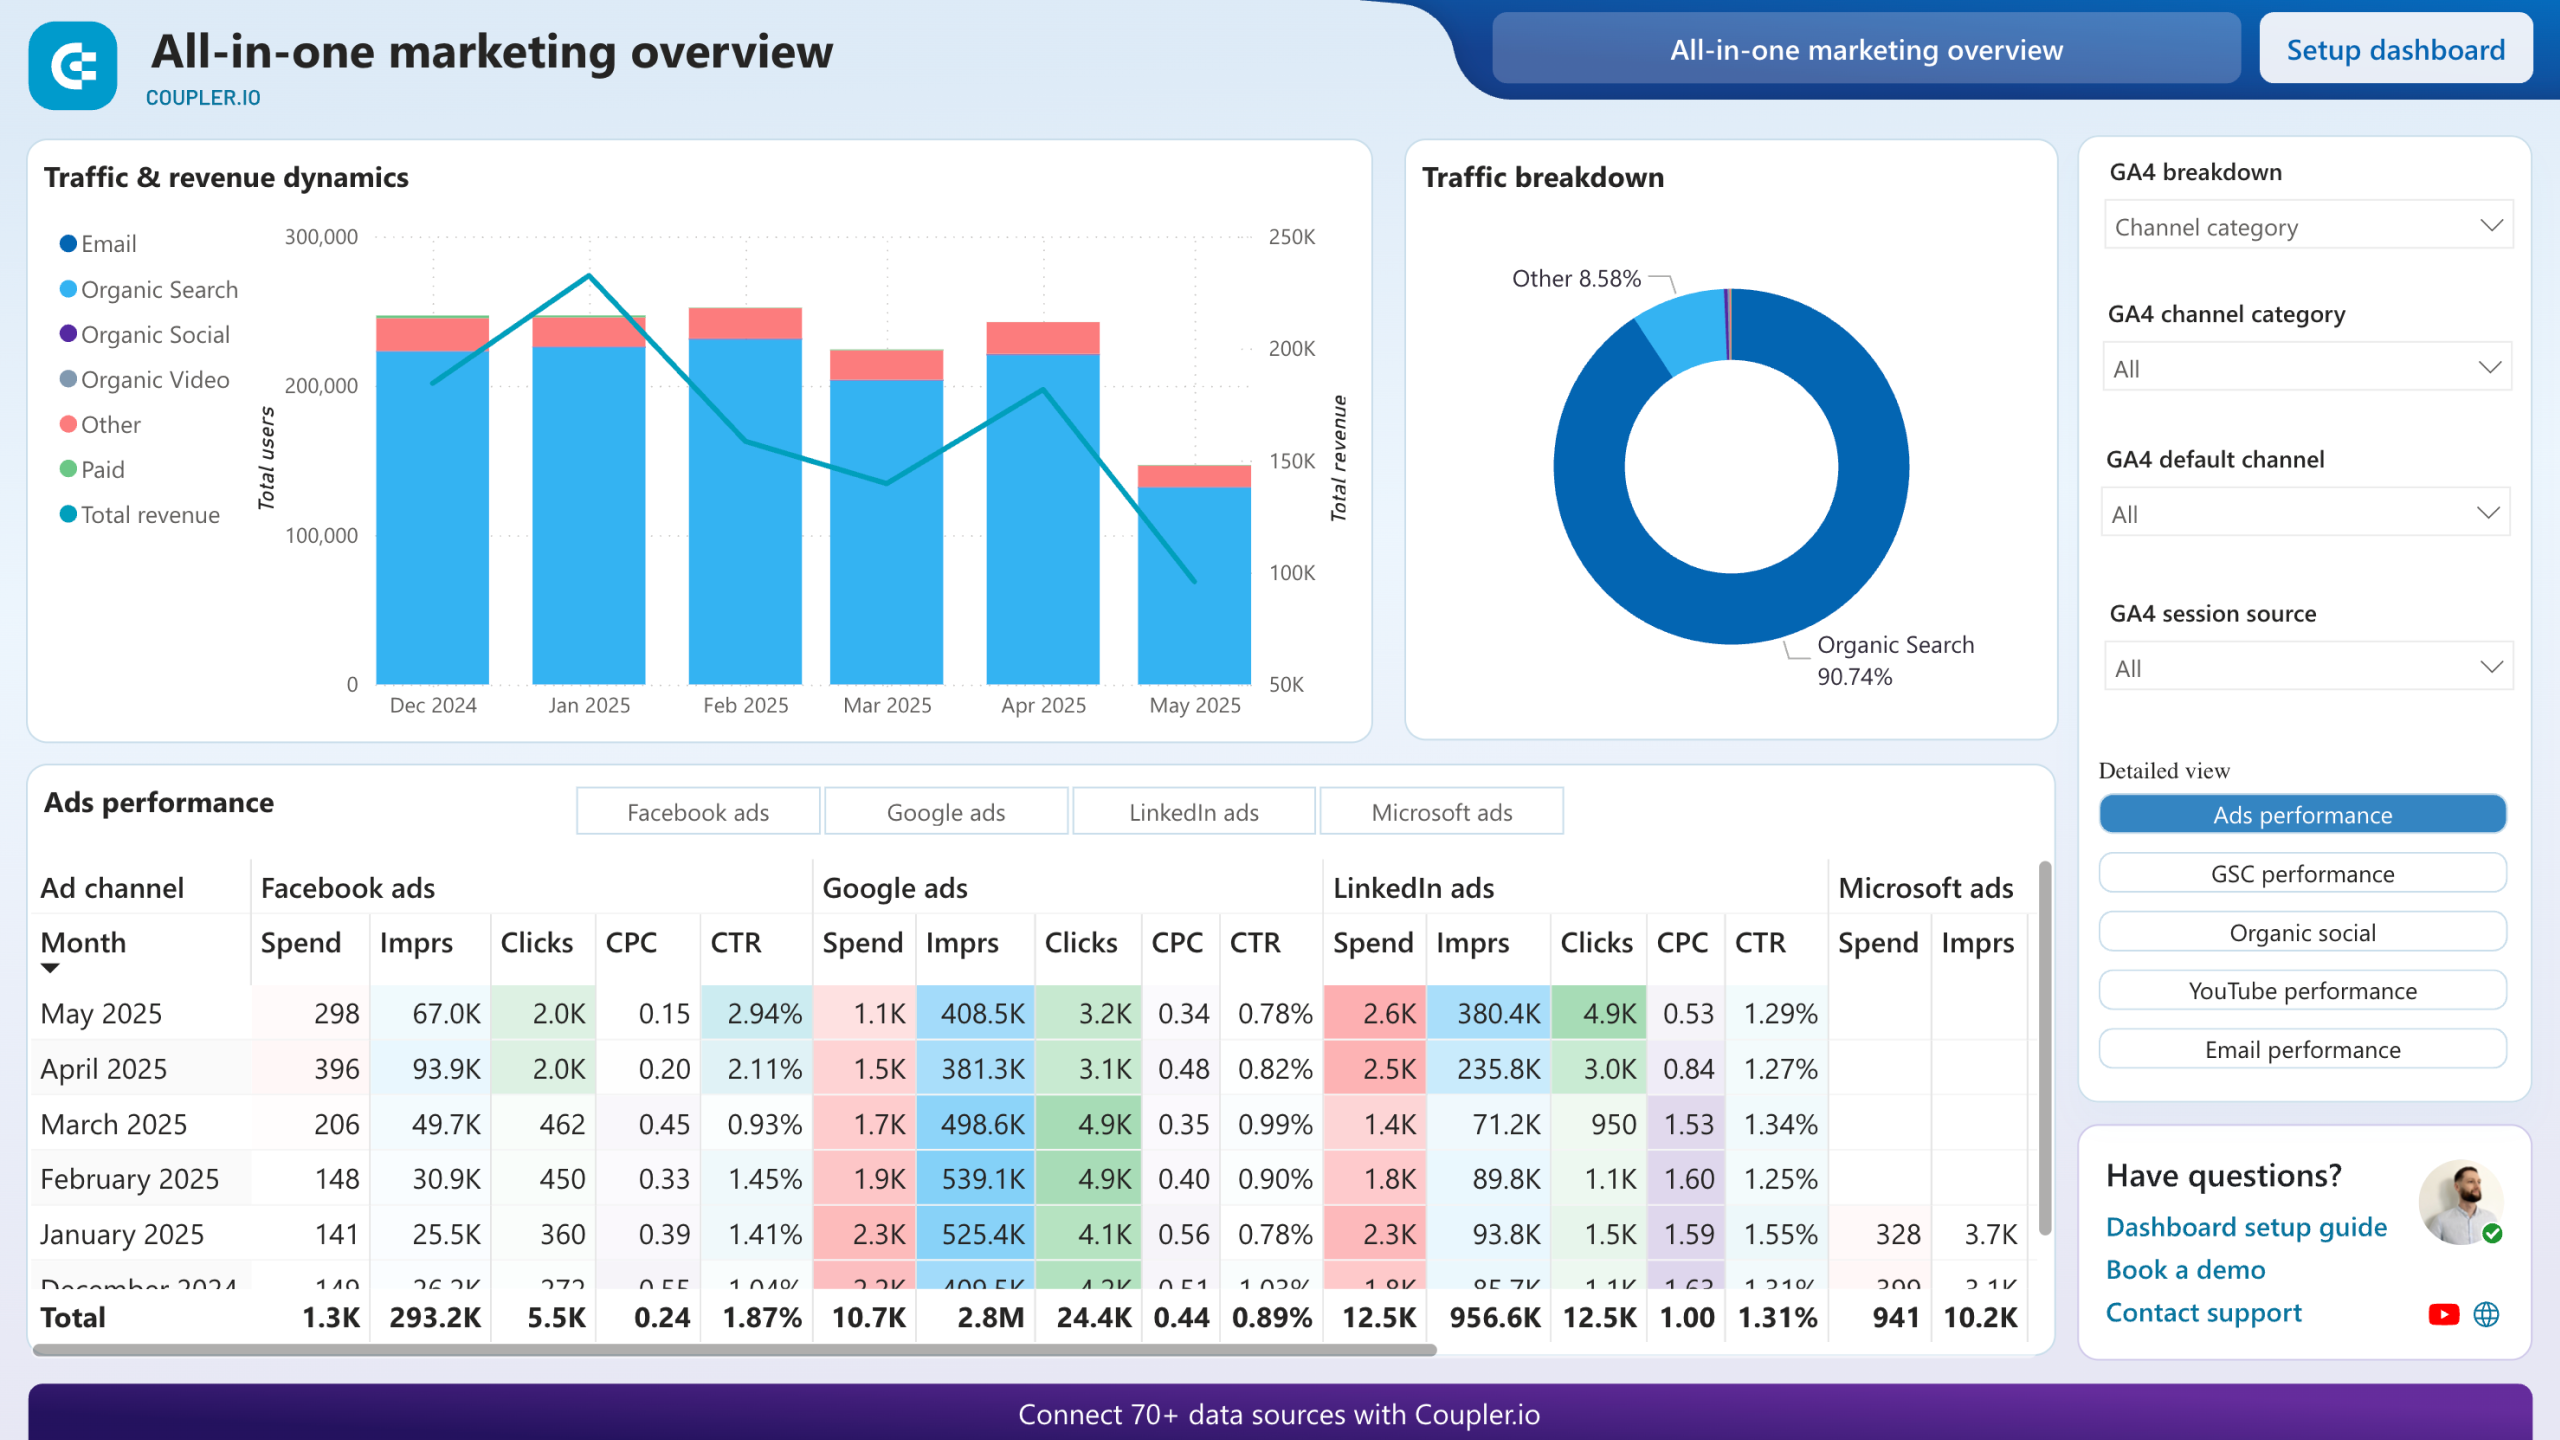
41. All-in-one marketing dashboard (+ template)

The dashboard provides a unified view of your marketing efforts across various channels. It integrates data from Google Analytics, Google Search Console, ad platforms, social media, email tools, and YouTube. So, you can monitor the performance of paid ads, organic searches, social media interactions, and email campaigns all in one place.
The dashboard is available in Coupler.io and as a template in Looker Studio and Power BI. Try it right away for free! Set up the dashboard by following instructions and transform raw marketing data into actionable insights.
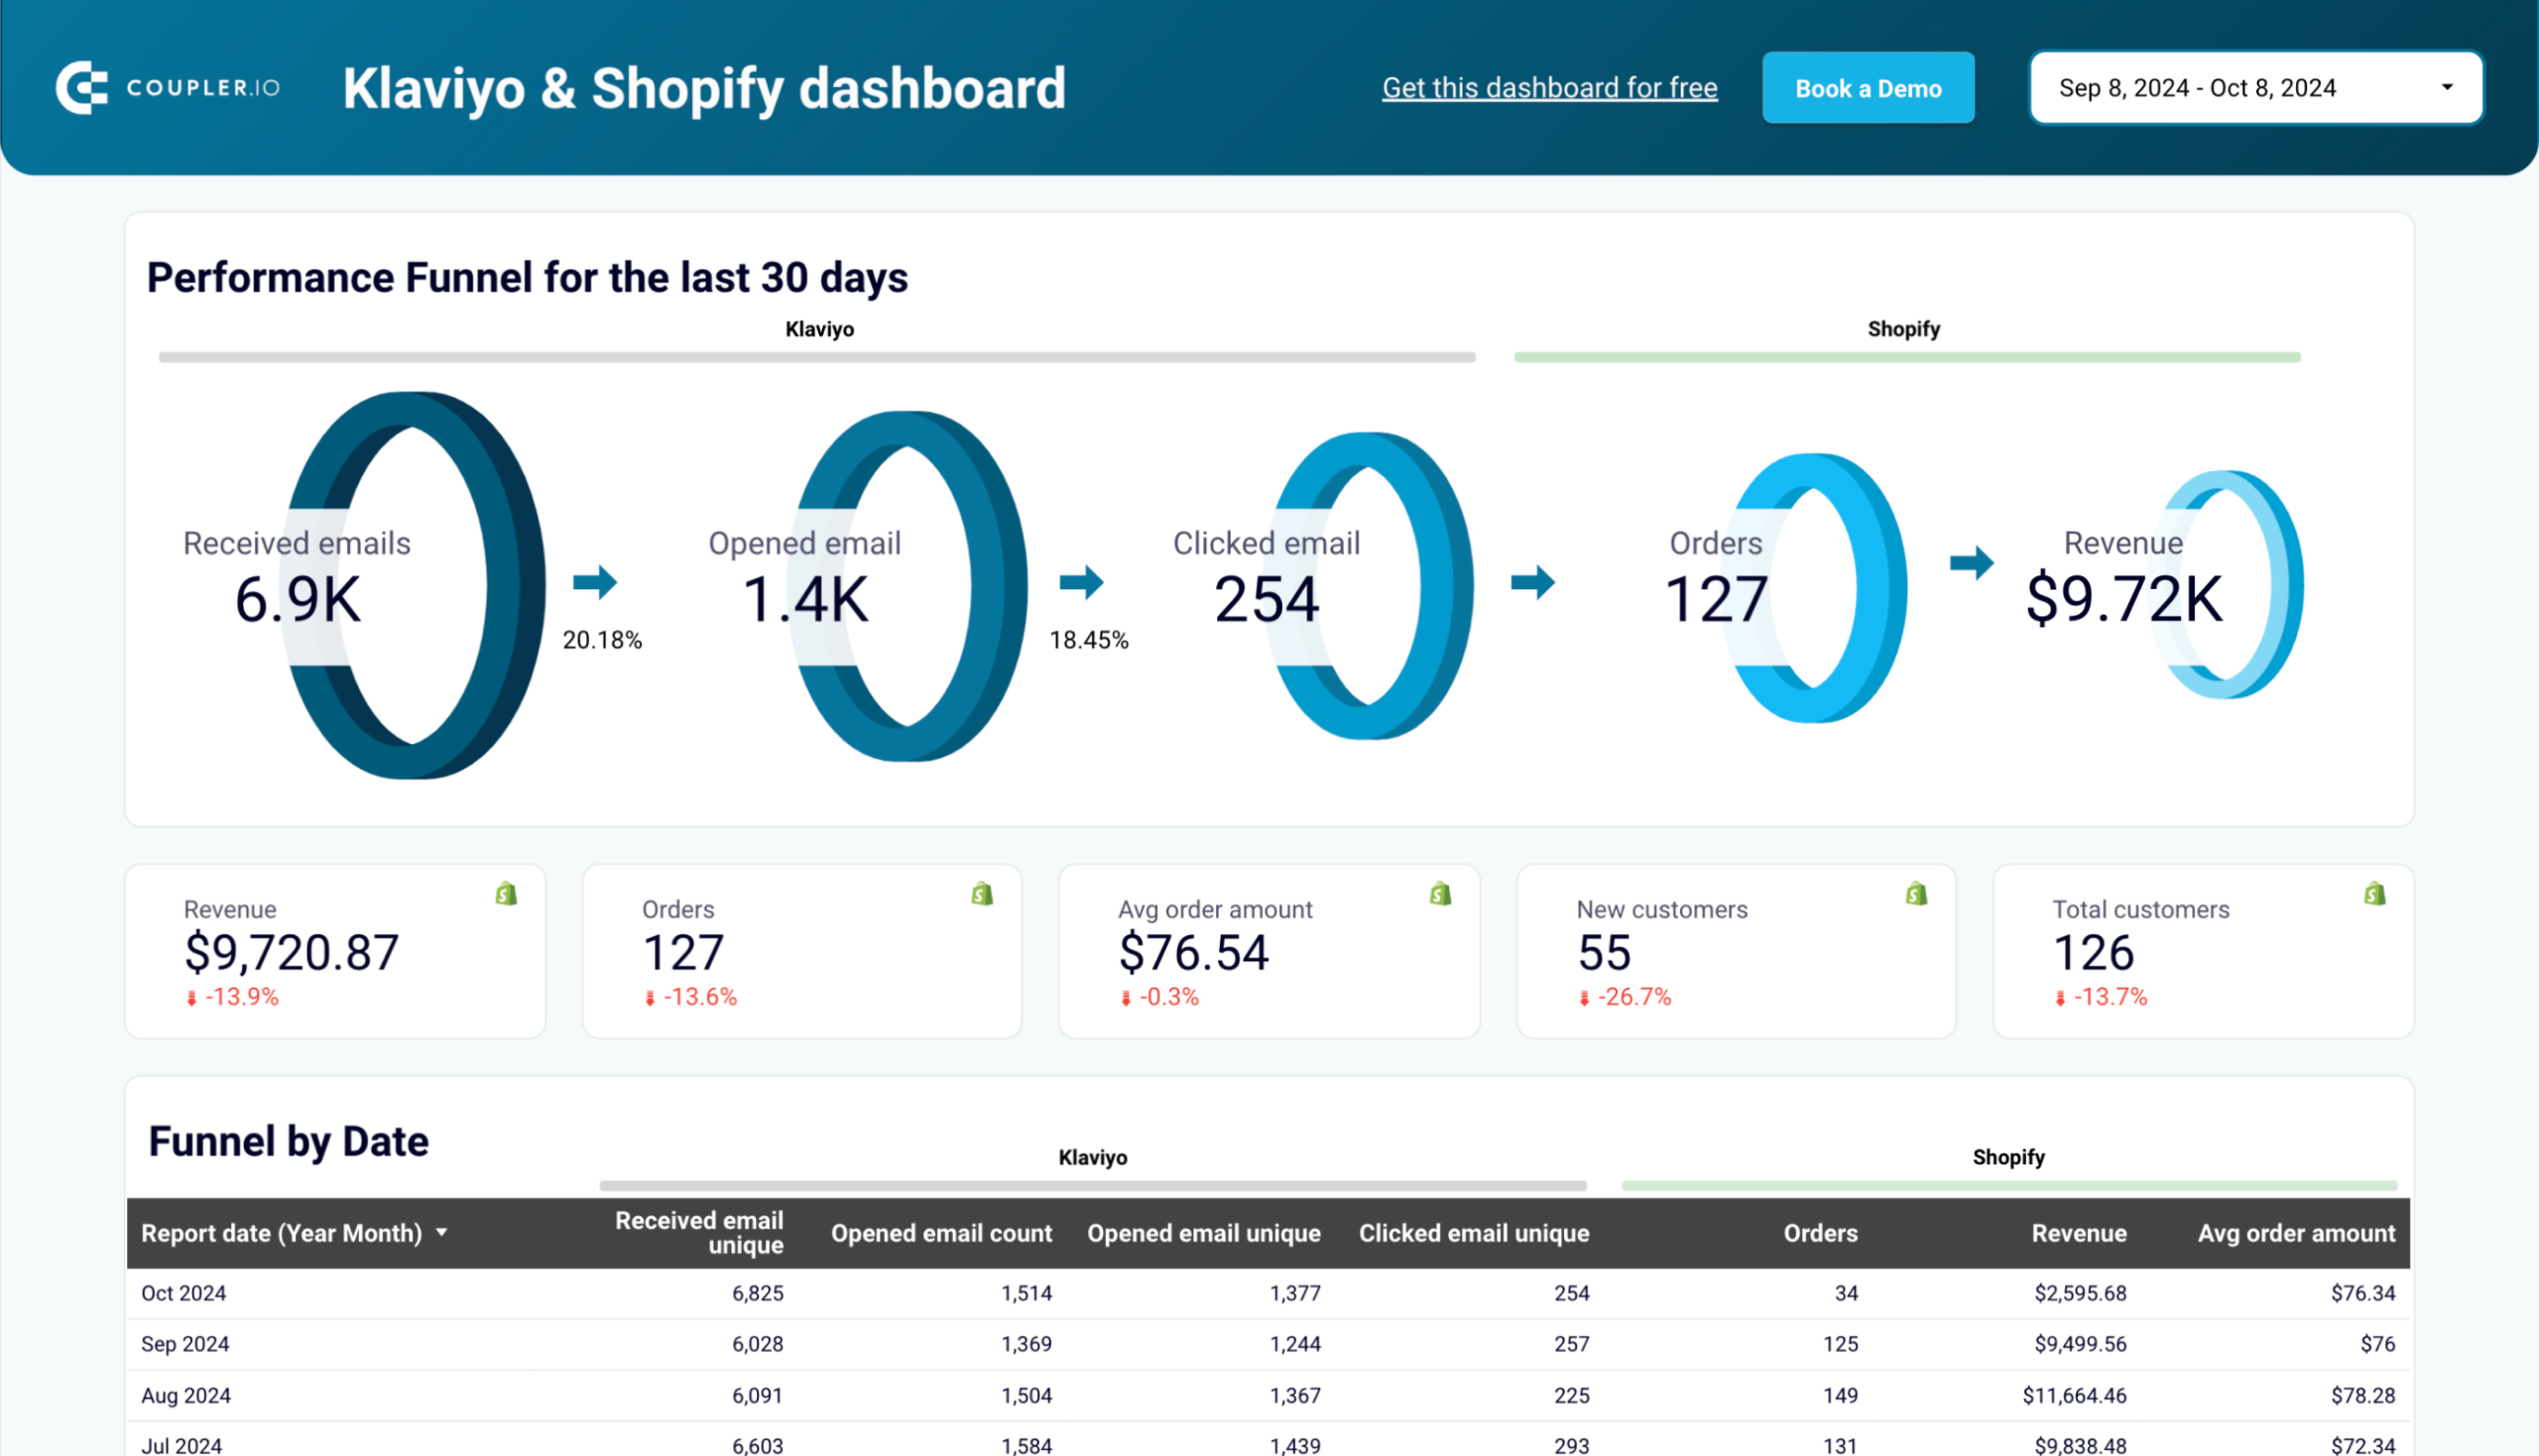
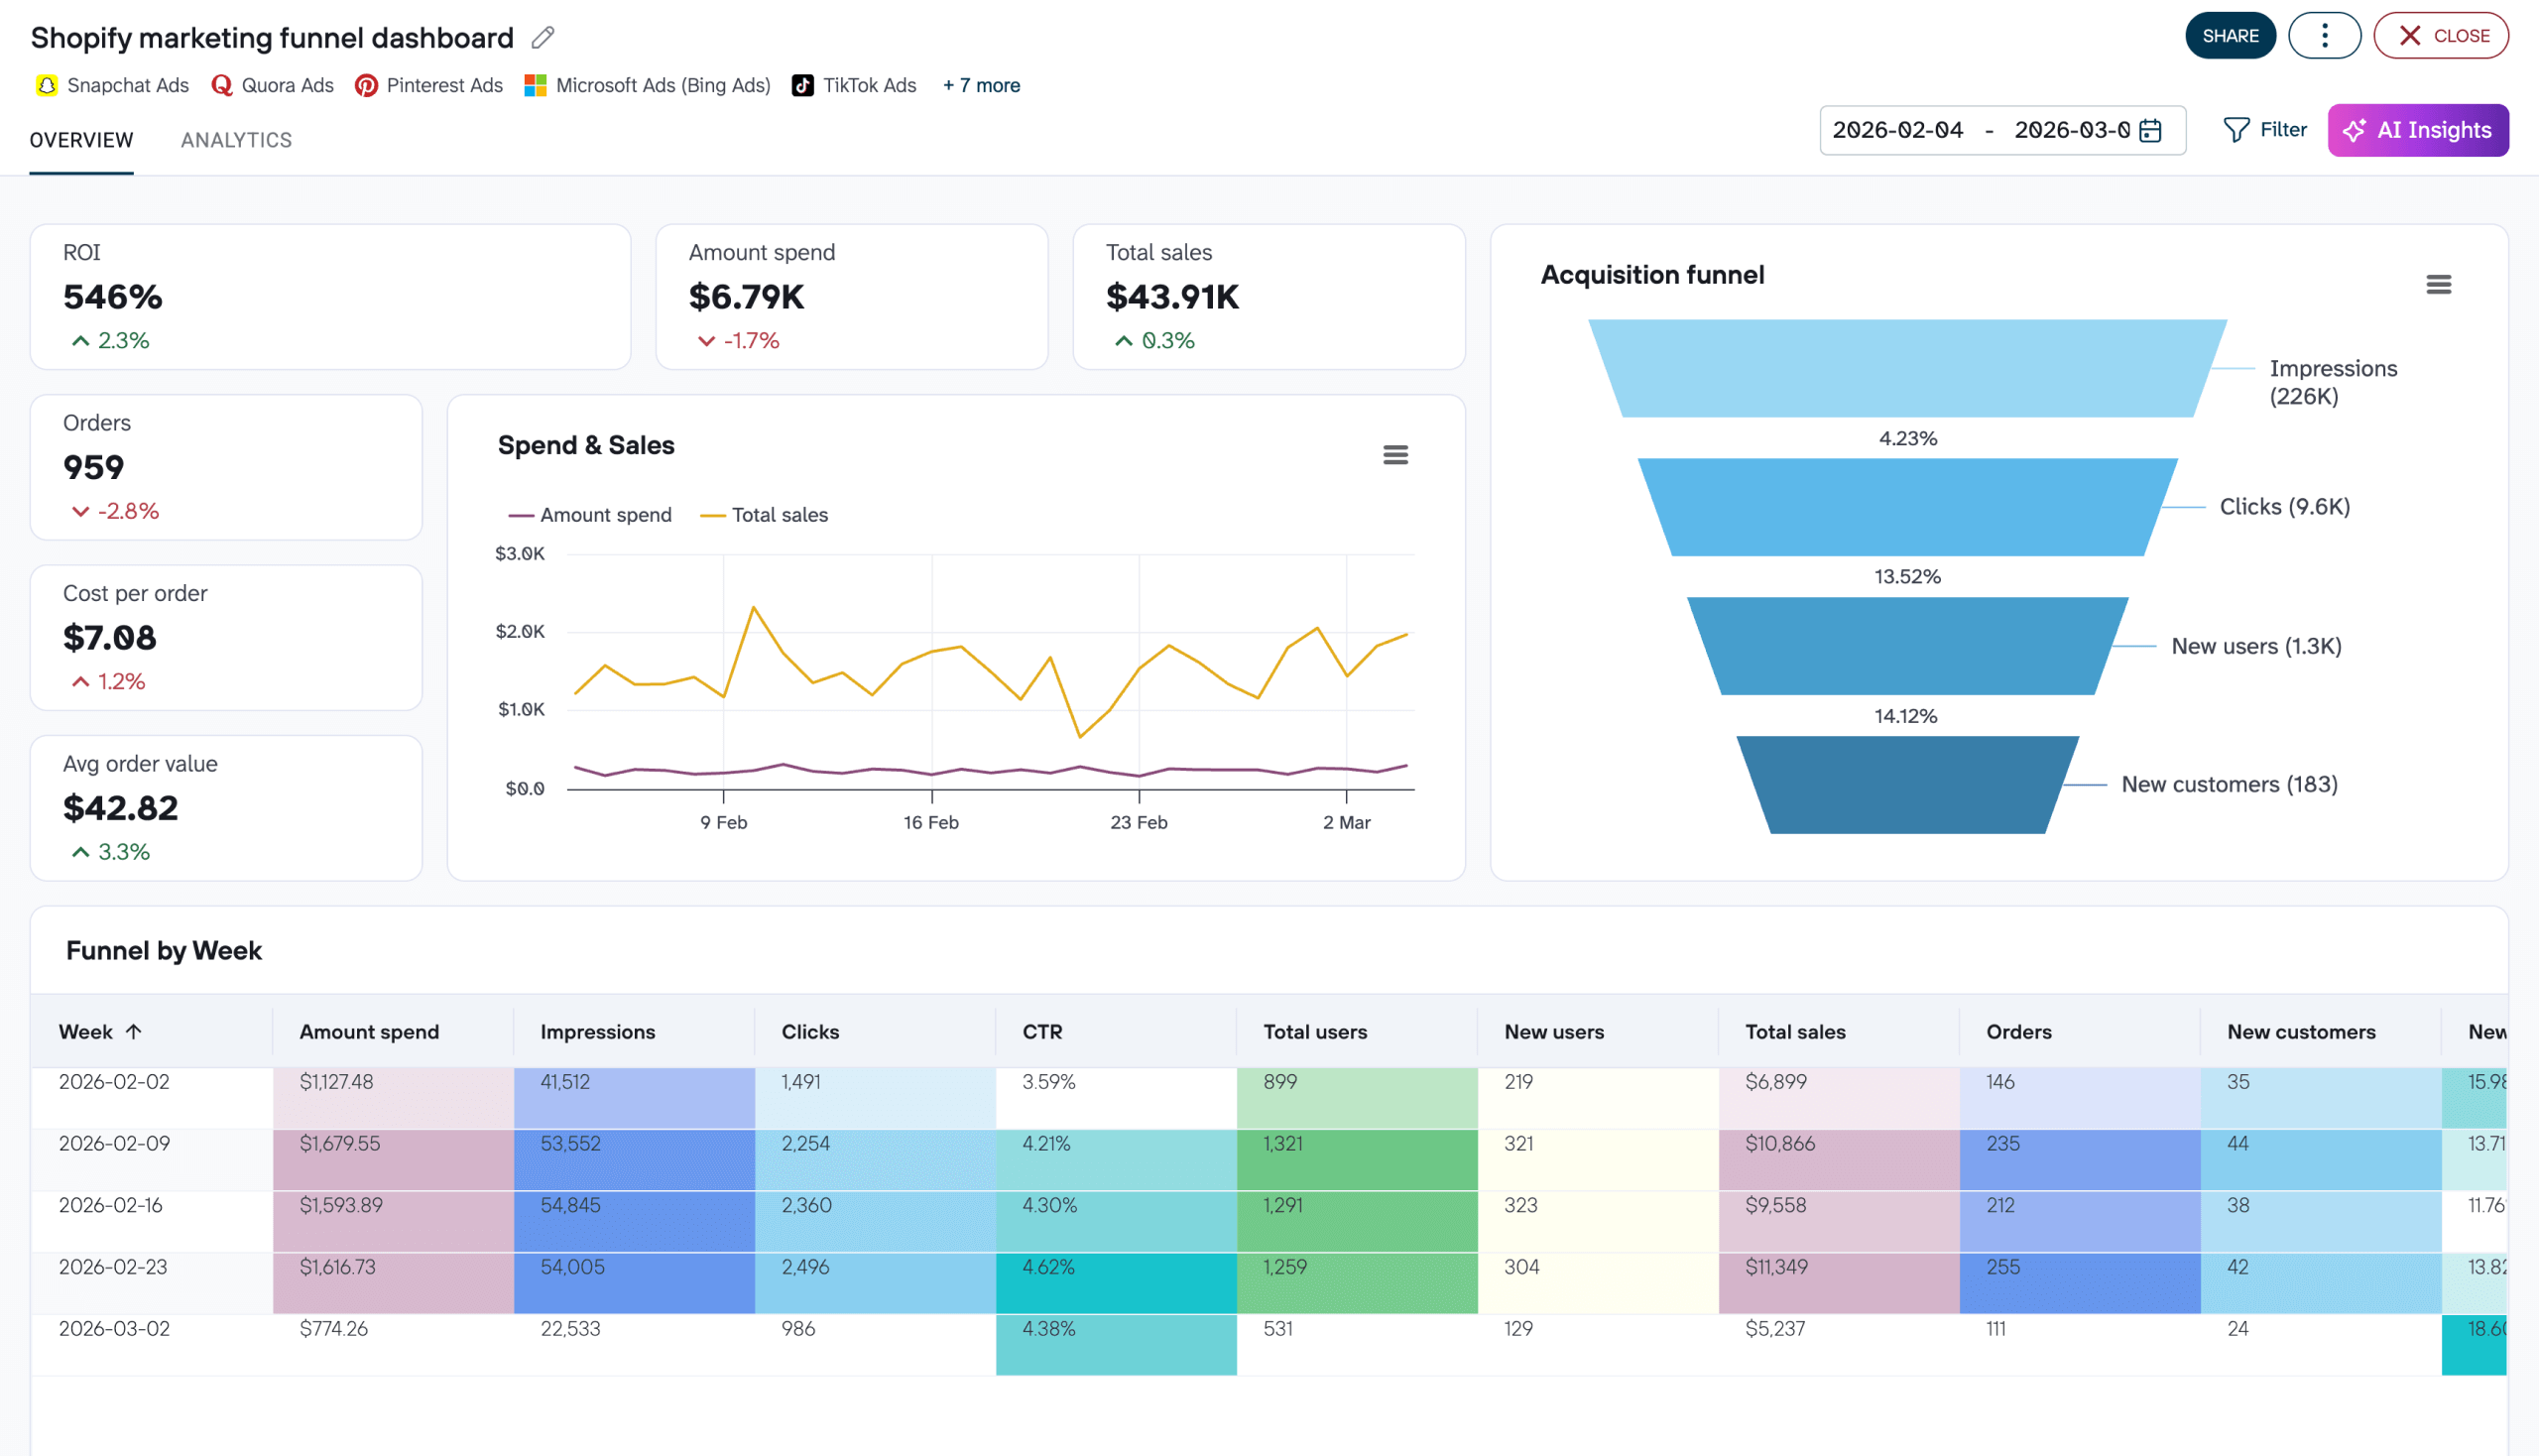
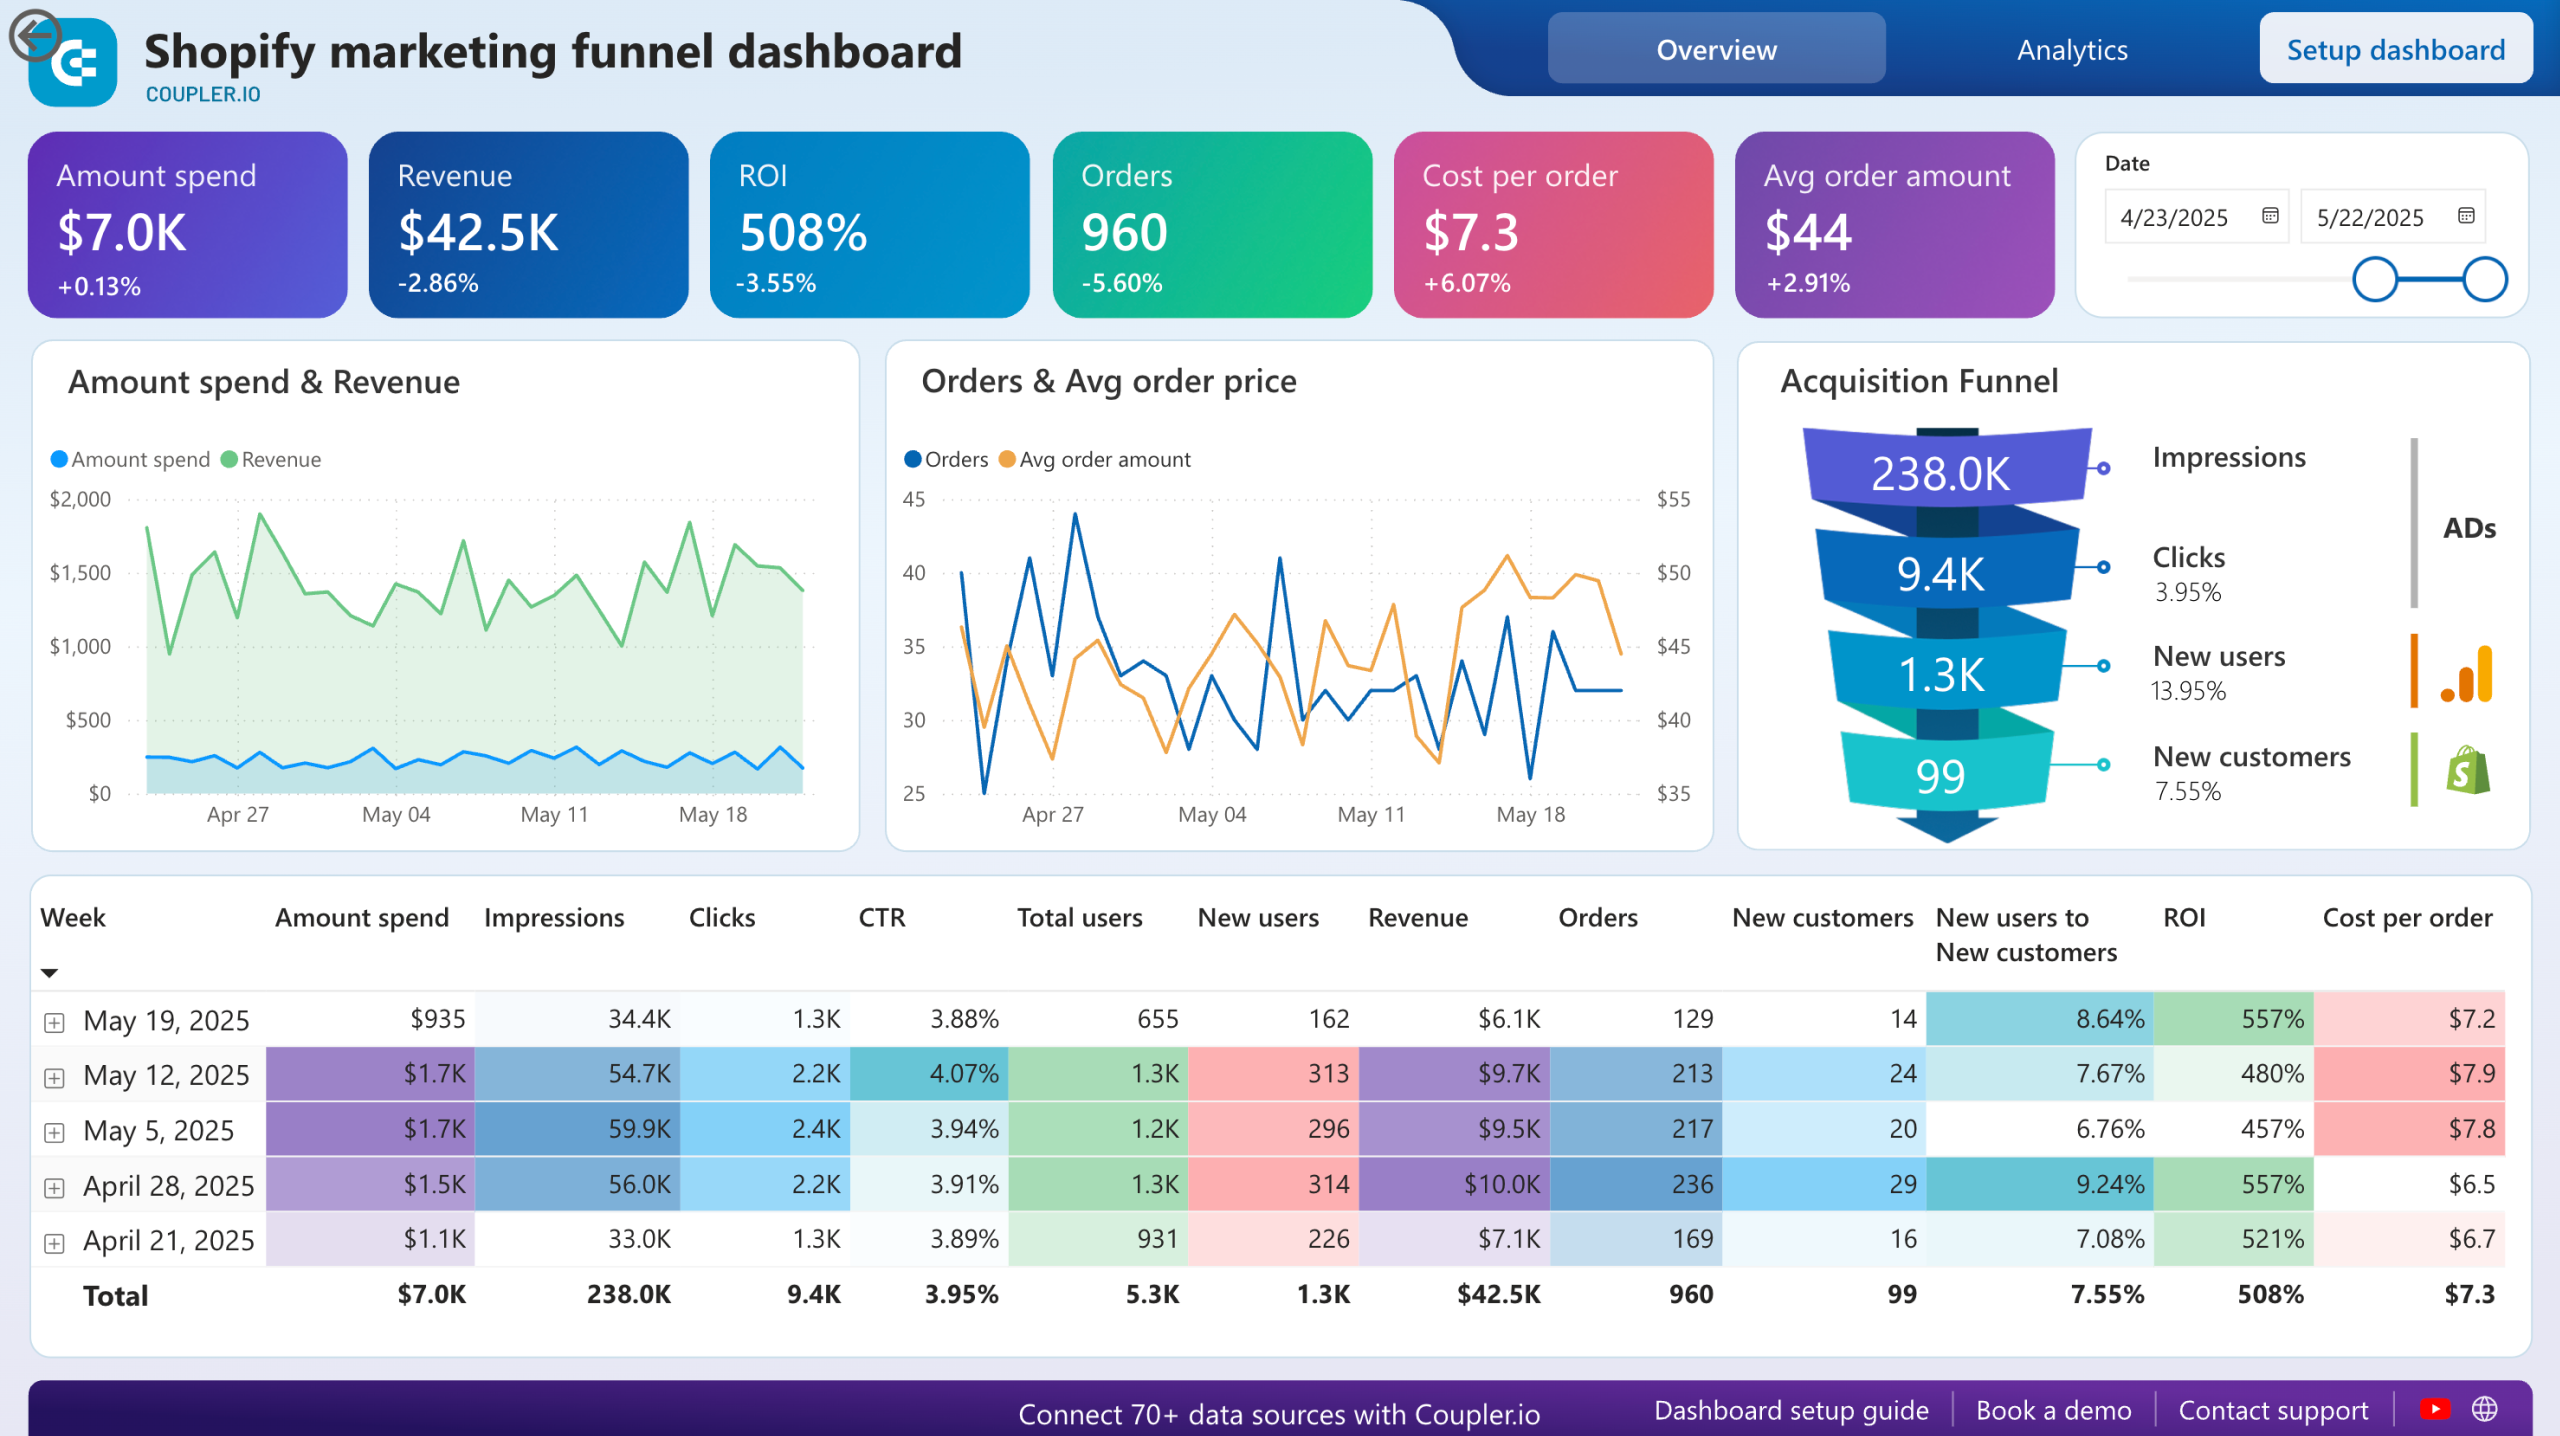
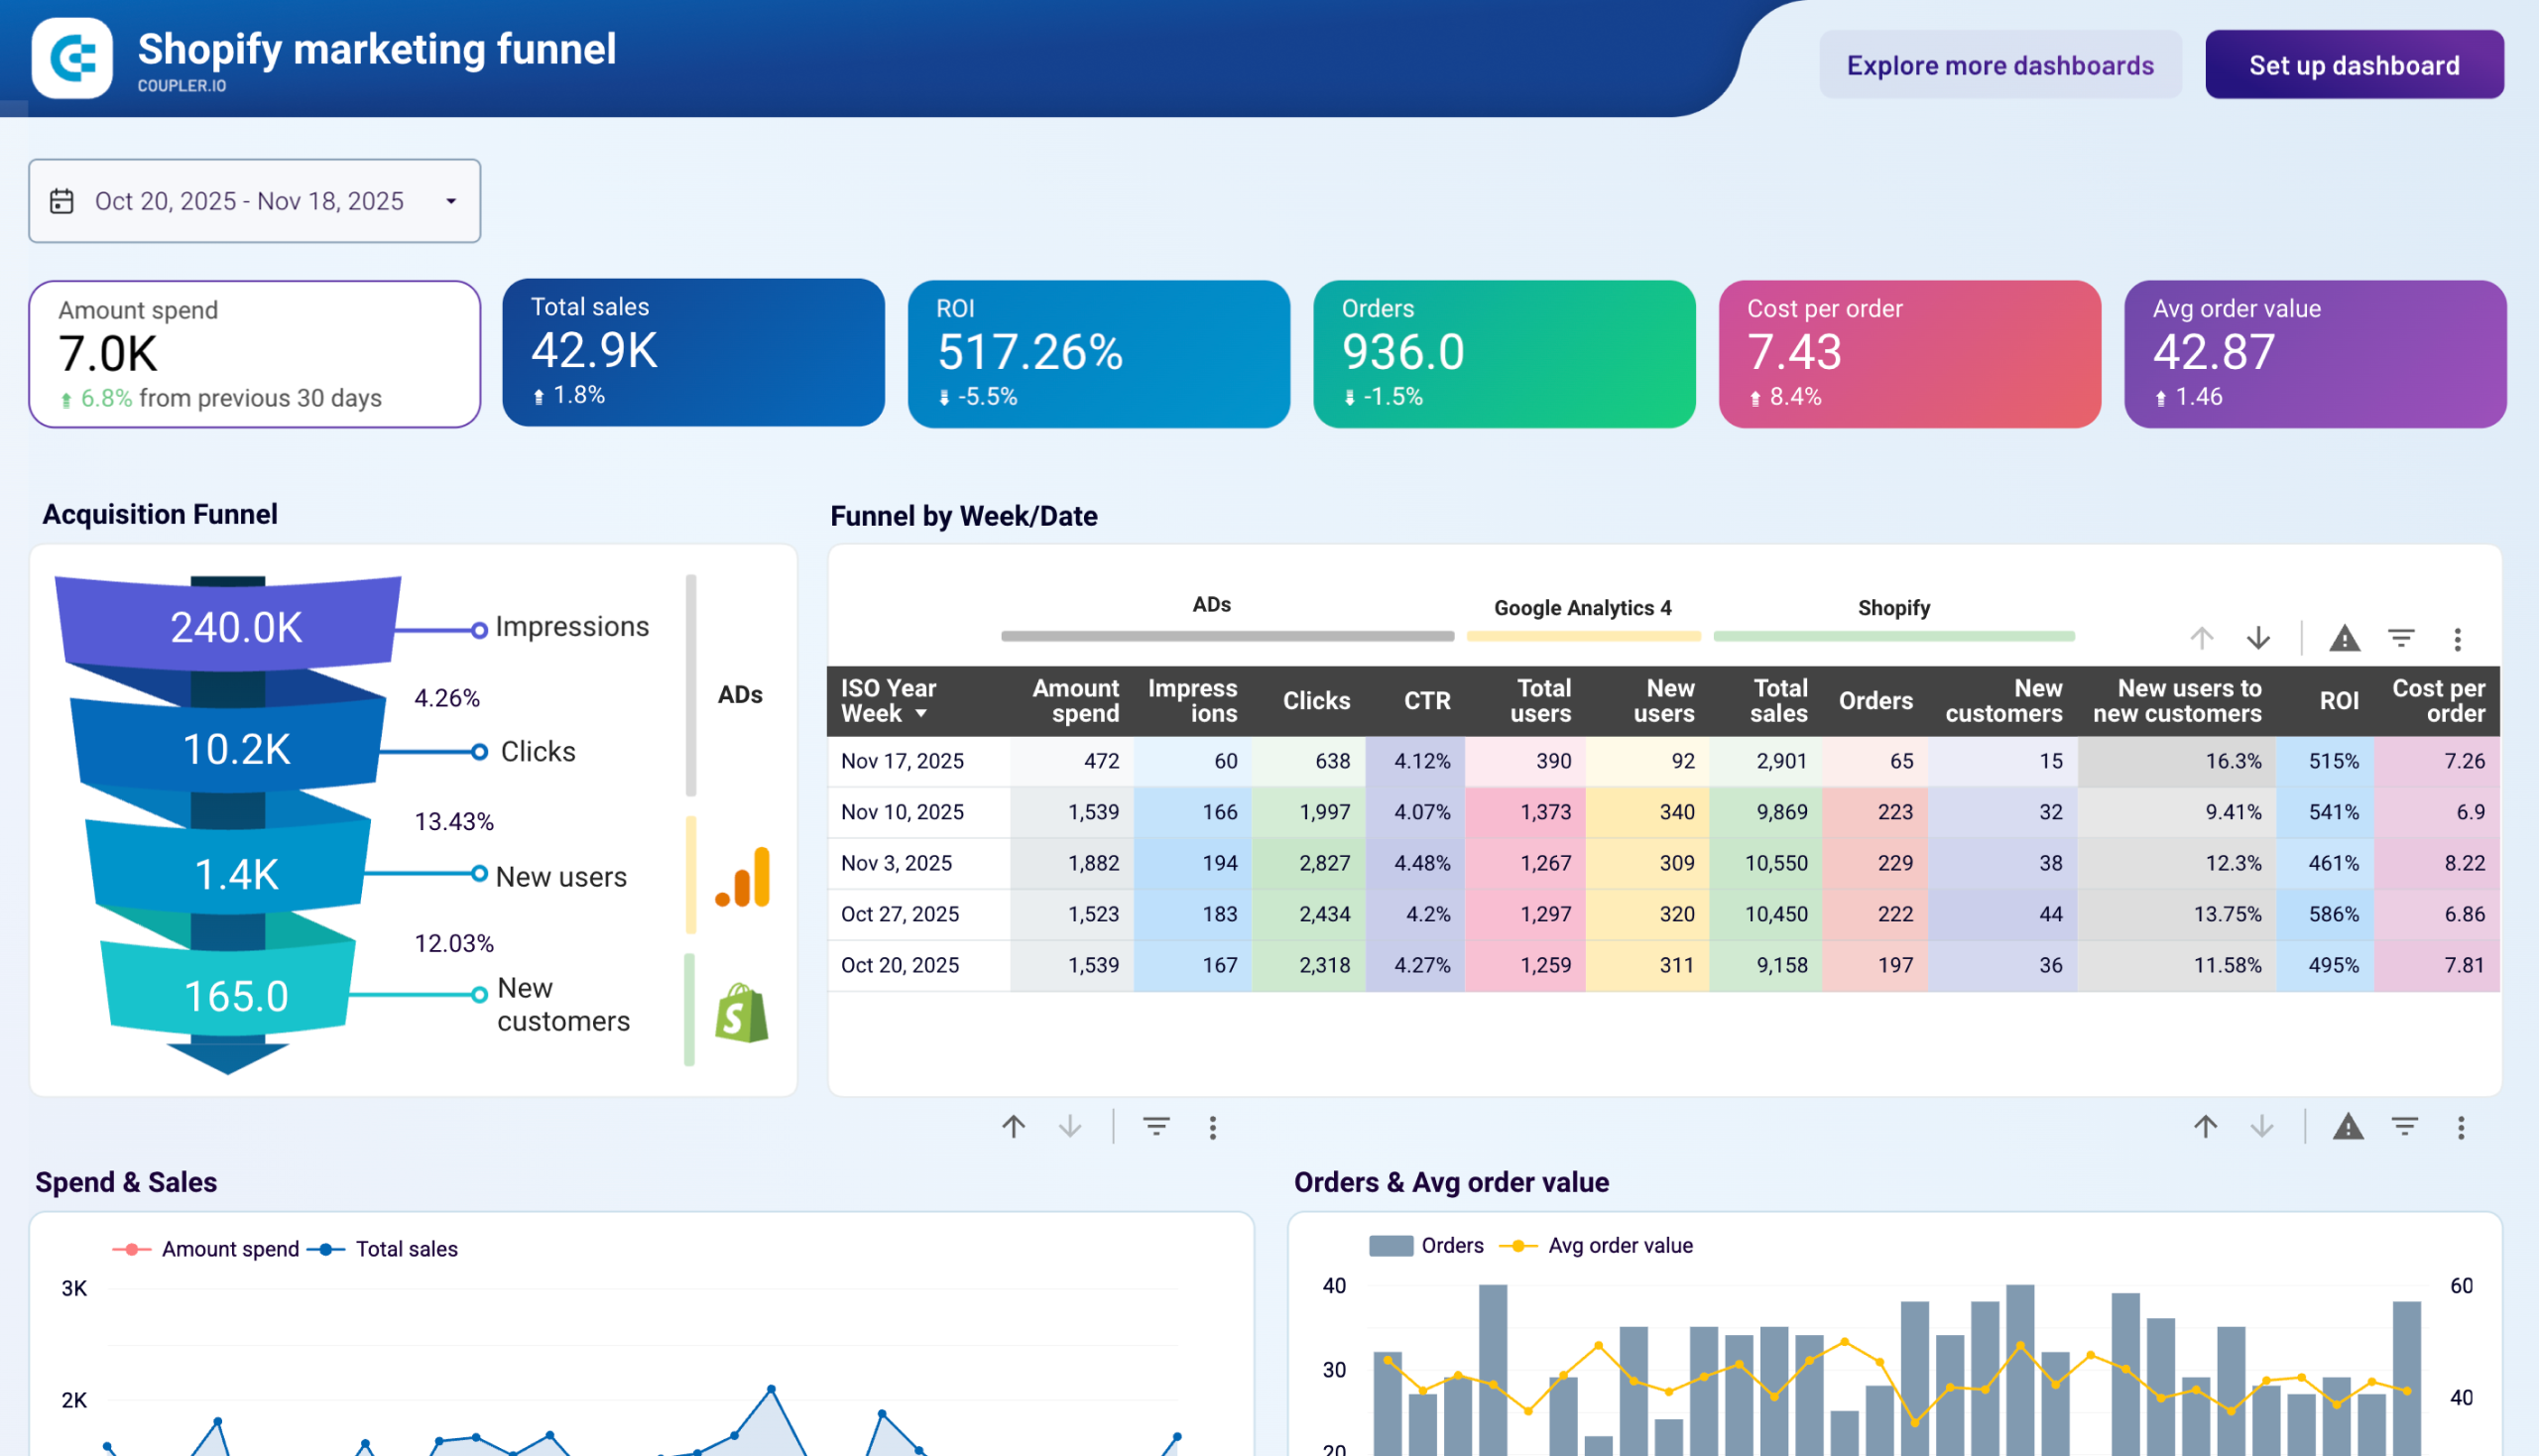
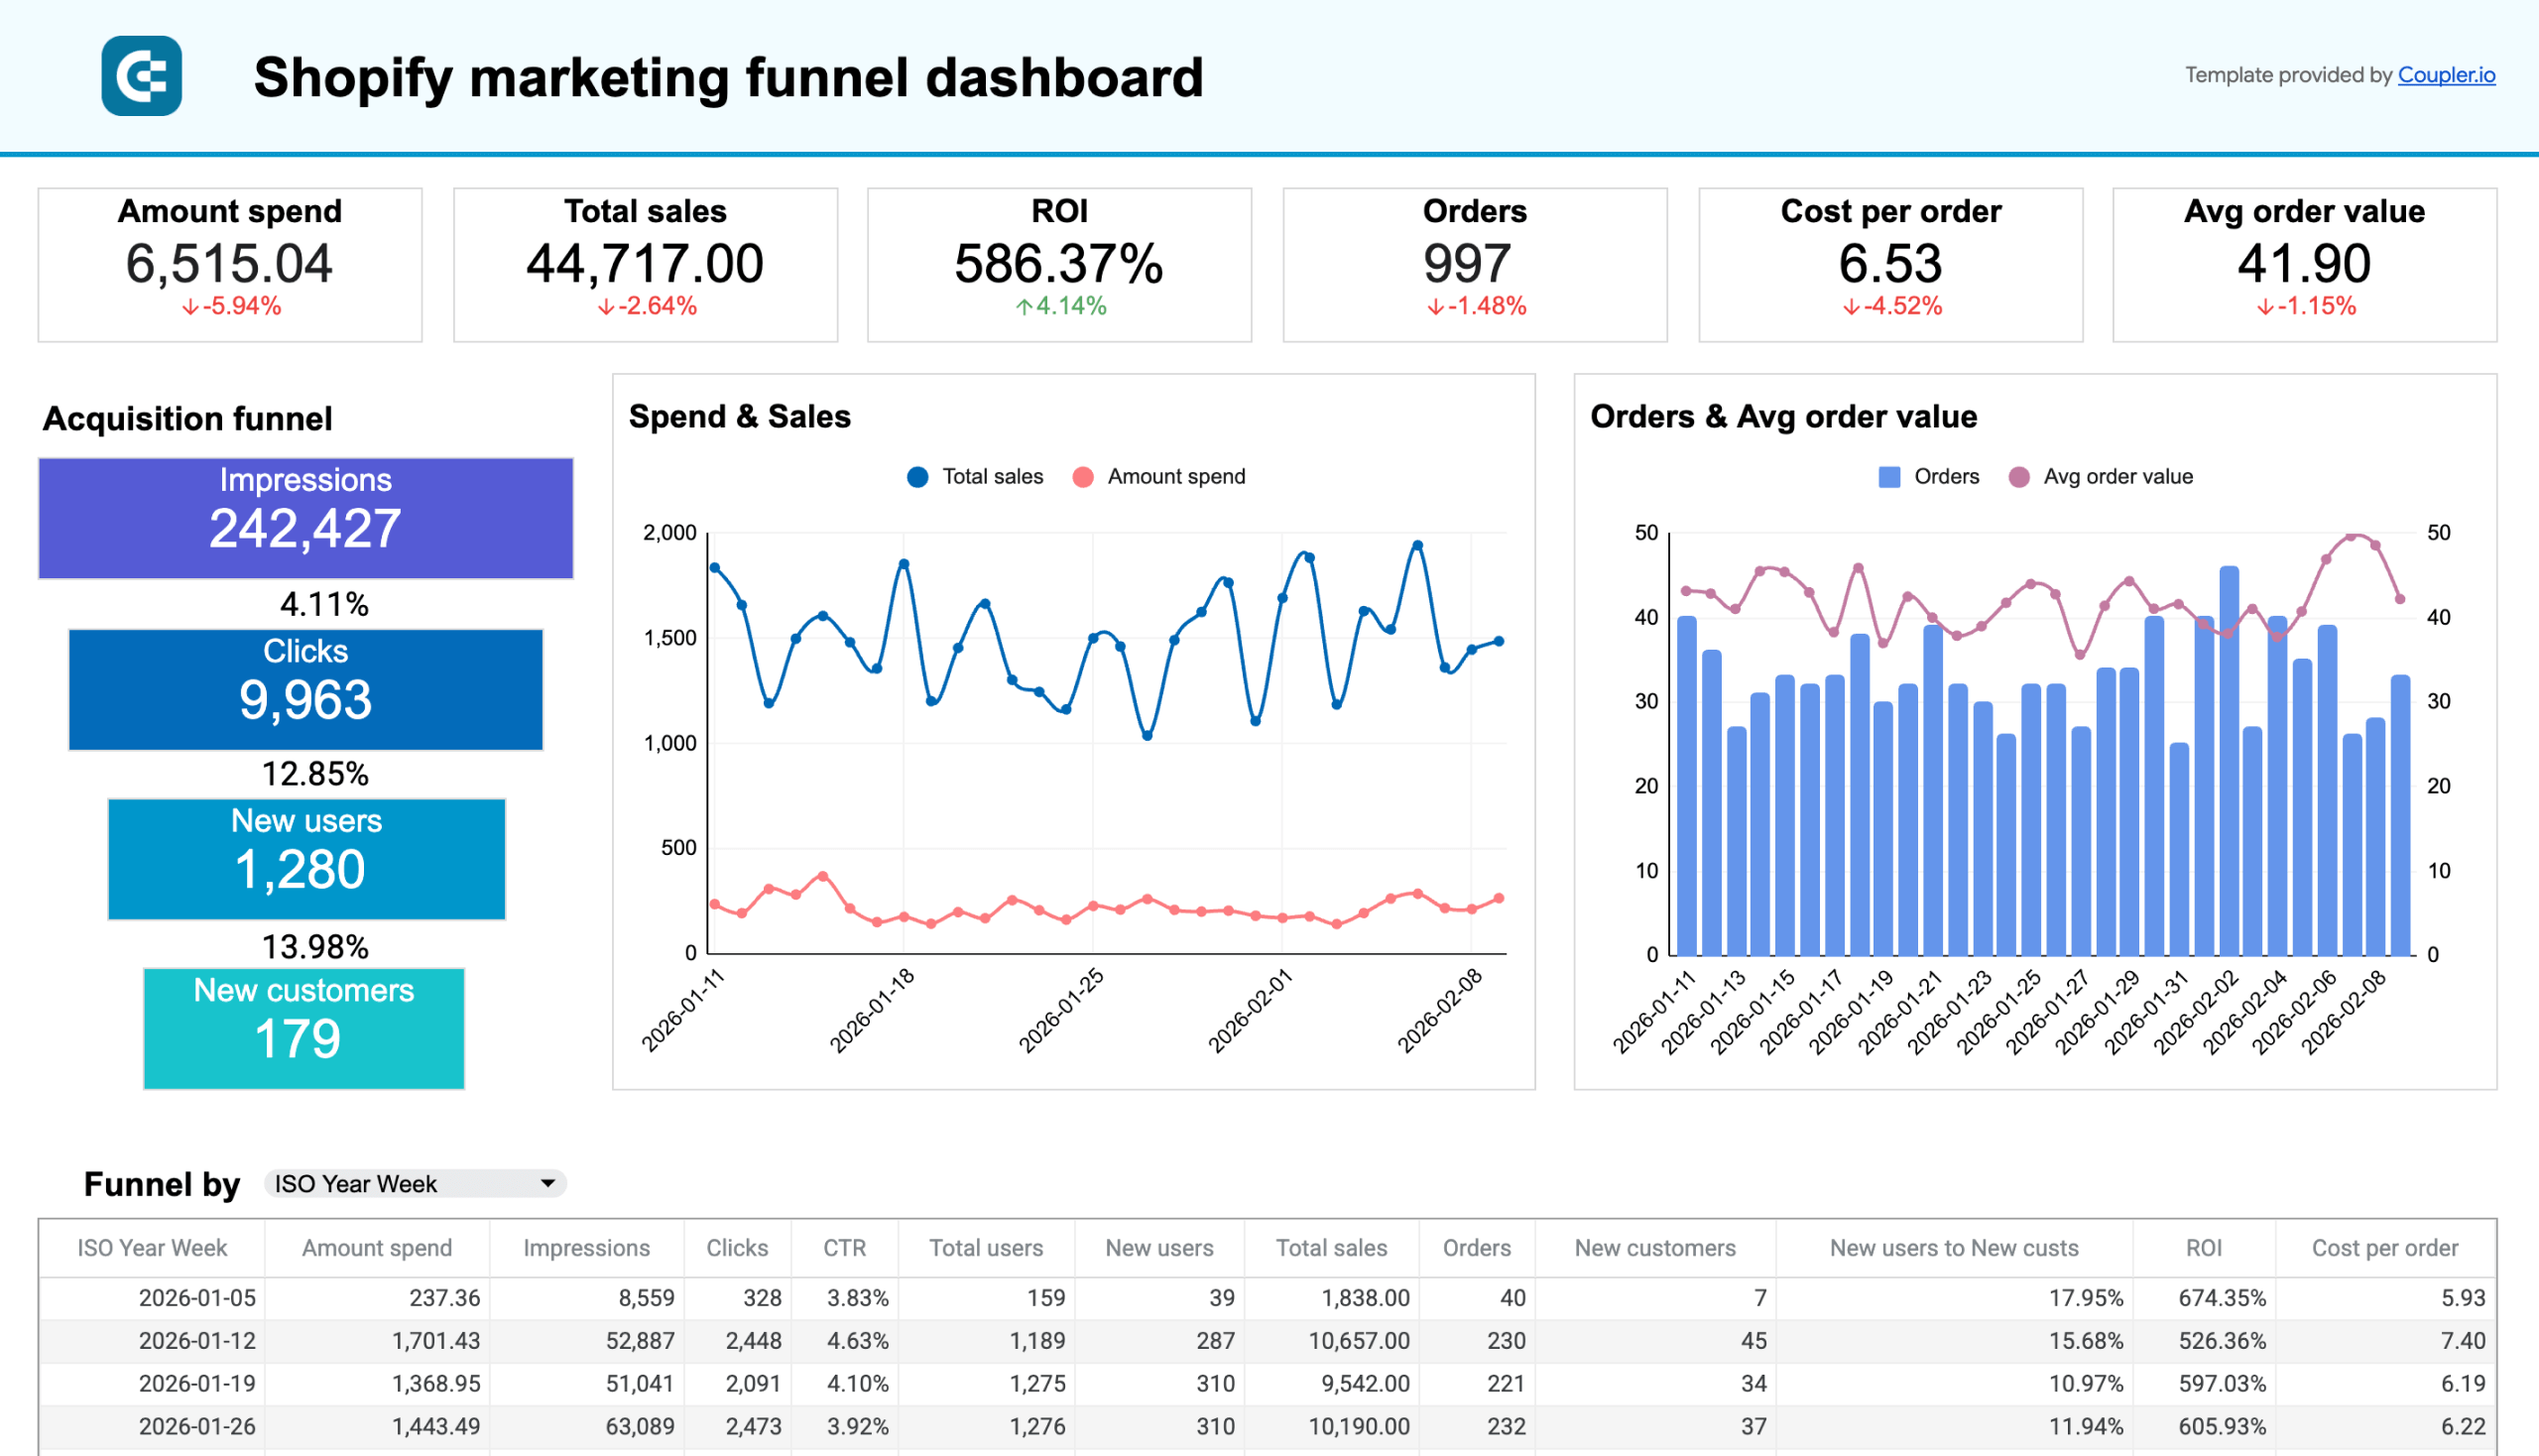
42. E-commerce marketing analytics dashboard for Shopify (+ template)
Shopify marketing funnel dashboard
 Preview dashboard
Shopify marketing funnel dashboard
Preview dashboardDo you advertise your products and sell them online via Shopify? If you do, then this Shopify analytics dashboard is a must-have reporting tool for your ecommerce business. It provides insights into the acquisition funnel, which is based on the data from ad platforms, Google Analytics 4, and your Shopify store. In addition to this, the dashboard template displays other essential metrics to understand your marketing performance, such as ad amount spent, return on investment, and so on.
The Shopify analytics dashboard template is designed in Coupler.io and is also available in Looker Studio, Google Sheets, and Power BI. Each version is equipped with a connector by Coupler.io to load data from GA4, Shopify, and ad platforms, including Facebook, Google, LinkedIn, TikTok, and others.
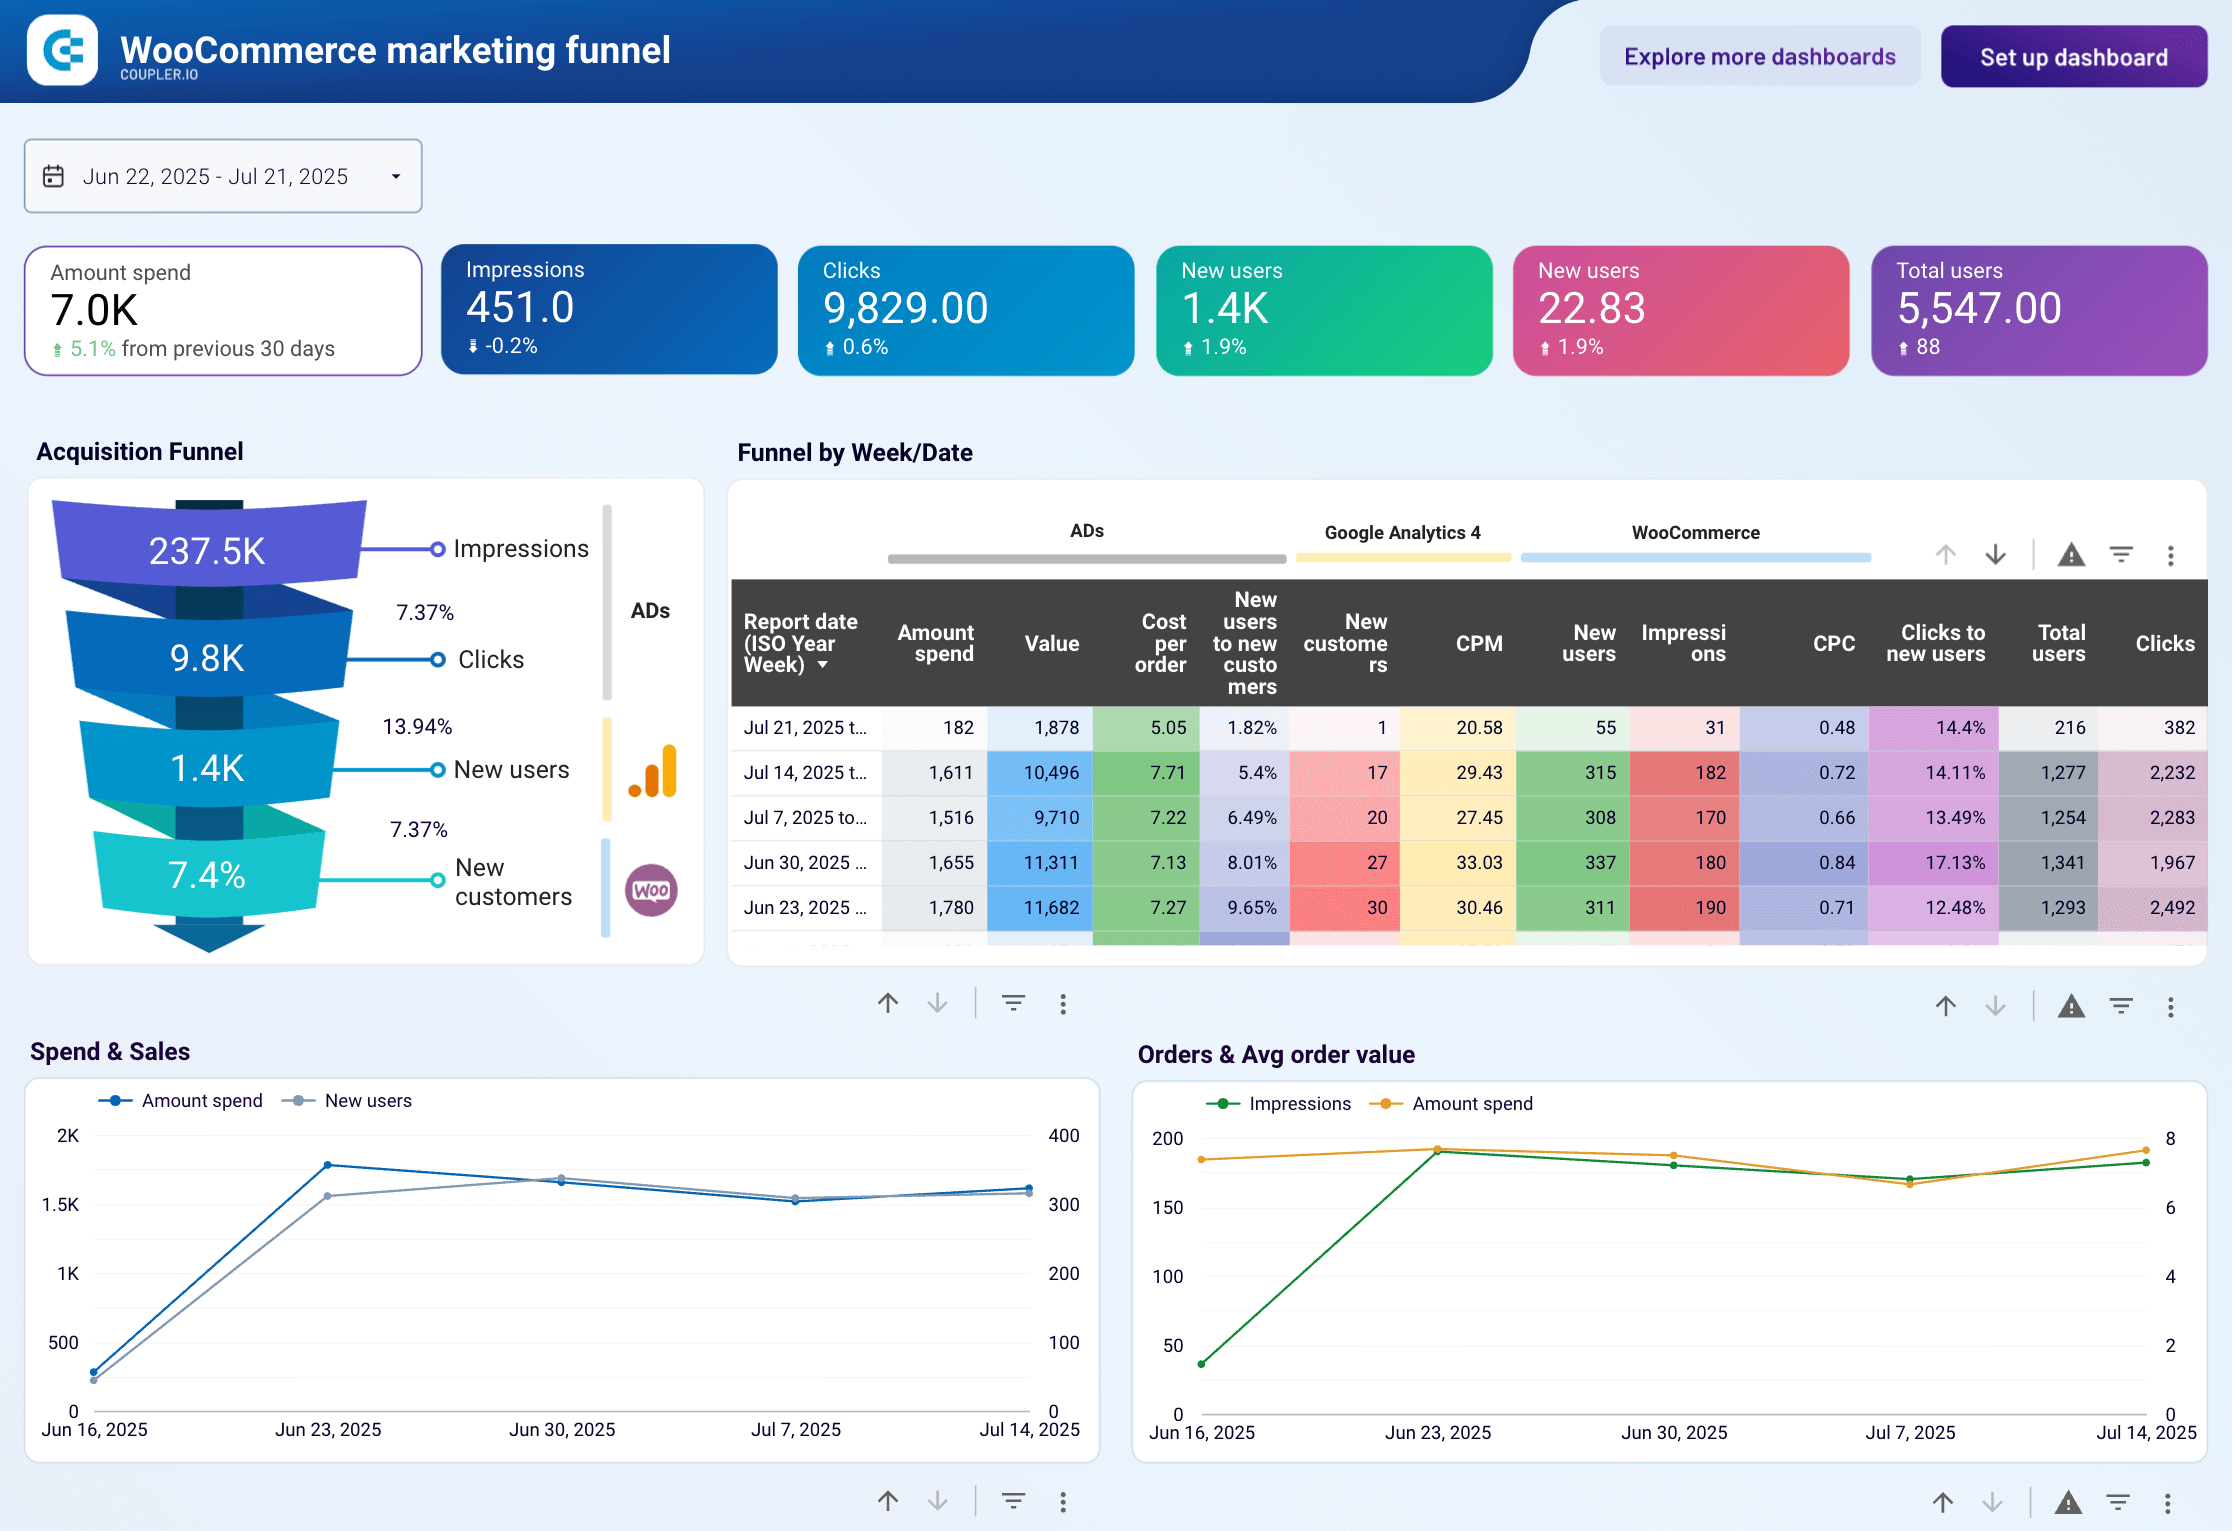
43. Marketing funnel dashboard for WooCommerce (+ template)
This dashboard consolidates advertising data (LinkedIn Ads, Pinterest Ads, TikTok Ads, etc.) with data from Google Analytics 4 and WooCommerce to show how your marketing efforts translate into actual orders and revenue. You can visualize the acquisition funnel from impressions to paying customers alongside a weekly breakdown of funnel conversions.
WooCommerce marketing funnel dashboard
 Preview dashboard
WooCommerce marketing funnel dashboard
Preview dashboardThe dashboard also has several charts for monitoring advertising spend, website traffic, and orders, and for analyzing correlations between spend & sales or clicks & CPC. This information is helpful for optimizing budget allocation, identifying conversion issues, and tracking which ad platforms drive the most sales.
A template for this dashboard is available in Looker Studio. Preview it, make a copy, and load data automatically with a free Coupler.io account.
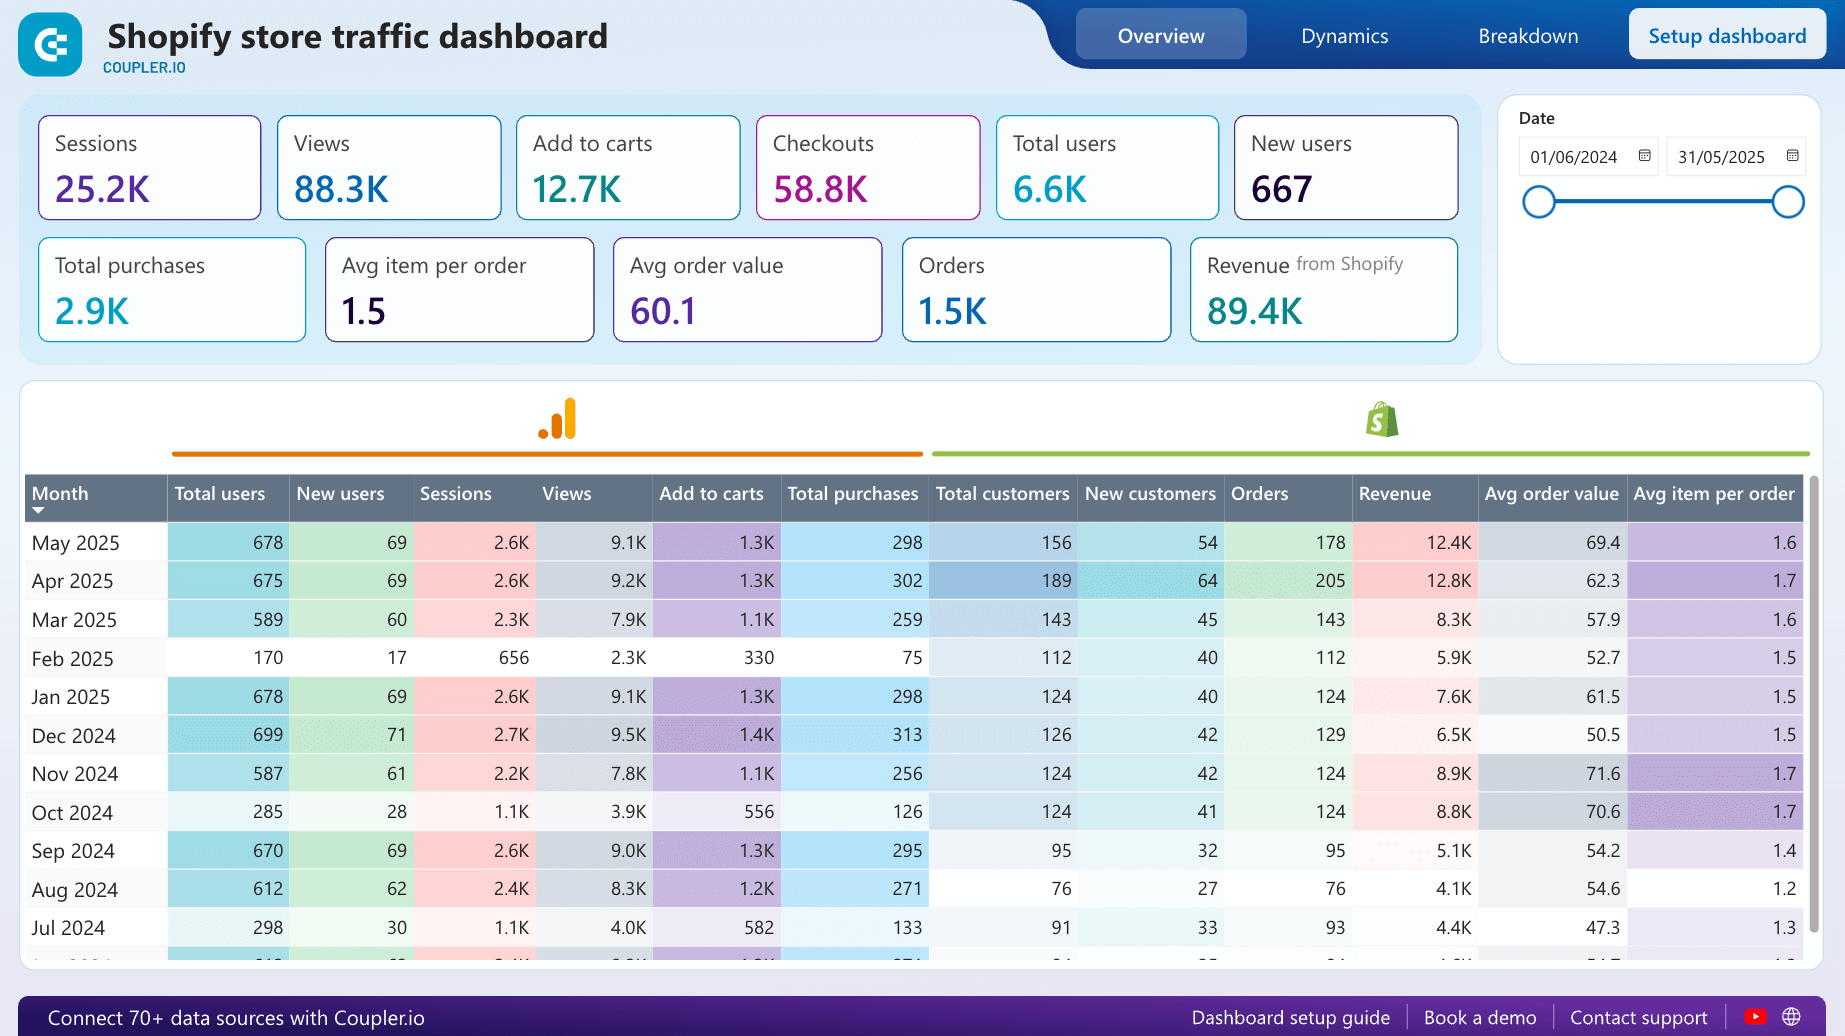
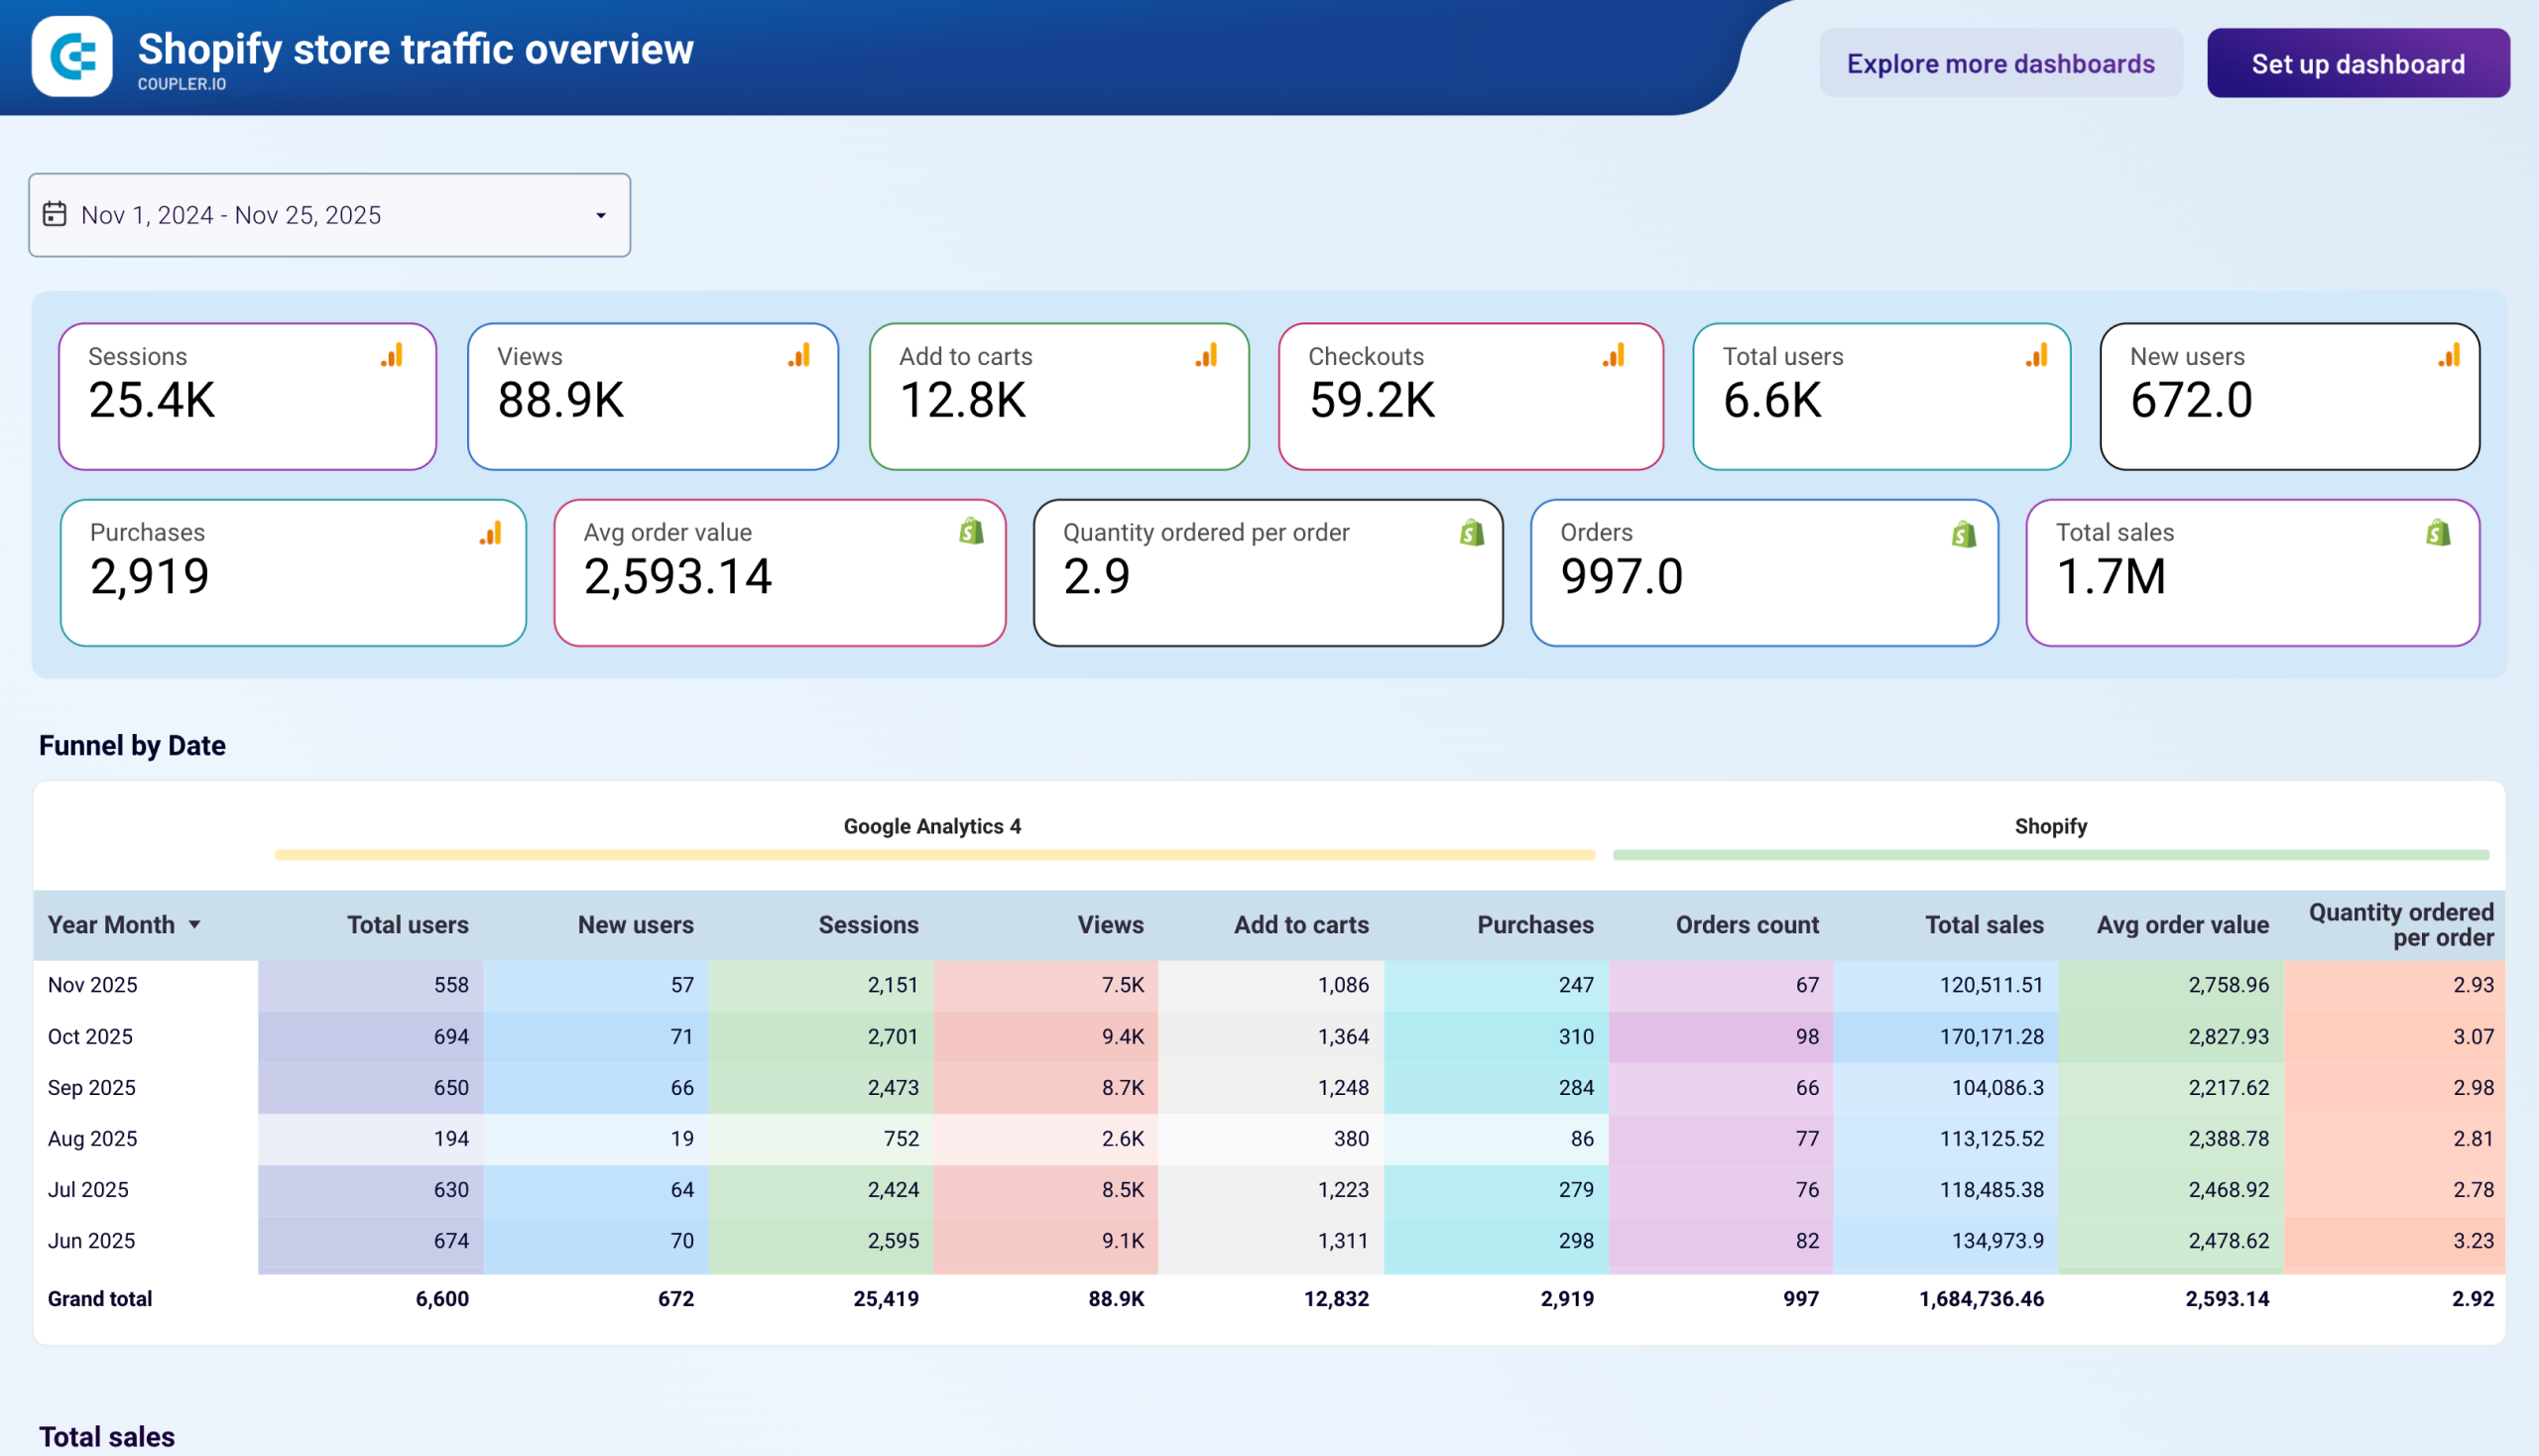
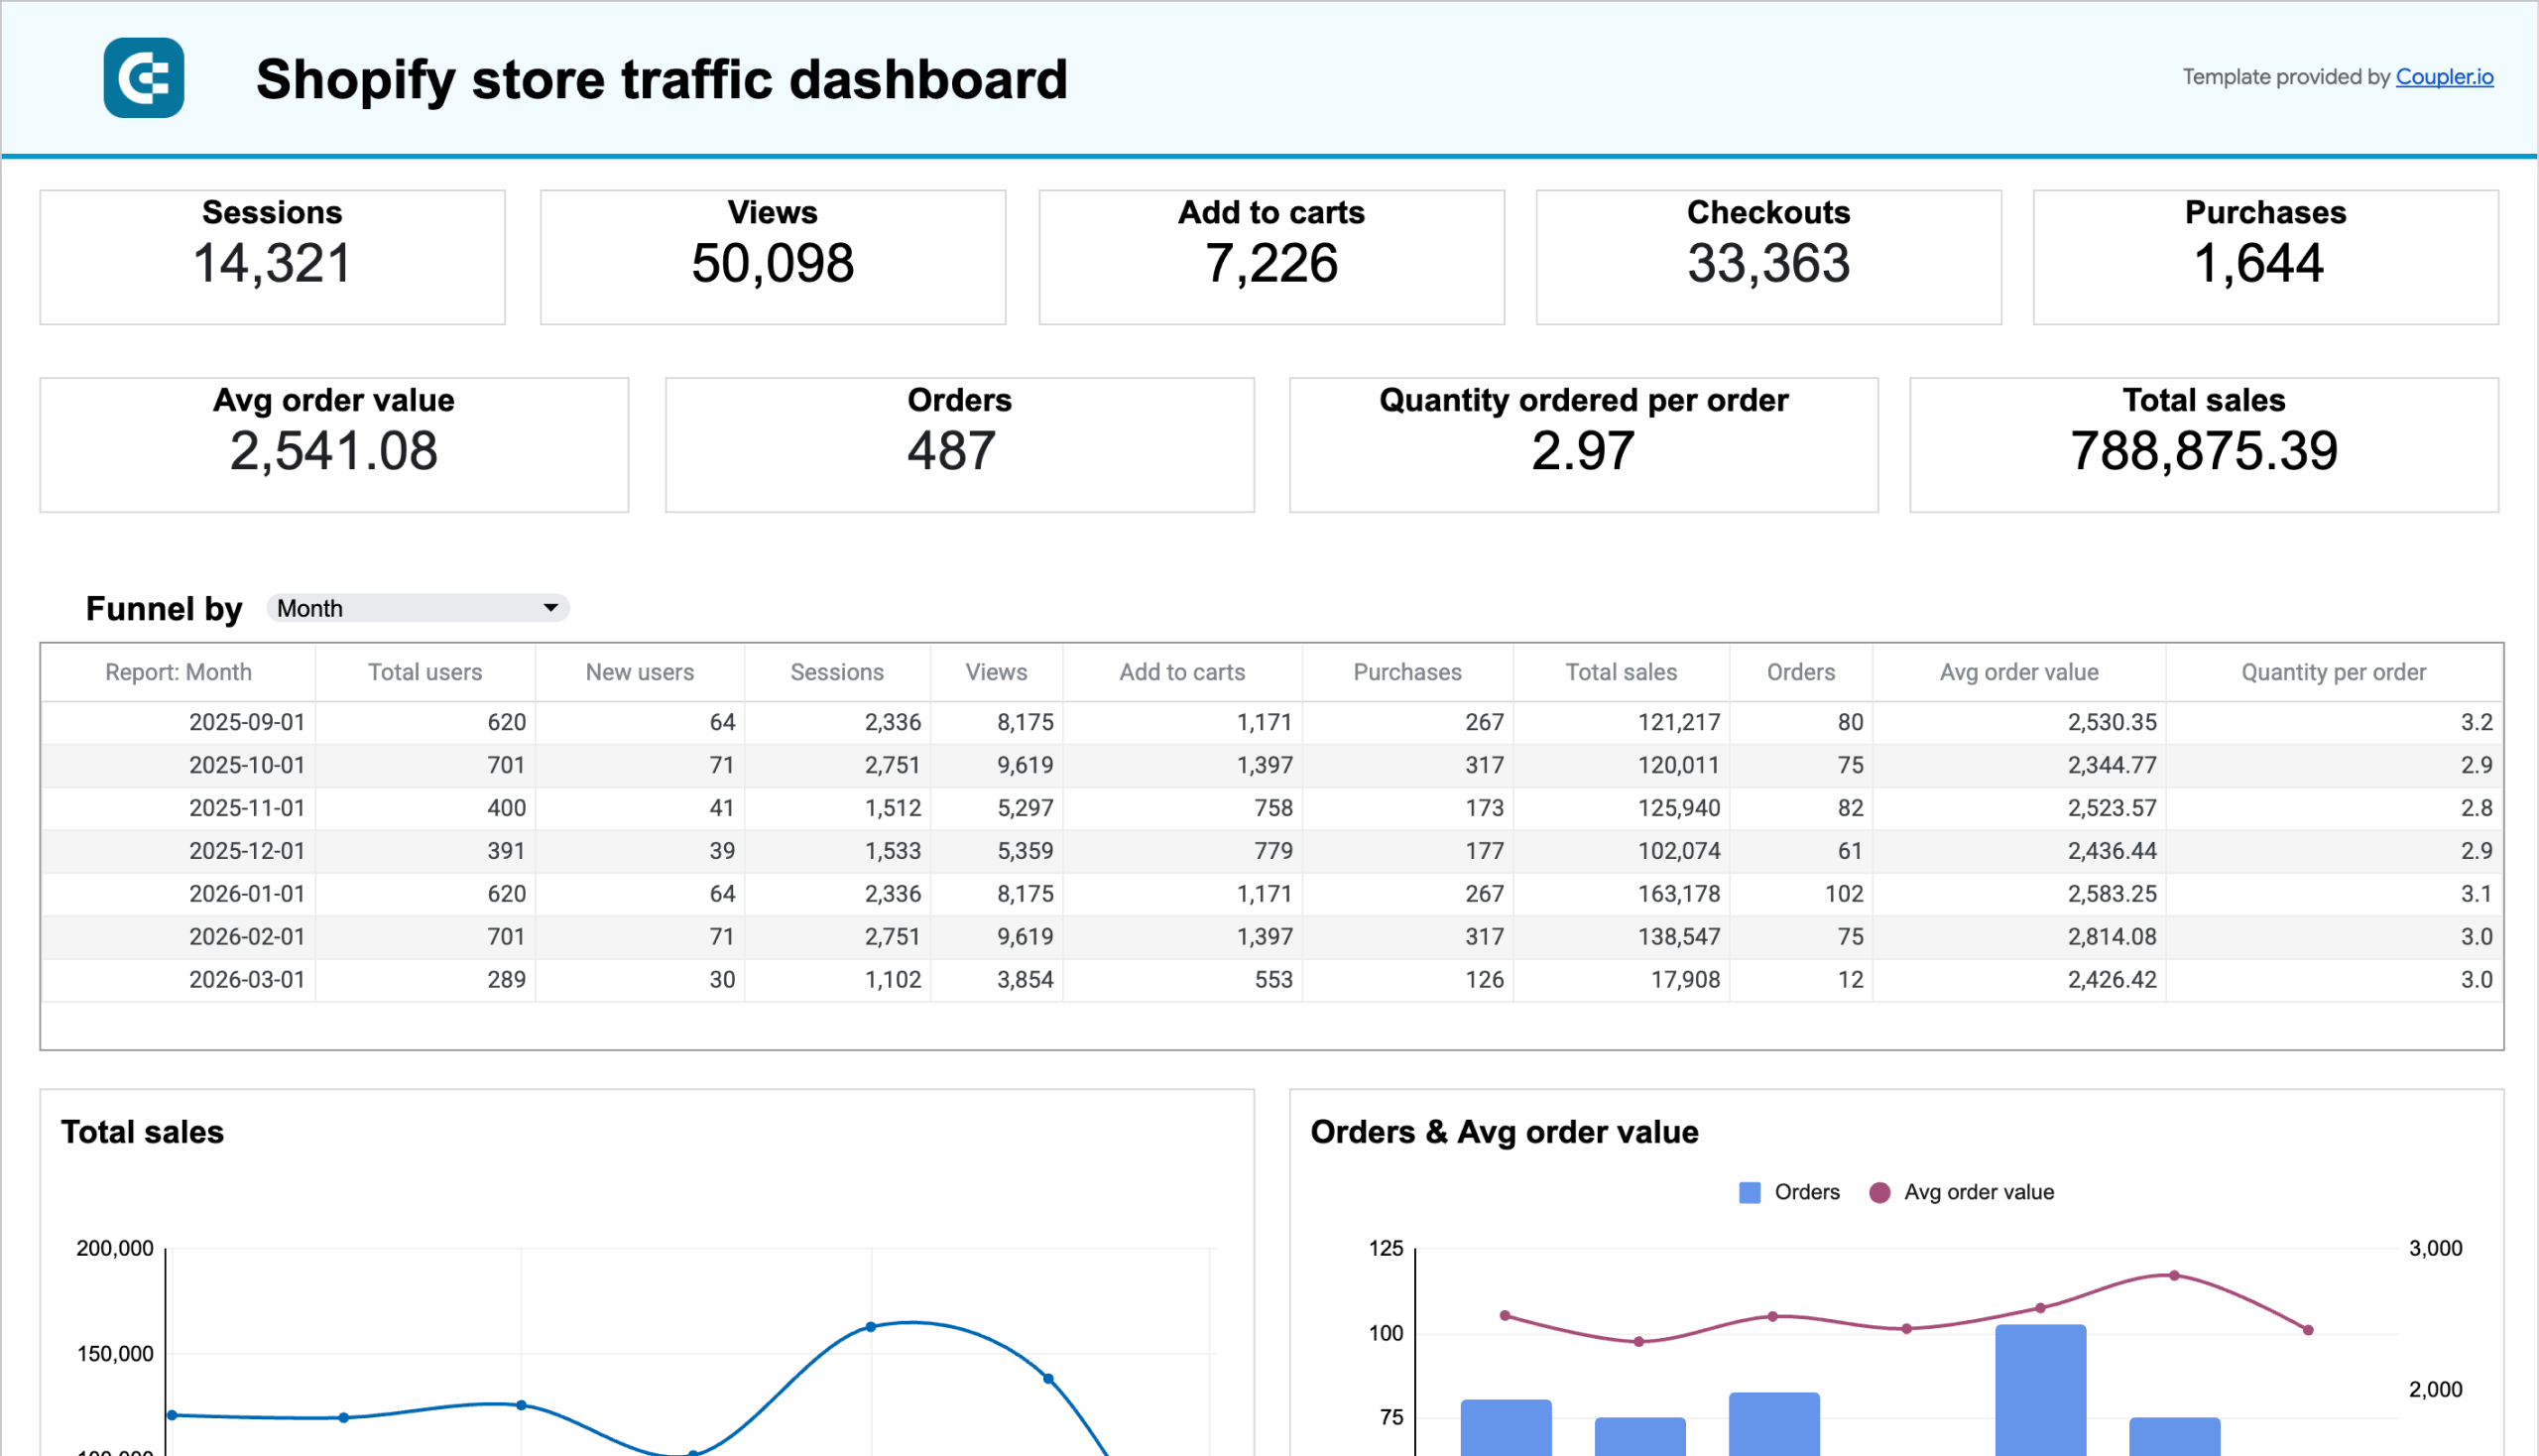
44. Store traffic dashboard for Shopify (+ template)
The Shopify store traffic dashboard combines performance data from Google Analytics 4 and Shopify. It allows you to track the entire customer journey from website visit to purchase in detailed tables and graphs. You can monitor key metrics like views, purchases, checkouts, revenue, and average order value to identify conversion bottlenecks and optimize your sales funnel. The dashboard also provides geographical performance insights to help you make data-driven decisions about inventory and store localization.
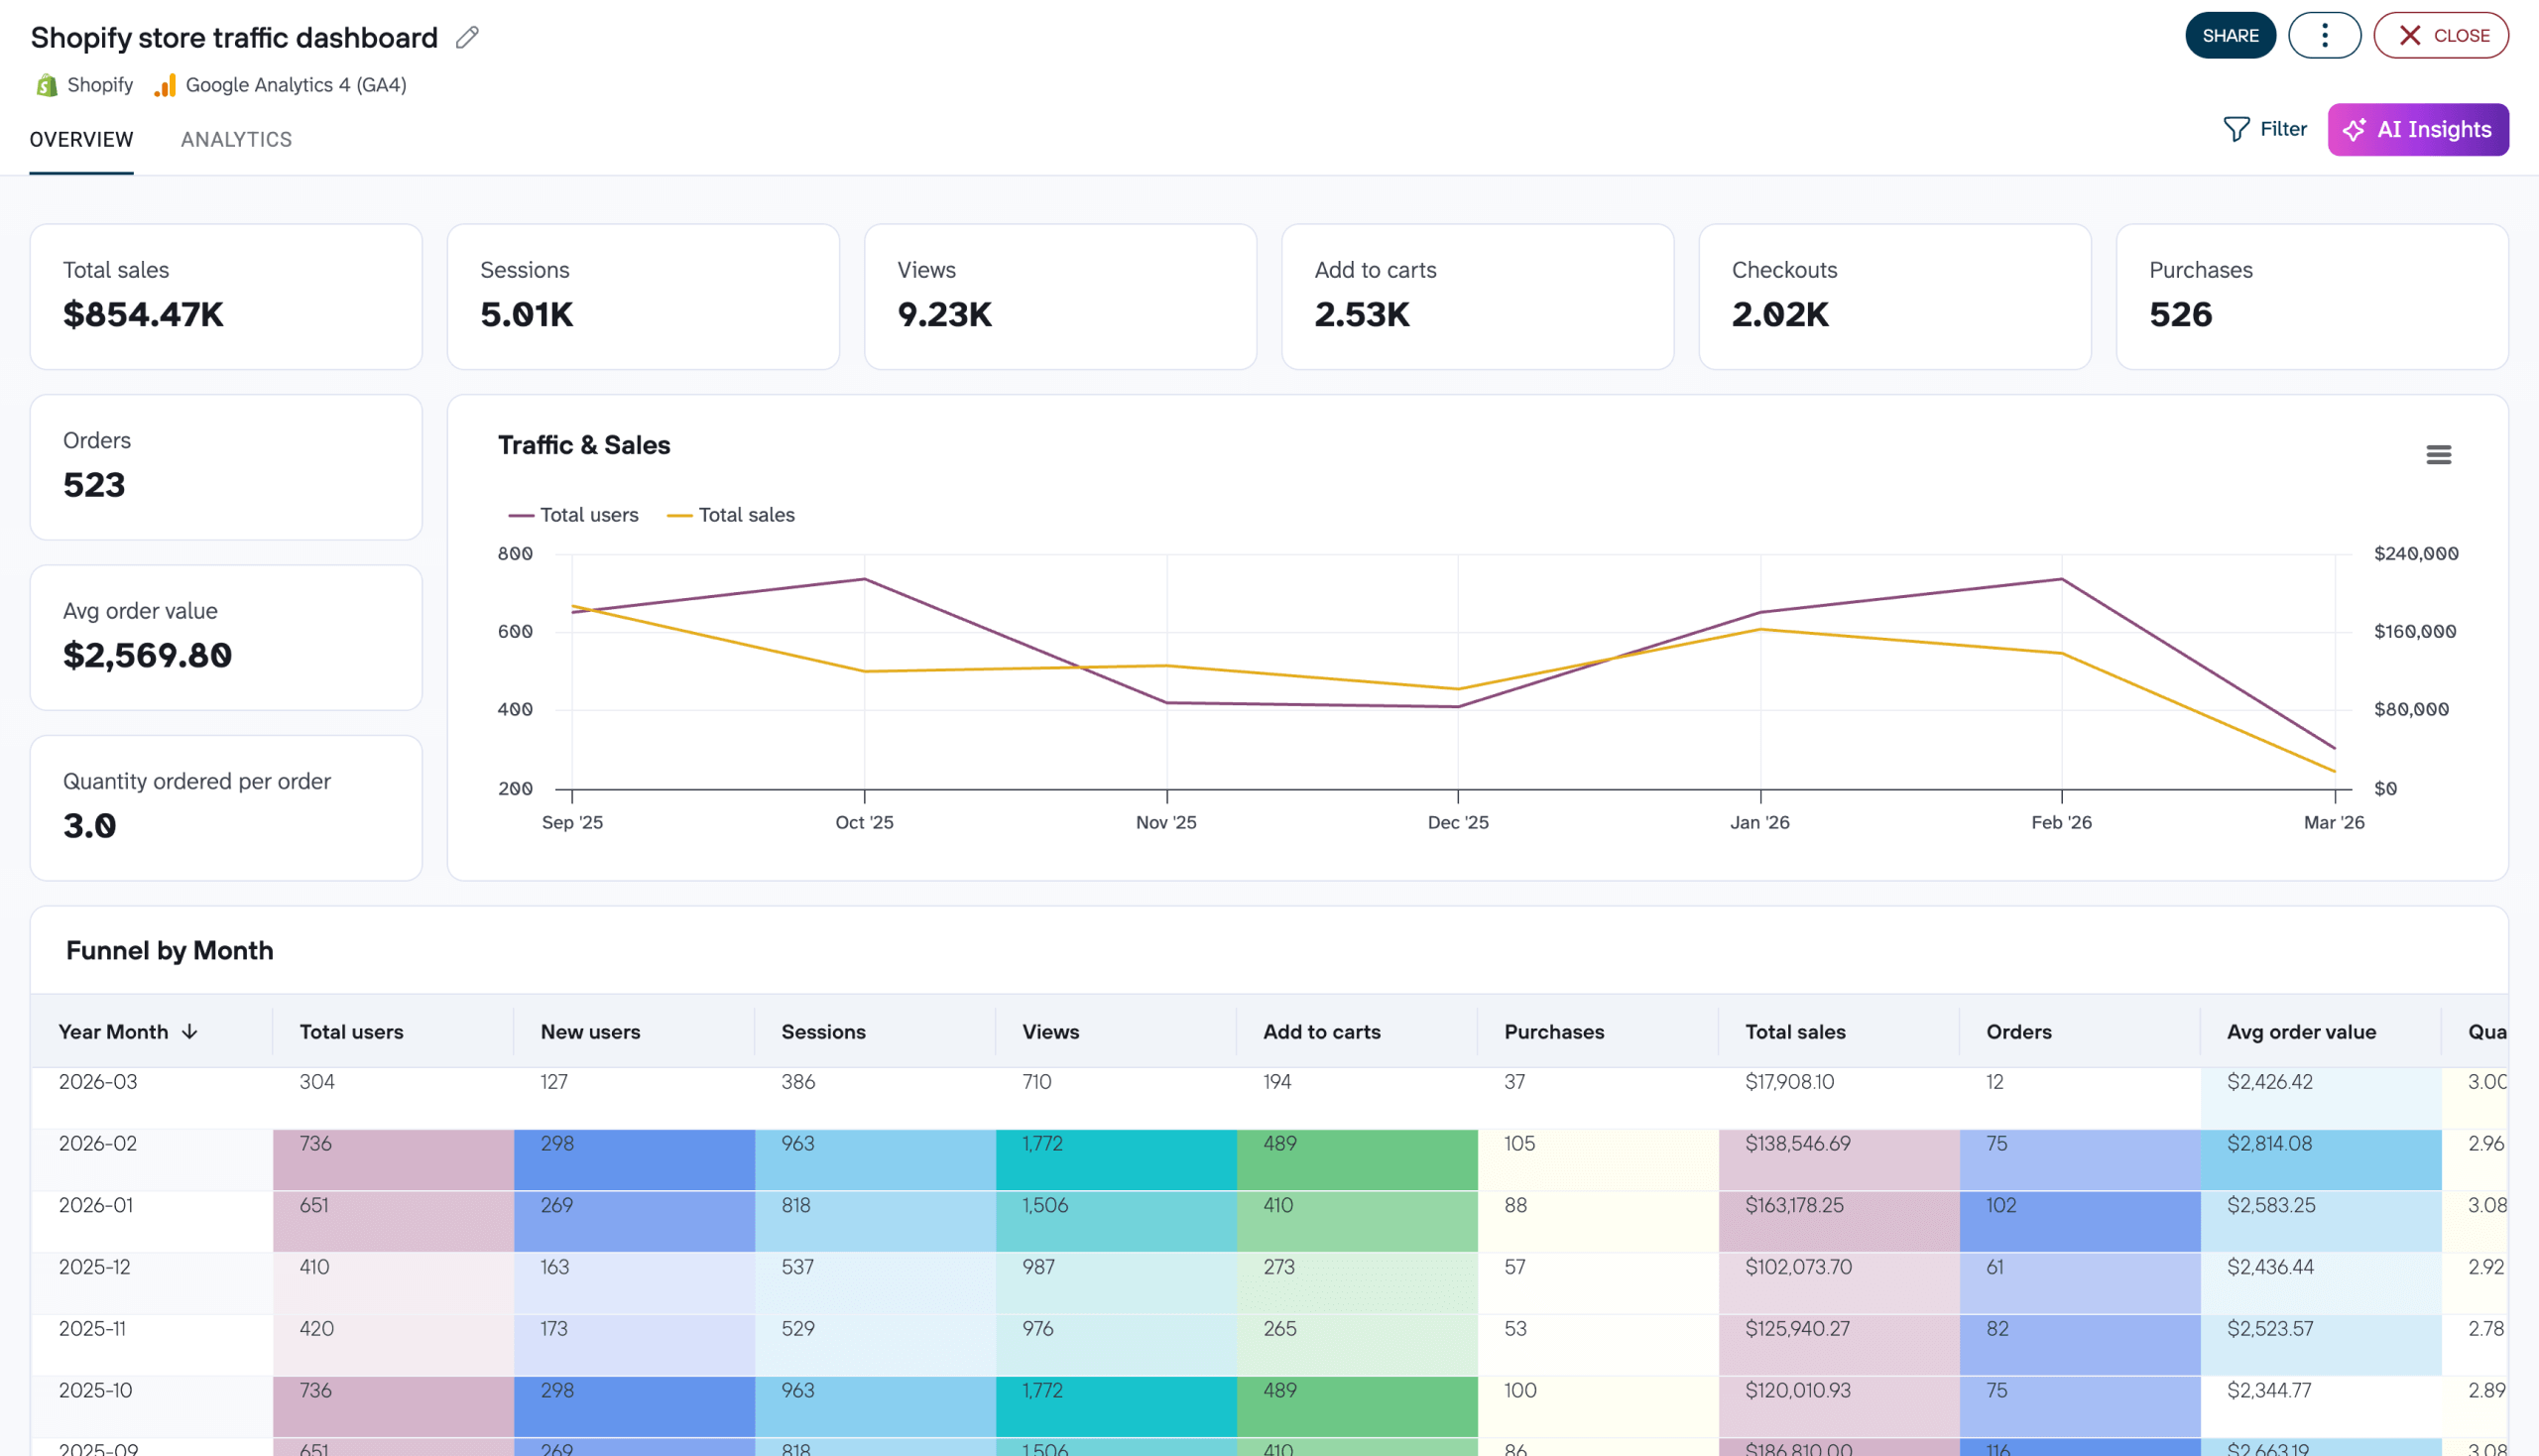
Templates are available in Coupler.io, Power BI, Looker Studio, and Google Sheets. To create a copy, choose the version you prefer and sign up for Coupler.io for free. It takes less than 5 minutes to set up an automatic data flow from your Shopify and GA4 accounts:
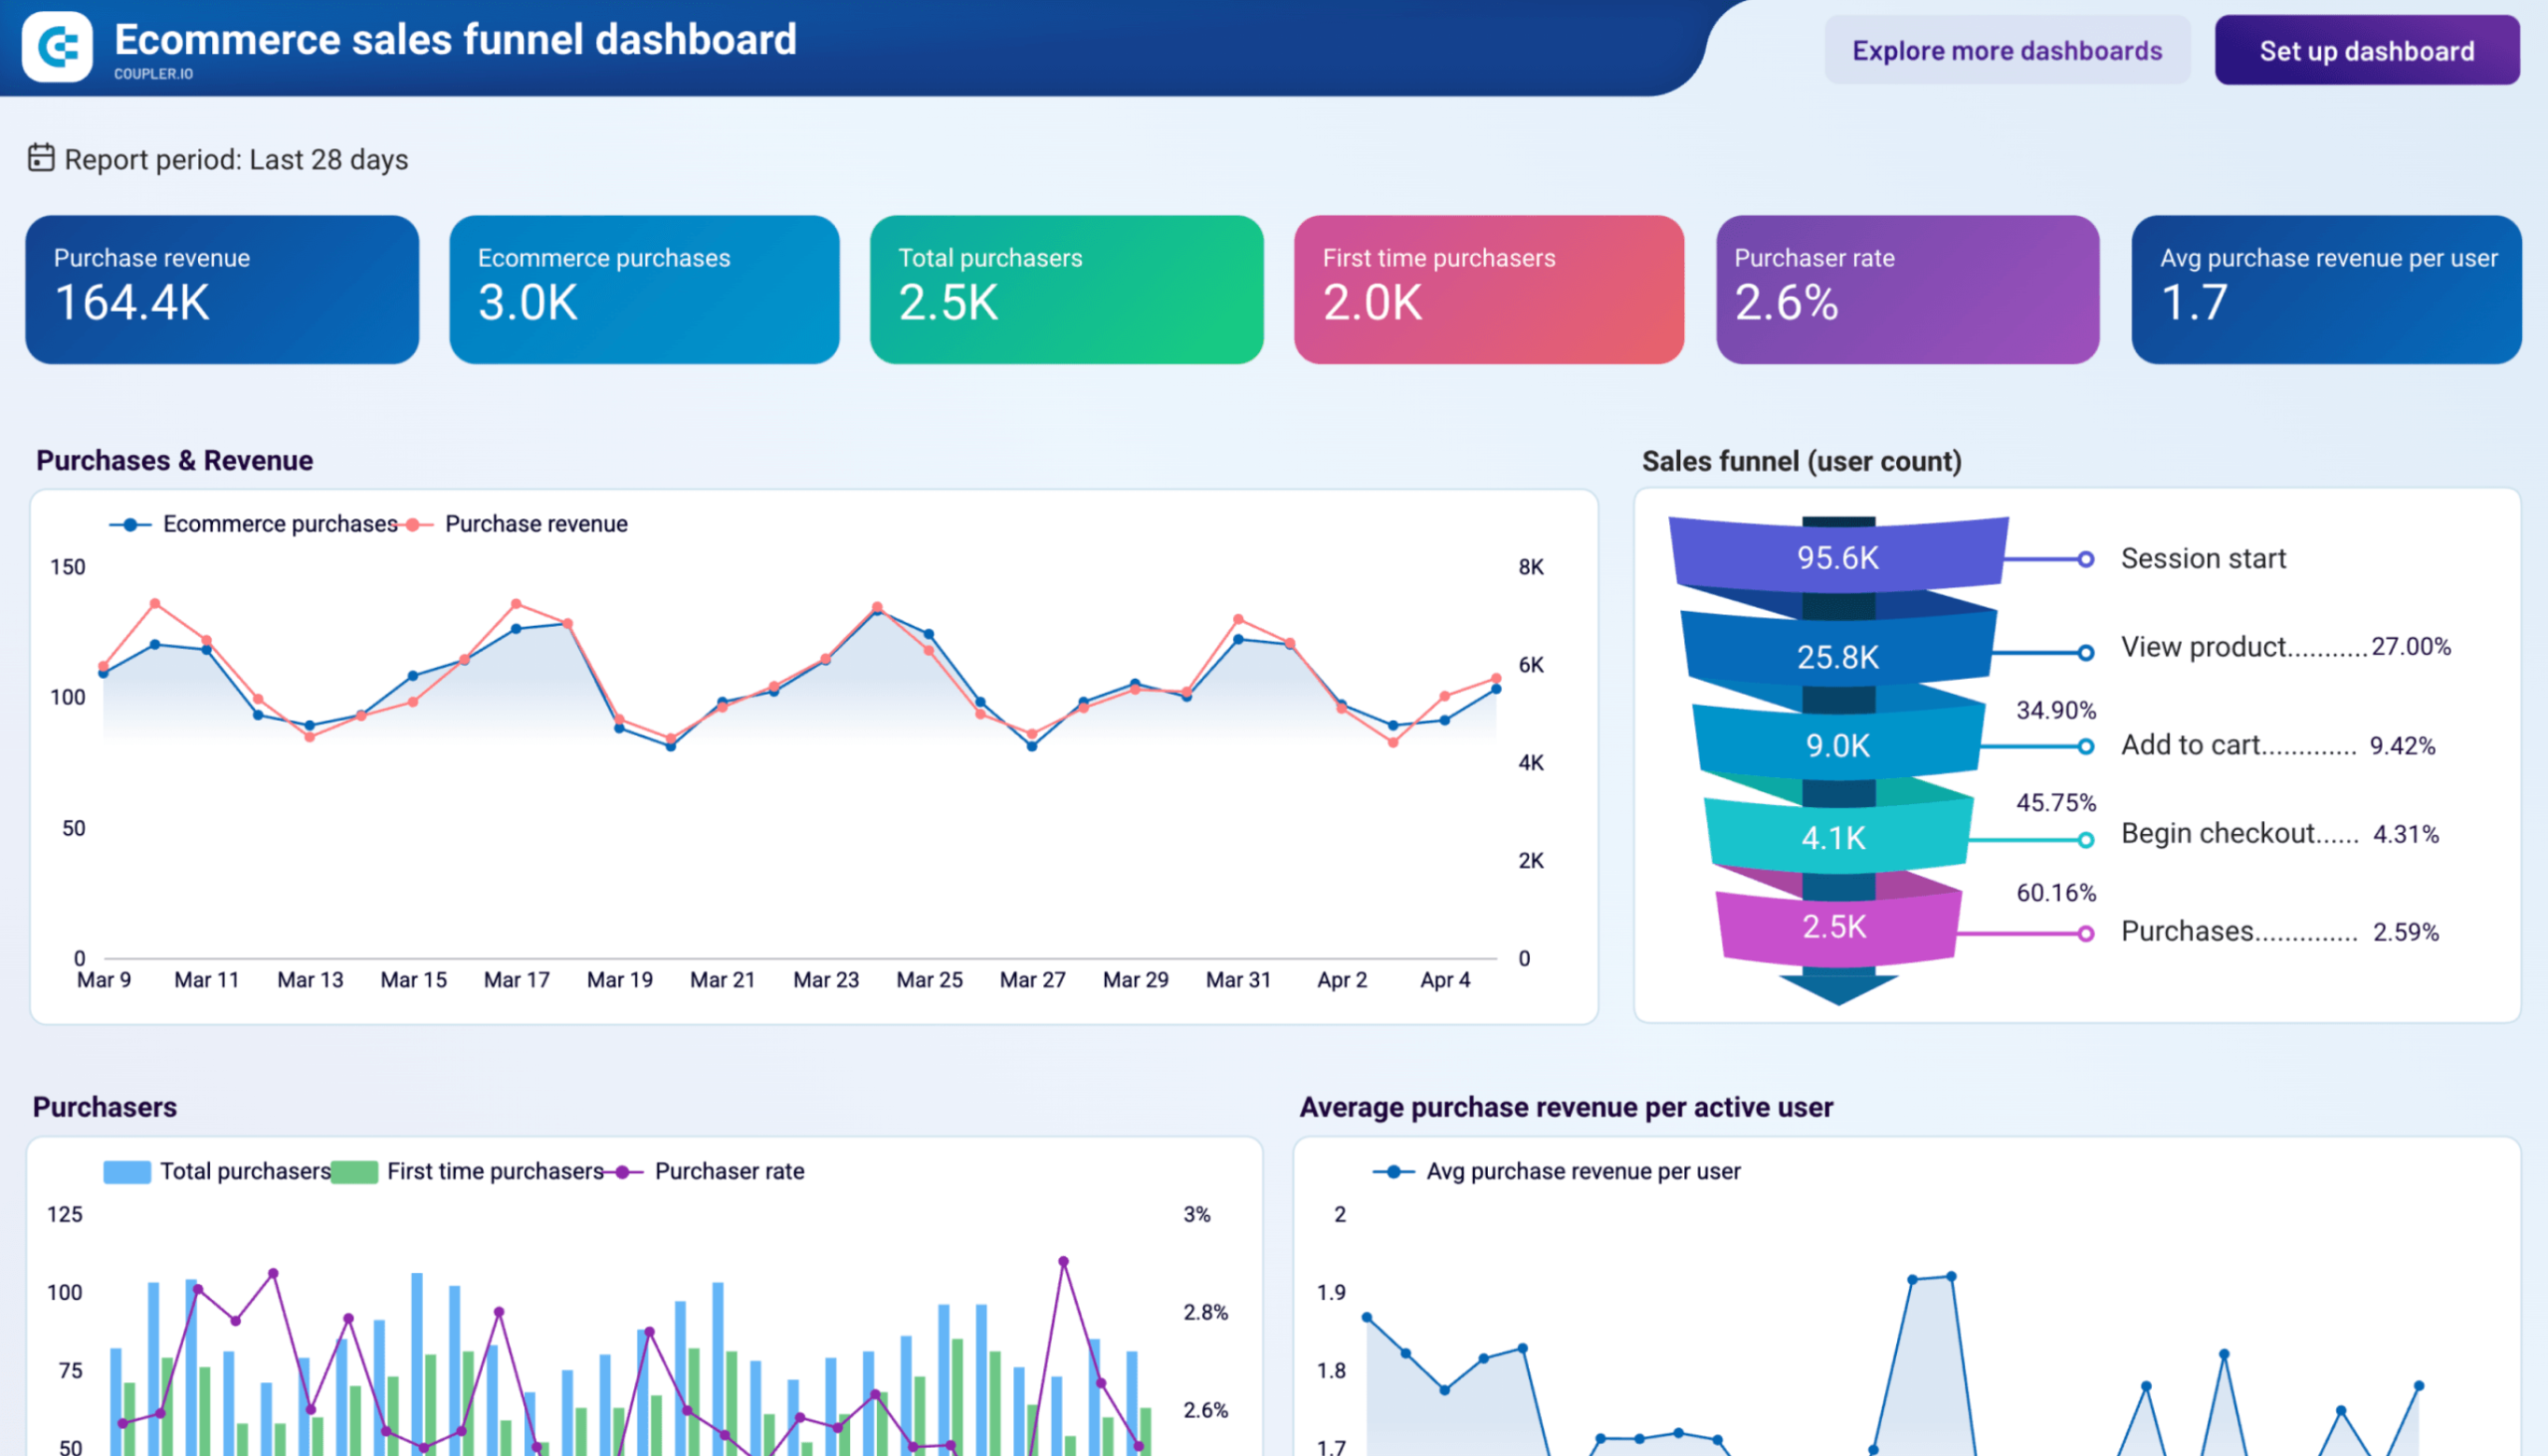
45. Ecommerce sales funnel dashboard for GA4 (+template)
Ecommerce marketers running paid or organic campaigns need to know how much of that traffic actually buys. This Data Studio dashboard connects to GA4 and visualizes the full purchase path from session start to completed transaction, with conversion rates at each of the five funnel stages. A dual-axis time series tracks daily purchases and revenue together, making it easy to separate traffic-driven revenue changes from order-value shifts.
GA4 ecommerce sales funnel dashboard
 Preview dashboard
GA4 ecommerce sales funnel dashboard
Preview dashboardThe channel breakdown on the overview tab shows new users by source and tracks total versus active users over time. This lets marketing teams connect acquisition activity to conversion outcomes: a channel that drives strong new-user numbers but shows low purchase rate signals a targeting or landing page problem, not a traffic problem. The dashboard is powered by Coupler.io, which handles the GA4 connection and data refresh automatically.
46. Store traffic dashboard for WooCommerce (+ template)
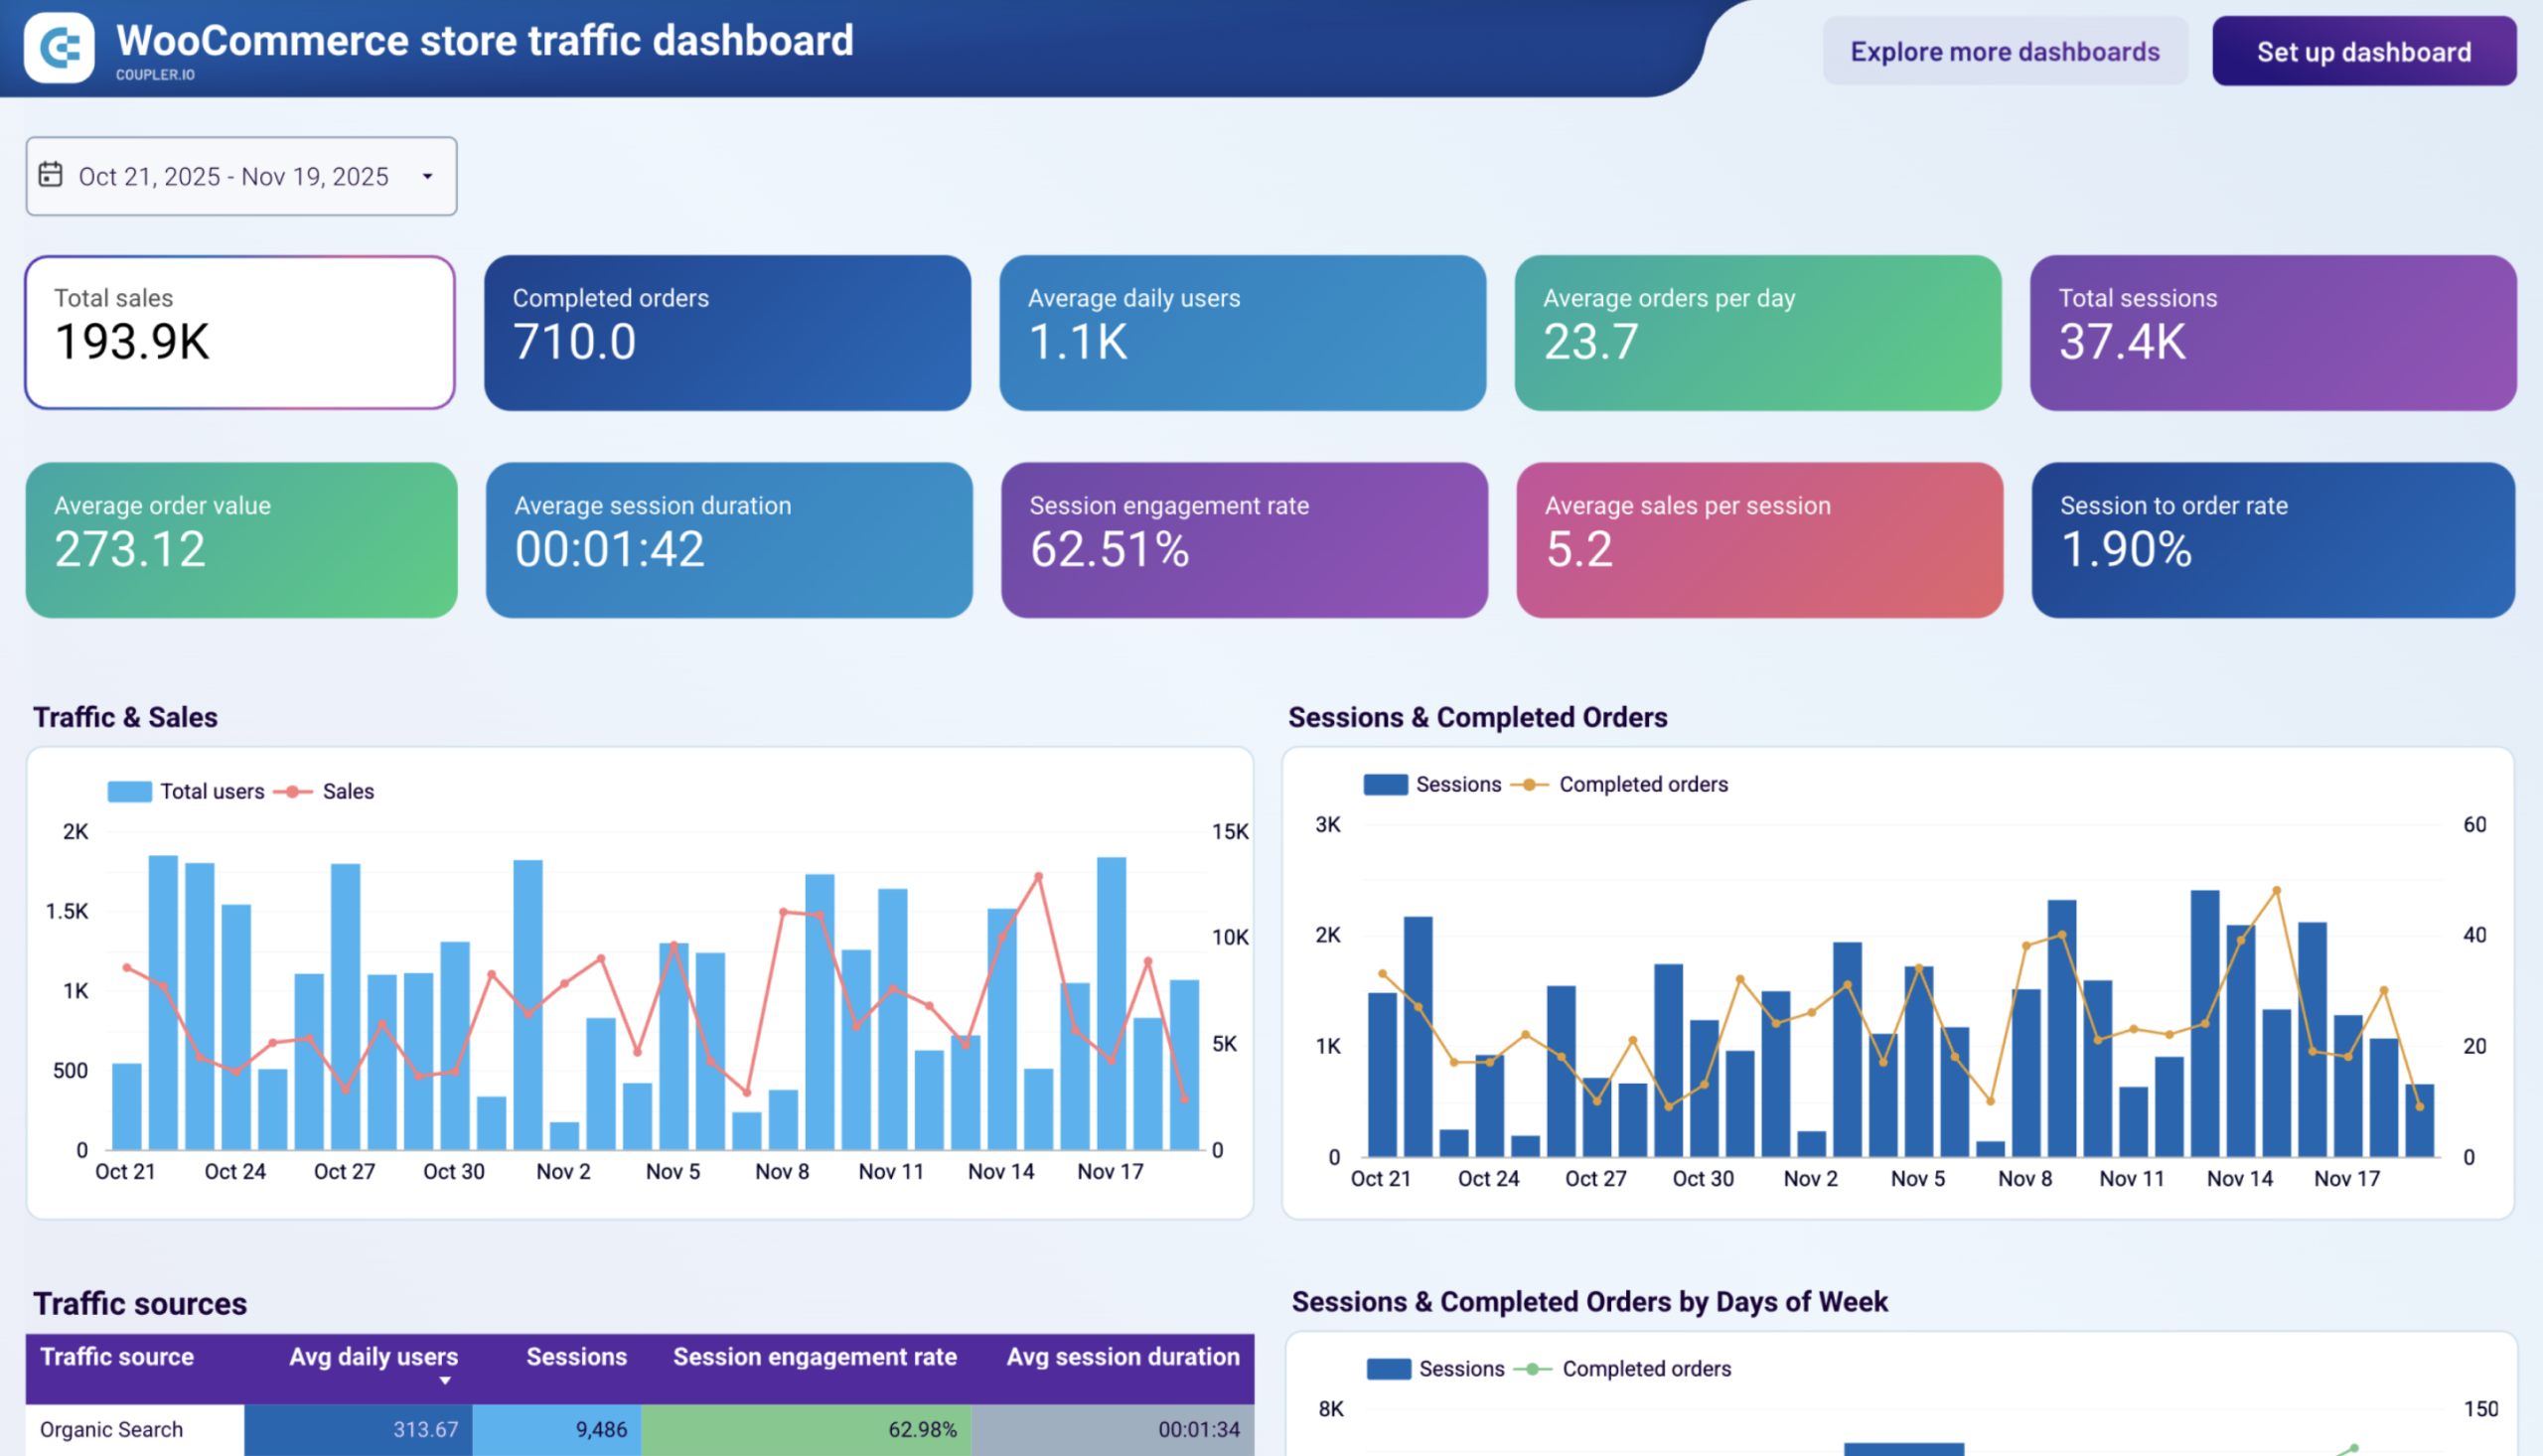
For WooCommerce store owners, knowing how much traffic you get is only part of the picture. Knowing which of that traffic actually buys is where the real insight lives. This dashboard blends Google Analytics 4 session data with WooCommerce order data to give marketing teams a single view of how acquisition channels, geographic markets, and day-of-week patterns translate into completed purchases.
WooCommerce store traffic dashboard
 Preview dashboard
WooCommerce store traffic dashboard
Preview dashboardThe traffic sources table ranks each channel by session engagement rate, average session duration, and session-to-order rate. This makes it immediately obvious which channels are sending quality traffic and which are inflating your numbers without contributing revenue. The dashboard is available as a free Looker Studio template with a Coupler.io connector.
47. Orders dashboard for WooCommerce (+ template)
Getting visitors to buy is one challenge. Understanding what happens to those orders (and whether your store handles them well) is another. This dashboard pulls data directly from WooCommerce to track fulfillment speed, customer purchase behavior, order pipeline health, and revenue by shipping destination in one place.
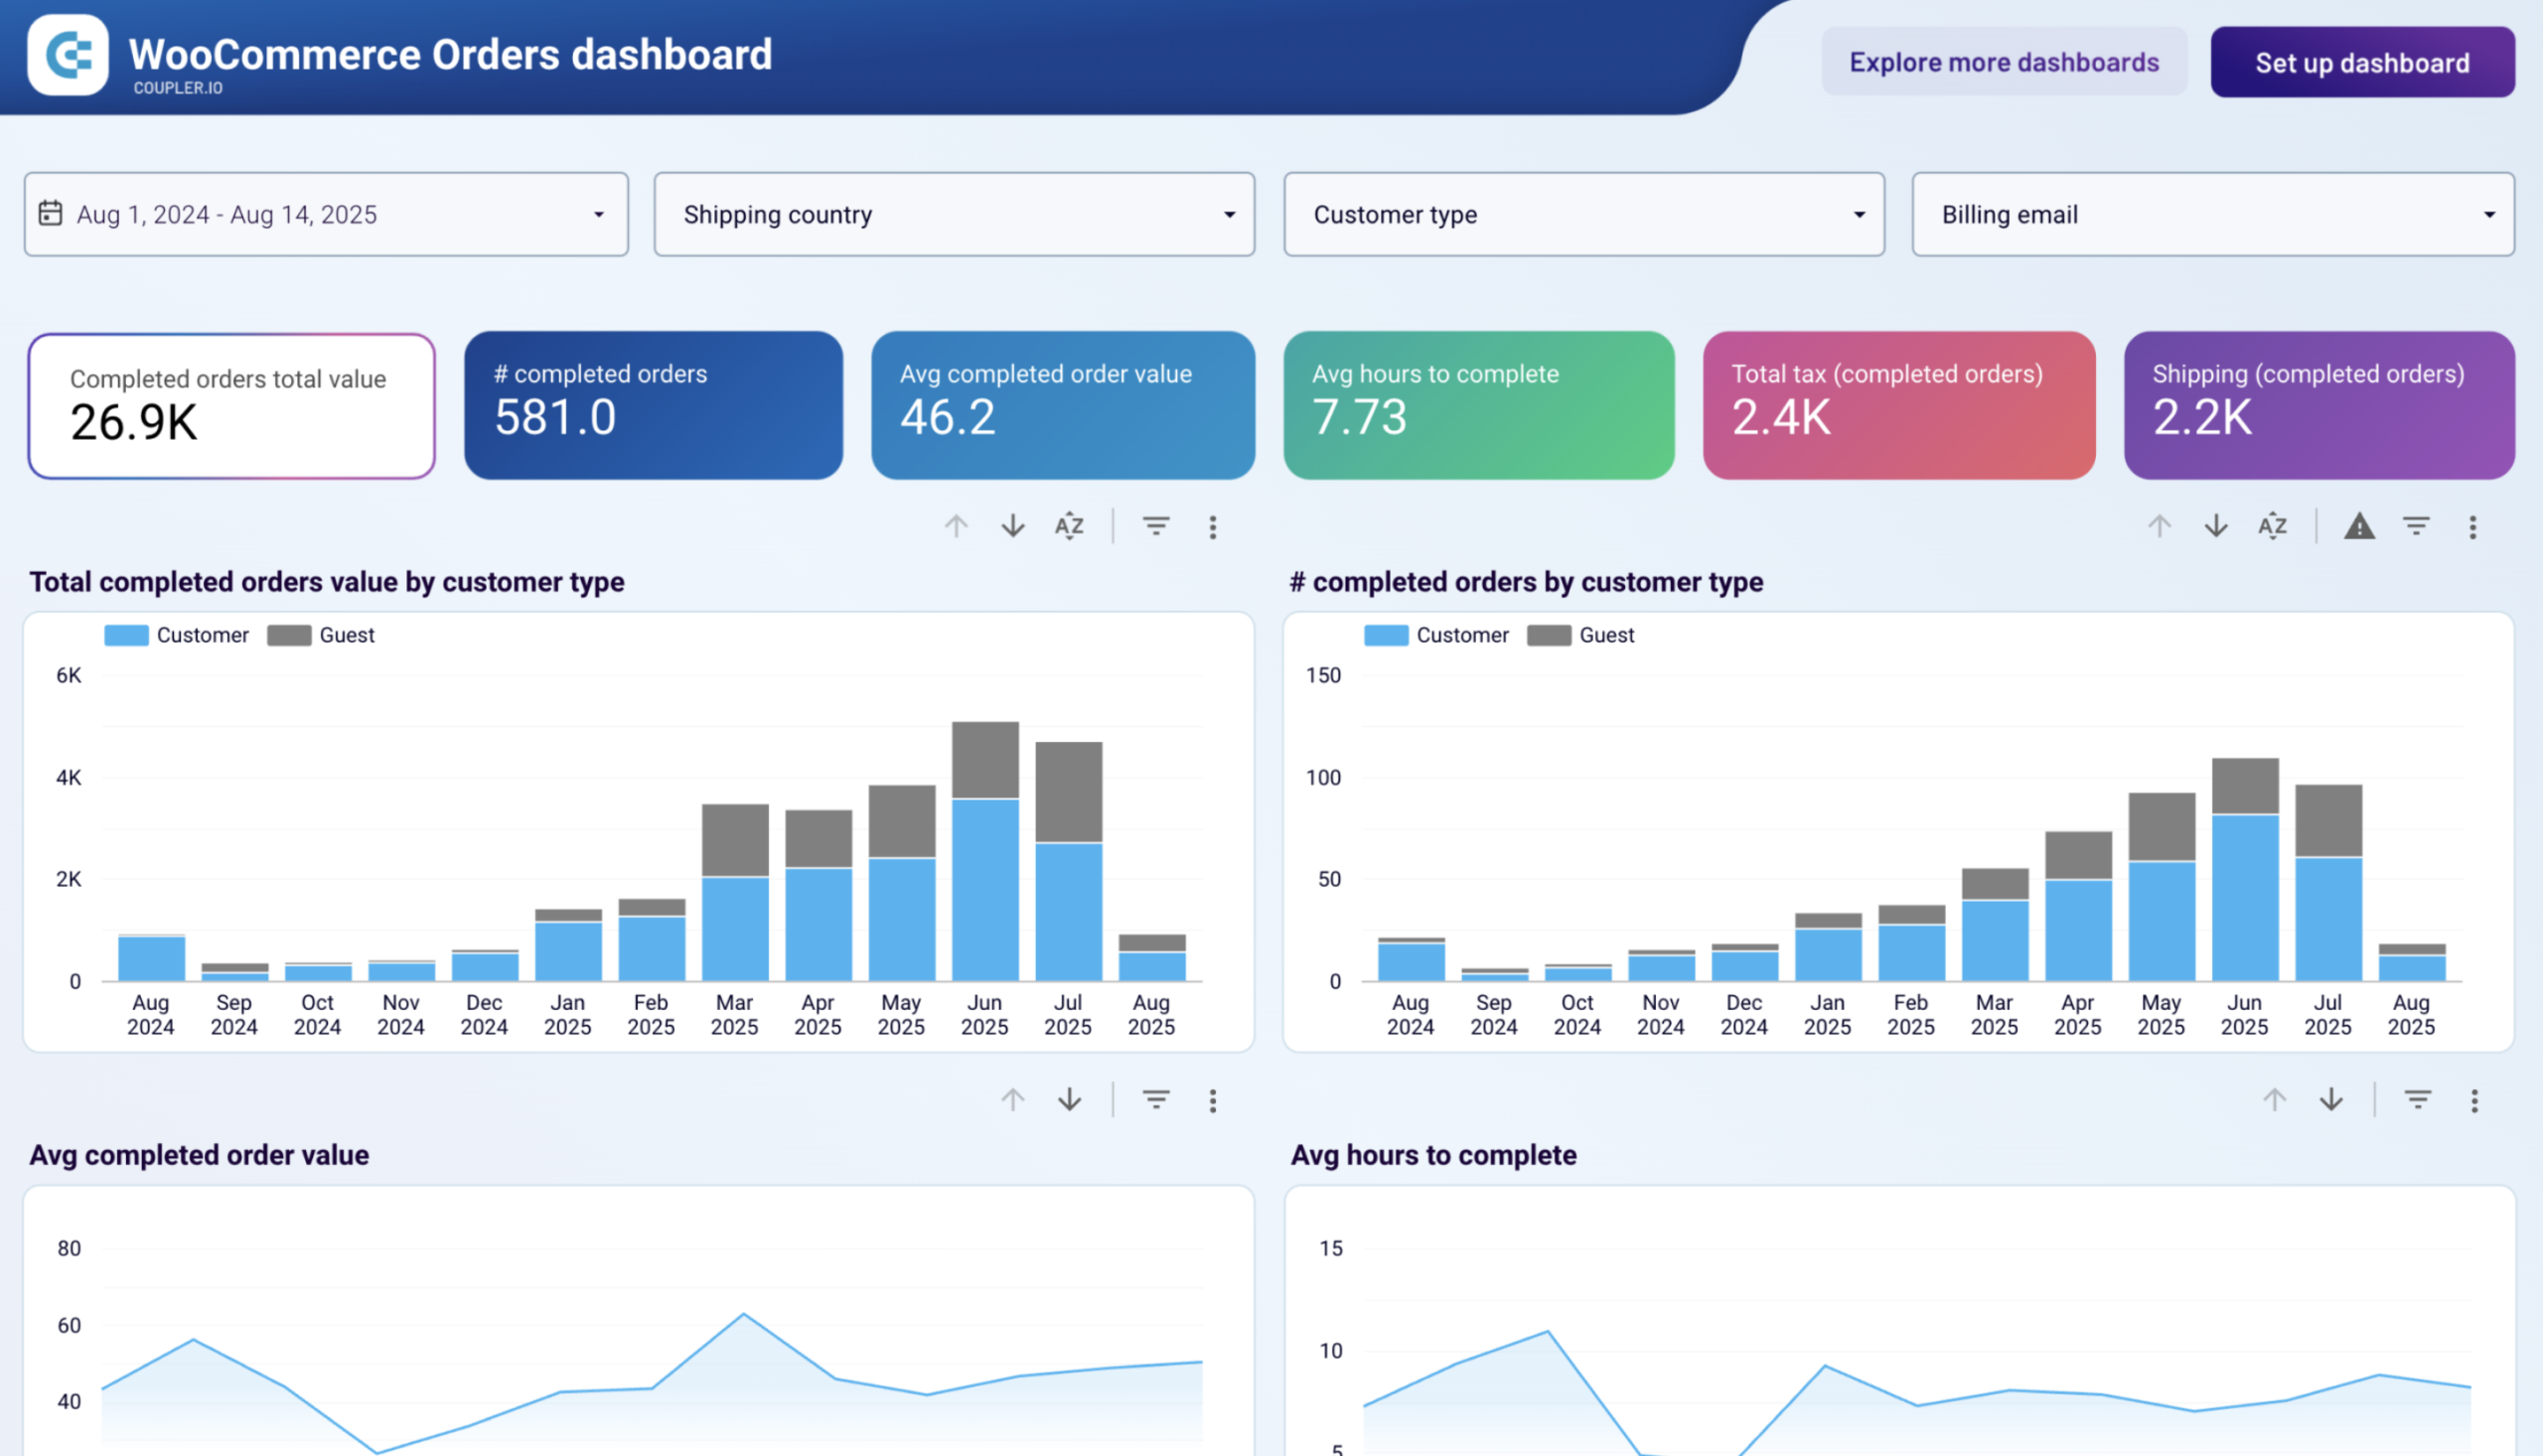
The order status breakdown flags how much of your pipeline is stuck in pending or on-hold, the customer type split shows whether registered or guest buyers generate more revenue over time, and the geographic map ties shipping destinations to actual order value.
The dashboard is a free Looker Studio template with a built-in Coupler.io connector. Connect your WooCommerce account, and it refreshes on a schedule you choose.
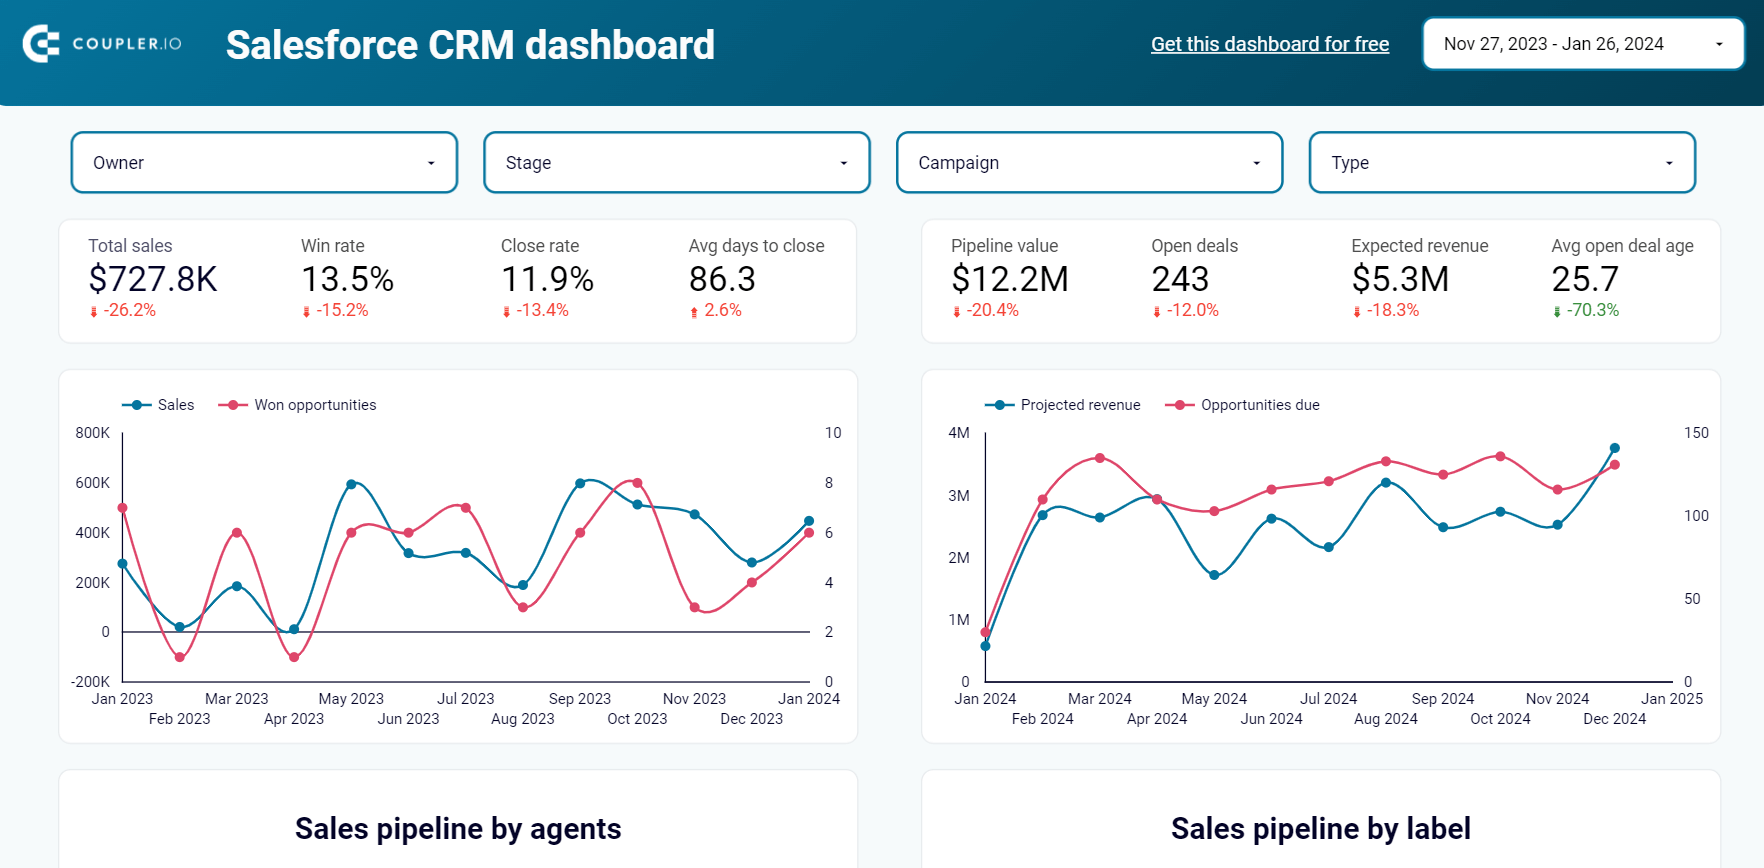
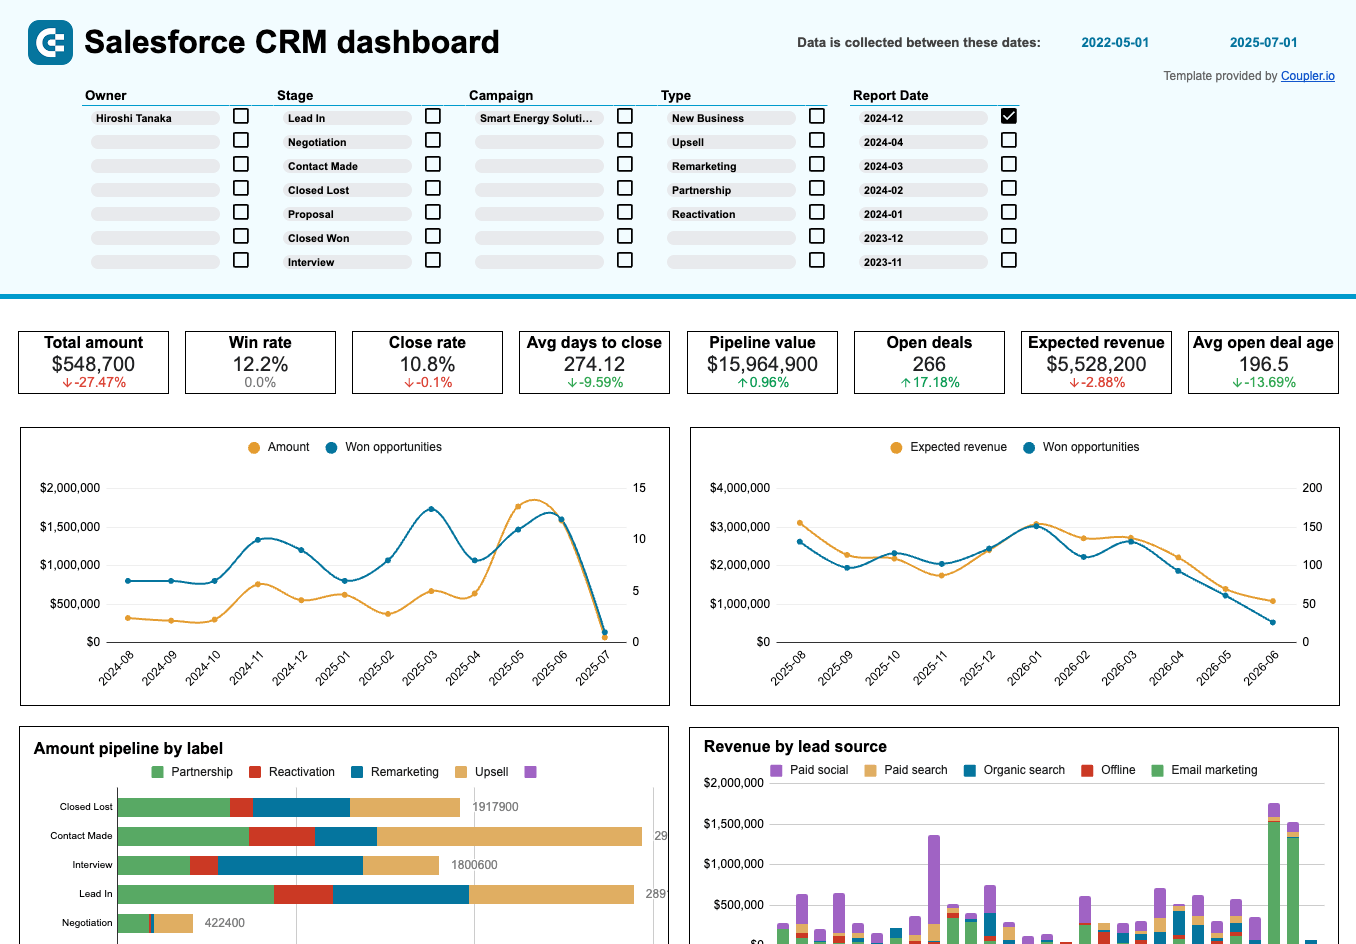
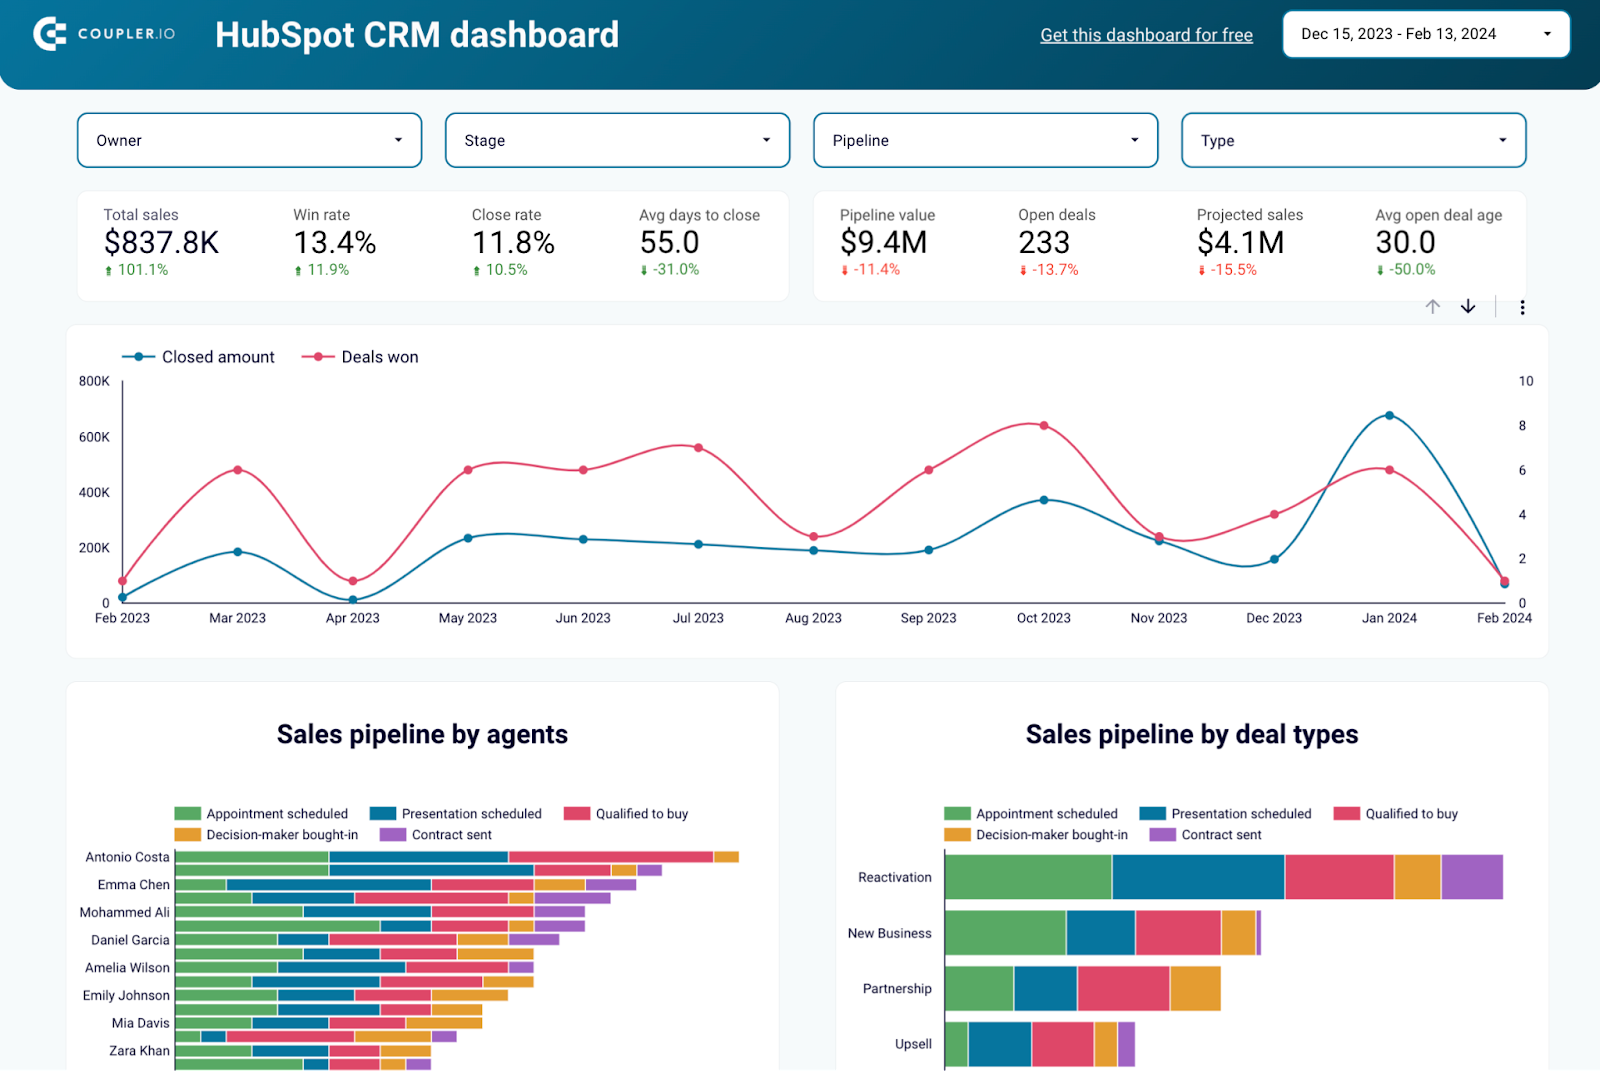
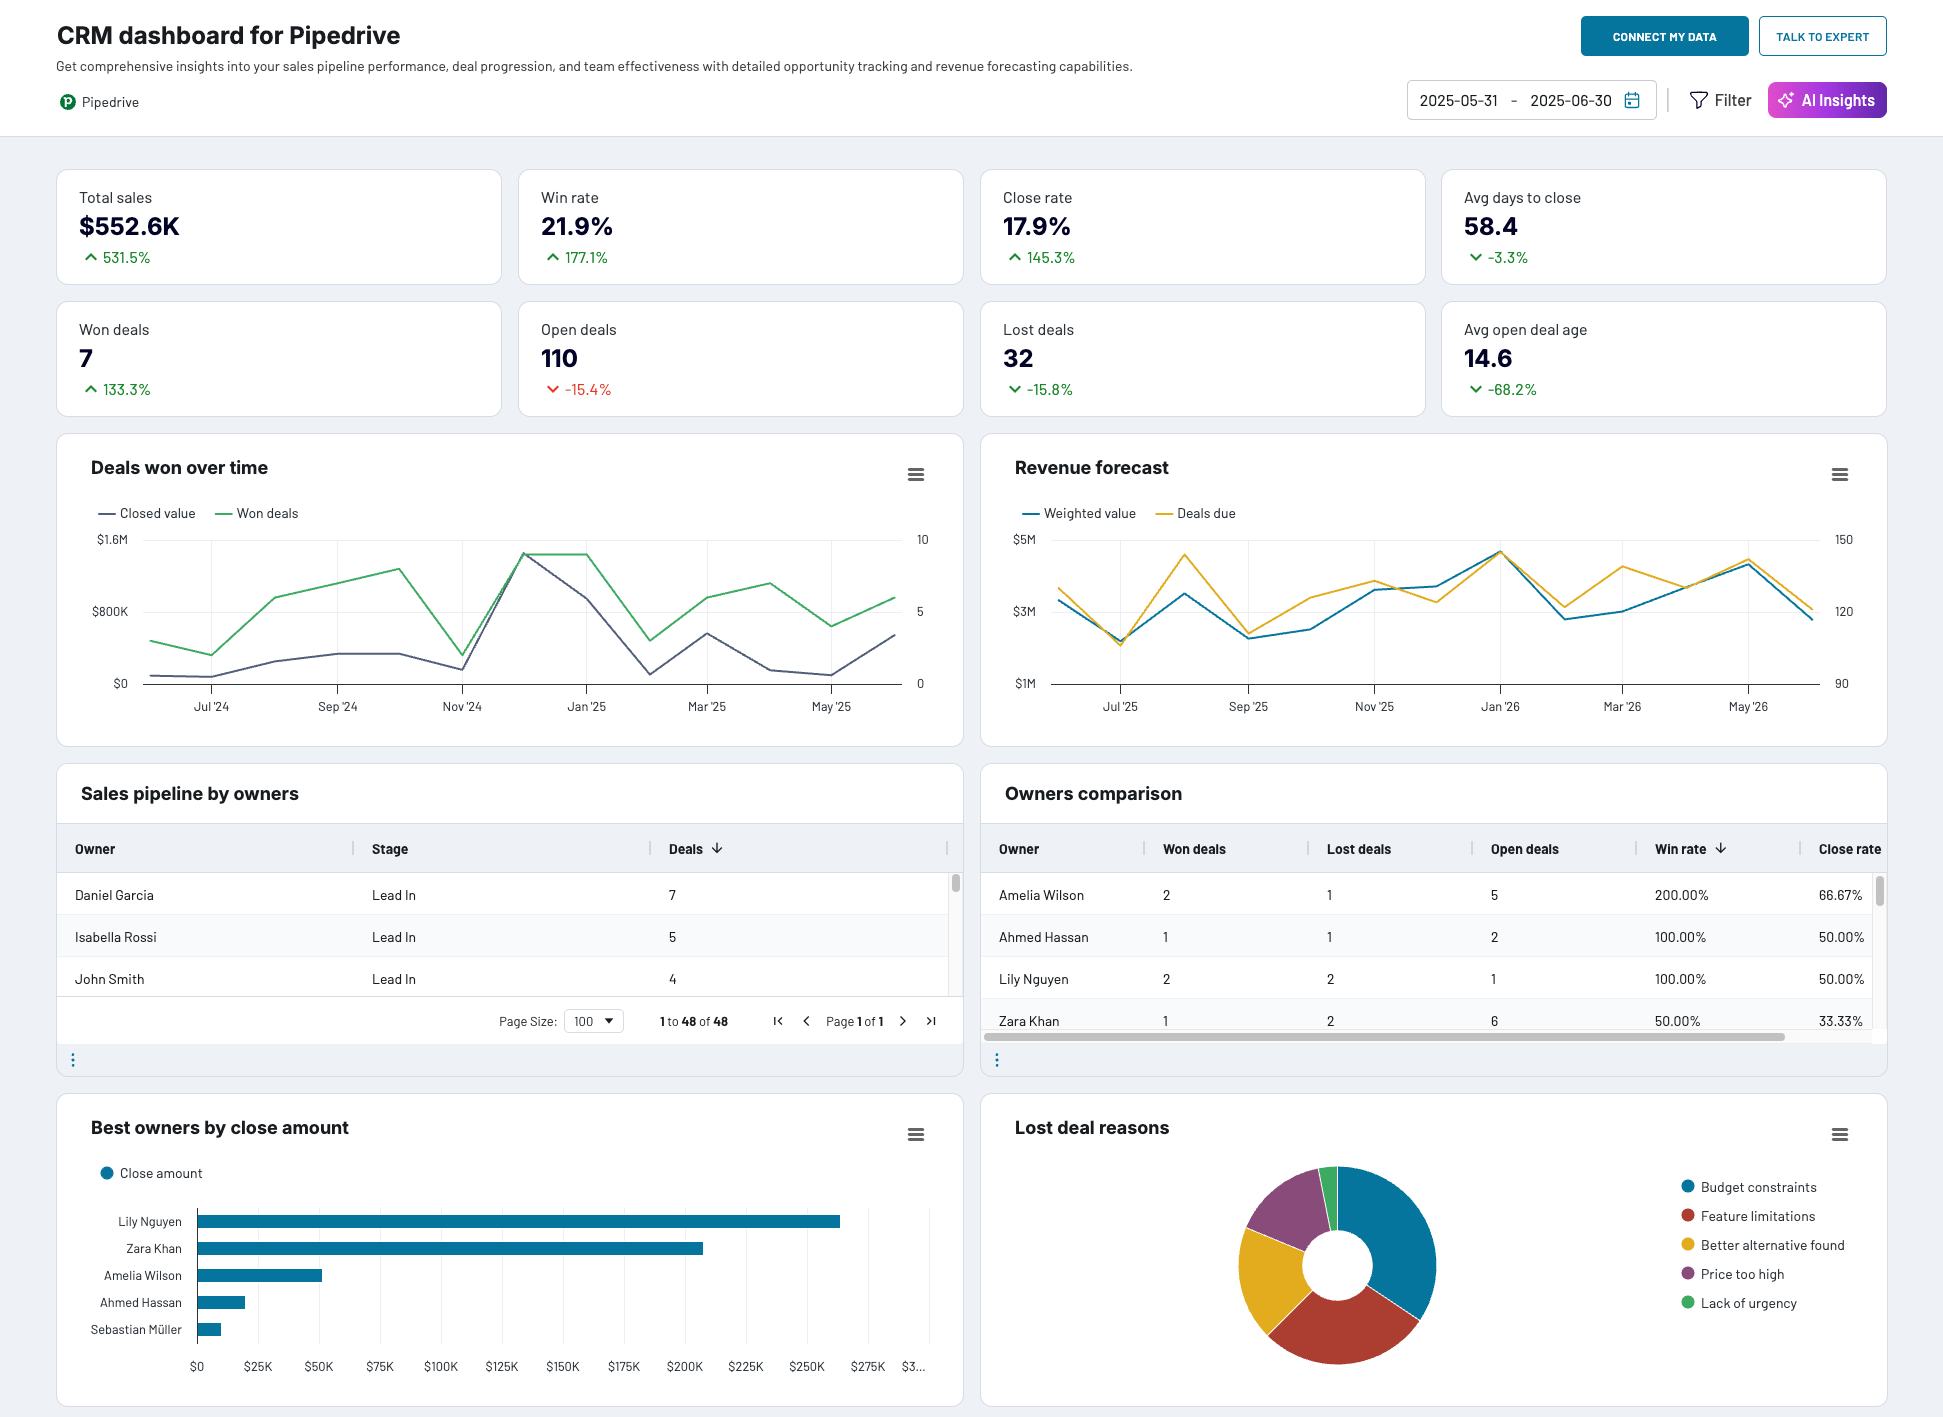
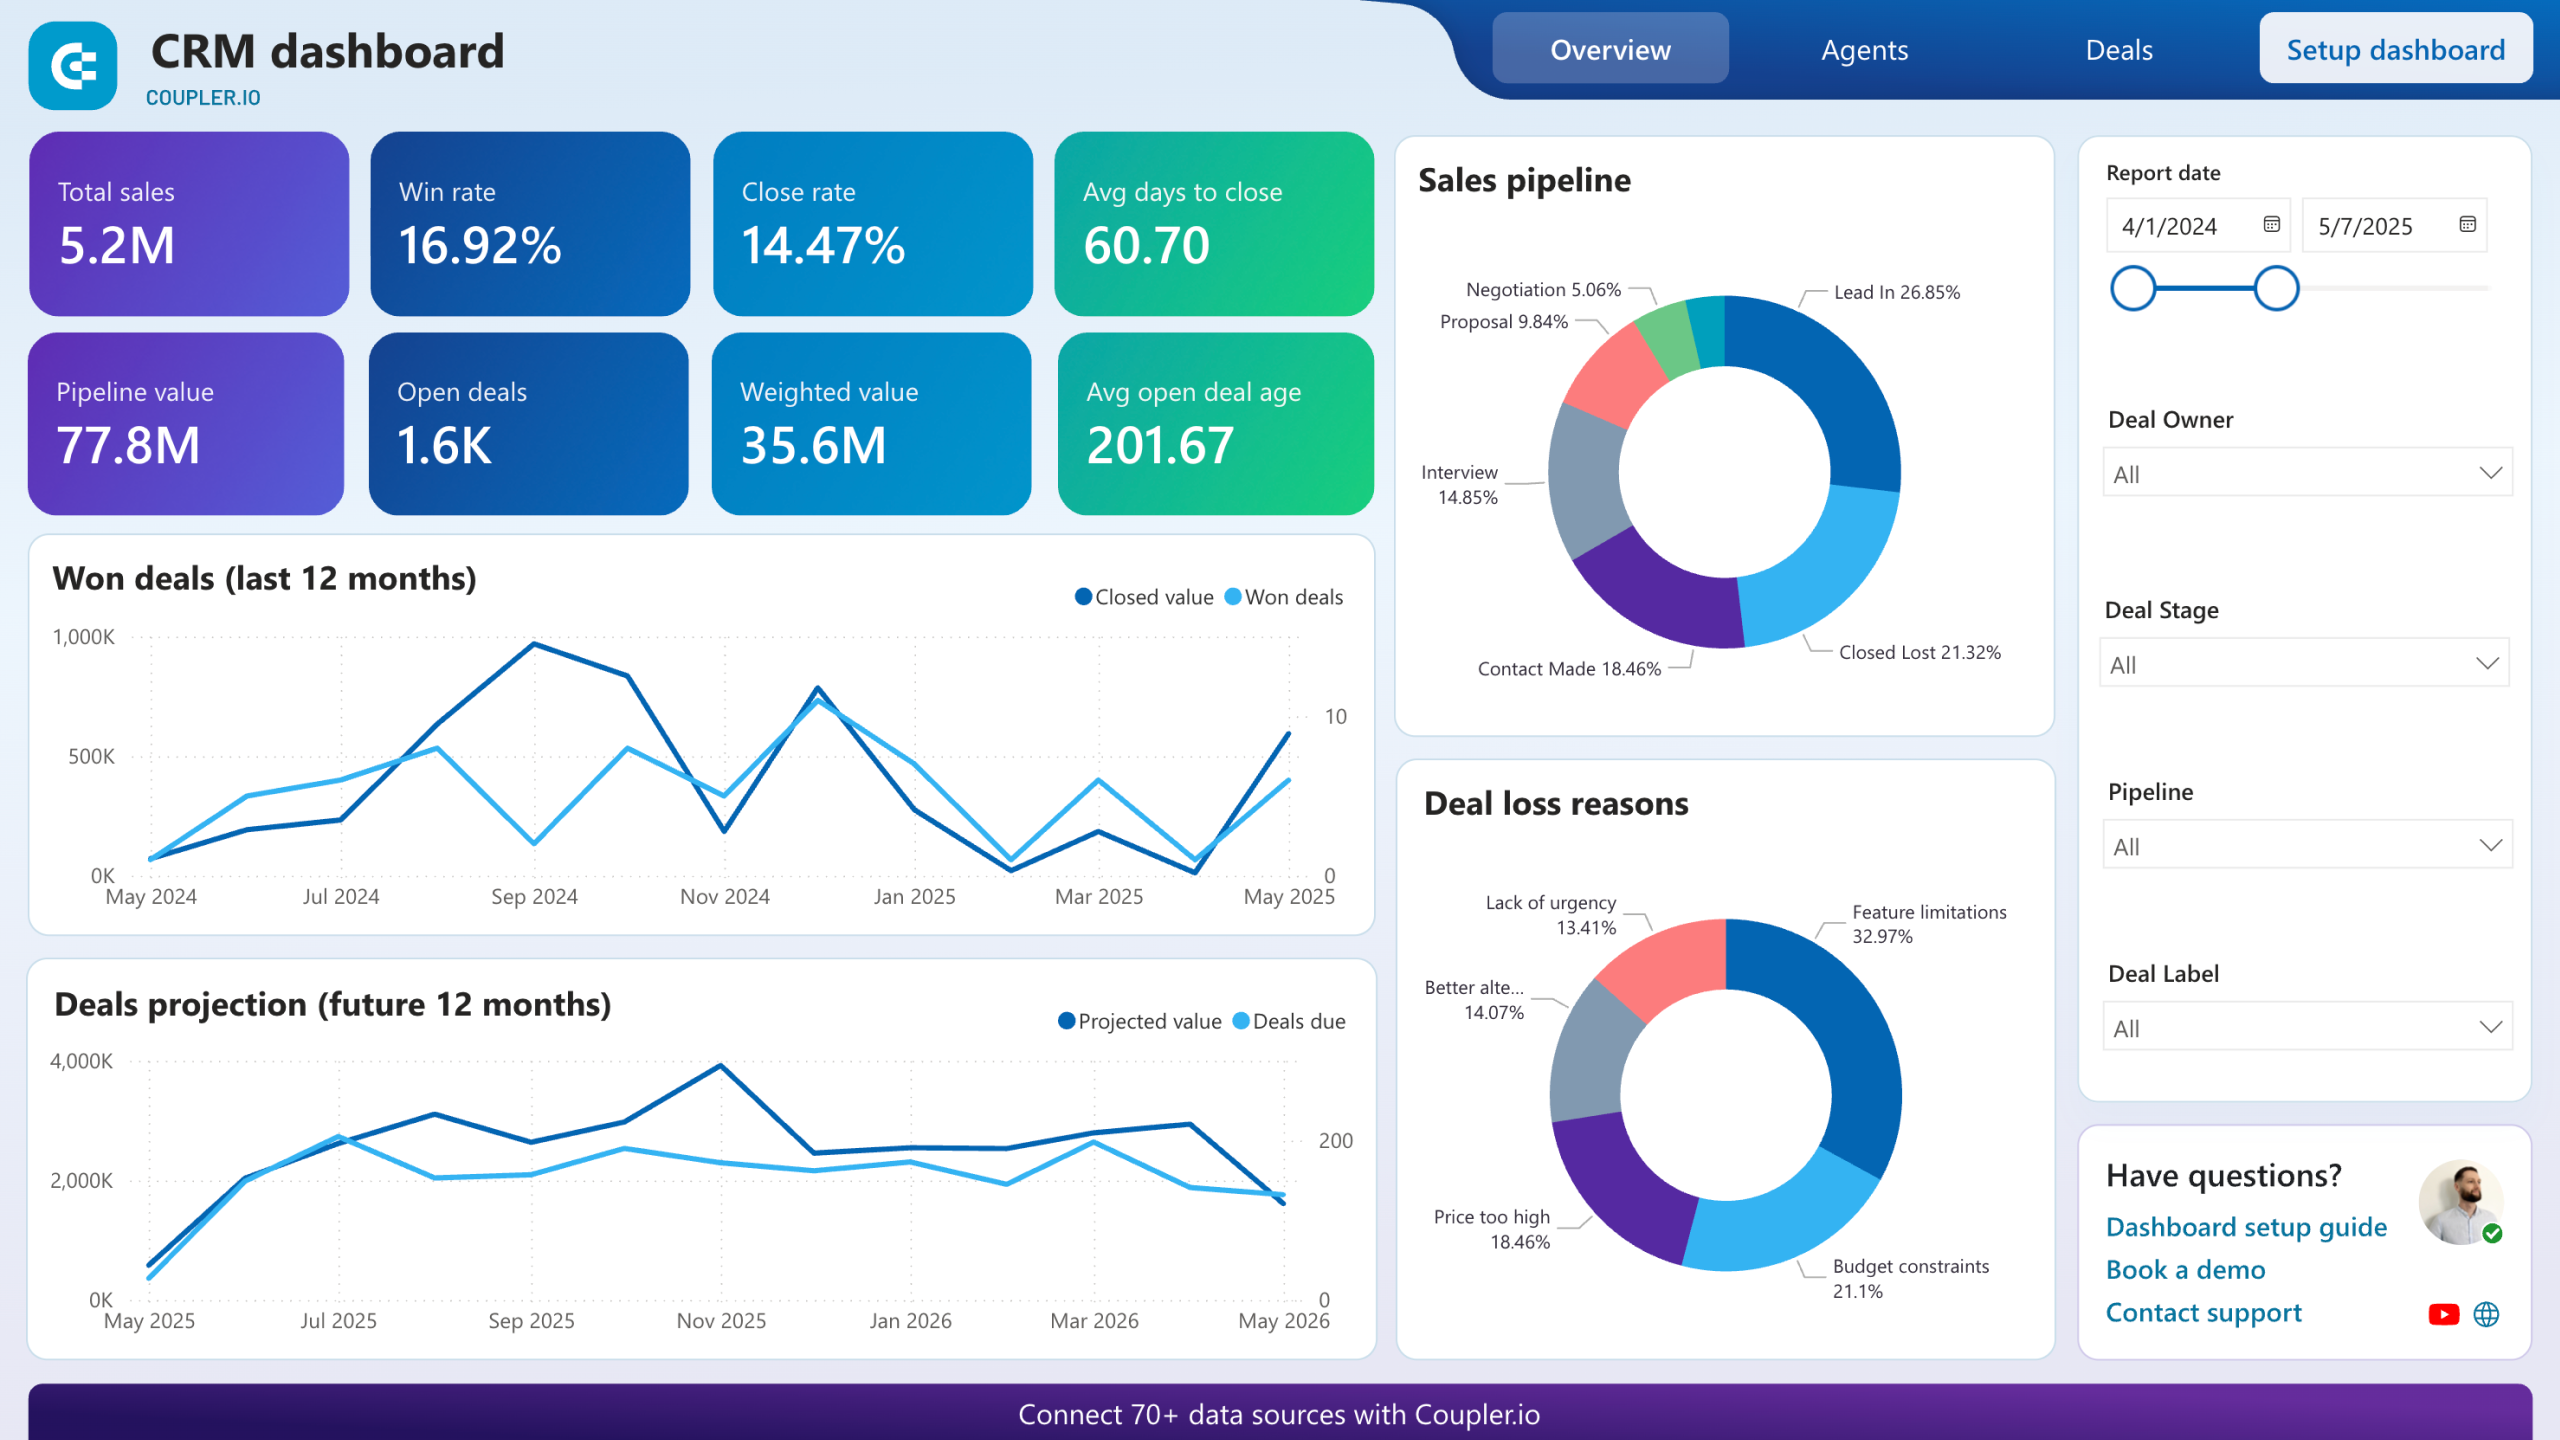
48. CRM dashboard for Pipedrive, Salesforce, or HubSpot (+ template)
While it’s not a strictly speaking marketing dashboard, a sales CRM dashboard gives marketers an excellent overview of what happens to the leads they generate. A comprehensive dashboard like the one shown above tells you which channels or even campaigns drive leads and generate revenue for the company. You can use such a dashboard to compare the quality of leads for different marketing sources and use this knowledge to prioritize (or deprioritize) particular approaches.
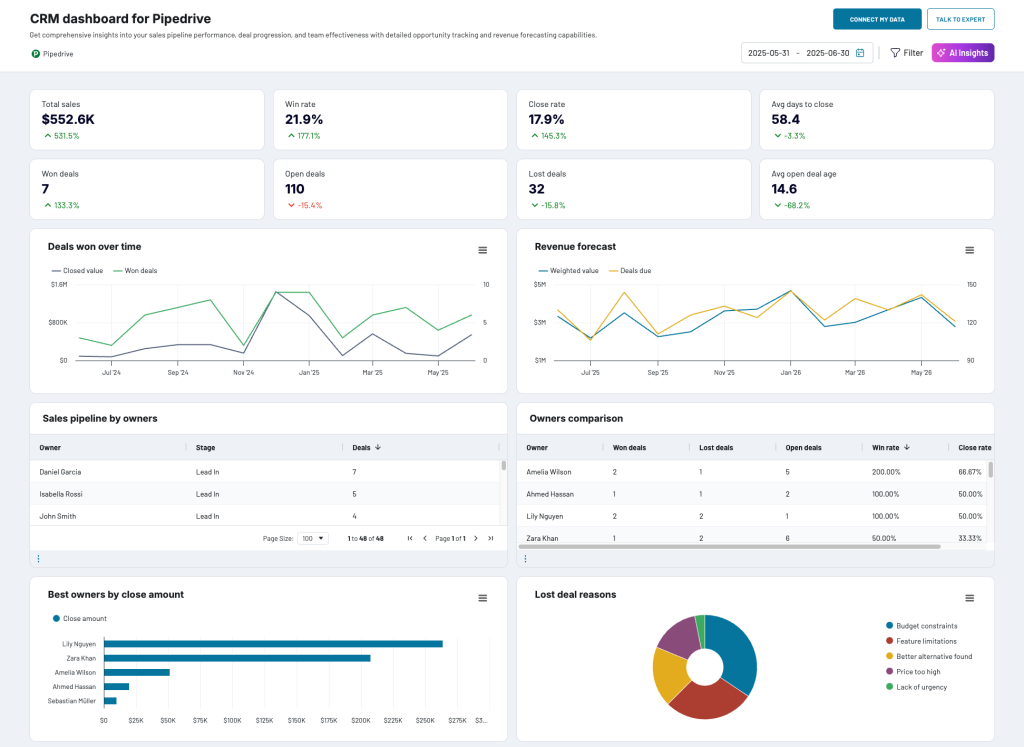
This dashboard template is designed in Coupler.io and pulls data from your Pipedrive app. There are also versions of the dashboard available in Power BI and Looker Studio, as well as in Google Sheets and Looker Studio for two other CRMs: Salesforce and HubSpot. Select the one you would like to get started with.


49. Digital marketing dashboard
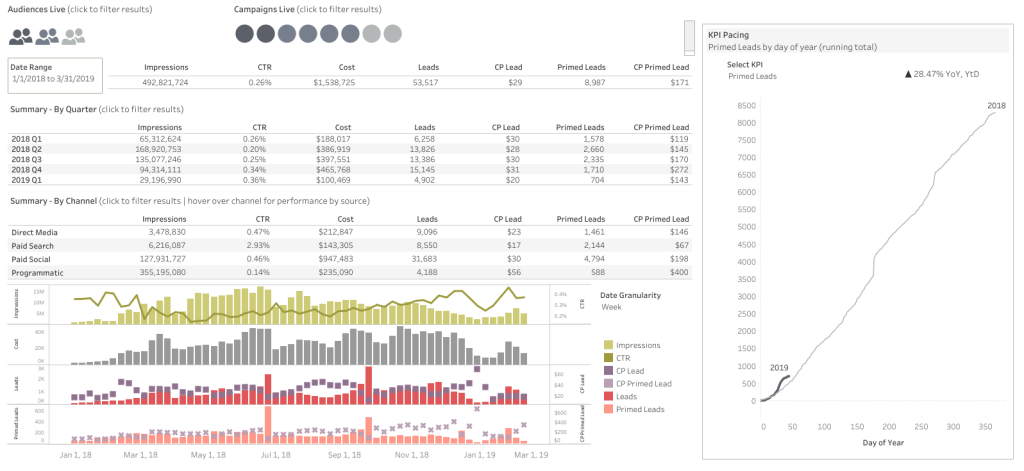
A digital marketing dashboard is a powerful tool for marketers. It’s designed to measure the performance and success of digital marketing campaigns. These dashboards usually display a set of different metrics, including visits, conversions, cost per acquisition, lead-to-customer ratio, and so on. In addition, you can use digital marketing dashboards to compare different marketing channels, such as social media and email marketing.
All in all, this category of marketing dashboards should provide you with an understanding of how well your marketing campaigns are performing. Based on these insights, you will be able to make the necessary improvements to achieve the set goals.
50. CMO marketing dashboard
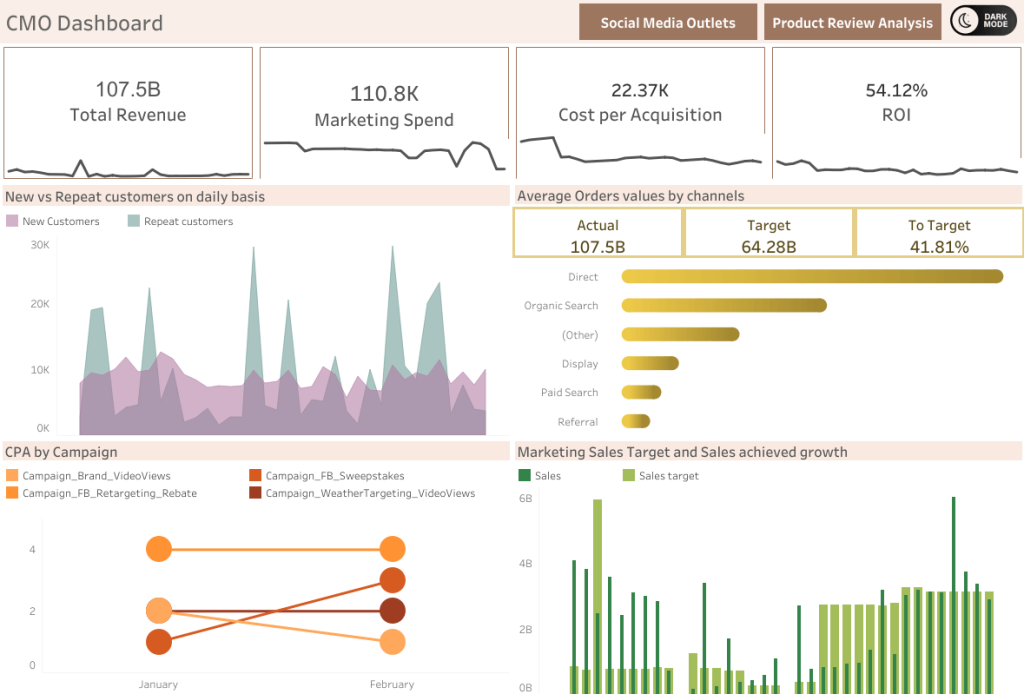
The Chief Marketing Officer (CMO) dashboard is the perfect at-a-glance answer to analyzing a wide range of marketing services, from social media and email to web performance and lead generation and more.
A CMO dashboard typically includes essential metrics such as website visits, engagement on social media, total revenue, rate of customer acquisition, and average revenue per customer. In addition, this dashboard may include a return on investments (ROI) metric. Together, these metrics can help CMOs succeed in providing a comprehensive analysis that enhances effective decision-making and proactive management strategies.
51. Affiliate marketing dashboard
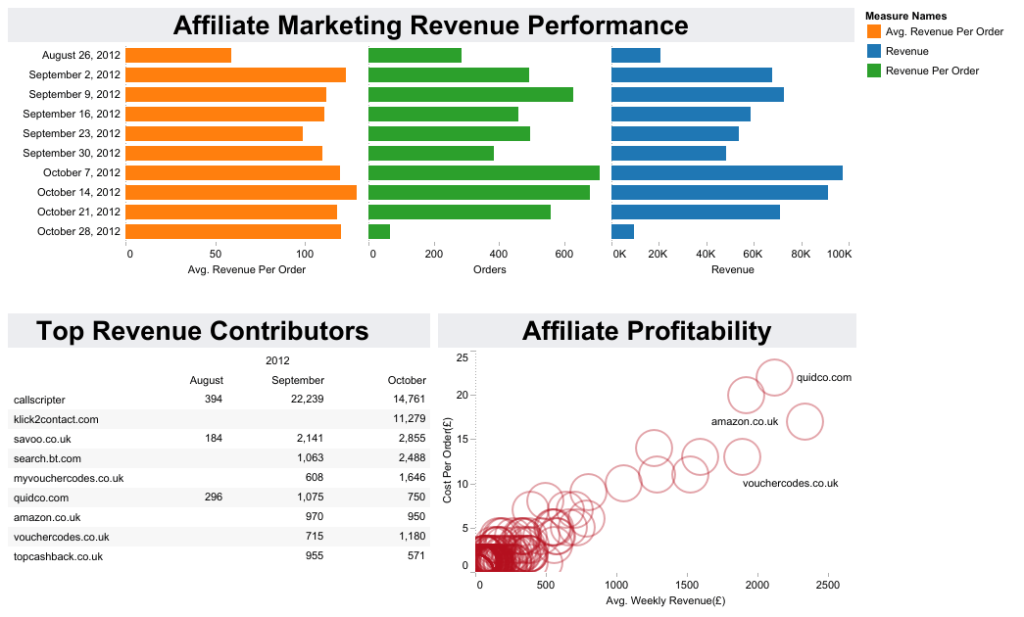
Affiliate marketing dashboards are essential for businesses to monitor the success of affiliate campaigns. Metrics included in an affiliate marketing dashboard usually involve clicks, conversion rates, revenue, top affiliate partners, and more. For more on this, learn how you can build an affiliate marketing funnel.
Marketing reporting dashboard from A to Z
A marketing reporting dashboard enables you to identify opportunities you may not have been aware of. But what is it actually? Why would you need it? Can you create it quickly using a template? We’ll answer all of these questions below.
What is a marketing dashboard?
A marketing dashboard is a performance management tool that displays a visual summary of marketing KPIs. It shows important information to help you achieve one or more objectives. This information is arranged in one place so you can easily monitor it at a glance.
Dashboards are ideally linked to real-time data sources. Generally, they display data in a summary fashion using charts, graphs, or “gauges” that look like a dashboard in a car.
Marketing dashboards should be designed for continuous monitoring. Other than that, the dashboards should be visible within the marketing department and other departments, as well as executives. This will help to facilitate accountability and the decision-making process. A dashboard for CMOs should be more high-level, and the report for a professional who manages a certain project – more detailed.
Why you need marketing dashboards
Well, any one of these reasons below is good enough to start using them as part of your marketing analytics process:
- To see the big picture. The process of data analysis encourages you to look more closely at the data. This is like peeling an onion, with multiple layers of data to explore. Taking a close-up view of the data is important, but you also need to step back and see the big picture. A dashboard is one of the best ways to provide this “big-picture” view.
- To spot trends. Seeing the big picture helps you easily spot trends that can only be seen when data is seen in aggregate and over time. This helps you understand if something is a one-time event or a trend. If something bad happens over and over again, it might mean that you need to change what you’re doing.
- To compare metrics side by side. Dashboards show all the key metrics in one place, and this will help you make comparisons easily. If you only look at one piece of information, you might make the wrong decision. For example, if something looks good or bad by itself, it might not be as good or bad when you compare it to other things. A metric that seems troubling when viewed in isolation is perhaps less alarming when viewed alongside related metrics.
- To show accountability. People in the organization are often skeptical about how well marketing is doing. By using dashboards, the marketing team can show that they’re really helping the organization succeed. This benefit is perhaps the most important reason for marketing to adopt the use of dashboards with its analytics process, even if they are not needed for any other reason.
Can you use marketing dashboard templates?
Yes. Templates can make building a custom dashboard easier and faster.
Many websites and platforms offer downloadable templates for spreadsheet apps like Google Sheets or Excel. For example, you can download HubSpot’s marketing reporting dashboard template for free to get started quickly.
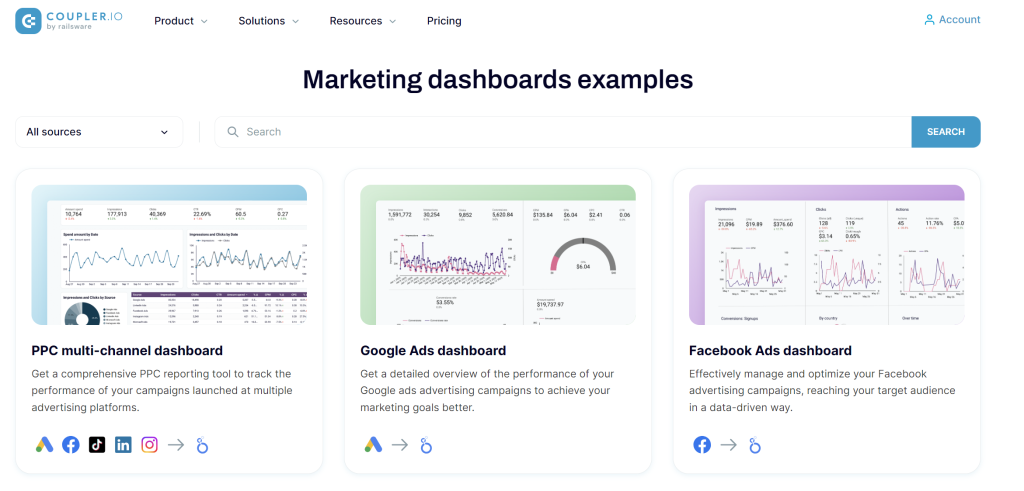
Many templates are also available for BI tools, such as Tableau, Looker Studio, and Power BI. For example, Coupler.io, a reporting automation solution offers a gallery of marketing dashboard templates designed in Looker Studio. These templates are equipped with a built-in connector to a dedicated data source. So, you can fast and easily connect a template to your marketing app and start using it right away.
Now, what if… you don’t want to build a marketing dashboard in Looker Studio yourself, either from scratch or using a template? You could hire a data analyst or a company to make a custom and high-quality dashboard for you. For example, Coupler.io offers a data analytics consulting service to handle advanced data management cases, such as creating auto-updating dashboards that display essential metrics to help you make data-driven decisions.
Types of marketing dashboards
Because there are a variety of marketing dashboards, it’s easier to separate them into two broad categories based on high-level functions: strategic and operations.
Strategic dashboards help with planning and making decisions, while operational dashboards help with tracking progress and seeing how well things are going. Some dashboards only focus on strategic planning or operations, but some do both.
Strategic marketing dashboards
These dashboards provide invaluable insight that helps to give direction to the marketing function. By displaying the “strategic” analytical results, these dashboards ensure your marketing team is doing the right things and investing its resources in the best possible way. This type of dashboard provides predictive analytics results that better equip your team for future success.
For example, a dashboard of this type may include the ability to accurately predict the conversion rates of future leads in your sales funnel. Thus, efforts can be focused on those customers most likely to show an interest, leading to quicker revenue growth overall.
Operations marketing dashboards
Operations marketing dashboards provide a valuable look into an organization’s digital presence. Unlike strategic dashboards that offer predictions, these dashboards are backward-looking.
The data is from numerous digital touchpoints, including the website, microsites, social media, and mobile. They are compiled so organizations can gain insight into the performance of each channel through metrics such as reach and impressions.
You will better understand the performance of each of those digital channels. Not only that, but an overall integrated picture will help you understand trends or correlations. With these insights, you’ll have the info needed to make effective changes for better outcomes.
How to create marketing dashboards: DIY steps
Now, how do you actually create a marketing dashboard similar to the one above? You need to follow a few steps that define the entire process and make it clear and easy.
Step 1: Define your marketing dashboard KPIs
The first step to creating a marketing reporting dashboard is defining the KPIs you want to measure. Each KPI should be tied to a goal or objective of your marketing strategy, so it’s crucial to have that in mind before you begin.
You can track marketing performance with a wide variety of metrics, including engagement rate, cost per lead, conversion rate, and so on. Your task is to select the KPIs relevant to your goals. In addition, you need to consider which metrics you can track with the available tools and apps.
It is not a good idea to display vain marketing metrics on your marketing dashboard KPI. It would be best to start with just a few of the crucial ones and then add up others that prove to be necessary for analytics. The pioneer set of metrics will likely uncover other metrics you’d like to add to the dashboard.
Additionally, when choosing KPIs to put on your dashboard, it is important to consider how they affect each other. This way, your dashboard will provide an accurate view of how marketing efforts are going.
Step 2: Select your marketing dashboard software
There are so many tools available for marketing analytics, for example:
- You can use Google Analytics or Adobe Analytics to track your website traffic and see how people use your site.
- Kissmetrics and Mixpanel provide more granular reports on specific marketing metrics.
- Looker Studio, Tableau, Qlik, and other data visualization and BI tools to create customized dashboards.
To select proper software or a set of solutions, you have to consider the needed features, how well the tool integrates with other existing systems in place, scalability, and, of course, budget.
Step 3: Connect to data sources
The next step when creating your marketing dashboard is to collect data from marketing data sources. These could be advertising platforms, CRM platforms, web analytics apps, and other marketing tools. Information gathered from these sources contains data and metrics required for successful reporting.
It’s also a best practice to use data connectors or data integration tools like Coupler.io. It’s a platform that allows you to automate data flow from different sources into your dashboard. This way, all the source data you need for your dashboard will be in one place.
The key is to make sure that the data you collect is accurate, up-to-date, and has good quality.
Coupler.io ready-to-use connectors are based on APIs. At the same time, it allows you to create custom integrations with sales and marketing APIs.
Step 4: Add charts and graphs to your marketing dashboard
Now, it’s time to add charts to visualize your marketing data in an easy-to-understand format.
You need to choose the right type of visualization for each metric. For example, line graphs are good to show the performance variation over time.
In addition to traditional charts, some BI tools offer interactive data visualizations. Making your dashboard interactive with the help of sliders or dropdowns allows users to gain additional insight into their KPIs without using additional queries or calculations.
There are a variety of ways to share your dashboard with stakeholders using different tools. Some of them allow you to export your dashboard into a shareable format, for example, PNG or PDF. Then you can share the file via email or chat. Other tools let you embed the dashboard in a website or app.
The most important aspect is to make your marketing dashboard accessible to the people for whom the dashboard was built. Only give access to those who need to see it for various tasks and purposes. Your data is important, so keep it safe. There’s no need to share it with the entire world. Just keep only those who require access informed on your chart analysis, marketing plans, and results.
Step 6: Improve your marketing analytics dashboard regularly
In order to ensure that your marketing dashboard remains useful, you should review it regularly and make any necessary adjustments. Look for anything that needs to be corrected or improved.
You should also make sure that all the information is accurate as checking the accuracy of all the information is important in ensuring its reliability.
A metric is trending downward, and you don’t know why? Double-check its source before making decisions about what to do next.
Finally, remember that metrics alone can’t tell you everything—they have to be interpreted to gain meaningful insights. It may be worth hiring an experienced analyst who knows how to read data and interpret results accurately. That way, you can be sure you’re making the right decisions for your business.
Bonus tip: make your marketing dashboard automated
An automated marketing dashboard can be a huge time saver when it comes to refreshing your data on a specific schedule. Ensuring your data is regularly updated and accurately presented can benefit you and your team immensely — providing you with the information you need to plan and execute successful campaigns efficiently.
Fortunately, there are data analytics platforms that offer out-of-the-box automation solutions. such as Coupler.io is one of these and with it, you can schedule automatic data refresh with total convenience and trigger it or make it trigger certain events like email sending. You don’t even have to write code. This tool lets you focus on making good decisions about your marketing strategies without having to spend extra time and effort on manual updates.
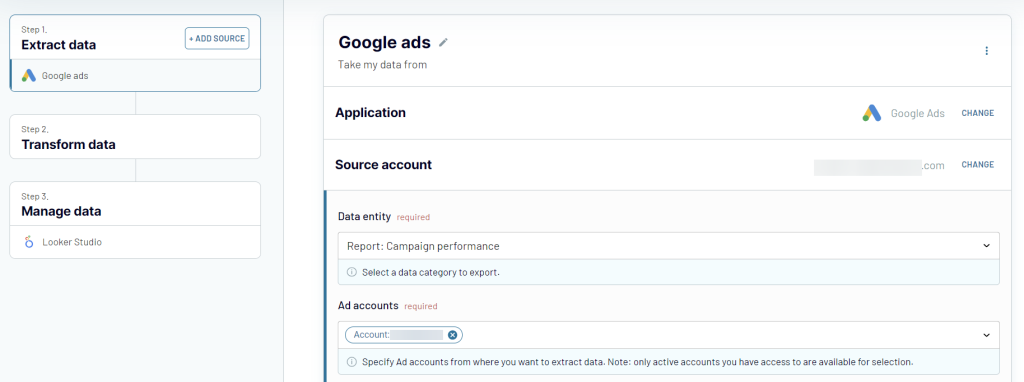
All you need to do is:
- Select and configure the connection with the marketing app containing the source data for your dashboard. The sources supported include Google Ads, Google Analytics, Mailchimp, and many more. You can add multiple sources to load data from, like separate accounts of one app and different apps.
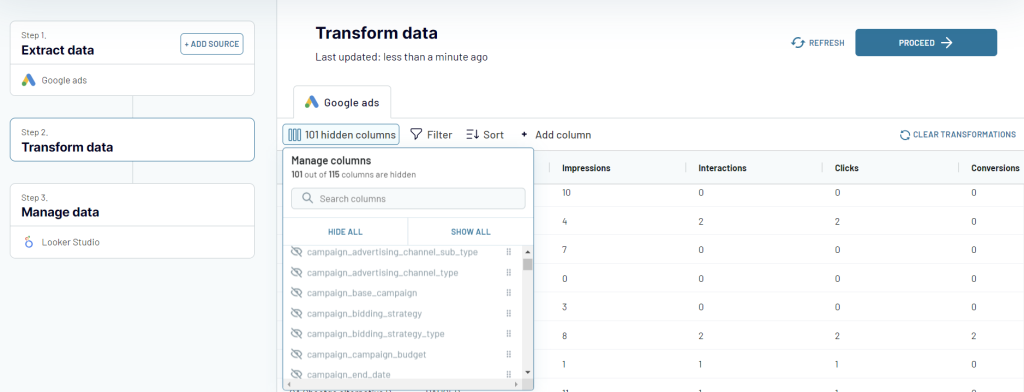
- Transform data before loading it to the dashboard. You can add/remove/modify columns, sort and order data, apply filters, and more.
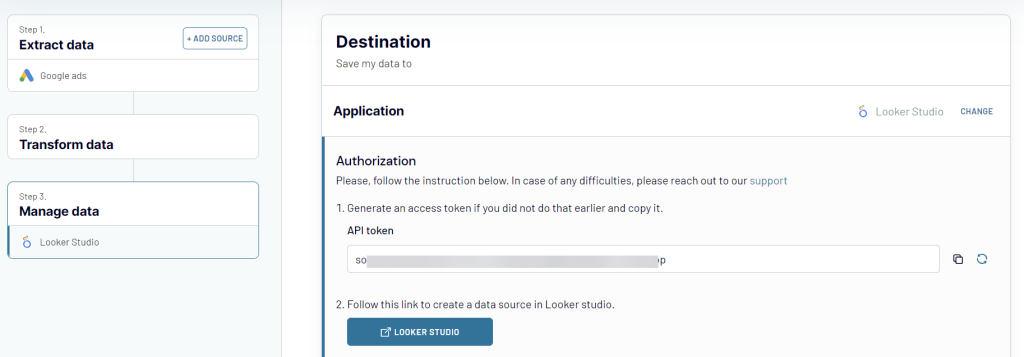
- Configure the selected destination for your source data that will be connected to the dashboard. Coupler.io provides Looker Studio as a direct integration, as well as Google Sheets, BigQuery, and Excel. Those can be used to connect your source app to other BI tools like Tableau, Power BI, and others.
Eventually, you can enable Automatic data refresh or use incoming/outgoing webhooks to implement the necessary automation flow for your dashboard. You’ll obtain a real piece of mind with a self-updating report that requires no manual data entry.
How marketing dashboard metrics can help your business succeed
The key to success with marketing dashboards lies in the ability to select the right metrics. Here are 10 key metrics worth tracking in marketing:
- Return on investment (ROI) – how much revenue you generate compared to what you’ve invested.
- Conversion rate – the percentage of users that achieved a particular conversion goal compared to all users.
- Clickthrough rate (CTR) – the percentage of users that clicked – on a link in an email, on an ad, on a social media post, etc. – compared to all users who saw the message.
- Time spent on site – the average amount of time users spend browsing your pages.
- Customer lifetime value (LTV) – how much, on average, you generate from a customer over their entire tenure with a product or service.
- Cost per acquisition (CPA) – what it costs to acquire a customer.
- Bounce rate – the percentage of visitors to your website that looked only at a single page and then left.
- Keyword positions – the average position in search, particularly Google Search, for each of your key keywords.
- Email open rate – a ratio of emails that were open, as compared to all delivered.
- Social media engagement – includes likes, shares, comments, and any other engagement with your content.
Overall, choosing the right metrics for your marketing dashboard helps you stay ahead of the competition and continually grow your businesses. If you have issues with identifying the most critical metrics for your business, ask Coupler.io’s data experts. They can help you with this and other tasks, like creating a dashboard that focuses on those metrics.
Best practices for marketing dashboards
When creating your marketing dashboard, it’s a good idea to follow best practices whenever possible. Here are some things to keep in mind:
- Select the right metrics. To get the best metrics for your marketing dashboard, think about who will be using it. What do they need to know? Which metrics are important for them to understand how well marketing is doing?
- Keep your dashboard simple. To accomplish this, focus on the important data and ensure that it is easy to understand. Do not add unnecessary design elements that could be confusing. Also, ensure the information is organized in an easy-to-follow way so people can quickly find what they need.
- Make your dashboard visually appealing. Colors play an important role when making your dashboard look nice. Symbols and icons can also help draw attention to important information and make your dashboard more appealing.
- Choose the right charts. The right visual tells a powerful story. It’s worth taking the time to understand which charts you need to use. For example, scatter plots can show how customers feel about a product and how much it costs. Columns can be used to show how successful a company was in getting new consumers interested.
- Facilitate easy collaboration and sharing. It is important to ensure everyone can work together and share ideas. This way, you can share ideas and stay focused on what needs to be done. Having a system where everyone can exchange ideas, data, and deliverables is important.
That’s it! You now know what to consider when creating your marketing dashboard. It’s time to put everything into action.
But if you need additional support in creating an optimized dashboard that fits your specific business needs, Coupler.io can help. With a tailored dashboard that showcases all the data relevant to your organization and campaigns, you’re ensuring thoughtful, informed decisions about the next steps for your strategies and goals.
Let us help you in creating a successful dashboard that brings all the pieces together to achieve all of your marketing objectives!
Finally, good luck! And thanks for reading.