Our top selection of marketing reporting templates for every case
If you want to create a great report, it doesn’t mean you should start from scratch. There are hundreds of models and reporting templates you can use or get inspired by. Here, you will find over 40 templates organized by marketing channel and use case, making it easy to find exactly what you need.
I’ve organized these templates into clear categories: multi-channel advertising dashboards, platform-specific templates for Google Ads, Meta Ads, and LinkedIn Ads, social media analytics, email marketing, website traffic, conversion funnels, and general marketing reports. If you want to jump to a particular category, use the Table of Contents block on the left side of the page.
Multi-channel paid advertising templates
When you’re running campaigns across multiple advertising platforms, you need dashboards that consolidate performance data in one place. These templates help you compare channel effectiveness and optimize budget allocation across your entire paid advertising strategy.
1. PPC multi-channel report template
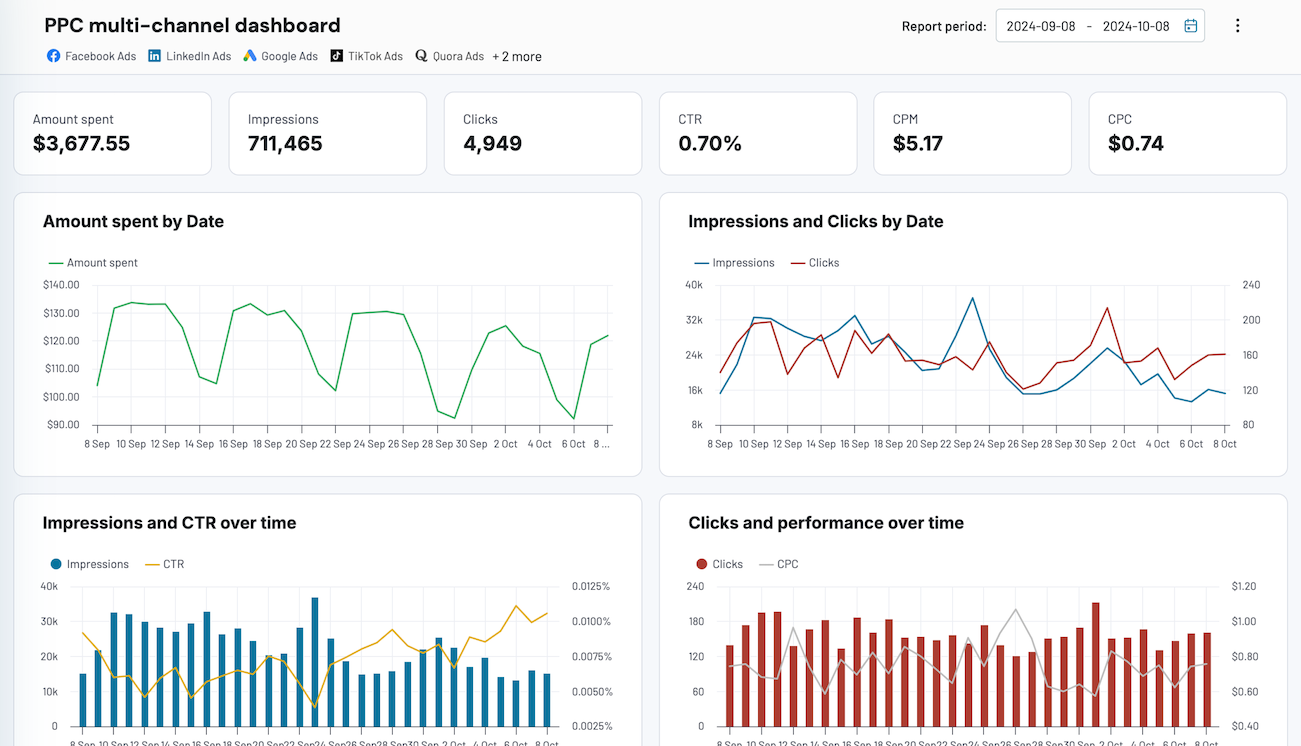
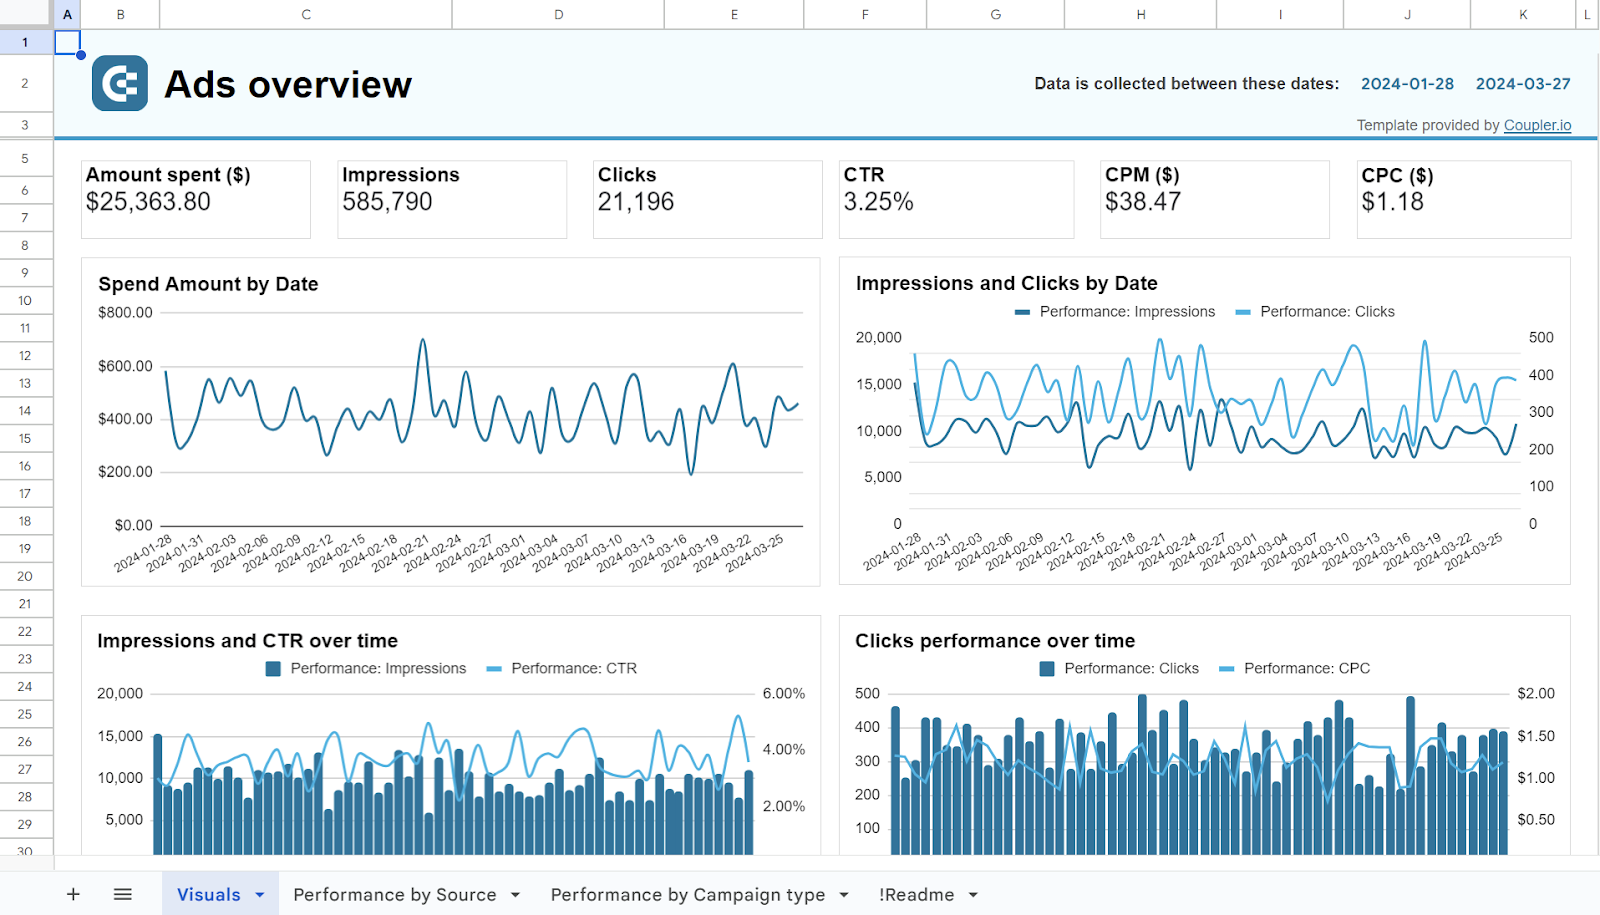
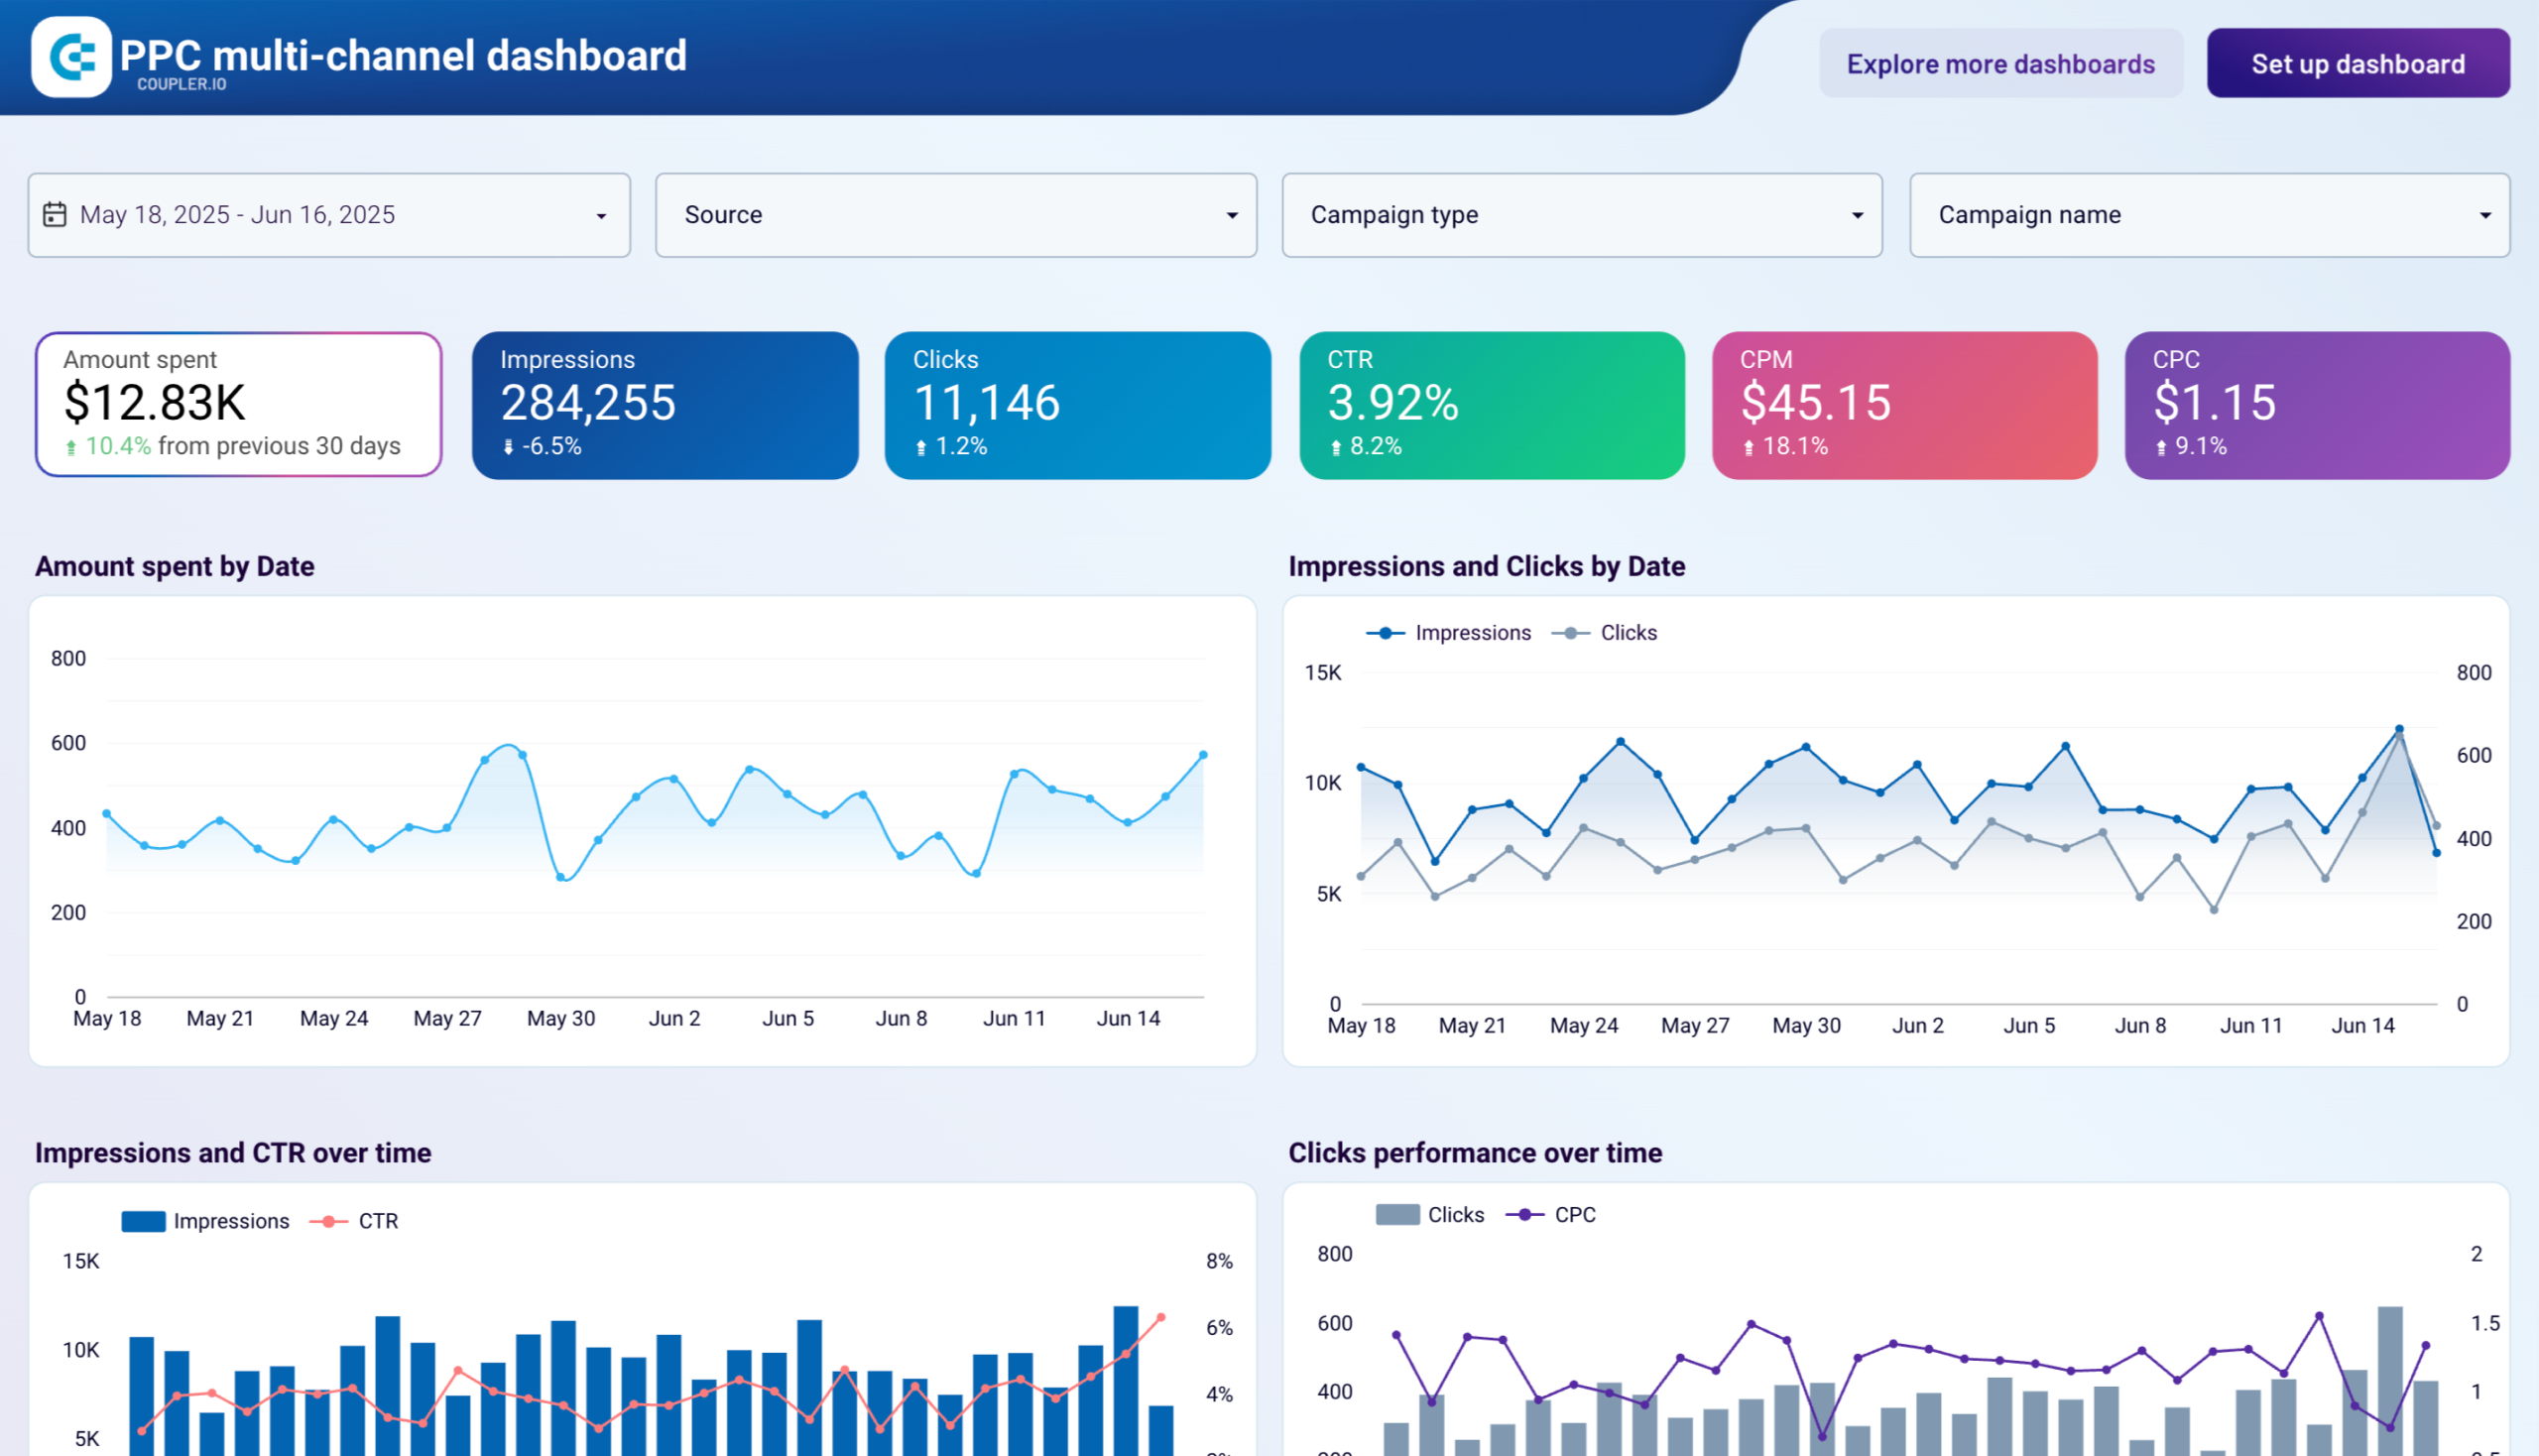
Paid advertising is one of the most important types of marketing used to increase traffic and conversions for brands. Examples of PPC channels include such platforms as Google Ads, Facebook Ads, and many others. Most likely, PPC experts operate multiple channels. So, it makes sense to have a report template that will accumulate performance data from all of these.
With this in mind, Coupler.io, a reporting automation solution, offers a free PPC multi-channel dashboard. It’s a report template designed in Looker Studio that connects to 5 ad sources, including Facebook Ads, Google Ads, LinkedIn Ads, Instagram Ads, and TikTok Ads.
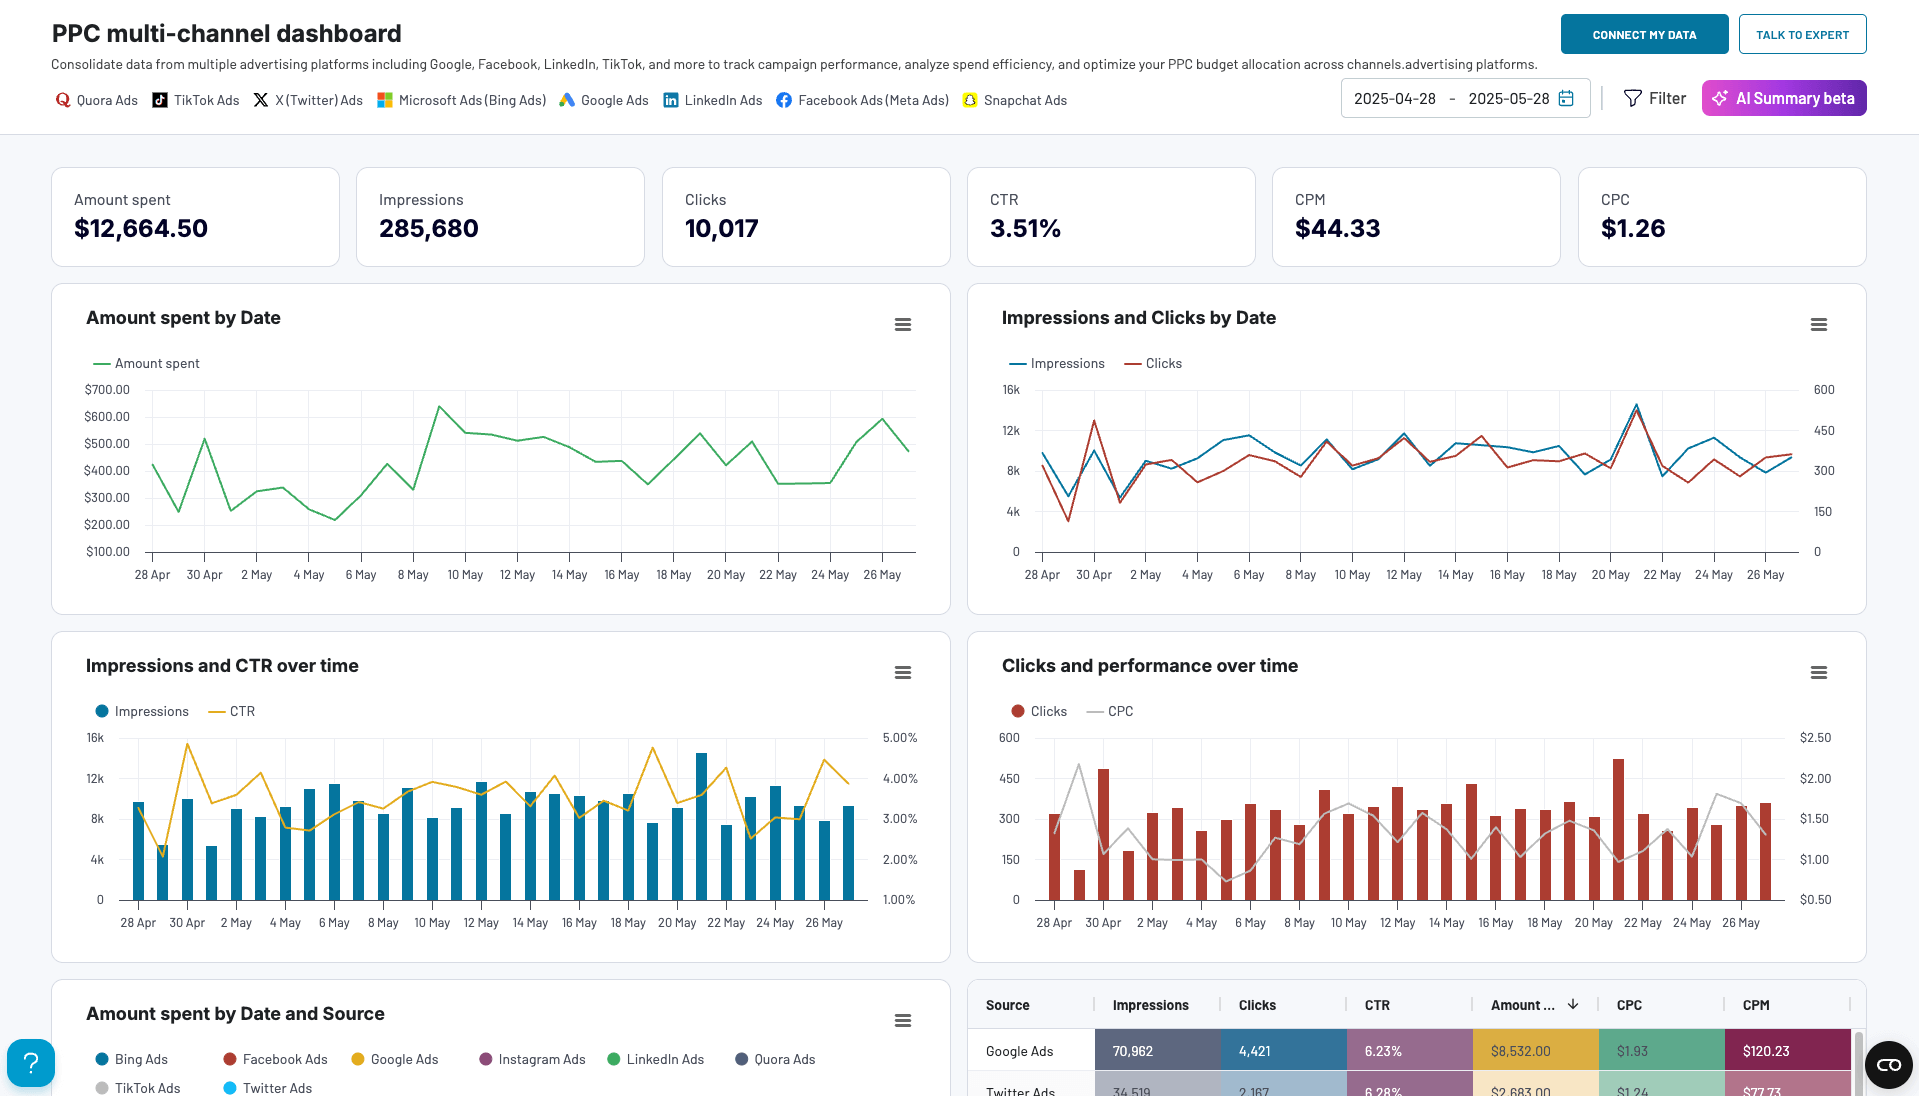
The report provides an overview of all your campaigns in one place. You can monitor each channel’s performance, compare it, and drill down into every campaign.
It’s not necessary to have all the supported ad channels for the report to be used. If you only use, let’s say, Facebook Ads and Google Ads, just select them when setting up the dashboard and start using them.
This PPC report is available in Coupler.io UI and as a template for different data visualization tools. Try out the one that fits your reporting requirements.


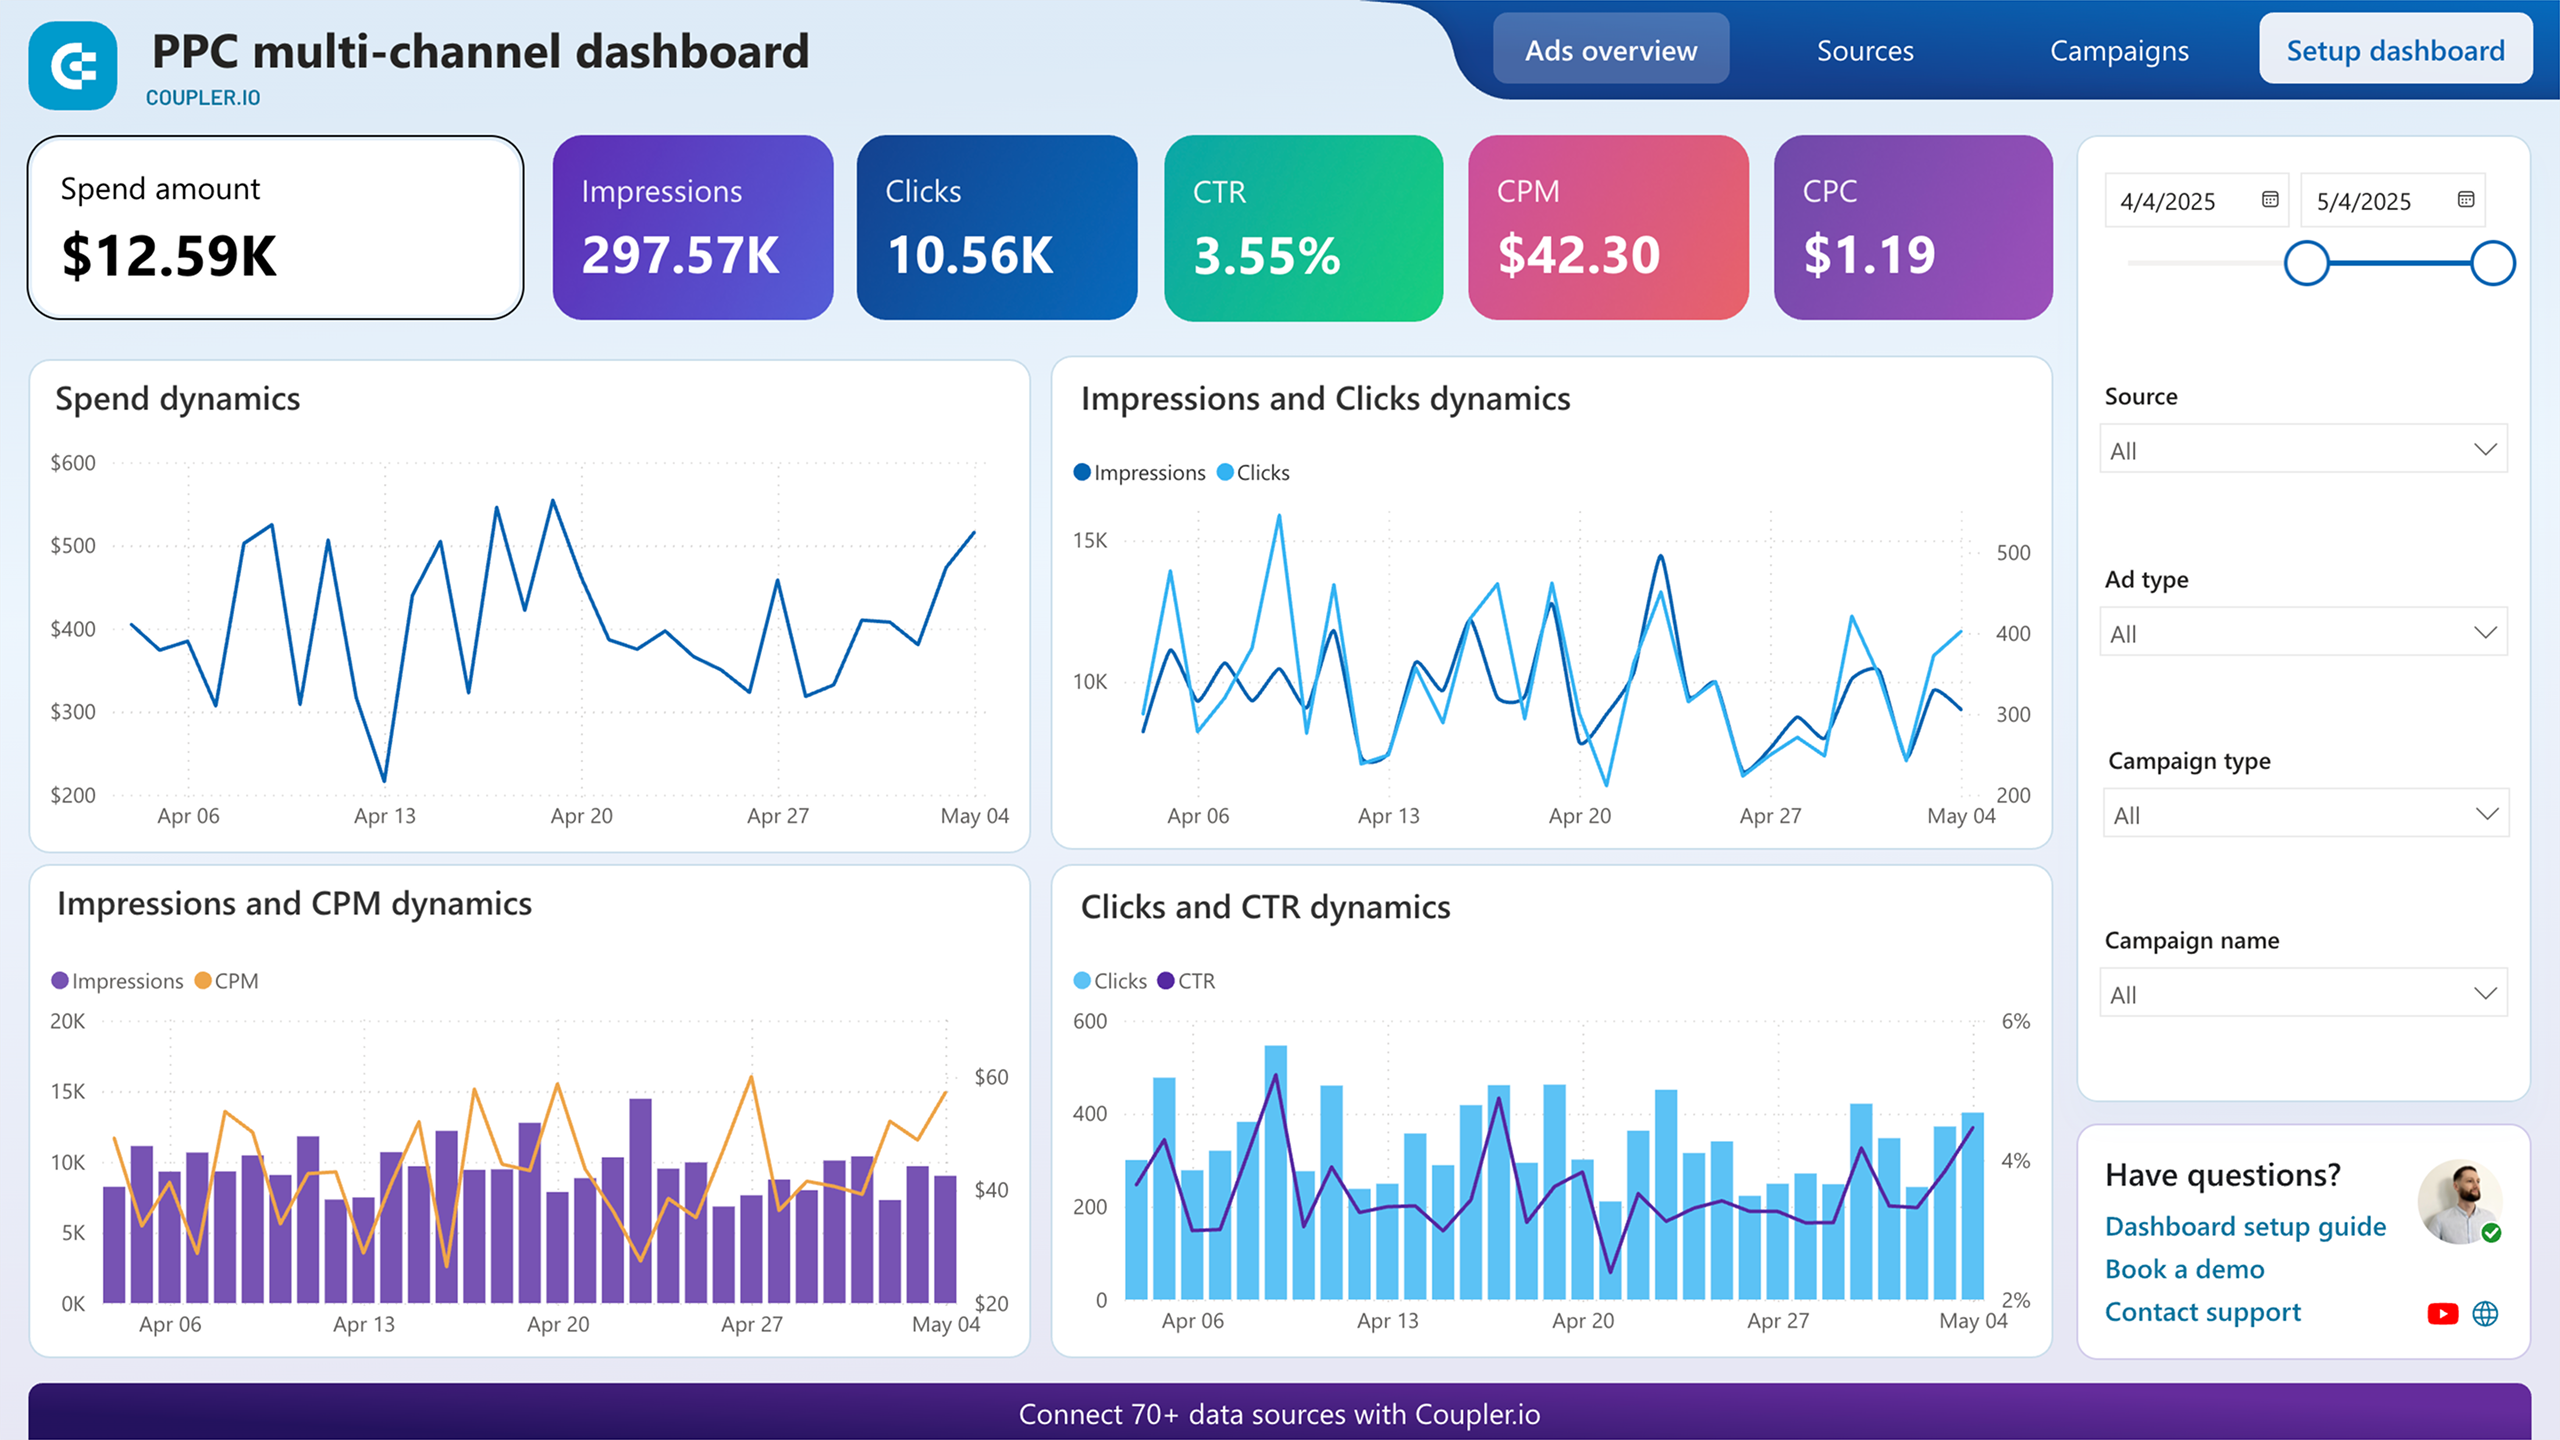


Report metrics:
- Amount spent
- Impressions
- Clicks
- Click-Through Rate (CTR)
- Cost-Per-Click (CPC)
- Cost per thousand impressions (CPM), etc.
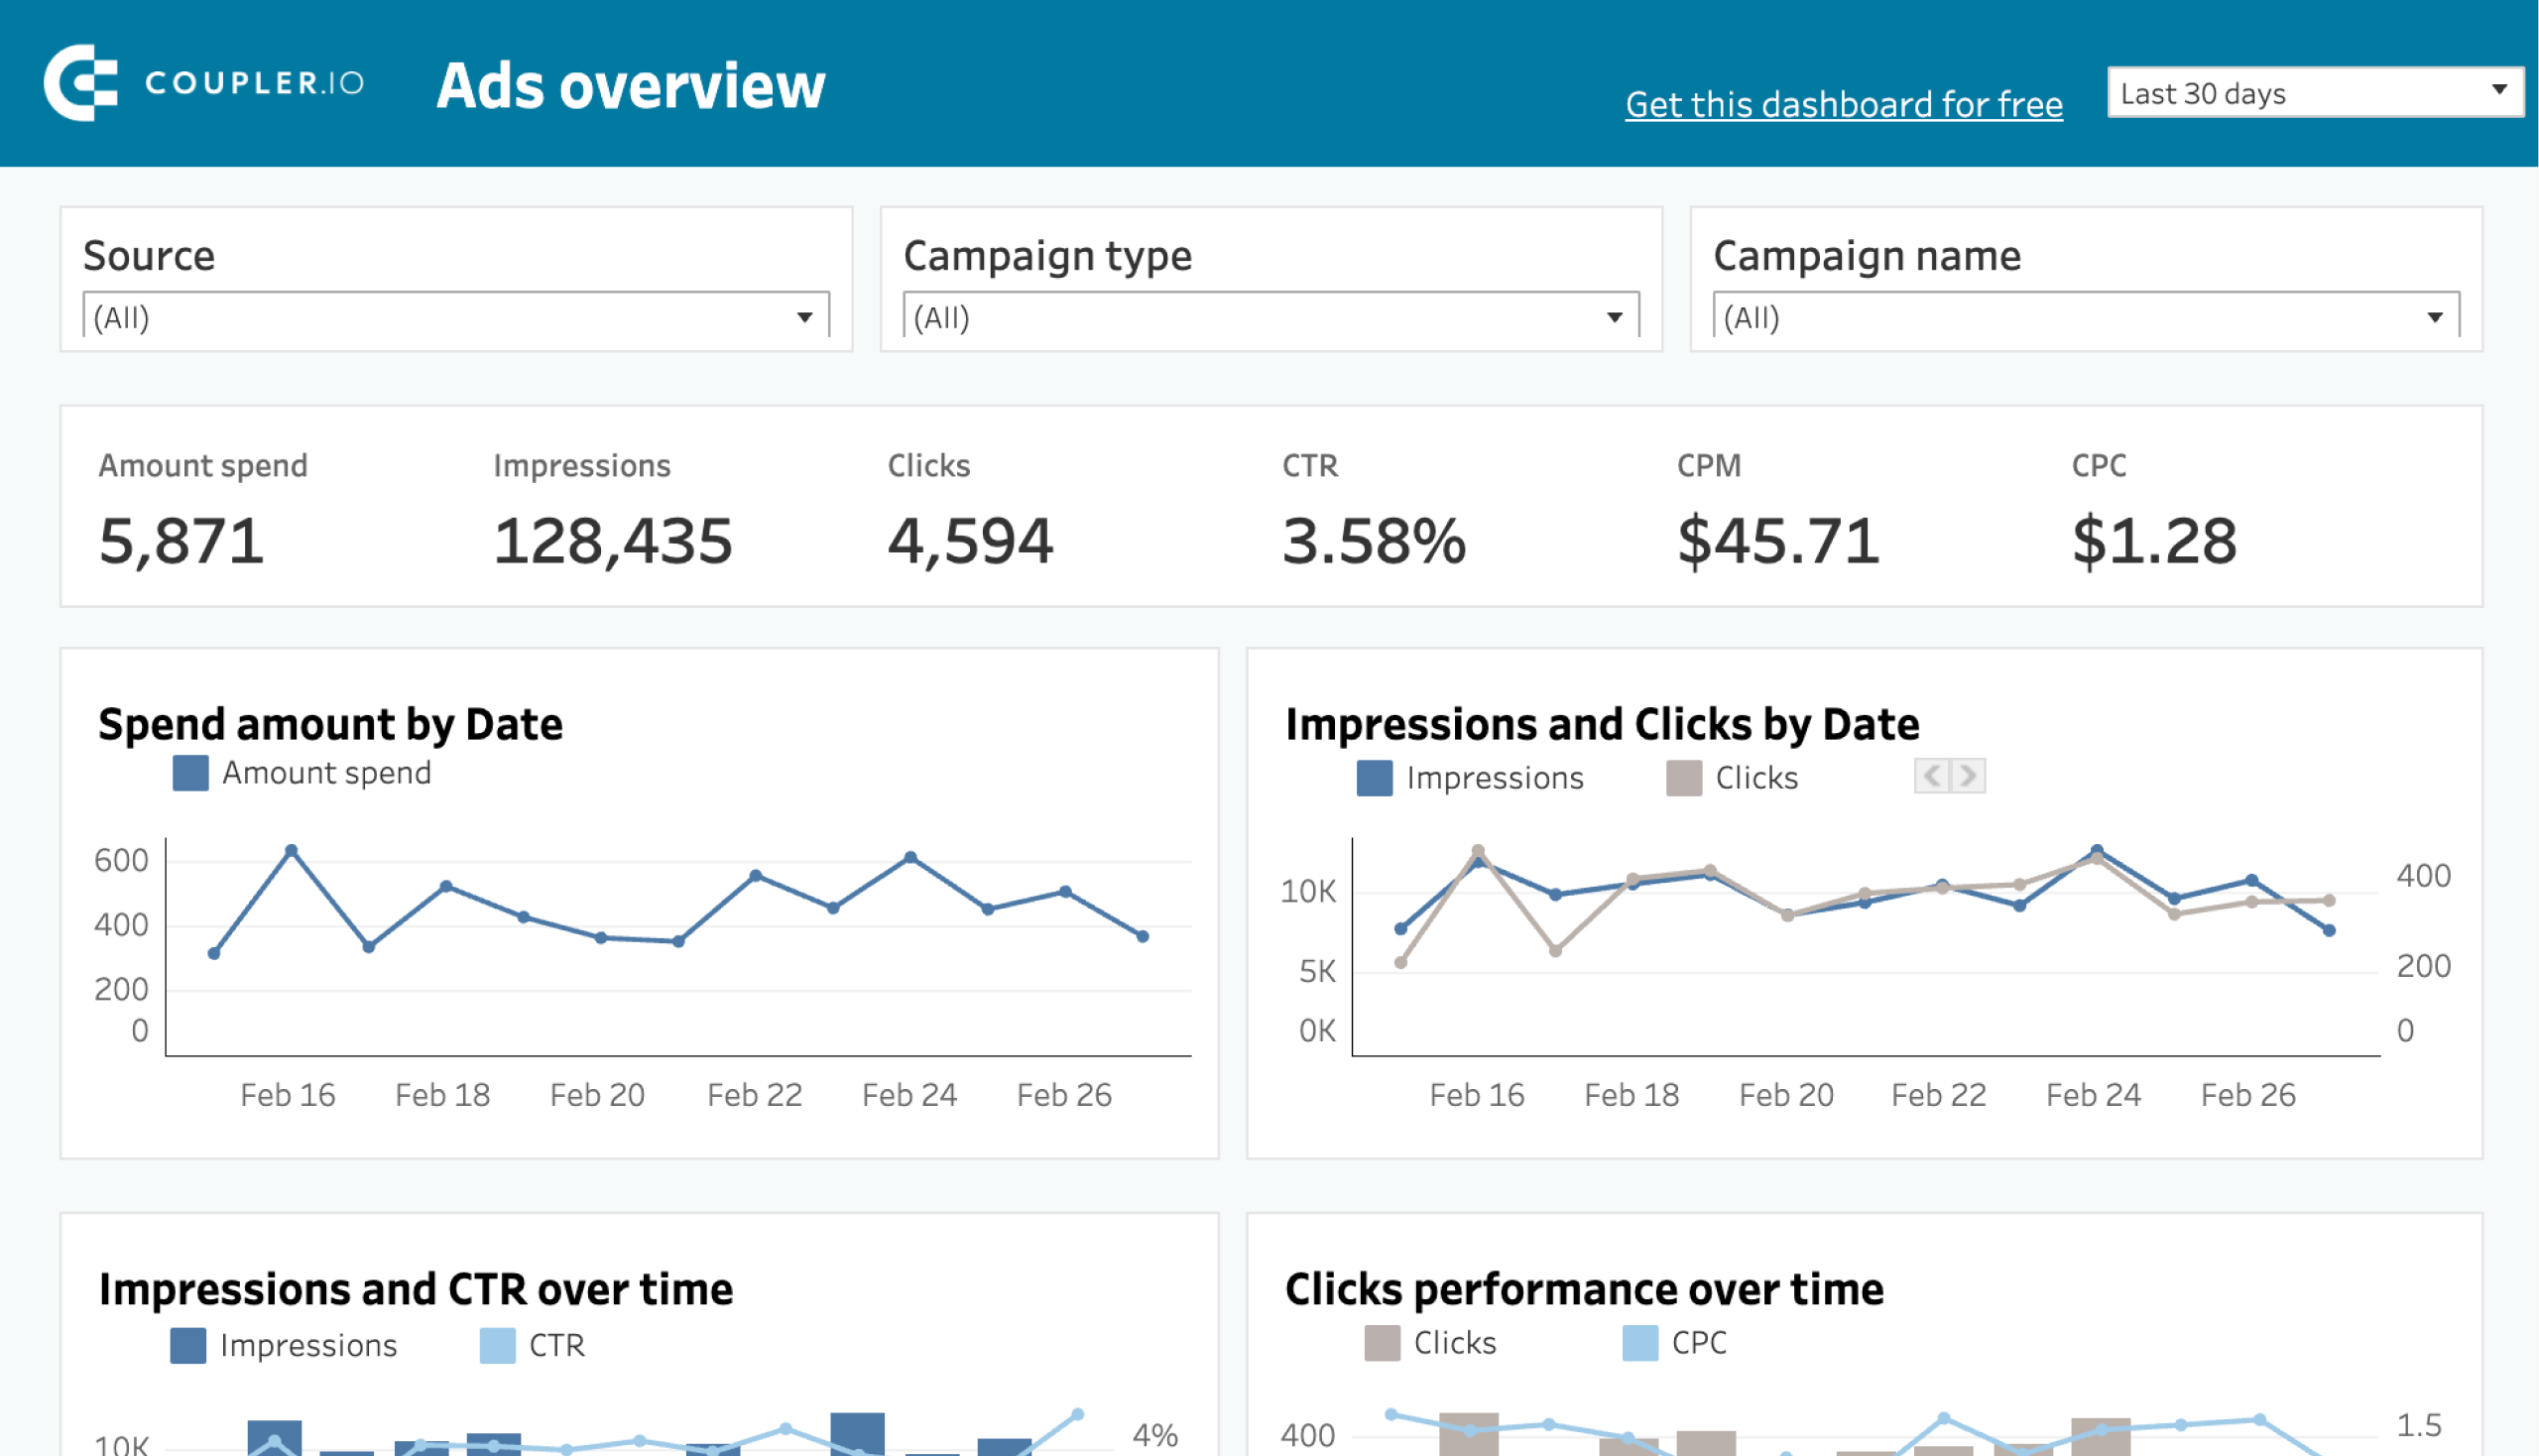
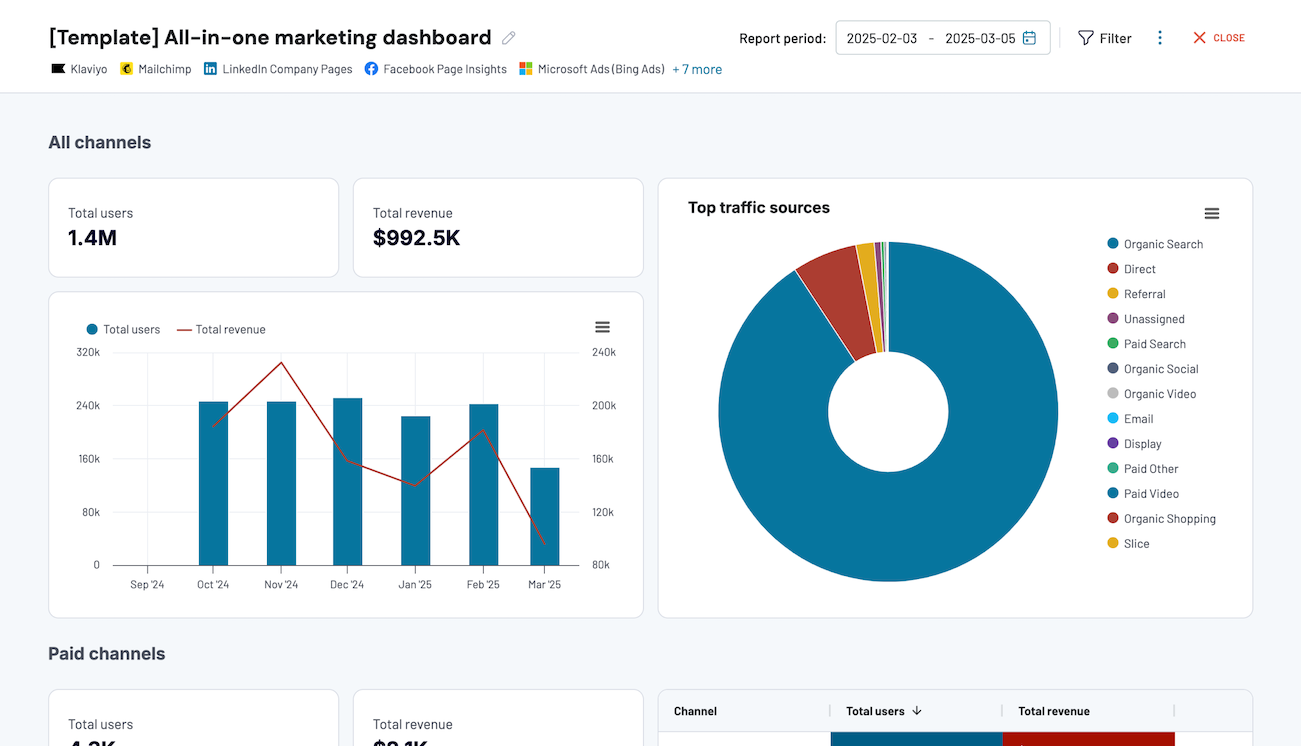
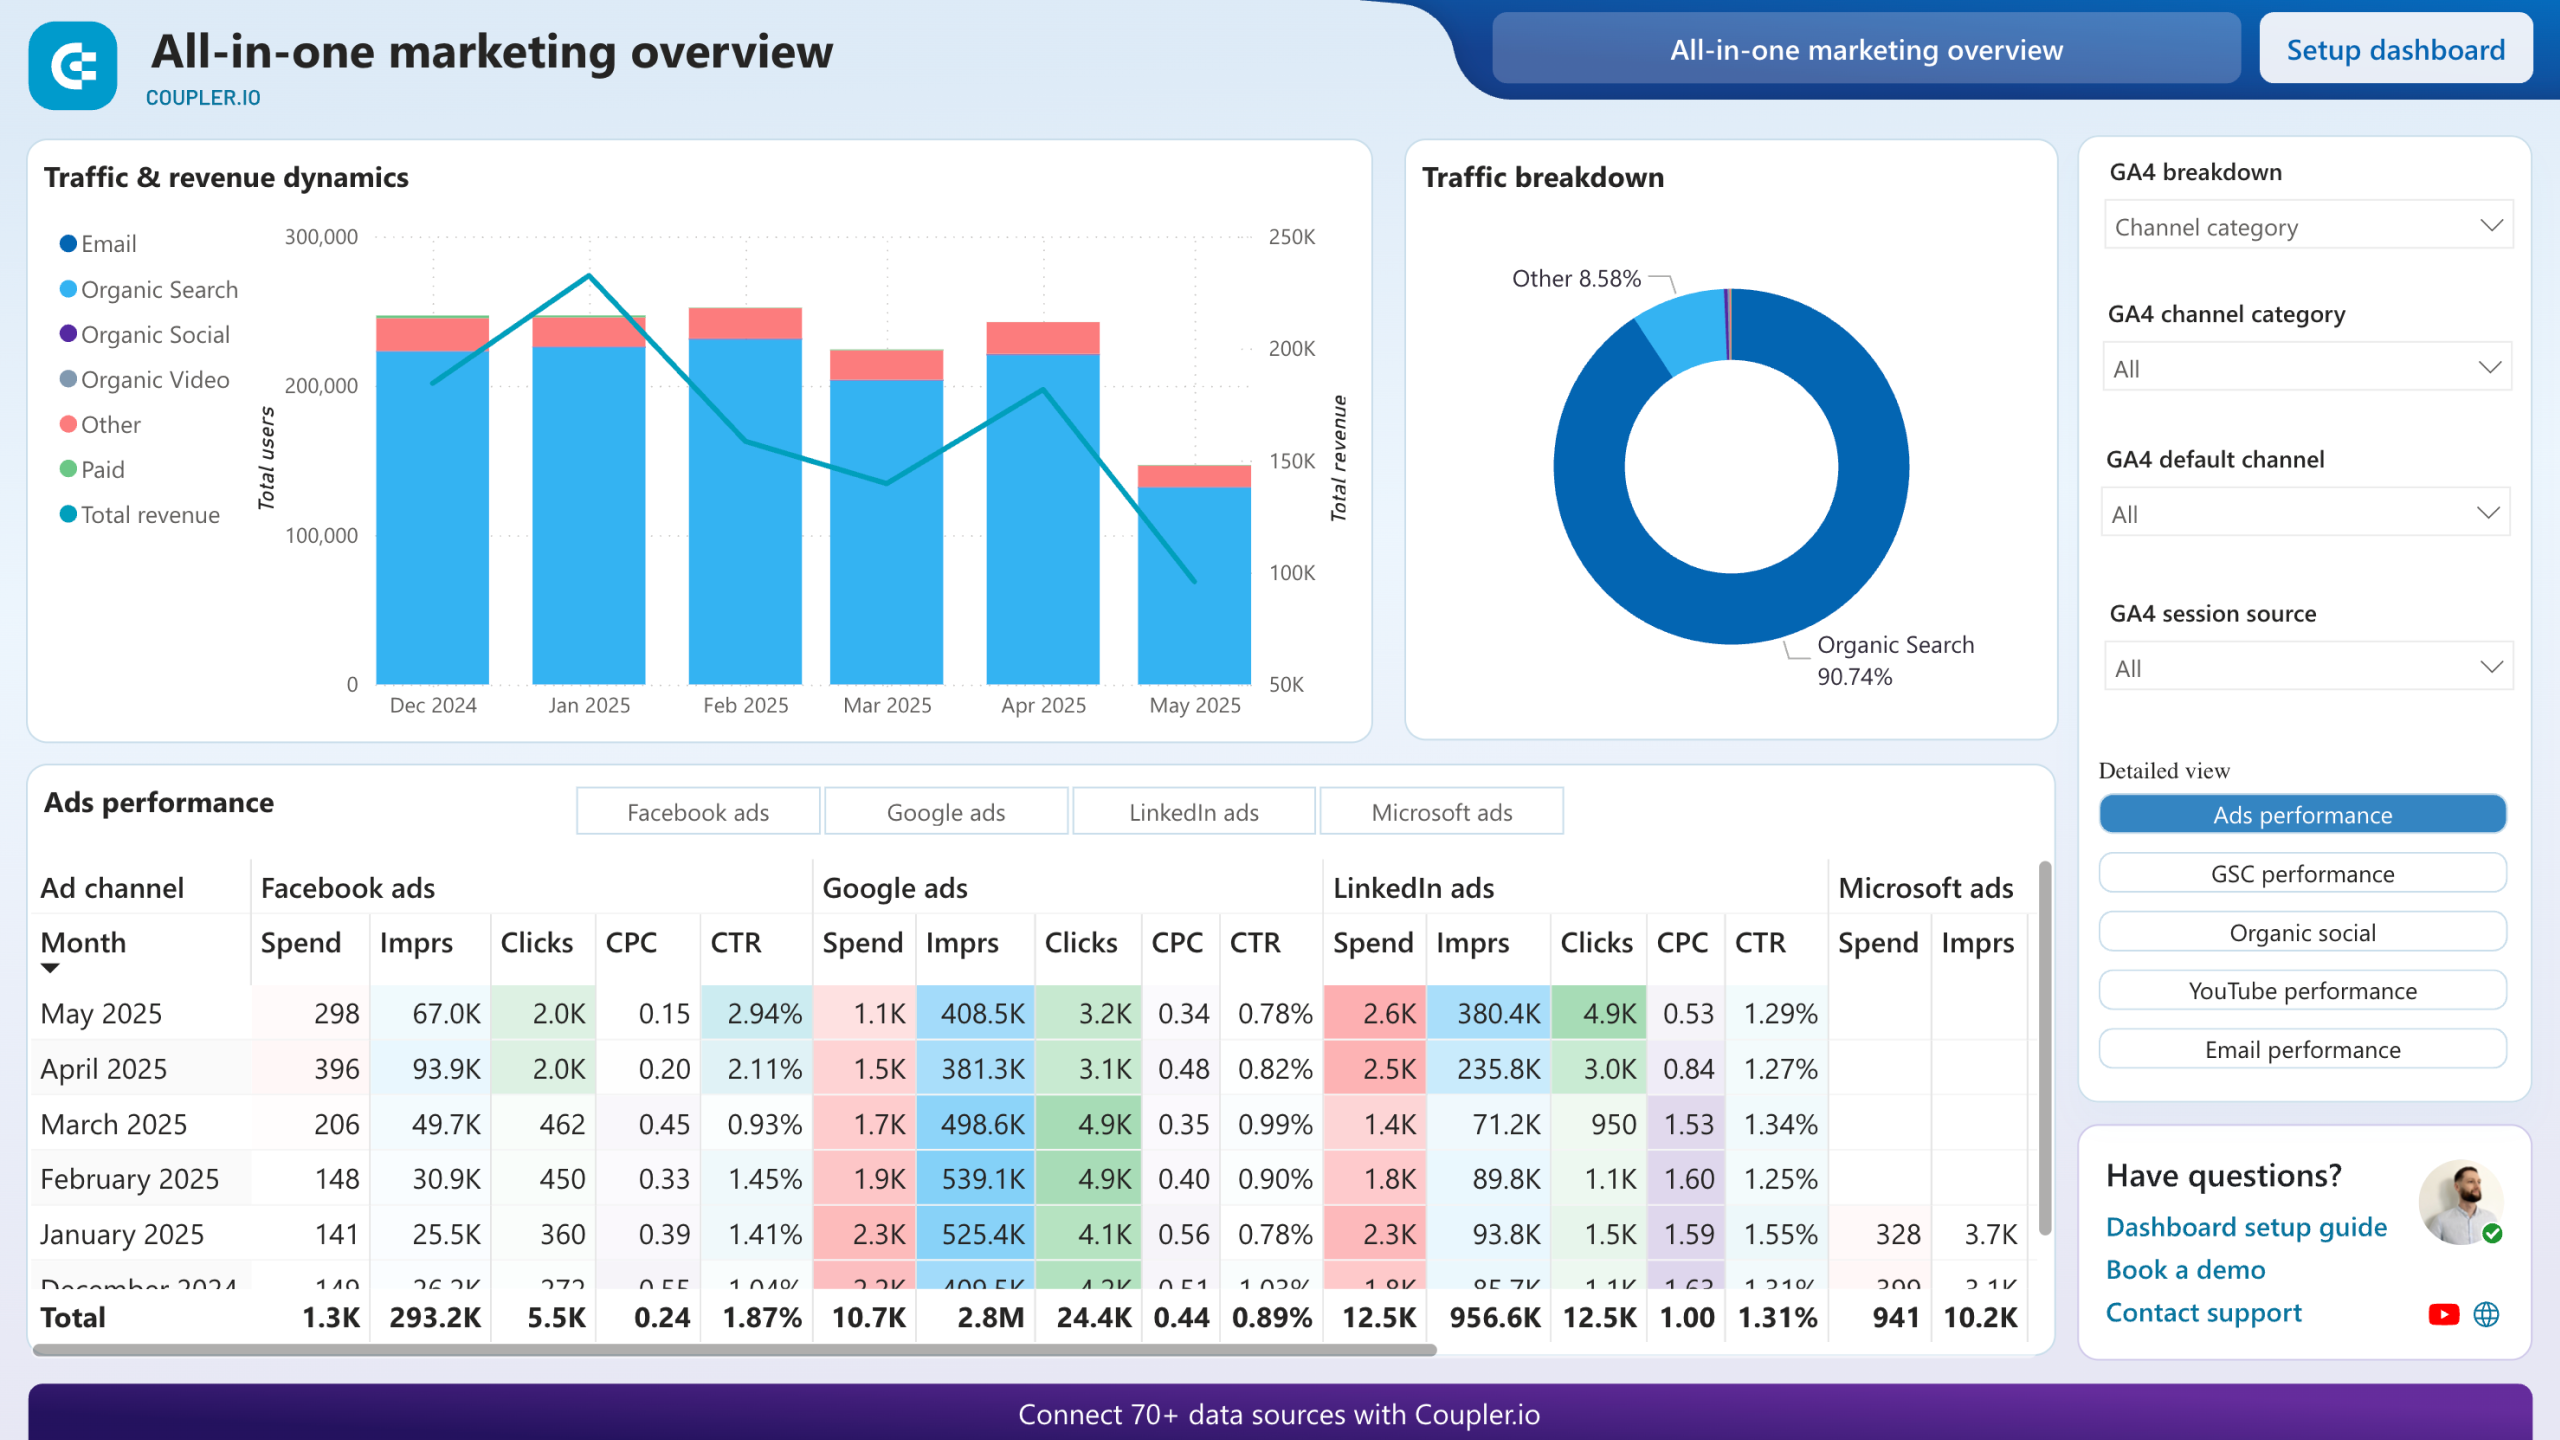
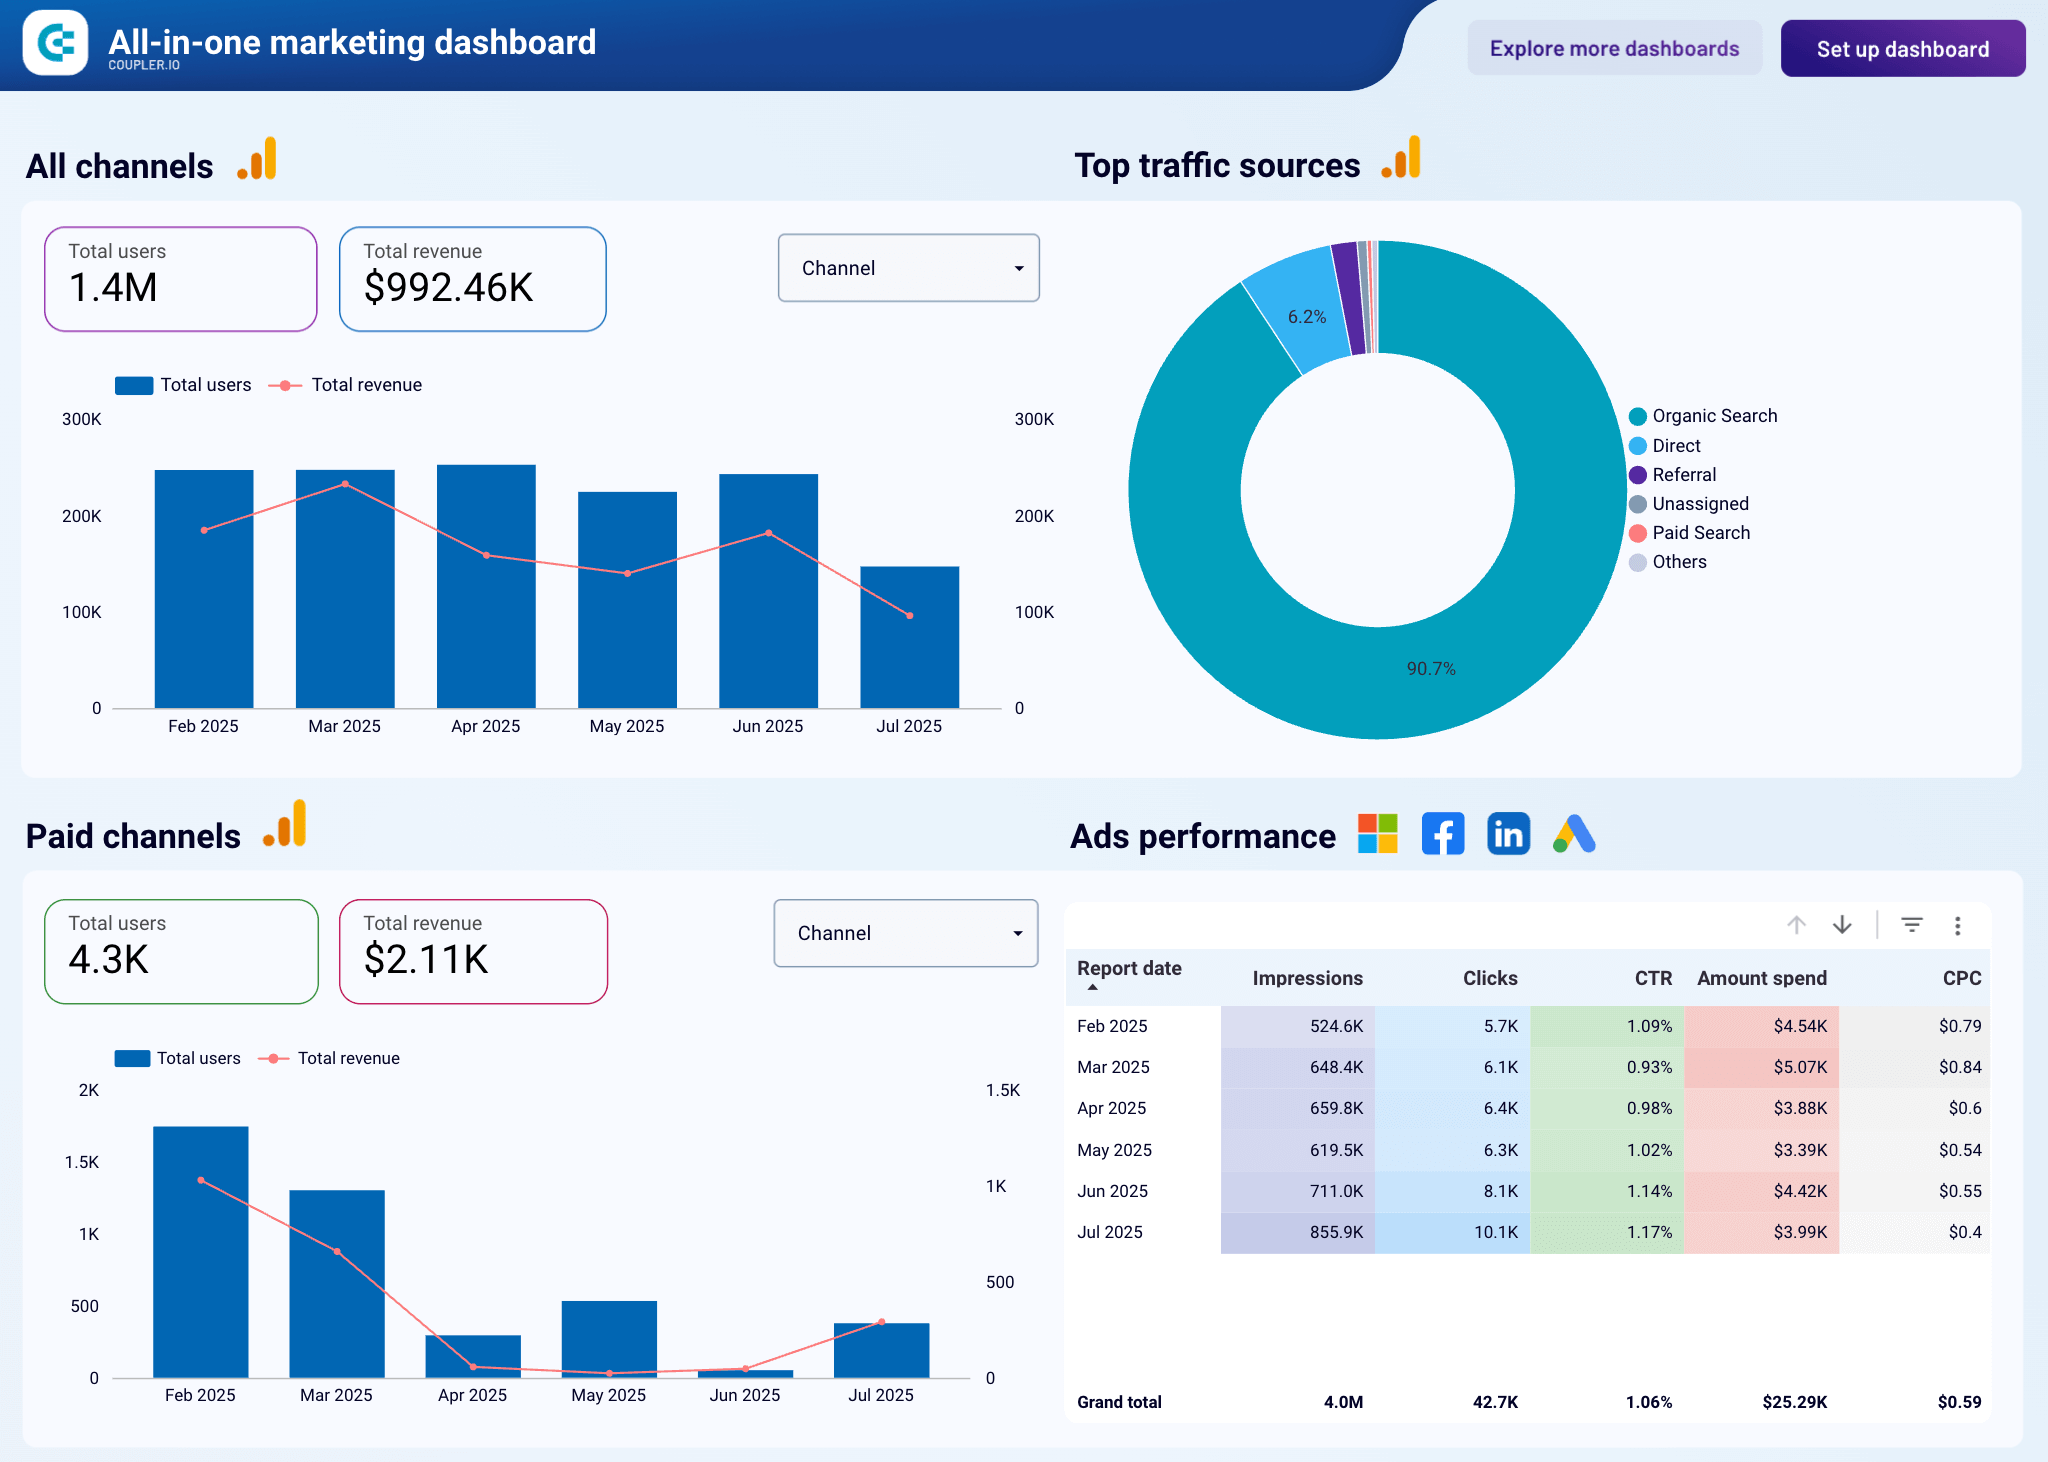
2. All-in-one marketing report template
The all-in-one marketing dashboard provides a unified view of your marketing efforts across various channels. It integrates data from Google Analytics, Google Search Console, ad platforms, social media, email tools, and YouTube.

Using this dashboard, you can track the performance of paid ads, organic searches, social media interactions, and email campaigns in a single interface.
It is available in Coupler.io and as a template in Looker Studio and Power BI. Try it right away for free! Set up the dashboard by following the instructions inside the template and transform raw marketing data into actionable insights.


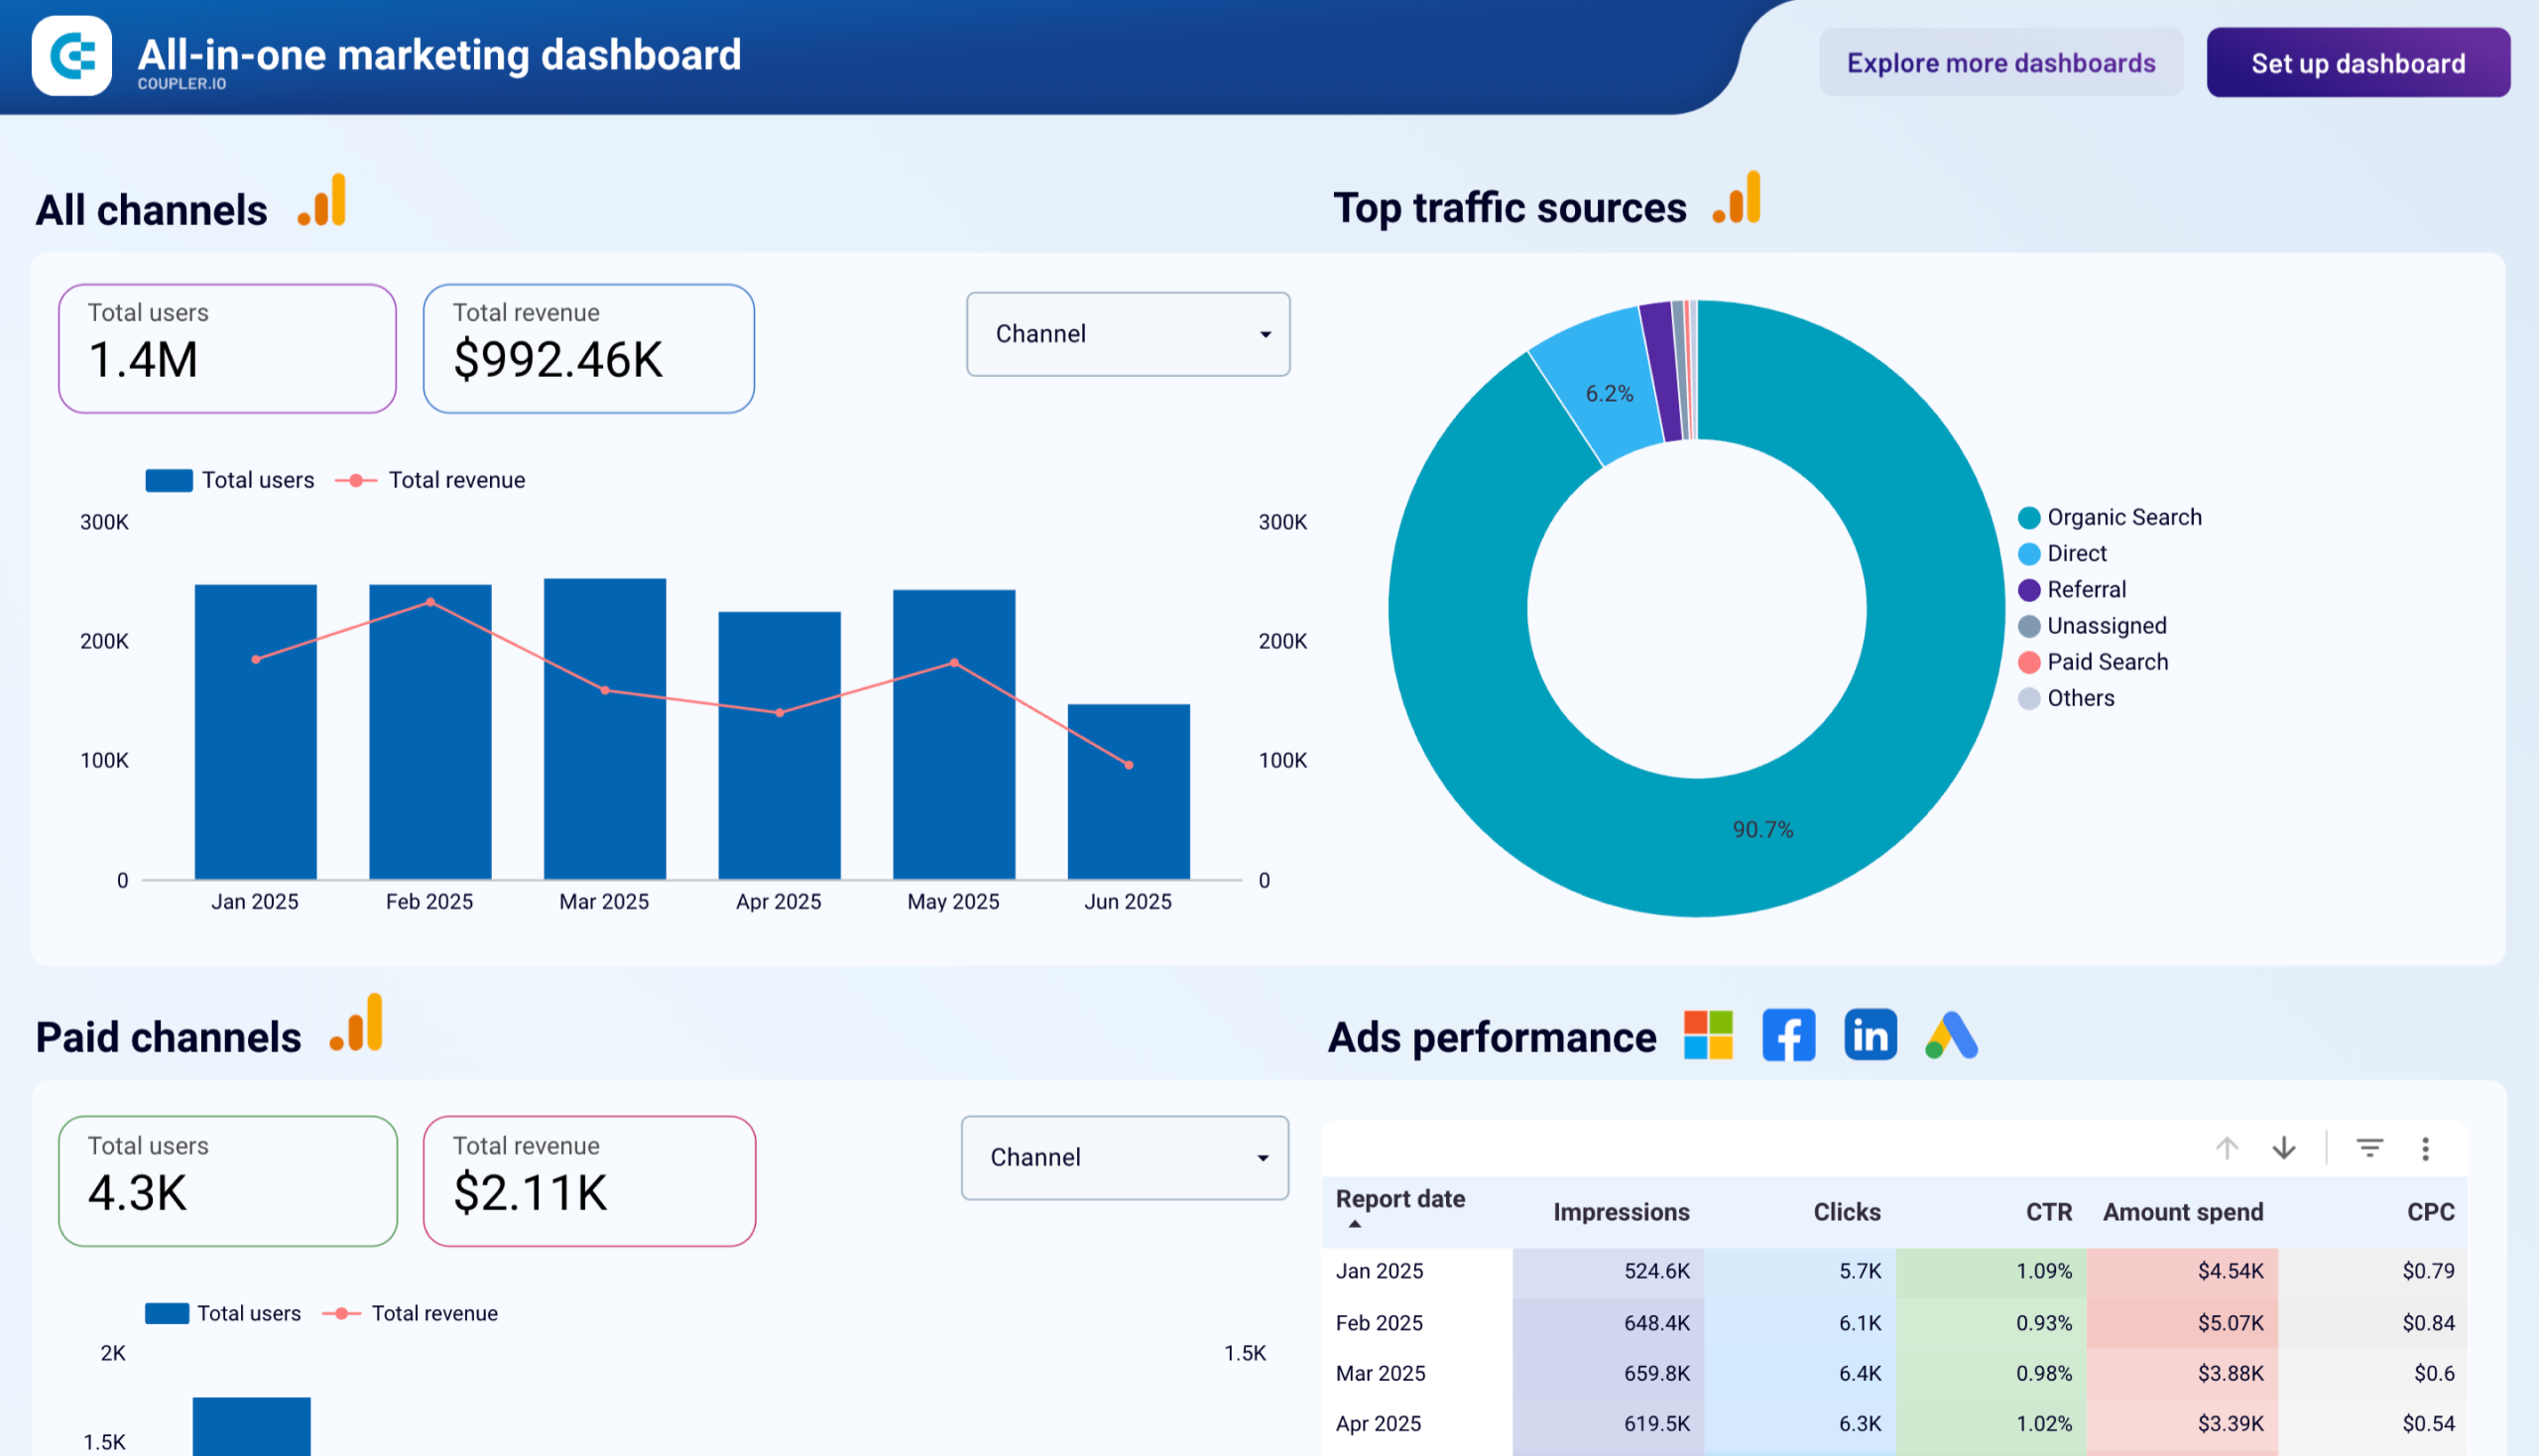
Report metrics:
- Ad performance: impressions, clicks, CTR, amount spent, CPC
- Google search performance: impressions, clicks, CTR, average position
- Social media performance: impressions, page views
- YouTube performance: views, minutes watched, engagements
- Email performance: emails delivered, open rate, bounces, unsubscribes, clicks
Marketing report templates for Google Ads
Google Ads is one of the most powerful advertising platforms for reaching customers with high purchase intent. These report templates help you monitor campaign performance, optimize ad spend, and track lead generation from your Google Ads campaigns.
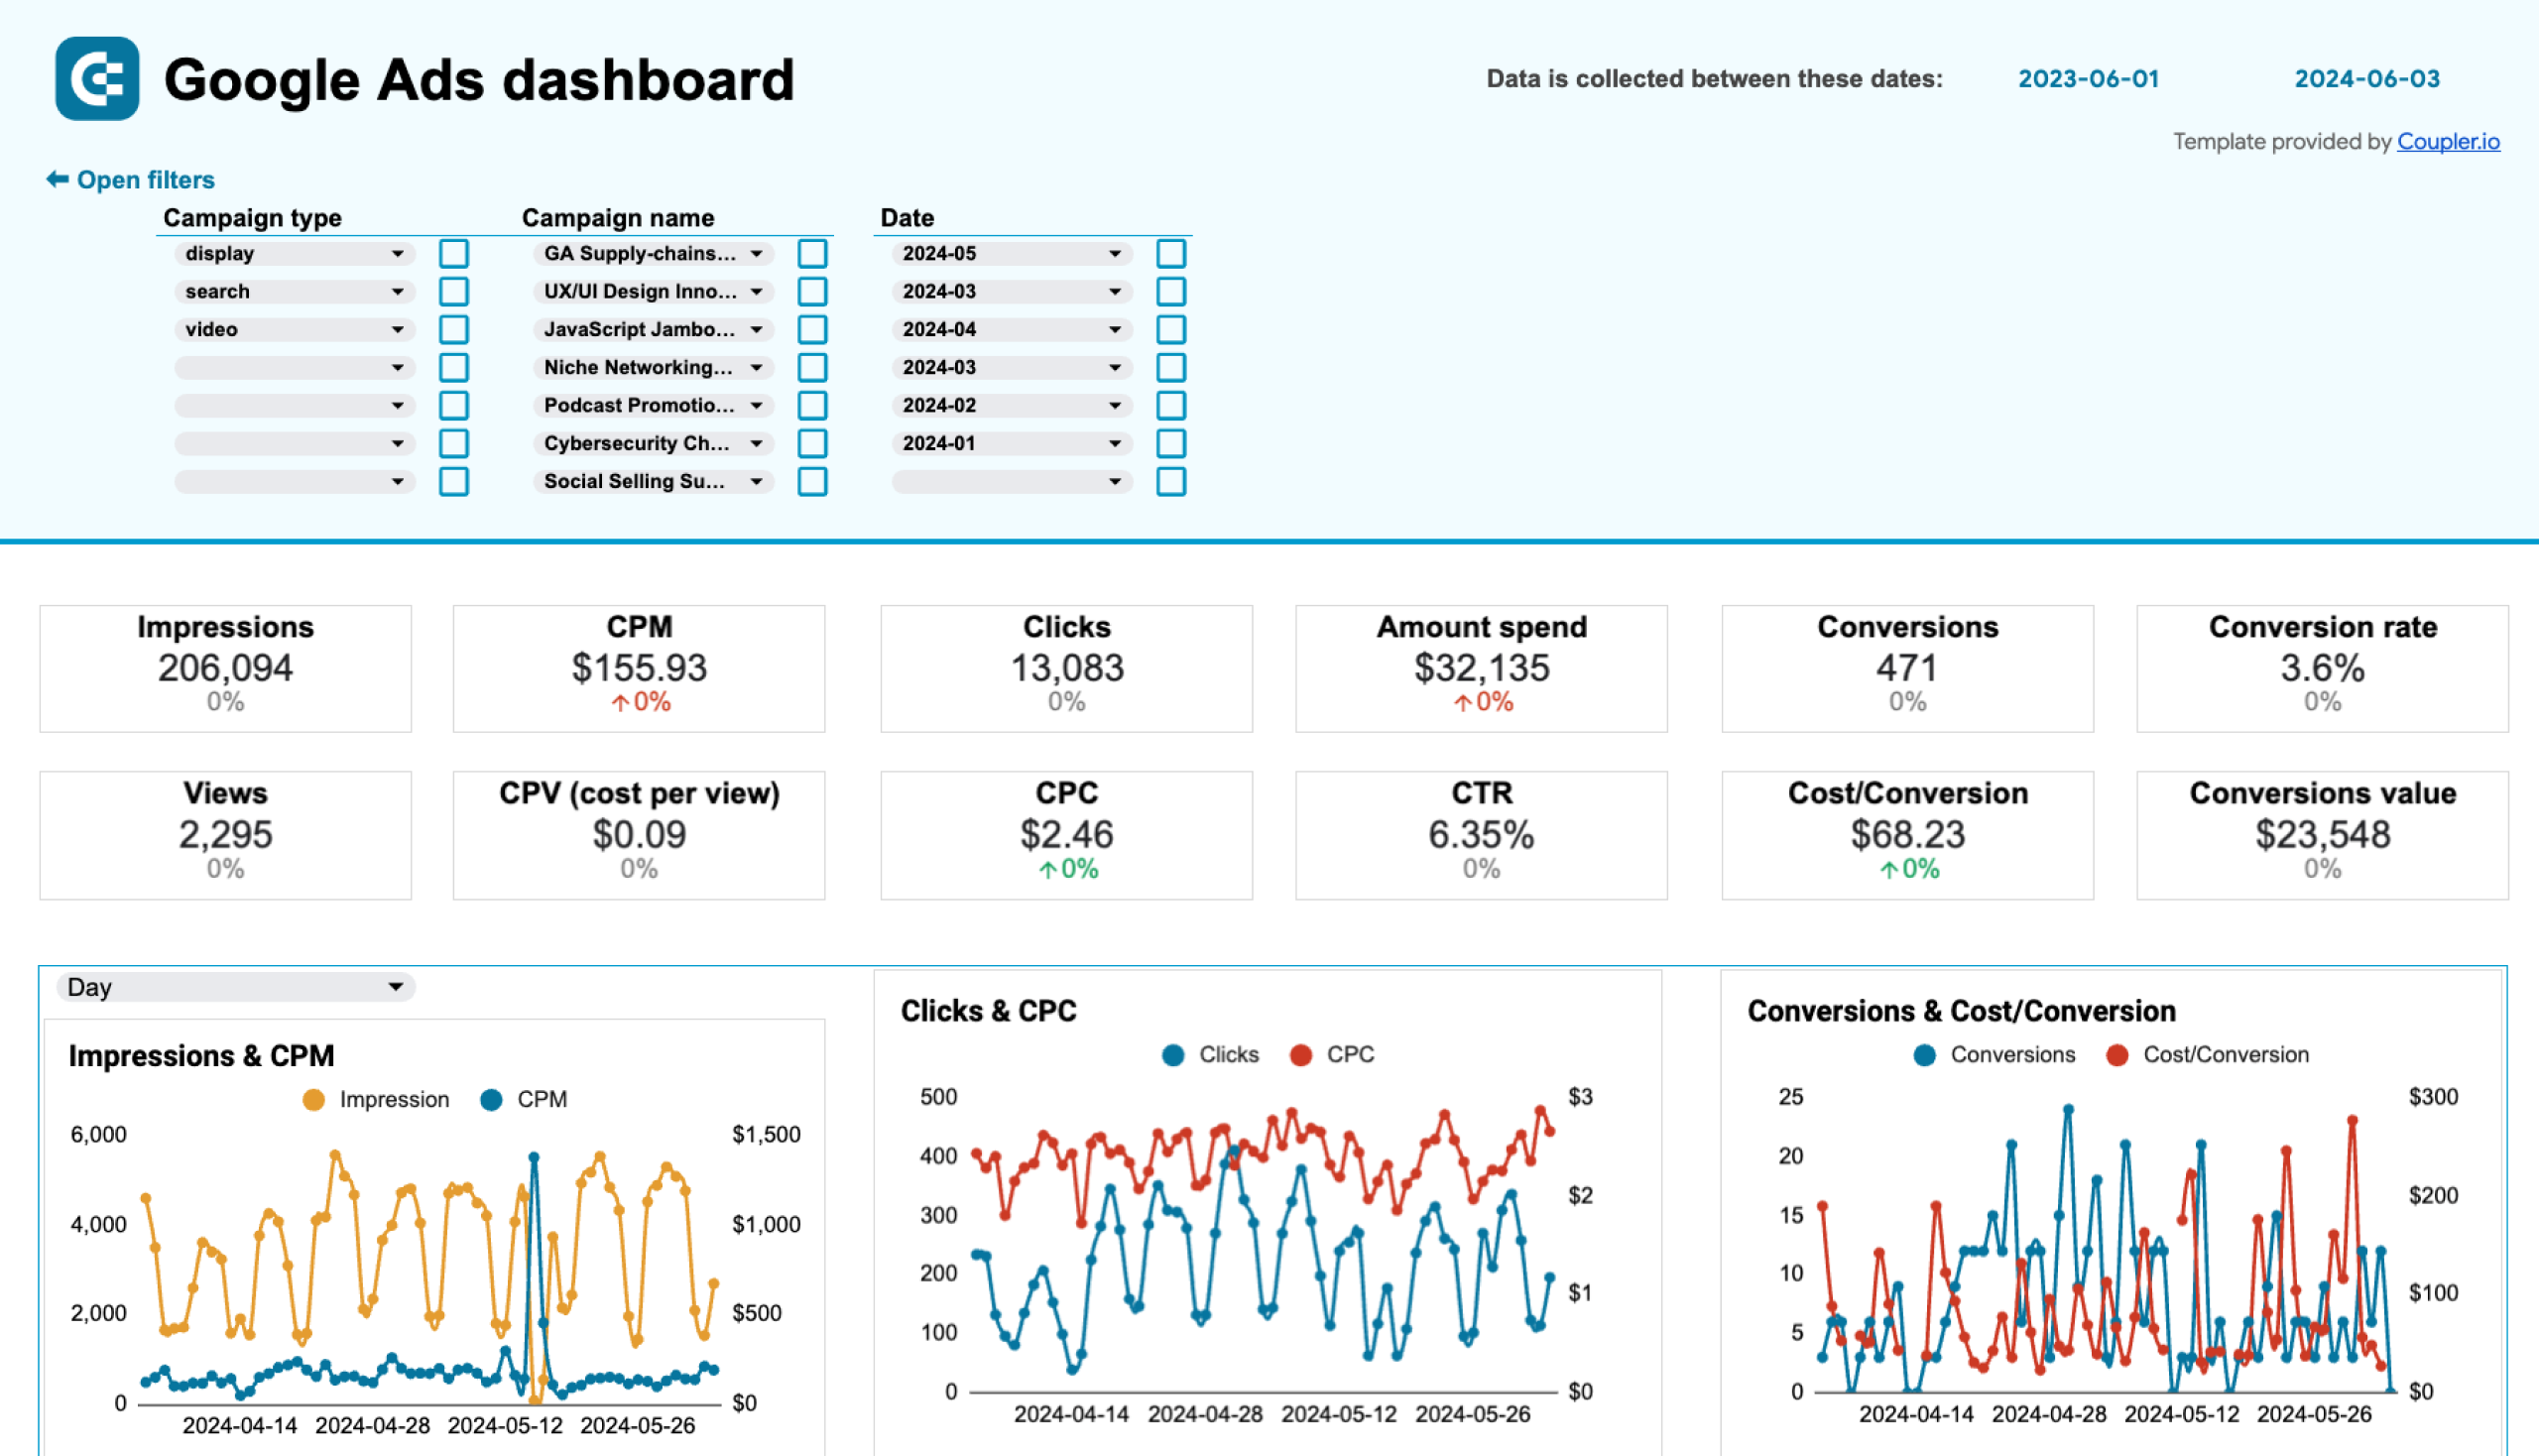
3. Google Ads report template
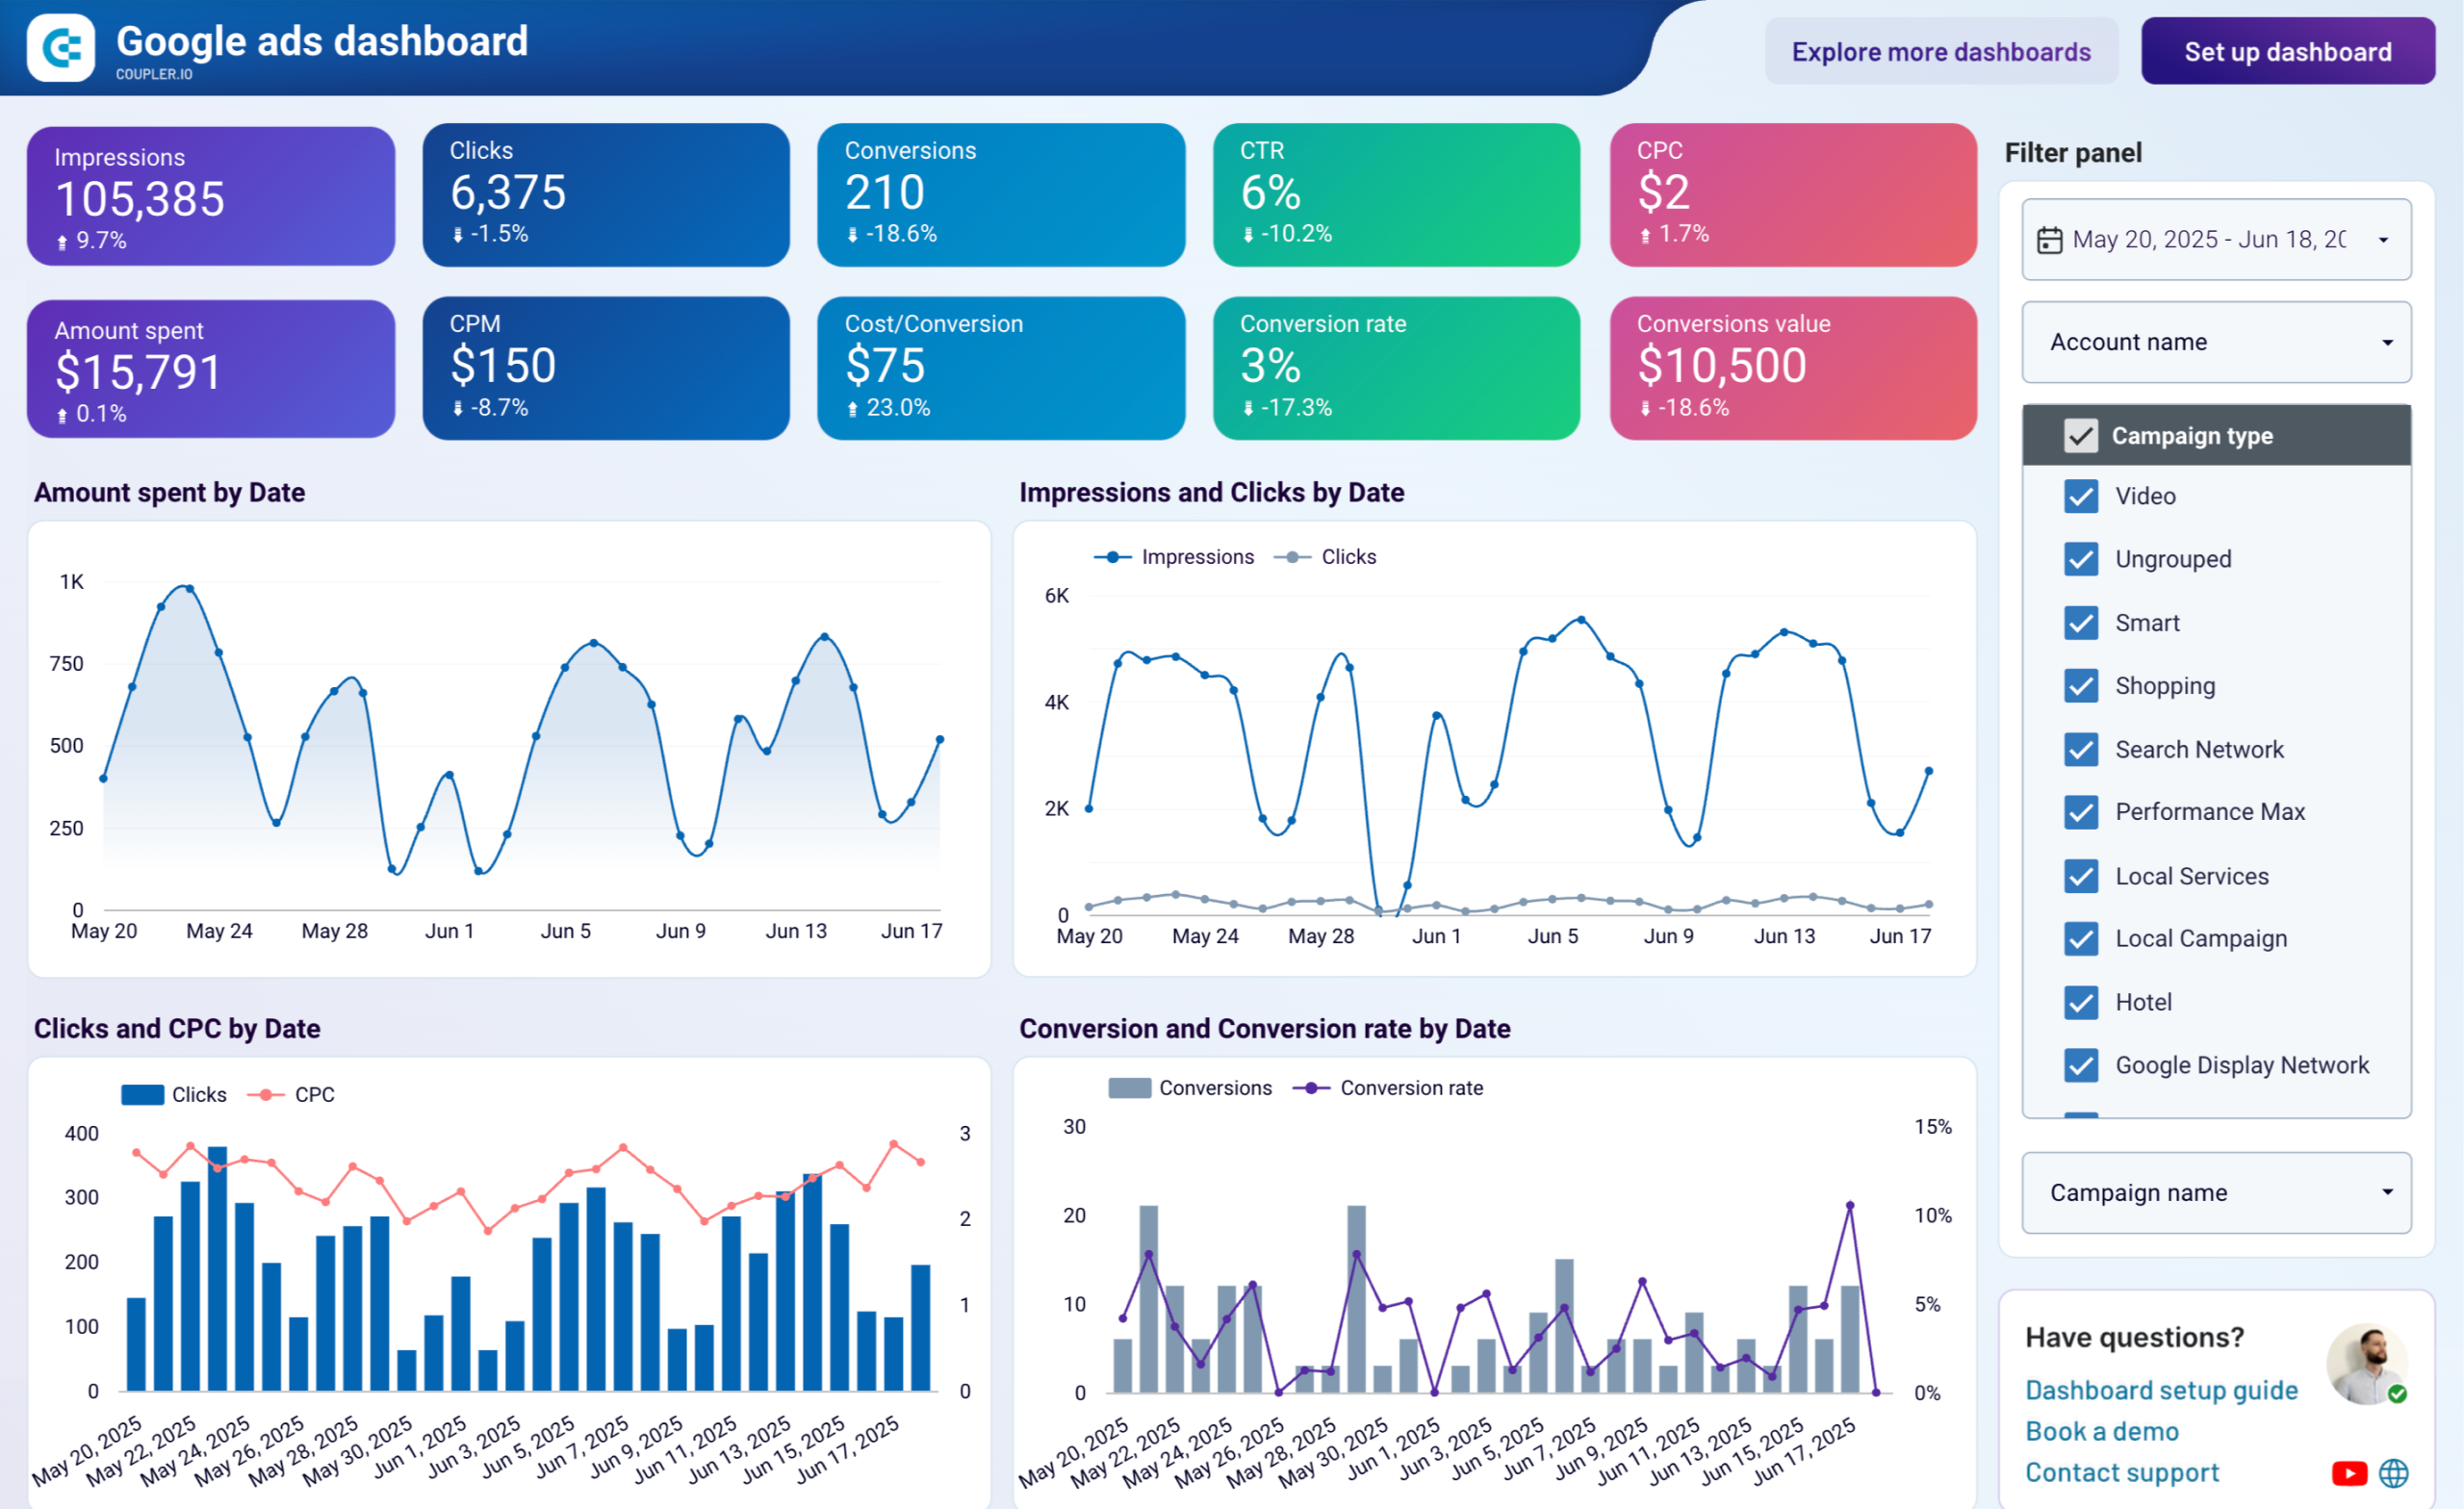
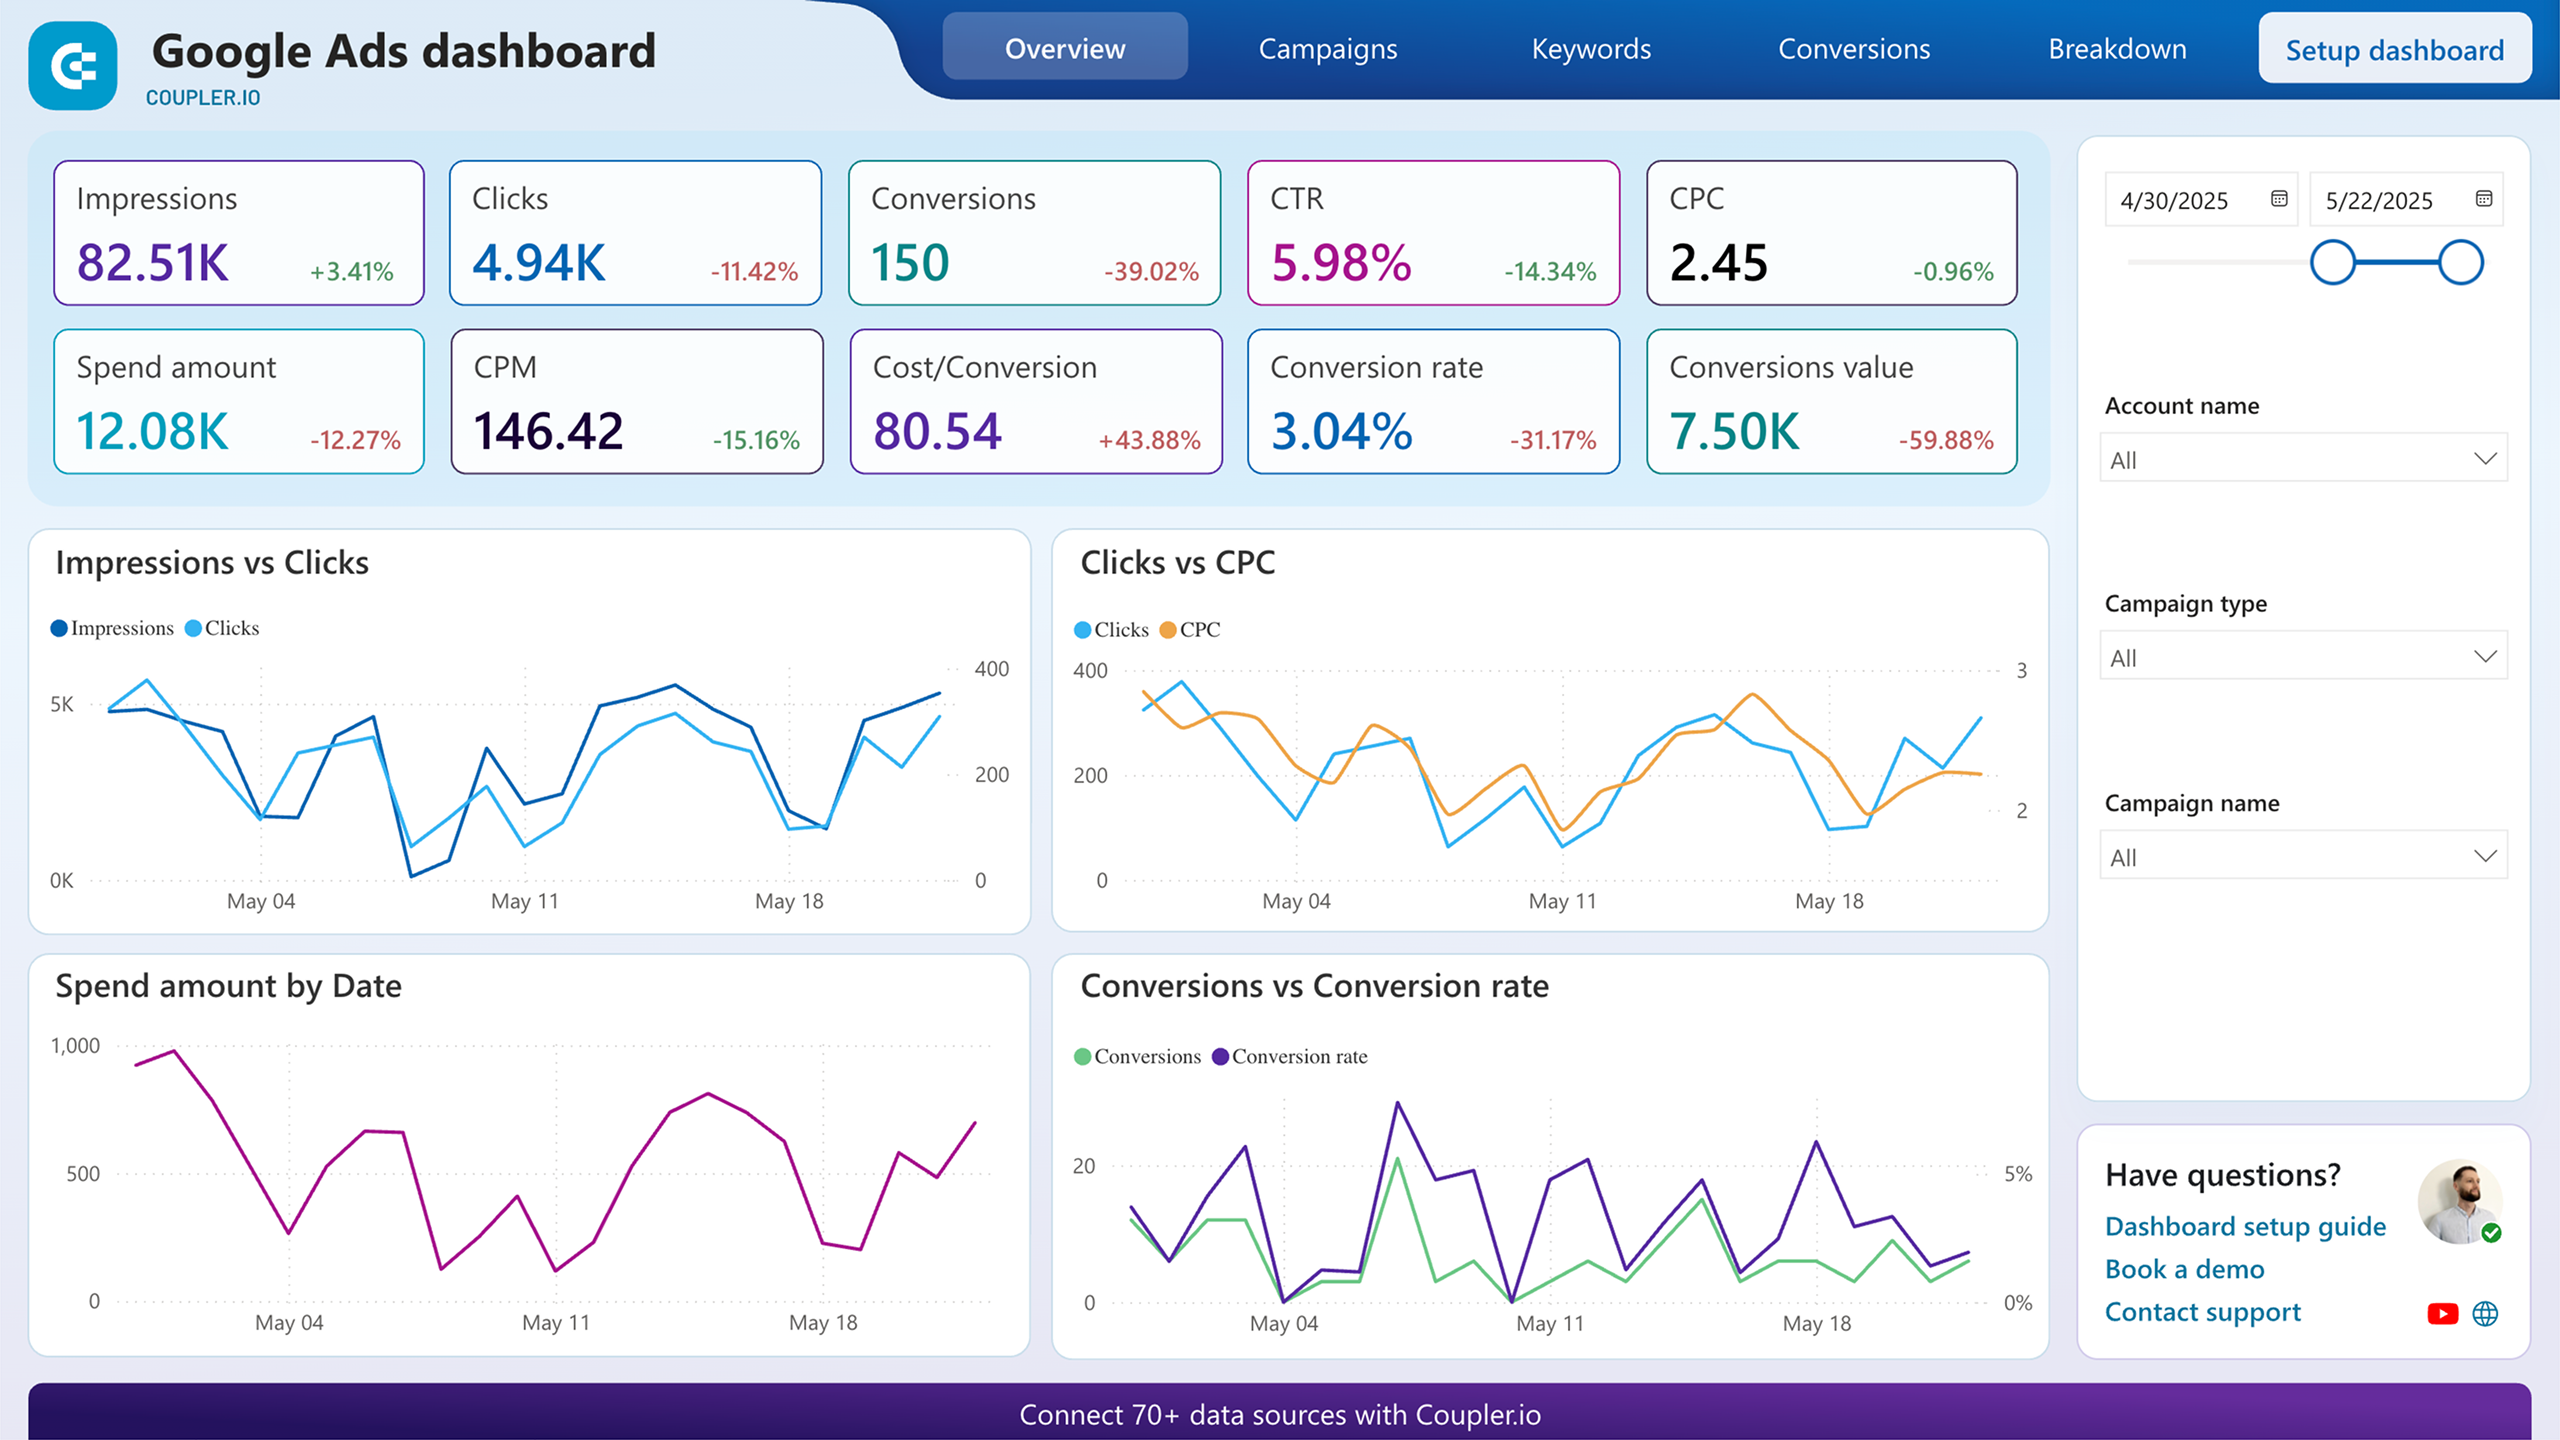
The next stop of our journey across paid ad templates is the Google Ads report template by Coupler.io. It’s a self-updating dashboard, which you can easily connect to your Google Ads account.
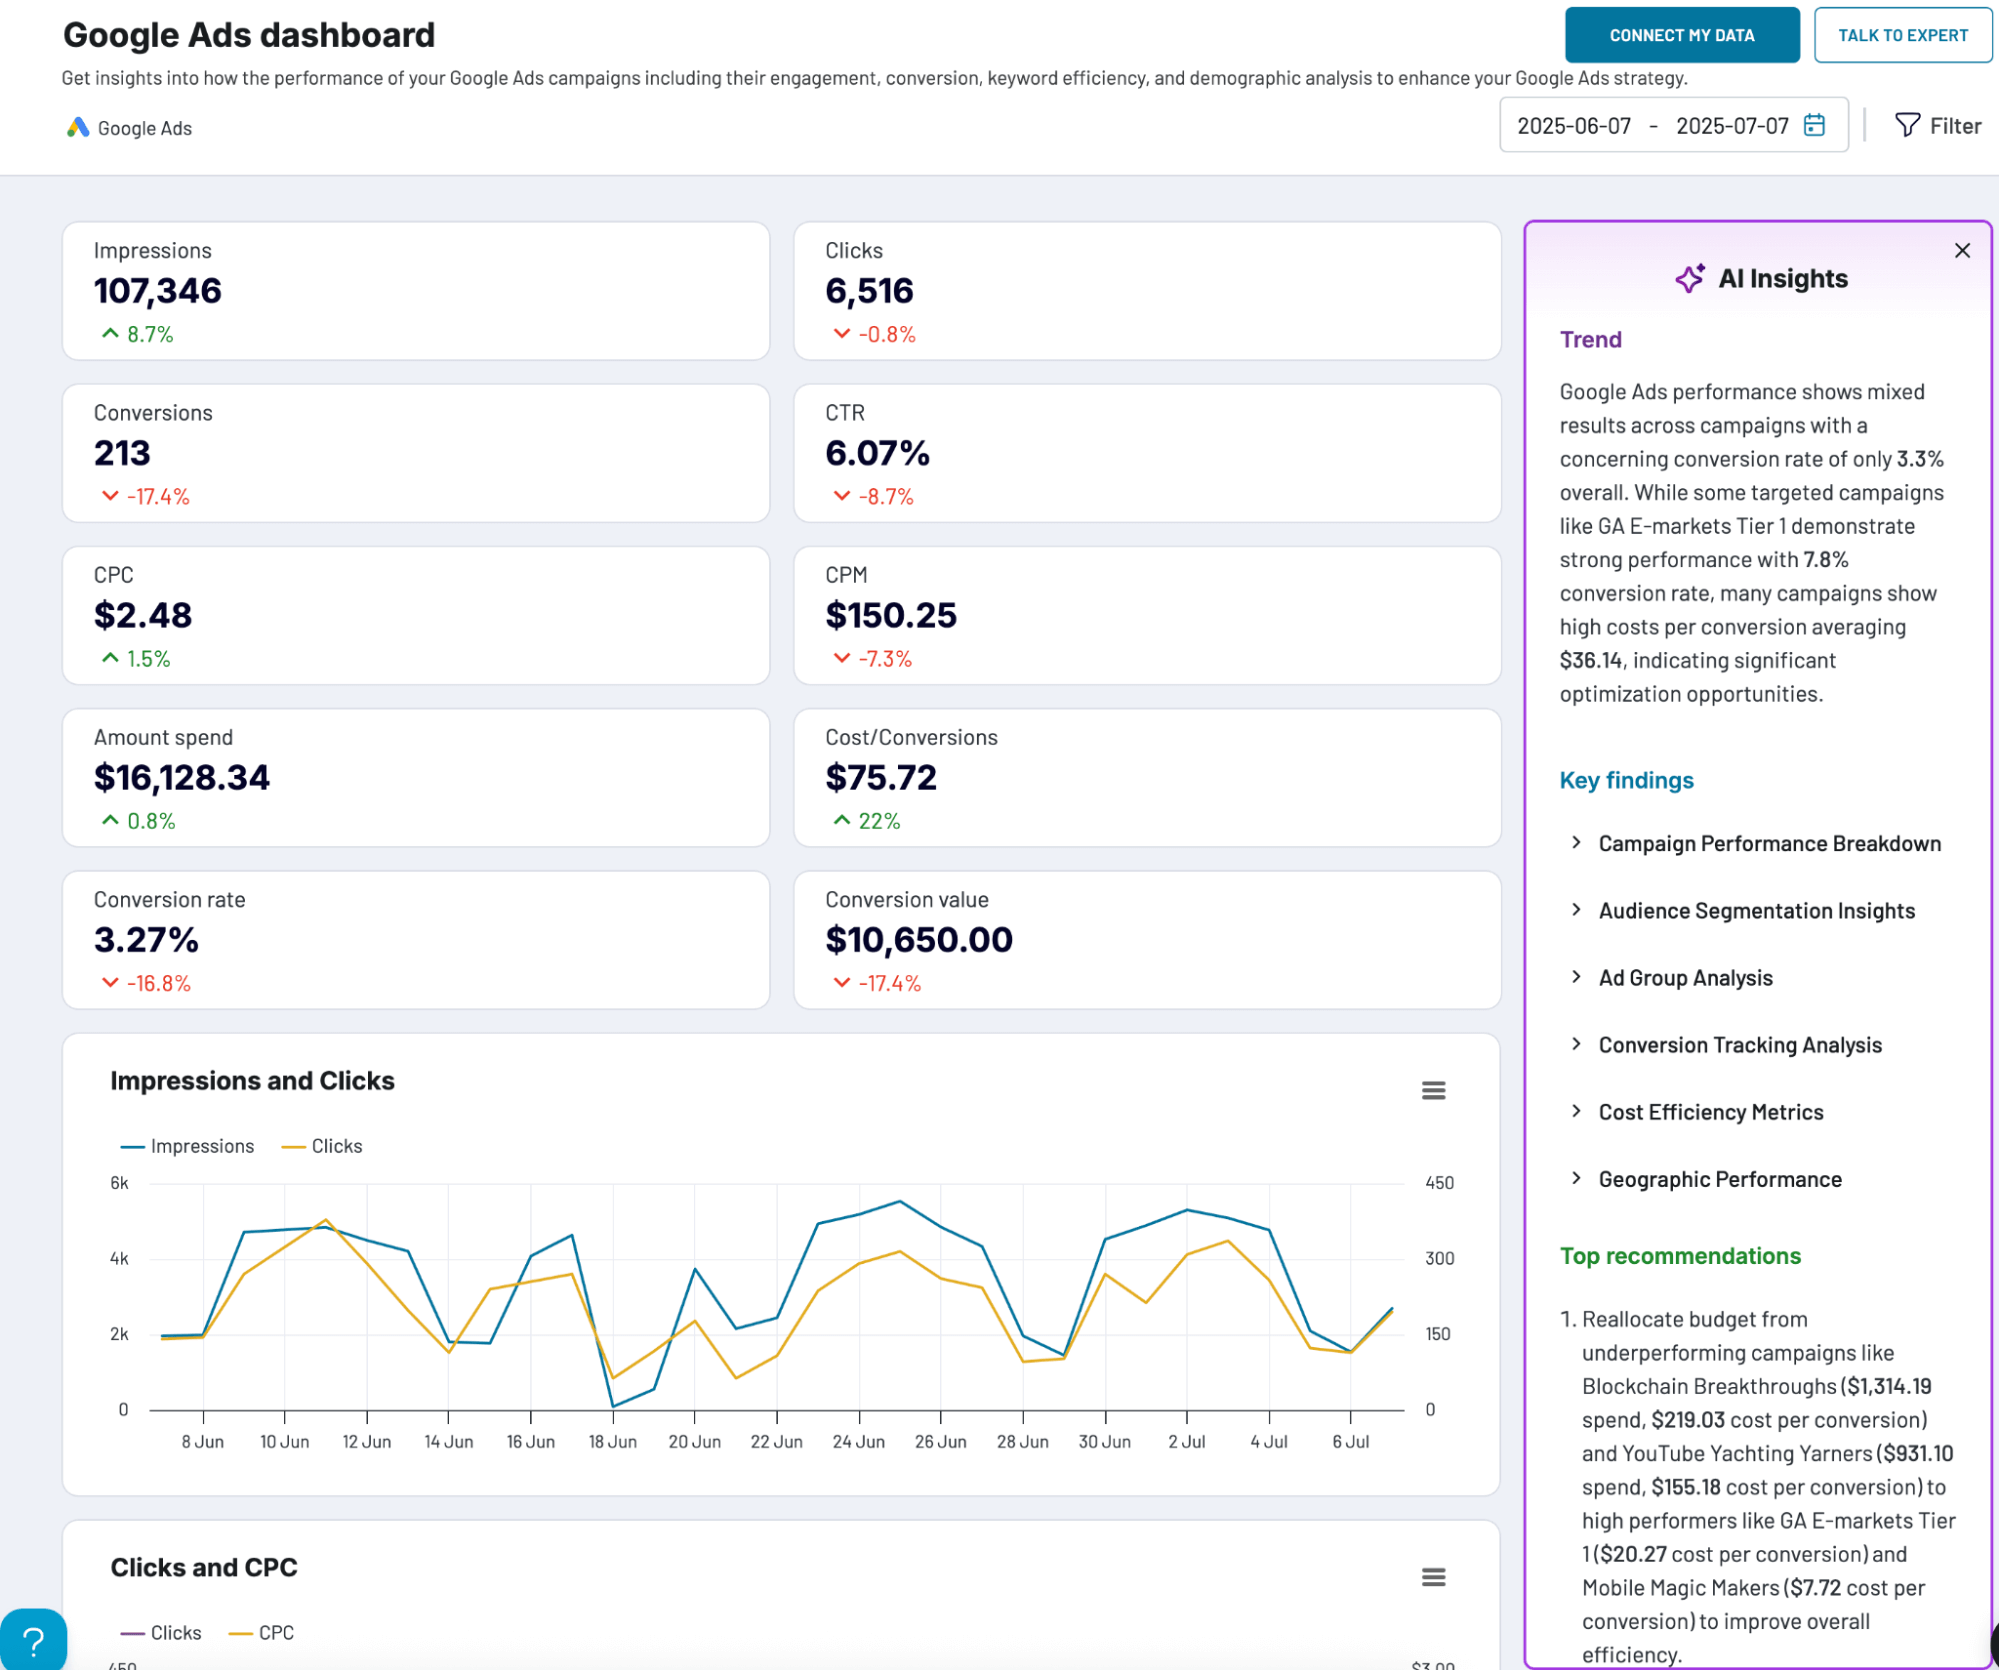
The report template allows you to monitor spending, understand your ad campaigns’ performance, and derive other valuable insights. The dashboard showcases various key metrics, including Impressions, Clicks, Cost per click, and so on.
To start using the template, you need to complete a few simple steps, which are described in the enclosed instructions. The process takes around two minutes. After that, the Google Ads report will automatically refresh according to the selected schedule. This dashboard is available in Coupler.io UI and as a report template in Google Sheets, Looker Studio, and Power BI.
Report metrics:
- Impressions
- Clicks
- CTR
- Average Cost-per-Click
- Conversions
- Cost per conversion
- Cost per thousand impressions (CPM), etc.
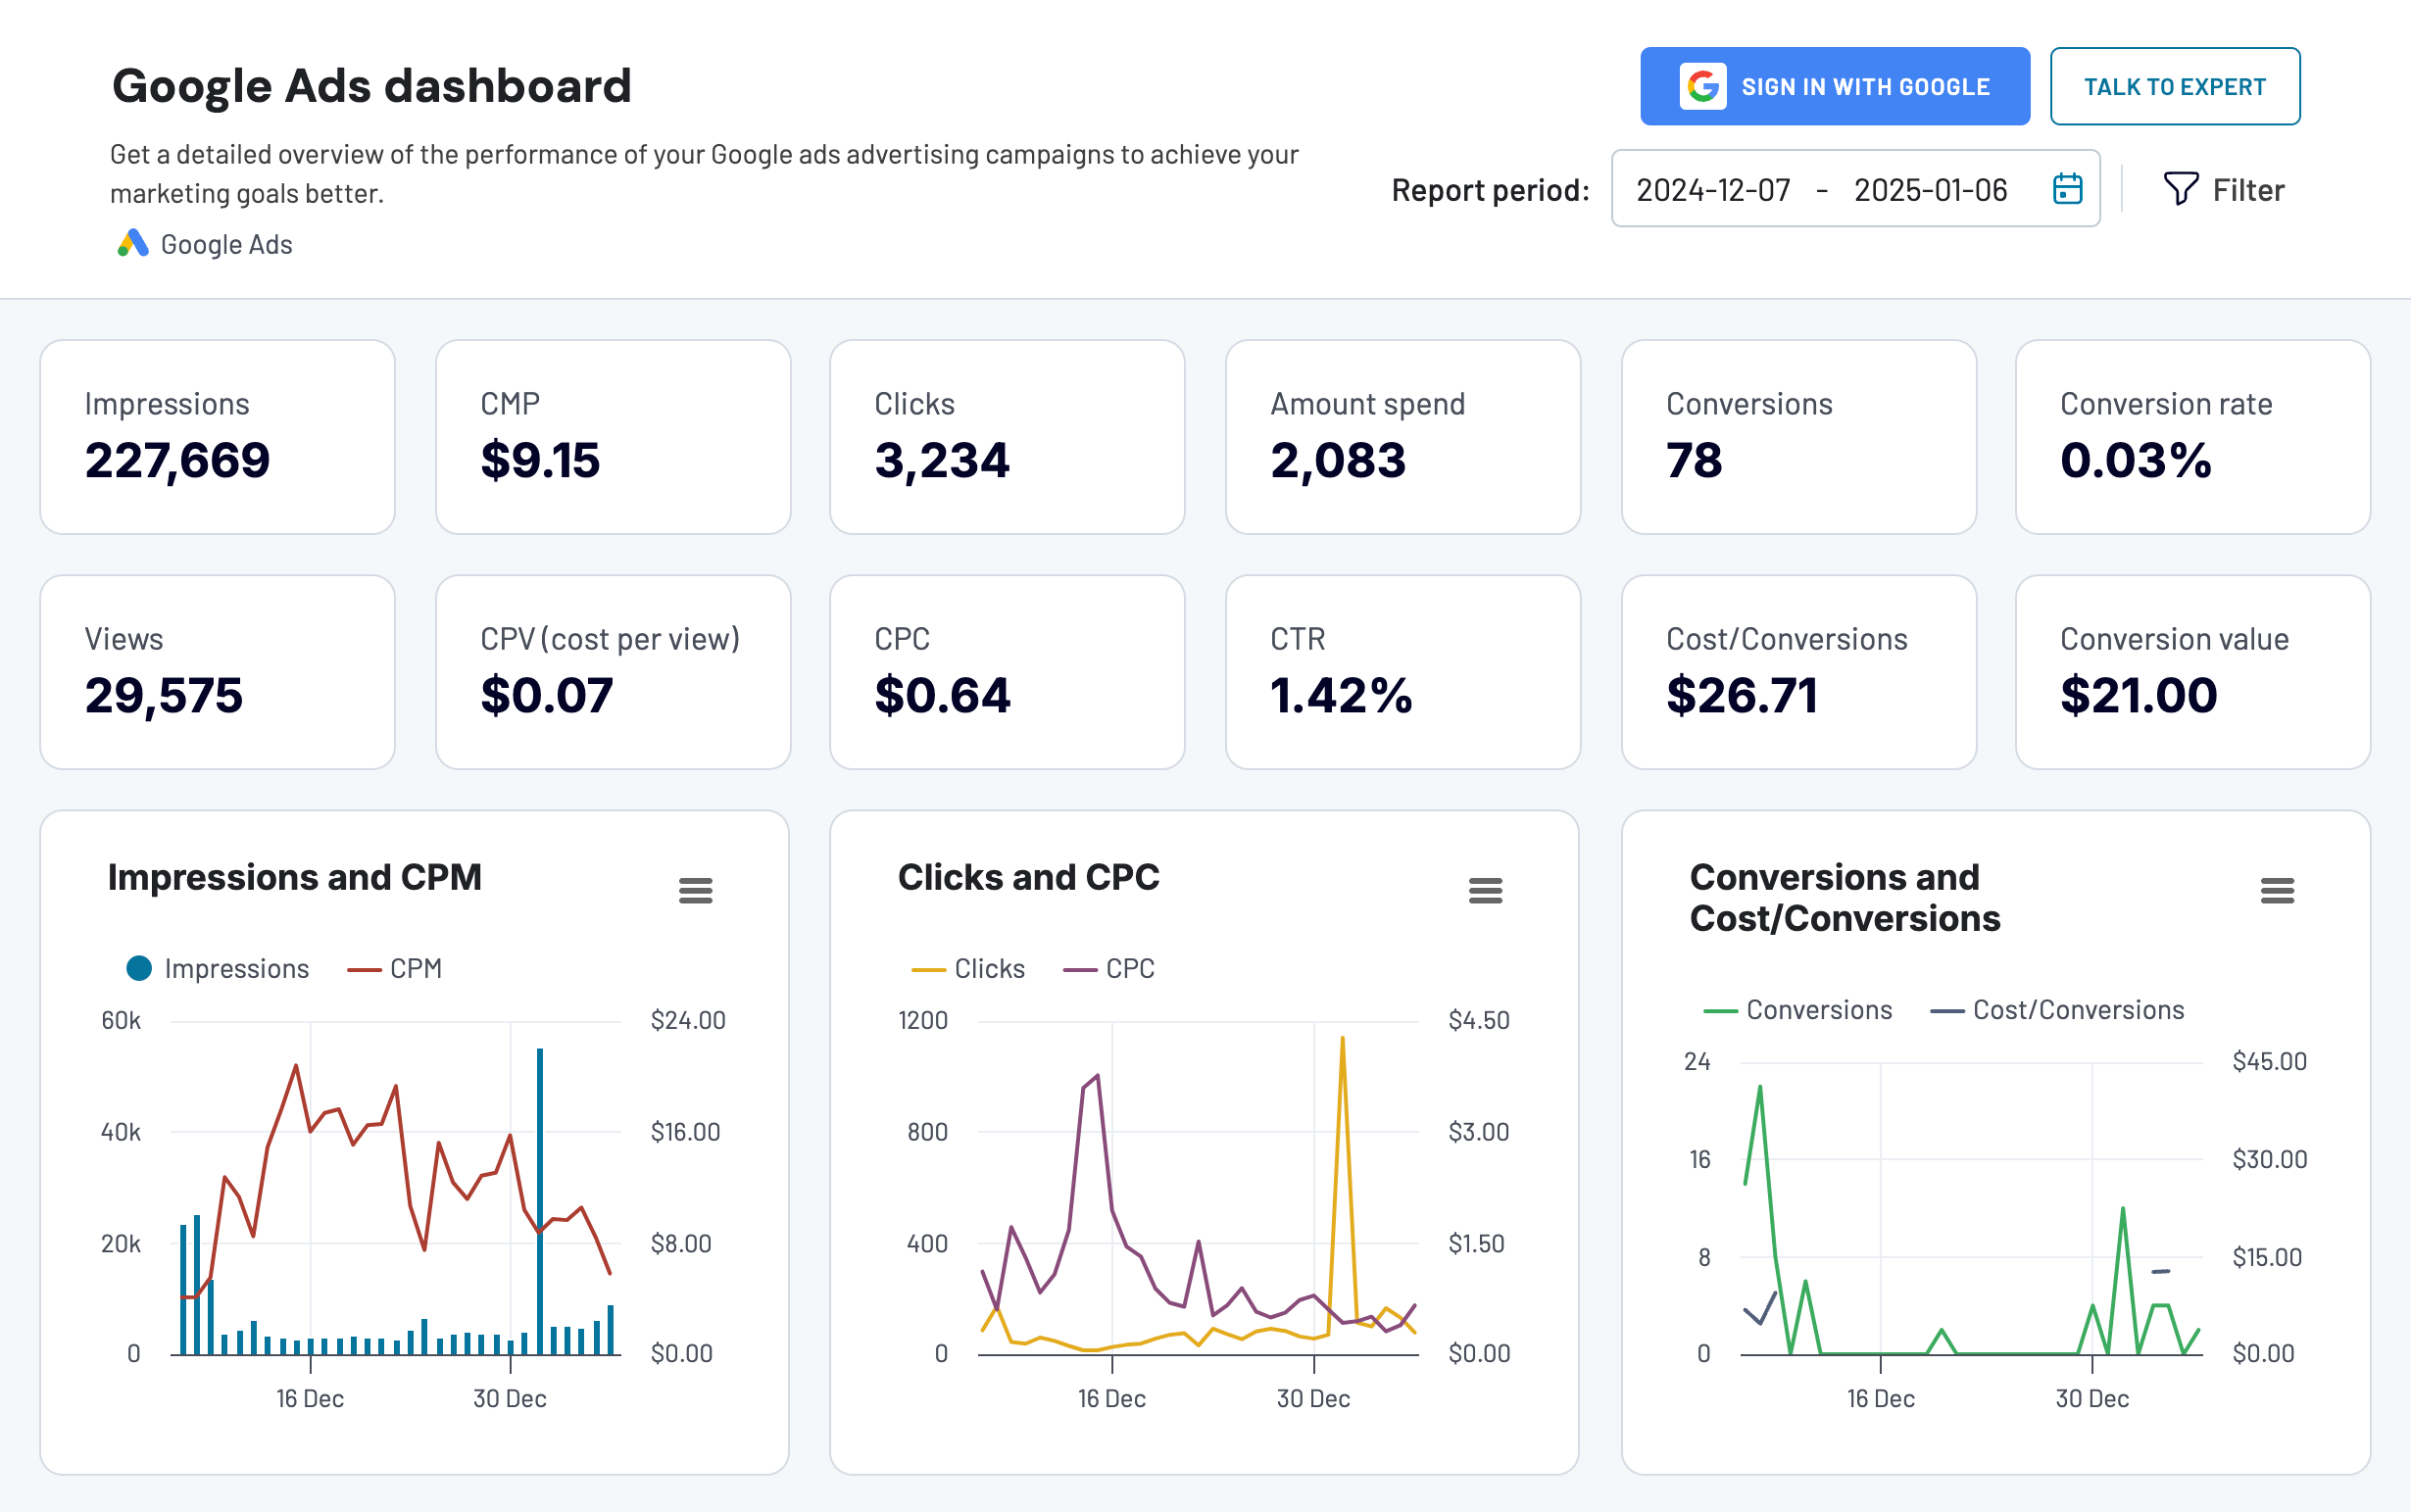
4. Google Ads monthly dashboard
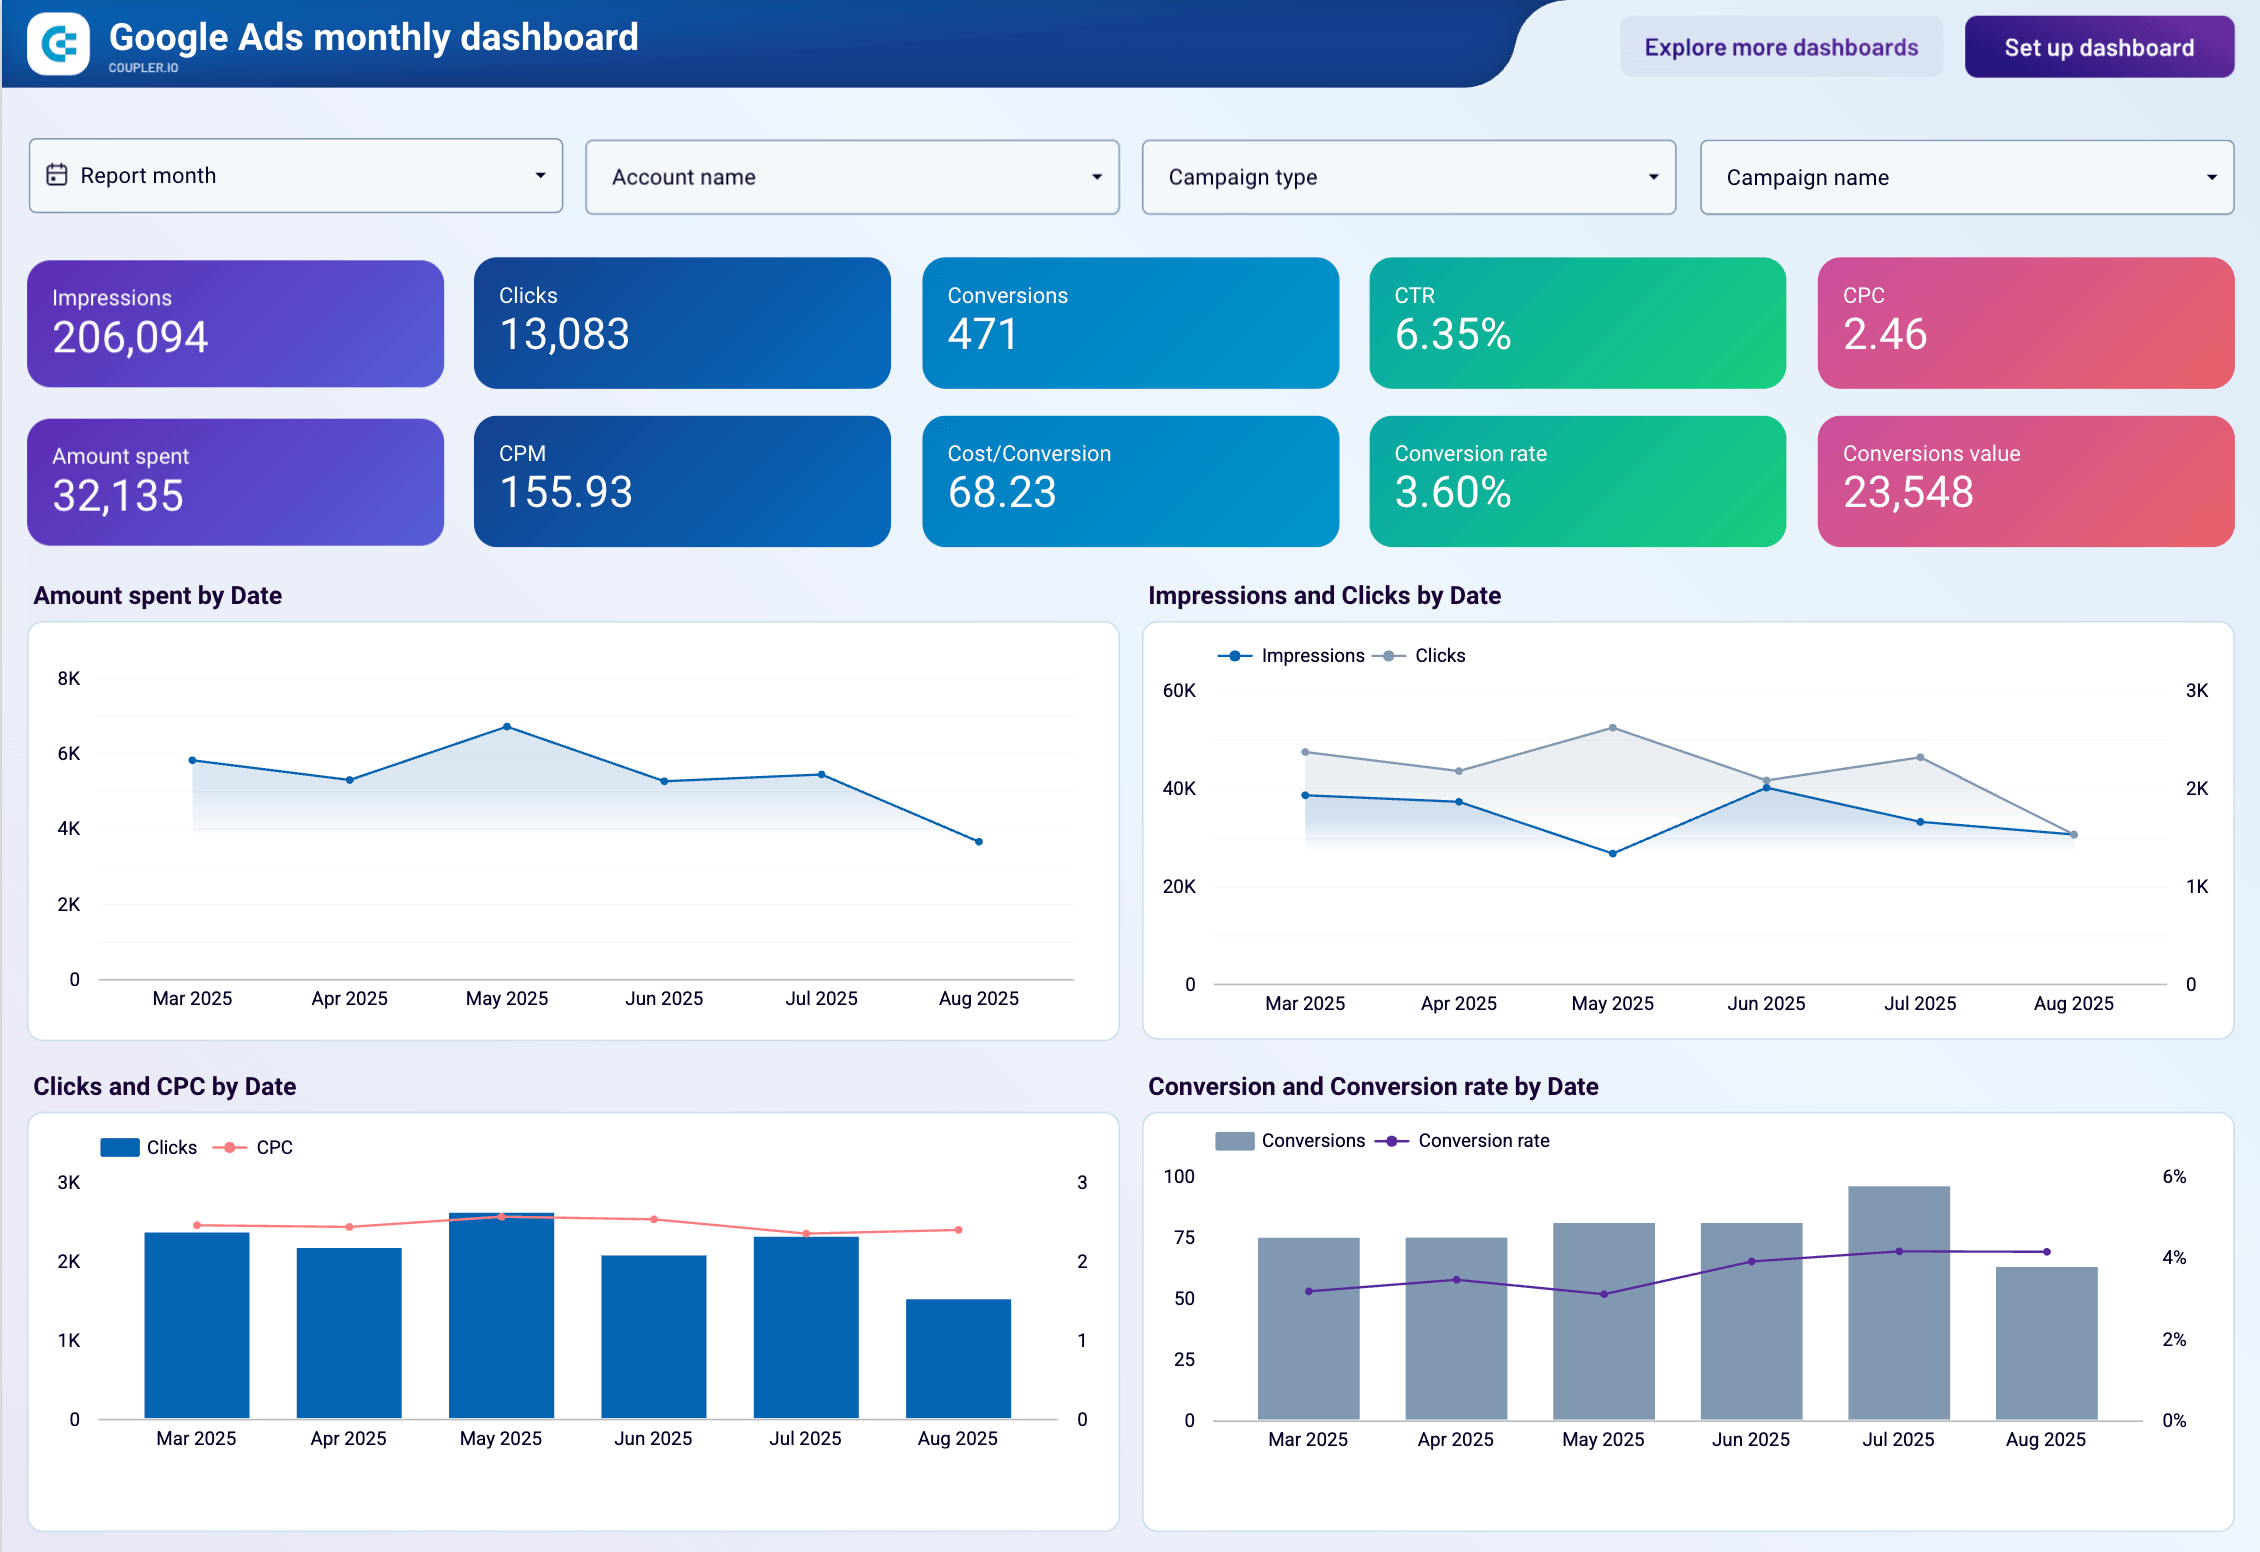
Track your Google Ads performance with a monthly perspective to identify seasonal trends, compare month-over-month growth, and optimize your advertising strategy based on historical performance patterns.
Google Ads monthly performance dashboard
 Preview dashboard
Google Ads monthly performance dashboard
Preview dashboardThis monthly reporting template consolidates your Google Ads metrics by month, making it easy to spot performance trends across longer time periods. Monitor how your campaigns perform month by month, identify seasonal patterns in ad performance, and make strategic budget decisions based on historical data.
The dashboard provides monthly breakdowns of spending, impressions, clicks, conversions, and cost efficiency metrics. Use this view to present performance reports to stakeholders, plan quarterly budgets, and understand the long-term trajectory of your Google Ads campaigns.
The report is available in Looker Studio and is equipped with the Coupler.io connector. This template automatically updates with your latest monthly data, eliminating manual report compilation.
Report metrics
- Amount spent
- Impressions
- Clicks
- CTR
- Conversions
- Cost per conversion
- CPM
- CPC
5. Google Ads leads report template
The Google Ads leads report provides insights into your lead generation campaigns across Google’s advertising platform. It consolidates critical metrics like cost per lead, lead value, and conversion rates to show you which campaigns are driving qualified prospects for your business.
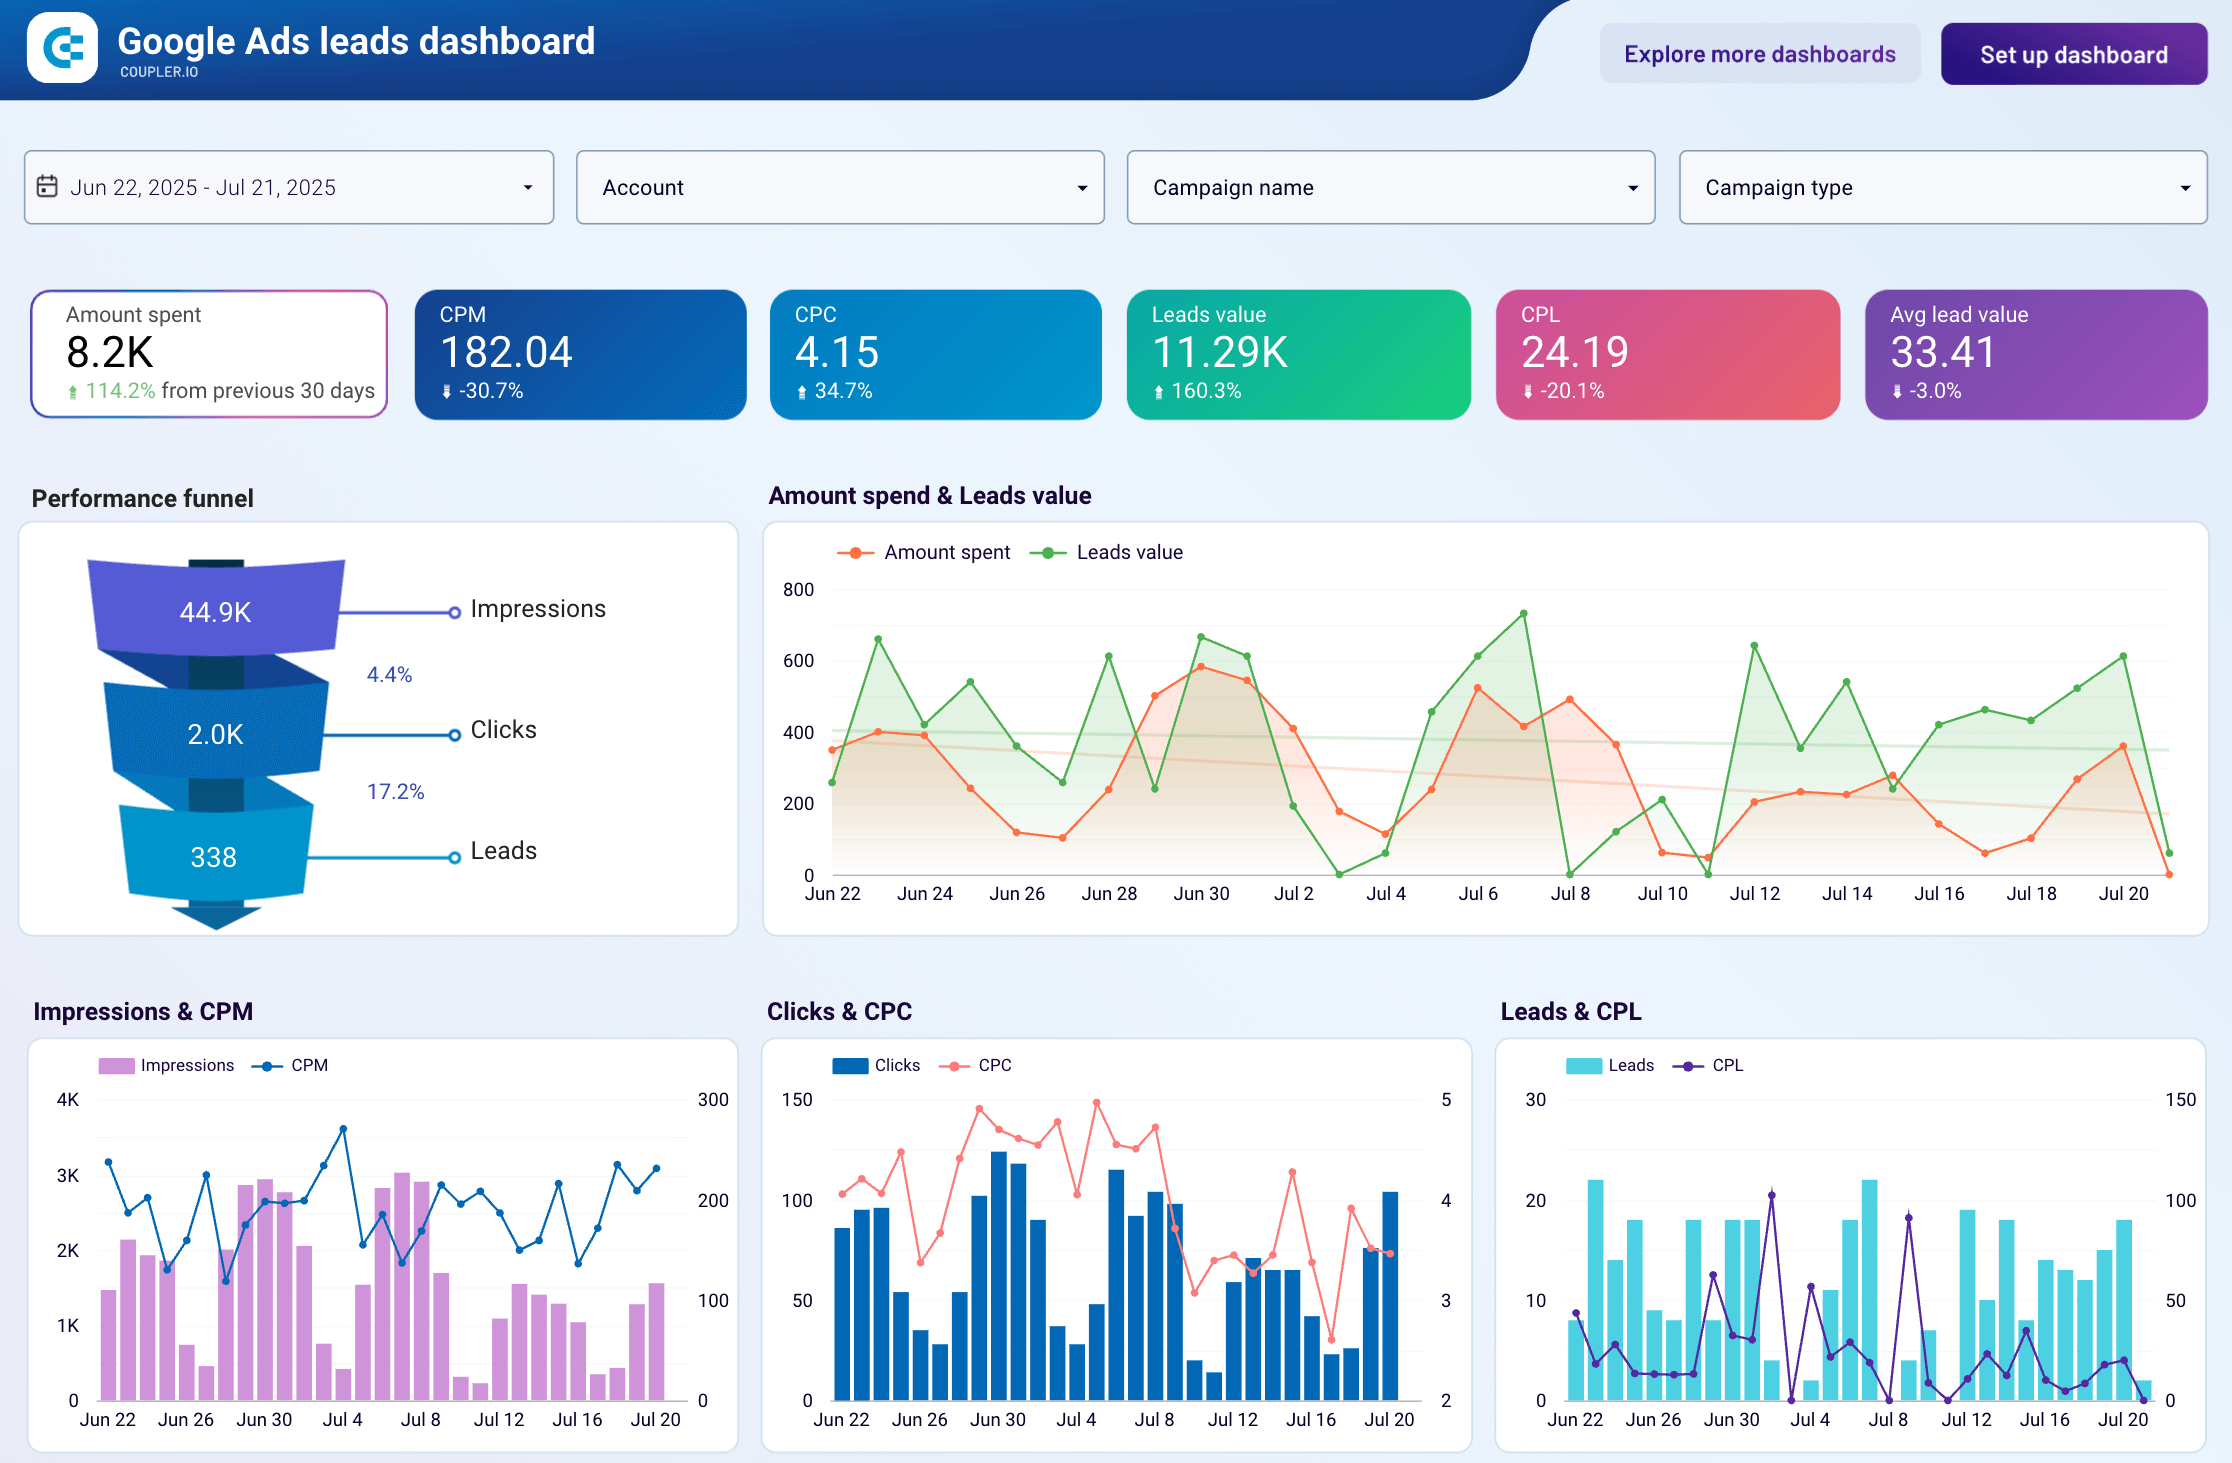
The report lets you track how ad spend correlates with lead value and what percentage of impressions or clicks convert into qualified leads. You can also analyze campaign performance in an interactive table, comparing metrics like CTR, CPC, average lead value, and more. This makes it simple to focus your budget on campaigns that attract better-quality leads.
A free template of this report is available in Looker Studio. You can populate it and sync your Google Ads data on a custom schedule by signing up for a Coupler.io account.
Report metrics:
- Amount spent
- Impressions
- Clicks
- CPM
- CPC
- Leads
- Leads value
- Avg. leads value
- Conversions
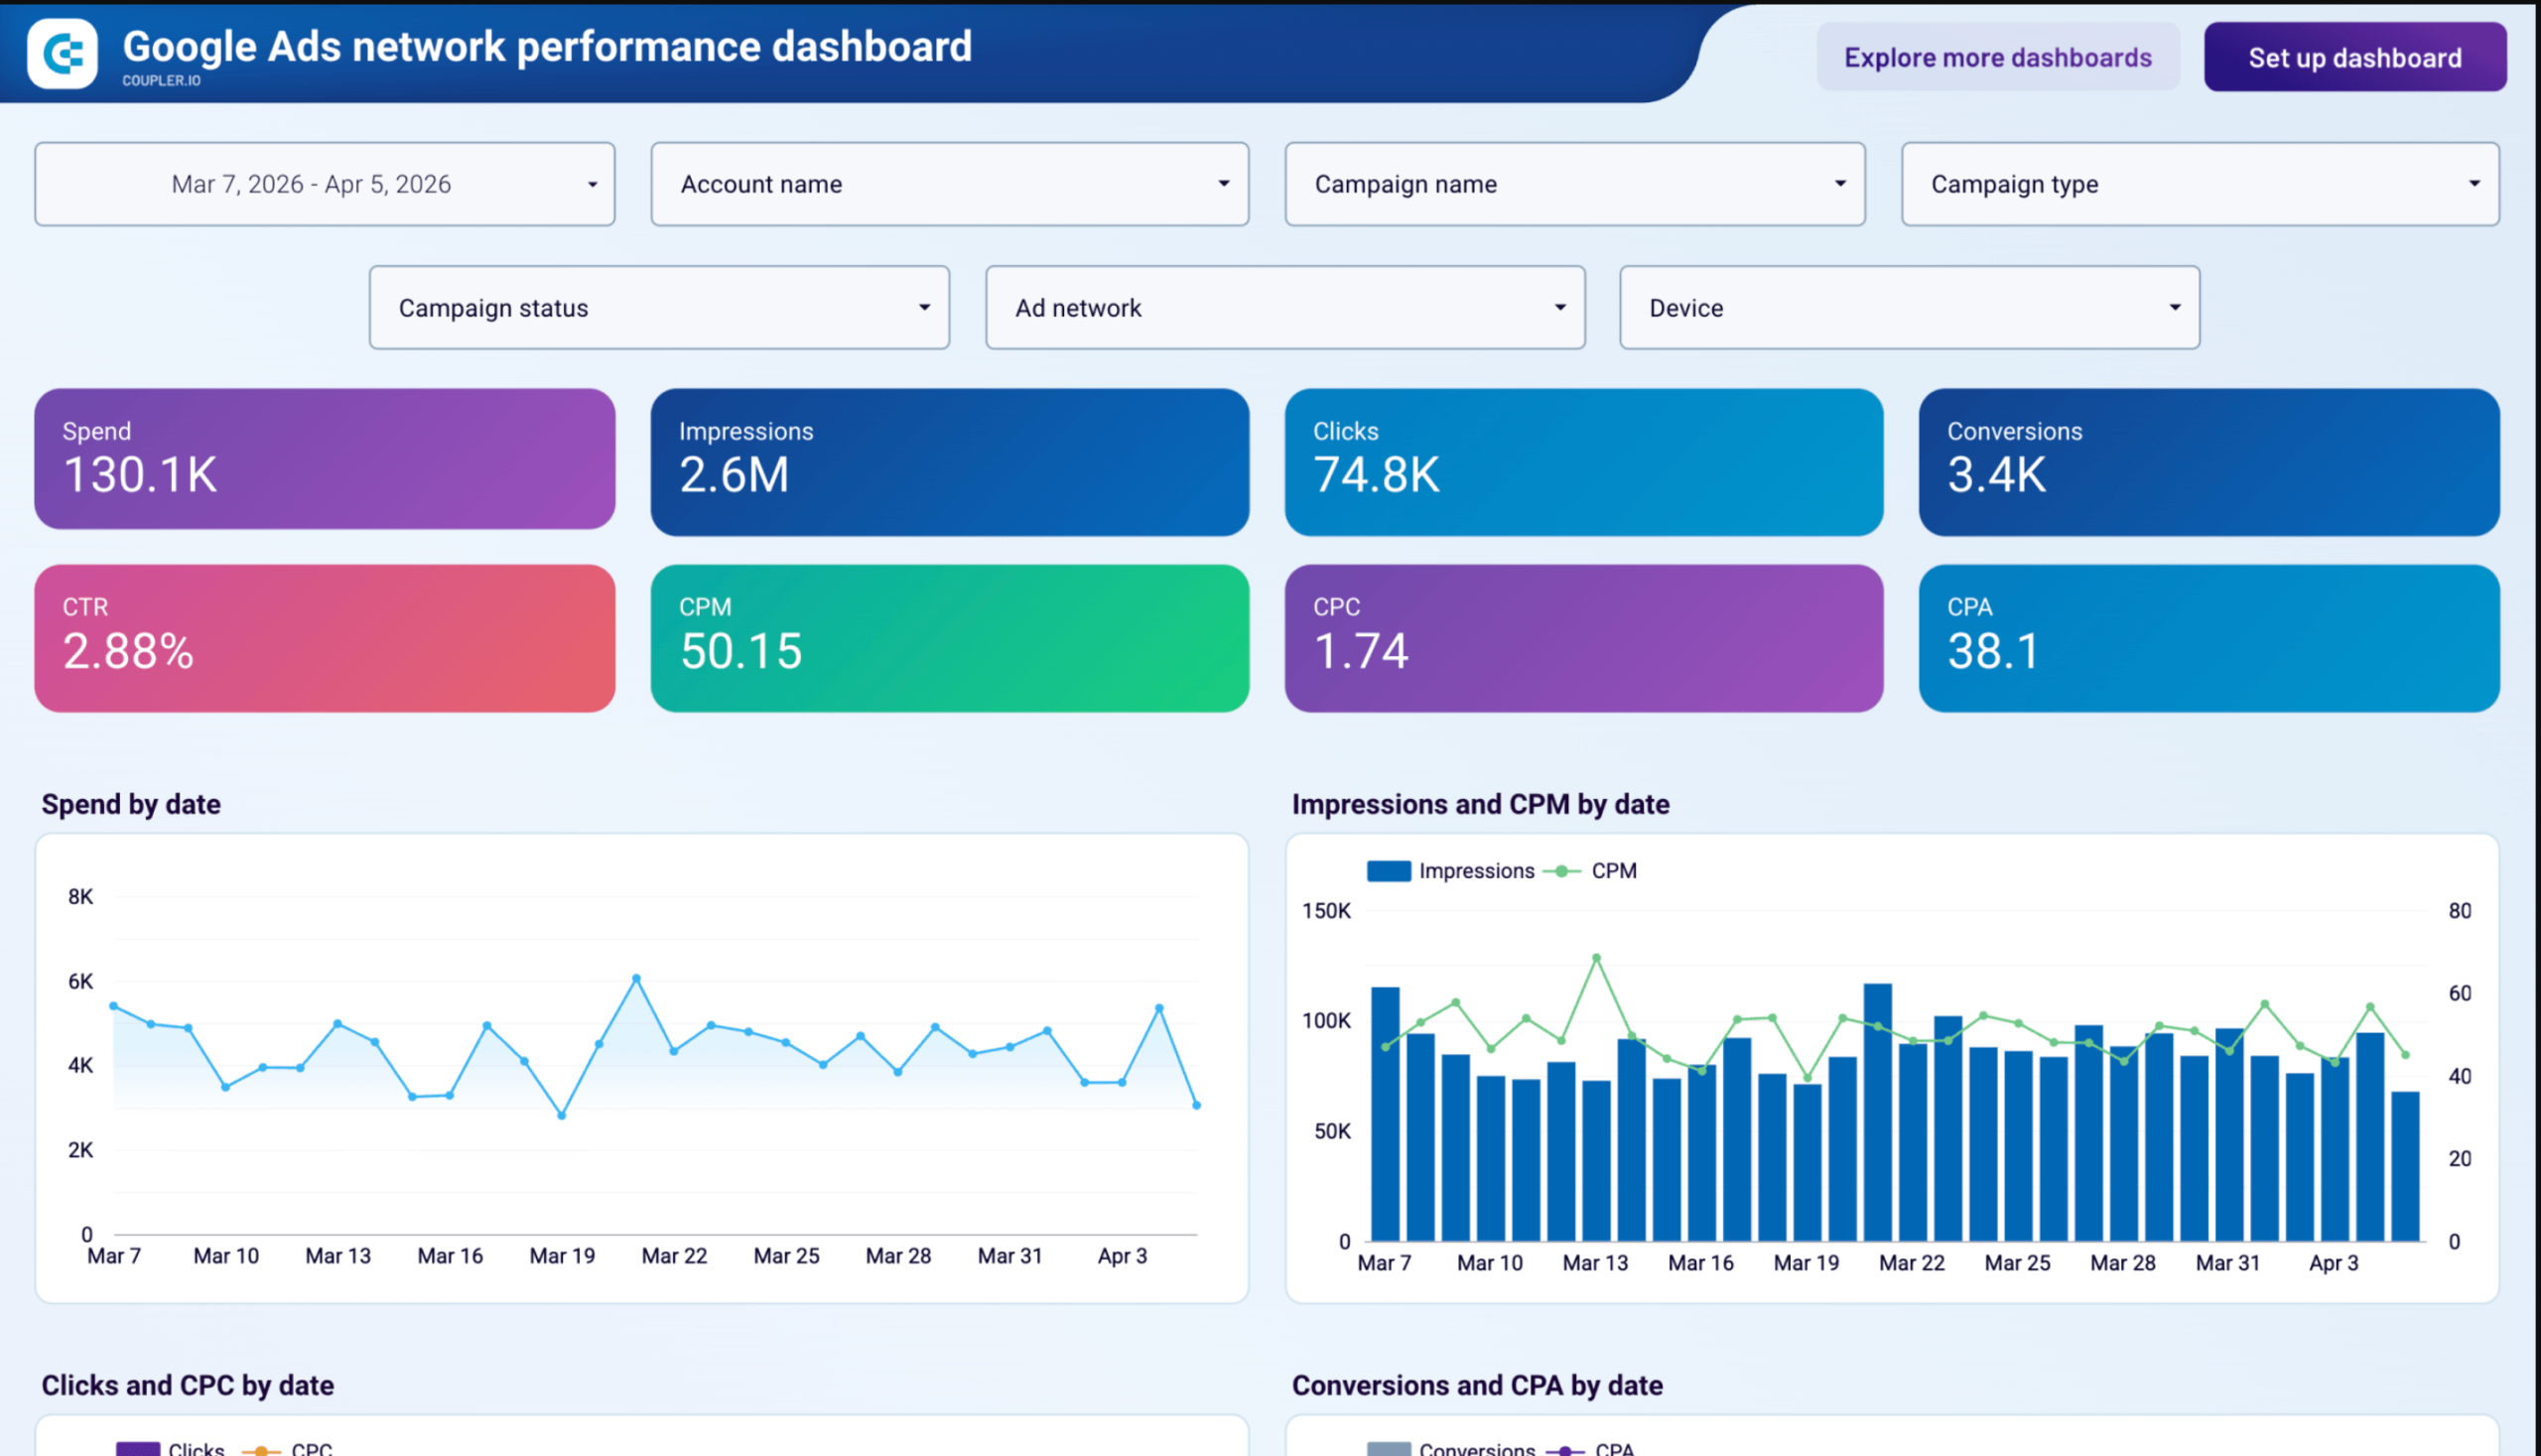
6. Google Ads network performance dashboard
If your marketing reports show Google Ads totals without splitting by ad network, you may be overlooking budget that converts at two or three times your target CPA on placements like Search Partners or Content. The Google Ads network performance dashboard by Coupler.io addresses this by breaking down performance across every network, device, and geography in your account.
Google Ads network performance dashboard
 Preview dashboard
Google Ads network performance dashboard
Preview dashboardThe five-page Data Studio template covers daily trend charts, a full campaign metrics table, impression share analysis, conversion breakdowns by action name, video asset performance with quartile completion tracking, and Performance Max asset ratings from Google.
Connect your Google Ads account via Coupler.io to populate the report. Data refreshes on the schedule you set.
Report metrics:
- Spend
- Impressions
- Clicks
- Conversions
- Click-through rate (CTR)
- Cost per mille (CPM)
- Cost per click (CPC)
- Cost per acquisition (CPA)
- Impression share
- Search top impression share
- Search lost IS (budget)
- Search lost IS (rank)
- Video view completion rates
Marketing report templates for Meta Ads (Facebook/Instagram)
Meta’s advertising platforms (Facebook and Instagram) offer powerful targeting capabilities for reaching specific audiences. These templates help you track ad performance, analyze audience engagement, and optimize your social advertising strategy across Meta’s ecosystem.
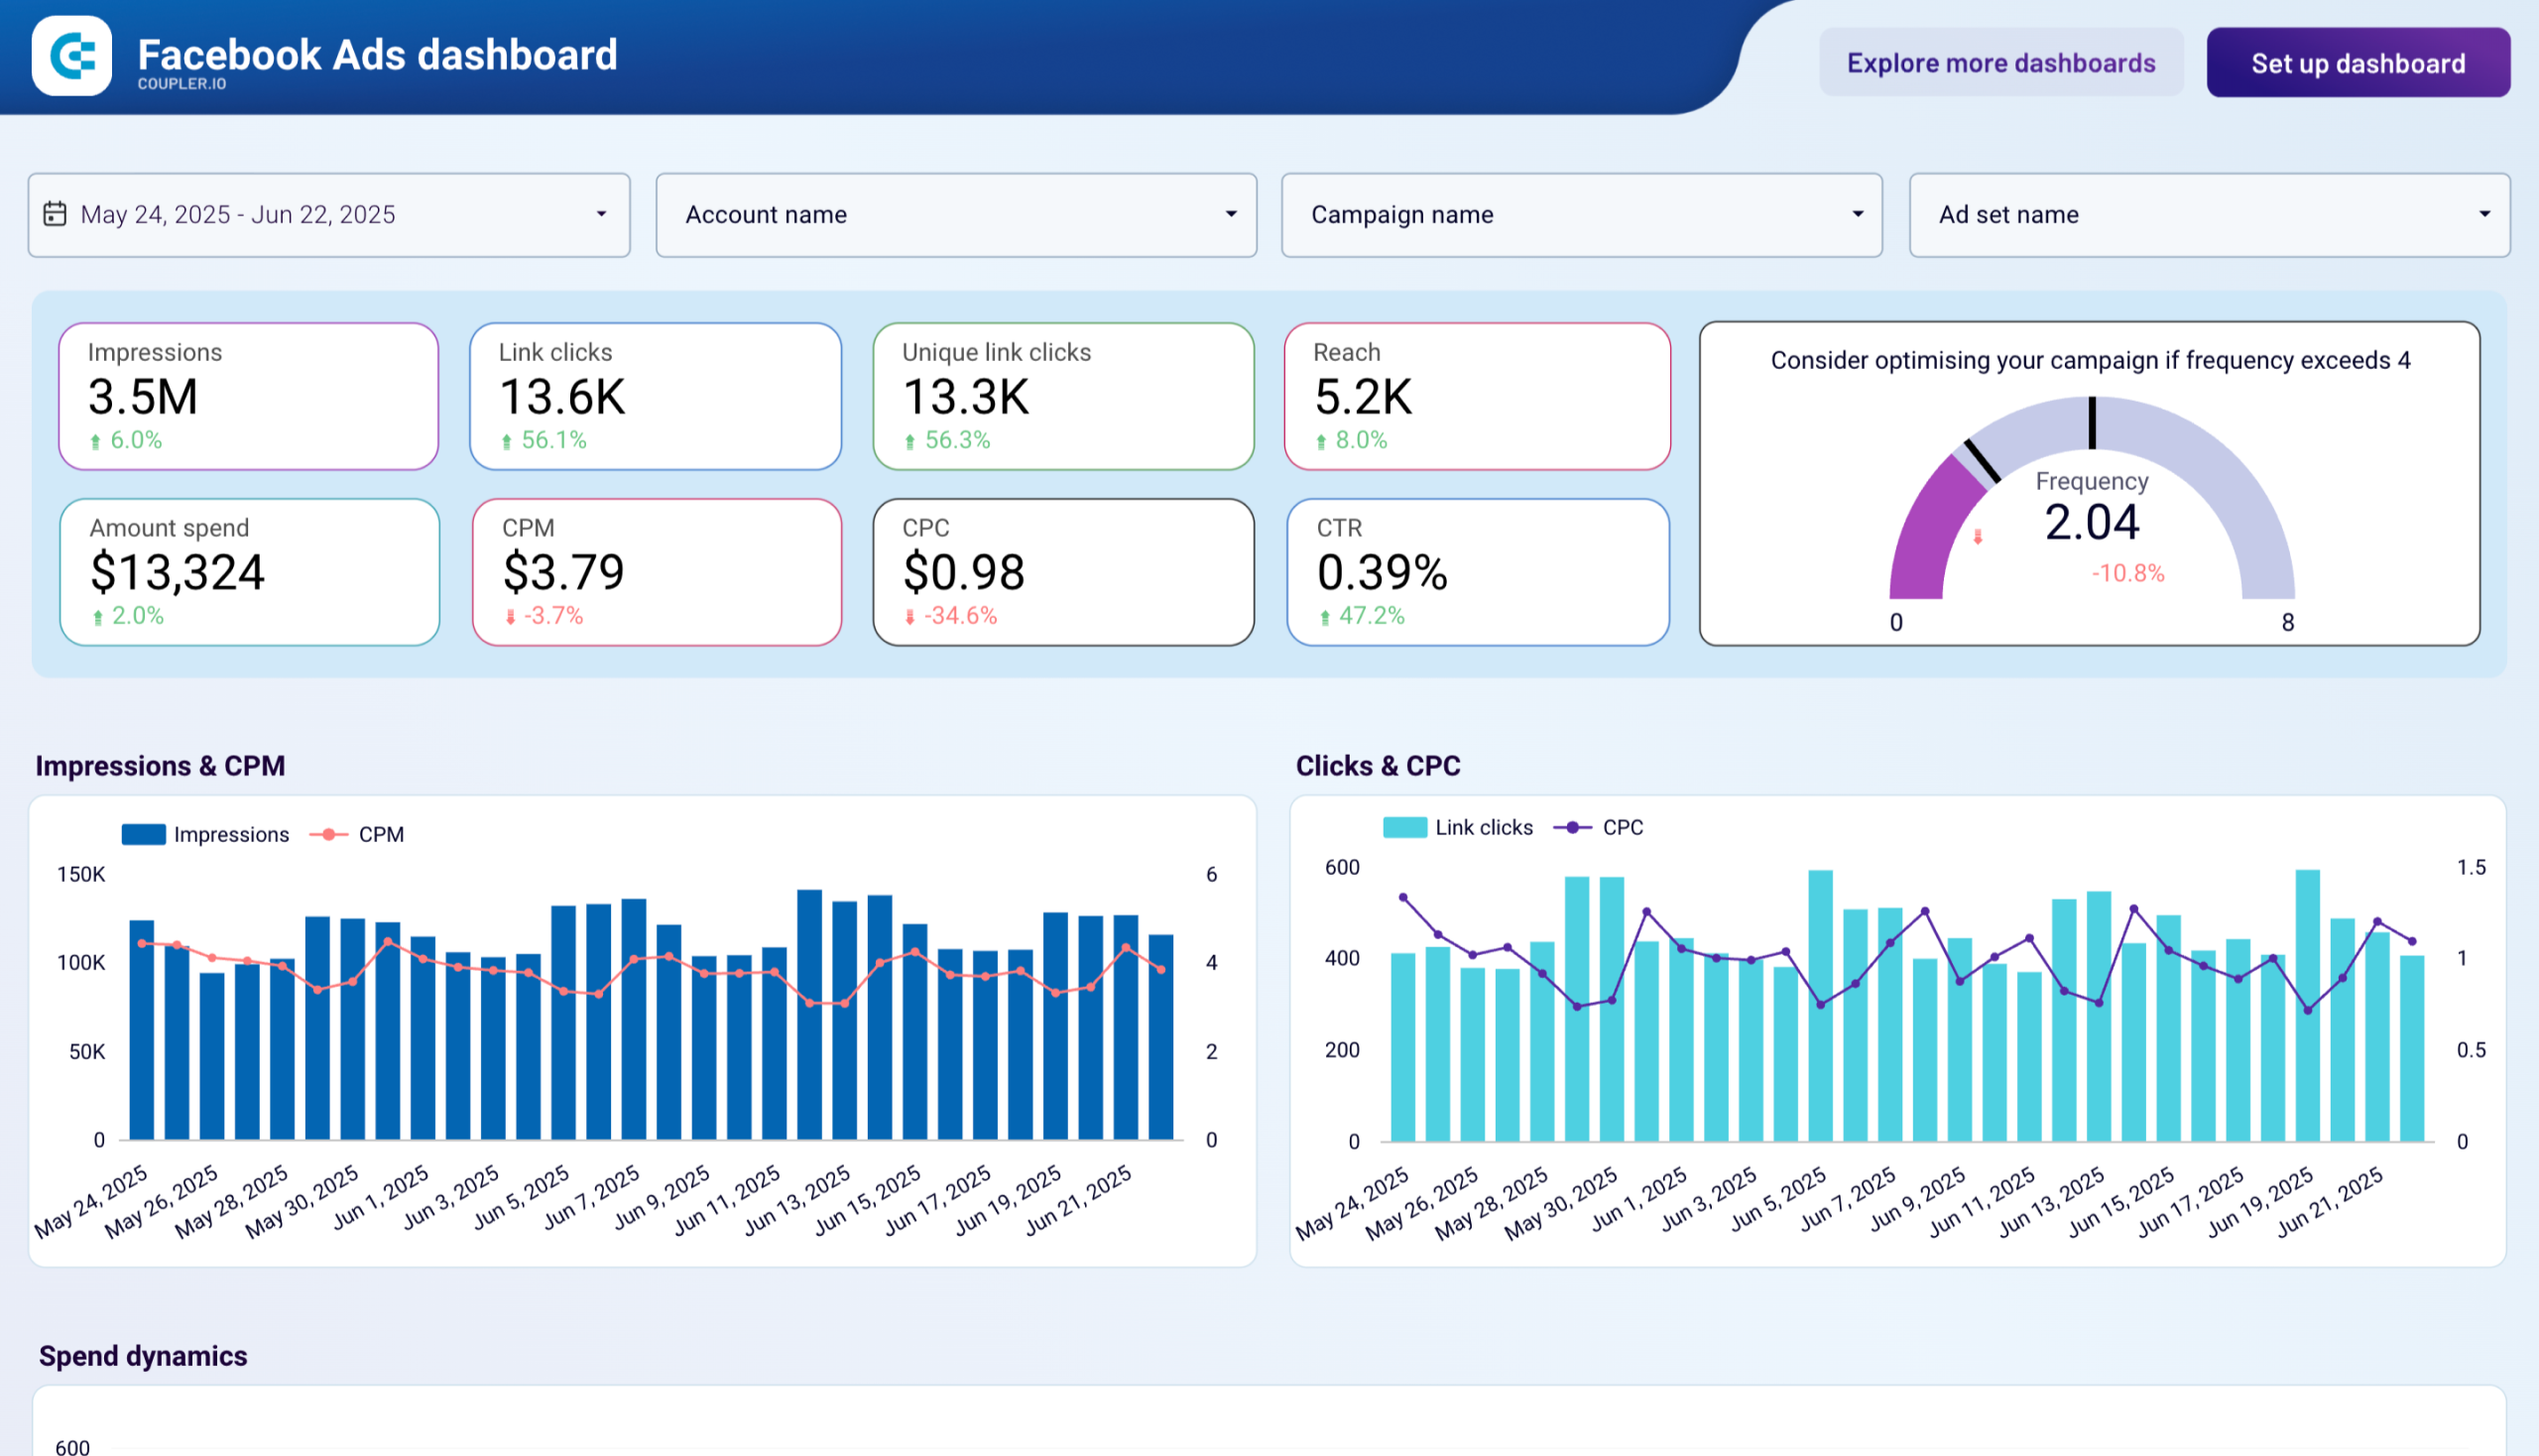
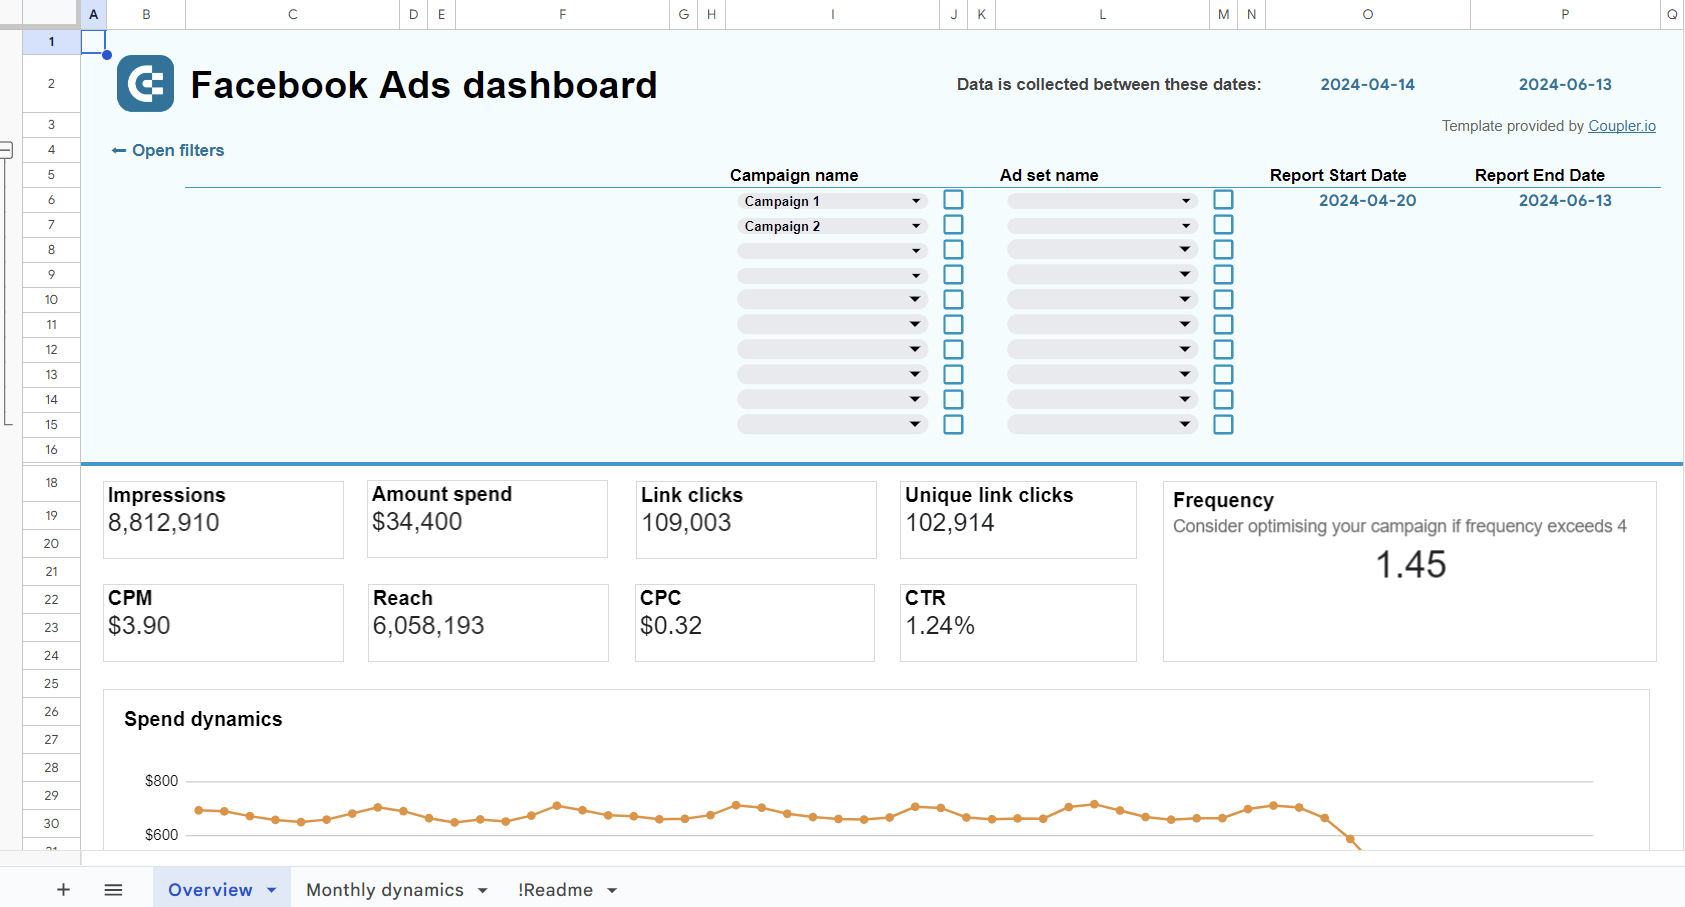
7. Facebook Ads report template
With this Facebook Ads marketing report template, you can track various metrics, monitor your campaigns’ performance, and identify the most profitable assets to spend your budget wisely.
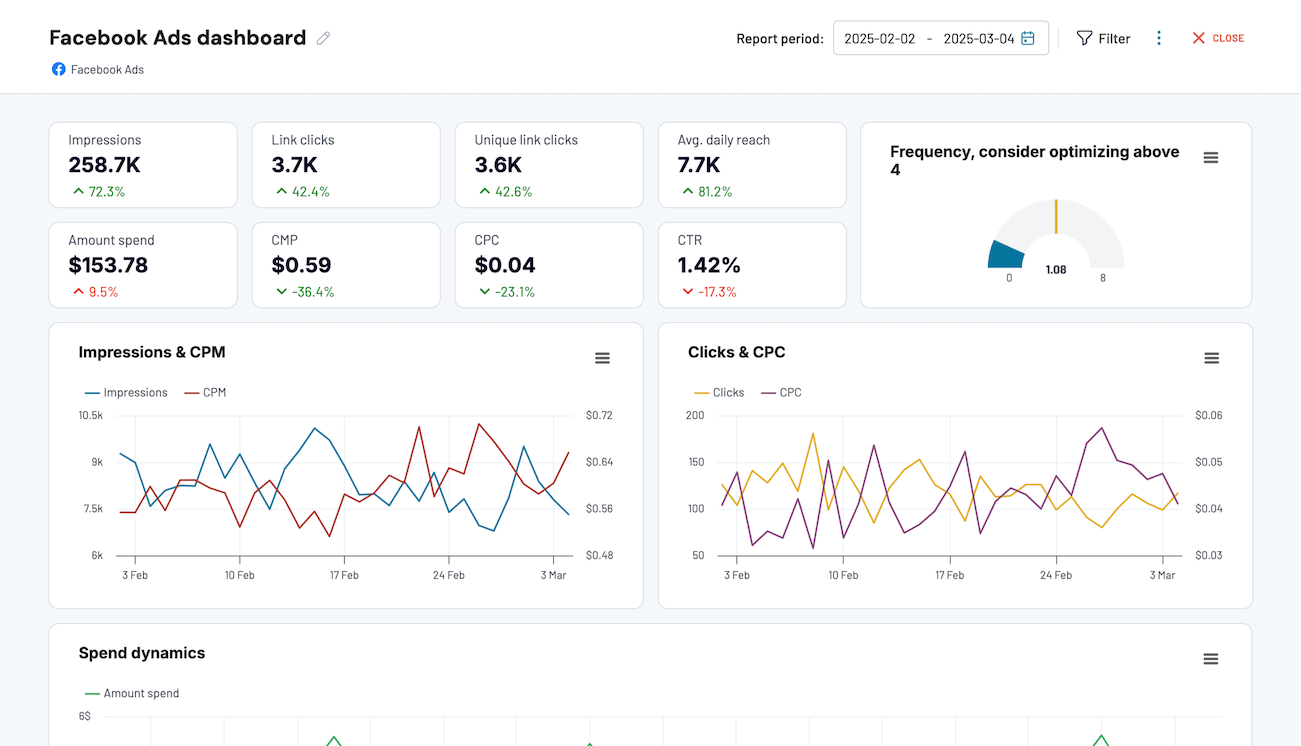
Just like with the previous report for Google Ads, you can easily automate your marketing reporting activity with this template for Facebook Ads. It works in the same way – you just need to connect your Facebook Ads account, and Coupler.io will automatically fill this report with your data. This report is available in Coupler.io UI and as a template in Looker Studio, Power BI, and Google Sheets.
Report metrics:
- Impressions
- Cost per thousand impressions (CPM)
- Clicks
- Unique clicks
- Actions
- CPA
- Action rate
- Total amount spent
- CTR
- Average Cost-per-Click
- Conversions
- Purchases
- And others
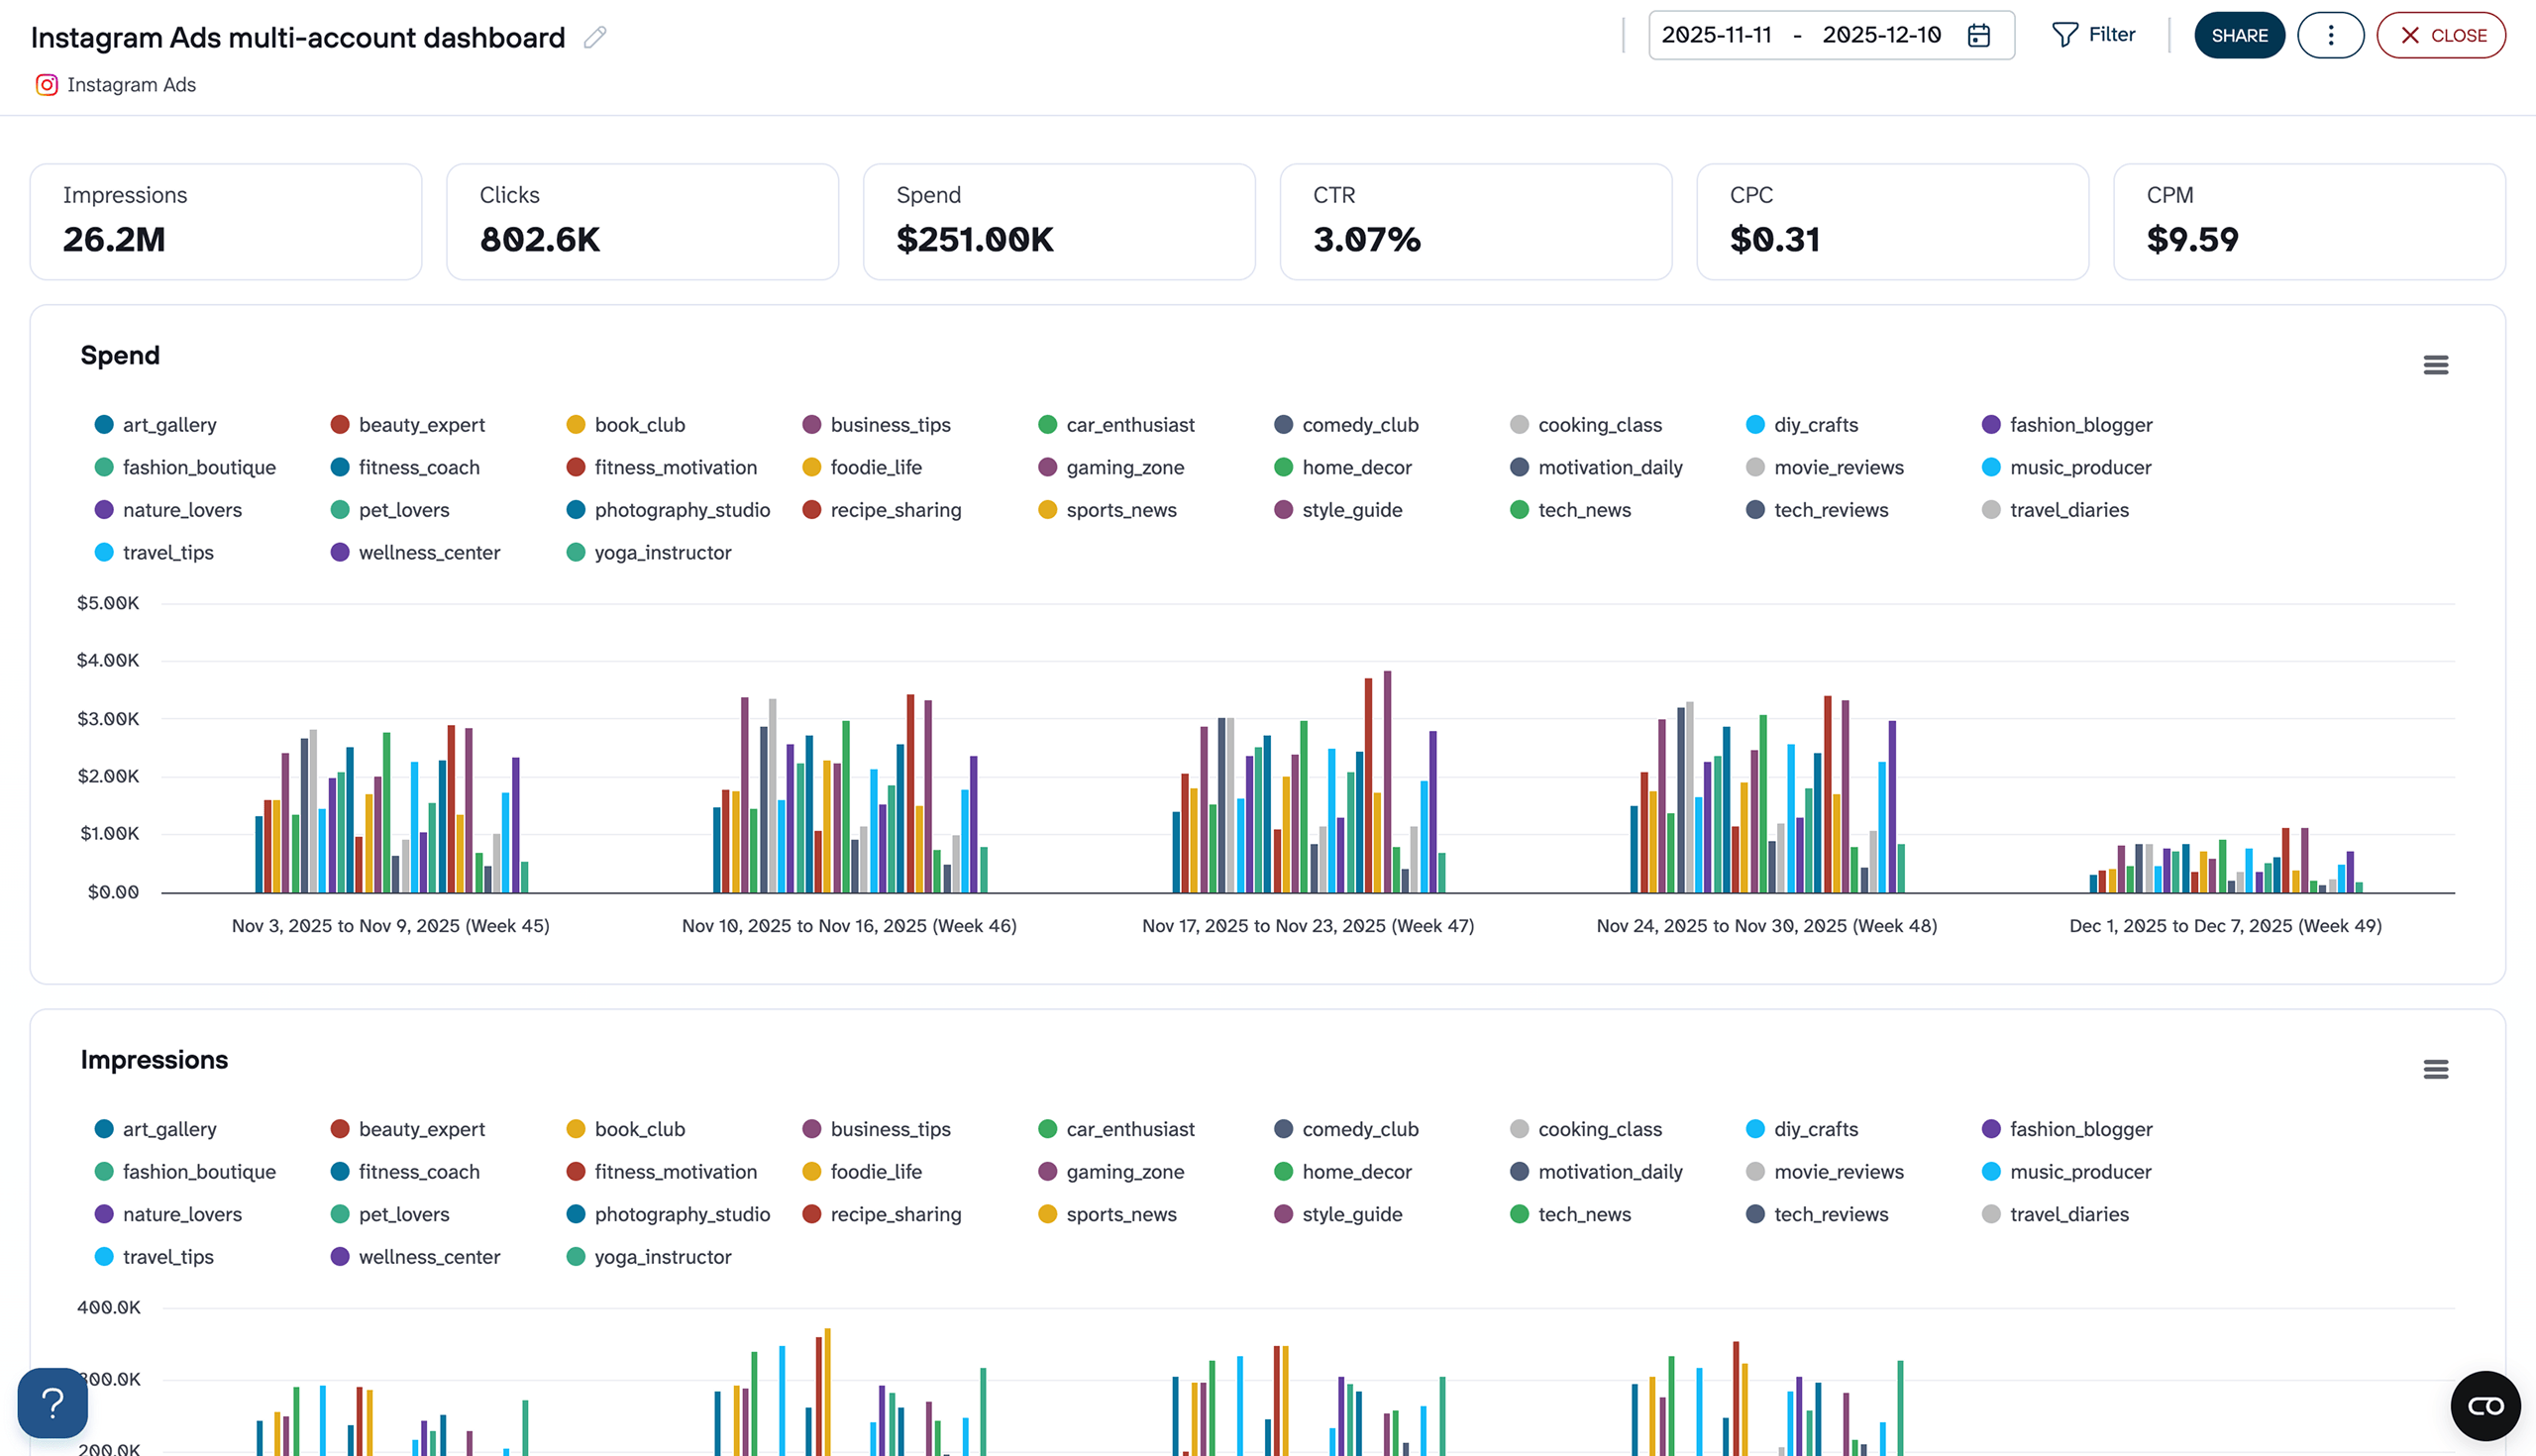
8. Instagram Ads multi-account report template
The Instagram Ads multi-account dashboard lets you compare advertising performance across all your Instagram accounts in one report. If you manage multiple accounts for different brands, clients, or regions, you no longer need to switch between ad managers or stitch together exports to get the full picture.
Instagram Ads multi-account dashboard
 Preview dashboard
Instagram Ads multi-account dashboard
Preview dashboardThe report plots weekly spend, impressions, and clicks per account, so you can see which accounts consume the most budget and whether that spend delivers proportional results. Per-account frequency tracking helps you catch audience saturation before it drives up costs, and the weekly spend charts reveal pacing problems when an account burns through its budget too early in the month. The account performance table ranks all accounts side by side for monthly reviews.
The report is available right in Coupler.io. To use it, simply connect the Instagram Ads accounts you want to track following the instructions.
Report metrics
- Impressions
- Clicks
- Spend
- CTR
- CPC
- CPM
- Average daily reach
- Average daily frequency
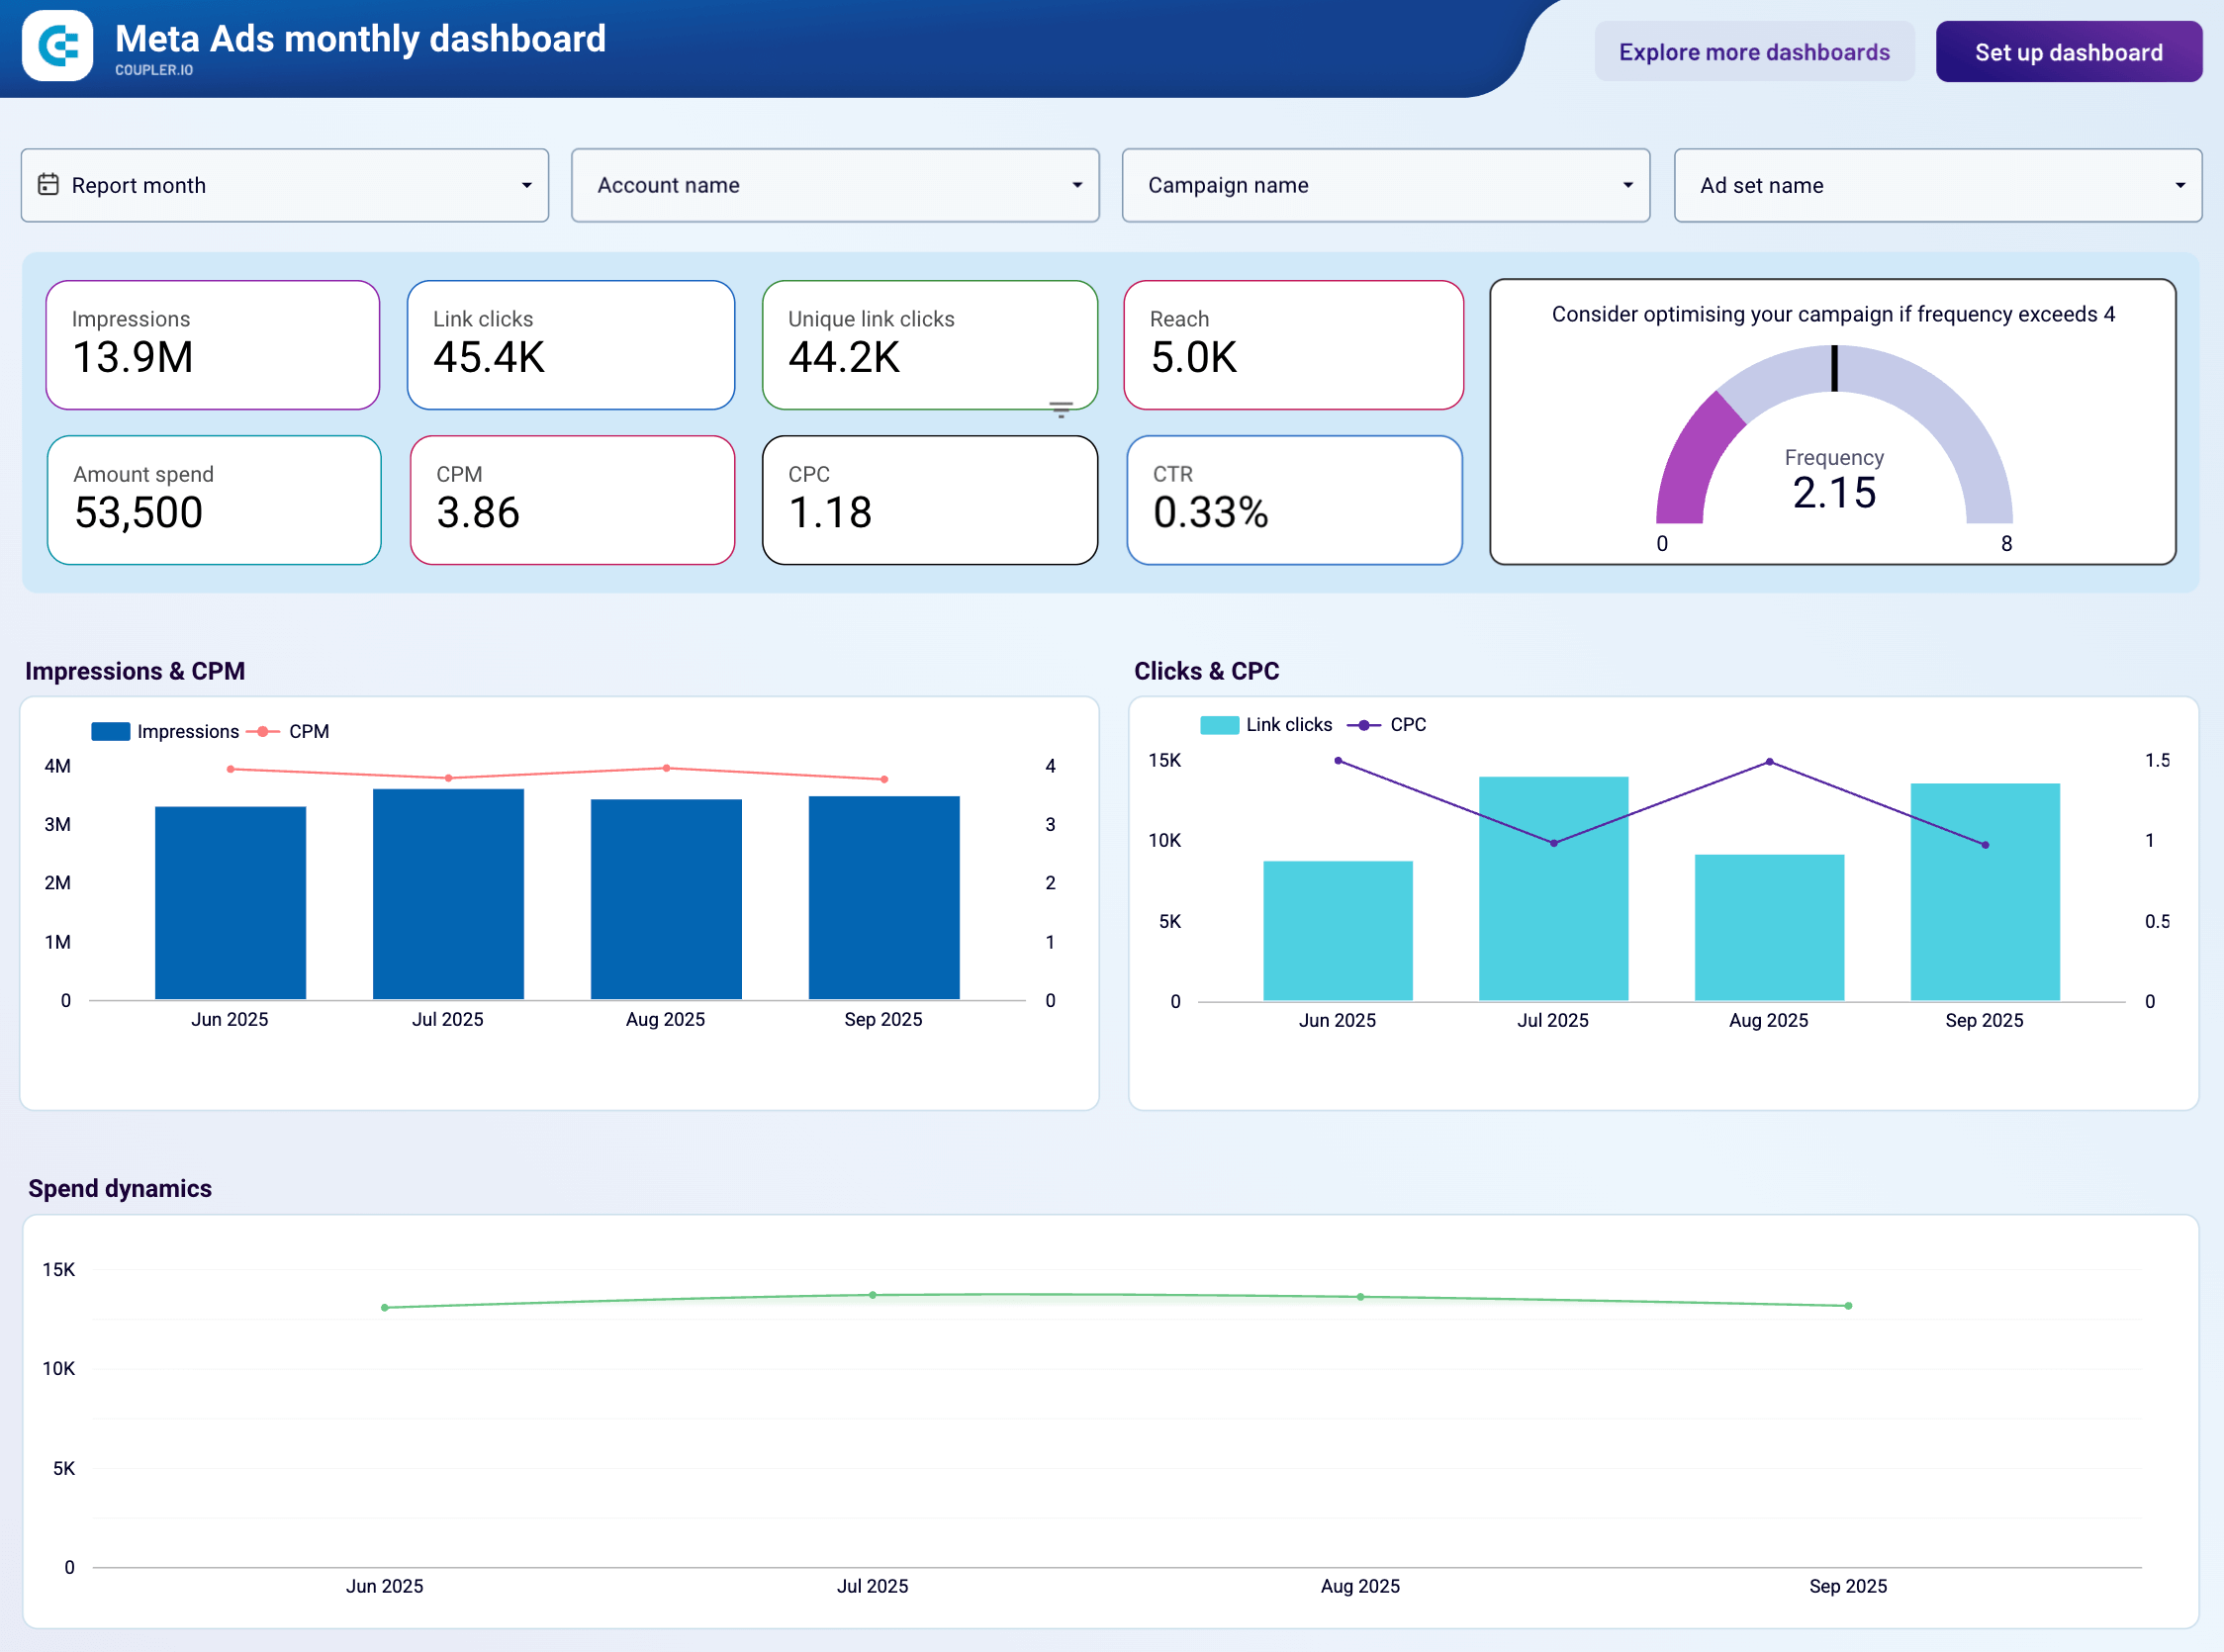
9. Meta Ads monthly report template
Analyze your Facebook and Instagram advertising performance with monthly granularity to understand seasonal trends, evaluate campaign effectiveness over time, and make data-driven decisions about your Meta advertising budget.
Meta Ads monthly performance dashboard
 Preview dashboard
Meta Ads monthly performance dashboard
Preview dashboardThis monthly view of your Meta advertising campaigns helps you identify patterns in audience behavior, track how ad performance evolves across different months, and compare the effectiveness of various campaign strategies over extended periods.
The dashboard aggregates key performance indicators by month, including spend, reach, engagement rates, and conversion metrics. This long-term perspective is essential for understanding the true ROI of your Meta advertising efforts and planning future campaign strategies.
Monitor monthly trends in cost per result, analyze how audience engagement shifts throughout the year, and identify which months deliver the strongest performance for your specific business objectives.
Report metrics
- Amount spent
- Impressions
- Reach
- Frequency
- Engagement rate
- Conversions
- Cost per result
- CTR
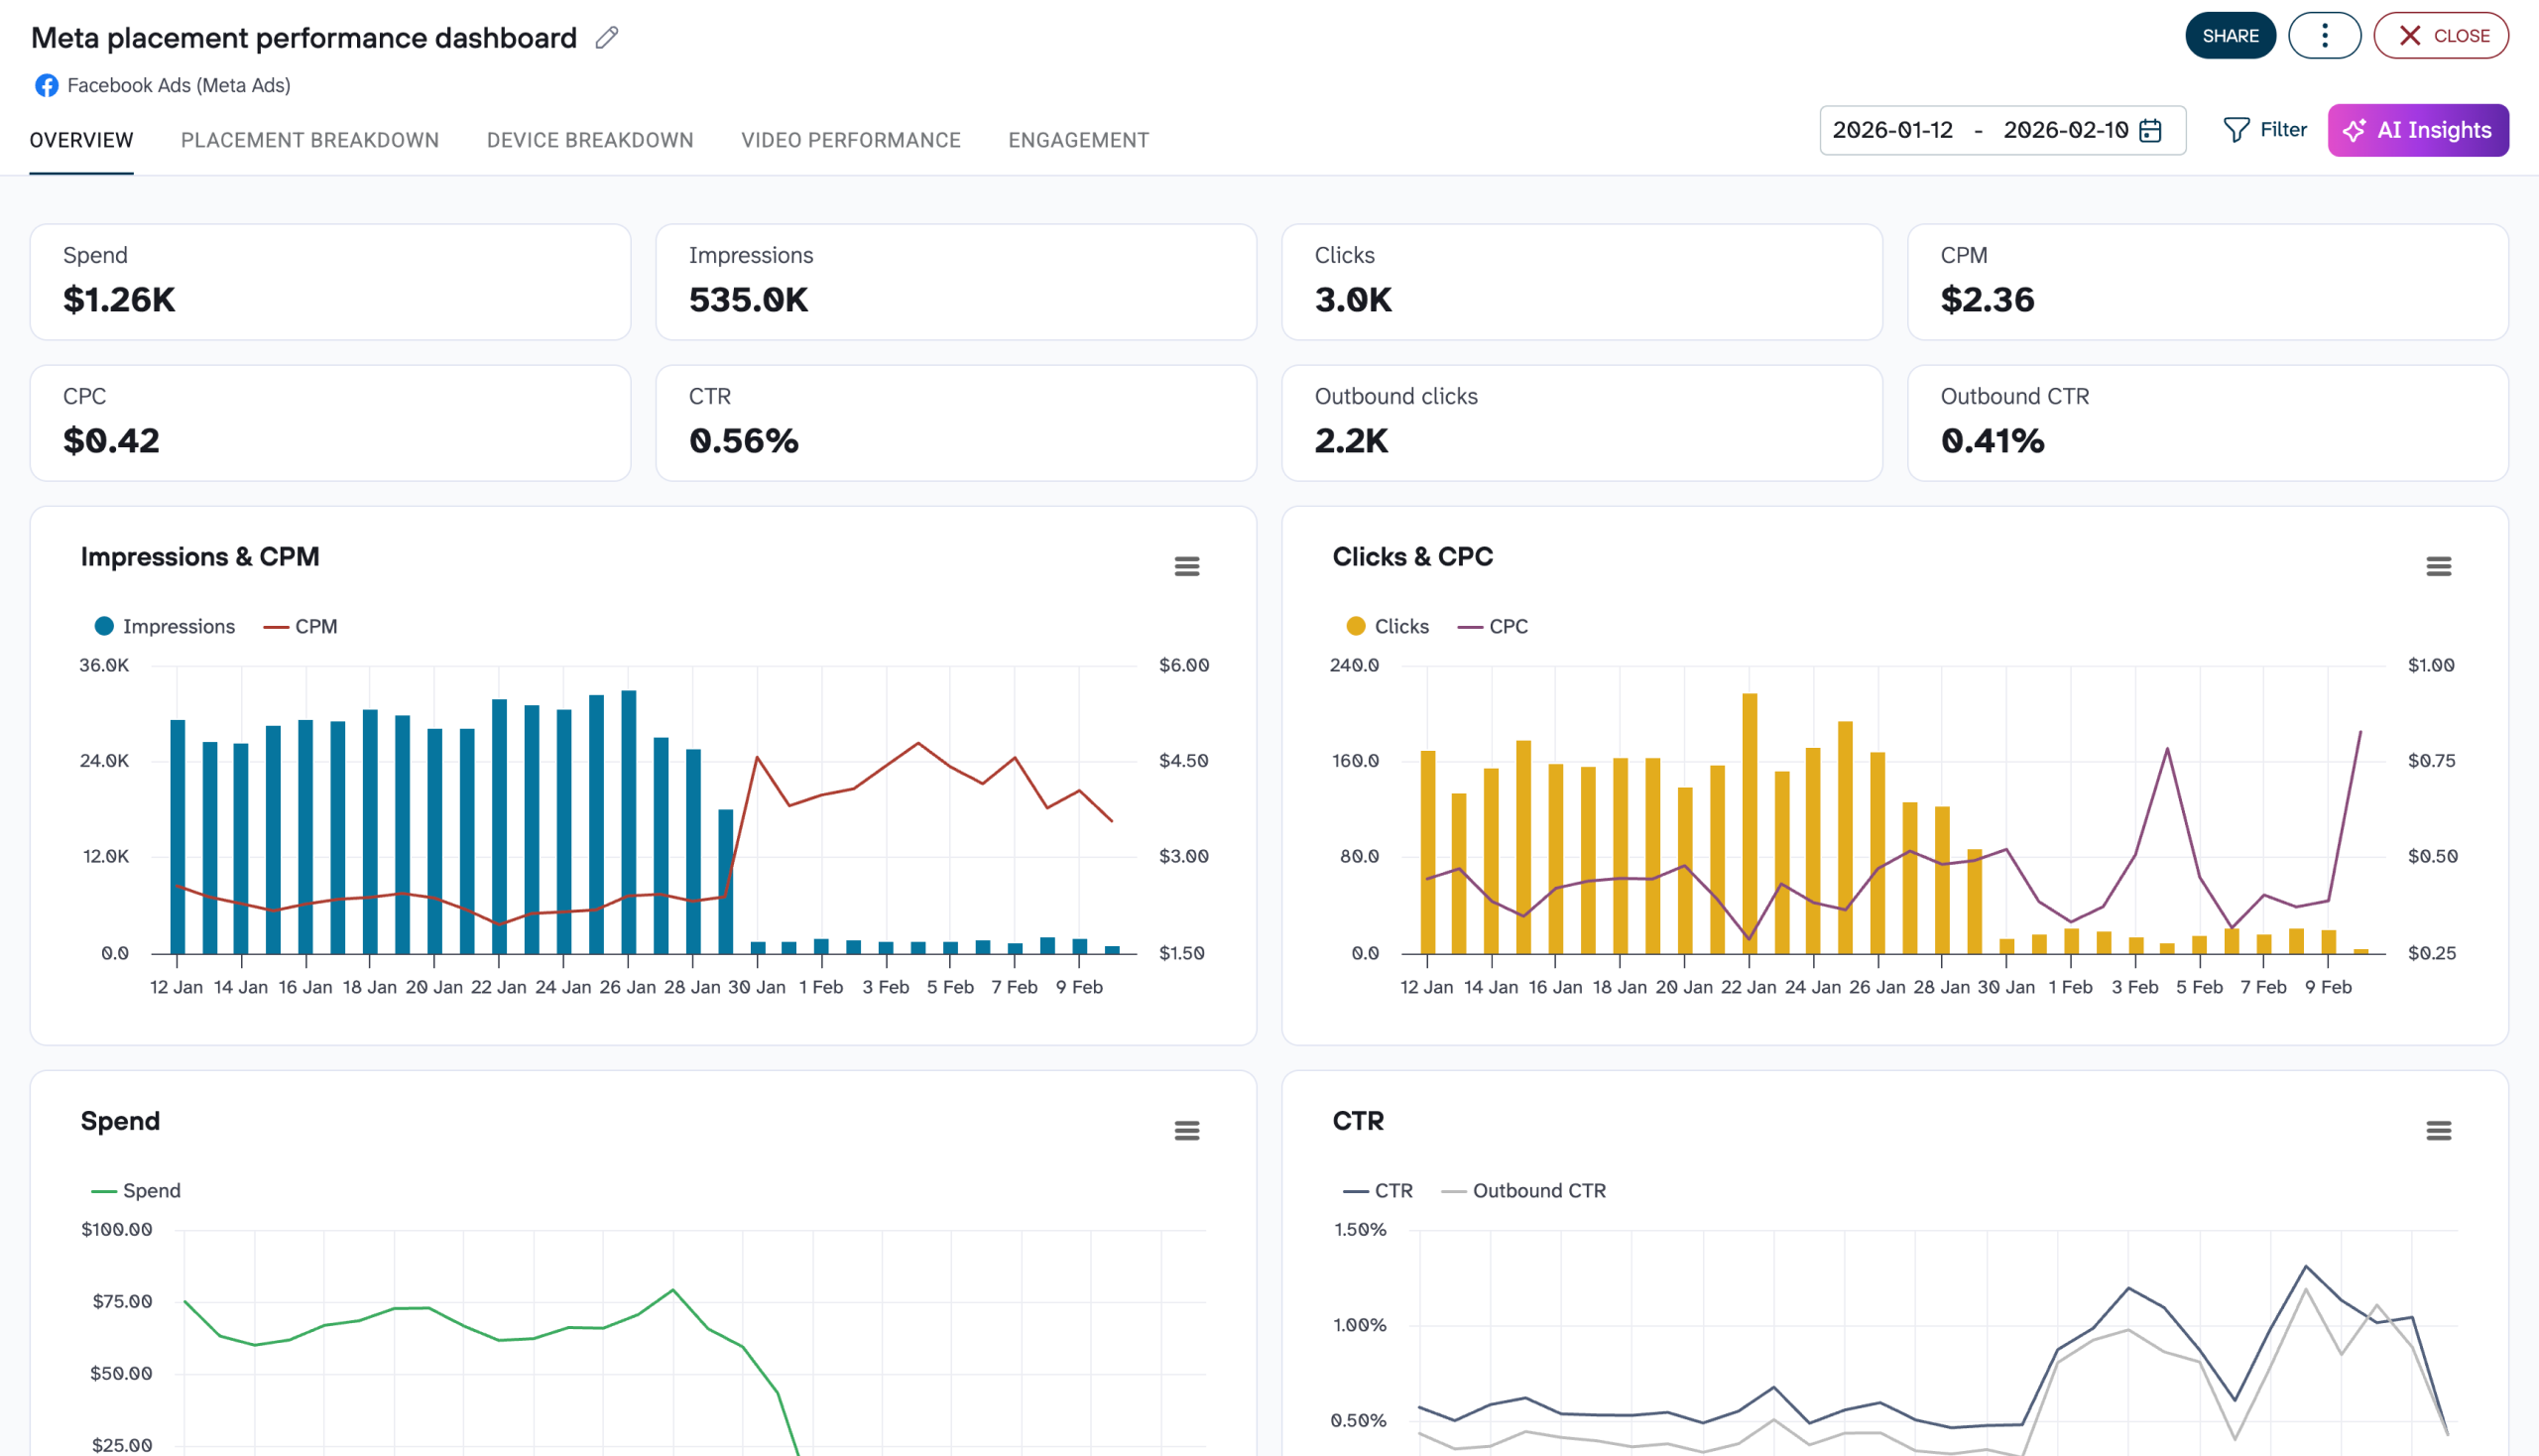
10. Meta Ads placement report template
This dashboard surfaces placement-level and device-level performance data so you can see exactly where your spend is going and whether it’s returning results.
Meta Ads placement dashboard template
 Preview dashboard
Meta Ads placement dashboard template
Preview dashboardWeekly trend views let you catch declining placements before they waste significant budget. For example, if Facebook right-hand column CTR drops three weeks in a row while CPM climbs, that’s a clear signal to pause spending there and redirect it to better-performing formats.
This Coupler.io in-house template keeps data refreshed automatically on a schedule you define.
Report metrics:
- Spend
- Impressions
- Clicks
- CPM
- CPC
- CTR
- Outbound clicks and outbound CTR
- Engagement rate
- Video completion rates (25%, 50%, 75%, 95%, 100%)
- Thruplay and Thruplay rate
Marketing report templates for LinkedIn Ads
LinkedIn Ads excel at B2B marketing and professional audience targeting. These templates help you track campaign performance, monitor lead generation efforts, and optimize your LinkedIn advertising for maximum ROI in the professional space.
11. LinkedIn Ads report template
Want to keep a close eye on the performance of your LinkedIn Ads campaigns? Then try this LinkedIn Ads marketing report template by Coupler.io. It allows you to track your progress with a set of key metrics, look at campaign performance from a funnel reporting perspective, and understand which campaigns generate the most leads.
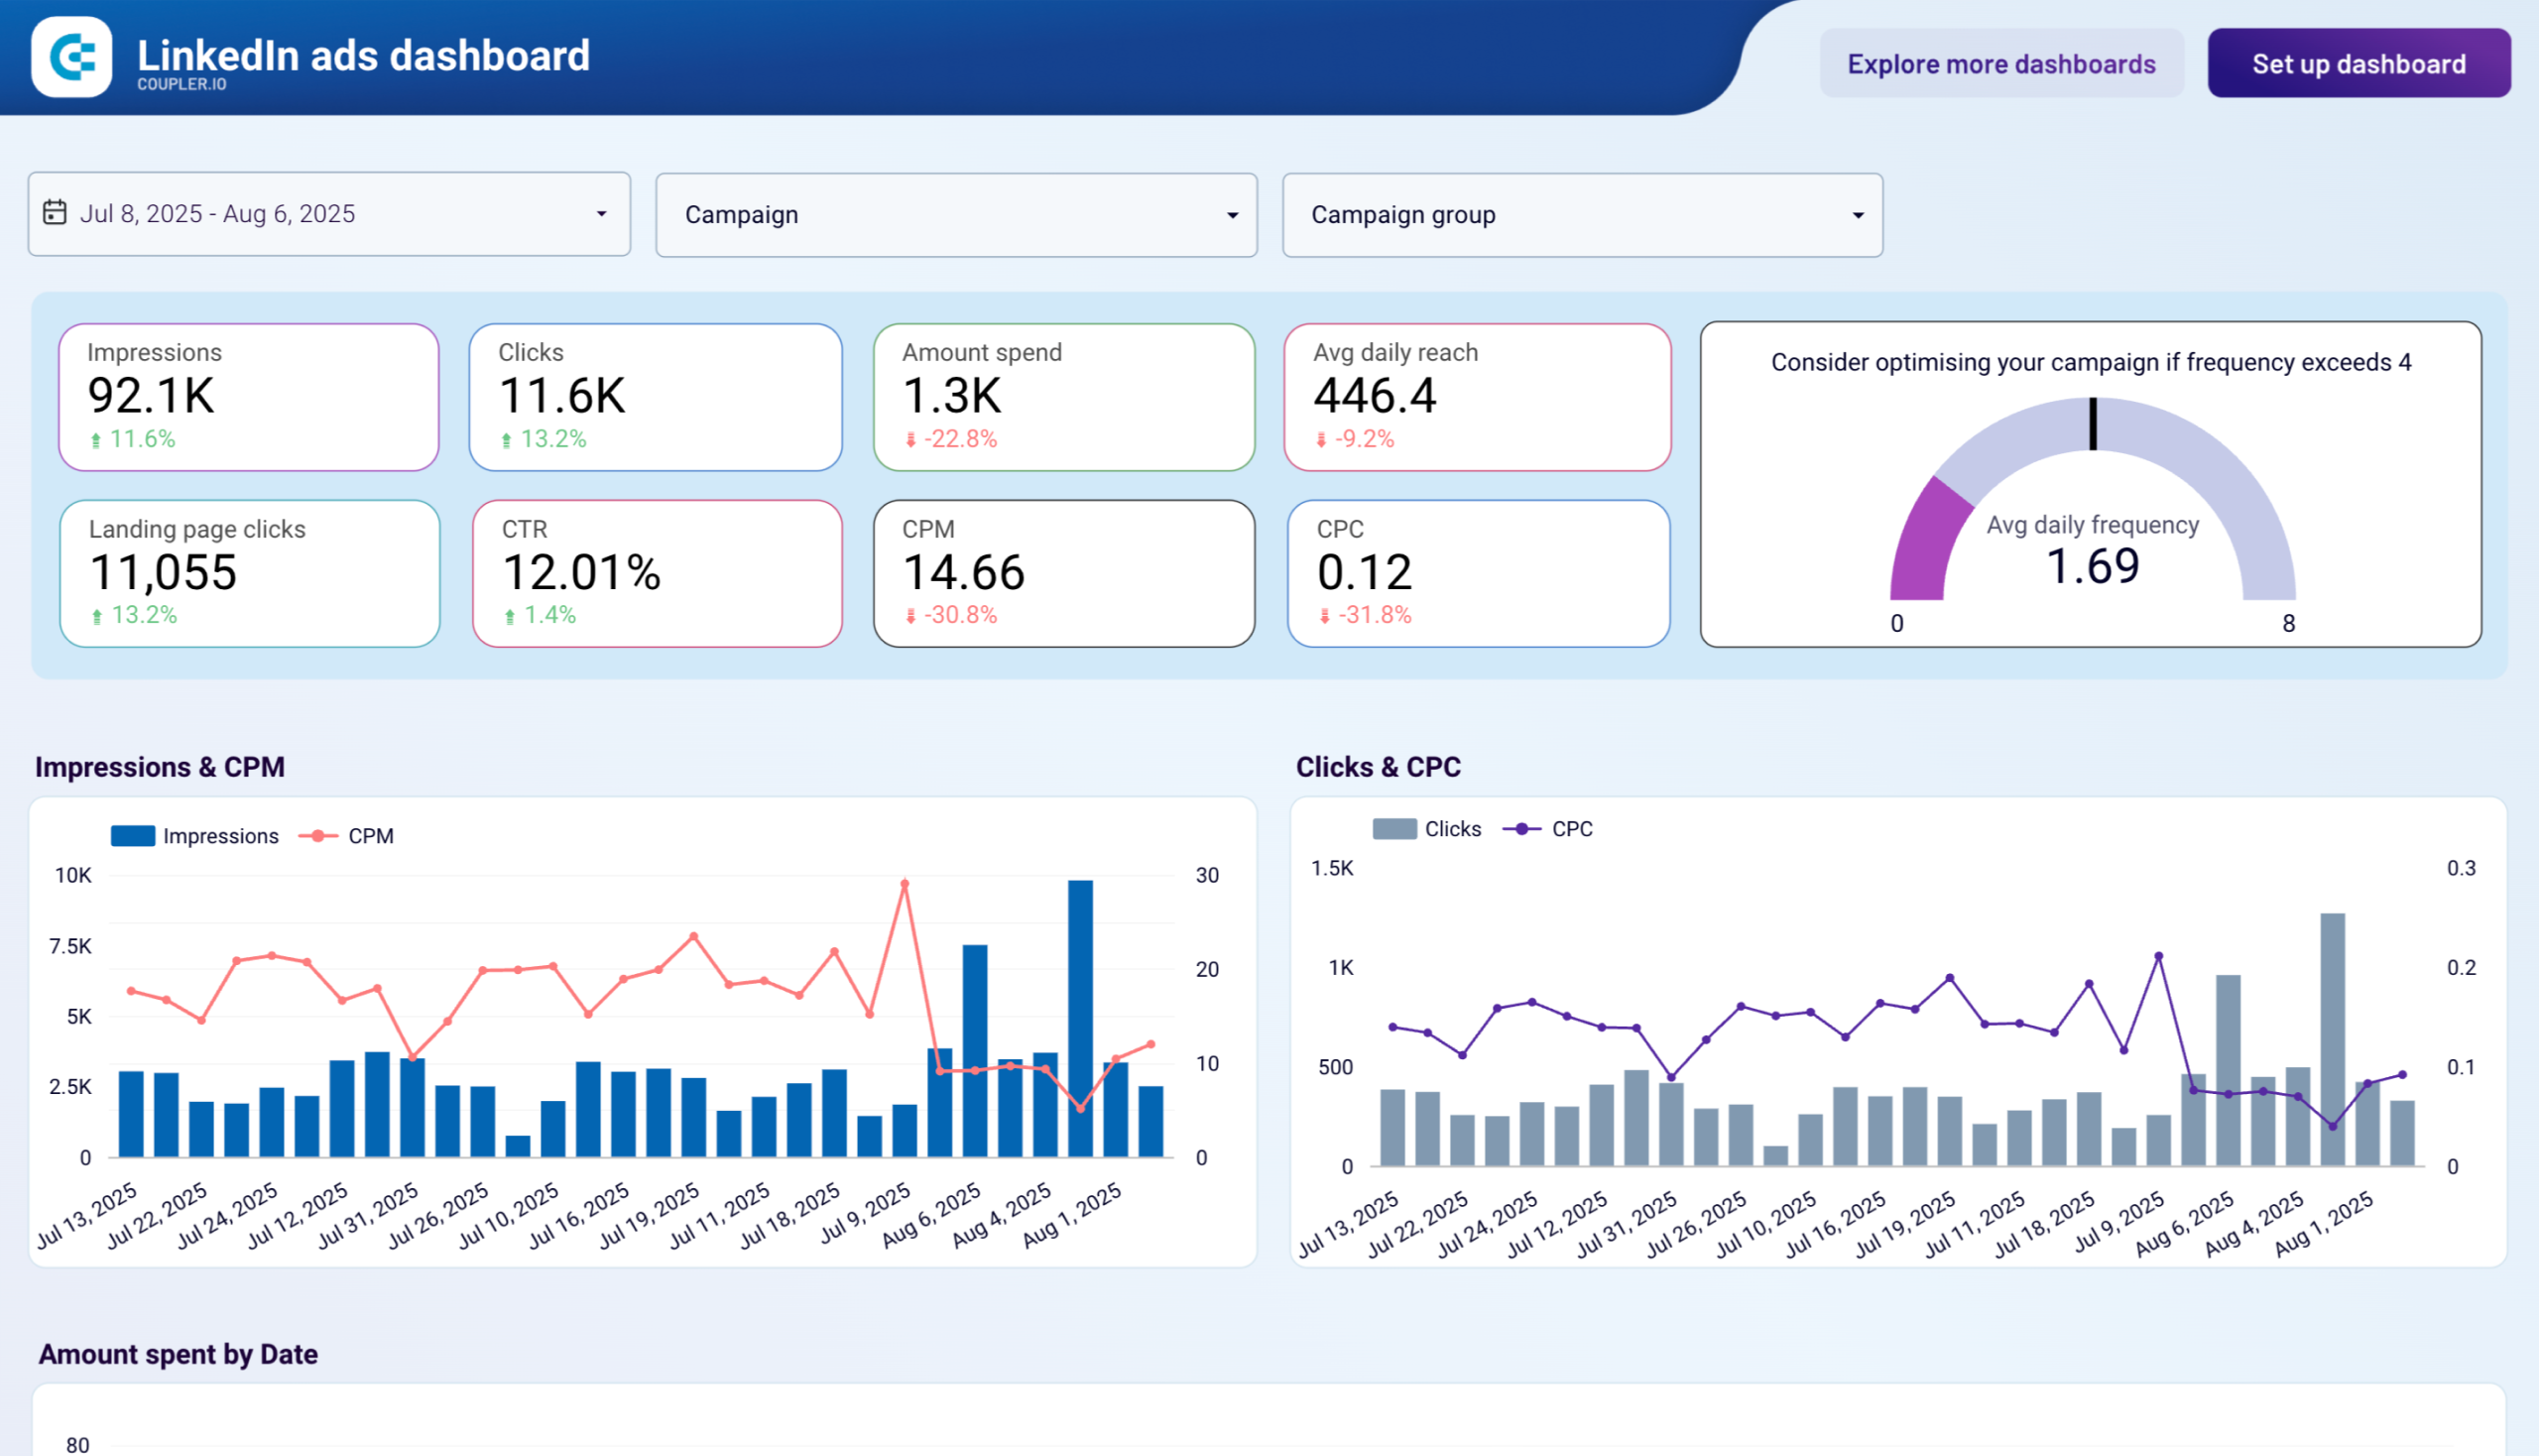
Just like the previous three report templates, it takes around 2 minutes and several clicks to get started. Coupler.io will do all the job on data flow automation, so you’ll get a self-updating dashboard in your possession.
Report metrics:
- Impressions
- CPM
- Amount spend
- Clicks
- CPC
- CTR
- Conversions
- Conversion rate
- Lead form opens
- Leads
- And others
12. LinkedIn Ads leads report template
This LinkedIn Ads report tracks your lead gen campaign performance, showing you exactly which campaigns deliver qualified prospects and which ones waste your budget. It consolidates lead performance data, cost metrics, and campaign effectiveness indicators to help you optimize your B2B advertising strategy.
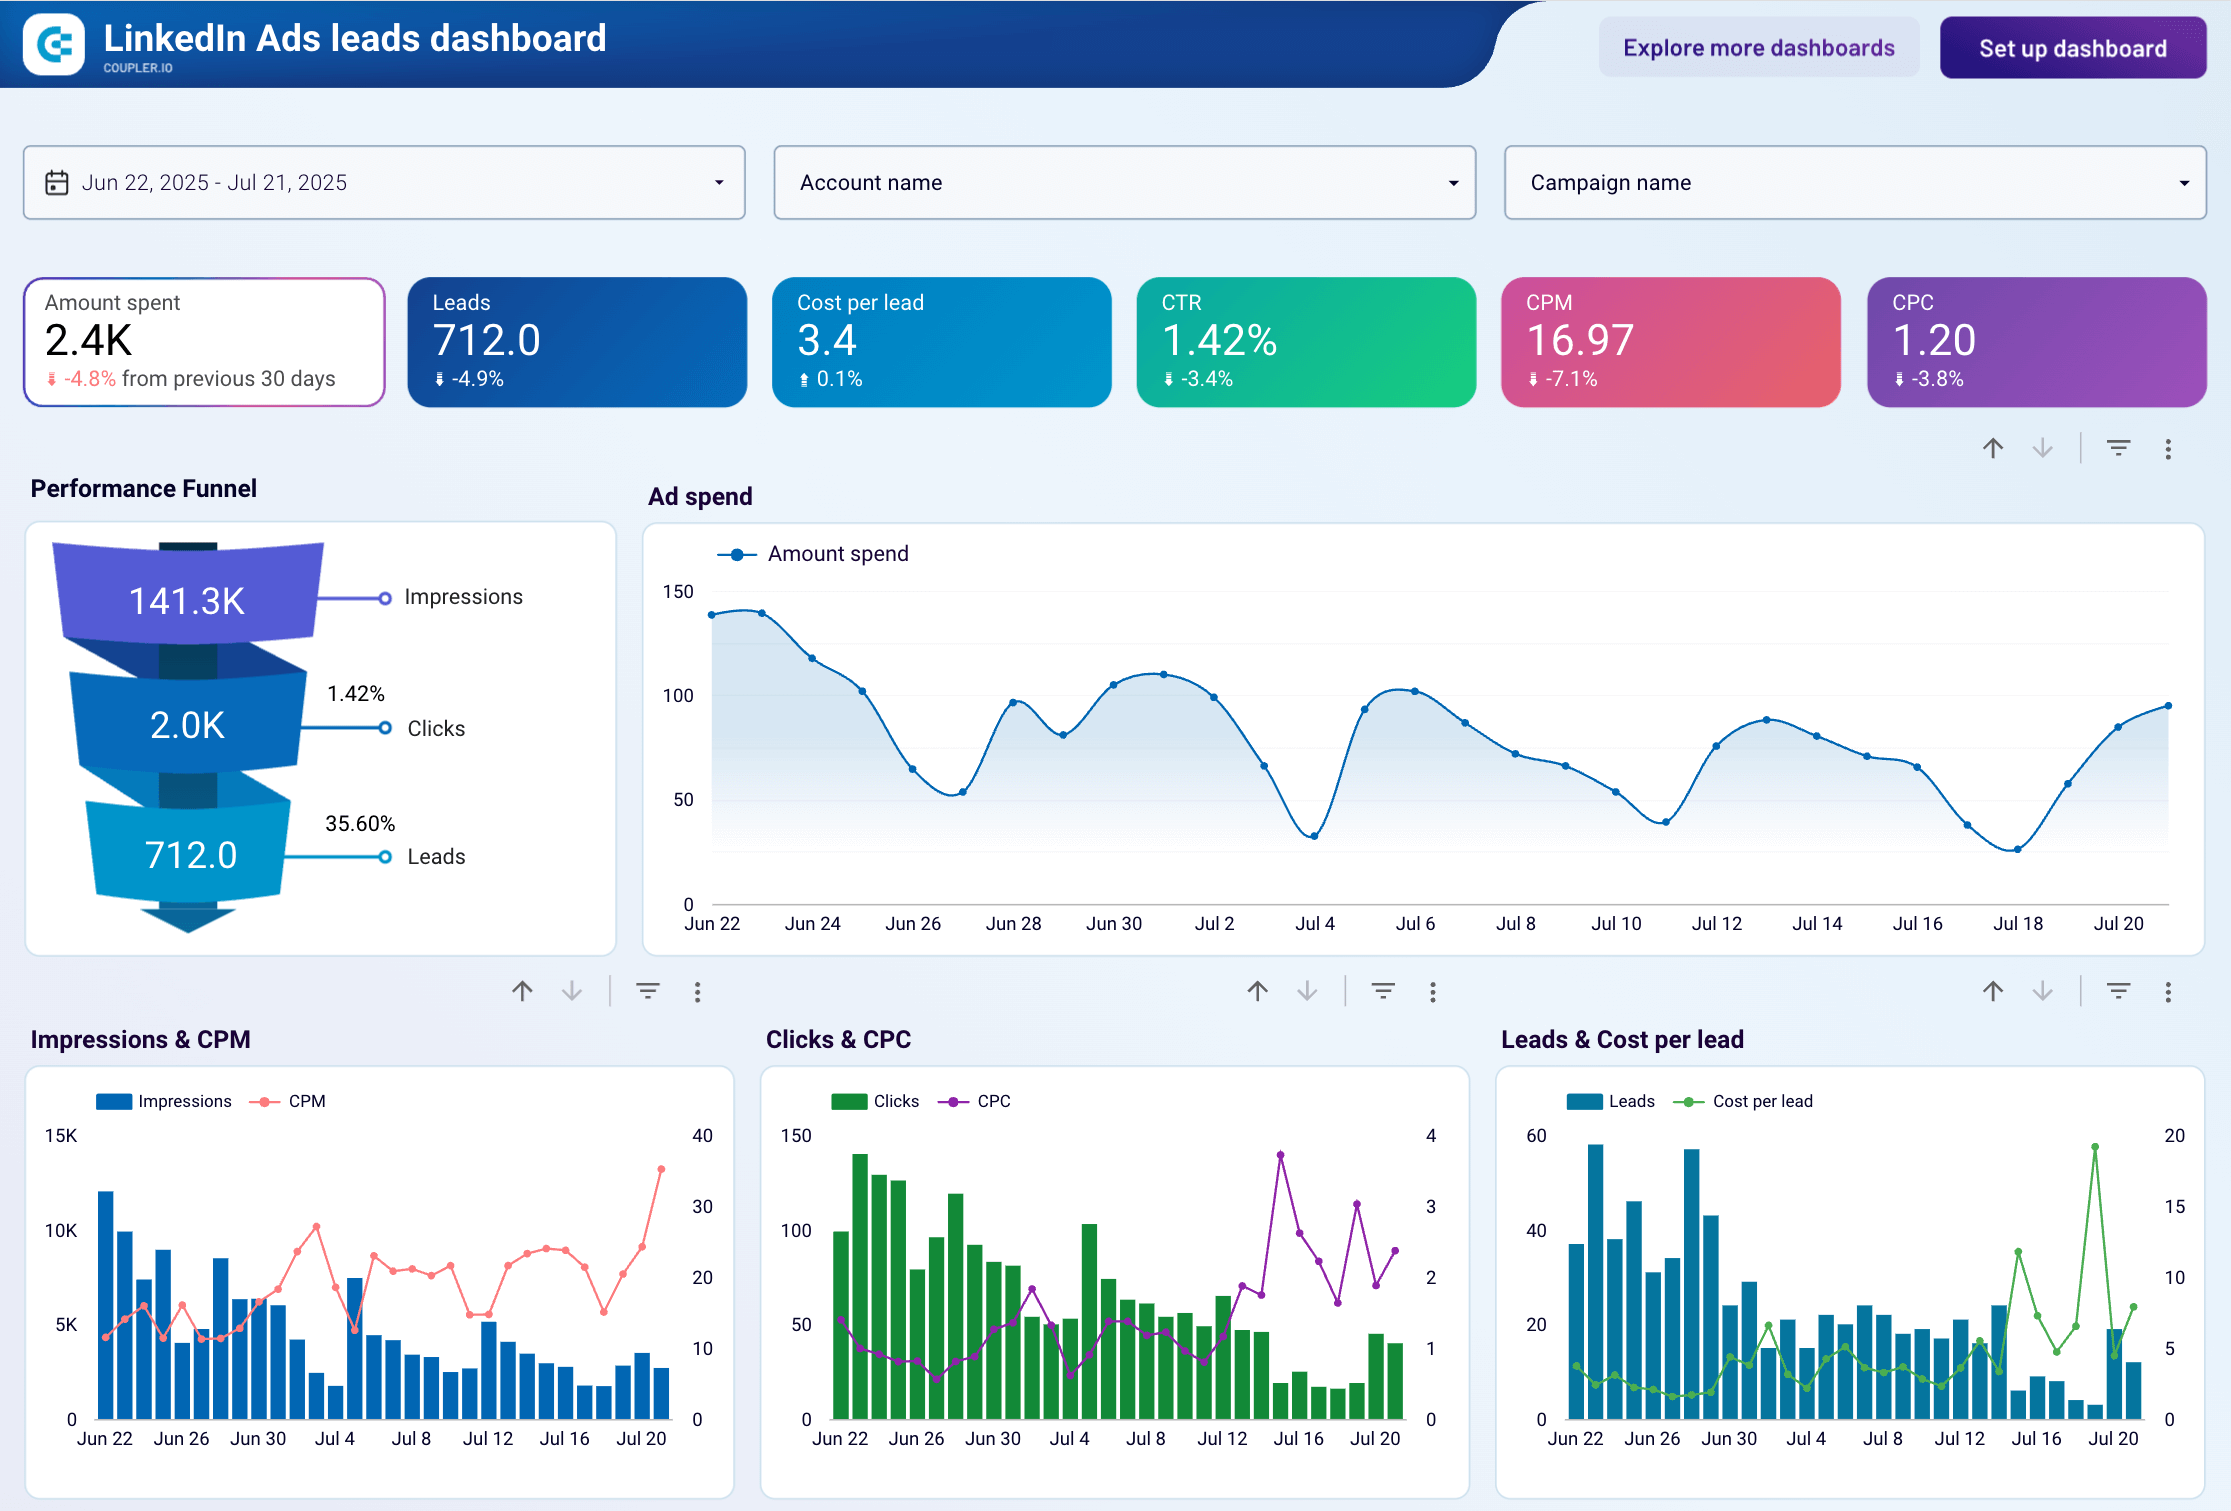
With this report, you can identify where prospects drop off in your funnel (impressions to leads) and take steps to mitigate leaks. There are also charts for monitoring spending patterns to improve budget allocation and optimize conversion efficiency. An interactive table lets you compare campaigns side-by-side to spot high-performers and repeat the formula.
To get a copy of this report template in Looker Studio, sign up for a free Coupler.io account. It takes less than 5 minutes to sync your LinkedIn data and get started.
Report metrics:
- Amount spent
- Impressions
- Clicks
- CTR
- Leads
- Cost per lead
- CPM
- Clicks to leads
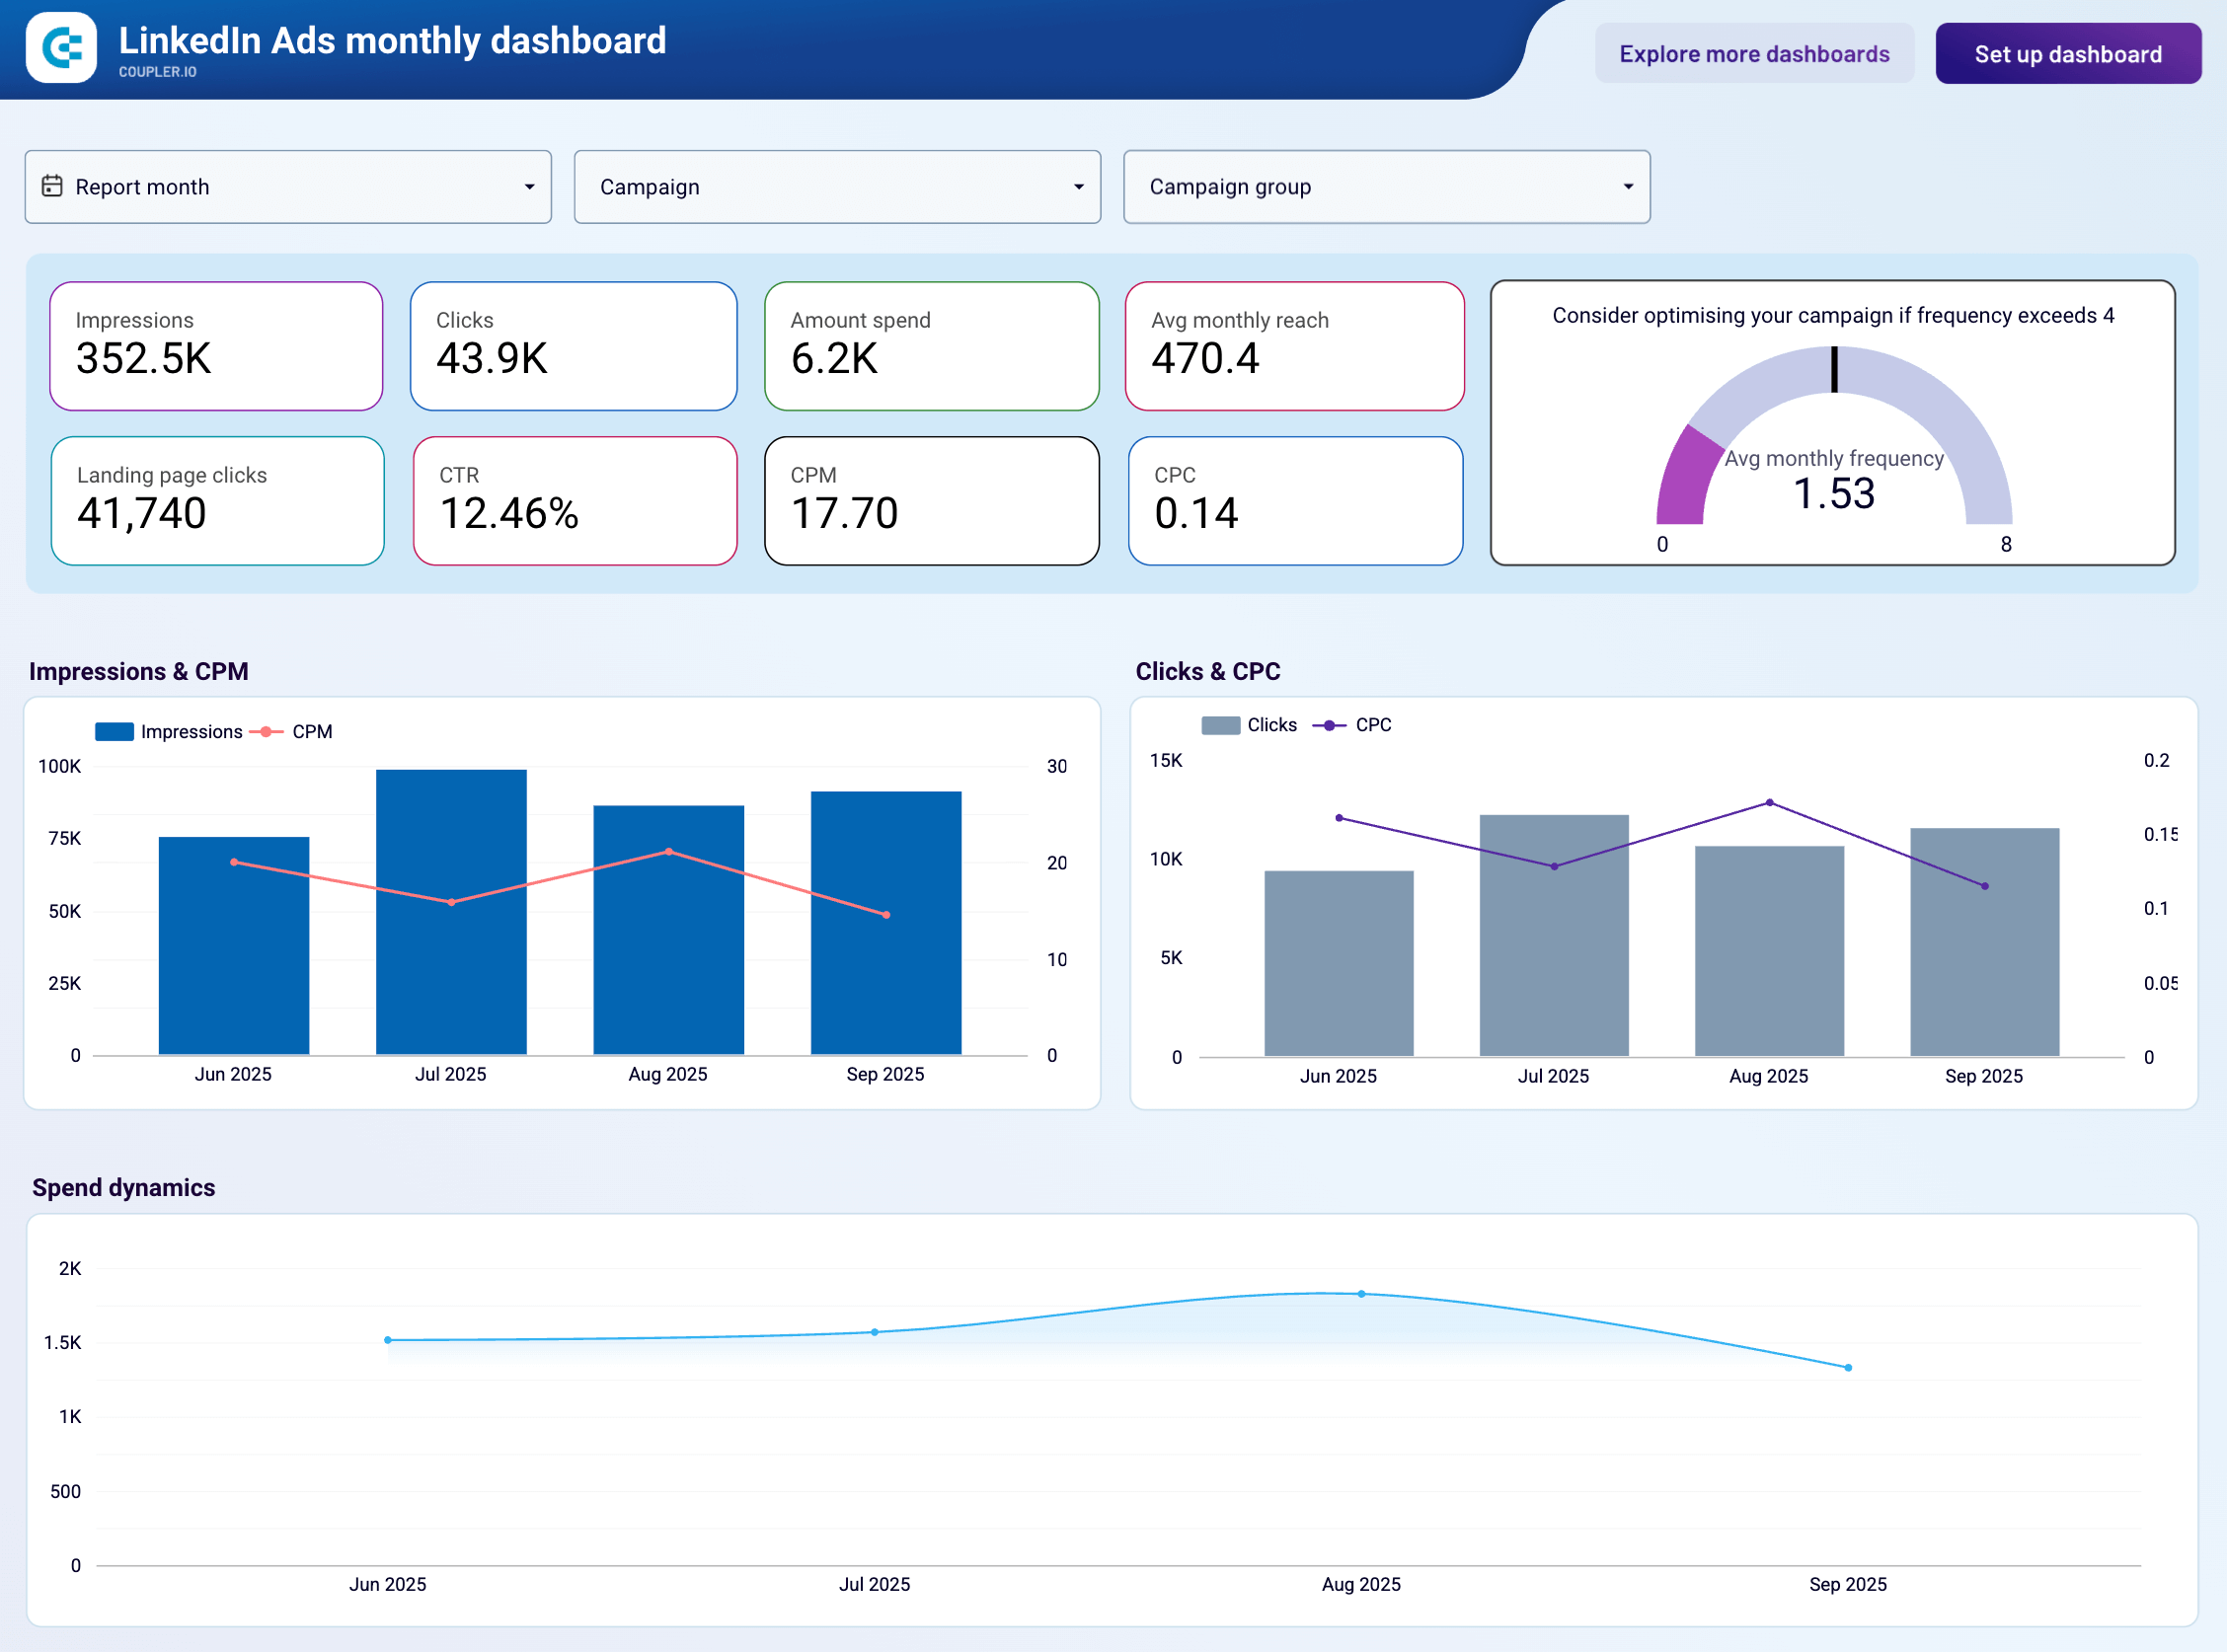
13. LinkedIn Ads monthly performance report template
Evaluate your LinkedIn advertising campaigns with a monthly perspective to identify trends in B2B audience engagement, assess the long-term effectiveness of your professional targeting strategies, and optimize budget allocation across quarters.
LinkedIn Ads monthly performance dashboard
 Preview dashboard
LinkedIn Ads monthly performance dashboard
Preview dashboardThis monthly dashboard aggregates your LinkedIn Ads performance data by month, providing the strategic overview needed for quarterly planning and annual budget forecasting. Track how your B2B campaigns perform across different business cycles and seasonal patterns.
Monitor monthly trends in professional audience engagement, analyze how different industries and job functions respond to your campaigns over time, and identify the most cost-effective months for reaching your target professional demographics.
The report is available as a Looker Studio template and is particularly valuable for B2B marketers who need to demonstrate ROI to stakeholders and justify advertising investments with clear month-over-month performance data.
Report metrics
- Amount spent
- Impressions
- Clicks
- CTR
- CPC
- CPM
- Leads
- Conversions
- Cost per lead
Marketing report templates for other advertising platforms
Beyond Google, Meta, and LinkedIn, there are advertising platforms that serve specific audiences and use cases well. These templates help you track performance on channels that often lack dedicated reporting solutions.
14. Bing Ads conversion tracking report template
The Bing Ads conversion tracking dashboard connects to your Microsoft Advertising account and shows how your spend translates into conversions across every campaign. It’s built for paid search managers who need to evaluate Bing Ads performance with the same rigor they apply to Google Ads.
Bing Ads conversion tracking dashboard
Bing Ads conversion tracking dashboard
Preview dashboardThe report pairs daily impressions and click trends with cost metrics on the same timeline. As a result, uou can tell whether a rising CPC is caused by auction competition or a targeting problem. The campaign performance table ranks every campaign by cost per conversion with color coding, so you can build a reallocation case in minutes. A goal-level breakdown lets you filter conversions by type, which matters when your account tracks both purchases and softer events like video views.
The template is built in Looker Studio with a Coupler.io connector to automate data load from your Microsoft Advertising account.
Report metrics:
- Impressions
- Clicks
- Spend
- CTR
- CPM
- CPC
- Conversions
- Cost per conversion
15. Reddit Ads report template
The Reddit Ads dashboard consolidates spend, reach, engagement, and conversion data from your Reddit Ads account into one report. It helps you evaluate ROAS across different campaign objectives and decide where your Reddit budget produces the best return.
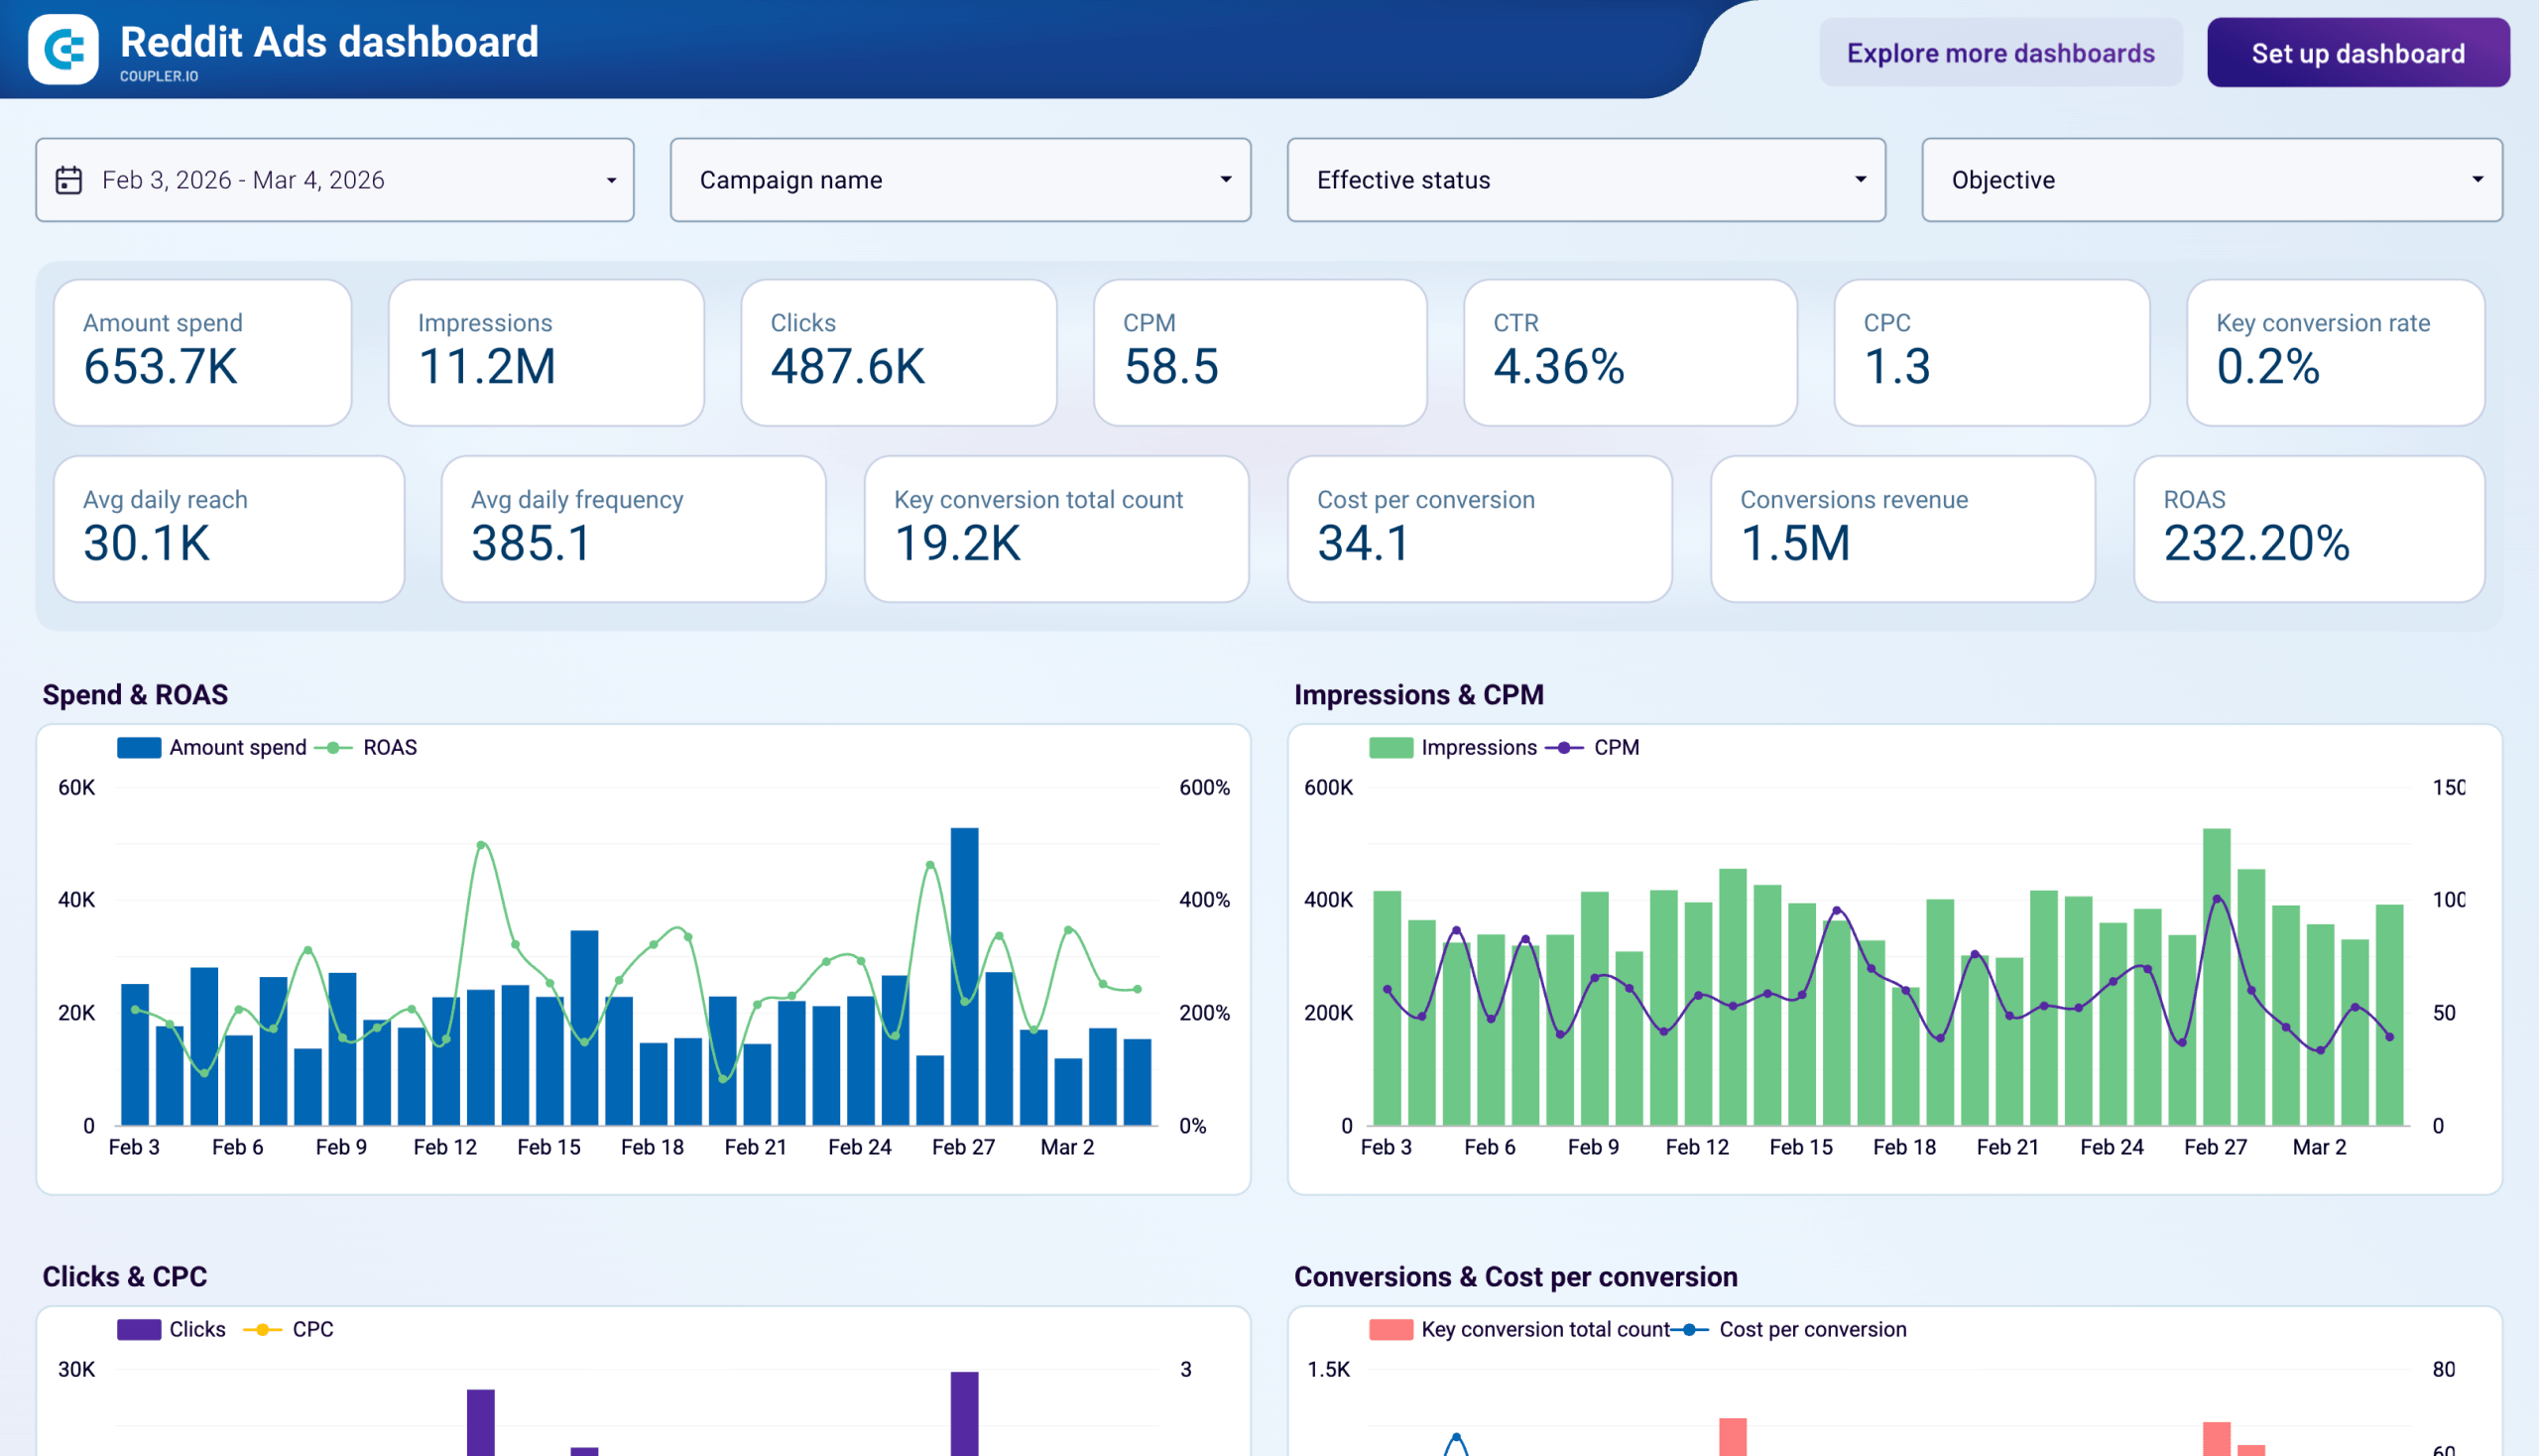
You can compare performance across campaign types to understand which objectives deserve more budget. The report also tracks reach and frequency, which helps you catch audience saturation early. If you need to justify Reddit as a channel to stakeholders, this dashboard gives you the ROAS and cost-per-conversion data to back it up.
Connect your Reddit Ads account through the built-in Coupler.io connector to populate this Looker Studio report with your data in minutes.
Report metrics:
- Amount spent
- Impressions
- Clicks
- CPM
- CPC
- CTR
- Conversions
- Cost per conversion
- ROAS
- Avg daily reach
- Avg daily frequency
Social media & content report templates
Beyond paid advertising, organic social media presence is crucial for brand building and audience engagement. These templates help you monitor social media performance, content effectiveness, and audience growth across multiple platforms.
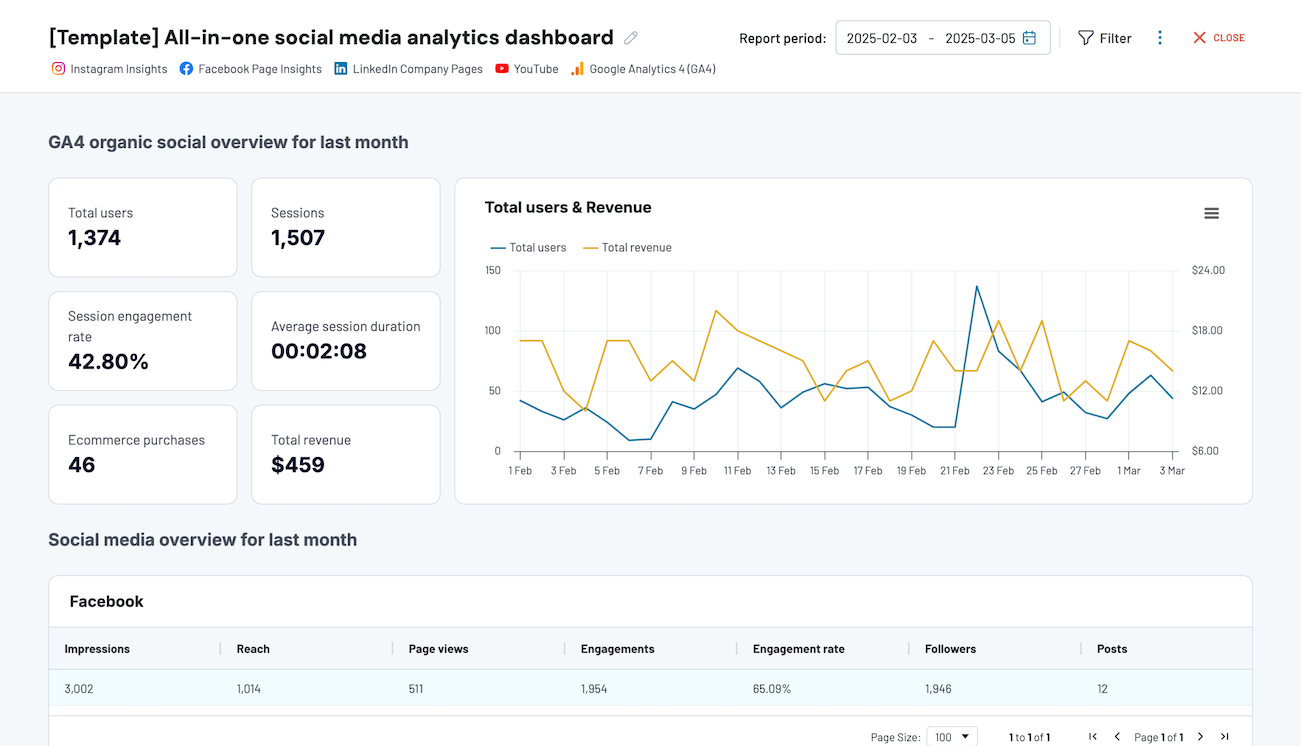
Use this dashboard to overview the performance of major social media platforms: Facebook, Instagram, LinkedIn, and YouTube.
All-in-one social media analytics dashboard
 Preview dashboard
All-in-one social media analytics dashboard
Preview dashboardWith integrated data from GA4, you can analyze how social channels contribute to your website traffic and total results. Additionally, the dashboard provides insights into last month’s dynamics for each platform.
You can use the dashboard right in the Coupler.io interface or as a Looker Studio and Power BI template. Follow the instructions to connect your social media accounts and start analyzing your data.


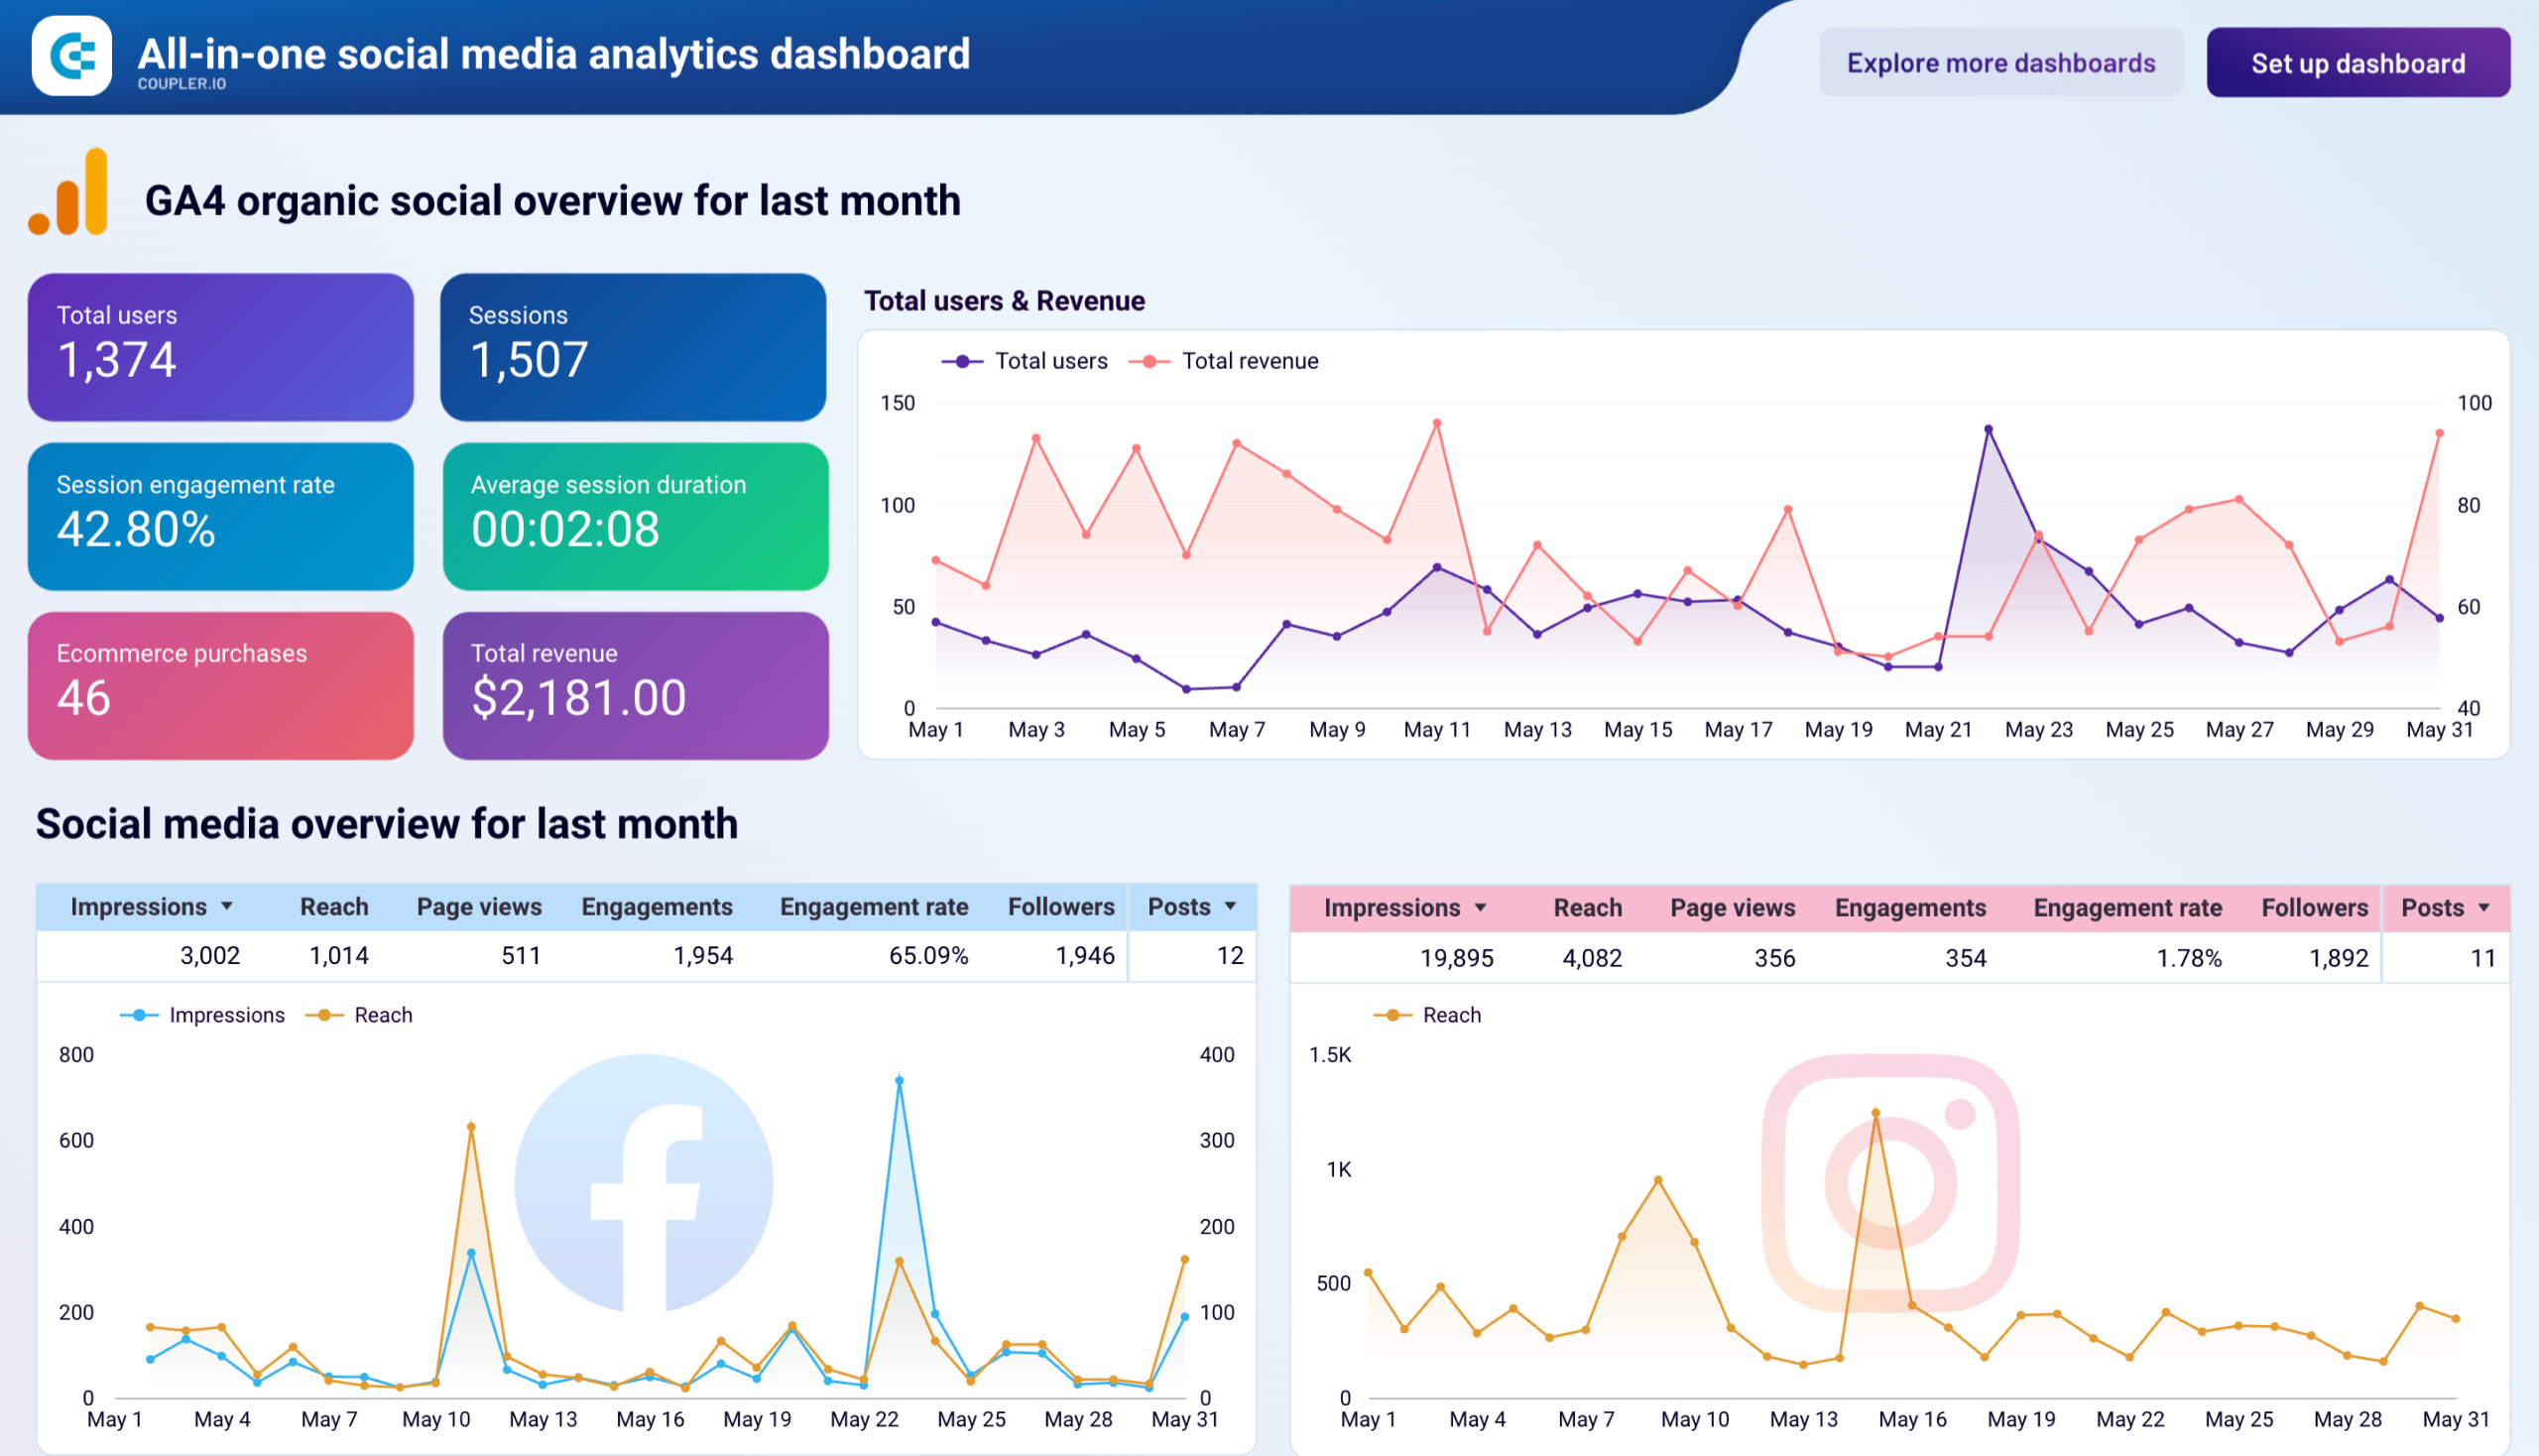
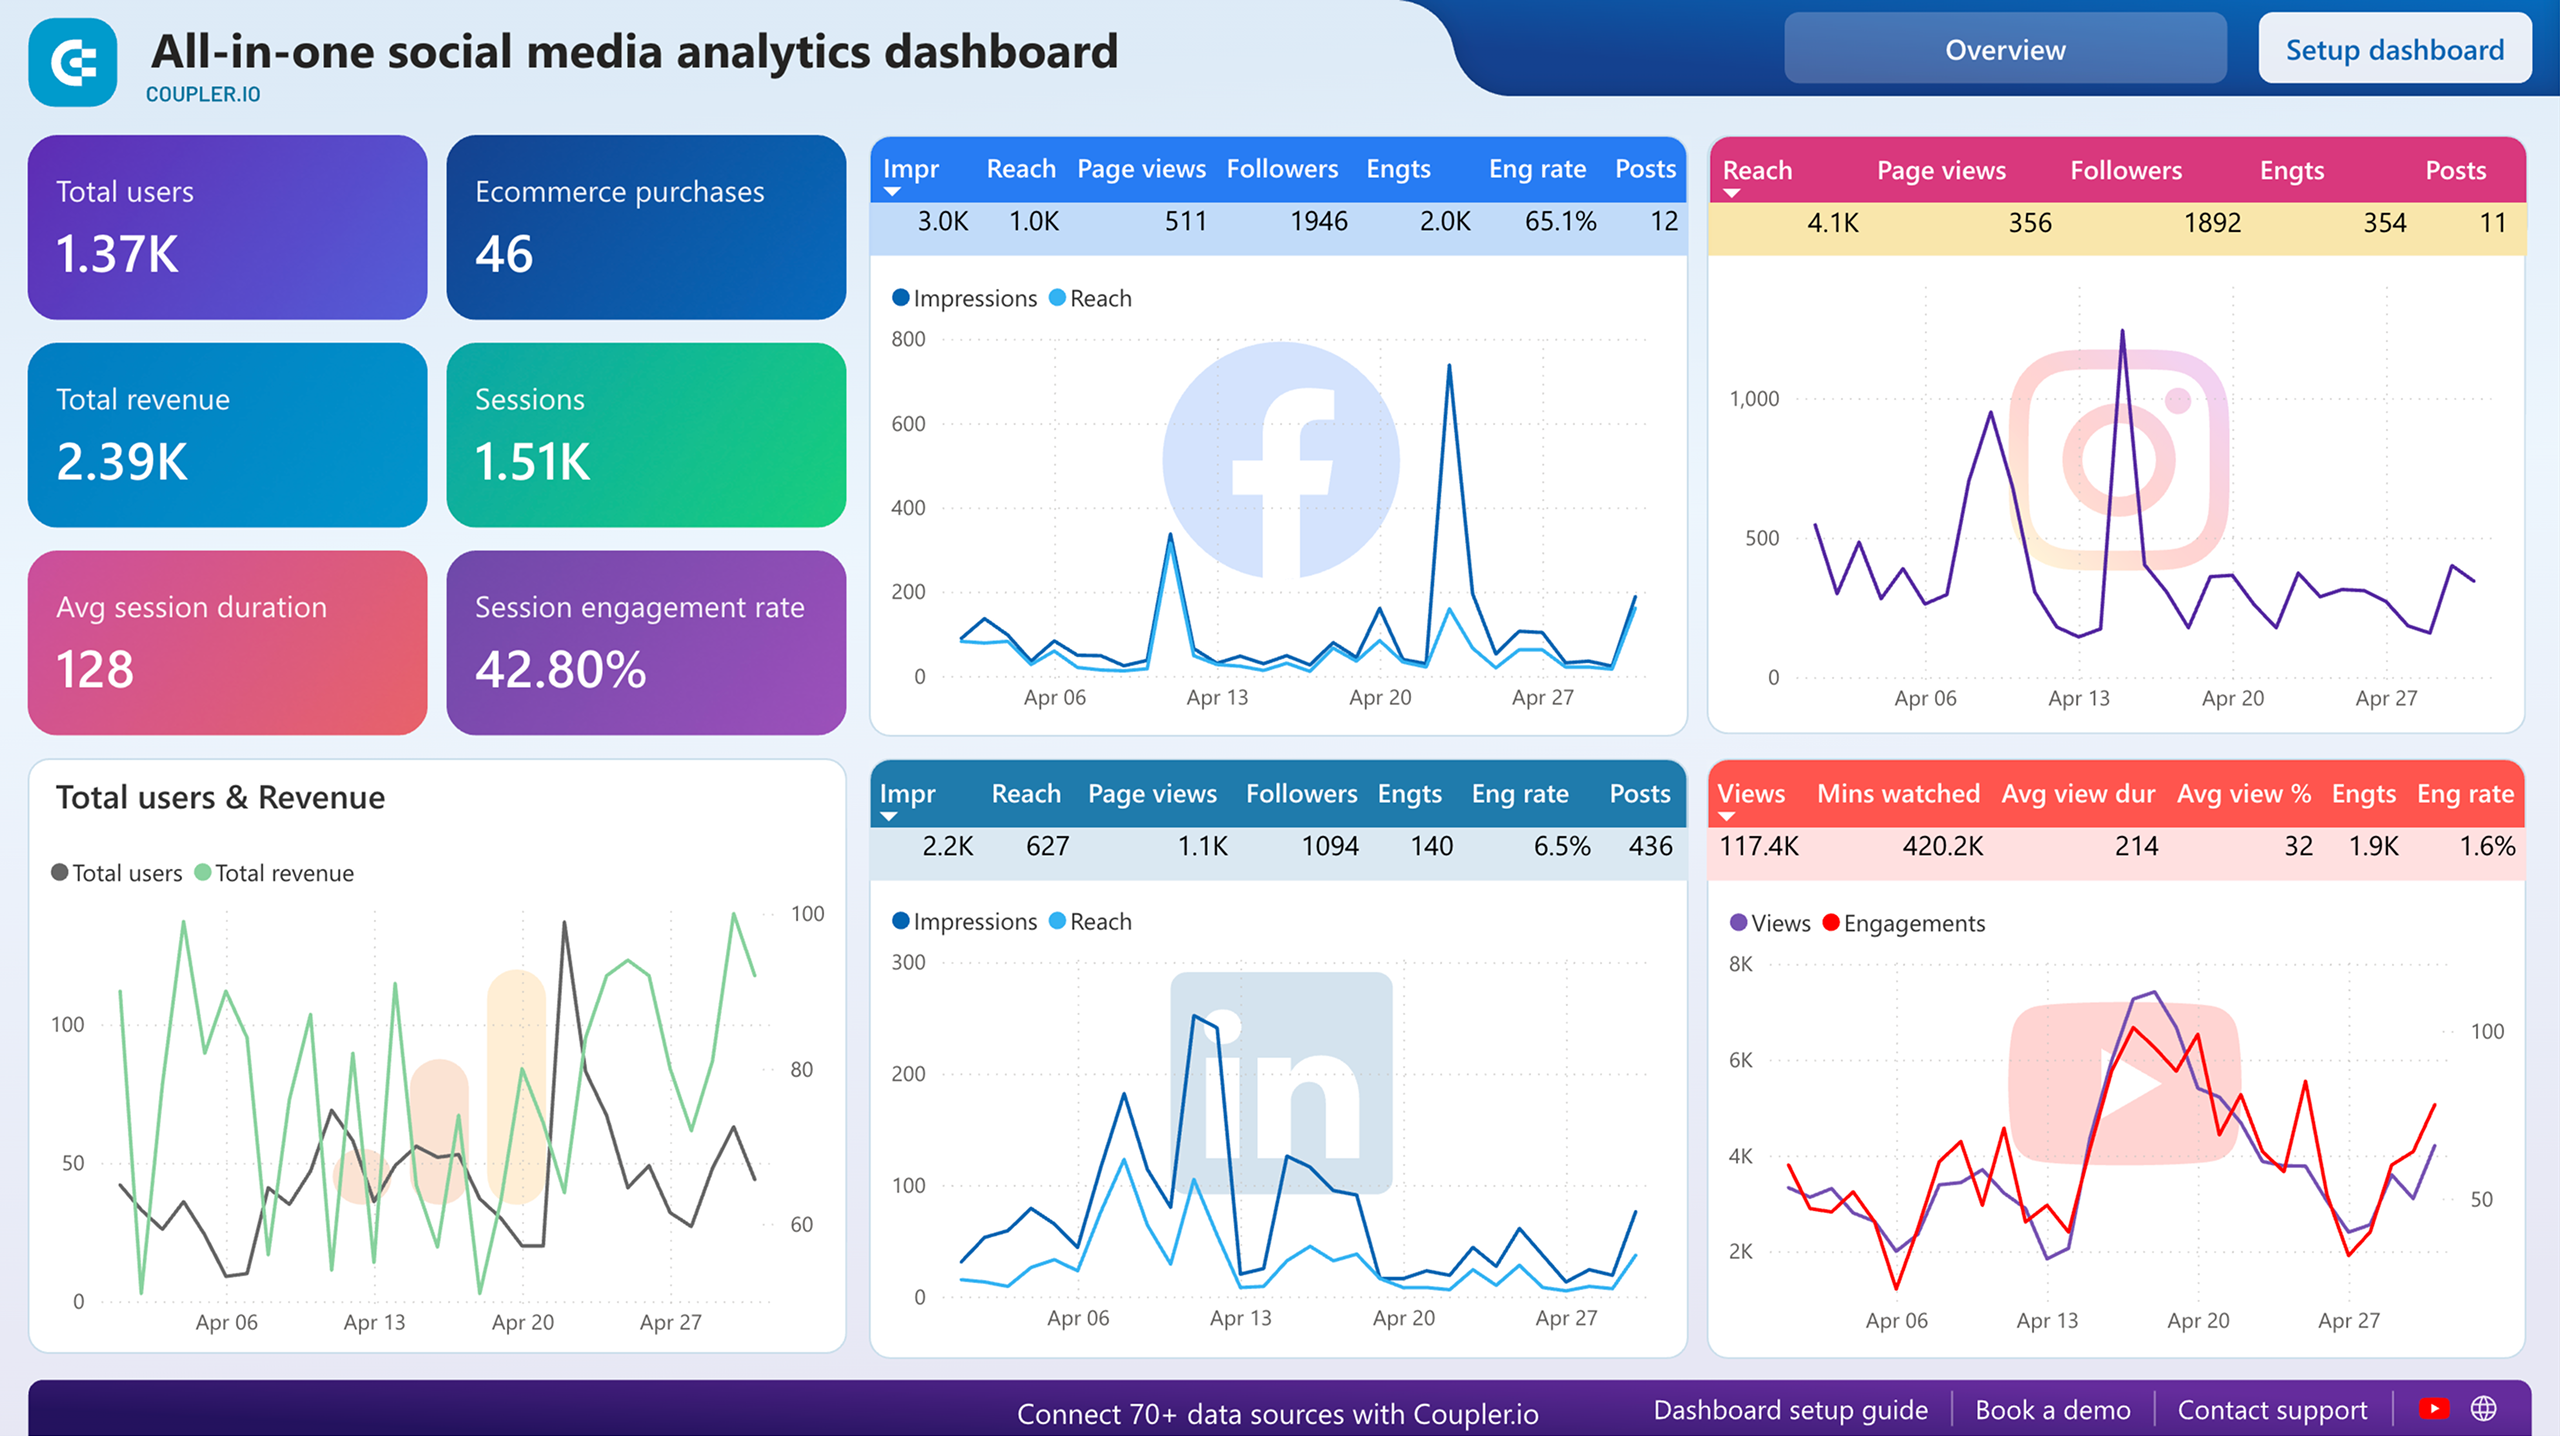
Dashboard metrics:
- Total users
- Impressions, reach
- Page views, video views
- Engagement rate
- Followers
- Posts
- Total revenue, etc.
If your marketing reports show Google Ads totals without splitting by ad network, you may be overlooking budget that converts at two or three times your target CPA on placements like Search Partners or Content. The Google Ads network performance dashboard by Coupler.io addresses this by breaking down performance across every network, device, and geography in your account.
17. Instagram business report template
Track your Instagram business account performance across multiple metrics including follower growth, content engagement, audience demographics, and post-level analytics to optimize your Instagram marketing strategy.
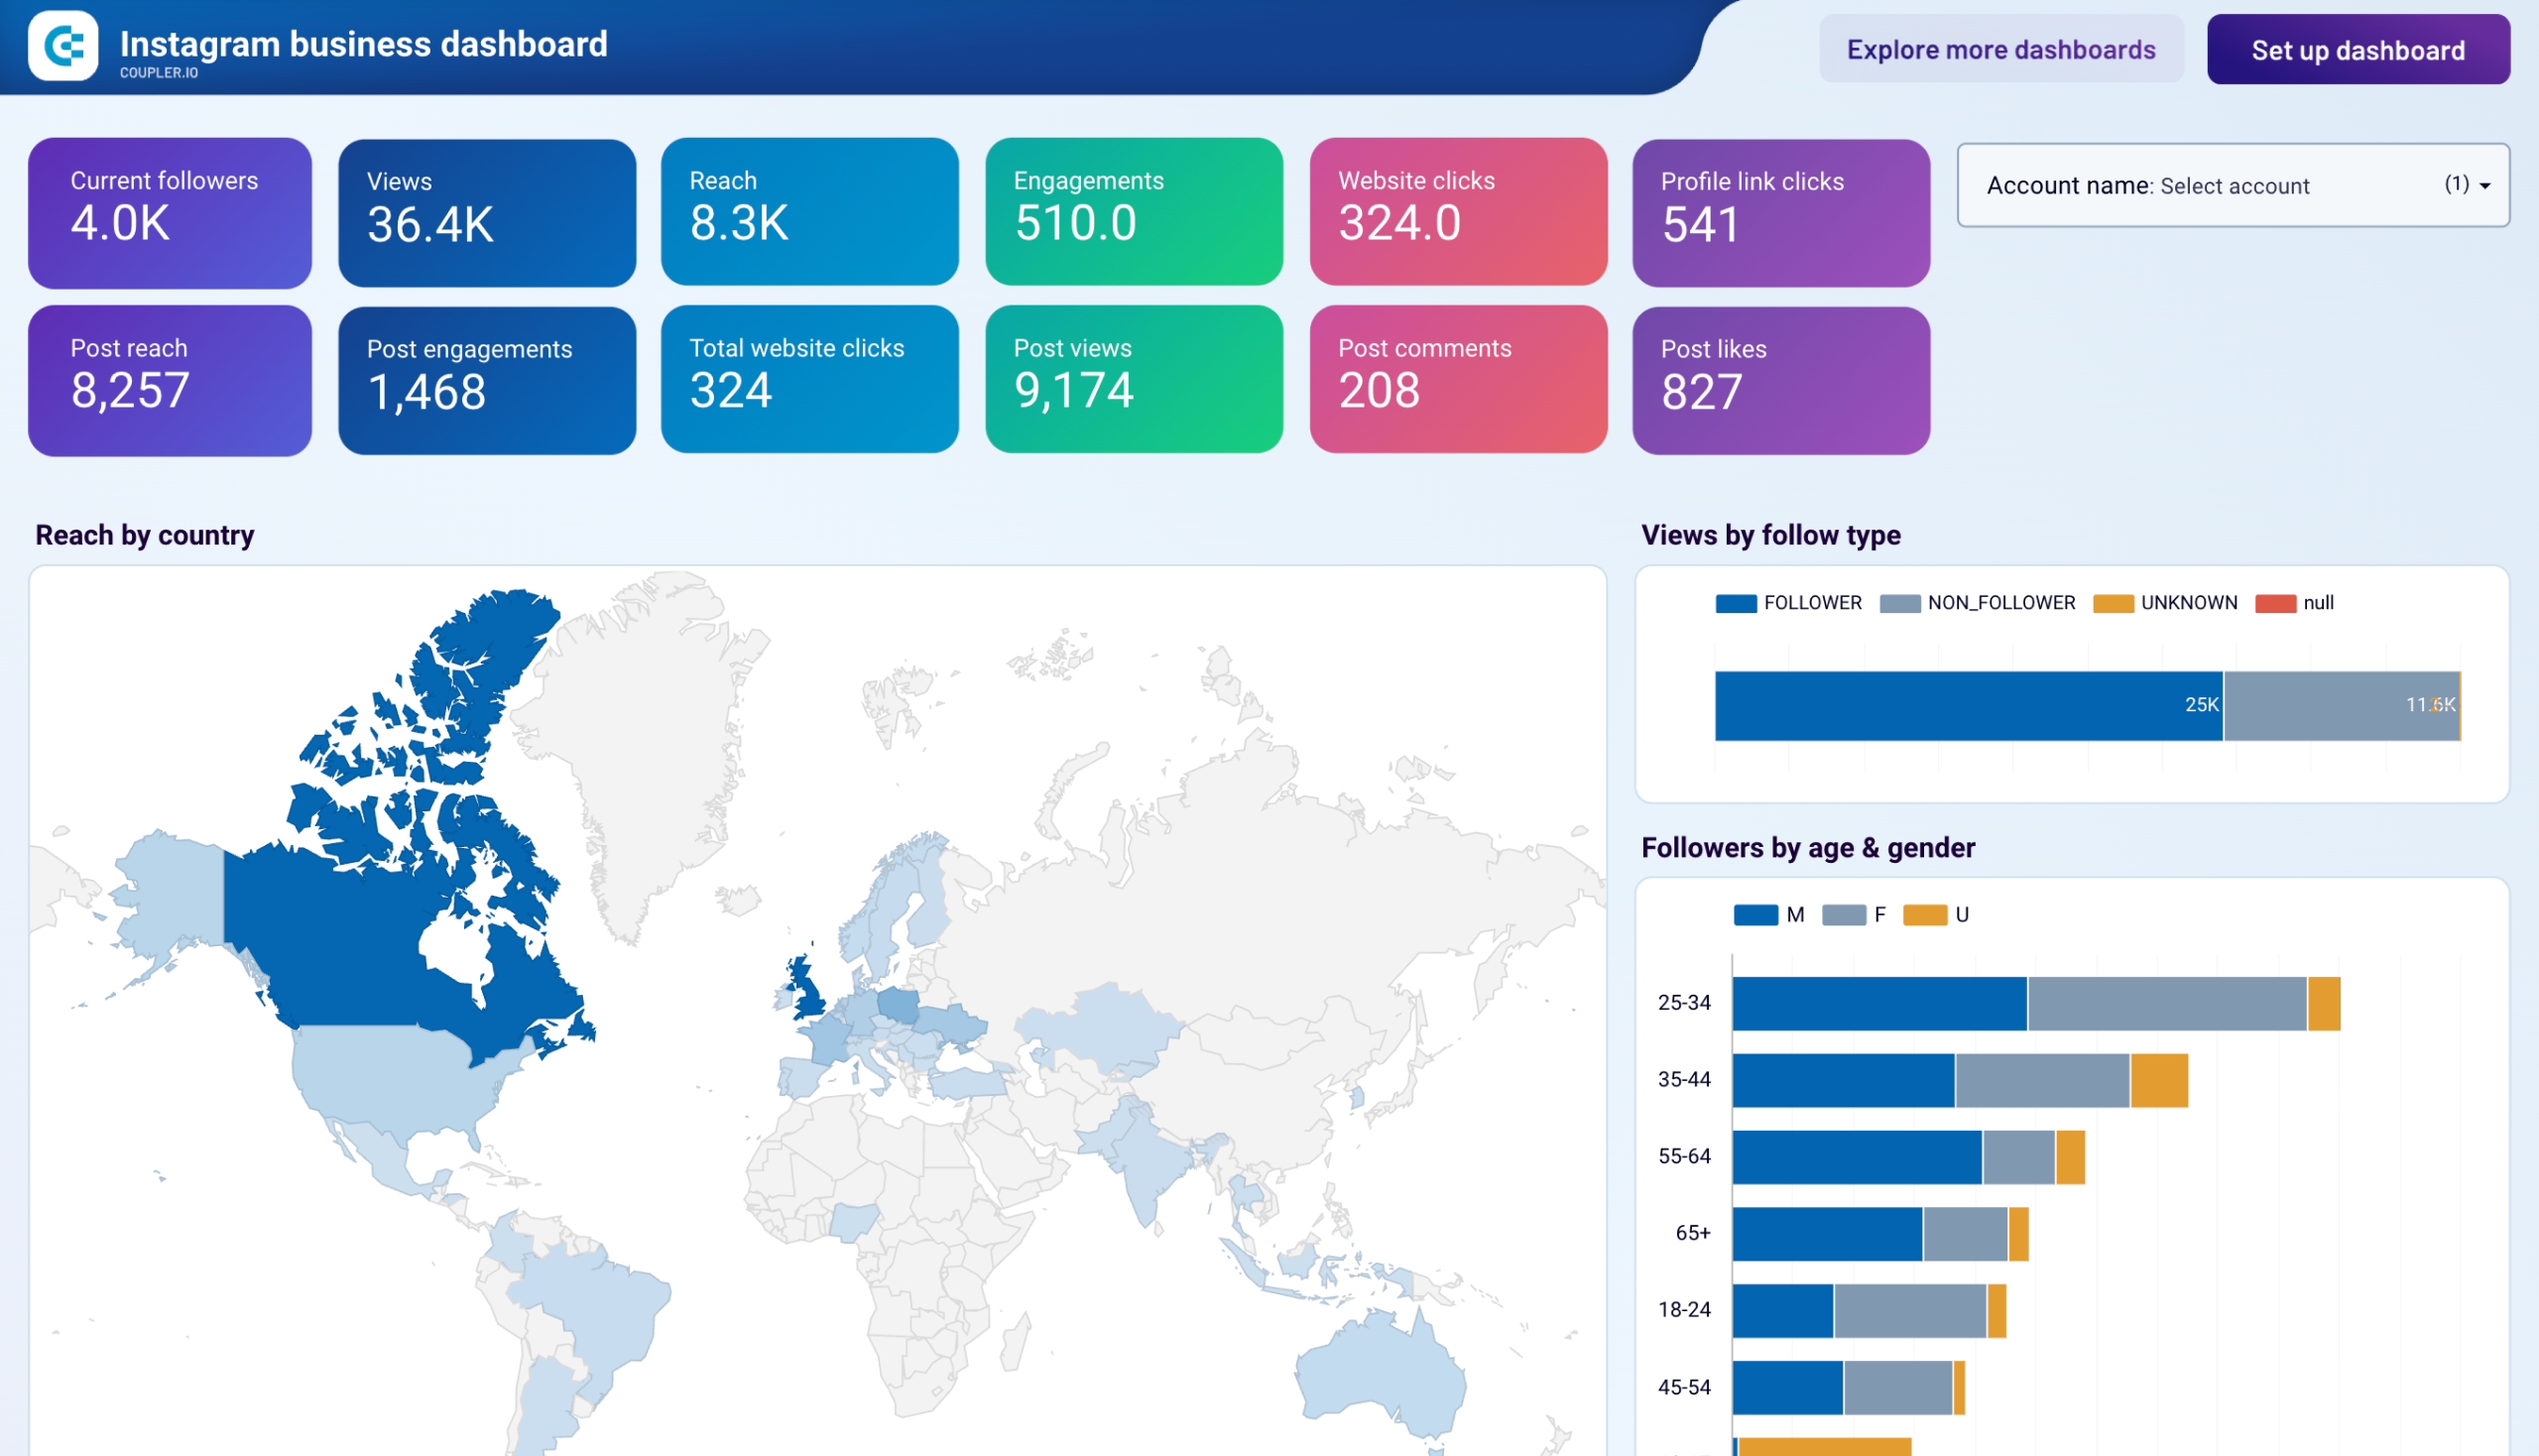
This comprehensive Instagram analytics dashboard provides detailed insights into your account’s performance, helping you understand what content resonates with your audience and how to improve engagement rates.
Monitor key metrics such as profile visits, reach, impressions, and follower demographics. Analyze individual post performance to identify your best-performing content types, optimal posting times, and most engaging creative formats.
The dashboard supports multi-account tracking, making it perfect for agencies managing multiple Instagram business profiles or brands with several product lines. Compare performance across accounts, identify trends, and apply successful strategies from one account to others.
Report metrics
- Followers
- Reach
- Impressions
- Engagement rate
- Profile visits
- Website clicks
- Post performance
- Story views
18. YouTube channel overview report template
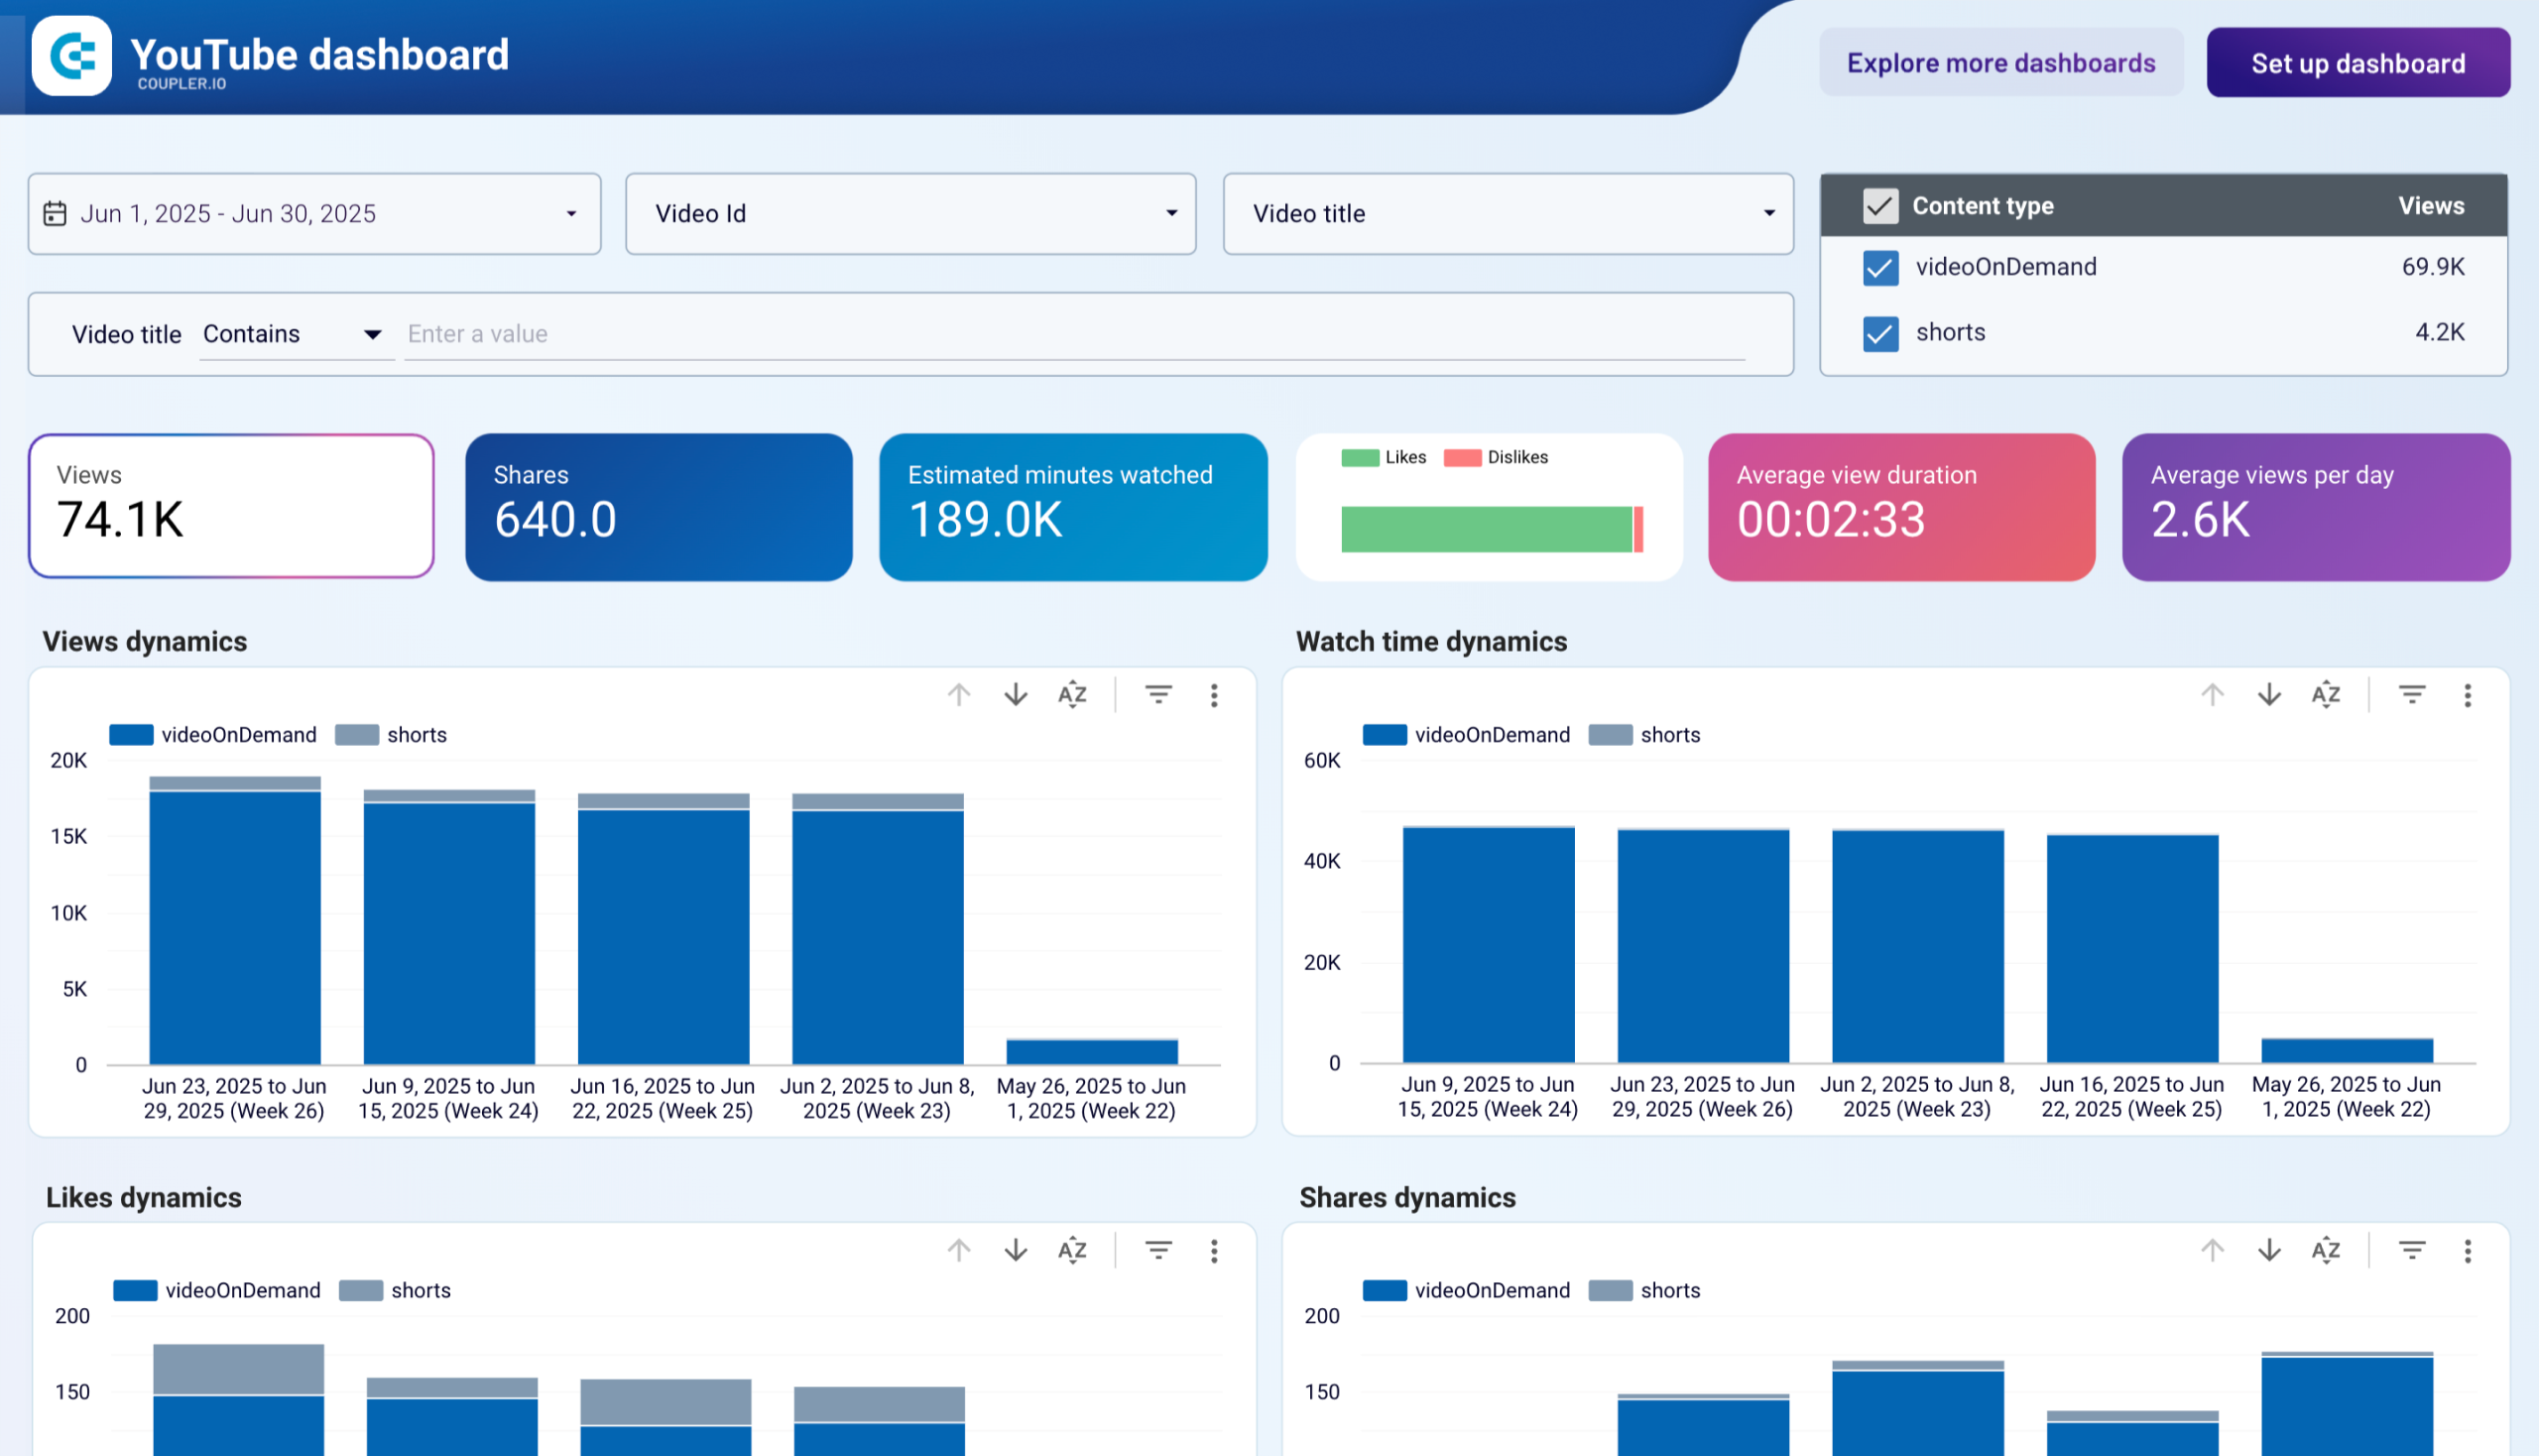
Coupler.io’s YouTube channel overview dashboard in Looker Studio breaks your channel data into separate tables for viewership, subscribers, engagement, and traffic. Instead of a single summary view, you get dedicated pages where you can filter by video ID or title, including regex-based filters that let you group videos by naming patterns (e.g., all titles containing “Tutorial”).
YouTube channel overview dashboard in Looker Studio
 Preview dashboard
YouTube channel overview dashboard in Looker Studio
Preview dashboardOne feature that separates this from YouTube Studio’s built-in analytics is the engagement table. It surfaces annotation impressions, card clicks, teaser CTR, and other interactive element metrics that YouTube Studio buries across multiple reports. The traffic sources page also lists the search keywords viewers used to find your videos and the top referral URLs where your content was embedded or linked.
This influencer marketing dashboard connects directly to YouTube Analytics through a built-in Coupler.io connector. Data refreshes automatically on your chosen schedule.
Report metrics:
- Views
- Minutes watched
- Average view duration
- Views per day
- Subscribers gained
- Subscribers lost
- Likes, Comments, Shares
- Annotations CTR
- Cards CTR
- Traffic sources
19. YouTube Analytics report template
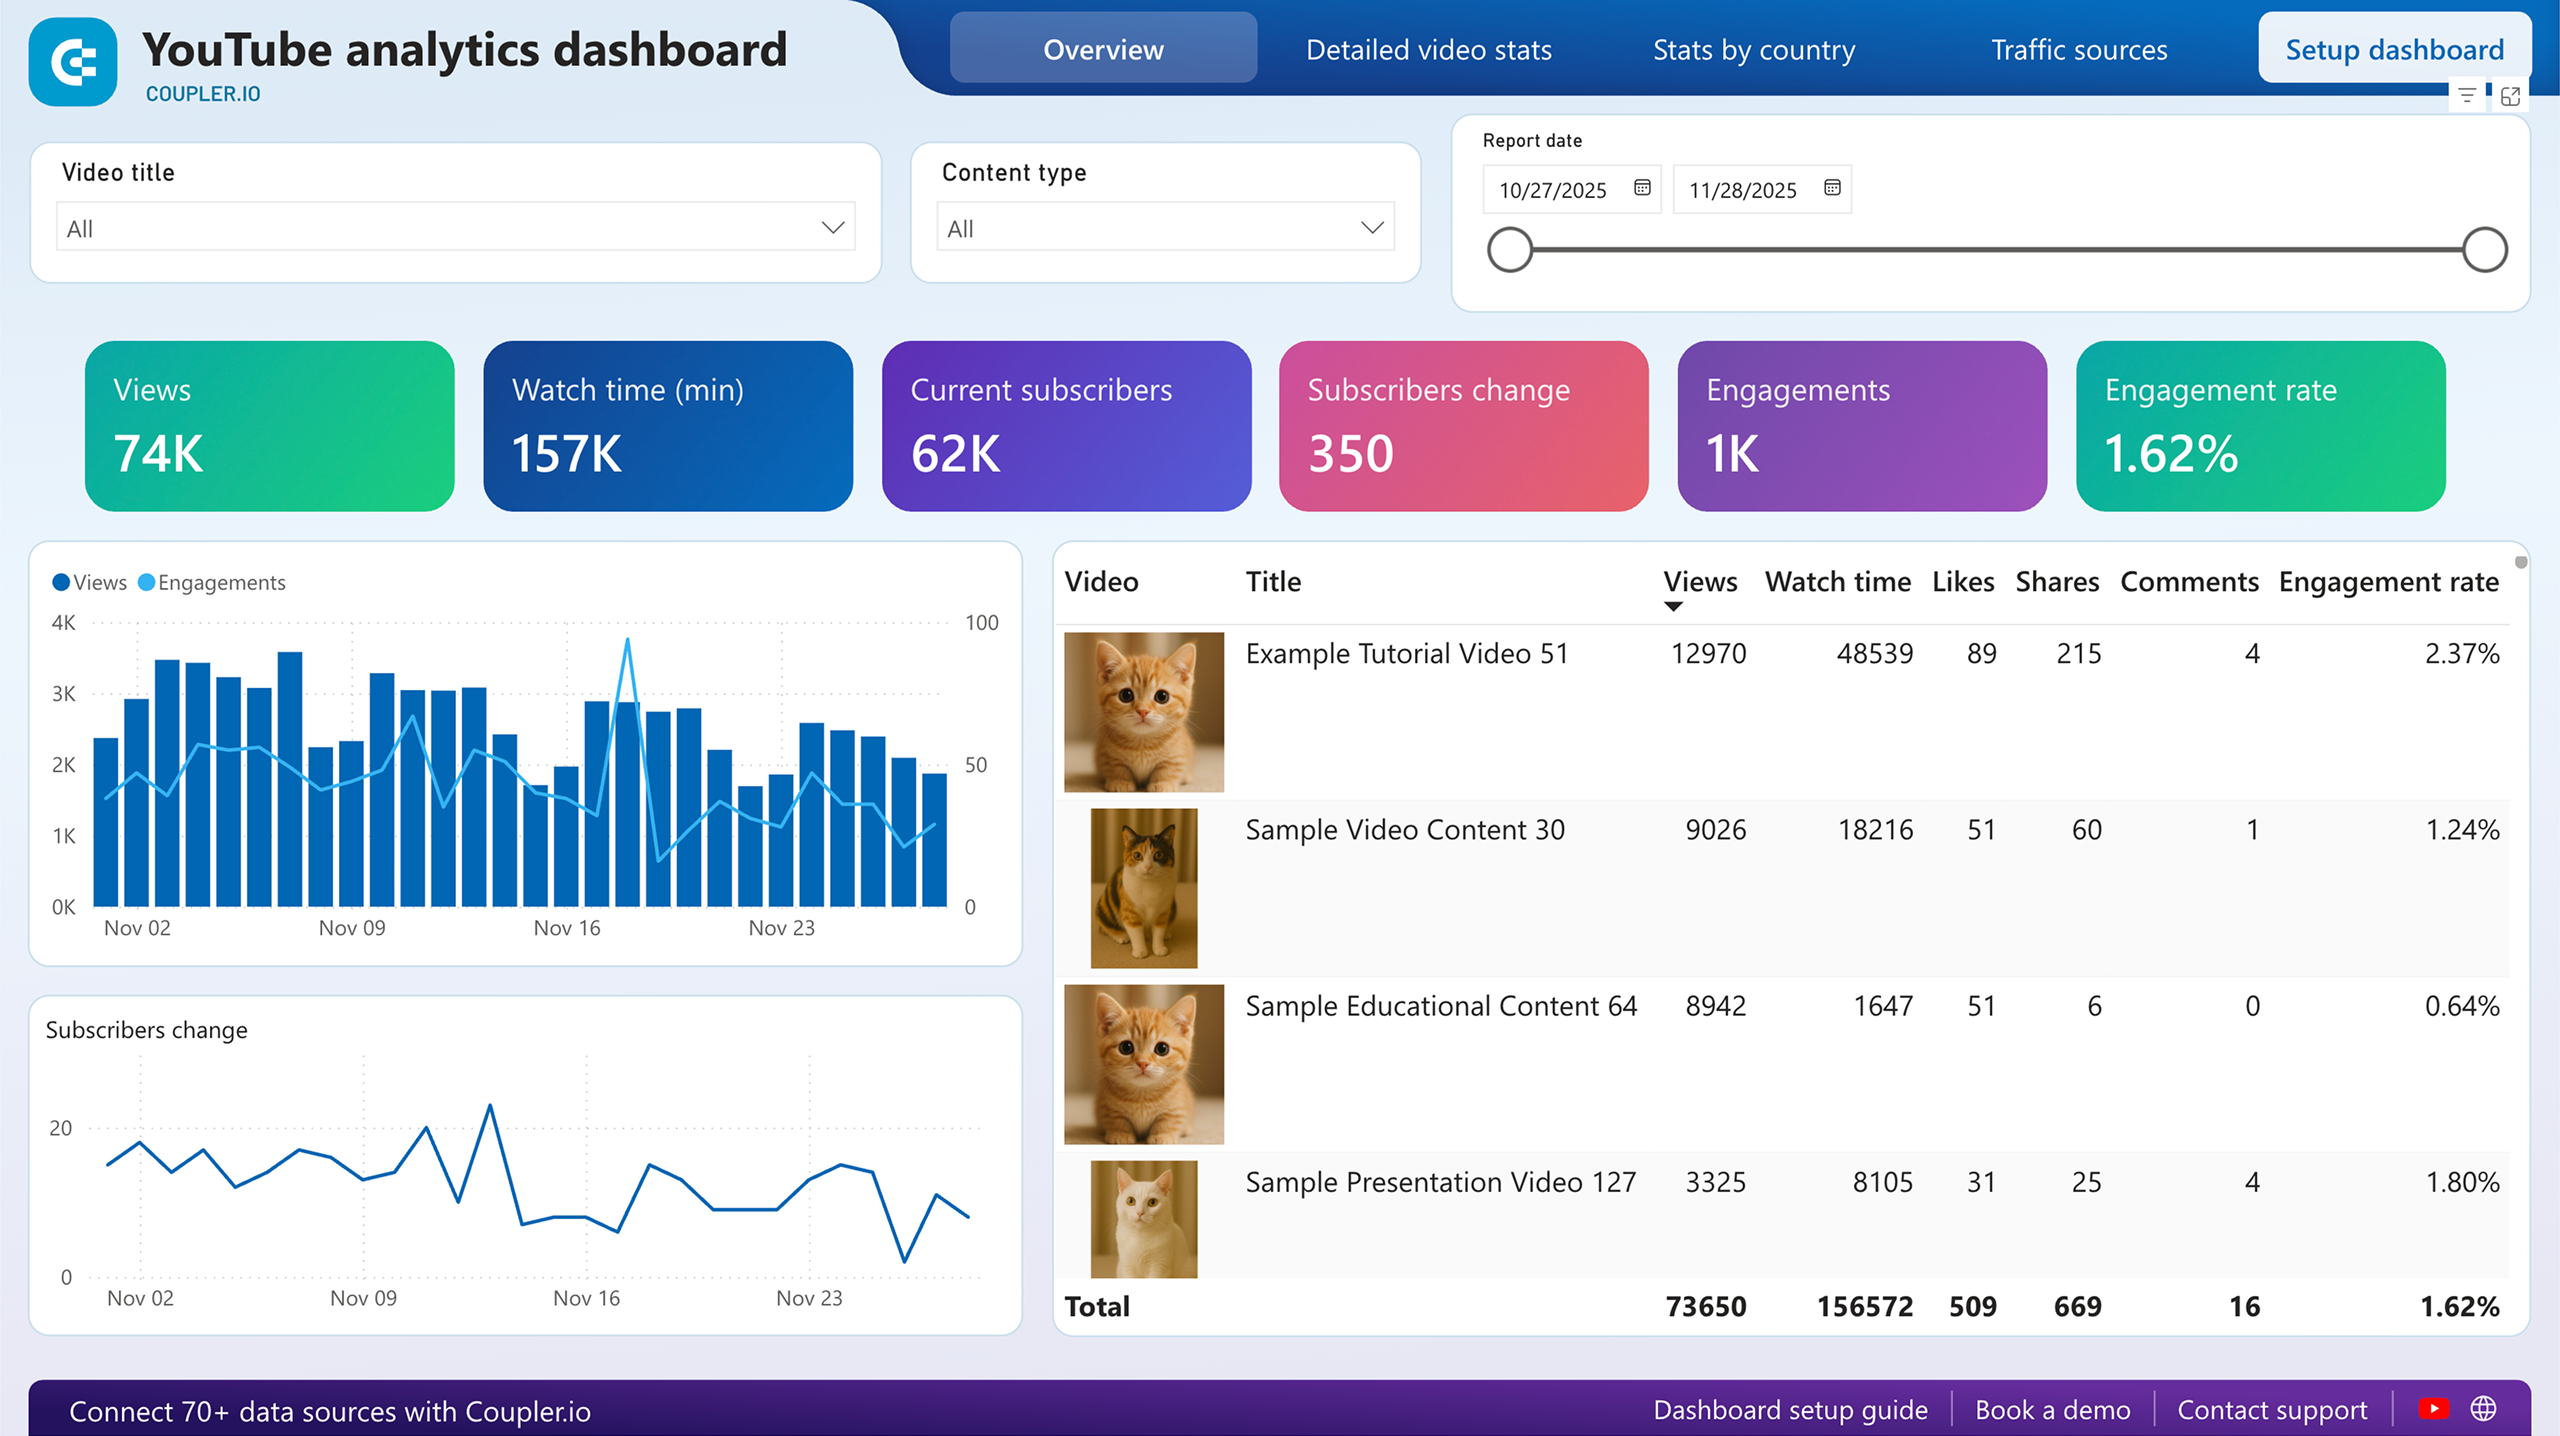
If your team already works in Power BI, Coupler.io offers a YouTube analytics dashboard built natively for that environment. It’s organized across four pages — Overview, Detailed video stats, Stats by country, and Traffic sources. This way, each analysis type lives on its own page rather than competing for space on a single screen.
Youtube analytics dashboard in Power BI
 Preview dashboard
Youtube analytics dashboard in Power BI
Preview dashboardThe Overview page pairs a daily views-versus-engagement chart with a subscriber-change timeline, making it straightforward to spot days when a video pulled in views but failed to generate interaction. The Detailed video stats page goes deeper by adding the average view percentage and content type classification (standard videos vs. Shorts), with color-coding for outlier values. That distinction matters if you’re trying to figure out whether Shorts are growing your subscriber base or just inflating view counts.
On the Stats by country page, a world map paired with an engagement table lets you compare not just where your views come from but also which countries actually watch longer. The Traffic sources page rounds things out with breakdowns by source type, top external referrers, search keywords, and related video URLs. Setup takes a few minutes via the Coupler.io connector.
Report metrics:
- Views
- Watch time (minutes)
- Current subscribers
- Subscribers change
- Engagements
- Engagement rate
- Average view percentage
- Likes, Shares, Comments
20. YouTube KPIs report template
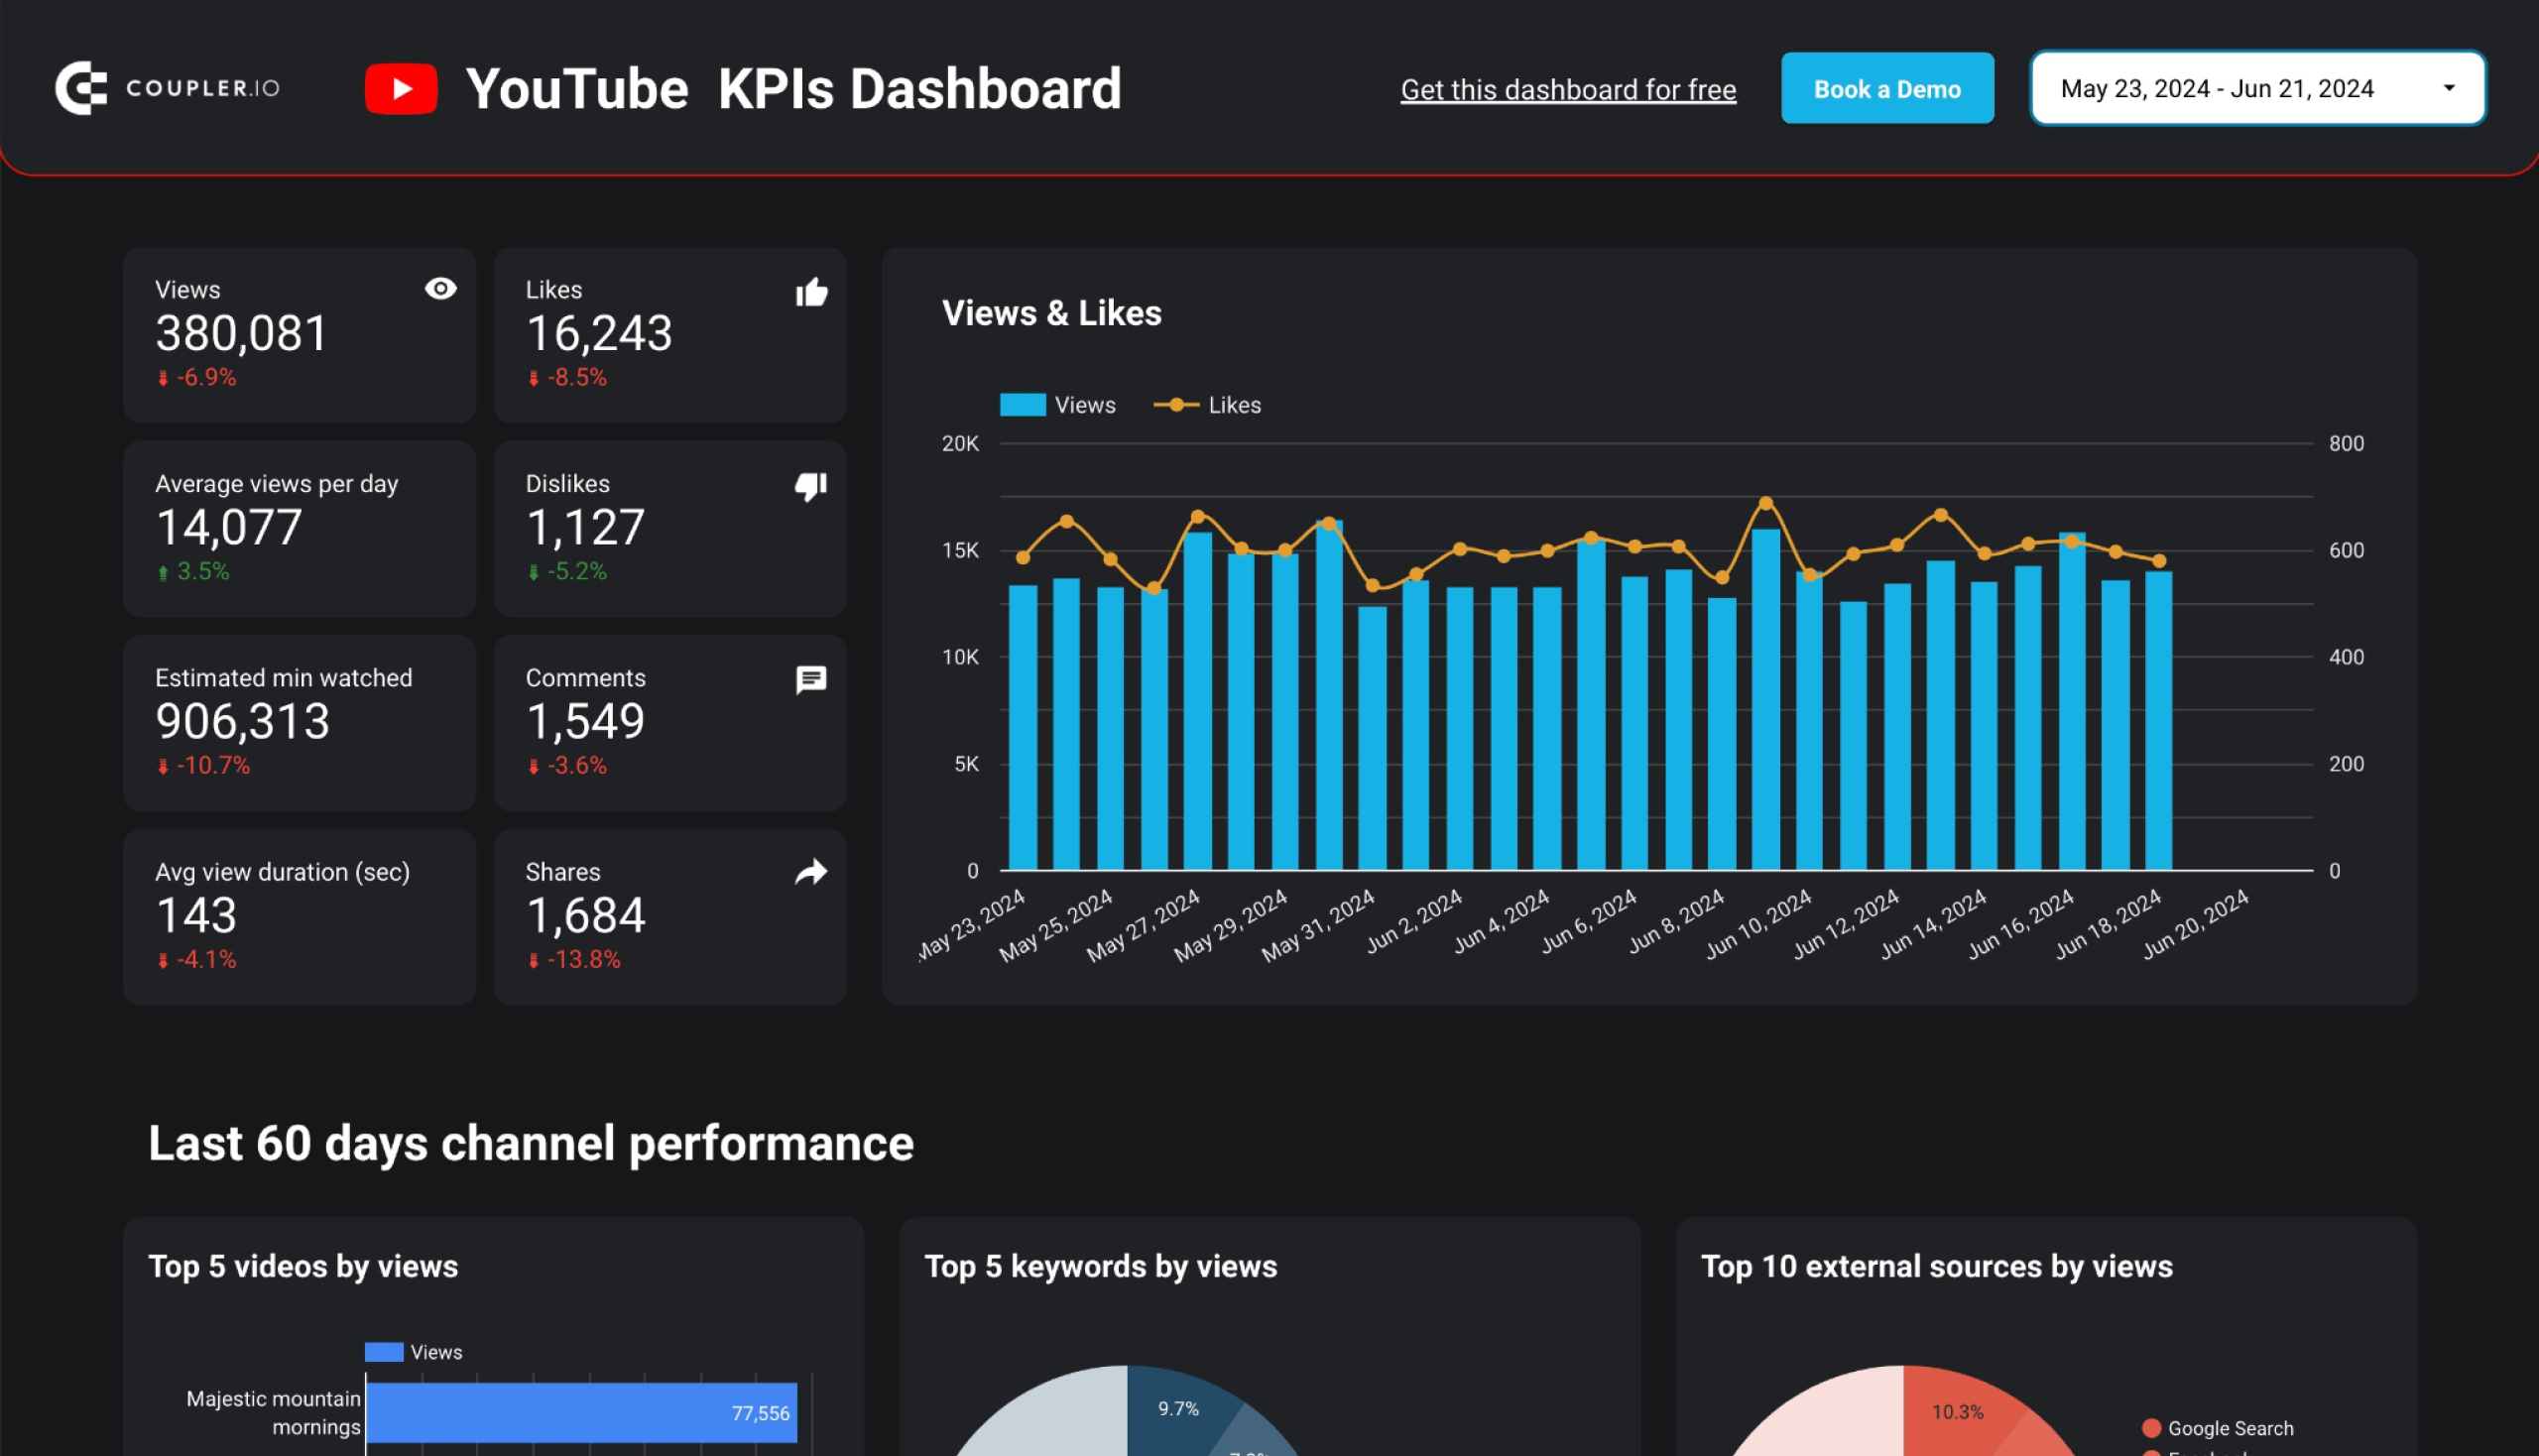
The YouTube KPIs dashboard takes a different approach from the channel overview template above. Where that dashboard is built around sortable tables, this one leads with scorecards and ranked charts. This format is better suited for weekly check-ins or stakeholder updates where you need the answer at a glance, not a deep drill-down.
YouTube KPI dashboard in Looker Studio
 Preview dashboard
YouTube KPI dashboard in Looker Studio
Preview dashboardThe top row displays views, likes, dislikes, watch time, comments, shares, and average view duration as individual scorecards. Below that, five ranked charts show your top videos by views, top keywords by views, top external traffic sources, top internal traffic sources (YouTube Search, Shorts, suggested videos, end screen cards), and a geographic map of views by country. You can scan all of these in under 30 seconds, which is the point.
A subscriber growth section breaks down gained versus lost subscribers with daily bar charts, so you can trace growth spikes back to specific publish dates. The video performance table at the bottom adds playlist additions and removals alongside the standard engagement columns.
This Looker Studio template connects to YouTube Analytics through Coupler.io and refreshes automatically.
Report metrics:
- Views
- Likes
- Dislikes
- Watch time
- Comments
- Shares
- Average view duration
- Average views per day
- Subscribers gained
- Subscribers lost
Email marketing report templates
Email marketing remains one of the highest-ROI marketing channels. These templates help you track campaign performance, monitor subscriber engagement, and optimize your email marketing strategy across different platforms.
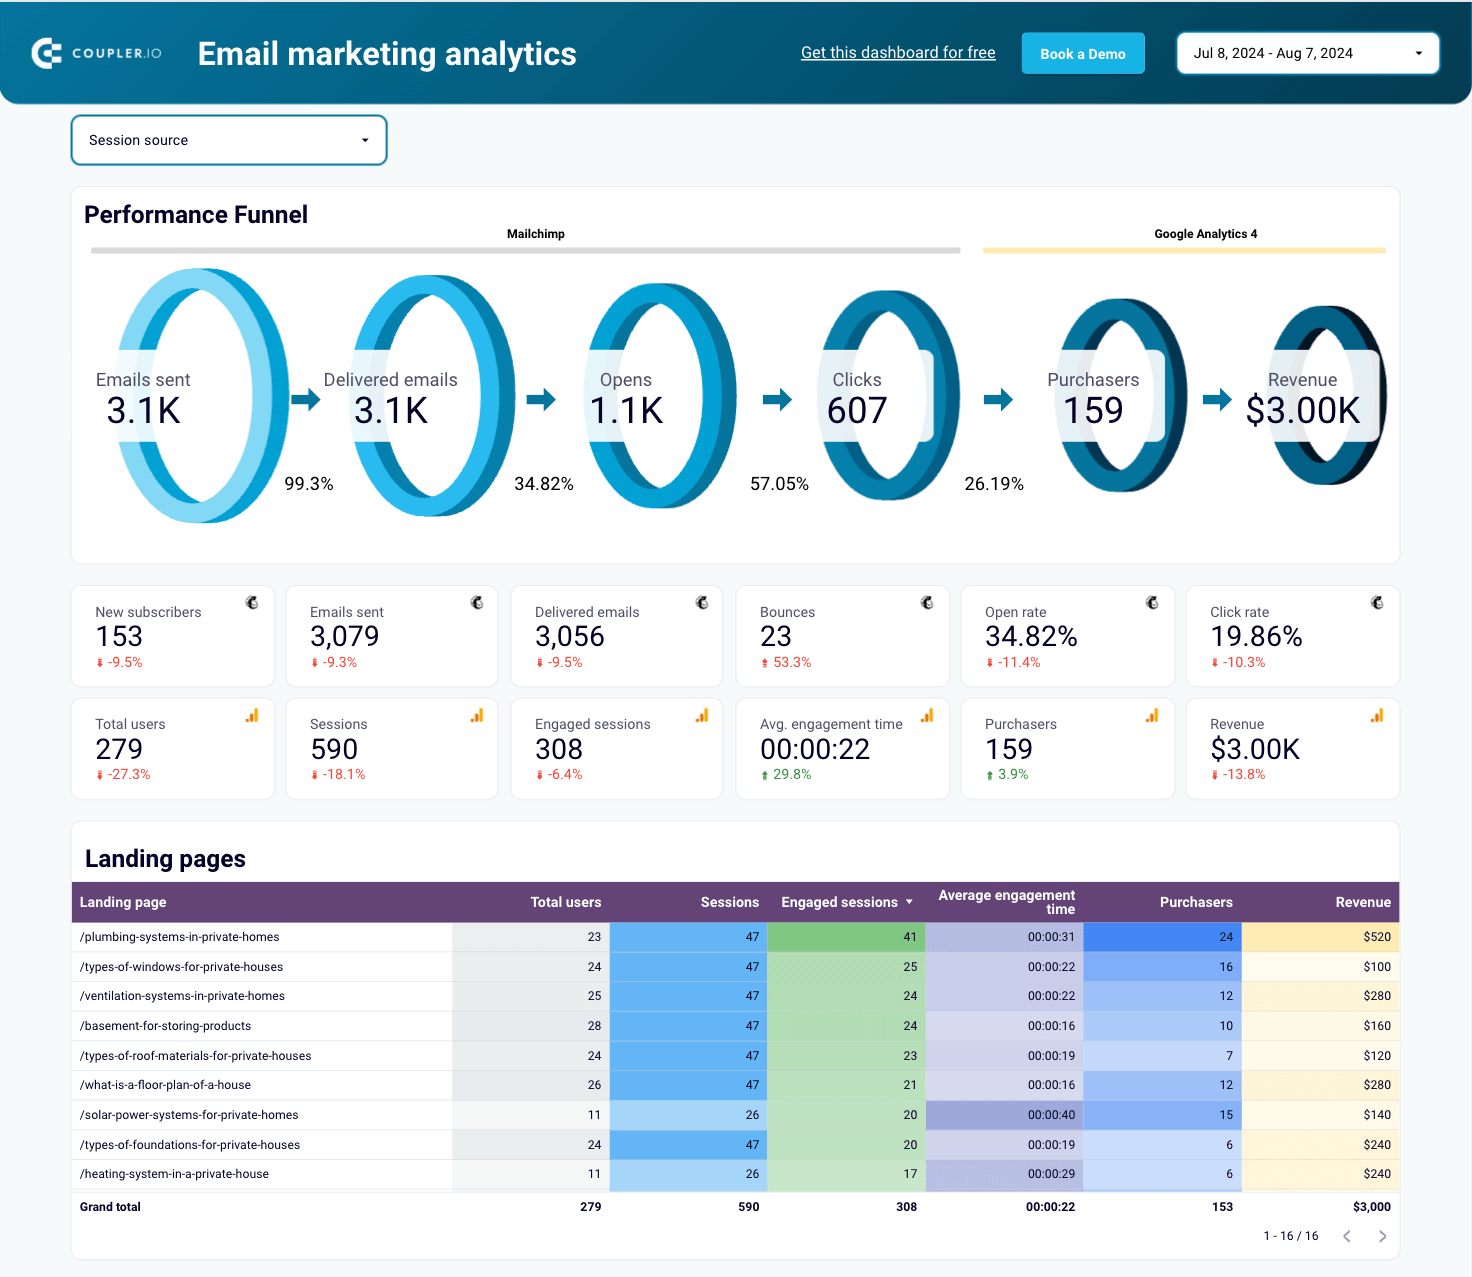
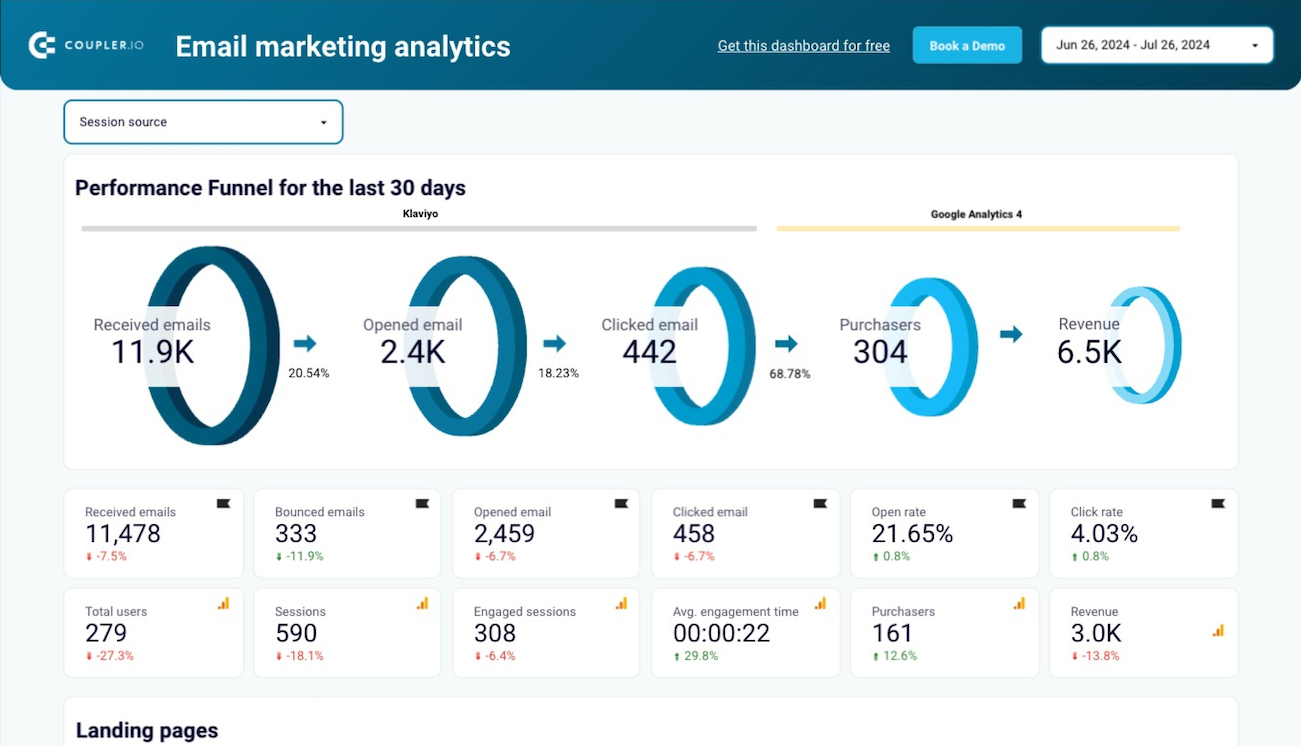
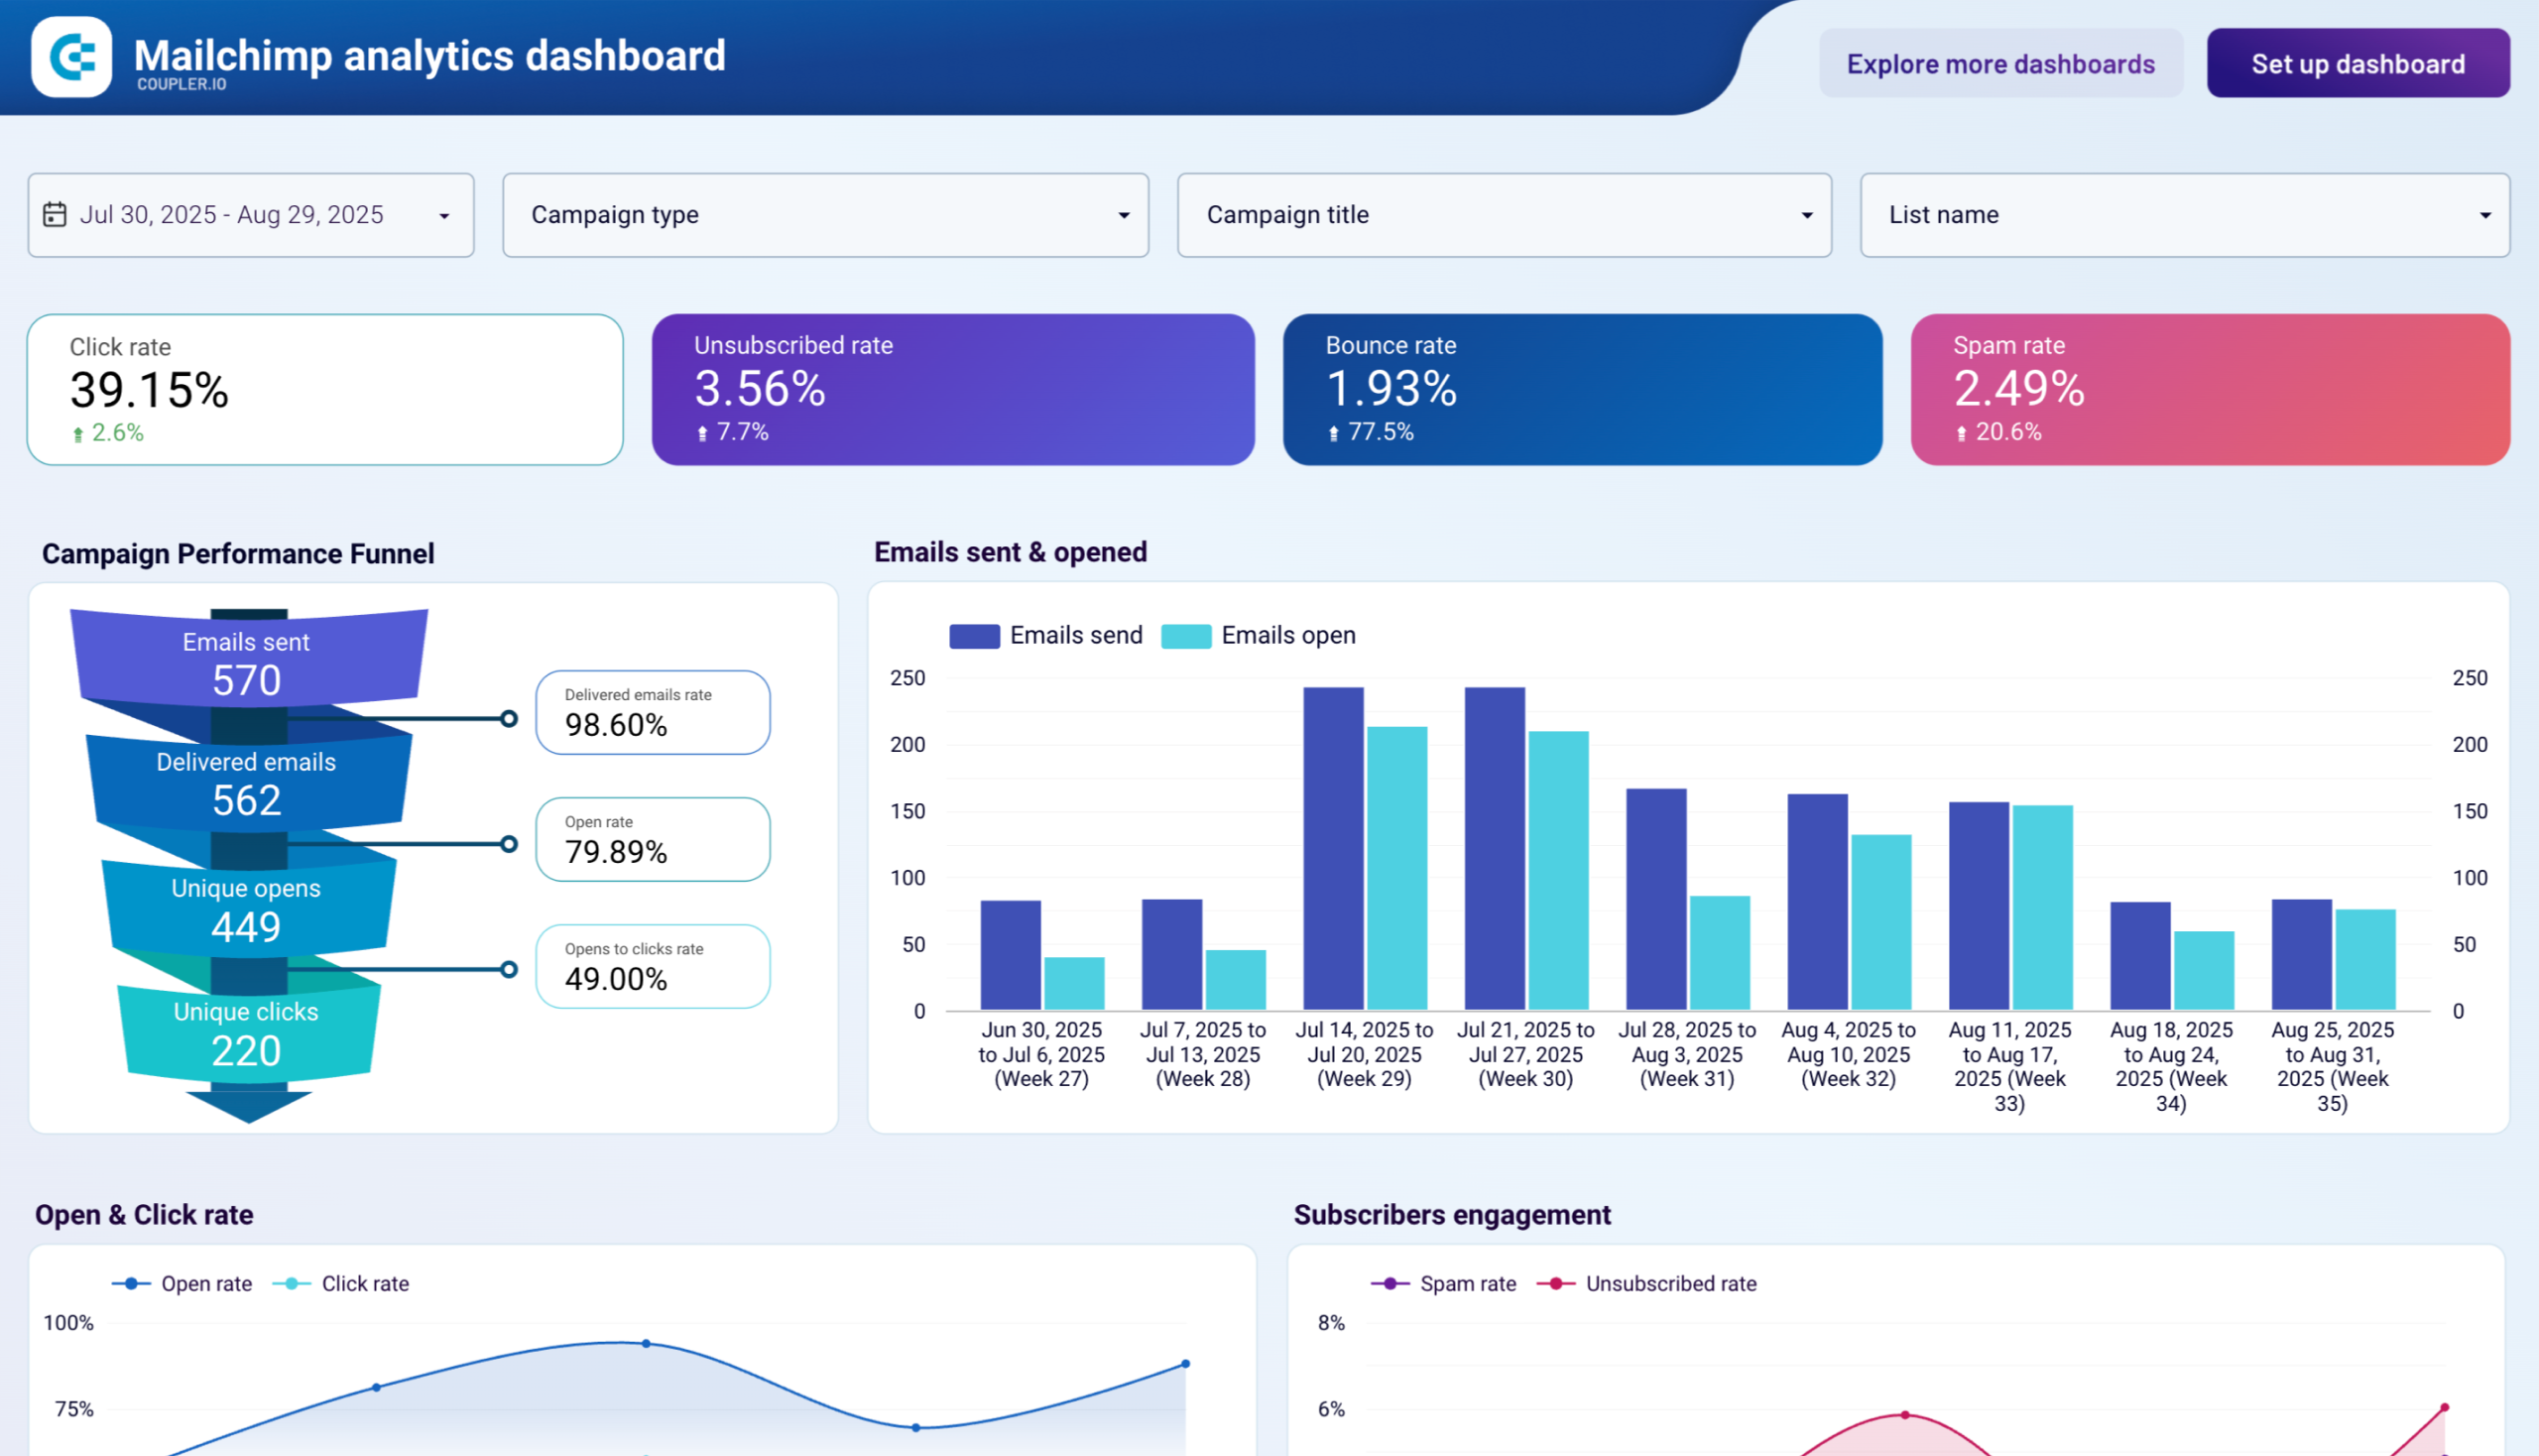
21. Email marketing report template for Mailchimp
Track your Mailchimp email campaigns with detailed performance metrics including open rates, click-through rates, bounce rates, and subscriber growth to optimize your email marketing effectiveness.
Mailchimp email marketing analytics dashboard
 Preview dashboard
Mailchimp email marketing analytics dashboard
Preview dashboardThis Mailchimp-specific dashboard provides comprehensive insights into your email campaign performance, helping you understand what content resonates with your subscribers and how to improve engagement rates.
Monitor key metrics such as campaign delivery success, open and click patterns, subscriber list growth, and unsubscribe trends. Analyze individual campaign performance to identify your most effective subject lines, content types, and sending times.
The dashboard automatically updates with your latest Mailchimp data, eliminating manual report compilation and ensuring you always have current performance insights. Use this information to refine your email strategy, segment your audience more effectively, and improve overall campaign ROI.
Report metrics:
- Email delivery rate
- Bounce rate
- Open rate
- Click-through rate
- Unsubscribe rate
- Subscriber growth
- Campaign revenue
- Conversions
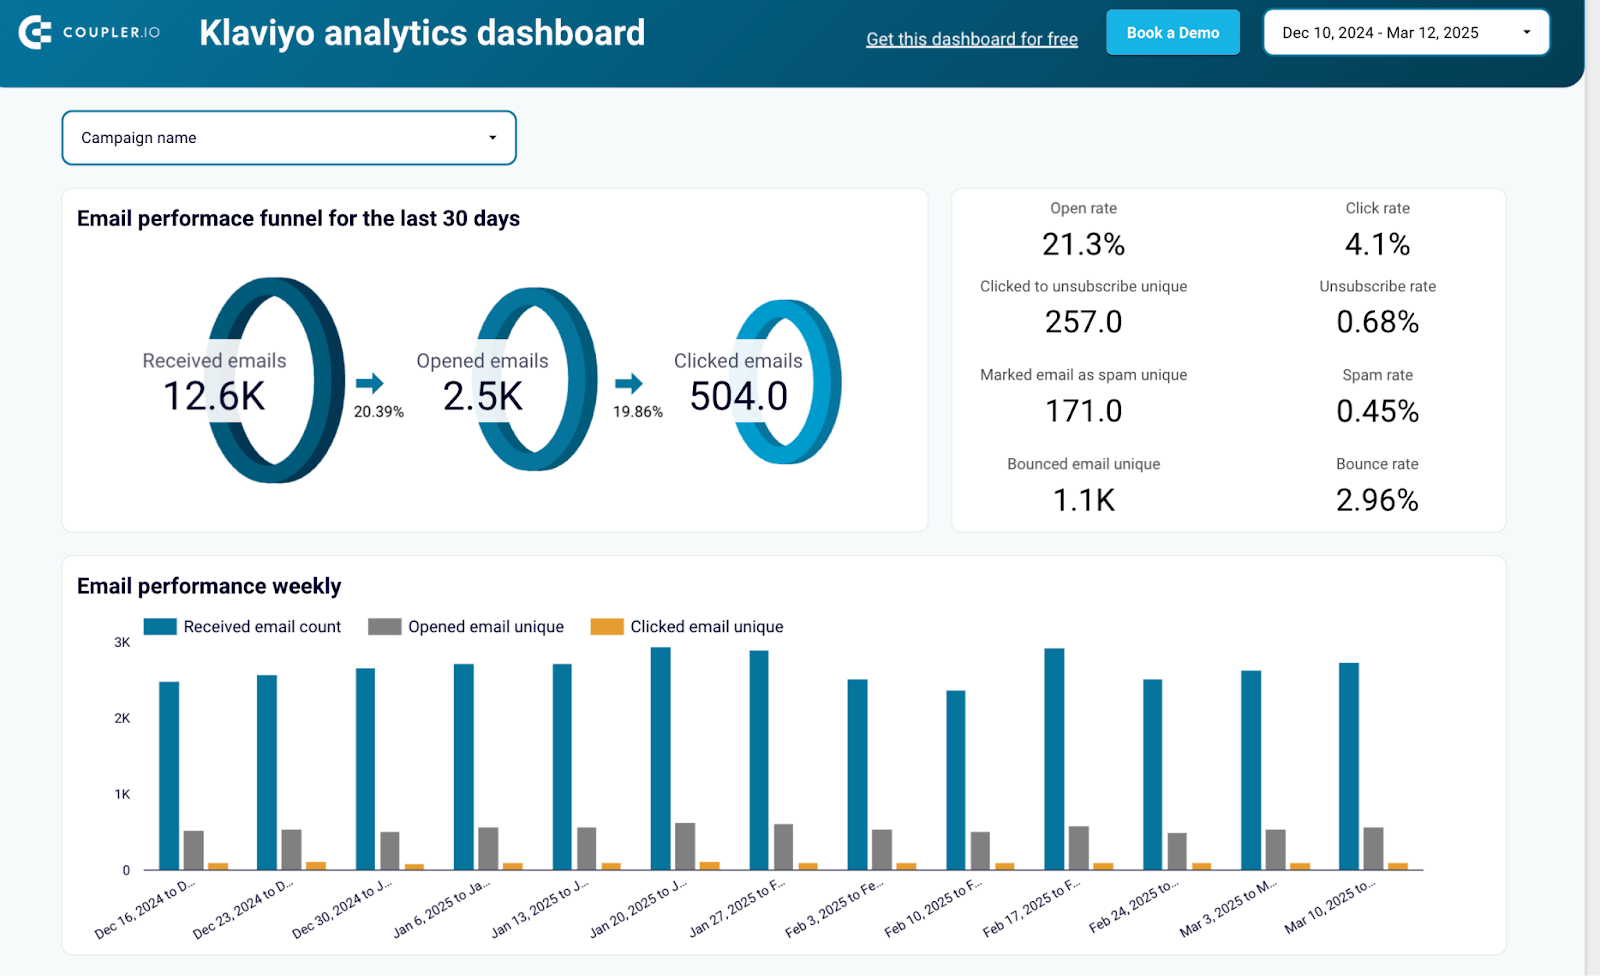
22. Email marketing report template for Klaviyo
Optimize your Klaviyo email and SMS marketing campaigns with detailed analytics on flow performance, campaign effectiveness, subscriber behavior, and revenue attribution to maximize e-commerce results.
Klaviyo email marketing analytics dashboard
 Preview dashboard
Klaviyo email marketing analytics dashboard
Preview dashboardThis Klaviyo dashboard is designed specifically for e-commerce businesses using Klaviyo’s advanced marketing automation. Track how your automated flows and campaigns drive revenue, monitor subscriber engagement across different segments, and analyze the customer journey from first email to purchase.
The dashboard provides insights into flow performance, campaign ROI, subscriber lifecycle metrics, and revenue attribution. Understand which automated flows generate the most revenue, identify high-value subscriber segments, and optimize your email strategy based on actual purchase behavior.
Monitor key e-commerce metrics such as revenue per email, conversion rates by flow, and customer lifetime value influenced by email marketing. This data-driven approach helps you refine your segmentation, improve personalization, and increase the overall effectiveness of your Klaviyo campaigns.
Report metrics:
- Revenue
- Open rate
- Click rate
- Conversions
- Flow performance
- Campaign performance
- Subscriber count
- SMS deliveries
23. Mailchimp analytics report template
Get deeper insights into your Mailchimp account performance with advanced analytics covering subscriber behavior, campaign trends, audience demographics, and engagement patterns across all your email marketing activities.
This comprehensive analytics dashboard goes beyond basic campaign metrics to provide strategic insights into your overall Mailchimp performance. Analyze trends across multiple campaigns, understand subscriber lifecycle patterns, and identify opportunities to improve your email marketing strategy.
Track subscriber acquisition channels, monitor engagement trends over time, and analyze how different audience segments respond to your campaigns. The dashboard helps you identify which types of content generate the highest engagement and which subscriber segments deliver the best ROI.
Use this dashboard to inform your content strategy, optimize send times based on historical engagement data, and make data-driven decisions about audience segmentation and campaign frequency.
Report metrics:
- Subscribers
- Open rate
- Click rate
- Bounce rate
- Campaign performance
- Audience segments
- Engagement rate
- Unsubscribe rate
24. Klaviyo analytics report template
Analyze your Klaviyo marketing performance across campaigns, flows, and customer segments with advanced analytics that connect email and SMS marketing efforts to actual revenue and customer lifetime value.
This advanced Klaviyo analytics dashboard provides e-commerce-focused insights that help you understand the true impact of your email and SMS marketing on revenue. Track performance across all your marketing activities, from automated flows to one-time campaigns, with detailed attribution and ROI metrics.
Monitor how different subscriber segments engage with your marketing, analyze the effectiveness of your automation strategies, and identify opportunities to increase customer lifetime value through better-targeted campaigns and flows.
The dashboard integrates revenue data with marketing metrics, helping you understand which campaigns and flows generate the most profit, which subscriber segments are most valuable, and where to focus your optimization efforts for maximum return.
Report metrics:
- Revenue
- Conversions
- Open rate
- Click rate
- Flow performance
- Campaign performance
- Customer lifetime value
- Subscriber segments
25. MailerLite campaign performance report template
The MailerLite campaign performance dashboard aggregates all your MailerLite campaigns into a single report. Instead of reviewing results one campaign at a time inside the platform, you can compare engagement and deliverability across your full sending history.
MailerLite campaign performance dashboard
 Preview dashboard
MailerLite campaign performance dashboard
Preview dashboardWith this report, you can evaluate which campaigns drive both opens and clicks, and which have strong subject lines but weak content. It also breaks down performance by campaign type, so you can see whether your resend strategy is recovering missed opens or adding noise.
The template is built in Looker Studio with a Coupler.io connector. Connect your MailerLite account to get started in a few minutes.
Report metrics:
- CTOR
- Open rate
- Click rate
- Bounce rate
- Spam rate
- Unsubscribe rate
- Emails sent
- Emails delivered
- Emails opened
- Emails clicked
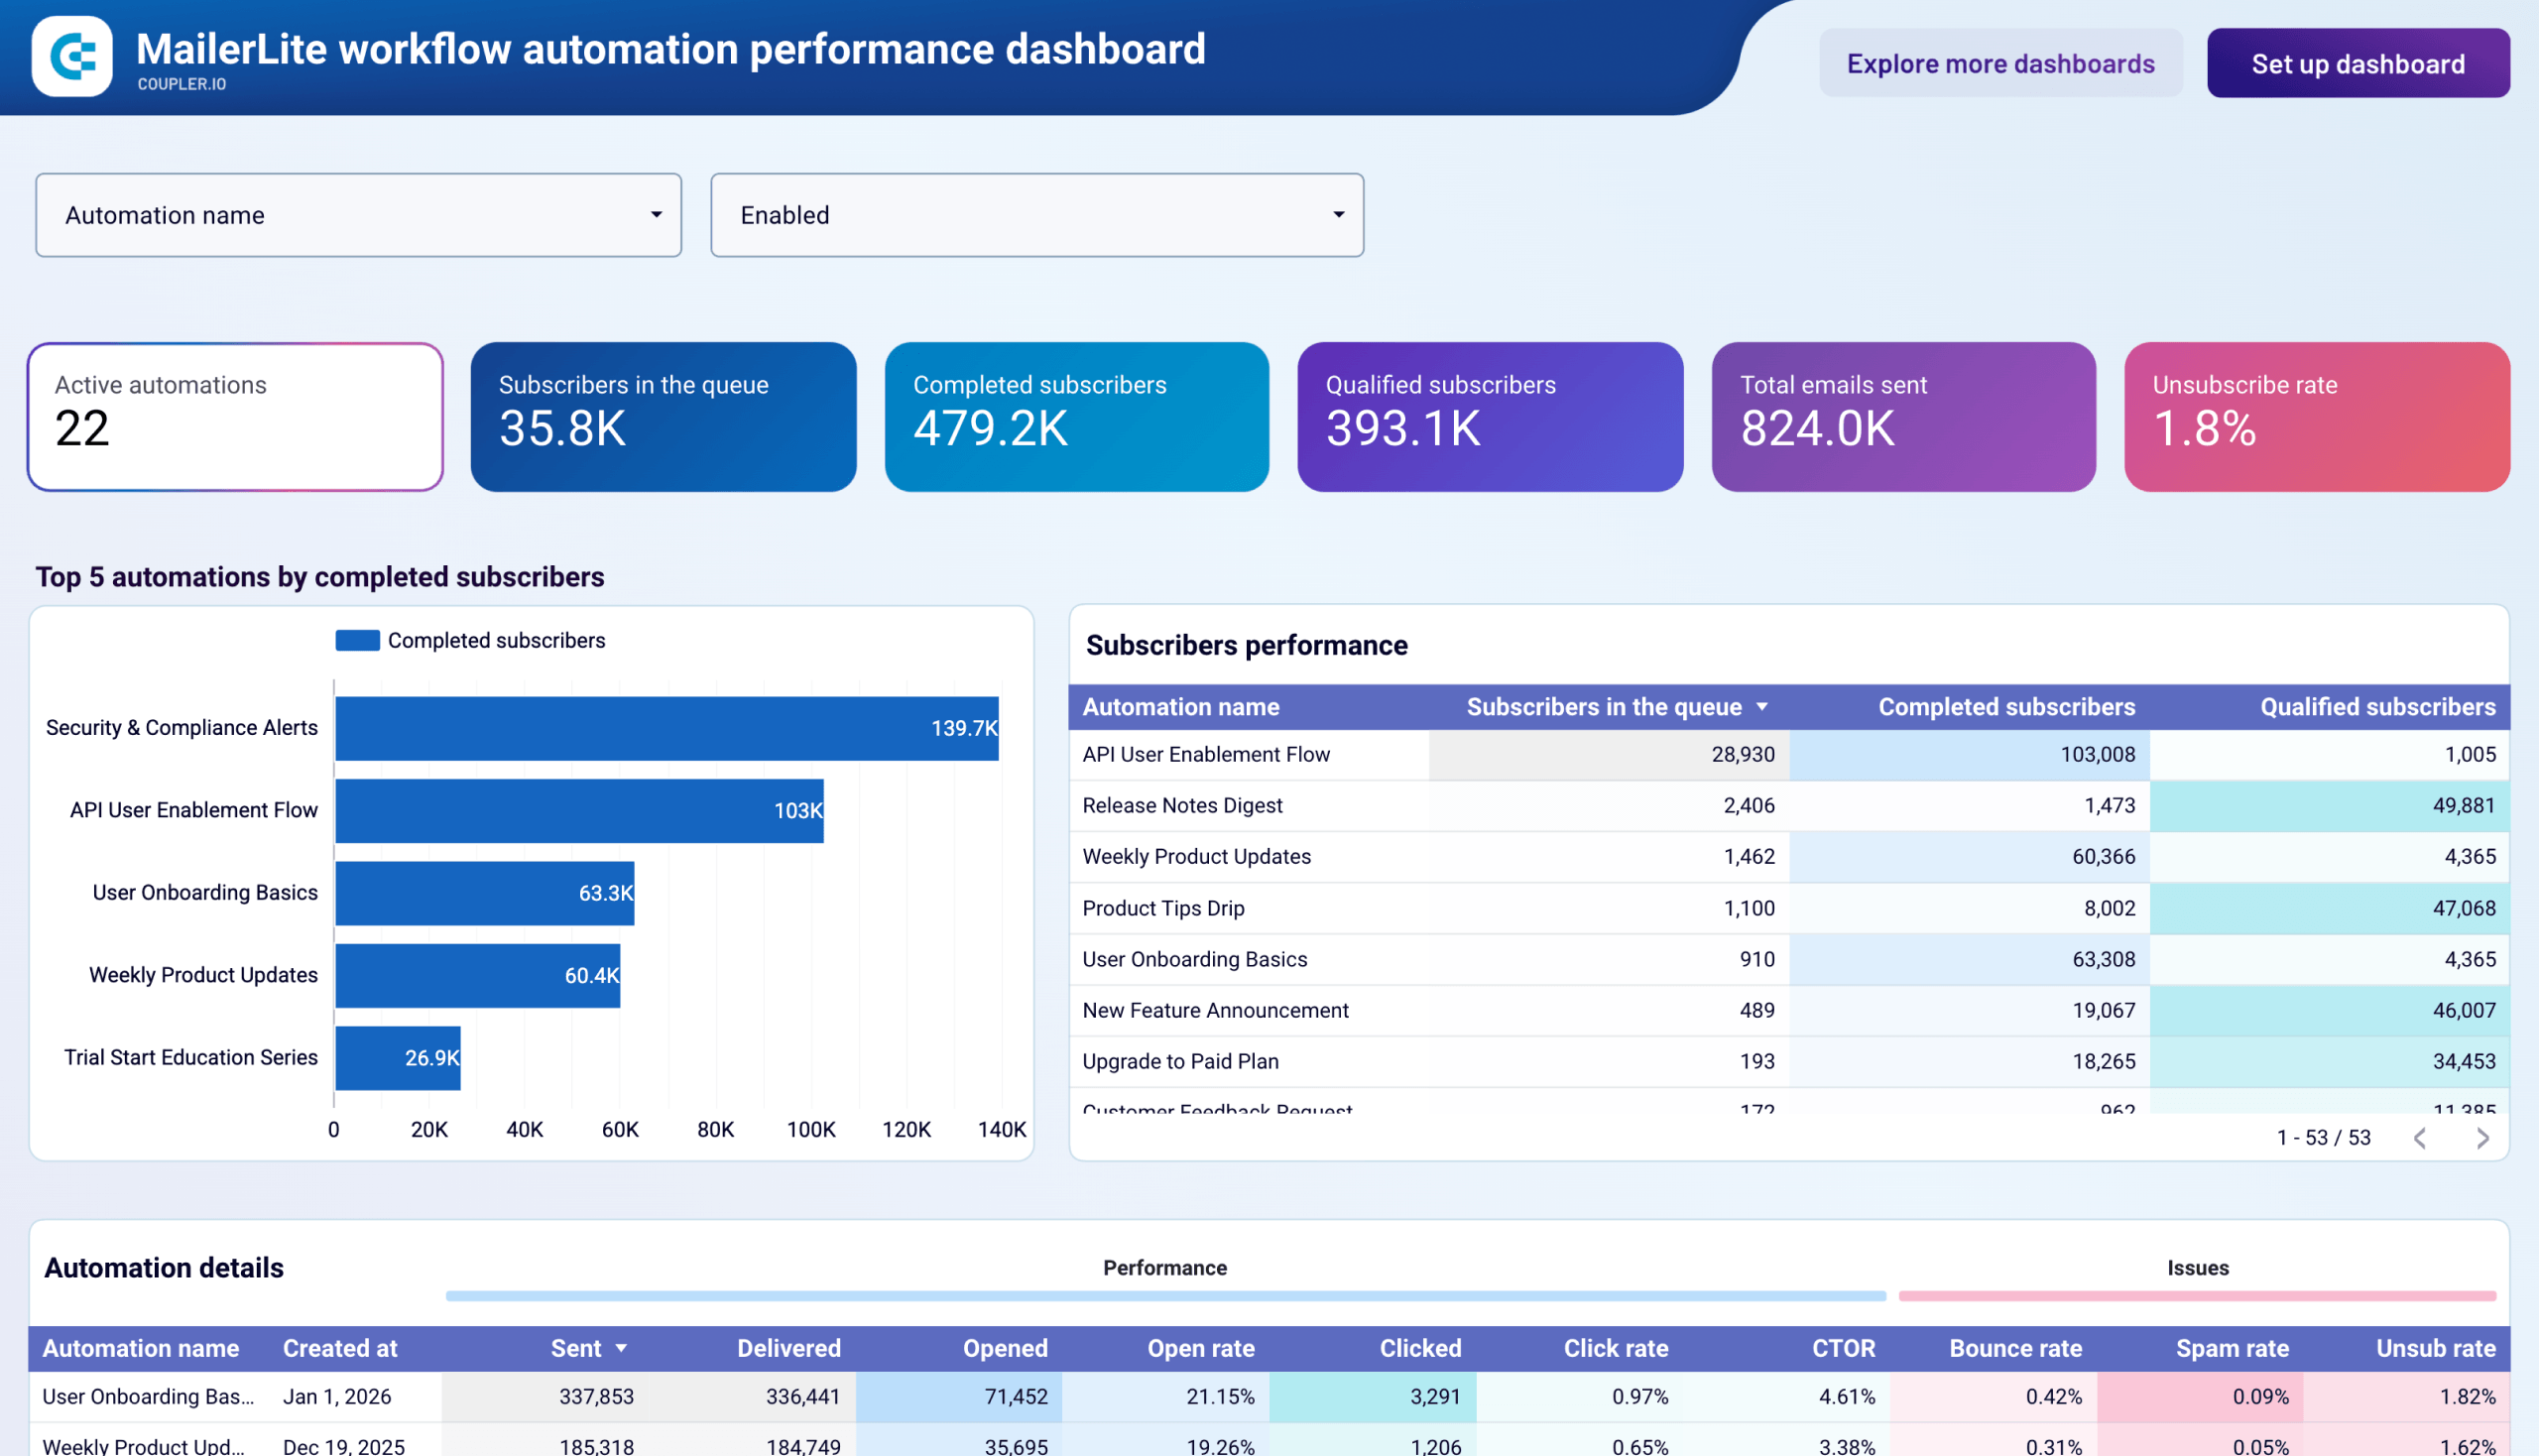
26. MailerLite workflow automation report template
Campaign reports cover individual sends. If you also run automated sequences in MailerLite, this dashboard monitors all of them in one place. It shows which workflows move subscribers toward a goal and which ones lose them mid-sequence.
MailerLite workflow automation performance dashboard
 Preview dashboard
MailerLite workflow automation performance dashboard
Preview dashboardWith the MailerLite workflow automation performance dashboard, you can compare completion and qualification rates across all your automations. It’s helpful for prioritization of where optimization will have the most impact. You can also identify broken workflows where subscribers are getting stuck, and spot deliverability issues within specific automations before they affect your overall sender reputation.
The template is available in Looker Studio with a Coupler.io connector.
Report metrics:
- Active automations
- Subscribers in queue
- Completed subscribers
- Qualified subscribers
- Total emails sent
- Unsubscribe rate
- Open rate
- Click rate
- CTOR
- Bounce rate
- Spam rate
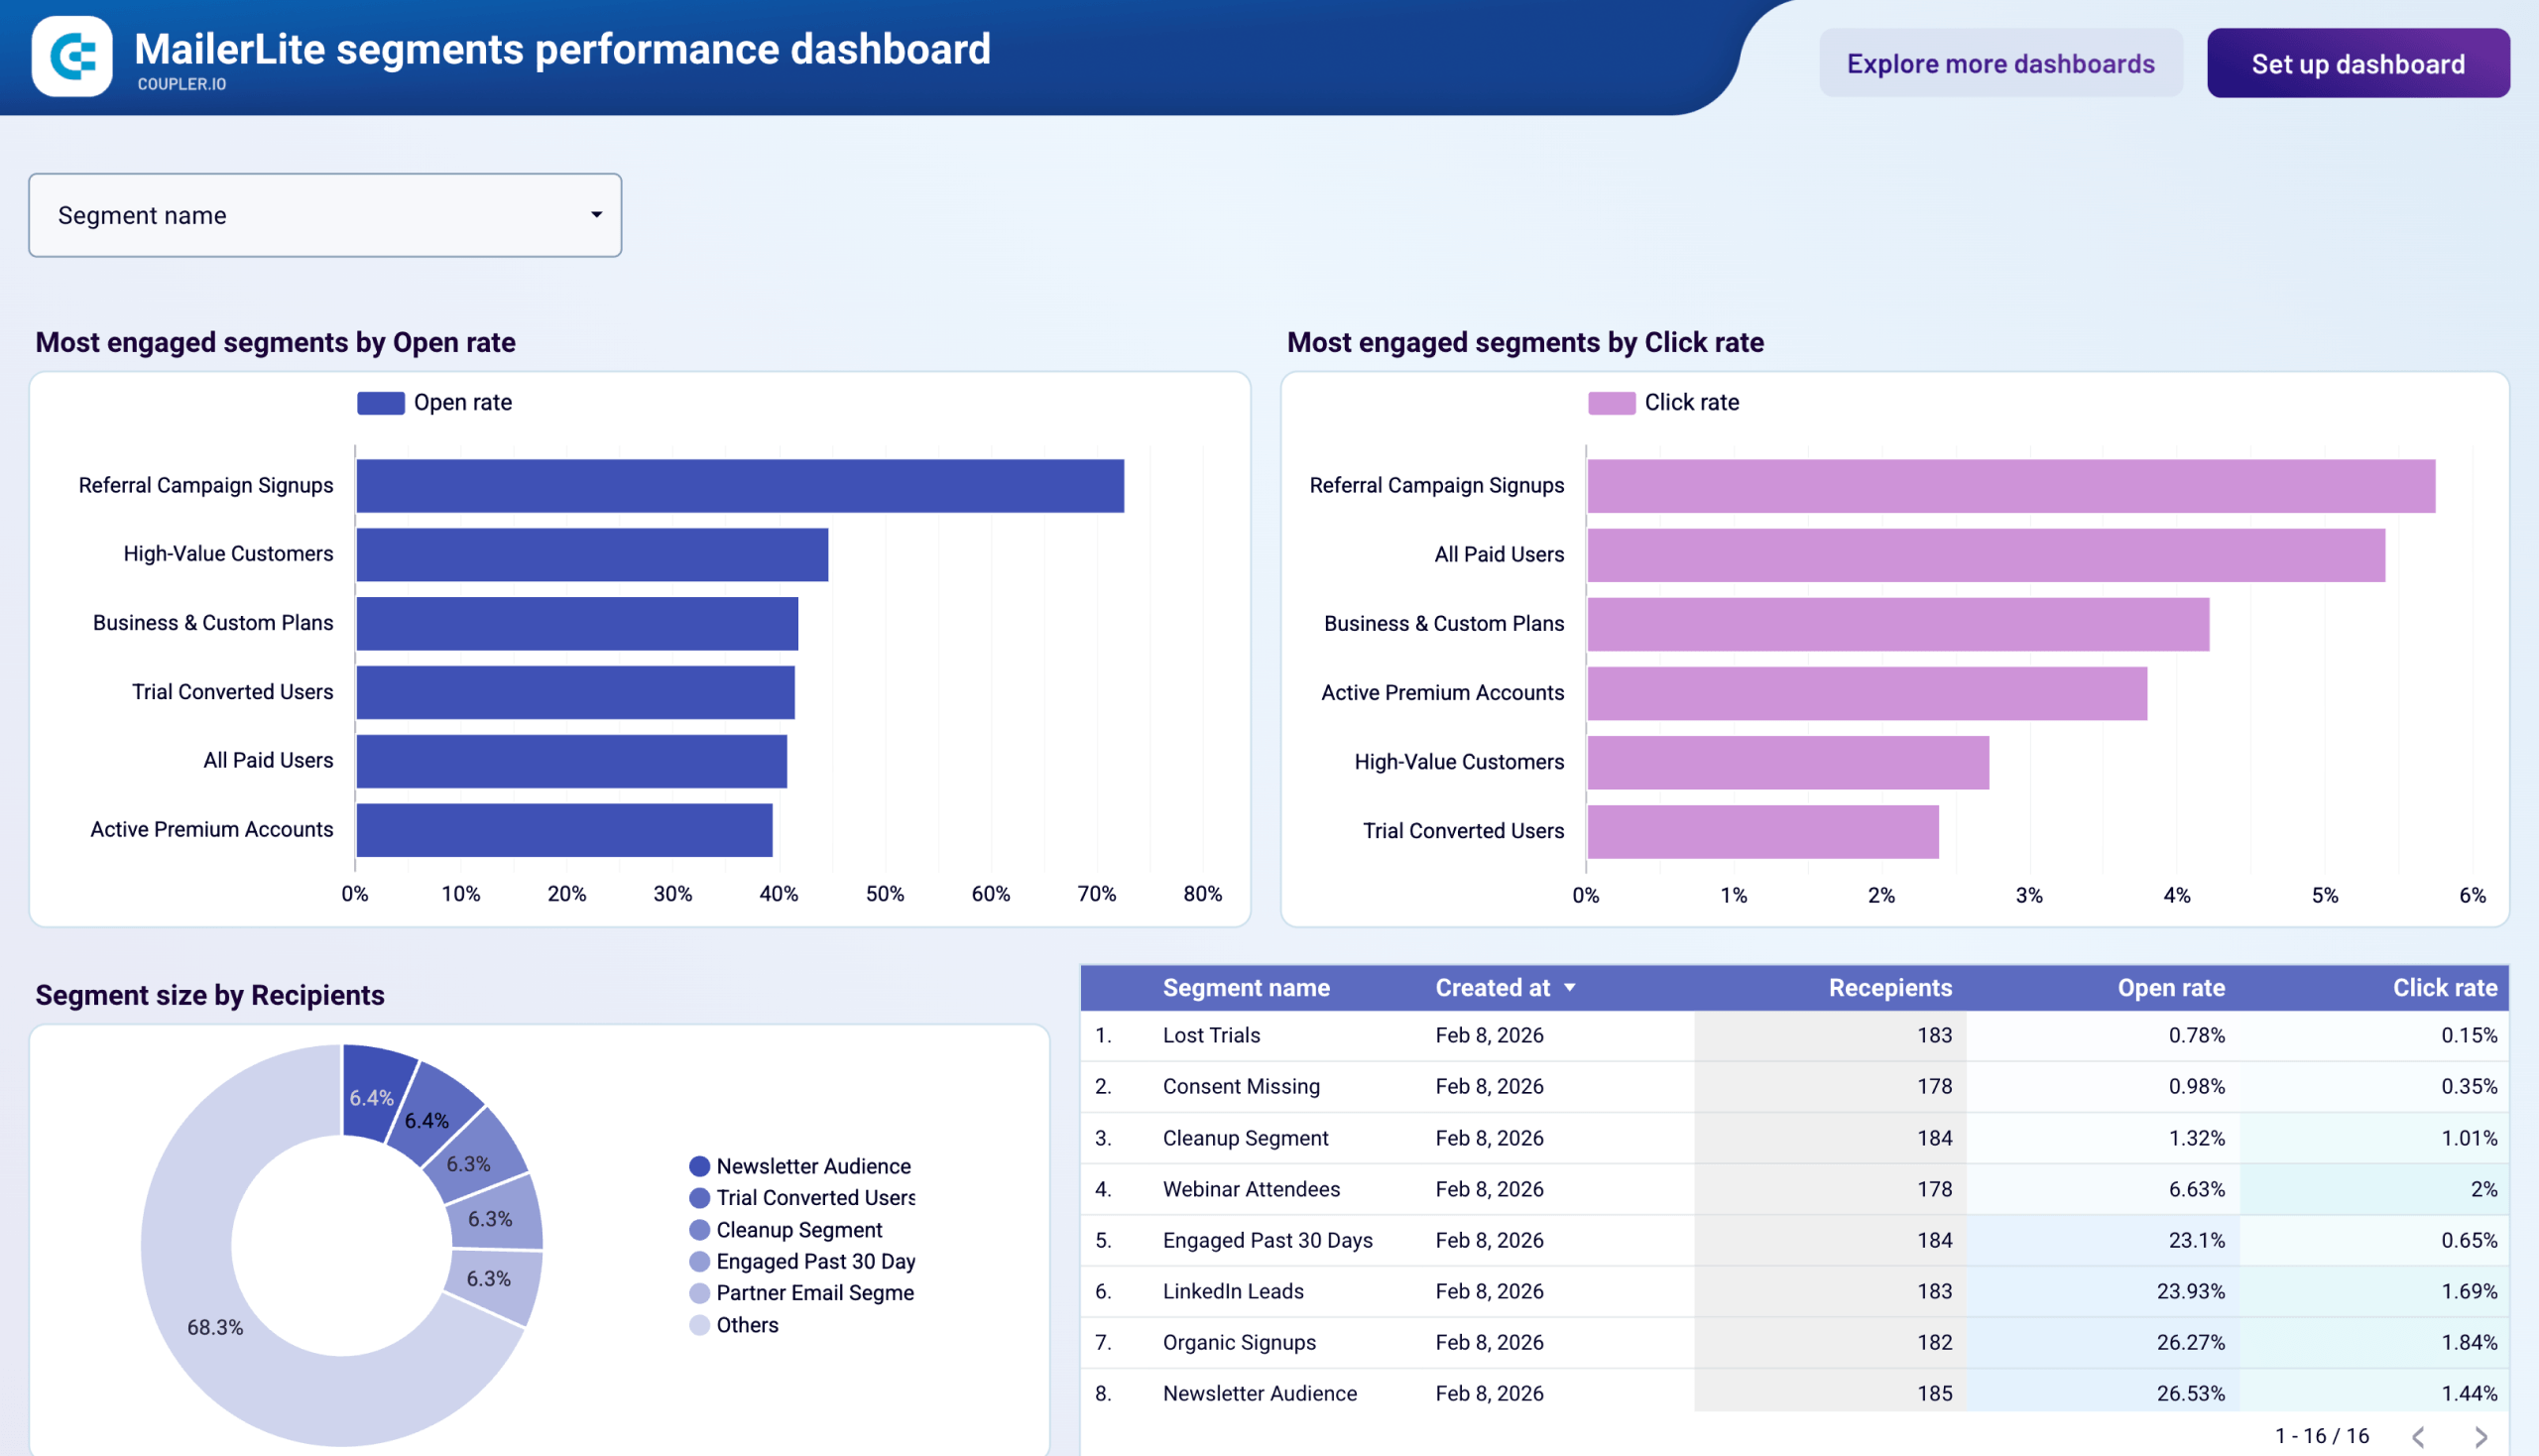
27. MailerLite segments performance report template
The MailerLite segments performance dashboard shows how different subscriber segments respond to your campaigns. Use it to find your most engaged audiences and identify groups that need re-engagement or list cleanup.
MailerLite segments performance dashboard
Preview dashboard
MailerLite segments performance dashboard
Preview dashboardThe report also shows the relative size of each segment, so you don’t overreact to strong engagement numbers from a group that represents a tiny fraction of your list. Filtering to a single segment lets you track how a newly created audience performs over its first few campaigns. You can rank all segments by open rate and click rate to see which groups are worth investing dedicated content into and which are hurting deliverability.
The template is available in Looker Studio with a Coupler.io connector.
Report metrics:
- Open rate (per segment)
- Click rate (per segment)
- Recipients (per segment)
Website & traffic analytics report templates
Understanding where your website traffic comes from and how visitors behave is fundamental to digital marketing success. These templates help you analyze traffic sources, monitor SEO performance, and understand the impact of AI on your organic traffic.
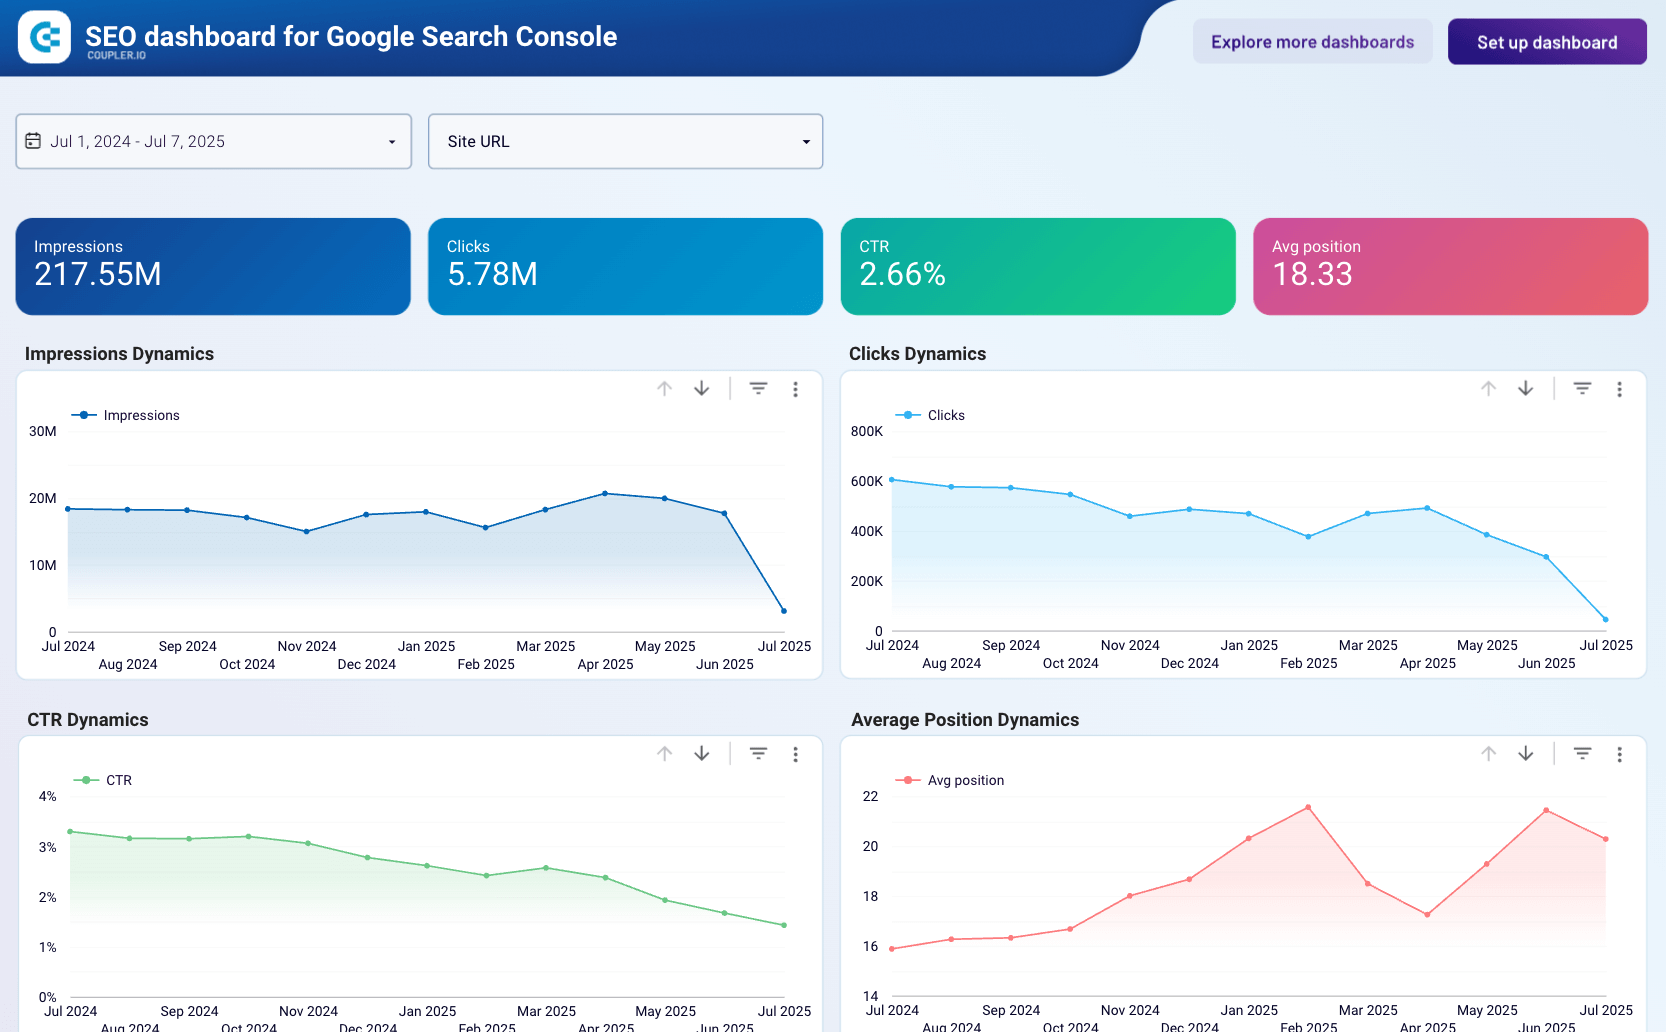
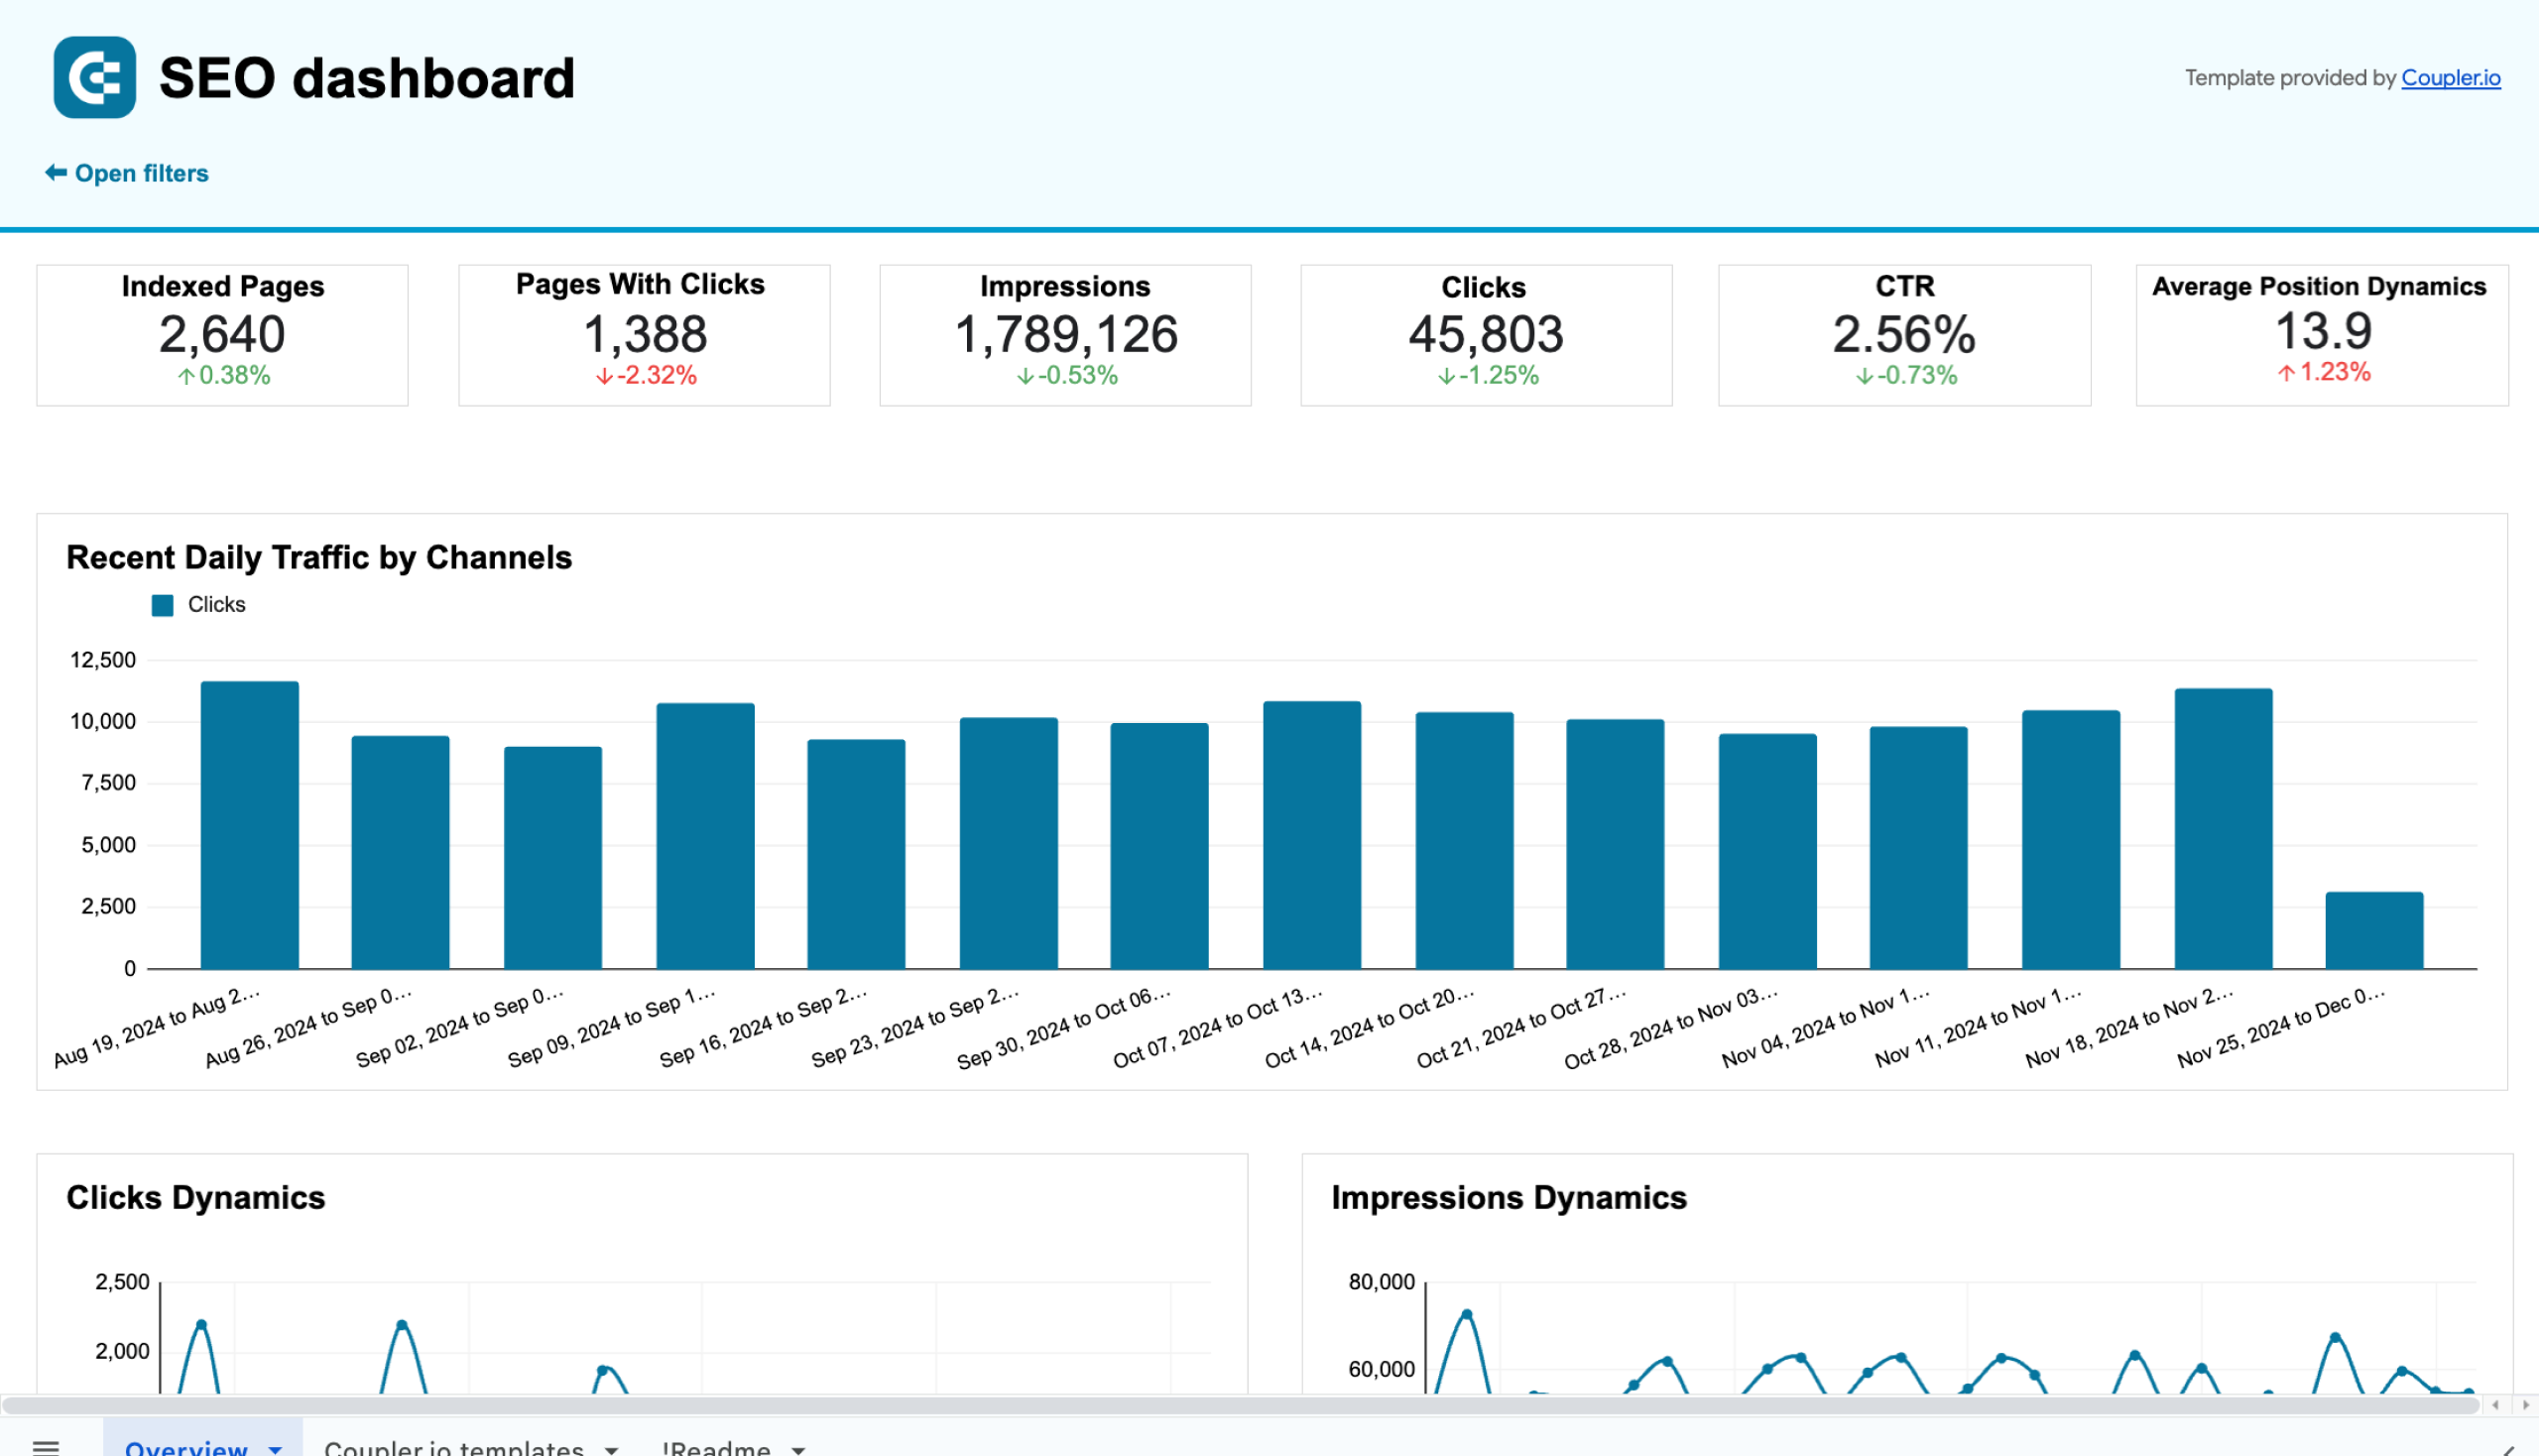
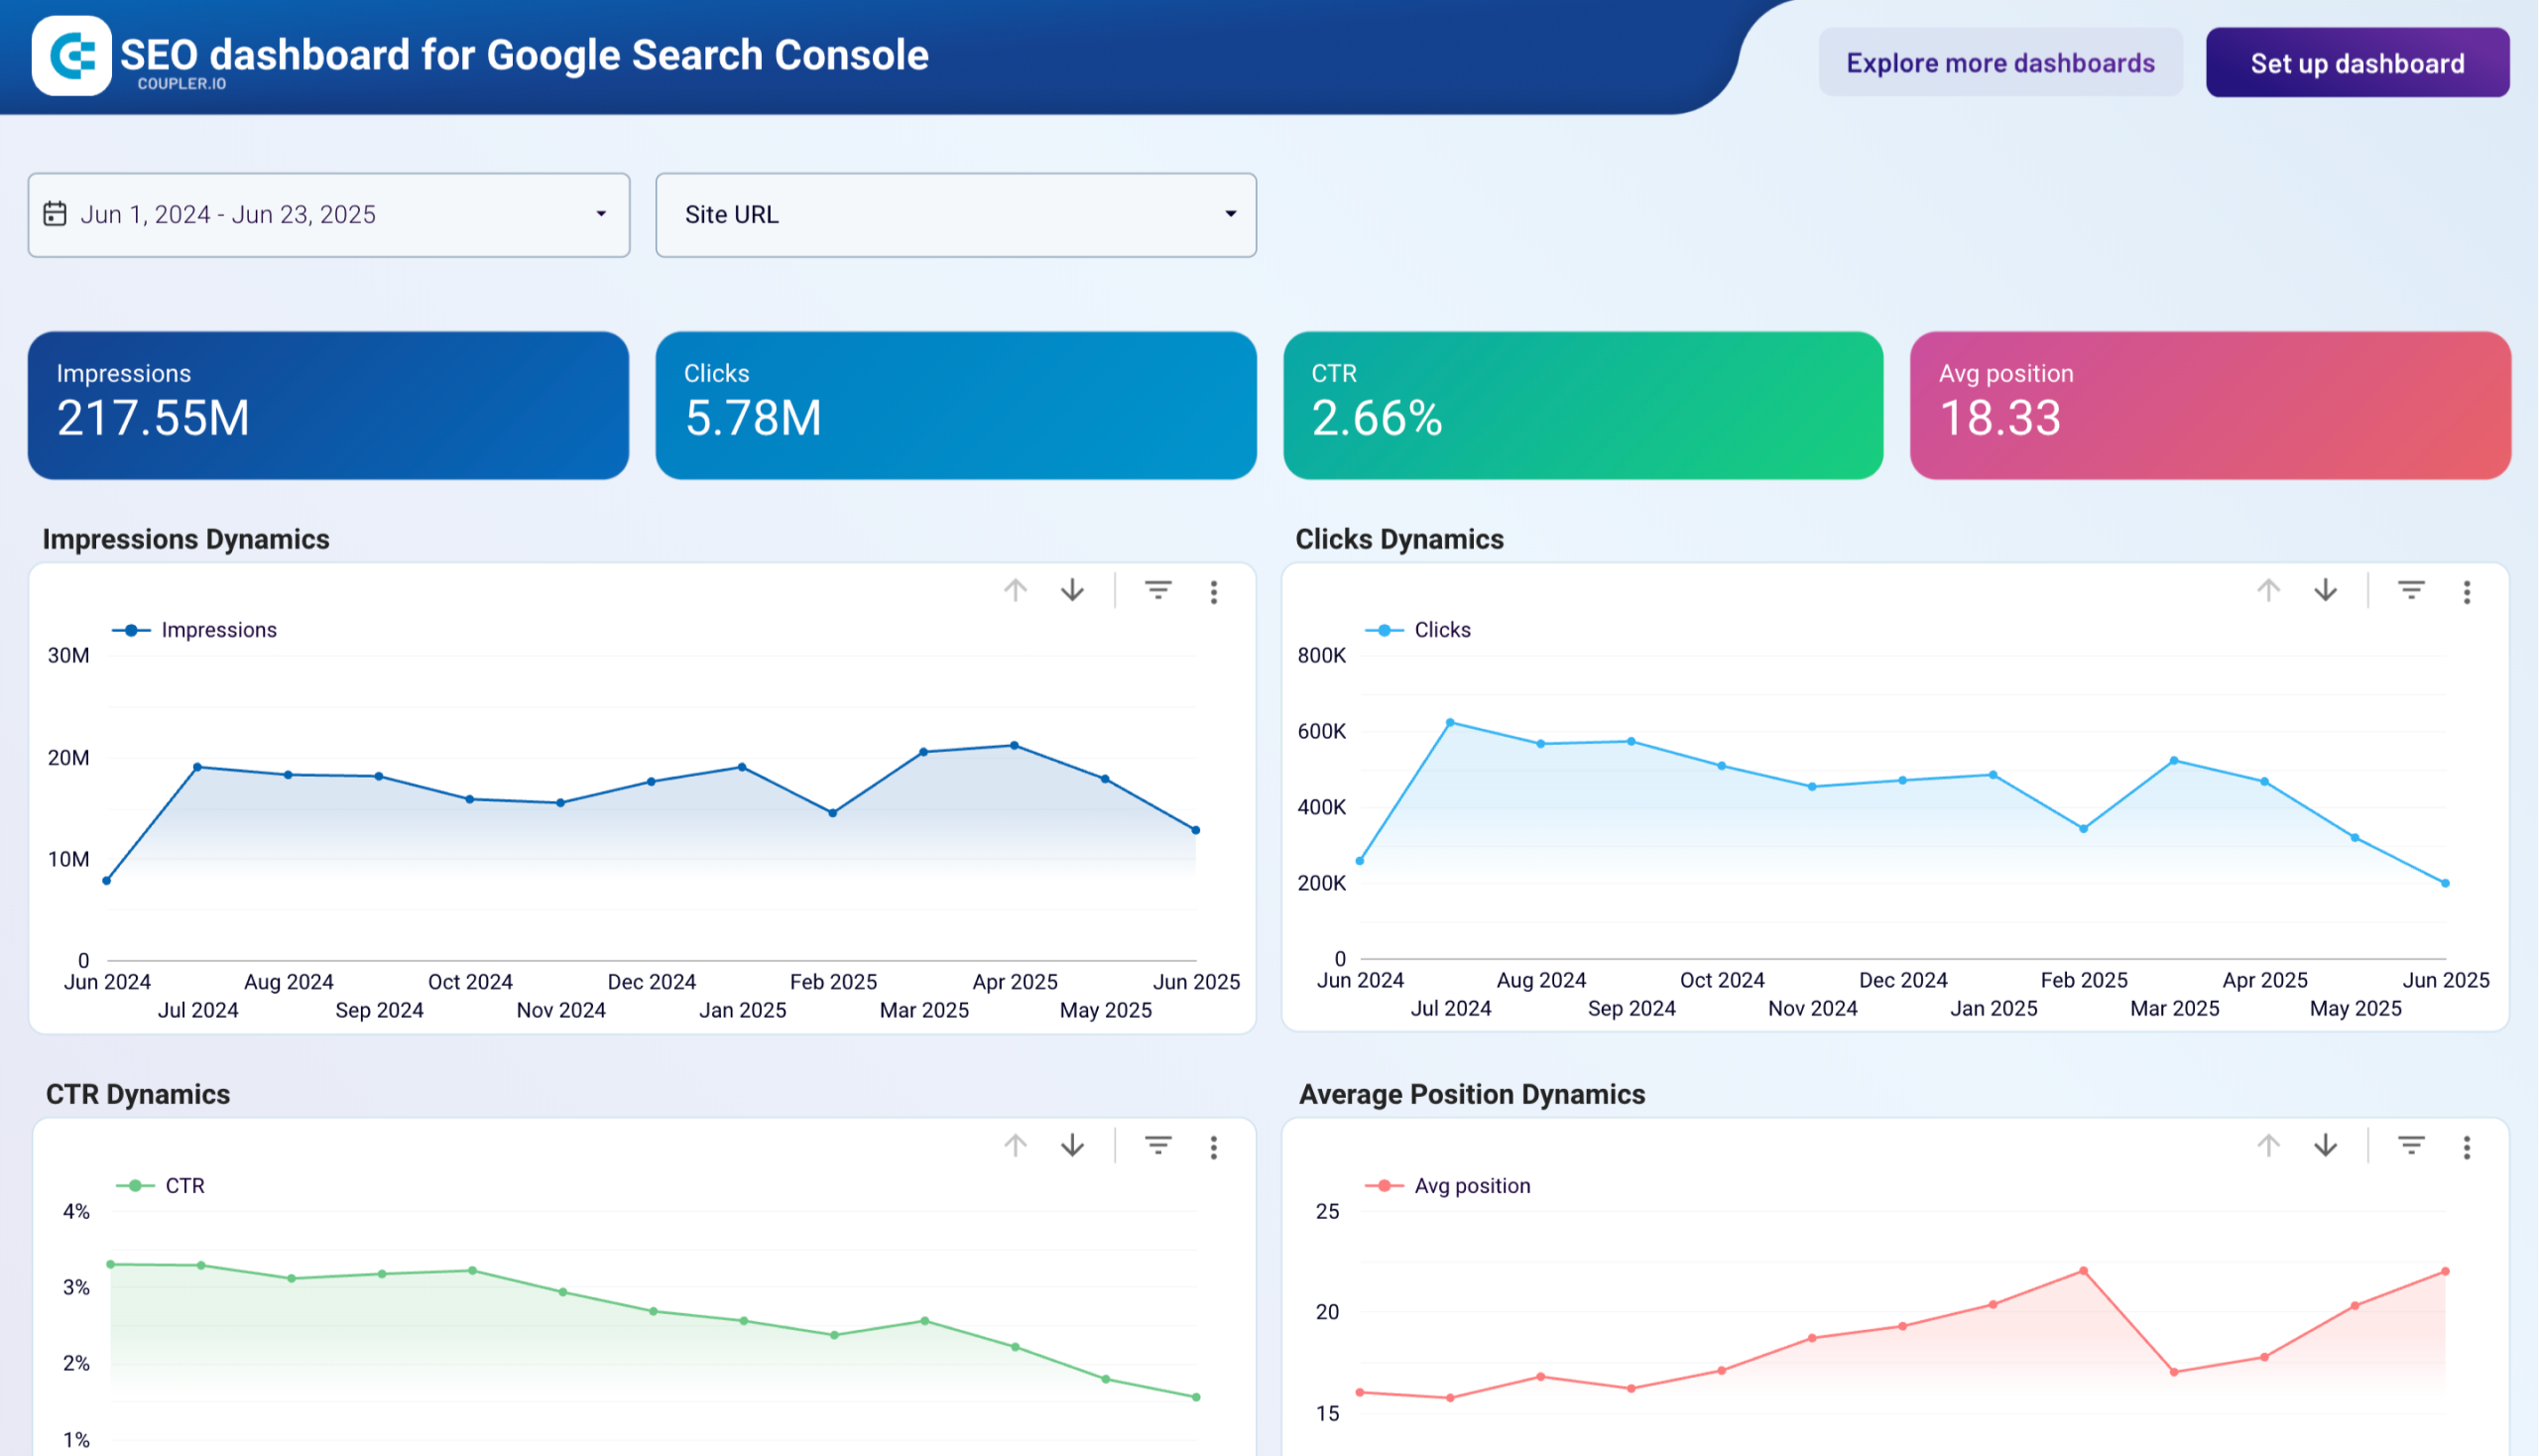
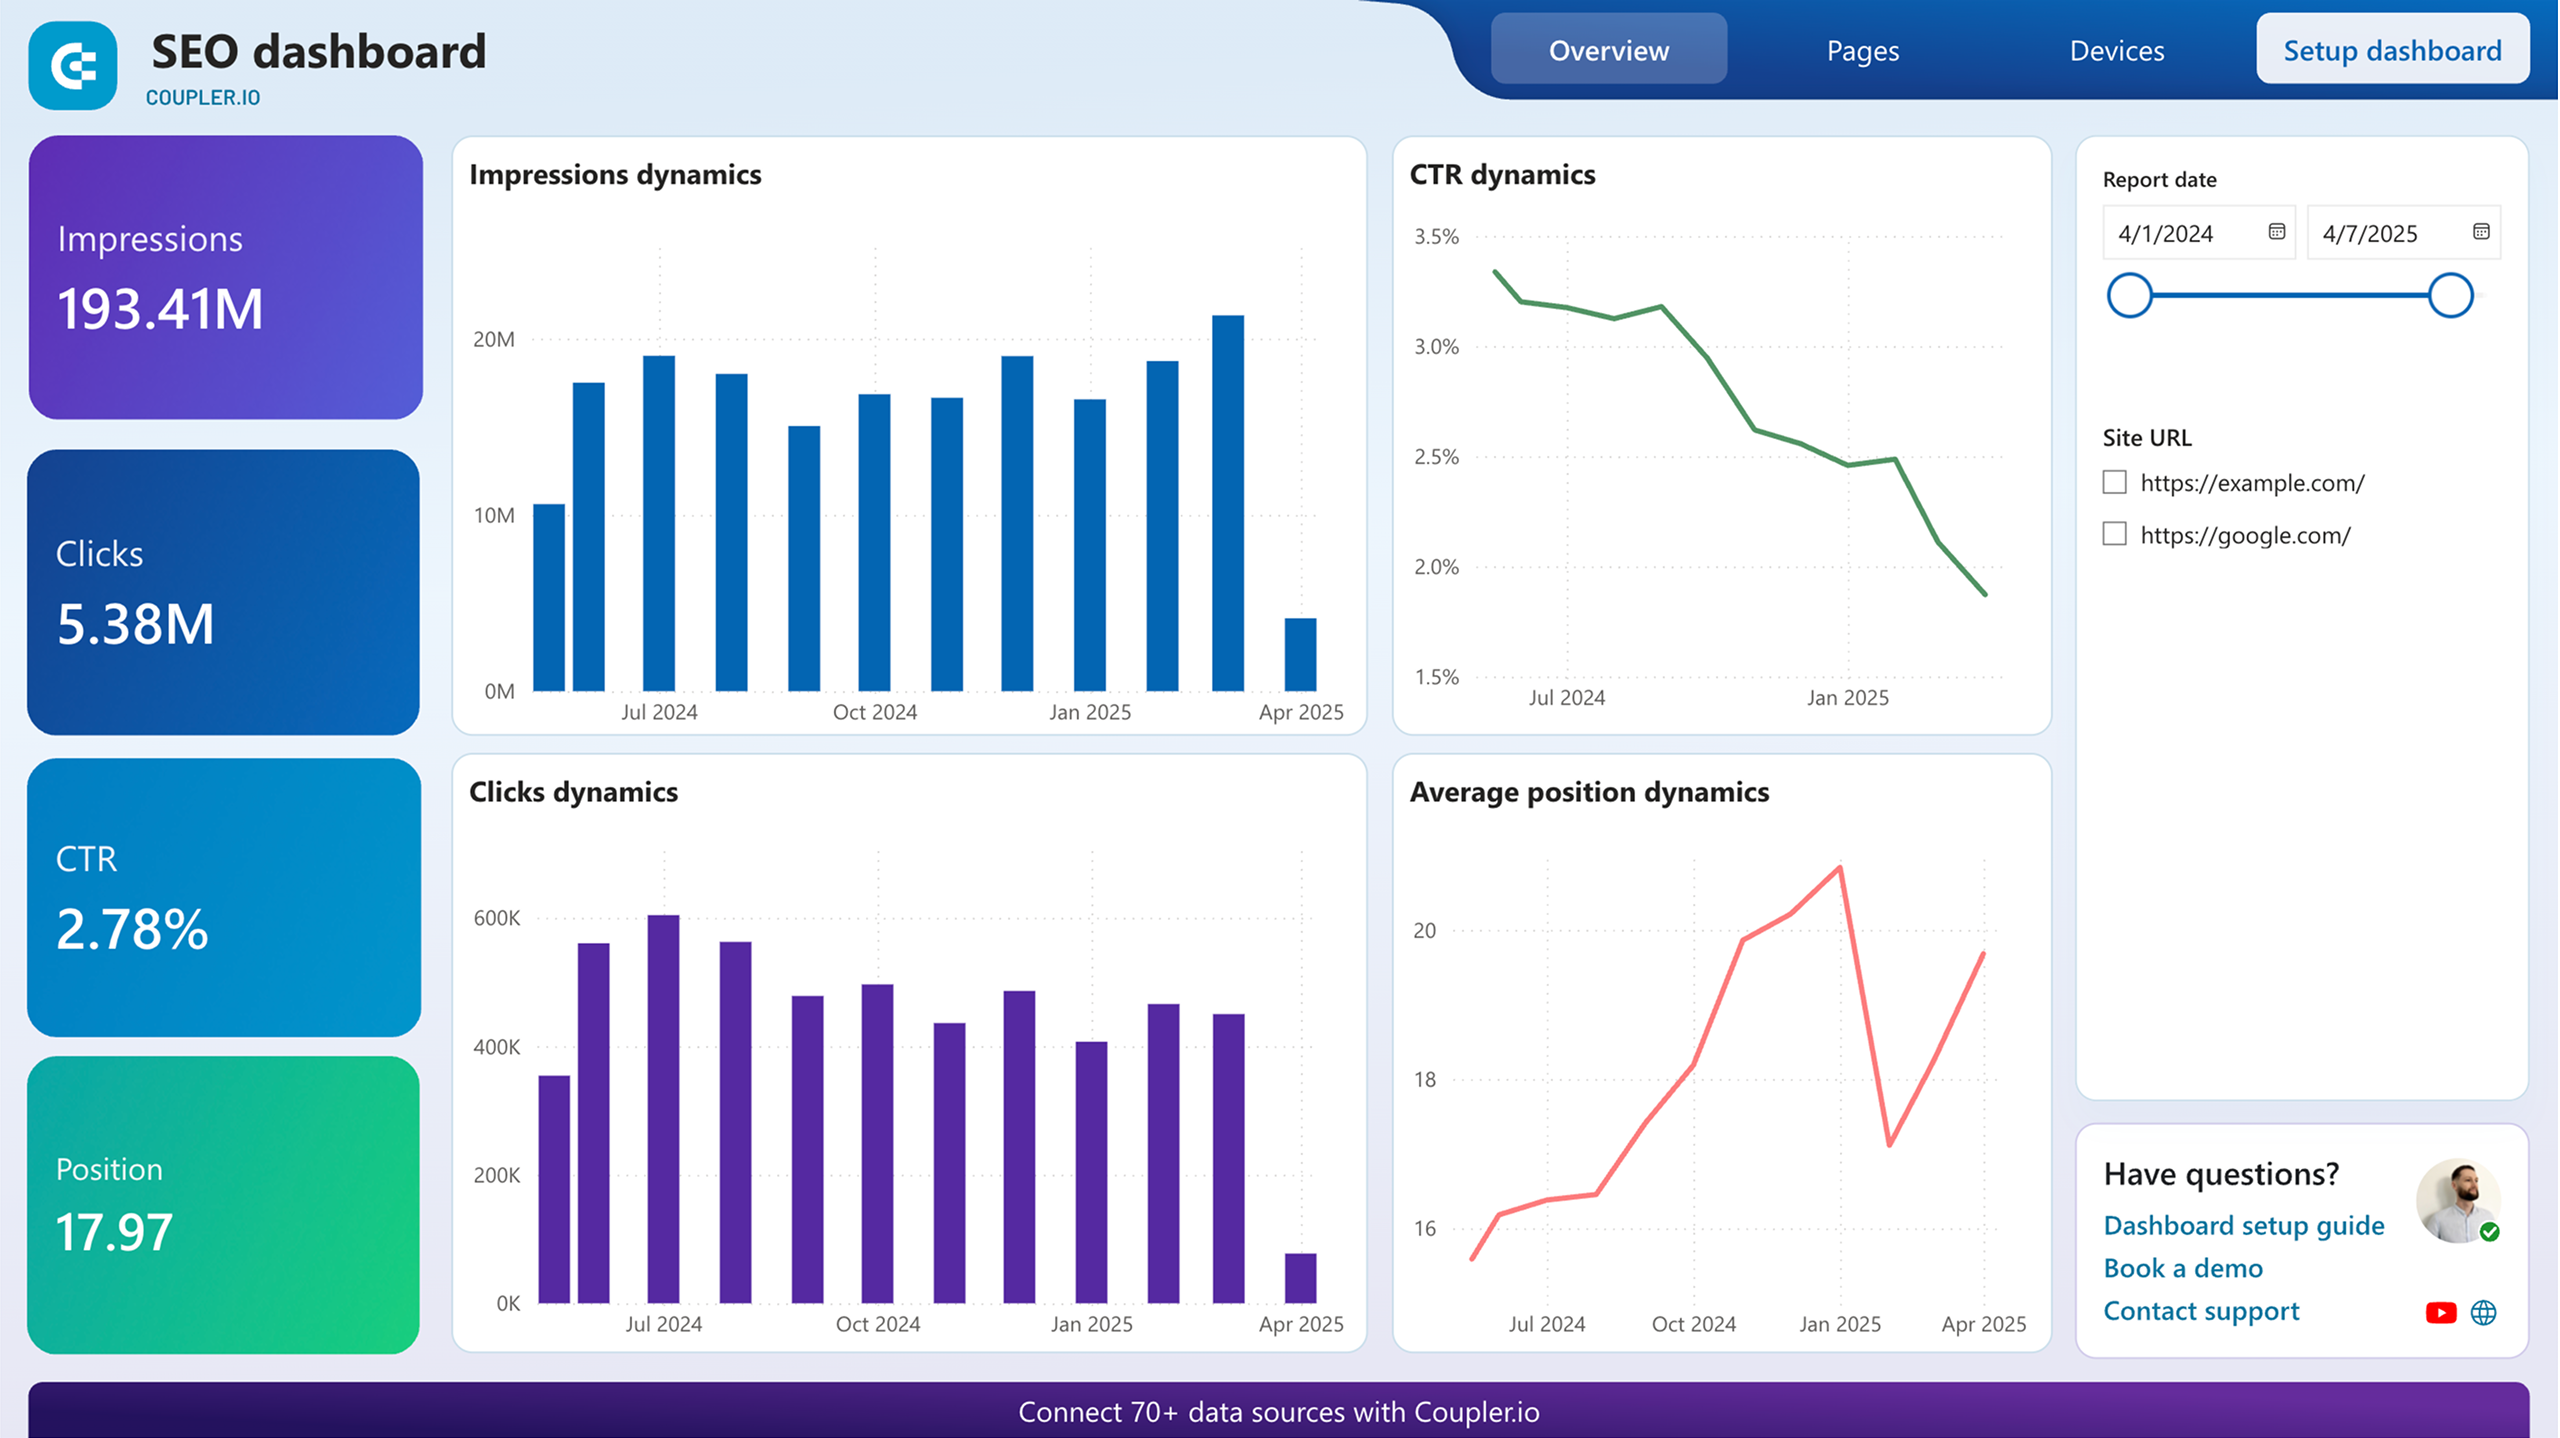
28. SEO report template
Search Engine Optimization is an important part of the whole marketing strategy. This is why it deserves a detailed report. Here’s an example of an SEO marketing reporting template by Coupler.io.
SEO dashboard for Google Search Console
 Preview dashboard
SEO dashboard for Google Search Console
Preview dashboardThis dashboard template allows you to track page rankings, click-through rate, the dynamics of impressions and clicks, and obtain many other valuable insights. The report gets data from the Google Seach Console with the help of the built-in Coupler.io connector.
Report metrics:
- Indexed pages
- Pages with clicks
- Impressions
- Clicks
- CTR
- Average position
- Click dynamics
- Best and worst performing URLs, etc.
The dashboard template is available for Google Sheets, Looker Studio, and Power BI. Pick the version that meets your reporting needs and try it out.
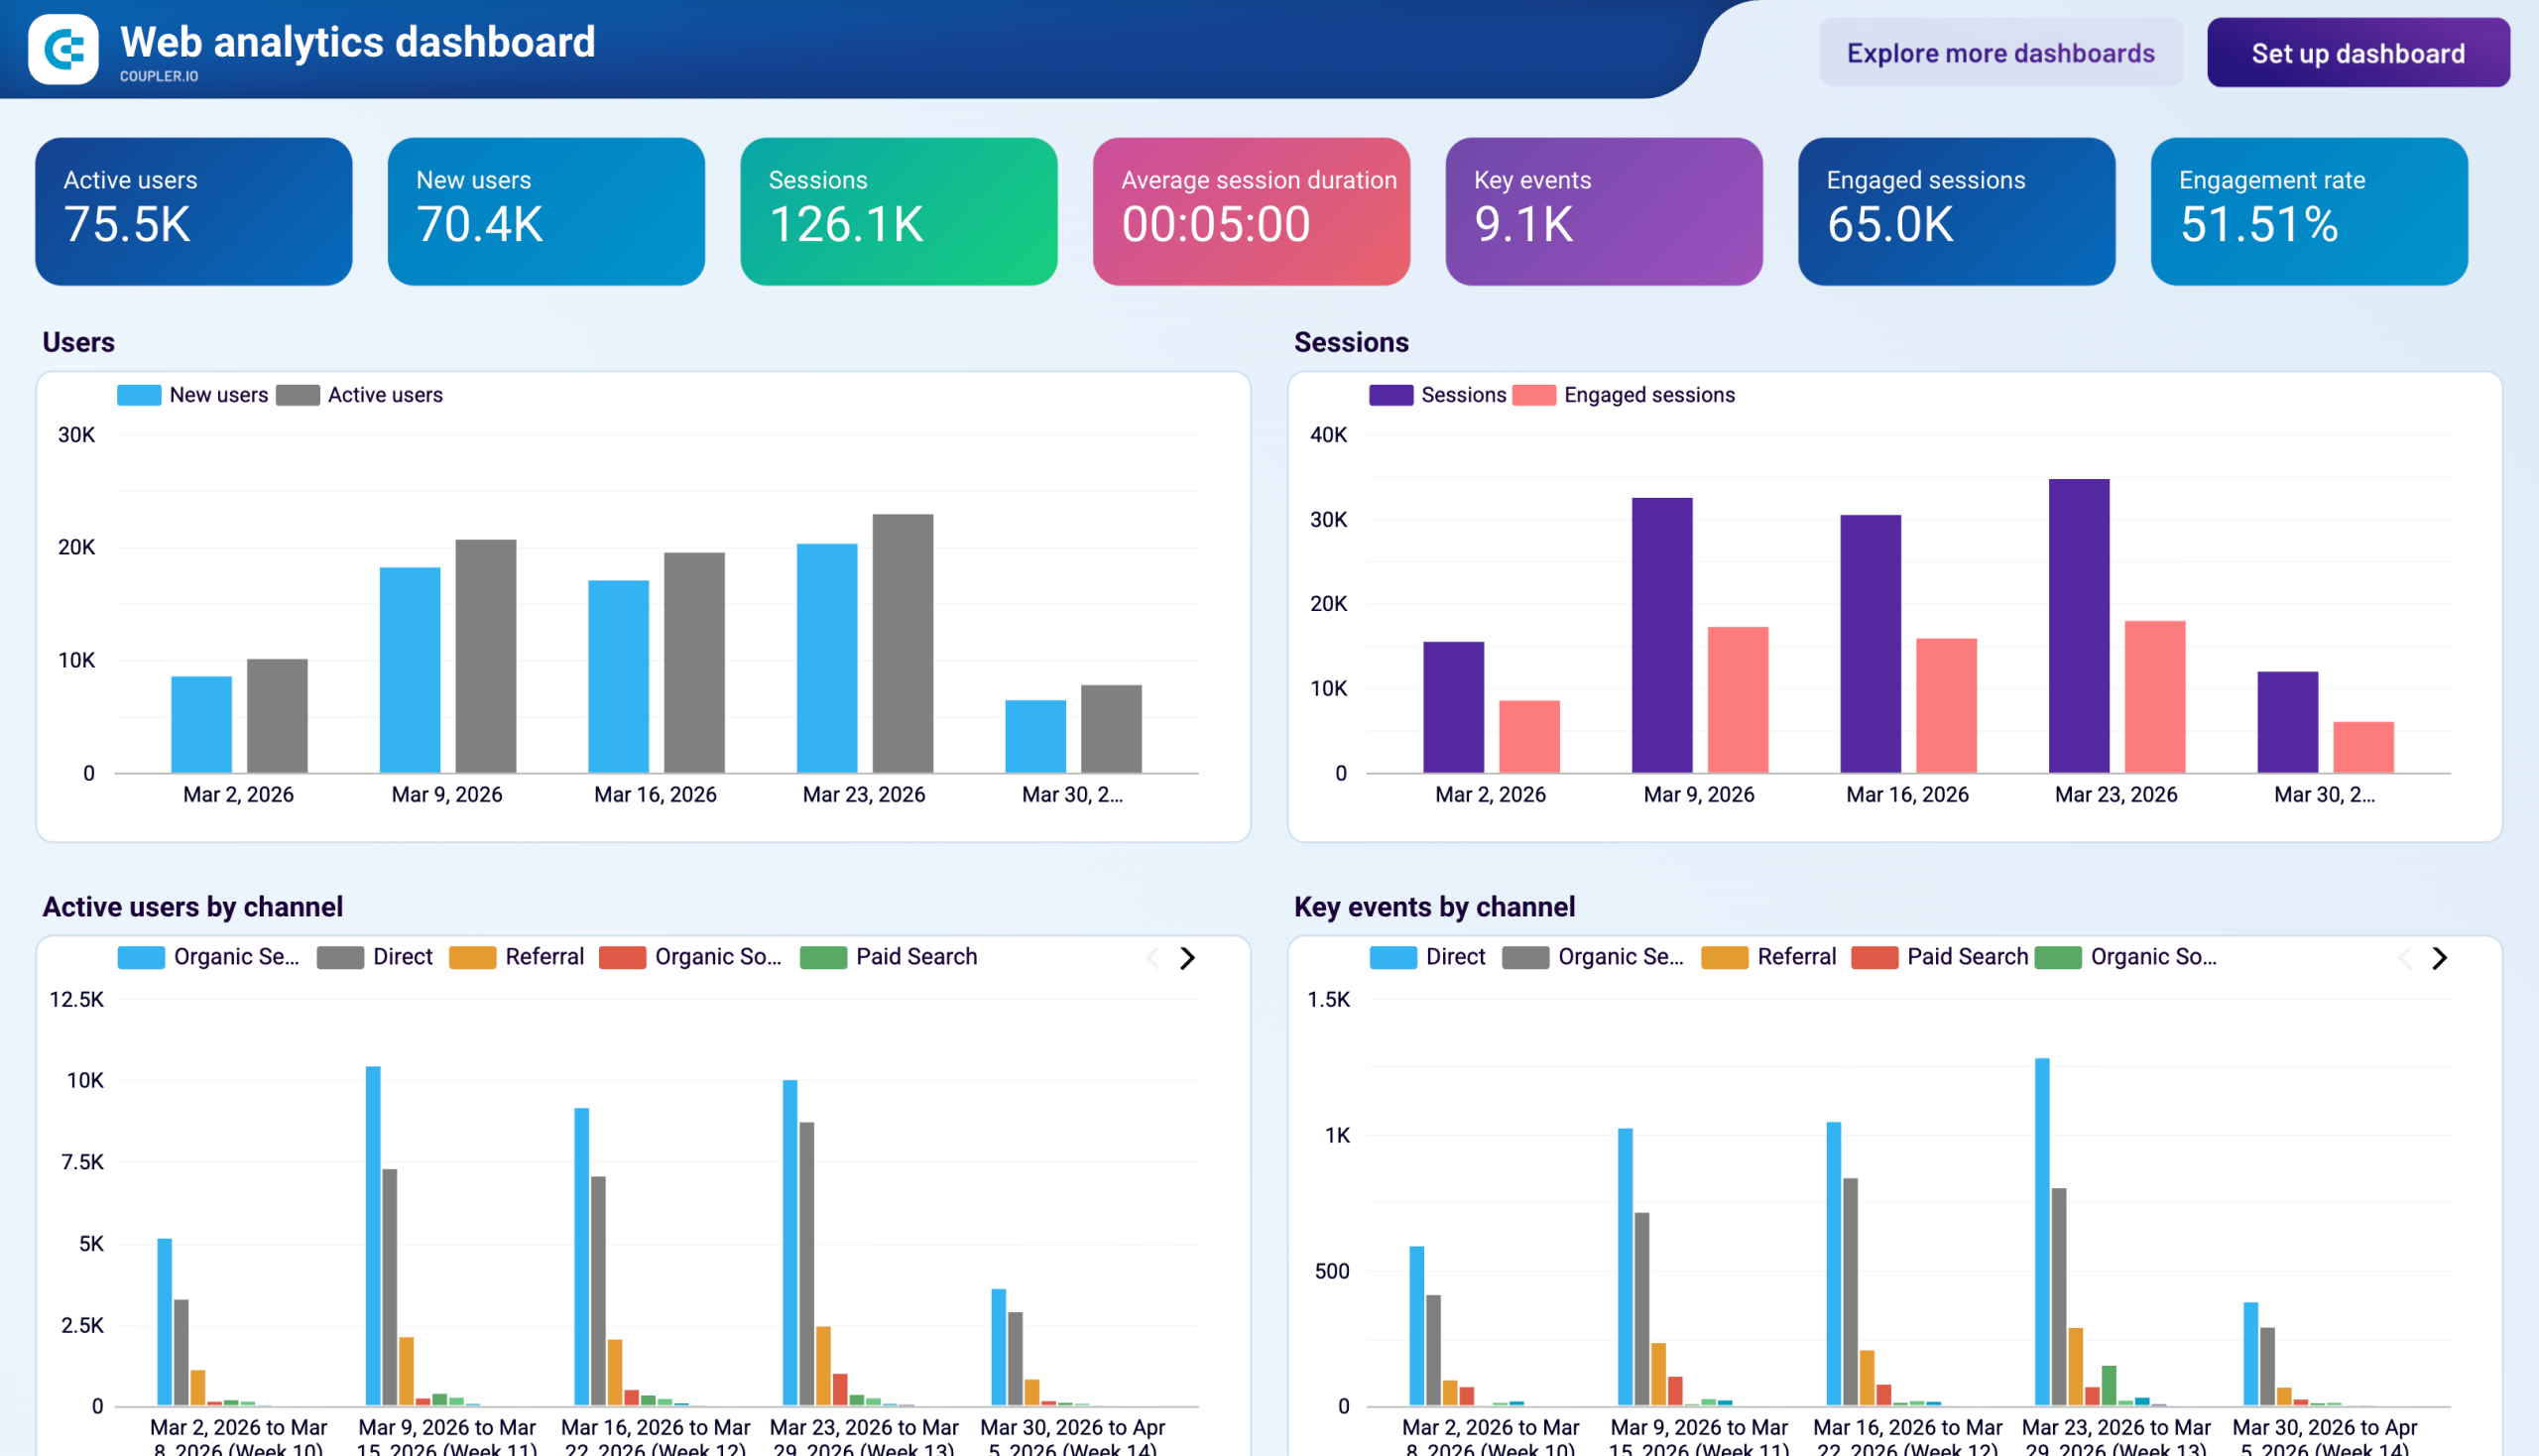
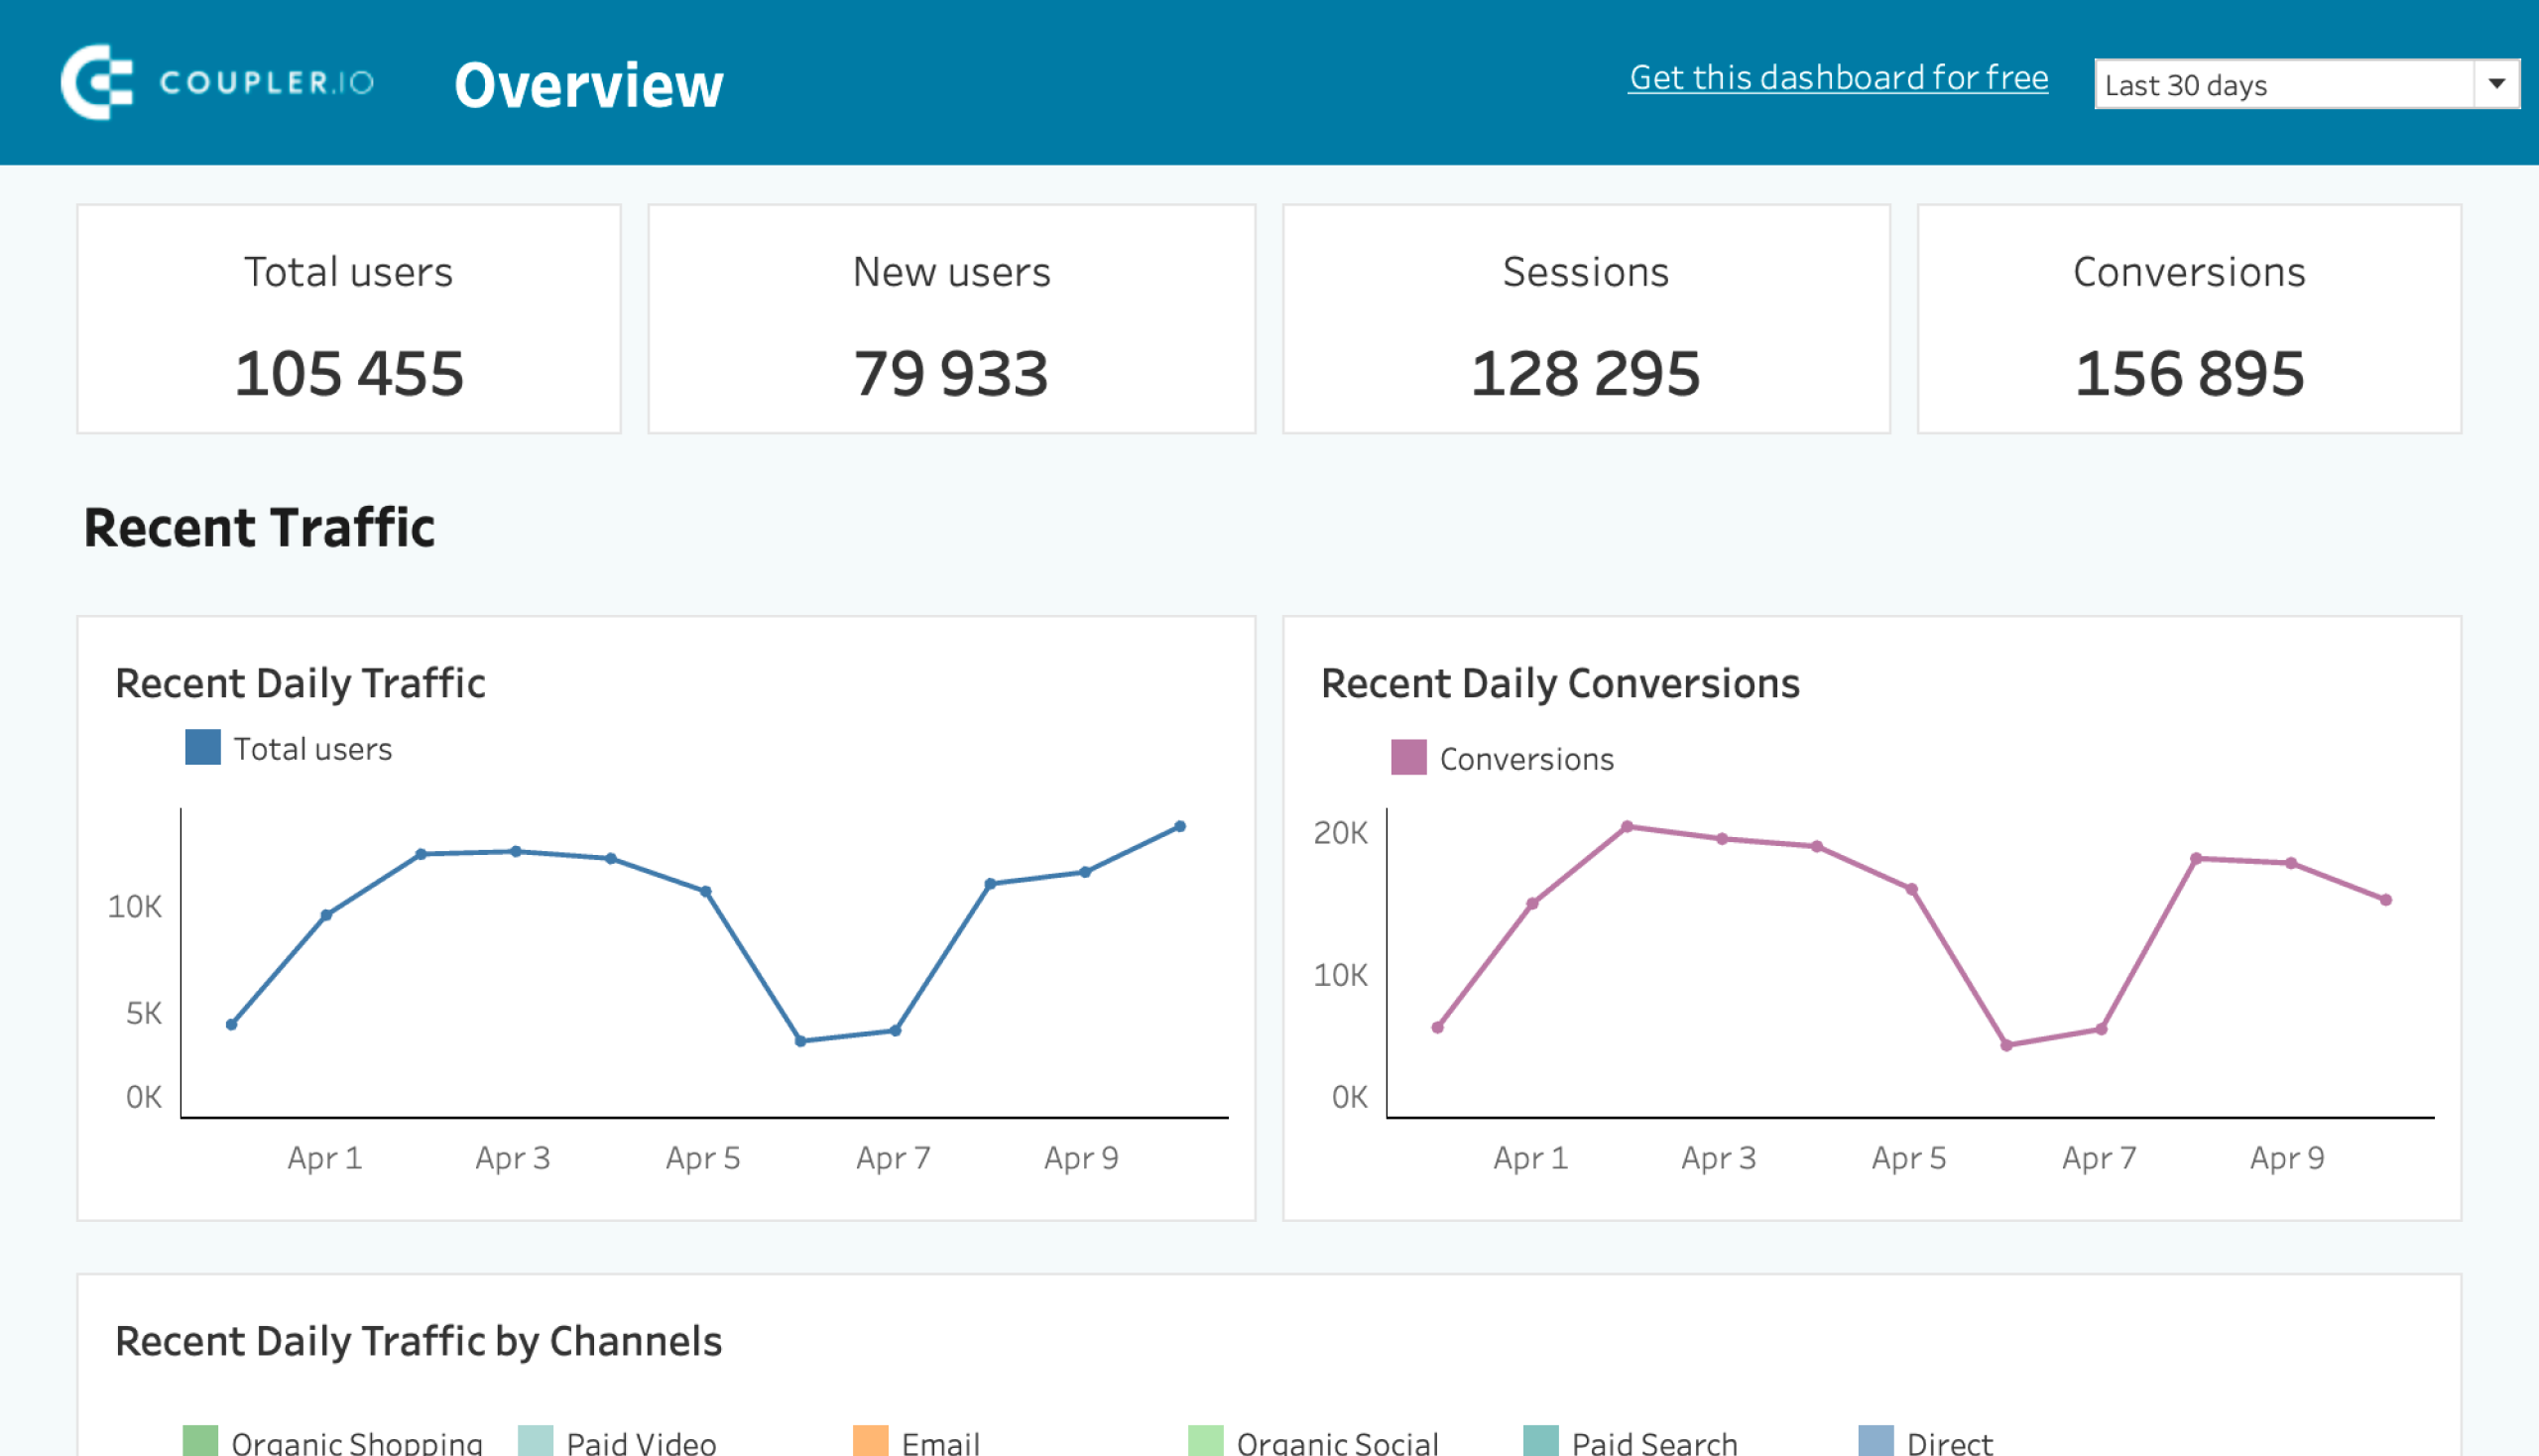
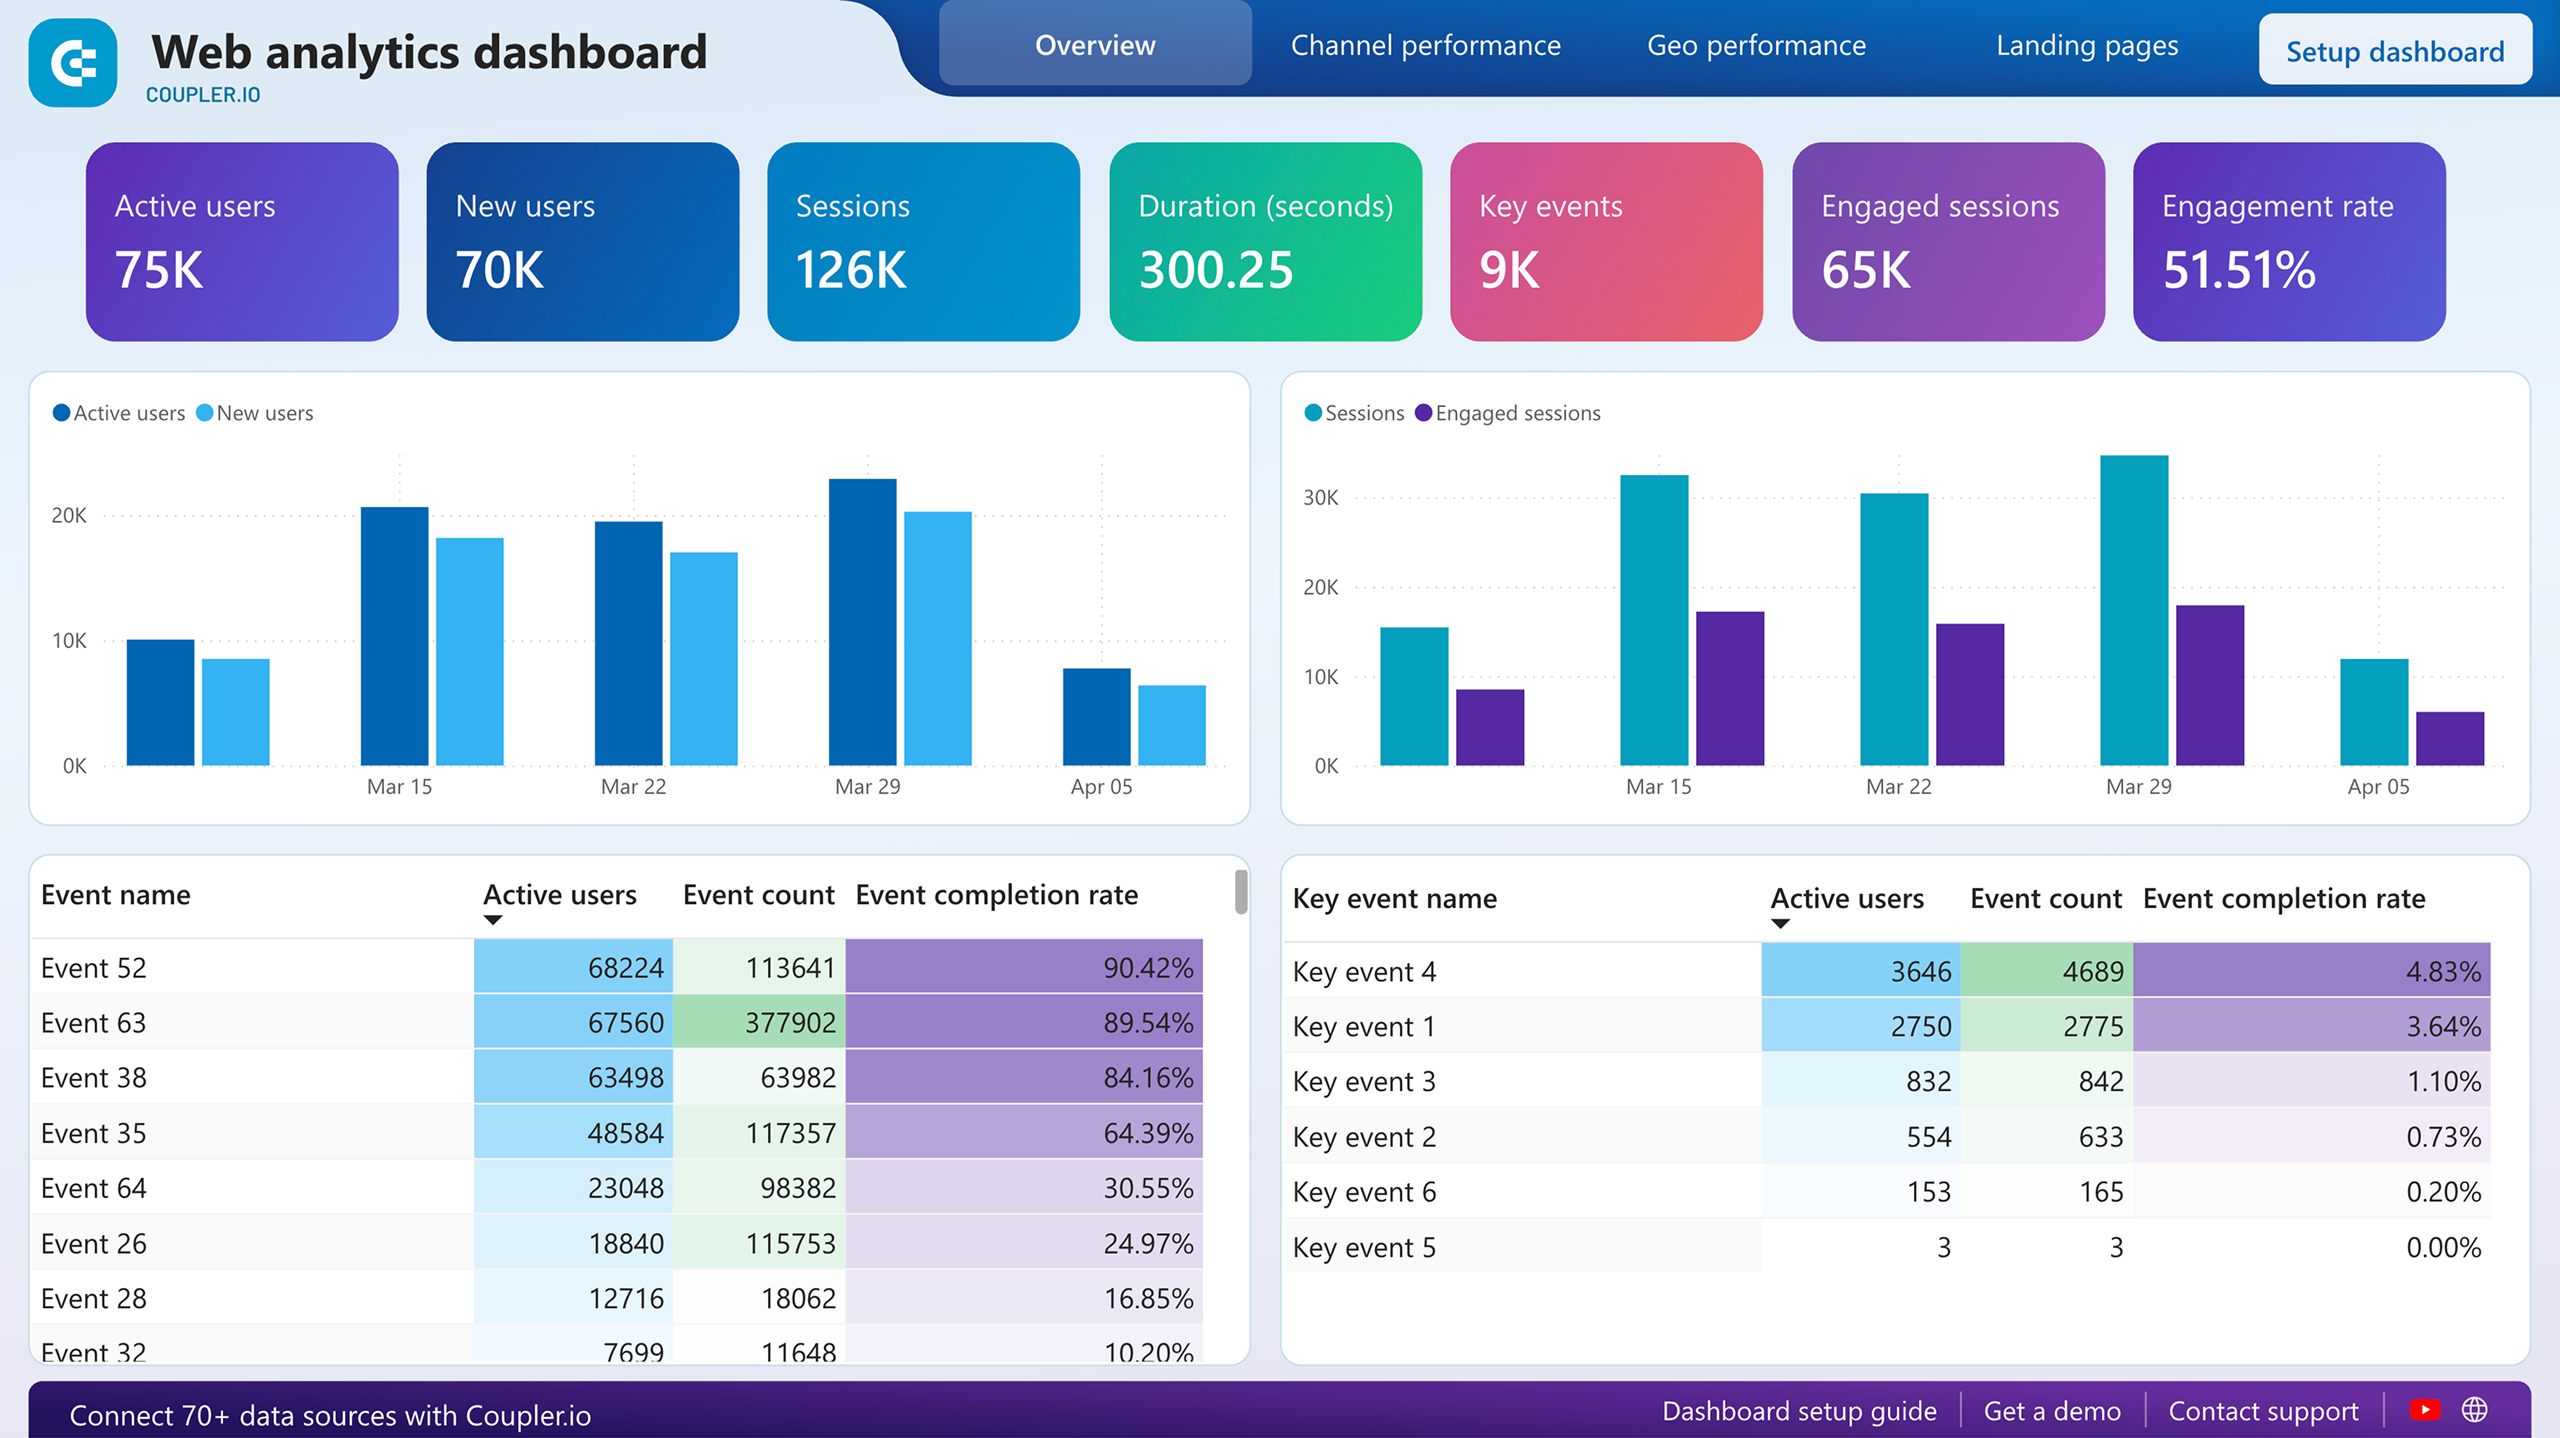
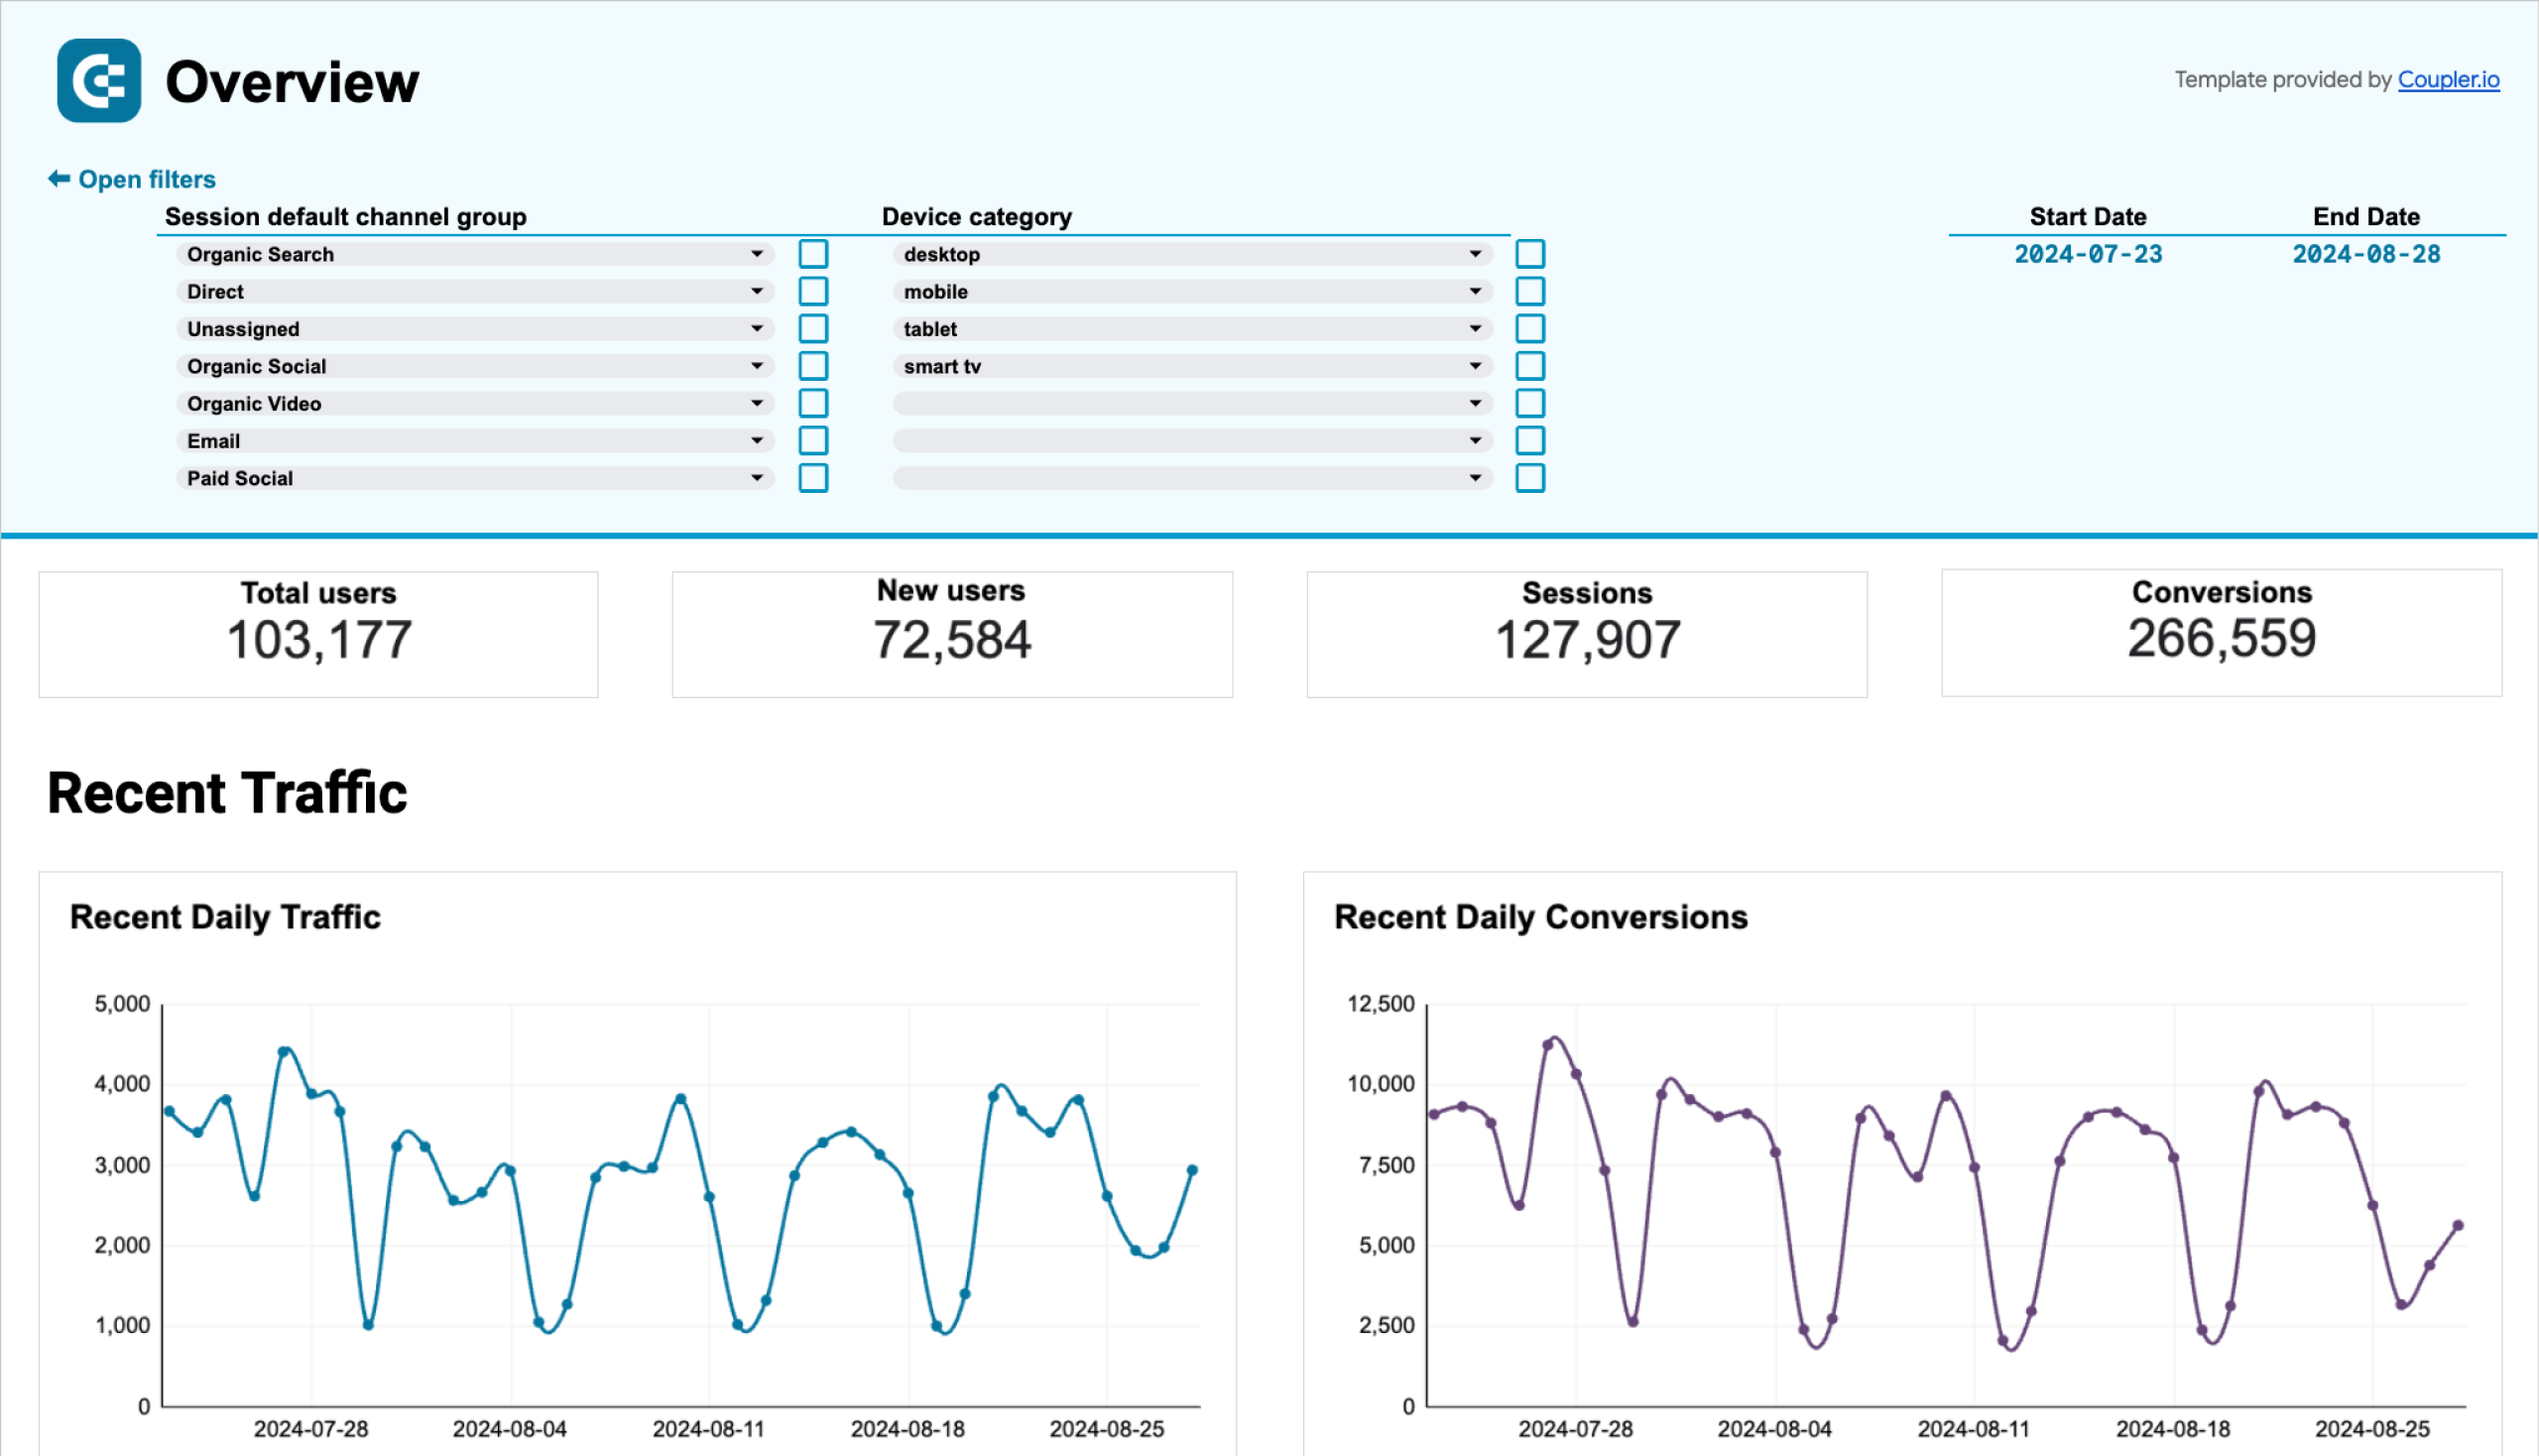
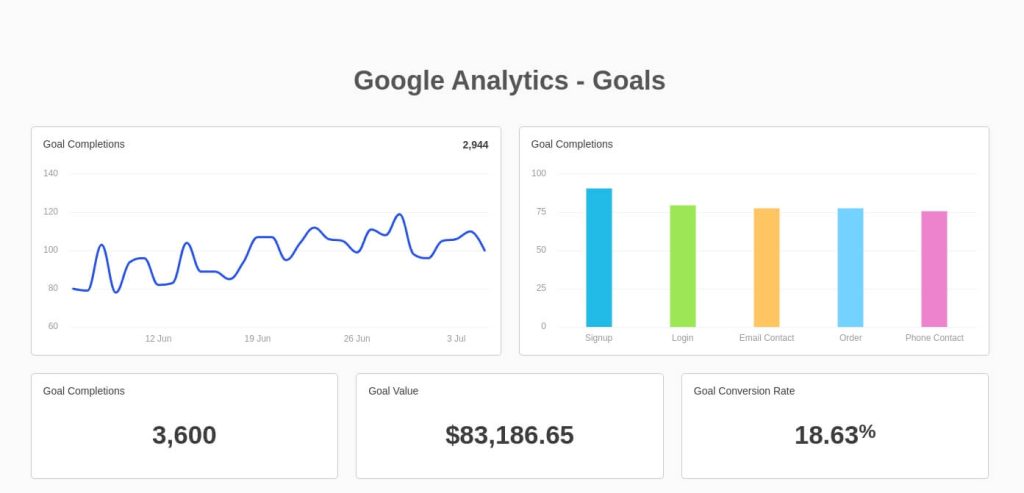
29. Web analytics report template
If you need a website visit overview, you usually go to GA4. But there is a better option – the web analytics report by Coupler.io. It’s designed for multiple reporting tools and connected to GA4. However, the data is shown in a more digestible way so you can easily derive insights on user categories, track conversion funnel and analyze pages by key web analytics metrics.
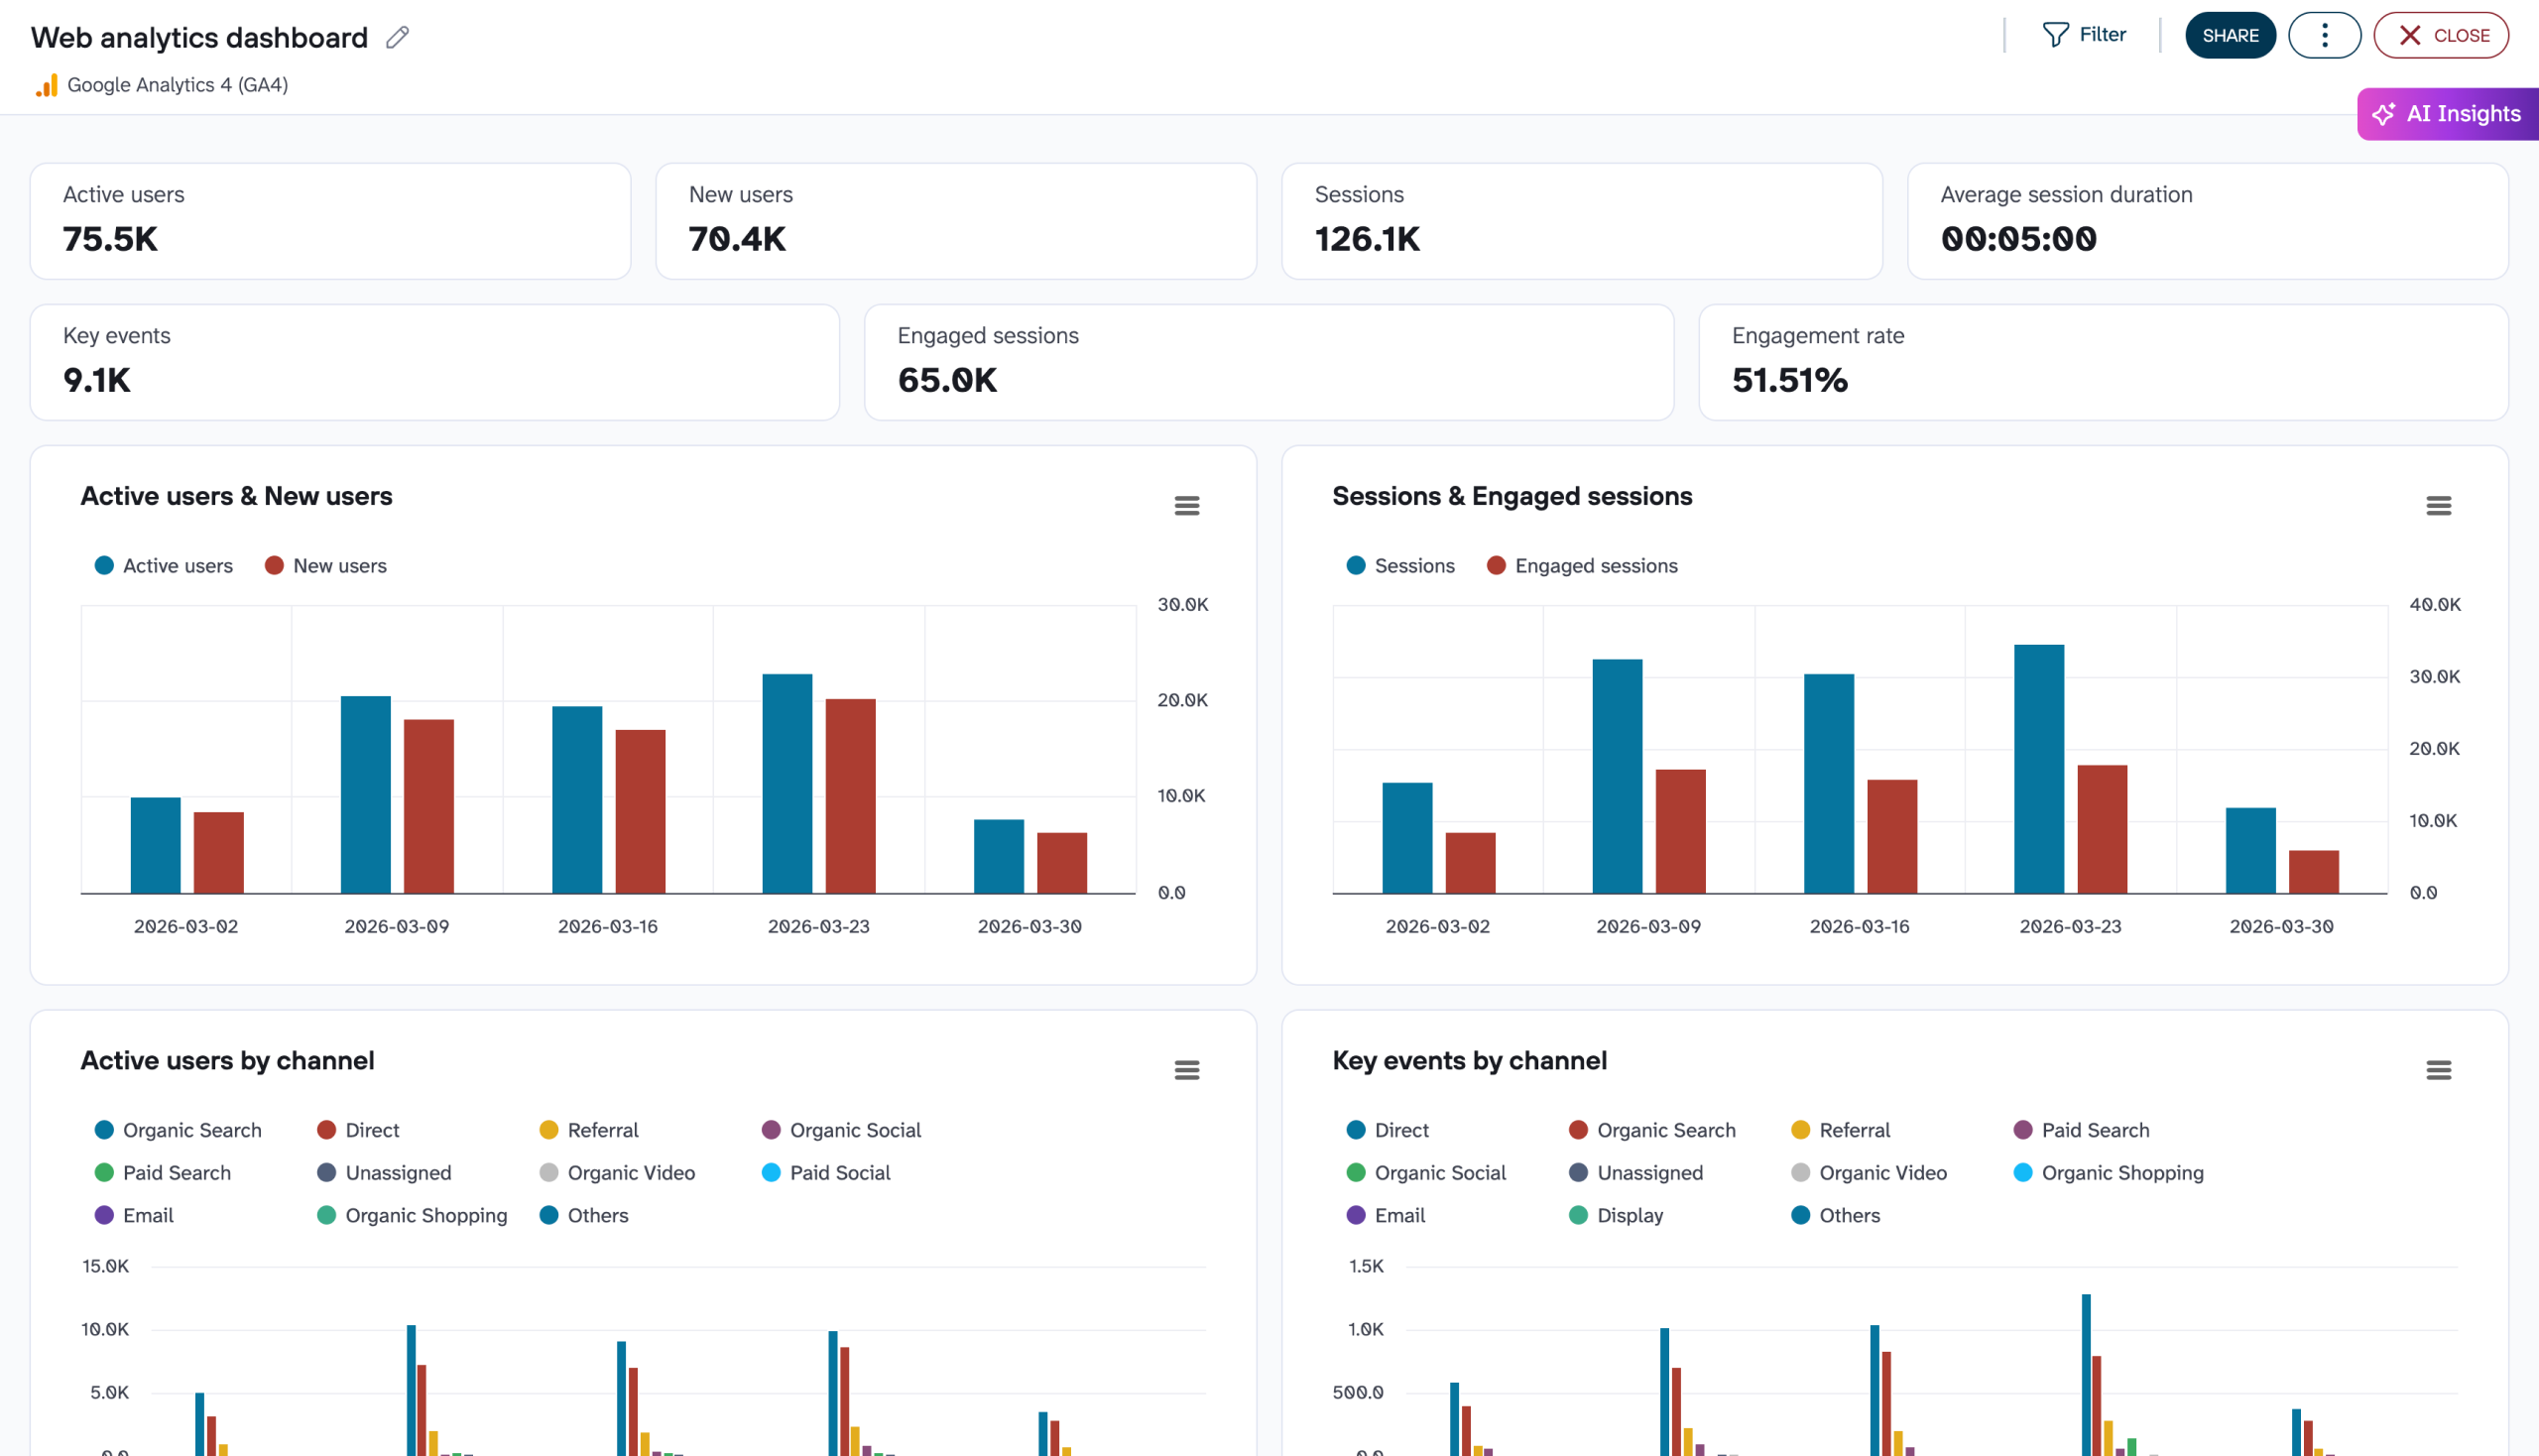
With this template, you can see how many people are visiting your website, the channels and mediums they are coming in from, and how much time they spend on your website. Also, you can track metrics like New Sessions, Goal Completions, and Demographics of your ecommerce from Google Analytics.
The template easily connects to your GA4 account with the help of Coupler.io. It takes up to 2 minutes to get it populated with your data, so give it a shot.
Report metrics:
- Users
- New users
- Sessions
- Conversions
- Views per session
- Session average duration
- Bounce rate
The dashboard template is available in Coupler.io, Google Sheets, Data Studio, Tableau, and Power BI. Pick the version that meets your reporting needs and try it out.
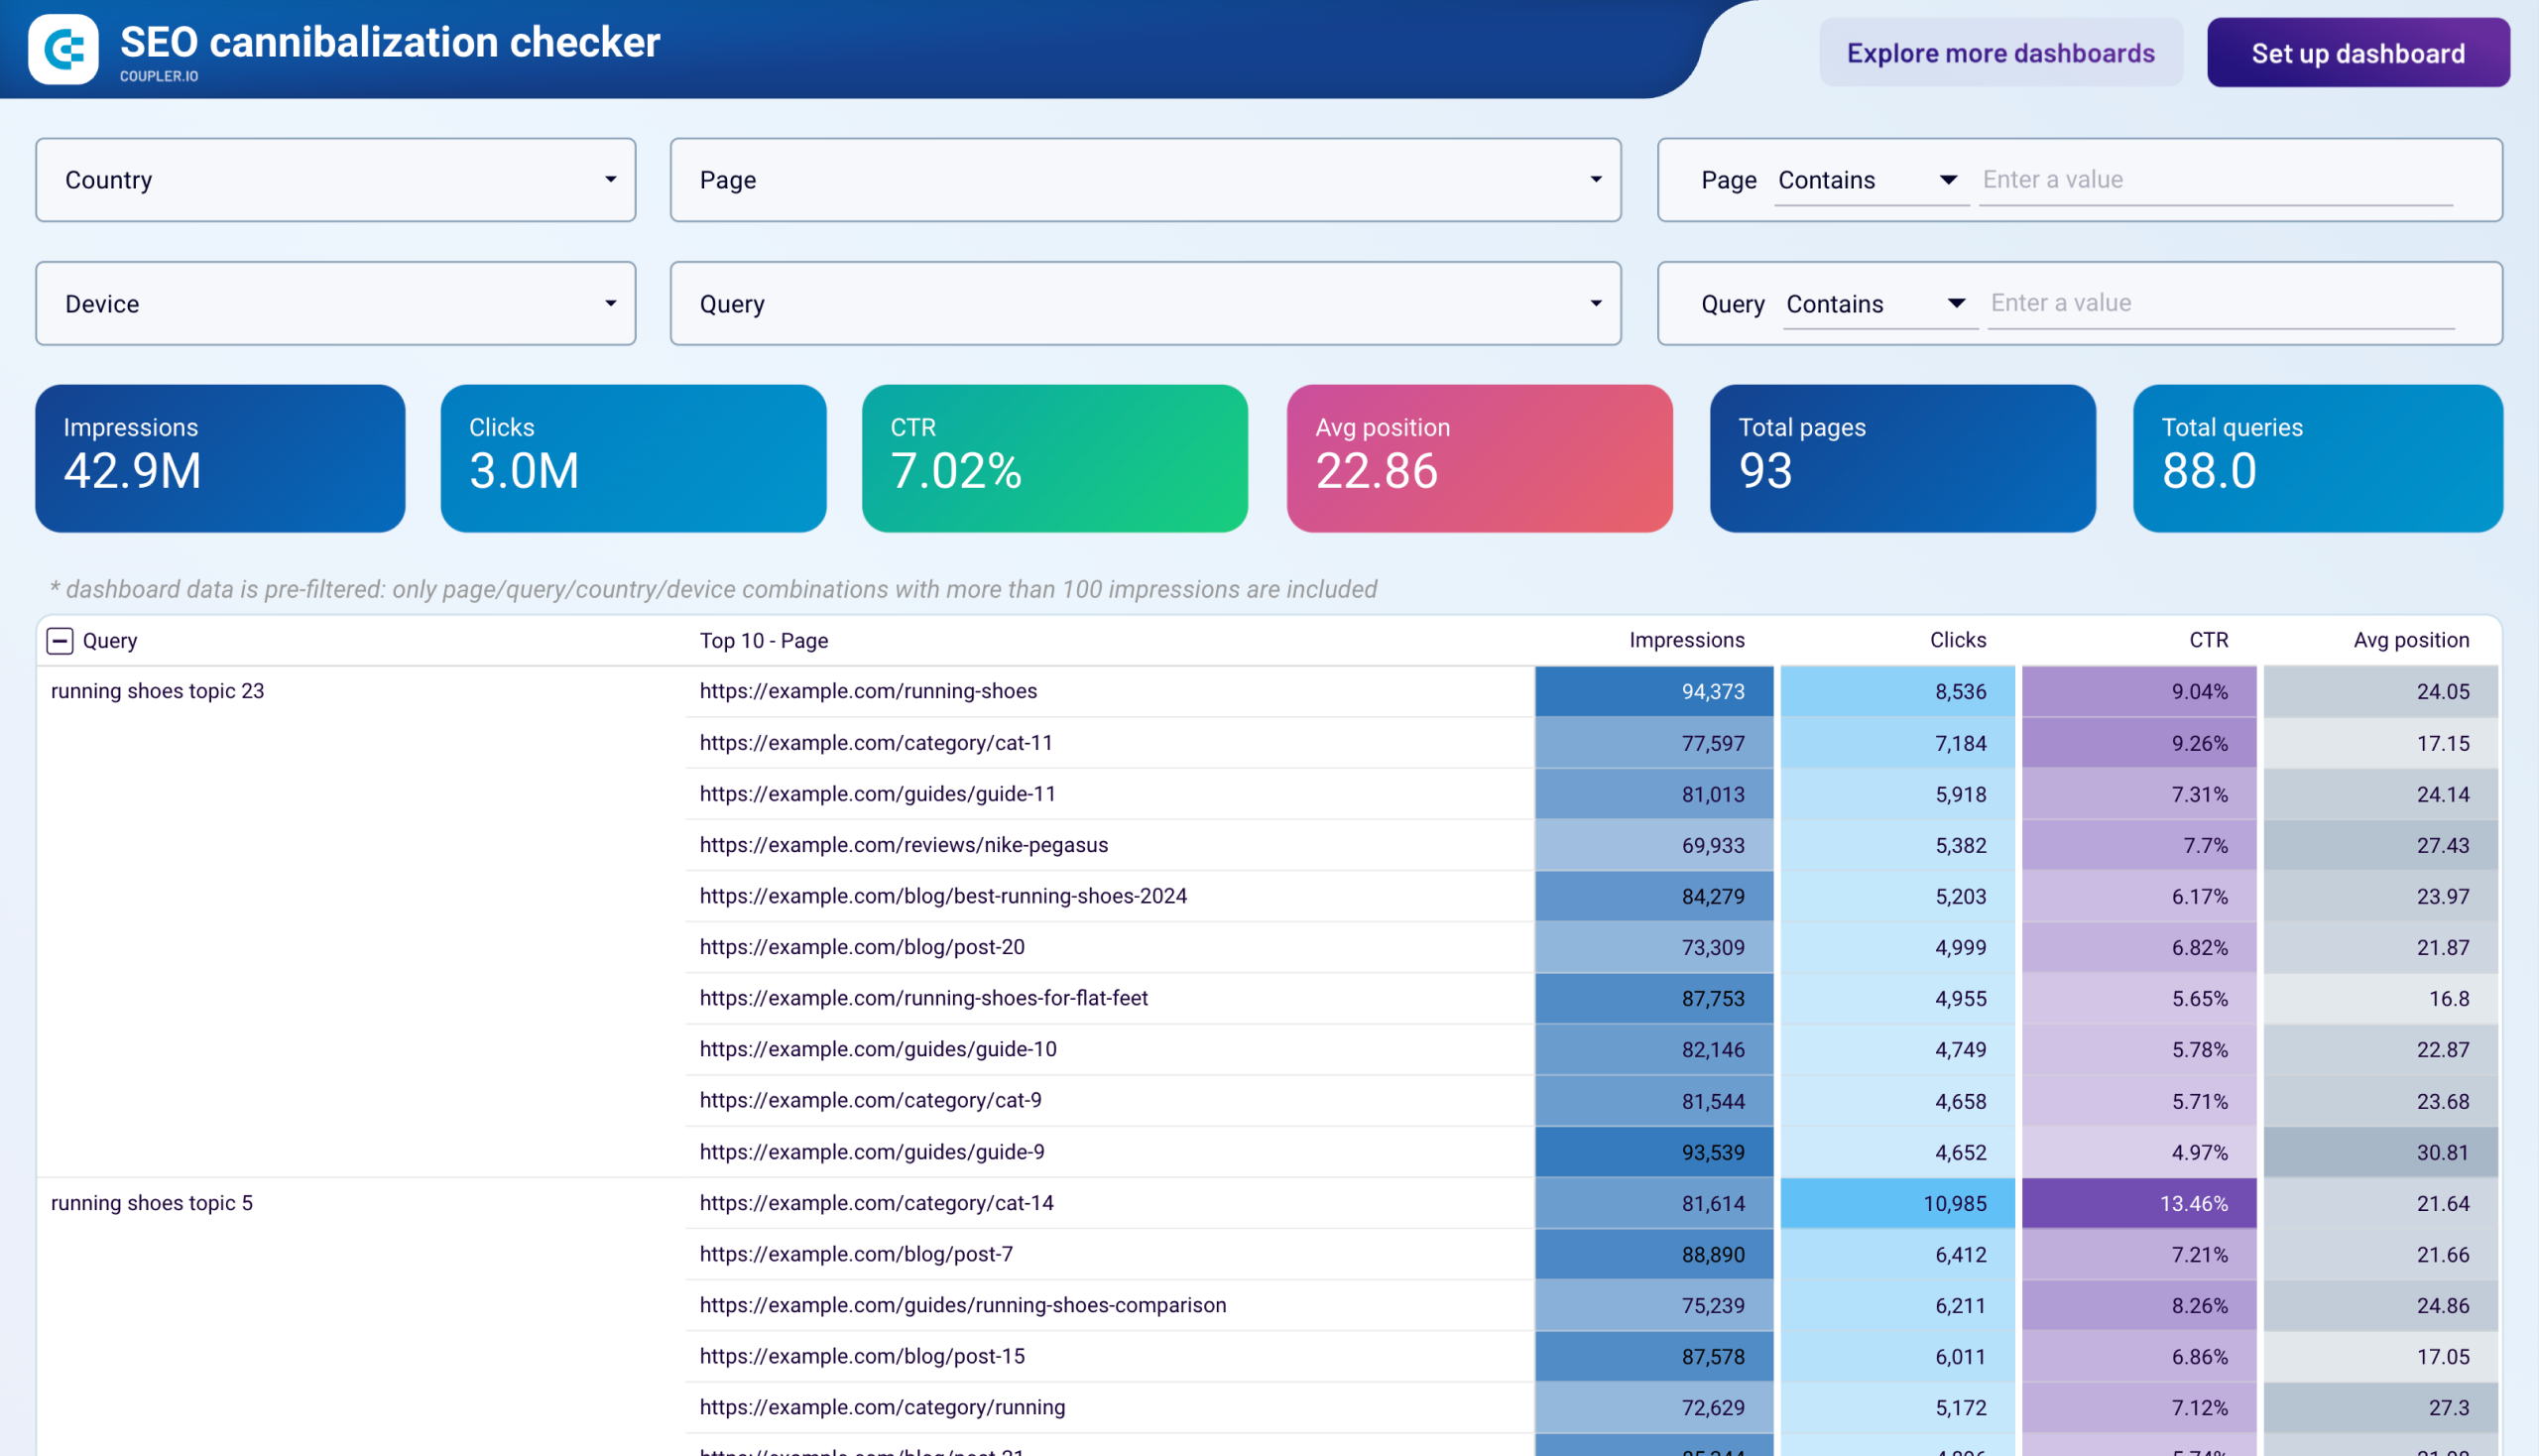
30. SEO cannibalization report template
Your SEO report might show healthy click and impression totals across the site, but those aggregate numbers can mask a specific problem: two or more pages competing for the same search query. The SEO cannibalization checker by Coupler.io is a Looker Studio report template built to surface these overlaps.
SEO cannibalization checker dashboard
 Preview dashboard
SEO cannibalization checker dashboard
Preview dashboardThe report pulls your Google Search Console data and organizes it by query. Each row in the main table lists a query alongside every URL that ranks for it, with impressions, clicks, CTR, and average position displayed per URL. This layout makes it straightforward to spot where Google rotates between your pages rather than consistently ranking one. You can scope the report to a subdirectory or keyword group using the “Page Contains” and “Query Contains” filters, which helps when you need to audit one content category without sifting through the entire site.
Report metrics:
- Impressions
- Clicks
- CTR
- Average position
- Total pages
- Total queries
To populate the report, connect your Google Search Console account through the built-in Coupler.io connector. Data refreshes automatically on the schedule you set.
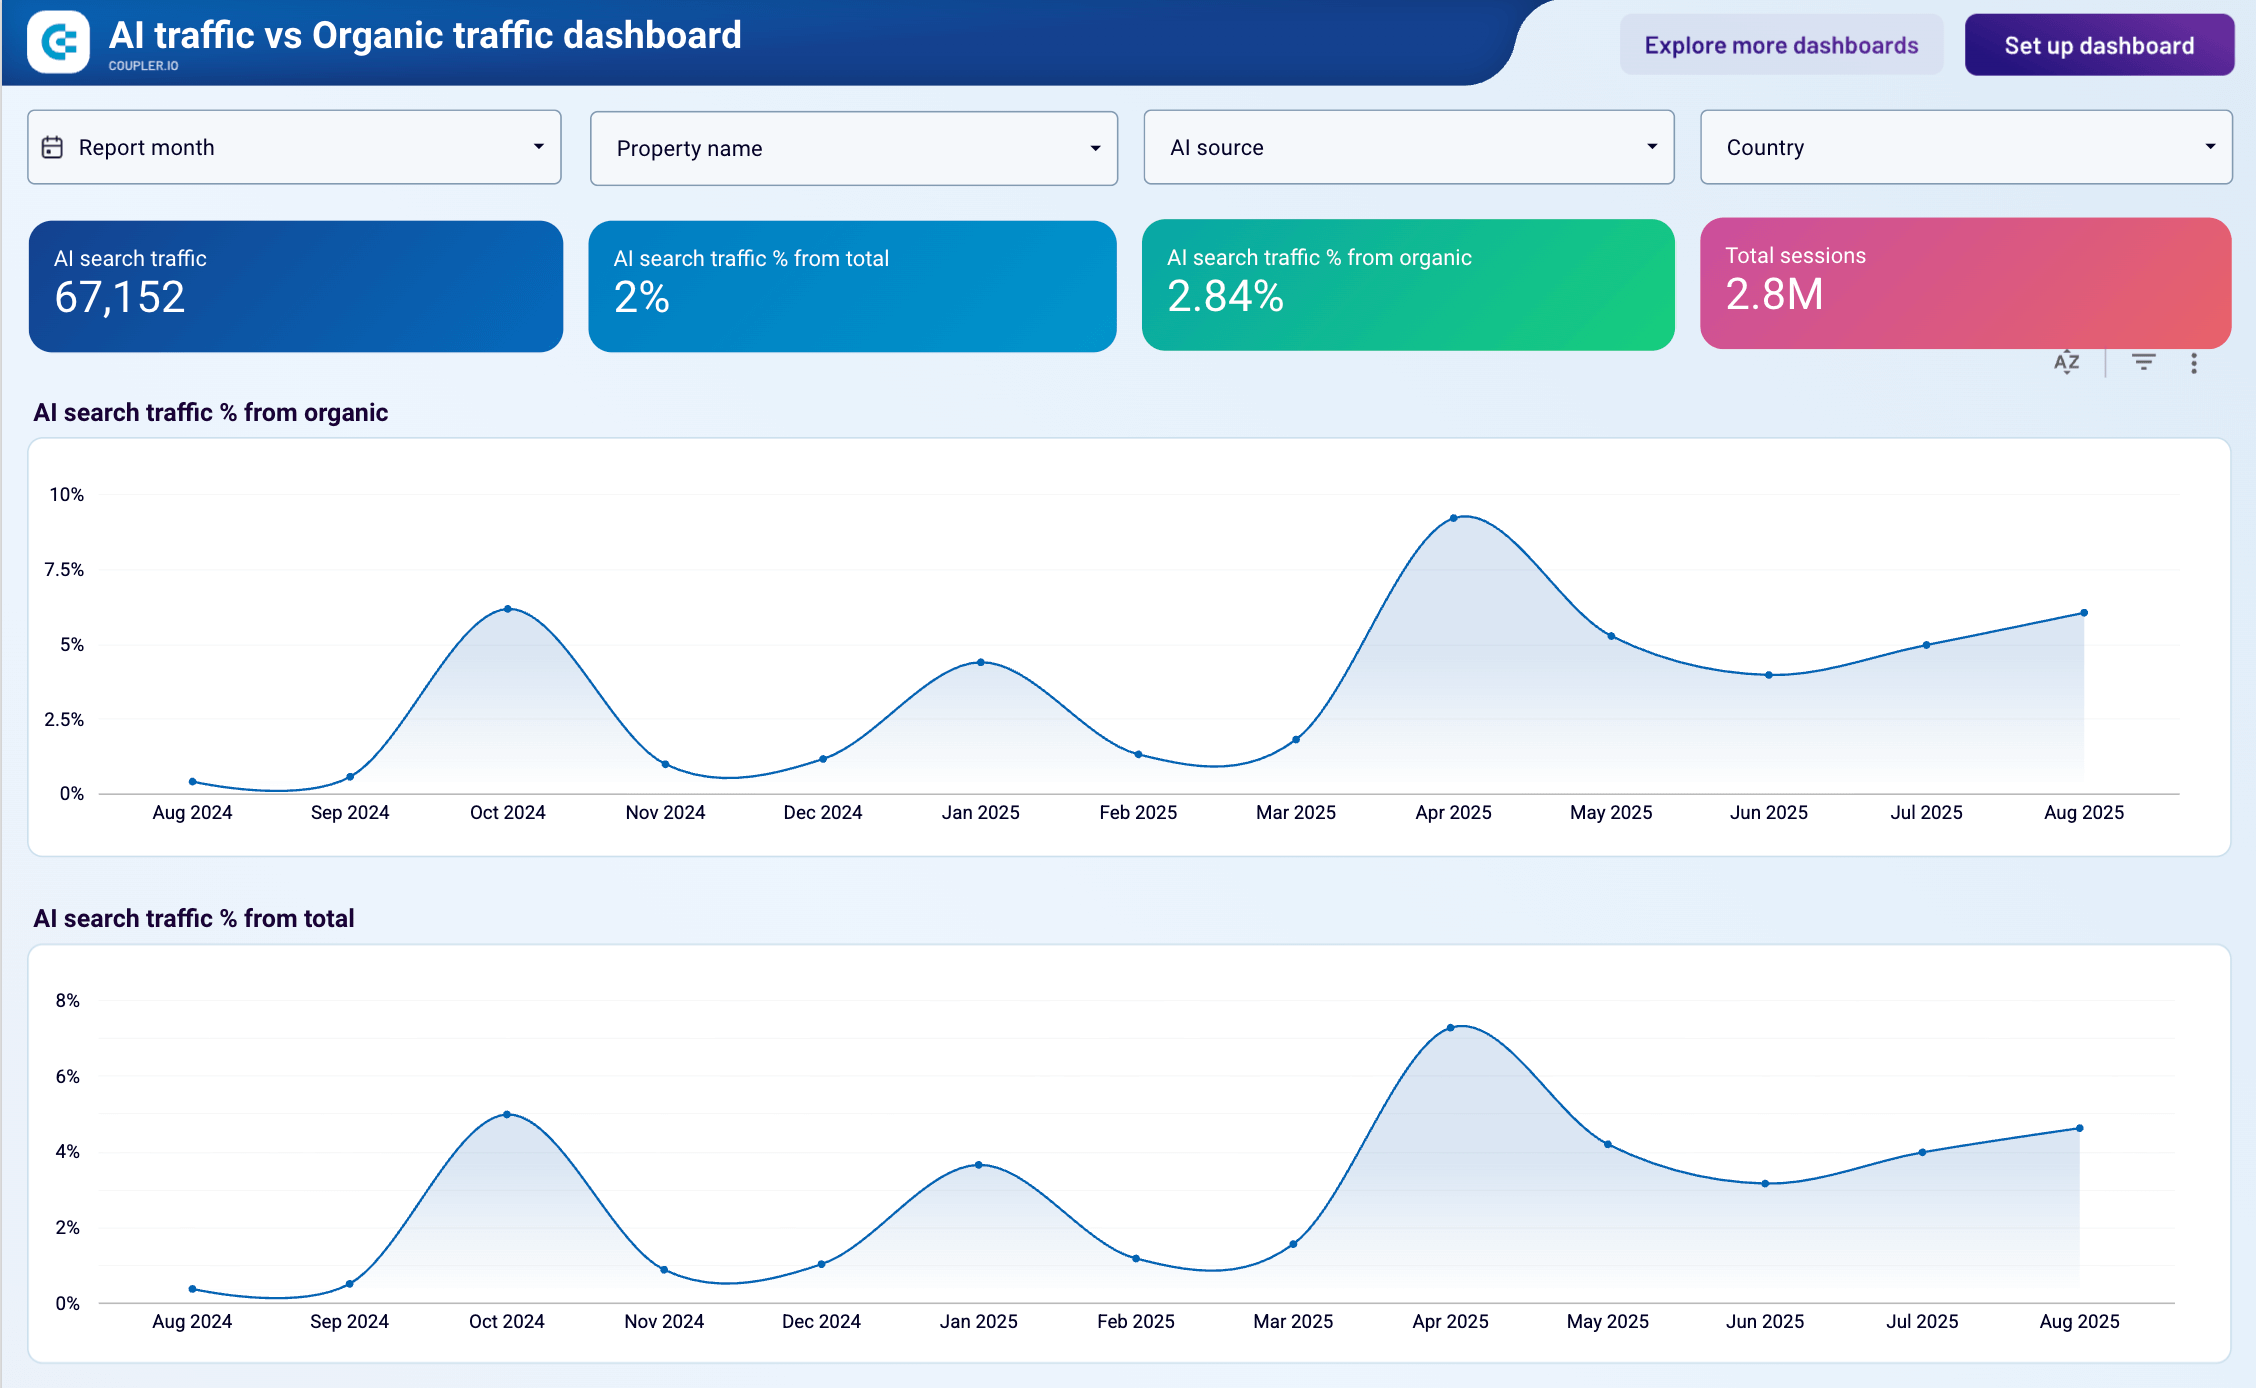
31. AI traffic vs Organic traffic report template
Understand how AI-powered search experiences (like ChatGPT, Perplexity, and other AI tools) are affecting your organic search traffic compared to traditional Google search results, and adjust your content strategy accordingly.
AI traffic vs organic traffic dashboard
 Preview dashboard
AI traffic vs organic traffic dashboard
Preview dashboardAs AI-powered search tools become more prevalent, understanding their impact on your website traffic is crucial. This dashboard helps you distinguish between traffic from traditional search engines and traffic from AI-powered platforms, giving you insights into how the search landscape is evolving.
Monitor trends in AI-driven traffic versus traditional organic search traffic, analyze which content types perform better in AI search results, and identify opportunities to optimize your content for AI discovery. Track metrics such as traffic volume, engagement rates, and conversion performance across different traffic sources.
The dashboard provides comparative analytics that help you understand whether AI search is cannibalizing your traditional organic traffic or opening new audience channels. Use these insights to develop content strategies that work effectively in both traditional and AI-powered search environments.
Report metrics:
- Users
- Sessions
- Traffic sources
- Conversions
- Bounce rate
- Page views
- Engagement rate
- Device category
Funnel and conversion report templates
Converting visitors into customers is the ultimate goal of digital marketing. These templates help you track the customer journey, identify conversion bottlenecks, and optimize your marketing funnel for maximum results.
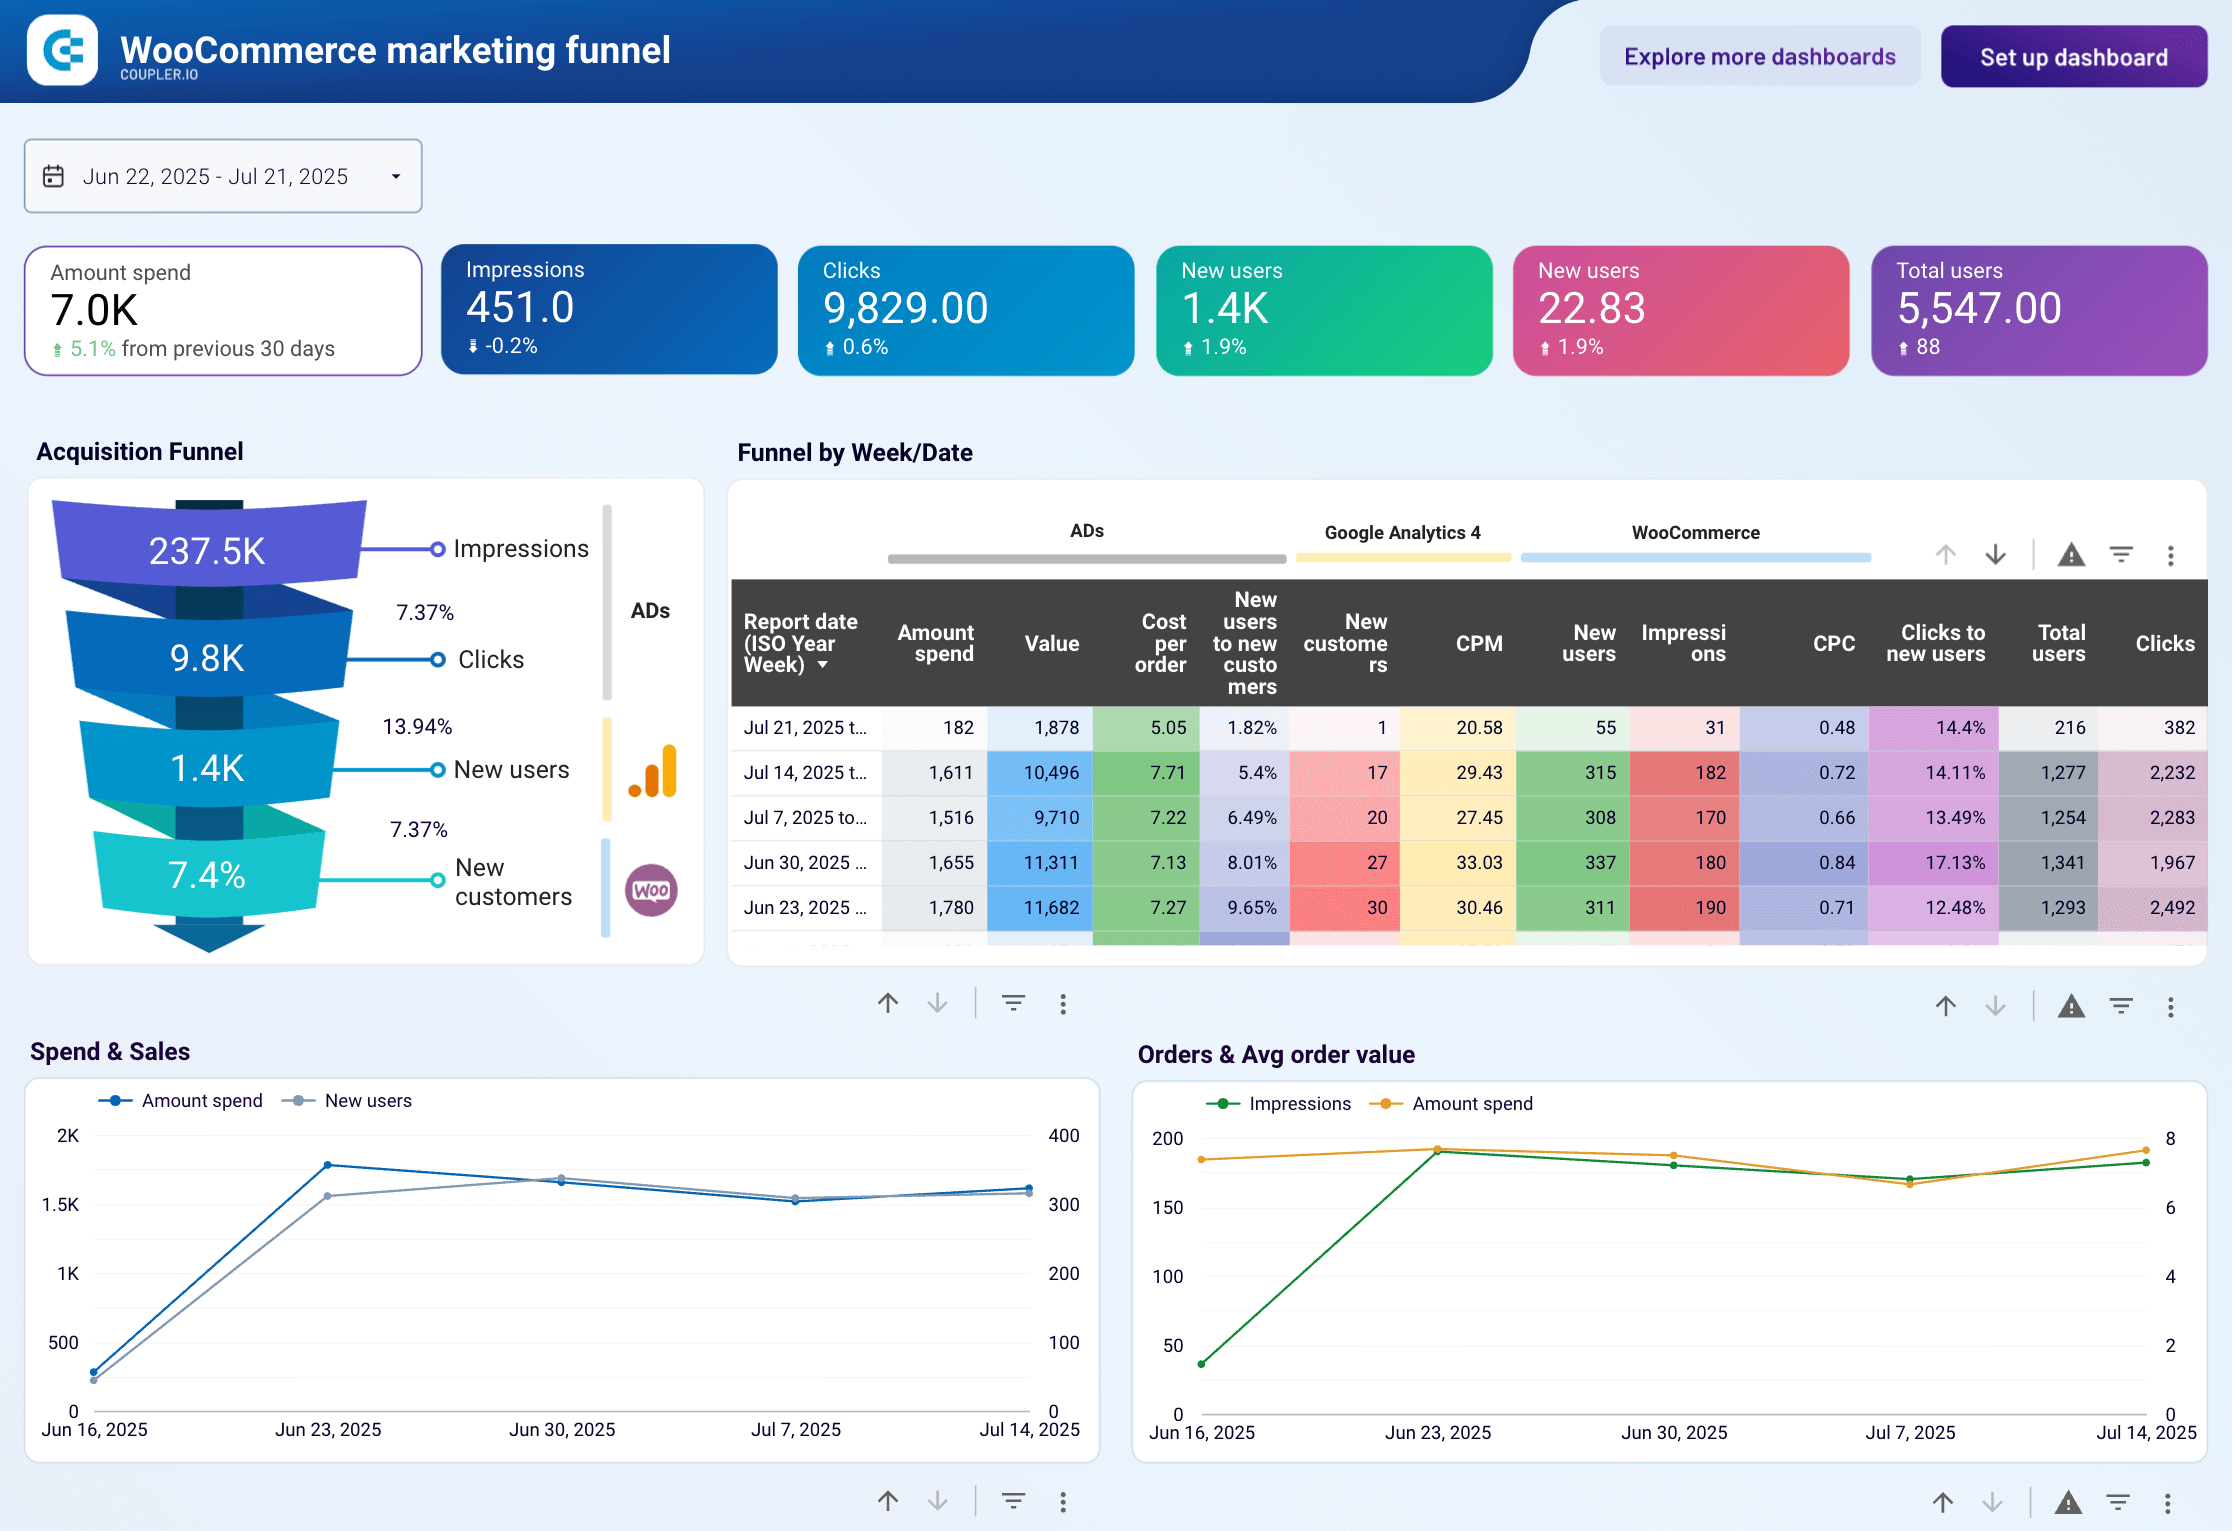
32. WooCommerce marketing funnel report template
If you’re running paid advertising campaigns to promote your WooCommerce store and need to understand which channels drive sales, this report can help. It combines data from your WooCommerce analytics, GA4, and platforms like Facebook Ads, Google Ads, and LinkedIn Ads to provide an overview of the customer acquisition funnel.
WooCommerce marketing funnel dashboard
 Preview dashboard
WooCommerce marketing funnel dashboard
Preview dashboardScorecards enable you to monitor key metrics, including amount spent, new users, clicks, etc., at a glance. The report also allows you to track the funnel’s weekly performance and examine correlations between clicks & CPC, spend & sales, and so on. You can use this information to make data-driven decisions, reallocate budget to high-performing channels, and optimize your creative and targeting strategies more effectively.
A free template is available in Looker Studio with a Coupler.io account. You can create a copy and sync your data from multiple platforms in under 5 minutes – check the report preview to get started.
Report metrics:
- Amount spent
- Impressions
- Clicks
- New users
- New customers
- Total users
- Orders
- Sales
- & more
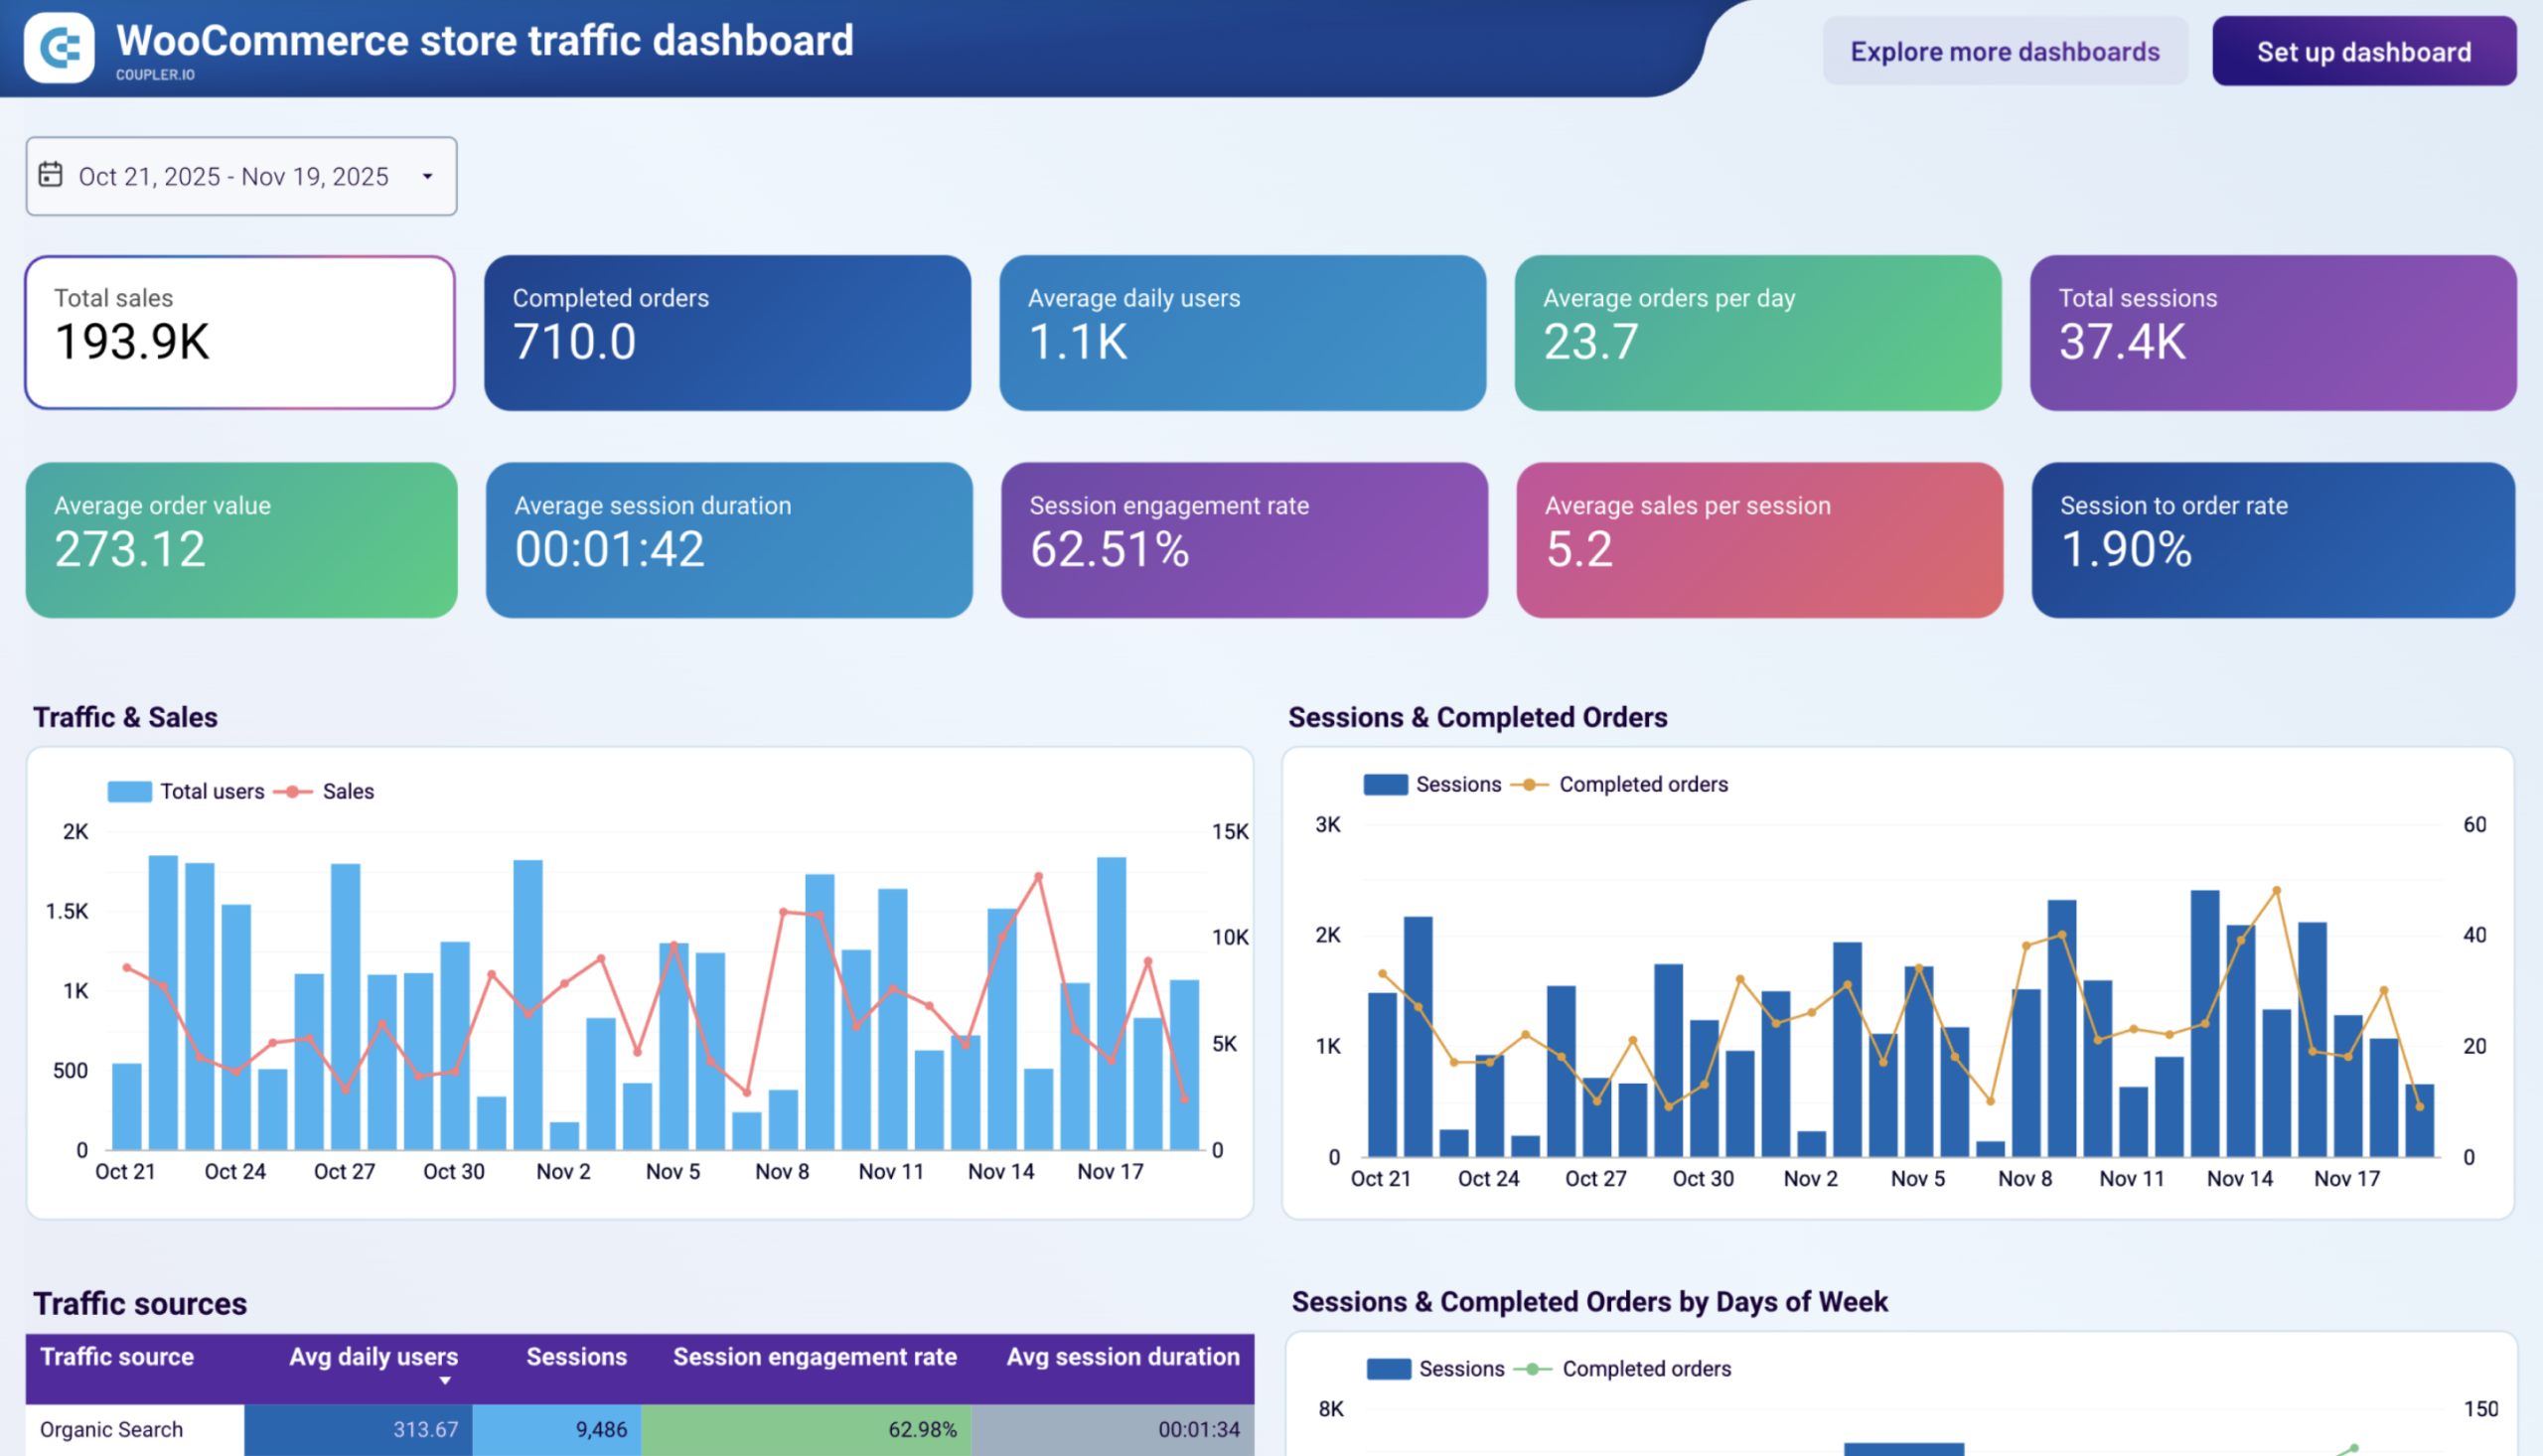
33. WooCommerce store traffic report template
Marketing teams running WooCommerce stores often track traffic in GA4 and sales in WooCommerce separately, then try to connect the dots manually. This report template eliminates that step. It pulls session data from Google Analytics 4 and order data from WooCommerce into a single Looker Studio dashboard, so you can see how traffic from each acquisition channel translates into completed purchases without exporting anything.
WooCommerce store traffic dashboard
 Preview dashboard
WooCommerce store traffic dashboard
Preview dashboardThe template is useful for diagnosing conversion problems at the channel level. If Organic Search brings three times the traffic of Email but converts at a third of the rate, that relationship is visible here. The same logic applies geographically: the performance-by-country breakdown shows session-to-order rate and average sales per session for each market, so you can compare conversion efficiency across regions rather than just traffic volume.
Report metrics:
- Total sales
- Completed orders
- Average daily users
- Total sessions
- Average order value
- Session engagement rate
- Average session duration
- Session-to-order rate
- Average sales per session
- Average orders per day
34. WooCommerce orders report template
Conversion doesn’t end when a customer clicks “buy.” What happens between order placement and order completion (how long it takes, whether it goes smoothly, and which customer segment it came from) determines whether that customer comes back. This WooCommerce orders report template gives operations teams and store owners visibility into exactly that: fulfillment performance, customer type distribution, order pipeline health, and geographic revenue contribution, all sourced directly from WooCommerce.
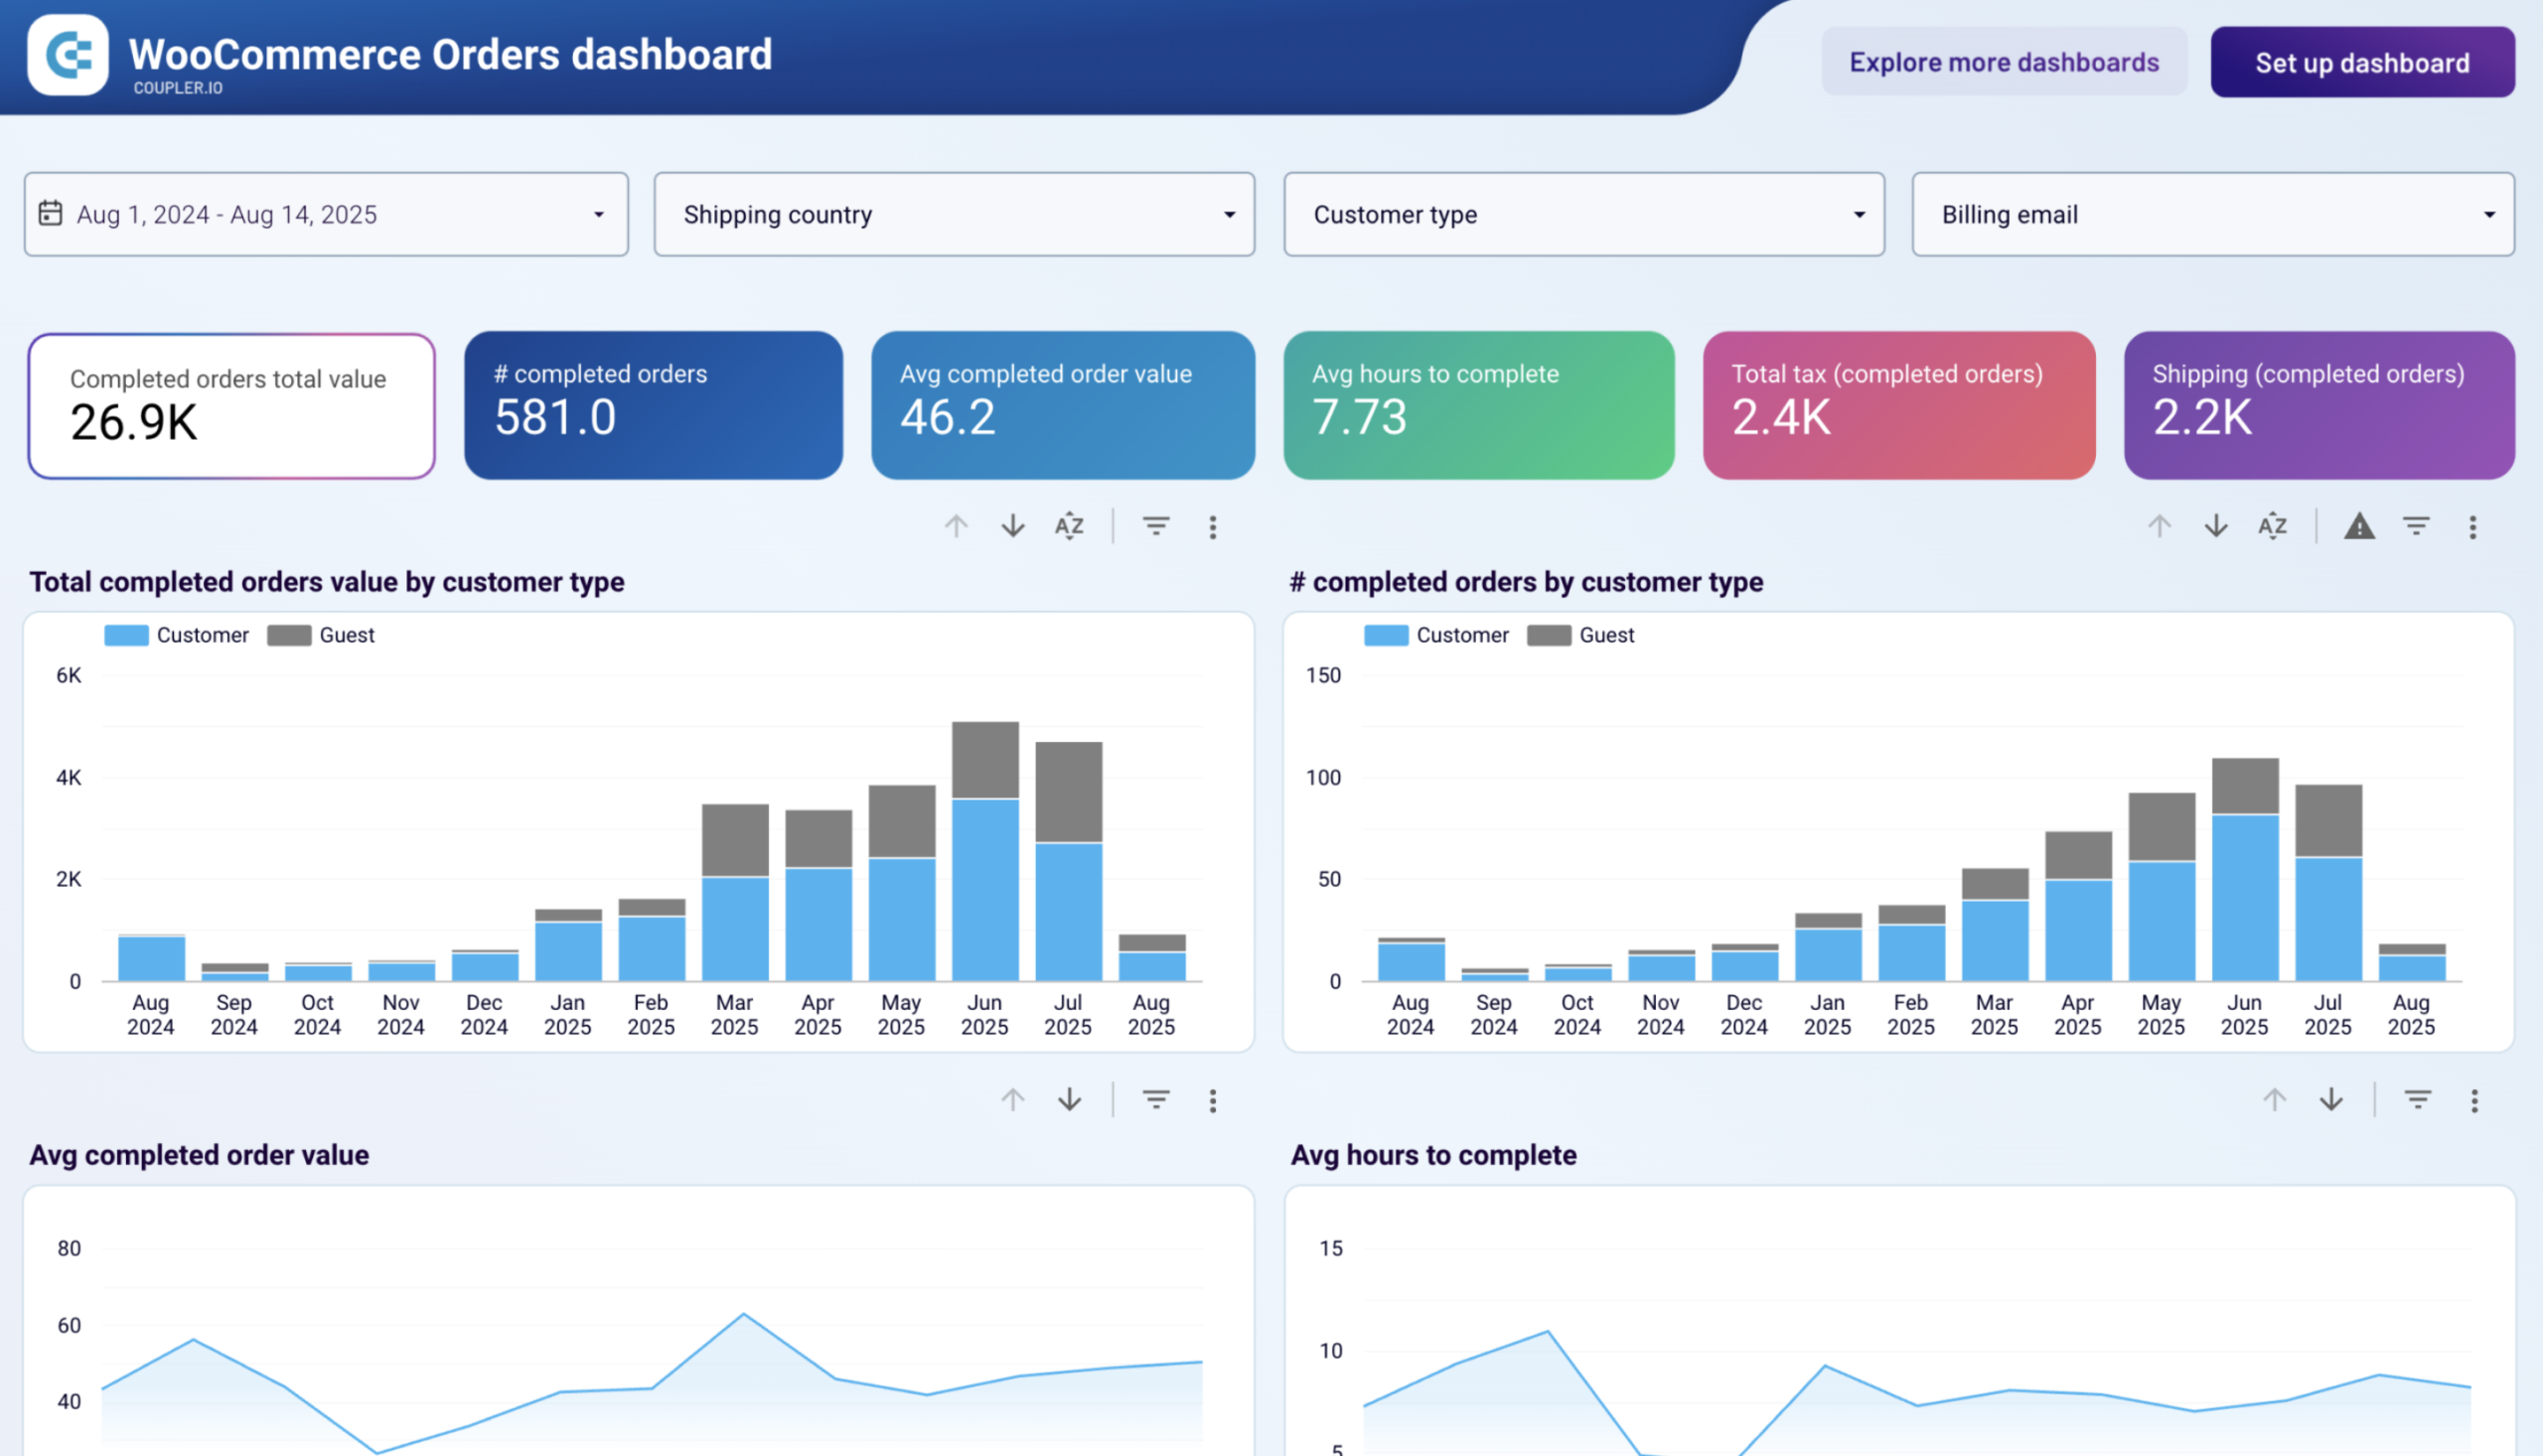
The template’s most actionable view is the average hours to complete trend chart, which shows how fulfillment time shifts over time. When processing slows down, the chart makes the timing visible, so you can cross-reference it with order volume and identify whether the cause is a capacity constraint, a workflow bottleneck, or an inventory issue.
Report metrics:
- Completed orders total value
- Number of completed orders
- Average completed order value
- Average hours to complete
- Order status distribution (completed, pending, on-hold, refunded)
- Total shipping on completed orders
- Total tax on completed orders
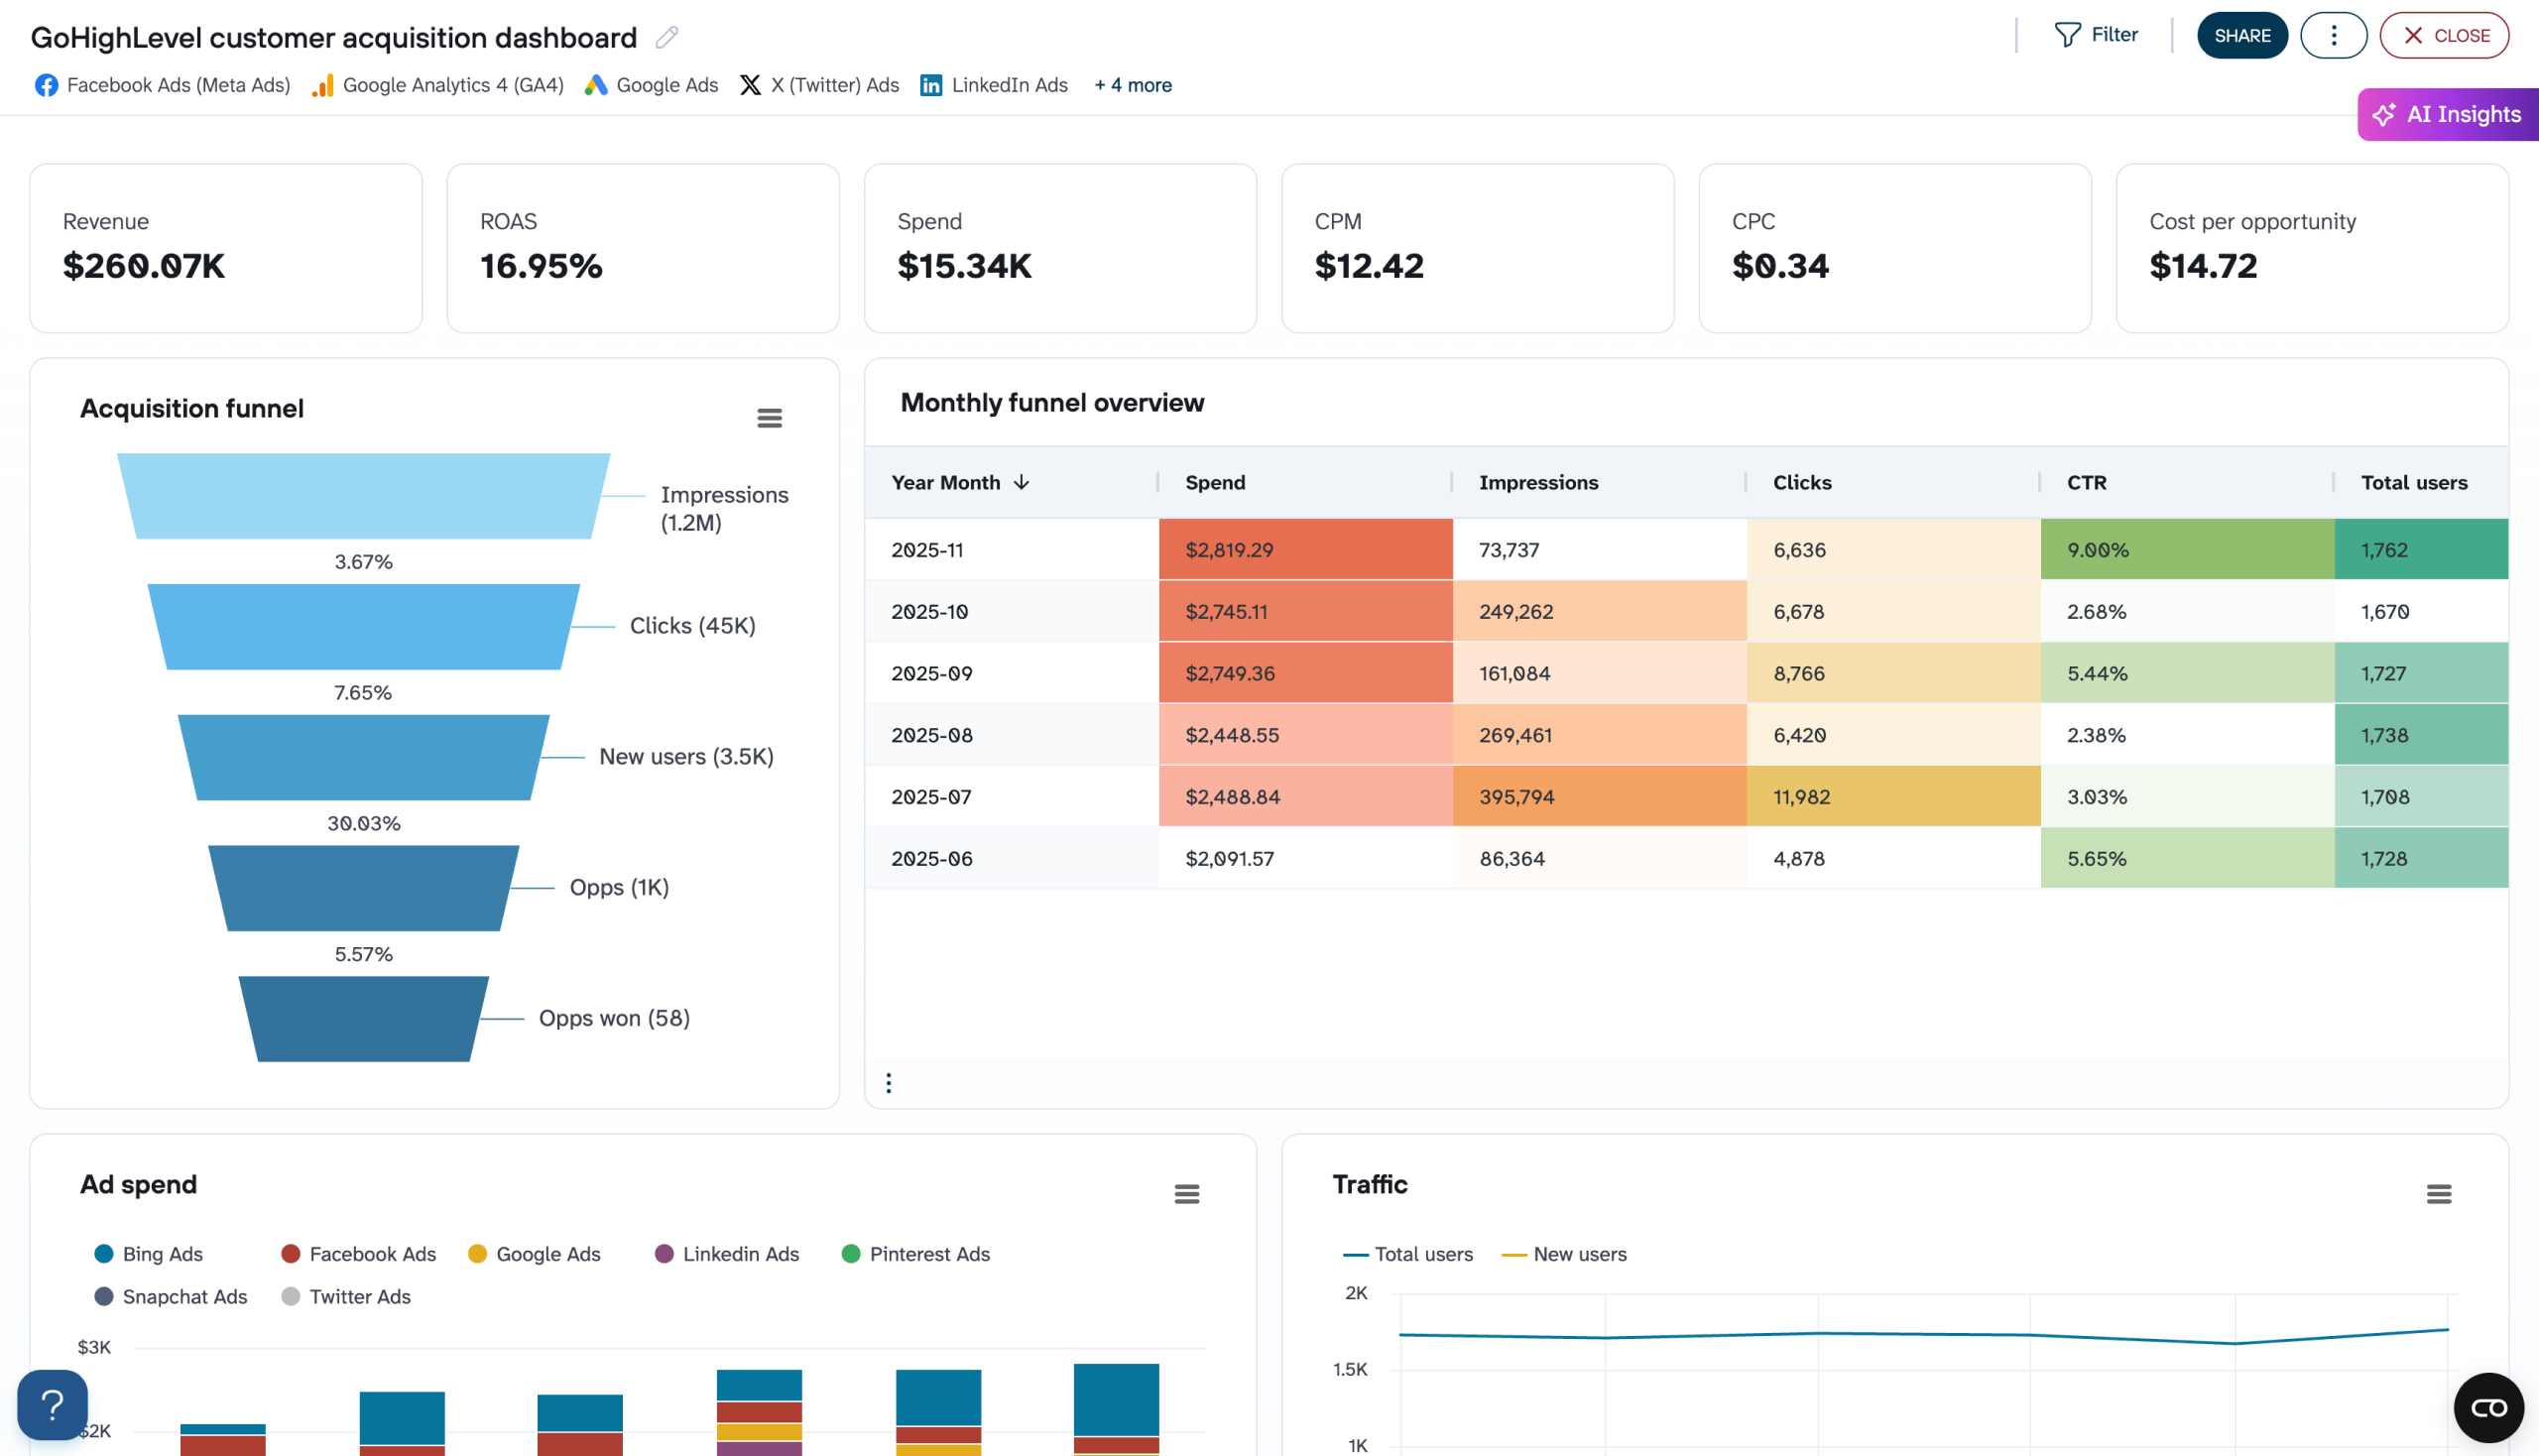
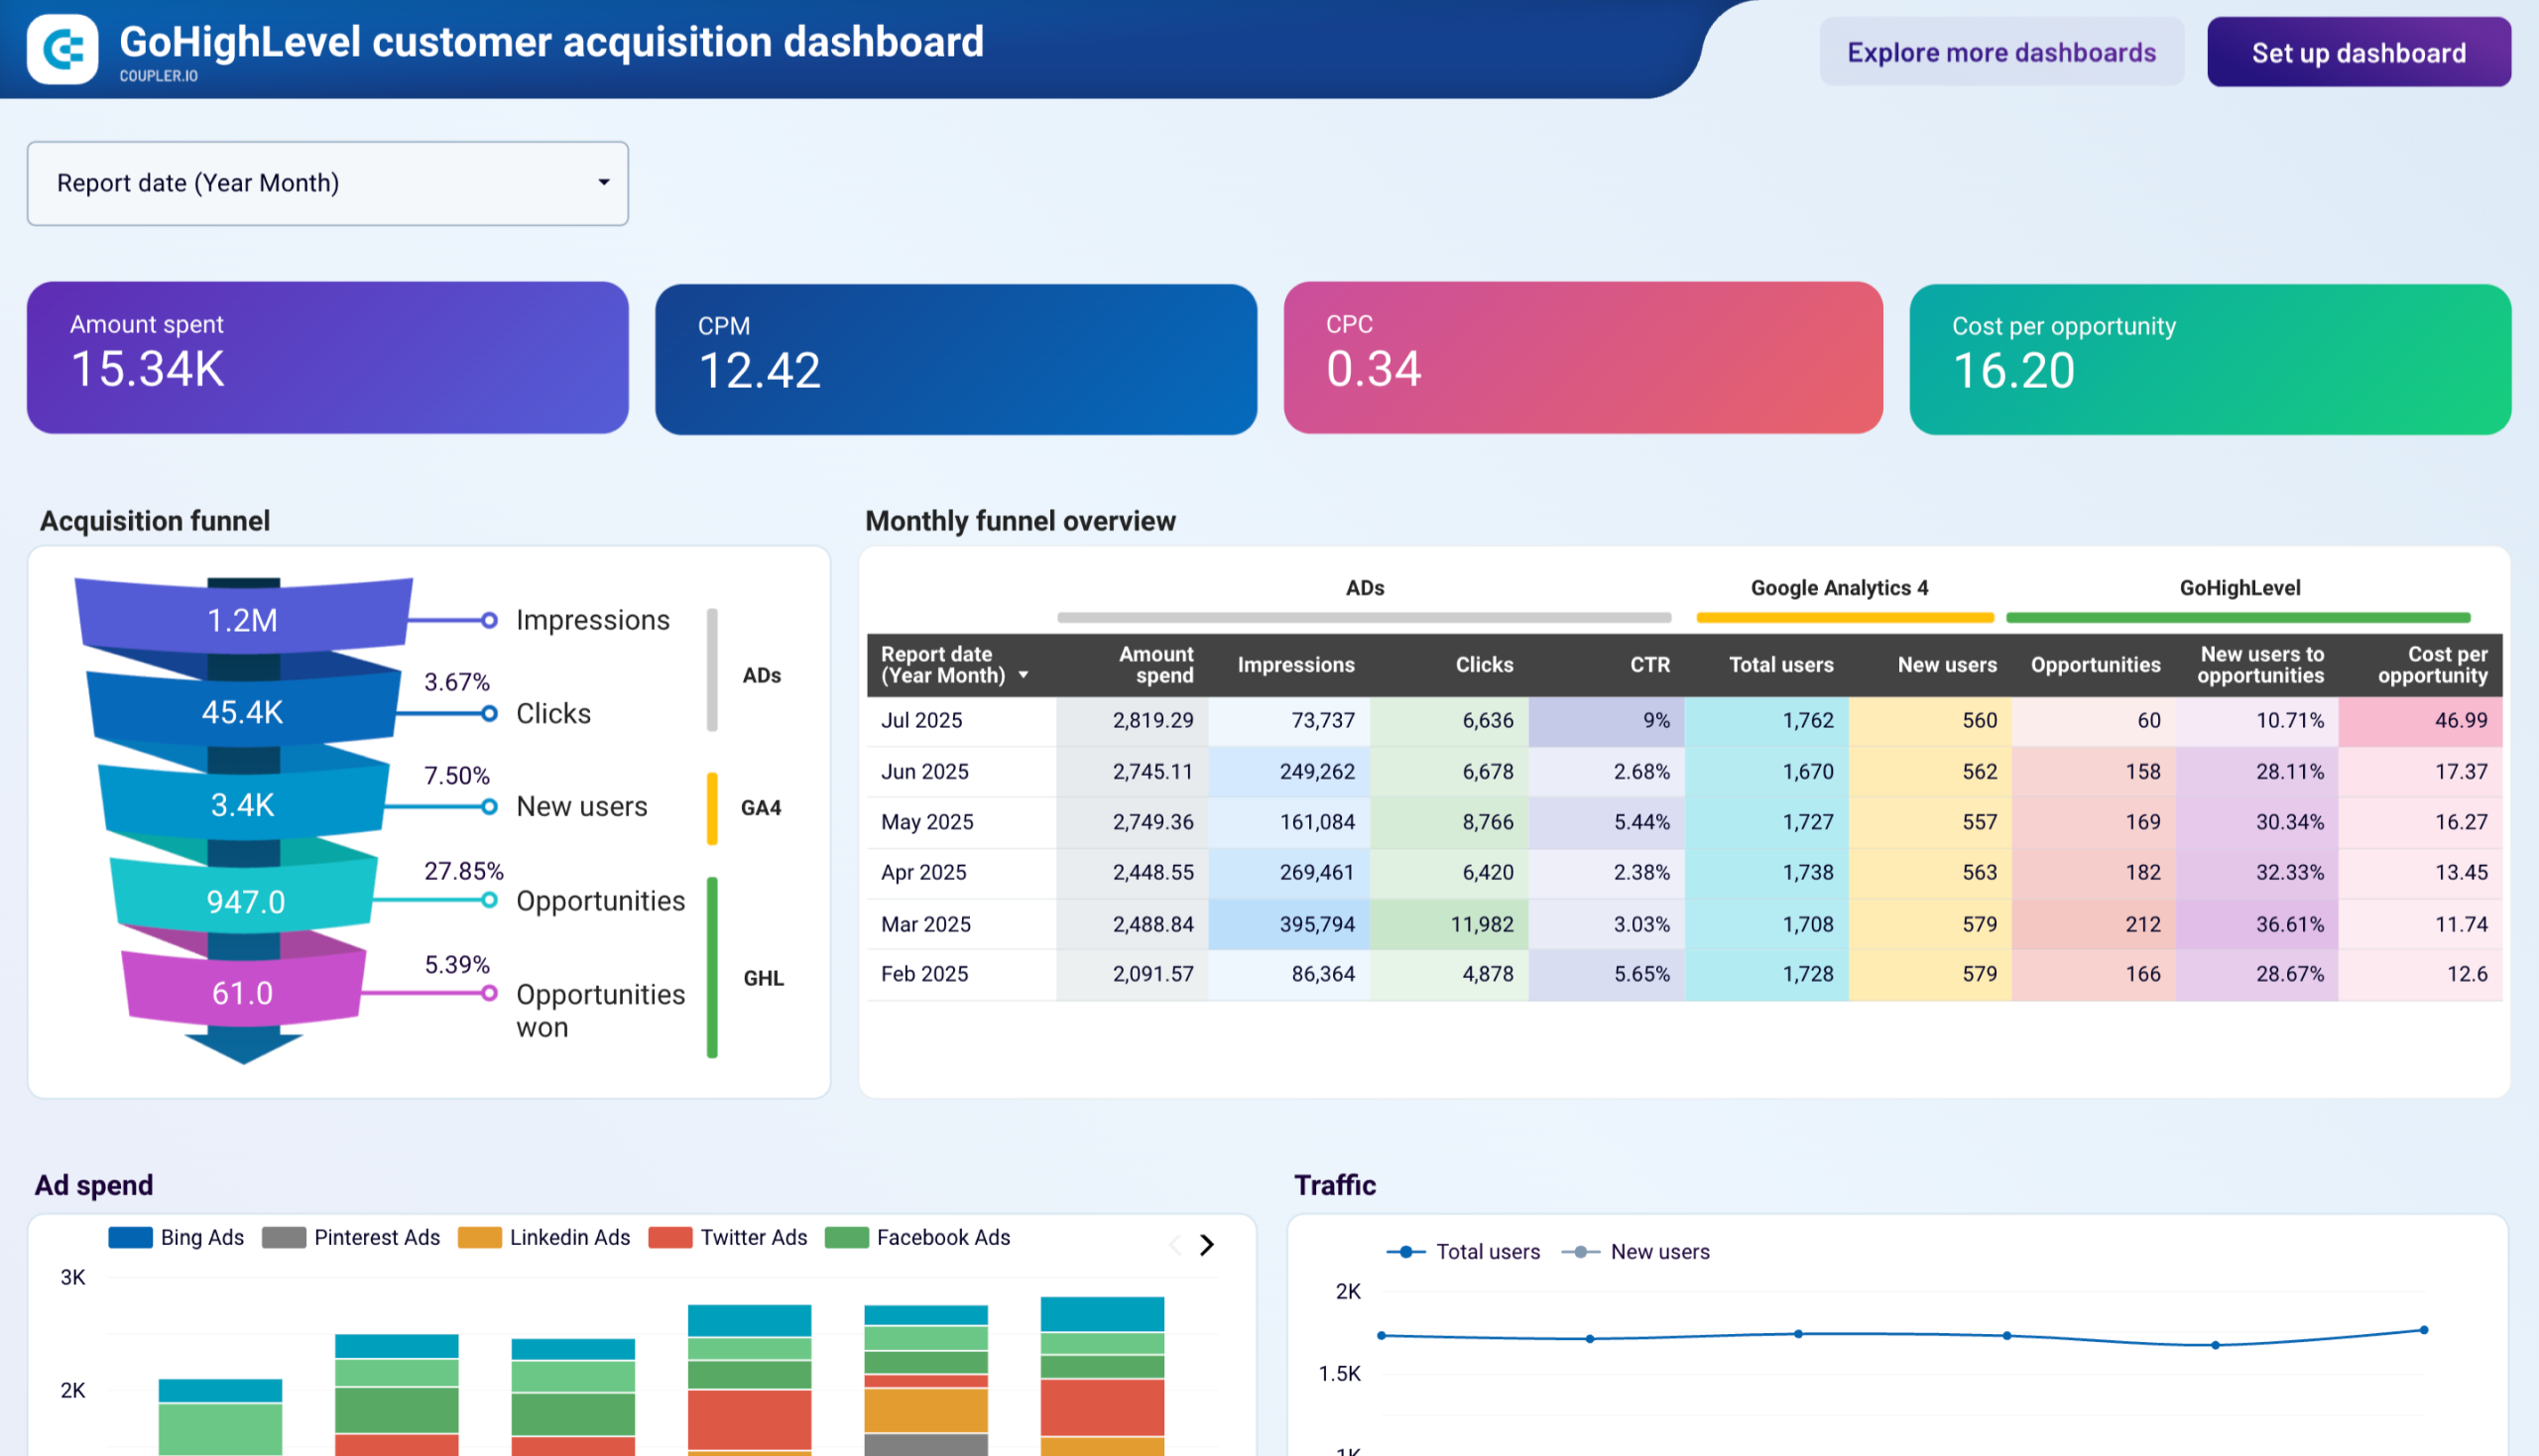
35. GoHighLevel customer acquisition report template
If you’re using GoHighLevel as your CRM while managing advertising across several platforms, this dashboard shows how your marketing efforts translate into actual business opportunities. It visualizes the five-stage acquisition funnel from impressions to won deals, helping you improve conversion rates at every step of the customer journey.
Customer acquisition dashboard for GoHighLevel
 Preview dashboard
Customer acquisition dashboard for GoHighLevel
Preview dashboardBy analyzing monthly trends in spend, traffic, and CRM conversions, you can see which marketing efforts actually drive business results. These insights help optimize budget distribution and concentrate resources on paid channels (e.g., Bing, Pinterest, Facebook) that generate your highest-quality sales opportunities.
You can use this marketing report template in Coupler.io or Looker Studio. Simply sign up for a free Coupler.io account and connect your GHL data.

Report metrics:
- CPM
- CPC
- Amount spend
- Cost per lead
- Cost per SQL
- CTR
- Impressions
- Clicks
- Leads
- Conversions
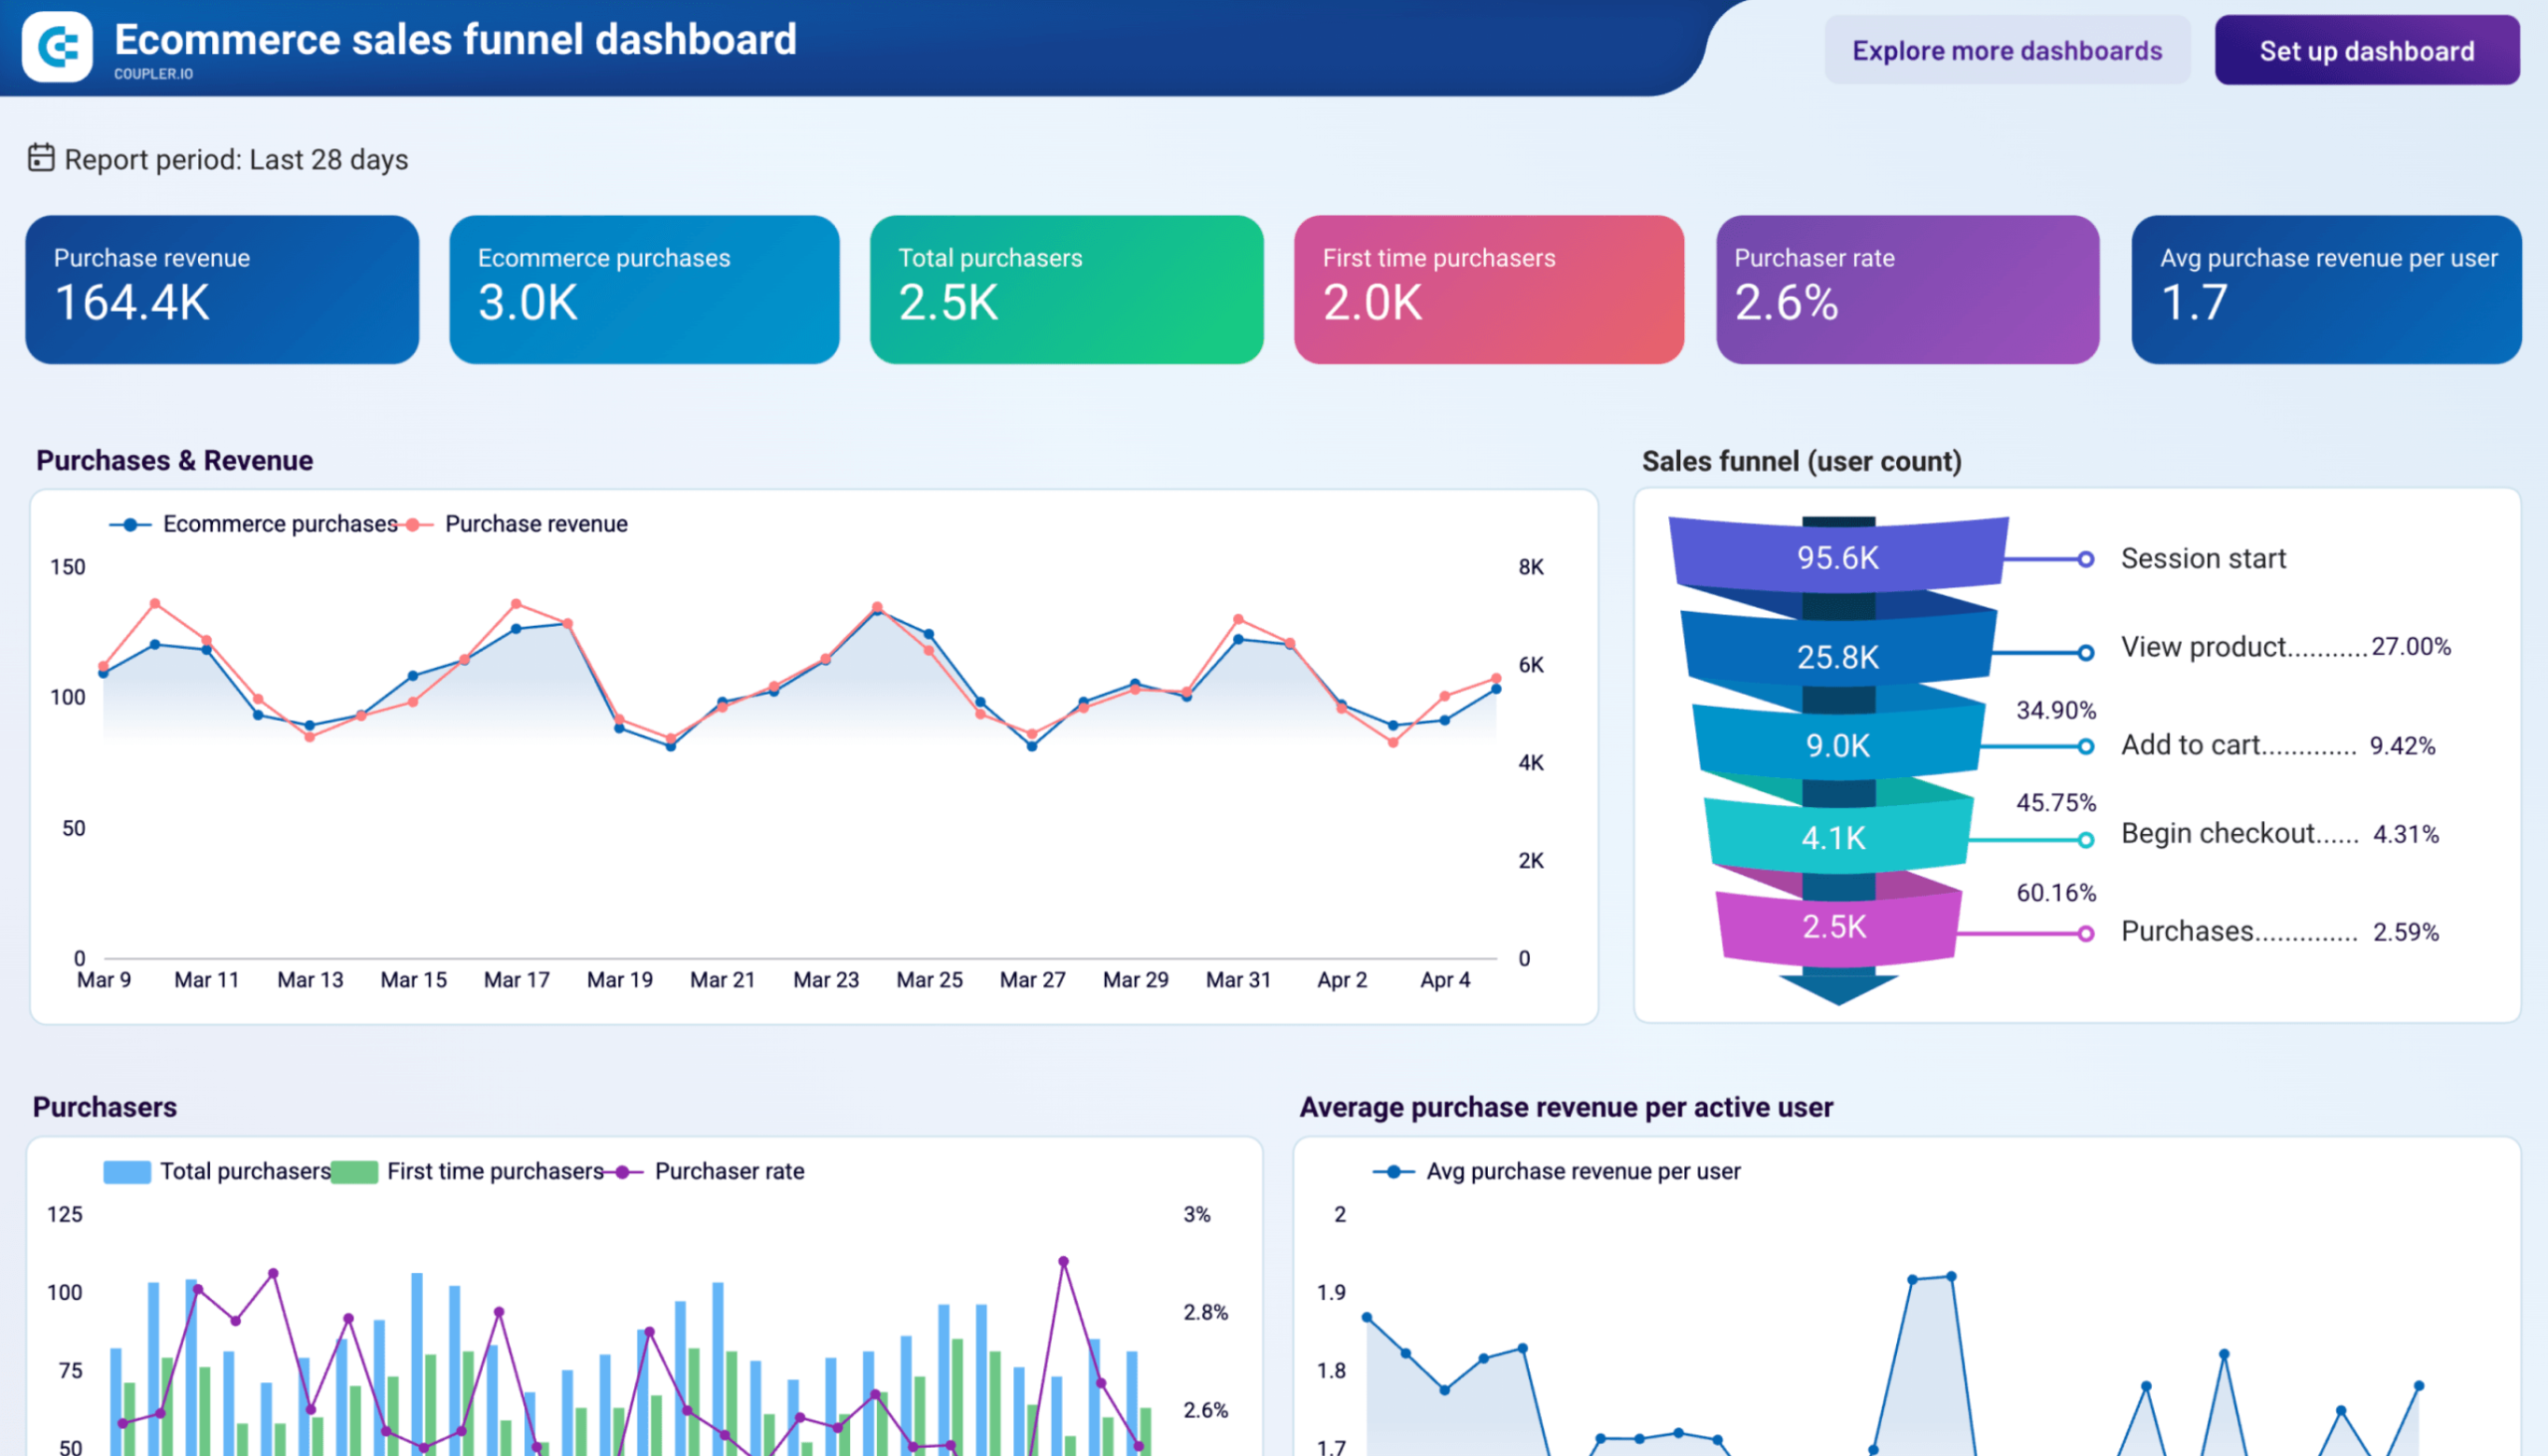
36. Ecommerce sales funnel dashboard for GA4
This GA4-powered Data Studio template gives ecommerce teams a reporting structure built around the purchase funnel rather than traffic metrics. It visualizes the step-by-step conversion path from session start through product view, add to cart, begin checkout, and purchase, with conversion rates at each stage. It also applies those metrics across four tabs covering the overall store, individual countries, device categories, and individual products.
GA4 ecommerce sales funnel dashboard
 Preview dashboard
GA4 ecommerce sales funnel dashboard
Preview dashboardMonitor your ecommerce conversion funnel from session start through purchase, with breakdowns by country, device, and product to find where shoppers drop off and why.
Report metrics:
- Purchase revenue
- Ecommerce purchases
- Total purchasers
- First-time purchasers
- Purchaser rate
- Average purchase revenue per user (ARPU)
- Step-to-step funnel conversion rates (session start → product view → add to cart → begin checkout → purchase)
Coupler.io connects to your GA4 account and keeps the template updated on a schedule. Follow the Setup guide inside the dashboard to get started.
General marketing reporting templates
Sometimes you need broader templates that cover multiple aspects of your marketing efforts or provide standardized reporting for stakeholders. These templates offer comprehensive views of your marketing performance across different timeframes and channels
37. Digital marketing reporting template
Are you combining different types of marketing tactics and strategies to boost awareness or leads for your brand? We’ve included a digital marketing reporting template that contains various marketing tactics and channels so you can have a complete overview of your performance.
In this digital marketing reporting template, you can include data from Google Analytics, and tools for SEO, email, performance, and social media marketing. It contains metrics such as Bounce rate, Click through rate, and Goal competitions for your marketing analytics. Also, it includes an overview of your email campaigns, social media performance, and a PPC overview.
Report metrics:
- Sessions
- Average session duration
- Bounce rate
- Goal completions
- SEO rankings
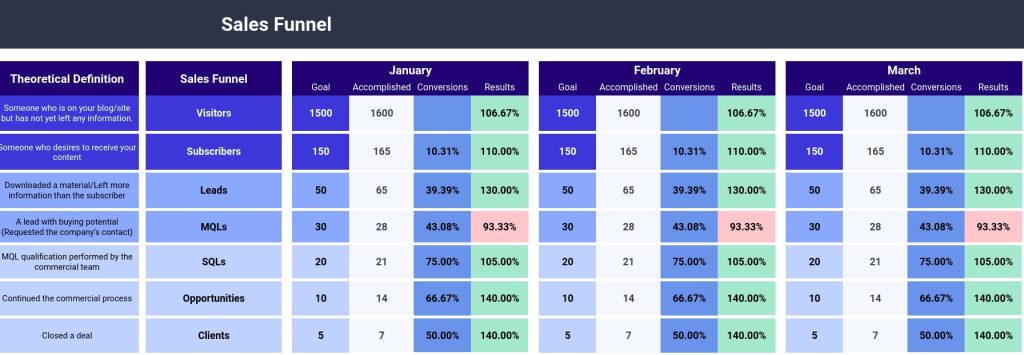
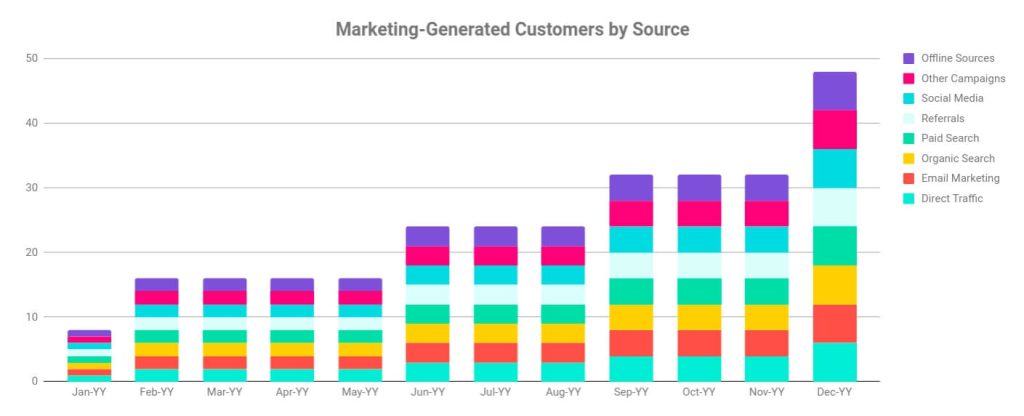
38. Content marketing report template
If you want to ensure your content is engaging for potential customers, you can use this content marketing reporting template from Rock Content. With this template, you can track various metrics, including Visitors, Leads, MQLs, SQLs, and Subscribers. Also, you can see which pieces of content are top-performing.
This template is designed in Google Sheets, but it has one significant drawback – you’ll have to load data to this template manually. The report is free to use: you only need to make a copy of it. But it does not support any automation.
As an option, though, you can use Coupler.io to connect your dashboard to the needed data sources.
Report metrics:
- Visitors
- Subscribers
- Leads
- Opportunities
39. Weekly marketing report template
A weekly report means that you get an overview of key metrics per week. A weekly marketing report can be for social media, SEO performance, ad campaigns, etc. So, there is a weekly report on Search Ads 360 performance.
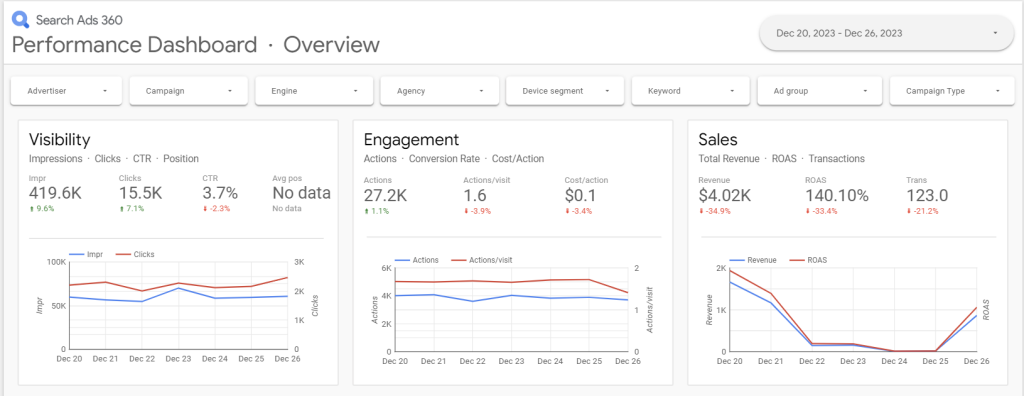
The report template is highly interactive since it allows you to filter data by many parameters. You can also easily connect it to your Search Ads 360 account using the native Looker Studio connector.
Report metrics:
- Impressions
- Clicks
- CTR
- Position
- Actions
- Conversion rate
- ROAS
40. Monthly marketing report template
Every month, you should create a report to have a complete overview of how things are progressing. This type of report doesn’t have to include much data, only the most essential metrics and data points from all of the channels you are using for campaigns.
This monthly marketing reporting template by HubSpot is a basic option if you want to keep managers updated. You can add details about Reach, Visits, Leads, Conversions, and Customers from all channels. Just like the previous models, you will need to make a copy in Google Sheets to edit this free template and load your company’s data into it. You can do this manually or, again, use Coupler.io to automate the data flow.
Report metrics:
- Reach
- Visits
- Leads
- Customers
- Conversion rates
41. Lead generation report template
One of the most important tasks for any marketer is to generate leads so that the sales team can close deals. To ensure you are on track with your leads, you need a detailed Hubspot lead generation reporting template like this one.
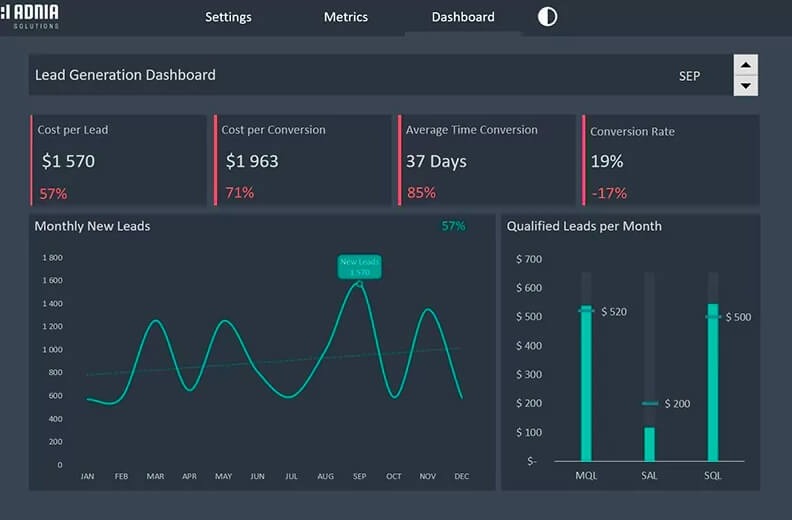
In this report, you can track the cost per conversion, conversion rate, and cost per lead. You can purchase this template to add your data to it and share it with stakeholders.
Report metrics:
- Cost per conversion
- Cost per lead
- Average time Conversion
- Conversion rate
Customer support reporting templates
Marketing doesn’t end at the sale, and the conversations your support team has are a direct read on how customers feel afterward. A support reporting template pulls those interactions into one view, so you can connect service quality to retention and word of mouth. Here’s a template for teams running support through Intercom.
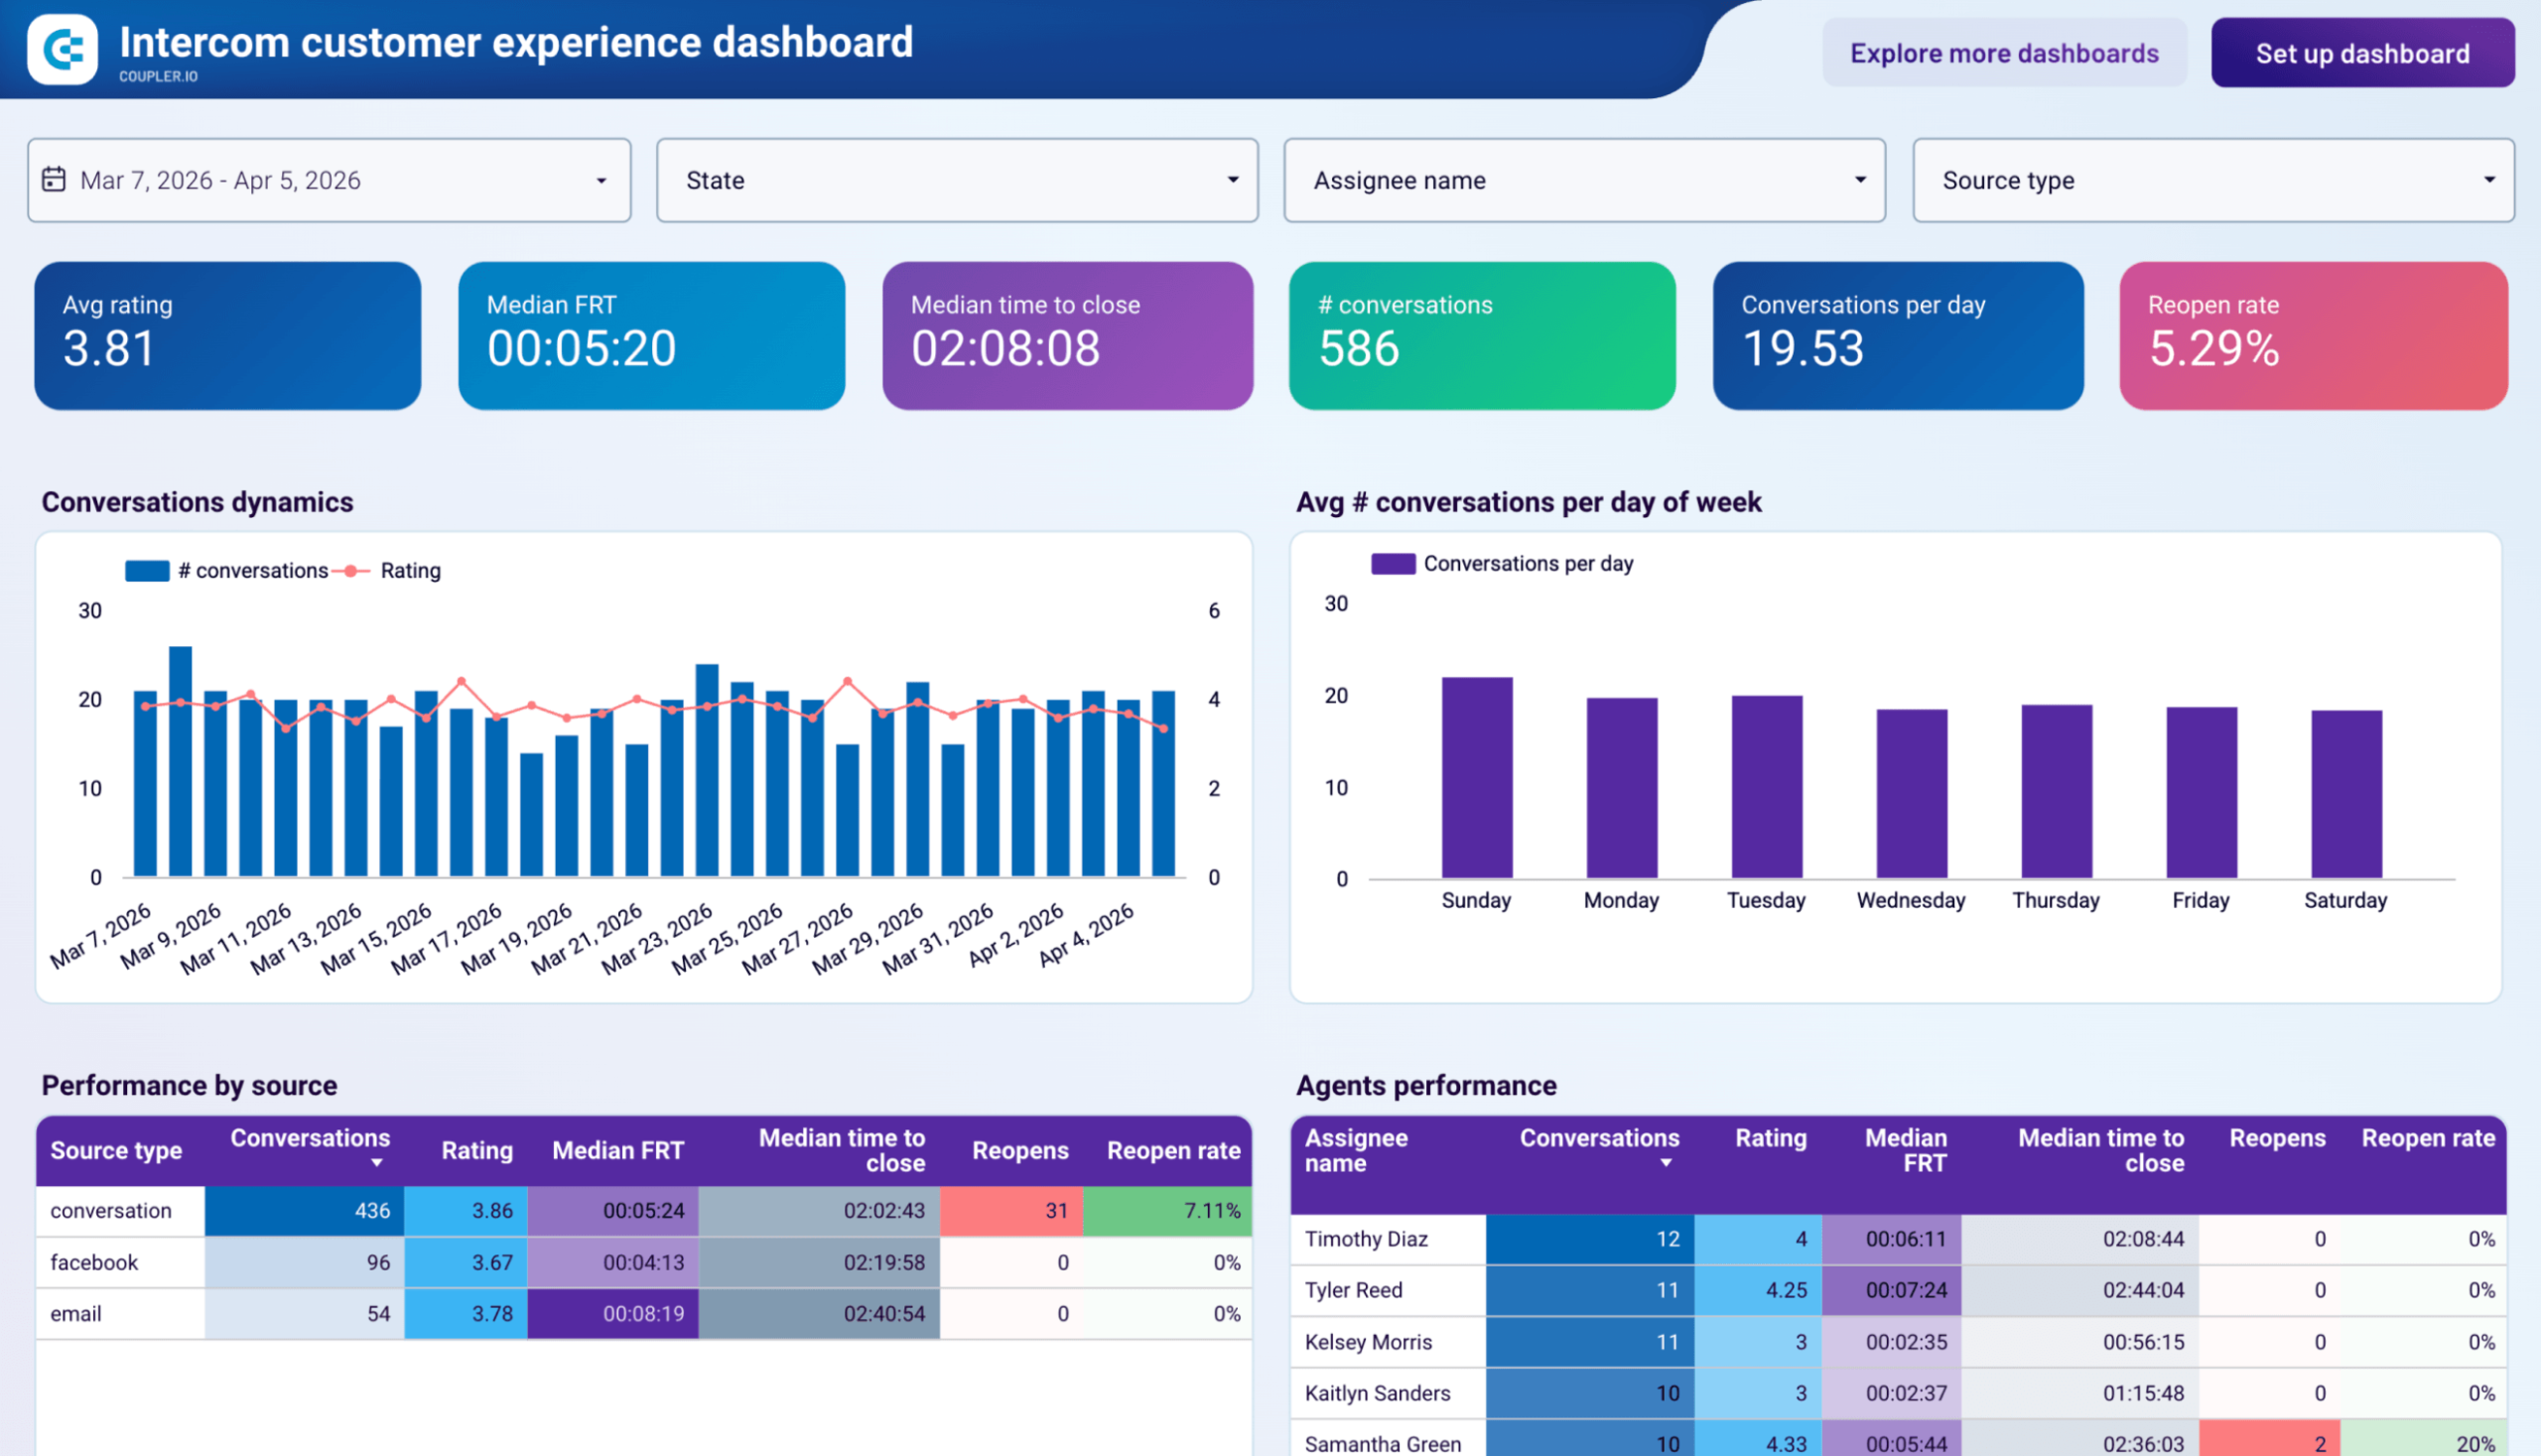
42. Intercom customer experience dashboard
Support teams live inside Intercom, but its native reporting only holds a few months of data and splits metrics across separate reports. To track service quality over a longer horizon, it helps to pull everything into one place. Coupler.io offers a free Intercom customer experience dashboard built in Google Data Studio for exactly this.
Intercom customer experience dashboard
 Preview dashboard
Intercom customer experience dashboard
Preview dashboardIt reports conversation volume, response and resolution times, satisfaction ratings, channel performance, and per-agent results from your Intercom account.
Report metrics:
- Avg rating
- Median FRT
- Median time to close
- Number of conversations
- Conversations per day
- Reopen rate
How to use automated marketing reporting templates
In our list, we introduced different examples of marketing templates. Some of them are built in Looker Studio, others are in Google Sheets, and so on. Therefore, the setup flows for each type will also be different.
Let’s check out what it looks like to use a Looker Studio marketing report template by Coupler.io. All our templates are available for preview for free. So, you can copy and adjust them for your needs.
However, if you also want to use the template and the built-in connector, you’ll need to create a Coupler.io account for free.
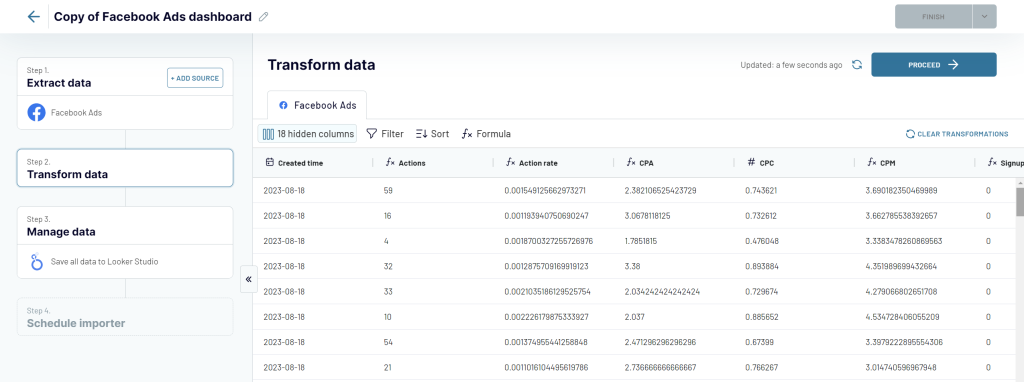
Once you have an account, open the template you want to use and go to the Readme tab. For this example, we will use the Facebook Ads reporting dashboard template.
- Open the dashboard and navigate to the Readme tab. Here you will find the link to click.
- You will be taken to the page where you need to connect your Facebook Ads account.
- Then, select Transform data to preview your dataset that’s about to be exported and check if everything is correct. After this, click Proceed.
- Now, it’s time to connect your Looker Studio account. Follow the instructions on the screen to complete the connection. You will need to click on Authorize to connect to Looker Studio and then click Connect to create a data source in Looker Studio.
- Once the data source is created, click Create report. As a result, you will get a copy of the dashboard with your data.
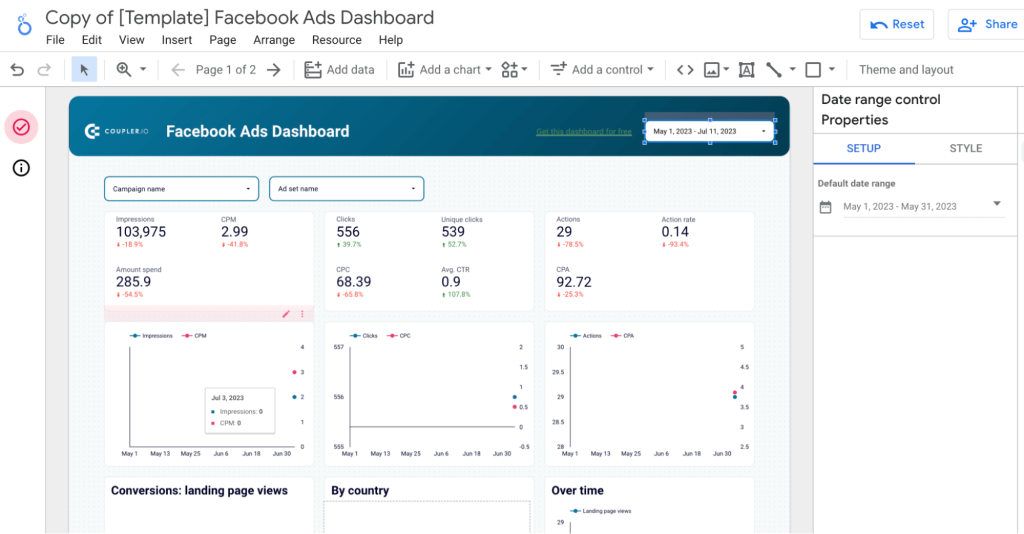
- Now, you can use Looker Studio functionality to customize your dashboard. If needed, you can add more data, move the blocks around, add and delete sections, and so on.
That’s it! The whole process only takes a couple of minutes. See other examples of our automated dashboards and templates, such as marketing dashboard templates in Google Sheets.
What is a marketing report for?
Marketing reporting refers to the process of gathering, organizing, and interpreting marketing data and metrics with the purpose of enhancing the performance of your campaigns and strategies. Such reports are usually created by marketing agencies or the marketing team of a company.
A marketing report allows you to track progress and define the areas where you need to invest more time or marketing budget. Also, reporting provides insights regarding the performance of each channel and activity you are executing. Marketing reports help you make data-informed decisions regarding marketing strategies. If you want to dig deeper into the benefits of this activity, we’ve prepared an article on marketing reporting that comes with useful and actionable best practices.
As you know, there are different types of reports depending on the channel, marketing strategy, and time period. Here are some of the most common types of reports used for marketing campaigns:
- Yearly marketing report
- Monthly marketing report
- Email marketing report
- SEO marketing report
- Content marketing report
- Digital marketing report
- PPC (pay-per-click) marketing report
- Traffic analytics report
- Lead generation report
What should a marketing report include?
Wondering what your marketing report should have to be insightful? Well, typically, a marketing report should include:
- Separate graphs for the most crucial aspects of your campaign.
- A set of the most informative metrics – as opposed to “vanity metrics” that look good but offer little meaning.
- A variety of visual elements – for example, different types of graphs for different metrics.
Depending on the type of report you are preparing (email marketing report, digital marketing report, yearly report, etc.), your final analysis will include different information and metrics. For instance, on a content marketing report, you will include details about bounce rate and organic traffic from Google Search Console, while on a PPC report, you will focus on cost per click and cost per acquisition.
How to create a marketing report
There are a few things you need to take into account before getting started with your marketing reporting activity, including whether or not you should use a reporting tool. Let’s take a look at what you need to do to prepare an analysis that is both actionable and easy to understand.
1. Start with the purpose of the report: Ask yourself why you are creating this asset and how it is going to be used. Make sure you know exactly what you want to track and what your expectations are. This way, it is going to be easier to present it to others and create an action plan based on the report.
2. Track the right metrics: Yes, metrics are important, and I know you want to fill your report with metrics showing progress. However, you need to focus on the ones that are essential and show the current status of your marketing campaigns. For example, for a social media report, the number of Page likes is not necessarily an essential metric since it’s more of a vanity one.
3. Gather and curate your data automatically: If you want to ensure that your data is up to date and correct, we recommend using a data automation solution that allows you to collect marketing data automatically and track changes in real-time. An example of such a solution is Coupler.io, a data automation and analytics platform that allows you to gather data from over 60 business apps, transform it, and create automated reports in Looker Studio, Google Sheets, or Microsoft Excel.
4. Focus on data visualization: It’s hard to understand hundreds of numbers that are just popping out in a simple marketing report. That’s why it’s best to include graphs, charts, and other data visualization elements that can make your report understandable and shareable.
5. Use ready-to-use templates: If you want to create a great report, it doesn’t mean you should start from scratch. There are hundreds of models and reporting templates you can use or get inspired by. We’ve curated a few for you. Let’s see them!
Using marketing reporting templates to measure progress
Creating marketing reports is an important part of marketing efforts that will help you have a complete overview and increase the performance of your campaigns. They are also essential for making your marketing data-driven, which is a must according to the latest marketing trends. There are various things that you need to consider before creating a marketing report, including what tools and templates to use.
Also, when creating marketing reports, we recommend using an automation tool that will export your data on a schedule to ensure that the information and metrics are up to date. Automating your reporting will help you work with fresh and correct data while allowing you to focus on what matters instead of manually adding information from various platforms.
Lastly, using reporting templates makes it simpler for you to create assets that are easy to understand and share with stakeholders. Templates come with key metrics you need to keep track of, as well as good design and data visualization elements like graphs and pie charts.