We have all used pivot tables in Microsoft Excel while working with large datasets. They help organize and summarize records for a quick analysis.
Power BI beginners may notice that it does not explicitly offer such a “pivot table” feature. However, a matrix visual helps you get similar results by summarizing records.
In this post, learn how to create a Power BI pivot table using a matrix visual.
What is a pivot table?
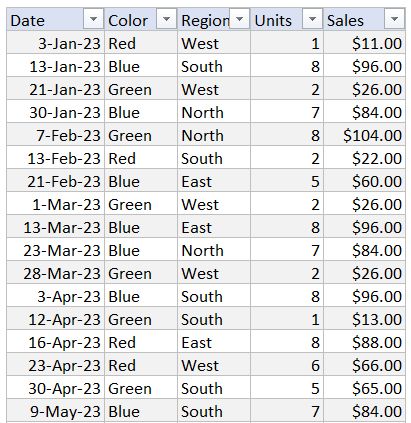
This is a powerful tool that aggregates or summarizes certain value columns within a specific category or group from a larger dataset or table. Let’s understand this through an example: consider a sales dataset containing columns like date, product color, region, and sales revenue, as shown below.
We can create a pivot table to derive summarized revenue data by product color and region. For example, here’s what it looks like in Excel:
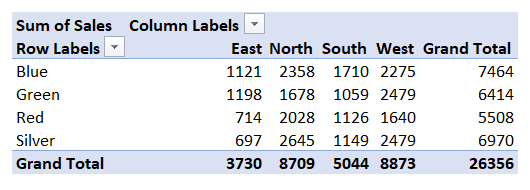
See the difference? Pivot tables make it much easier to interpret data for complex datasets.
You can also apply various summarization methods to the values, like sum, average, min, and max and analyze data as per your needs.
Learn more about Power BI SUMMARIZE and DATEDIFF function in Power BI.
How to create a pivot table in Power BI using a matrix visual?
First, connect (if you haven’t yet) the data sources you want to use for your pivot table. Then, you can use a matrix visual to create a pivot table by selecting fields for columns, rows, and values from your data. You can also customize its appearance to look like Excel pivot tables.
Let’s go through this step-by-step.
Step 1: Load data into Power BI
You can use native connectors or a no-code platform like Coupler.io to transfer your data. Coupler.io supports over 60 various data sources and can send your data to Power BI automatically on a schedule. It’s quite convenient to use as it allows you to manage all your data sources in one place.
To start transferring your data, select your data Source in the widget below and click Proceed.
Sign up for a Coupler.io account for free and configure the data source. Next, in the transformation step, you can preview the connected data and perform various modifications. Moreover, Coupler.io lets you connect multiple cloud sources and merge tables in Power BI.
Then, proceed further to the destination settings and copy the importer URL.
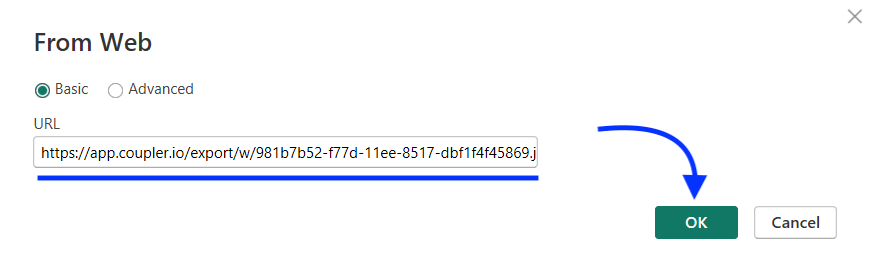
Now, open the report in Power BI Desktop and navigate to Home > Get Data > Web. Paste the copied importer URL into the corresponding field and click “OK.”
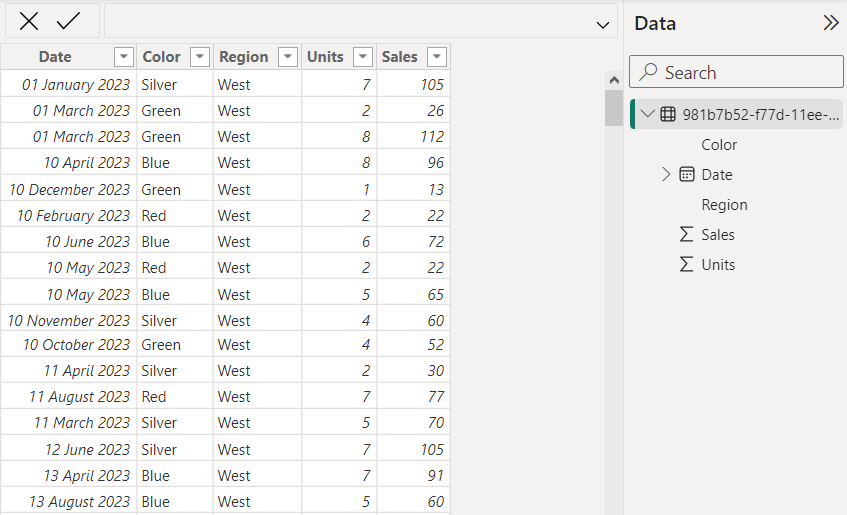
The data will be loaded and previewed in the Power Query Editor. If necessary, modify it and click “Close & Apply” to load it into your report. The data source will be connected to your report.
You can also schedule automatic data refreshes from the Coupler.io interface. It can update your data as often as every 15 minutes, giving you access to almost real-time data.
Step 2: Add a matrix visual
Now, we’ll use the matrix visual to create a pivot table in Power BI.
In your Power BI report, expand the Visualization pane on the right side. Select the Matrix visual from the Build visual tab, as shown below. It will create a blank matrix visual.
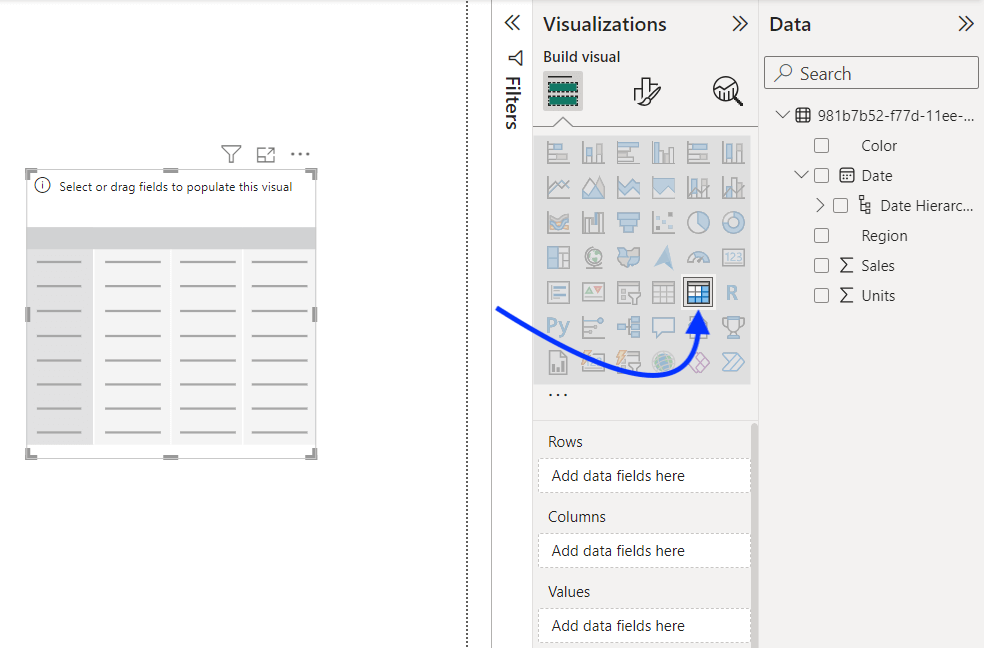
In the same visualization pane, select the following:
- Columns – These fields appear as vertical columns in the pivot table
- Rows – These fields appear as horizontal rows in the pivot table
- Values – These fields are summarized in the table based on columns and rows
In each, you can add single or multiple fields as per your data analytics needs. You can also drag and drop fields from the data pane, as shown below.
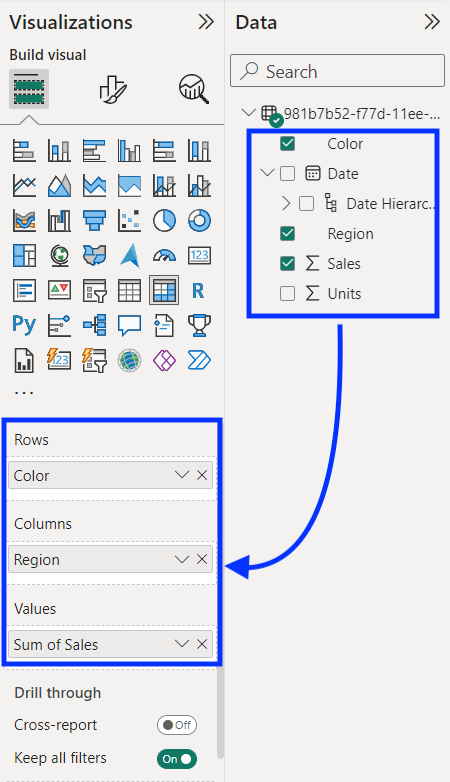
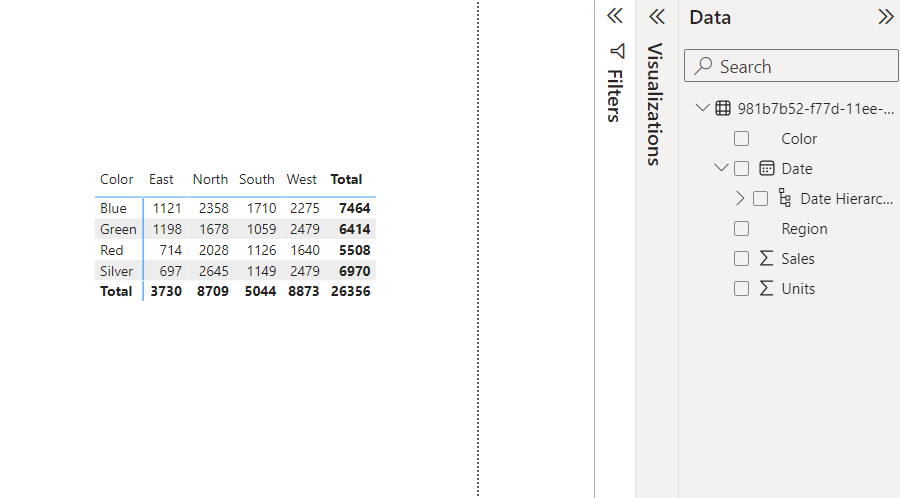
This will create a matrix visual, similar to the pivot table, with summarized values for the selected columns and rows. Here’s what it looks like:
Step 3: Apply visual formatting
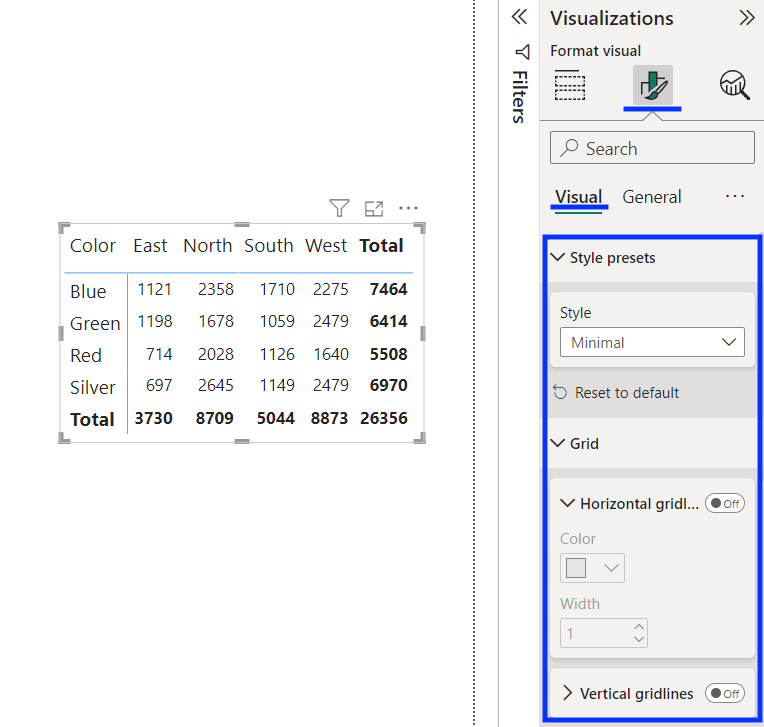
To make the Matrix visual look like an Excel pivot table, you can modify its appearance from the Format visual tab. You can change its formatting as per your choice, but here’s our recommendation:
- Style – Select the “Minimal” style from the list
- Horizontal Grid – Disable the horizontal grid
- Vertical Grid – Disable the vertical grid
You can also change the background color and other settings for the headers, values, and grand totals for the Power BI pivot table.
How to work with pivot tables based on a matrix visual
With the steps described above, you can create a basic pivot table for the summarization of values. But you may need additional features while working with more complex datasets.
Here are some key functionalities to extend your data analytics using pivot tables in Power BI.
Sorting
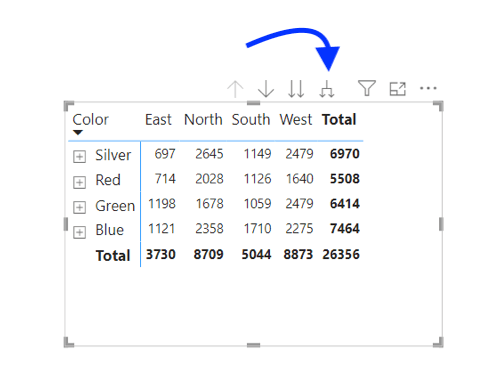
You can sort the matrix visual (pivot table) by its row field or the subtotal column. Click the row header or subtotal header to sort the matrix.
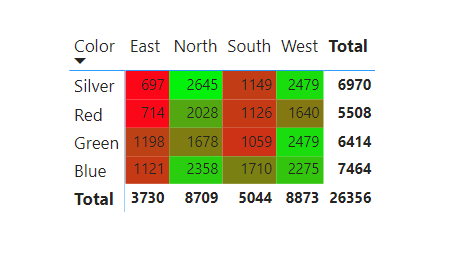
The up or down triangle in the row header represents the column used for sorting. For example, in the screenshot below, the pivot table is sorted by using the “Color” row.
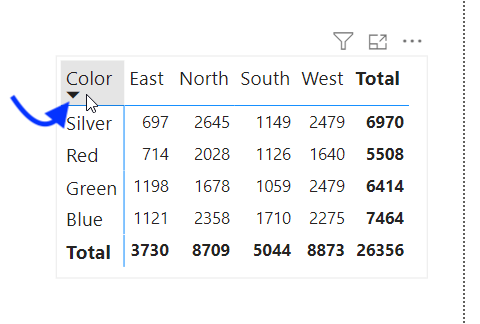
You can toggle ascending or descending sorting by clicking the same header again.
Filtering with a slicer
In Power BI, the Filter pane can apply general filters to the matrix visual. But for a more interactive experience, it’s recommended to add a slicer. This helps users quickly filter the pivot table based on other columns.
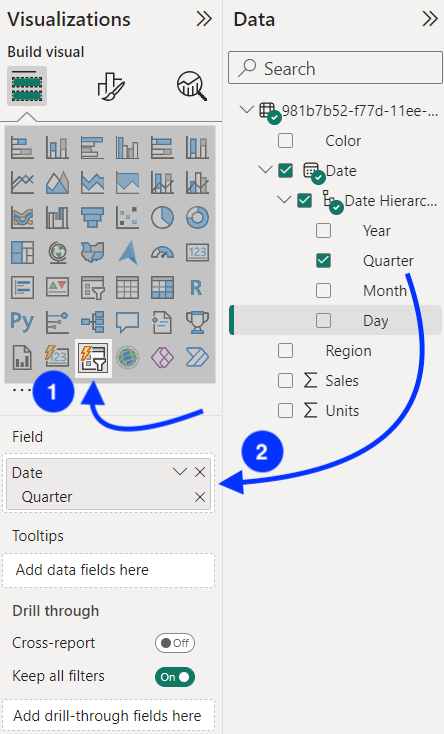
To add a slicer to a pivot table in Power BI, select the Slicer visual on the Visualization pane and add the field that you want to use for slicing the data. In this example, we add a date-based slicer to filter the pivot table based on quarters.
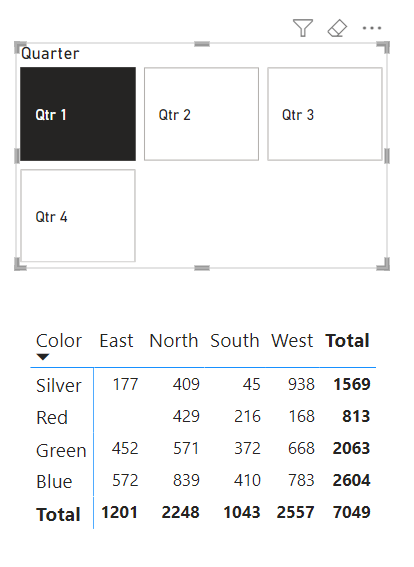
This will add a slicer to the Power BI report, which you can use to filter or slice the matrix visual data. For example, here, we’ve created a slicer using the Quarter value from the date column. Now, selecting the quarter (let’s say Qtr 1) will filter the Power BI pivot table to show data falling in that quarter only.
If needed, you can also customize the layout of the slicer in Power BI from the formatting pane.
Conditional formatting
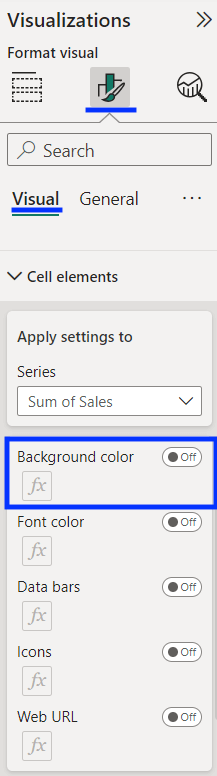
You can apply conditional formatting to the cells containing values to make them easy to read. To do so, select the matrix visual and go to the Visualizations pane. Expand the Cell elements section to see the conditional formatting options.
Here you can change background color, font color, data bars, icons, and website URLs. For example, to apply conditional formatting to the background color, toggle the option and click the “Fx” button under it.
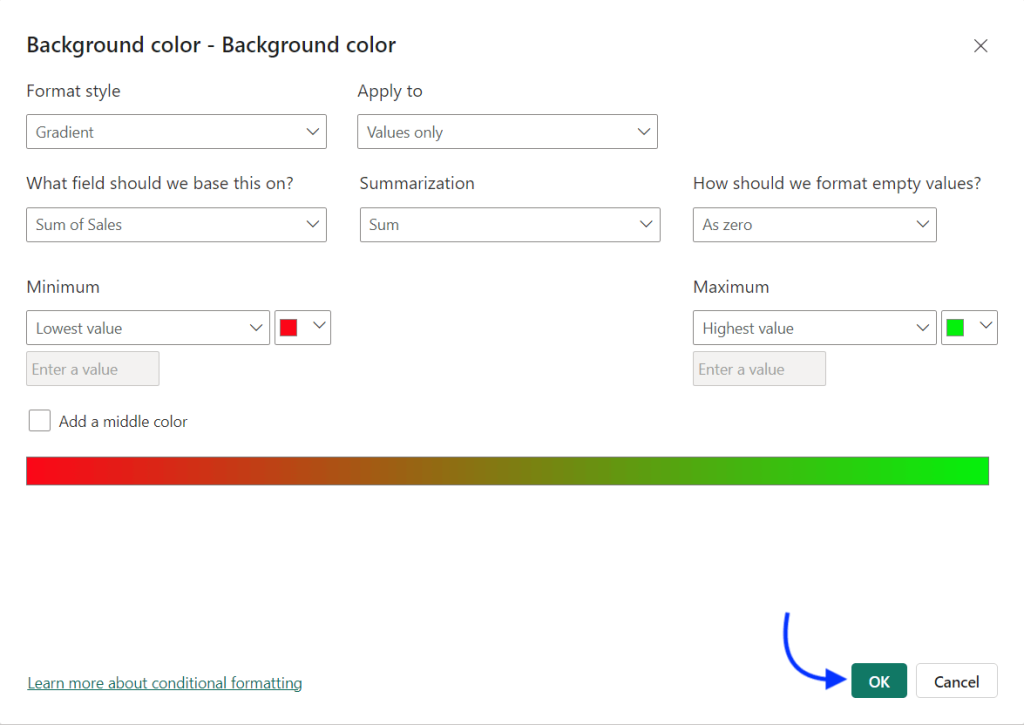
Now, set how you want to format the cell background color. You can choose the format style from the following:
- Gradient – Change the background based on a color scale
- Rules – Define custom rules to change the background color
- Field value – Assign color based on the specific field values
In the example below, we’ve applied gradient-based conditional formatting based on the sum of values. Once you’re done with the settings, click “Ok” to apply the formatting.
Here’s what the results look like:
You can also apply the data bars conditional formatting to create a PivotChart-like visual in Power BI.
Data aggregation
By default, the matrix visual summarizes all the values in the column (i.e. adds all the values.) But, you can change the aggregation type as per your analytics needs. For example, instead of a sum of values, you may need the average of values in certain cases.
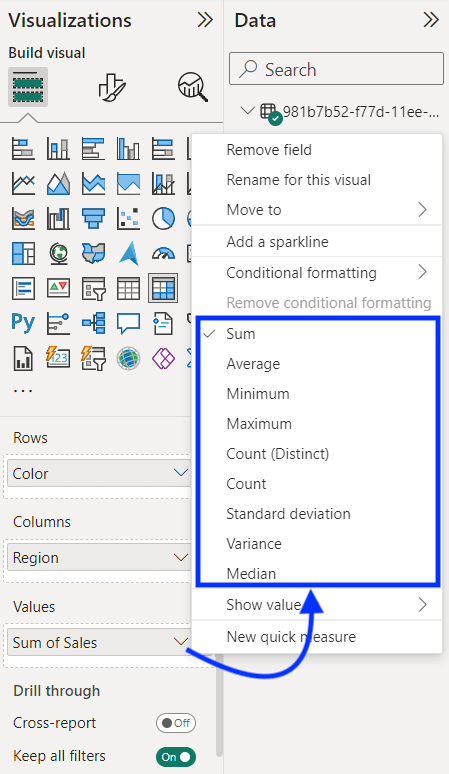
To do so, click the column name under the Values and select the aggregation type from the following:
- Sum
- Average
- Minimum
- Maximum
- Count (Distinct)
- Count
- Standard deviation
- Variance
- Median
Adding multiple columns, rows, or values
For complex datasets, you may need to add multiple columns, rows, and values to the pivot table in Power BI.
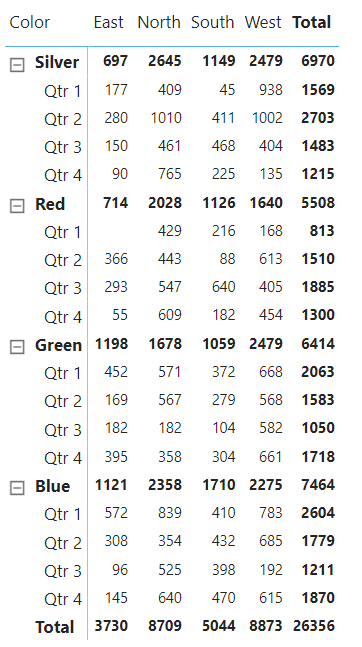
Let’s say we want to add another row (i.e., Quarter) to the matrix visual. You can easily do that by dragging and dropping the field into the Rows section.
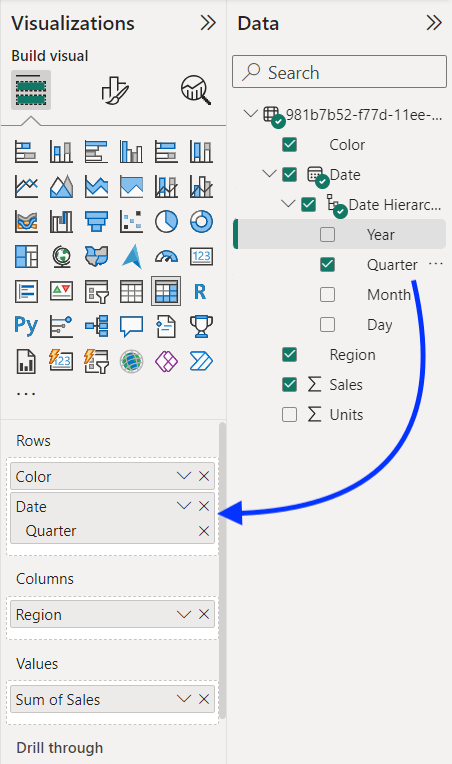
Then, click the + (plus) sign on the left or the double-headed arrow icon to expand the pivot table to all rows.
Here’s what the Power BI pivot table with multiple rows expanded looks like:
Similarly, you can create pivot tables with multiple columns and rows to summarize values by important fields in the dataset.
Check out our blog post on how to create calendar table in Power BI.
How to use a pivot table in Power BI for various business purposes
Ecommerce sales analysis
Online sellers can create a pivot table to analyze sales data using product categories as the column and order date as the row. It can help identify the best and worst-performing categories in the store over time.
For example, here’s a pivot table showing the quarter-wise number of items sold in each product category:
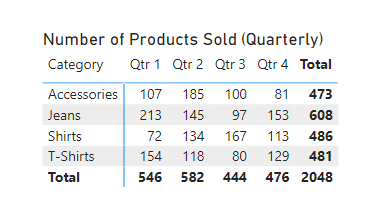
Further, you can apply other conditional formatting to visually compare the sales data across categories.
Marketing data analysis
Marketers can use the pivot table to analyze campaign performance and build a data-driven strategy.
For example, you’re running digital ad campaigns across different channels. You can use a pivot table to identify which campaigns are performing well.
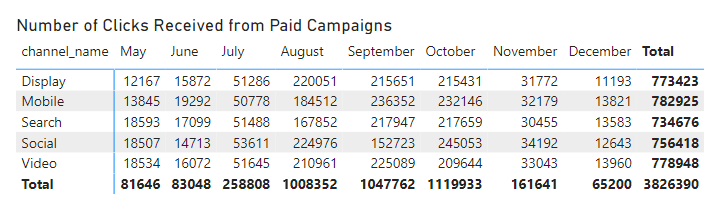
Similarly, you can use it to analyze other marketing data and get helpful insights.
Spending & financial data analysis
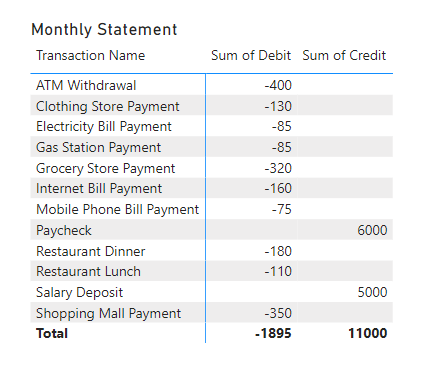
Pivot tables can help you summarize bank statements and plan your budget. For example, you can summarize the credit and debit amounts by transaction name.
Here’s a simple example of using a pivot table in Power BI for bank statement analysis.
The above examples demonstrate the applications of pivot tables across verticals. In business intelligence, they’re used for more complex analysis and summarization.
Is it possible to create pivot tables from dynamic data sources?
Yes, it’s possible. In Power BI, the matrix visuals are automatically updated when the source changes.
However, you must set up scheduled refreshes for every dataset used in the visual. But there is a better way to build dashboards and visuals that refresh automatically. You can use a data automation platform like Coupler.io to connect your dynamic data sources.
Coupler.io helps you automatically refresh your data on a schedule. It allows you to build near real-time dashboards and reports while handling all your data sources in a single interface.