Your Guide to Setting up Bing Ads Analytics. What Metrics to Track and How to Customize Your Reports

Are your Bing Ads campaigns performing well? I hope they are, but even if so – there’s always room for improvement. And streamlining Bing Ads analytics is precisely what can help boost your ad results. When you track metrics closely, run experiments, and decipher the correlations, you can easily figure out what is working and what isn’t.
From this article, you will learn how to organize Bing Ads analytics effectively. I will explain how to build custom reports and live dashboards, and how to integrate Bing Ads analysis into your cross-channel PPC reporting. So, let’s get started!
How to set up Bing Ads analytics: options you have
Bing Ads, which is now called Microsoft Advertising, is a valuable addition to your set of PPC channels. It can help you cover audience segments that might not be reached by ads running on other platforms. In your Microsoft Advertising account, you have dozens of pre-set default reports. But you may quickly notice that they are not so very helpful for Bing Ads analysis.
There are some limitations to how you can segment data, audience overlap analytics is also not the best, and some attribution models might not be supported. Options for customization and visualization are also limited. On top of that, Bing Ads doesn’t store your ad information forever – after some period, data will be lost or summarized (for example, hourly data merged into daily).
How can you fix this and set up analytics in a format that works for you?
You can build your analytics in different ways:
1. Work with your data inside Bing Ads with custom reports
If standard reports don’t include everything you need, you can create custom ones. This can be done with native functionality within your Microsoft Advertising account. Custom reports offer you more freedom as you can add what’s missing and remove what’s unnecessary. Apart from this, you can change and rearrange tiles on the overview dashboard, explore your data in a graph form, and so on.
However, these customization options are not endless. Microsoft Advertising can’t offer you the same level of flexibility as data viz and BI tools. And if you need to perform cross-channel PPC analysis, that’s also not an option. Although custom reports do offer more freedom compared to standard ones, most limitations we mentioned are still there.
2. Analyze metrics in a custom dashboard or report outside of Bing Ads
You don’t have to limit yourself to native Bing Ads analytics. You can create custom reports in a spreadsheet app or build live dashboards with BI tools outside of Microsoft Advertising. And, of course, there’s no need to manually export-import CSV files with Bing Ads data for this.
You can automate the whole analytics reporting process, and it’s actually easier than it sounds. For example, you can use such a solution as Coupler.io. It’s a professional’s choice for automating marketing reporting and PPC reporting in particular. With Coupler.io, you can extract your Bing Ads data on a schedule, transfer it to another app, and refresh Bing Ads data in the custom analytical report or dashboard you built.
In addition, Coupler.io can collect data from a bunch of other ad and marketing apps. This means you can use one tool to bring all your ad data in one place and easily build an auto-updating cross-channel PPC report. If you’re not down to create reports from scratch, you can always opt for Bing Ads report templates.
The latter is a great way to simplify and streamline your analytical reporting, so we’ll start with exploring this option first. After all, who doesn’t want their reports to be ever-green and always analysis-ready without having to lift a finger? Let’s see how to get there!
How to automate your Bing Ads analytics in just a few minutes
Automated reporting is a great way to organize Bing Ads analytics and PPC analytics in general. To set it up, first, you need to decide in what app it would be most convenient for you to analyze your metrics.
- Some people prefer spreadsheets with their formulas and advanced calculation capabilities.
- Others are in favor of BI tools with their rich data viz functionality.
- If you are planning to conduct deep analysis using ML algorithms, then, a data warehouse can be a good choice as well.
Once you know where you want to work with your ad data, you will need a tool to automate the data flow and make sure data from Bing Ads is transferred into your analytics app on time. Then, you will be able to build a Microsoft Ads dashboard or analytical report in the destination app using fresh data automatically exported from Bing Ads.
In our example, we’ll see how to automate your ad data flow with the help of Coupler.io, a popular data analytics and automation platform. This solution is a good fit for marketing professionals as it’s very user-friendly, and you don’t need any tech knowledge to use it.
Coupler.io allows you to automate reporting and analytics by collecting data from Bing Ads and 330+ other sources and sending it to an app of your choice for data analytics. These can be data viz and BI tools (Looker Studio, Power BI), spreadsheet apps (Google Sheets, Excel), and databases (BigQuery). In particular, Coupler.io can collect data from plenty of ad and marketing sources, such as Facebook Ads, LinkedIn Ads, Google Analytics 4, Google Ads, Mailchimp, and more. And, of course, Bing Ads (Microsoft Advertising) is one of them. This is useful to create multi-channel paid ad performance reports like this one.
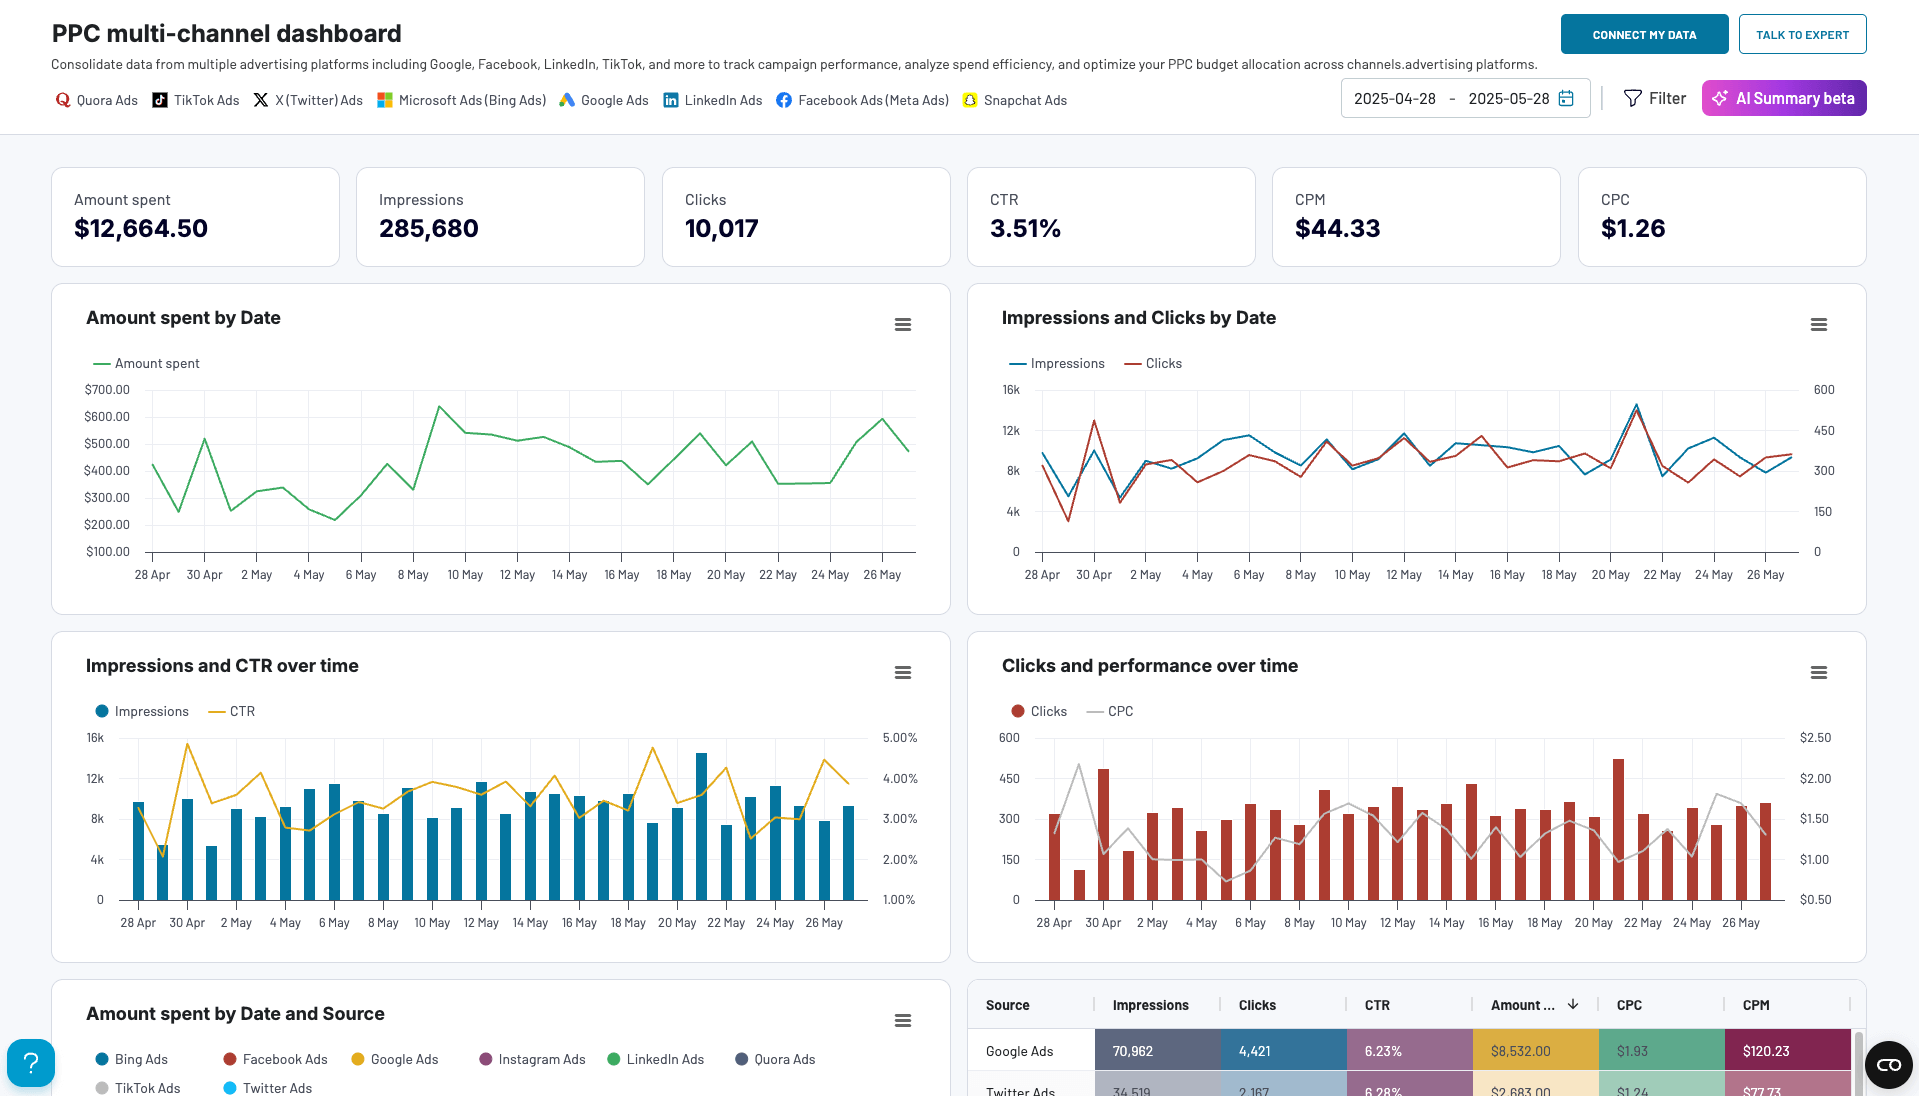
Apart from this, Coupler.io can automatically update your ad data imported into another app. This means you can use Coupler.io to create auto-updating reports or live cross-channel dashboards like the one above. It includes data from Microsoft Ads (Bing Ads), as well as data from several other PPC channels (Instagram Ads, Quora Ads, etc.). Such a dashboard can be a valuable instrument for analyzing your data and making informed decisions.
Now, let’s see how to channel your Bing Ads data into a data viz tool or spreadsheet app where you can build custom analytics.
First, sign up for Coupler.io – you can do this in just a few clicks, no card required. Then, select Microsoft Advertising as a source and choose your destination.
You can send your Bing Ads data directly to Looker Studio or Power BI. Alternatively, you can transfer it to a spreadsheet app and work with your data there – or connect your auto-updating spreadsheet to Tableau, if you prefer this tool. For advanced analysis, loading Bing Ads information into a data warehouse (BigQuery) is also available. Use the form below to get started for free.
Step 1. Collect your Bing Ads data automatically
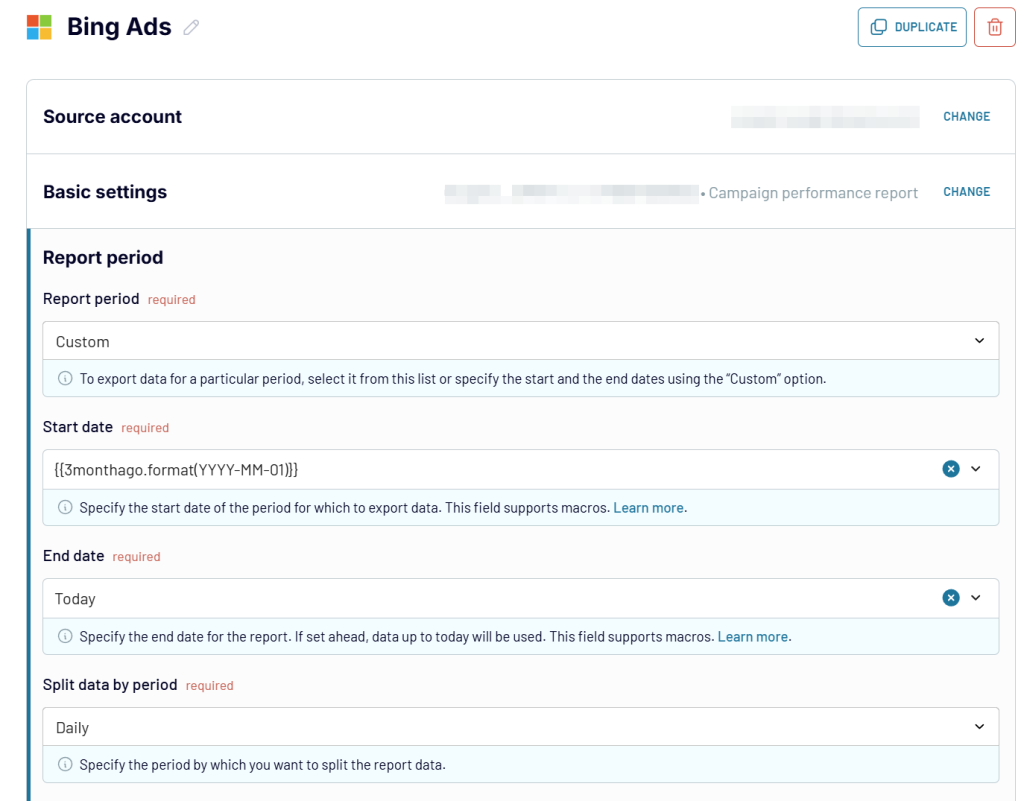
Then, follow the in-app instructions to set up a data flow. Connect your Microsoft Advertising account, specify ad accounts and what data you want to extract, as well as other parameters:
You can also add other data sources to combine with your Bing Ads data.
Step 2. Preview and transform your data set
In the next step, Coupler.io preloads the dataset that is about to be exported. You can edit and transform it in different ways:
- Hide, rename, and rearrange columns that you don’t need for your report
- Add new formula-based columns – for example, to calculate custom metrics
- Sort and filter your data, as well as blend data from different ad apps into one dataset
For example, in the screenshot below, you can see a preview of a multichannel dataset. It was created directly in Coupler.io by blending together data from Bing Ads (Microsoft Advertising), Facebook Ads, Google Ads, and LinkedIn Ads.
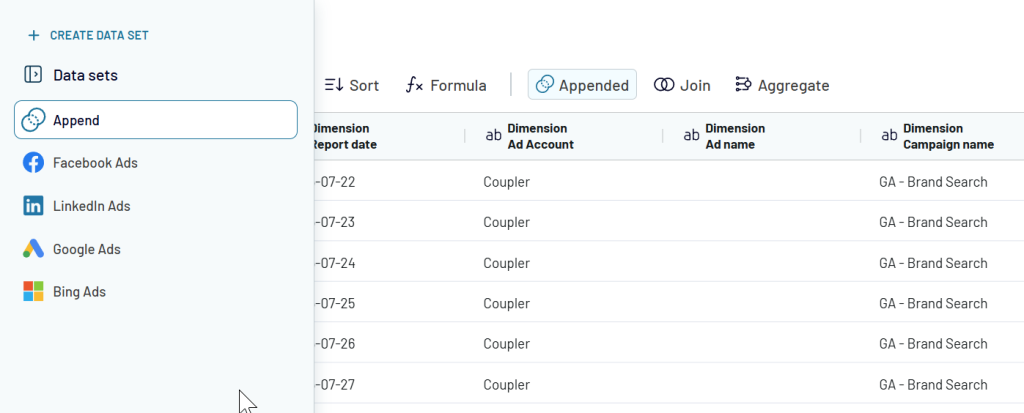
Data is combined based on column names. For instance, impressions from Facebook Ads for a specific campaign can be merged with impressions from Bing Ads to give a total number of impressions. As different platforms use different conventions, you need to rename columns so that they can merge correctly.
If you don’t need to transform your data, you can skip this step and just connect your destination account.
Step 3. Load data and schedule updates
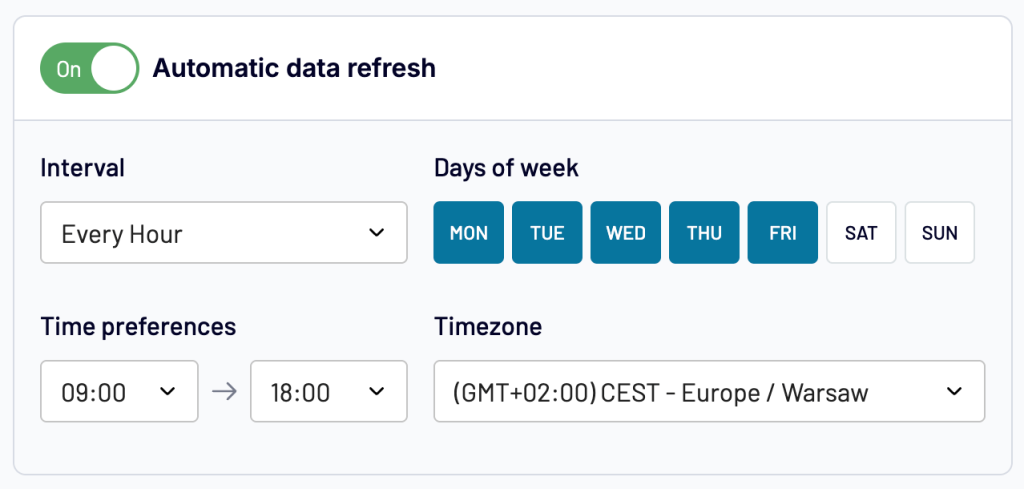
One of the great things about Coupler.io is that it can refresh your imported data in the destination app automatically on a schedule. This means your Bing Ads analytics performance report or real-time dashboard can always stay to date – without any manual effort from your side.
To activate this functionality, toggle on Automatic data refresh and specify your preferences for the schedule.
Once everything is ready, save and run the data flow.
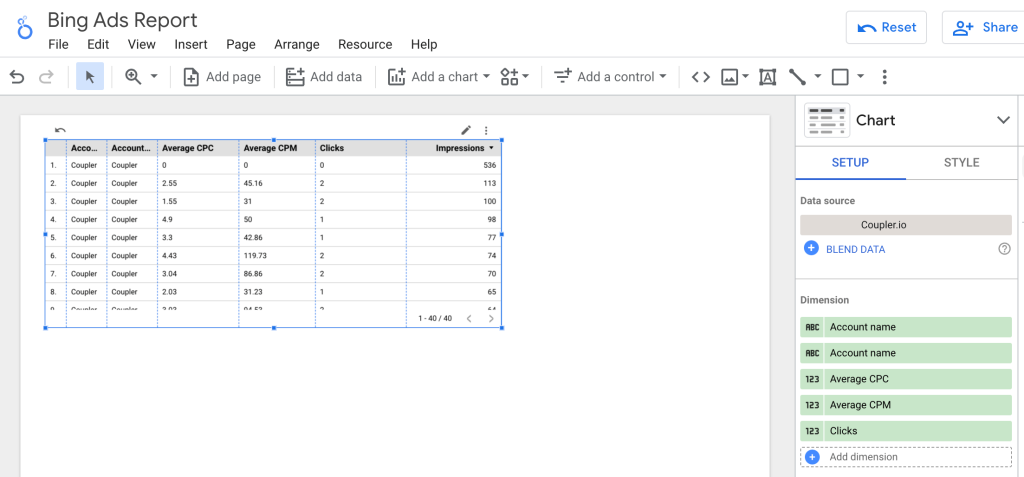
And here’s an example of a sample Bing Ads dataset transferred to Looker Studio. Now you can use Looker Studio’s full functionality to visualize your data. This is a great way to set up custom Bing Ads analytics. You can add other datasets to your report, present your data with various graphs and charts, perform calculations, and so on.
With a custom report tailored to your needs, you can focus on what matters most and gain full transparency into your data. Apart from that, visualized data is easier to work with, so this will help you streamline Bing Ads analysis.
And this is how the same sample dataset looks when imported to Google Sheets:
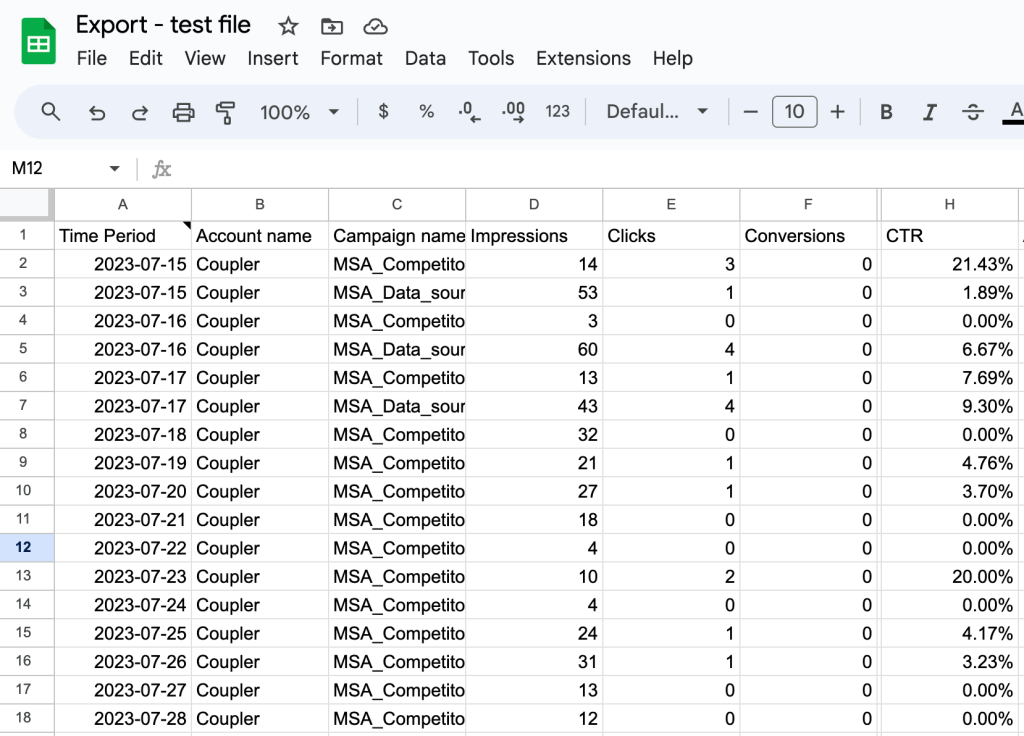
If using spreadsheets is more convenient for you, you can analyze Bing Ads metrics in Google Sheets or Excel. This is convenient if you want to perform calculations, use formulas, and manipulate data with ease. Google Sheets or Excel’s native functionality also allows you to build simple graphs and charts if needed.
When creating a self-updating ad report in a spreadsheet app, typically you need to leave one sheet for raw data (like the sample dataset shown above). Then, you go to another sheet and create your report there. When Coupler.io updates raw data, the numbers in the report on the connected sheet will be refreshed.
This is also a great way to set up custom Bing Ads analytics. You can select yourself what data to include and what to omit, and how to better organize it according to your needs and goals.
How to analyze Bing Ads with native functionality?
But what if you want to stick to native functionality? If you are only starting to experiment with Bing Ads and in-built analytics is enough for now, that might be an option as well.
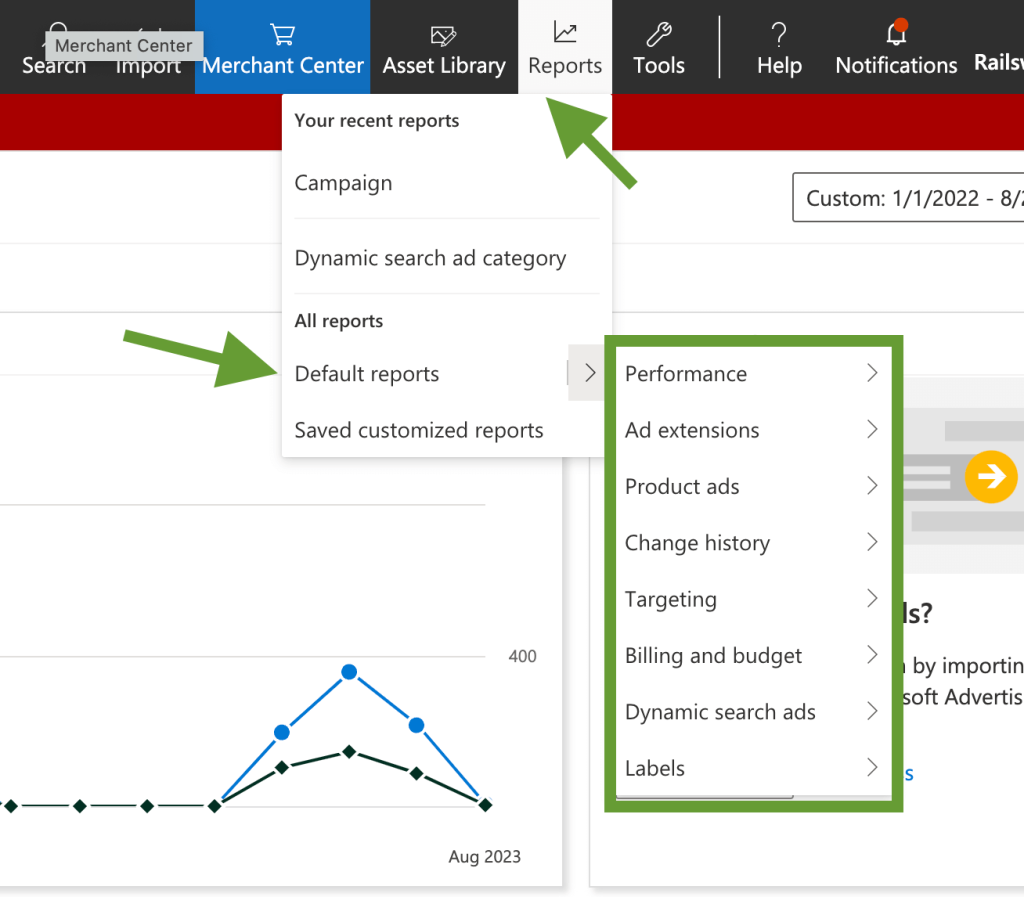
Apart from the dashboard on the main page of your Microsoft Advertising account, you will also find dozens of standard reports available. You can access them by clicking on Reports -> Default reports.
For example, you can check performance by campaign, ad group, keyword, and so on.
But it’s likely that sooner or later you will want to customize these reports. Let’s have a look at how to do this.
How to create customized reports in Bing Ads?
You can create a customized report by changing one of the standard reports and saving it.
To do so, log in to your Microsoft Advertising (Bing Ads) account, and on the top menu panel click Reports -> Default reports. Then, select the report you want to customize, open it, and make the required changes. For example, you can hide or add columns, as well as drag and drop column headings to rearrange their order. You can also add filters, change the date range, select specific campaigns for analysis, and so on.
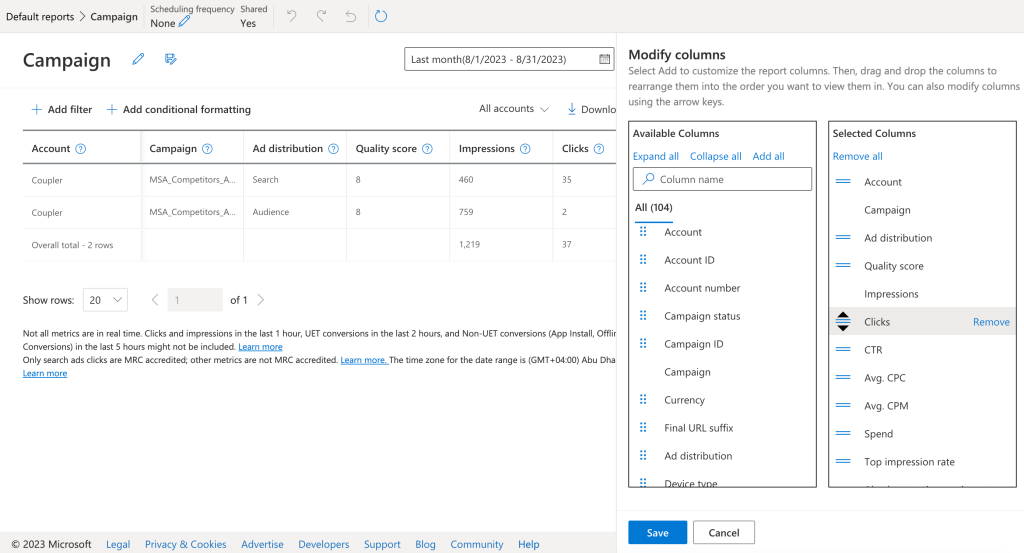
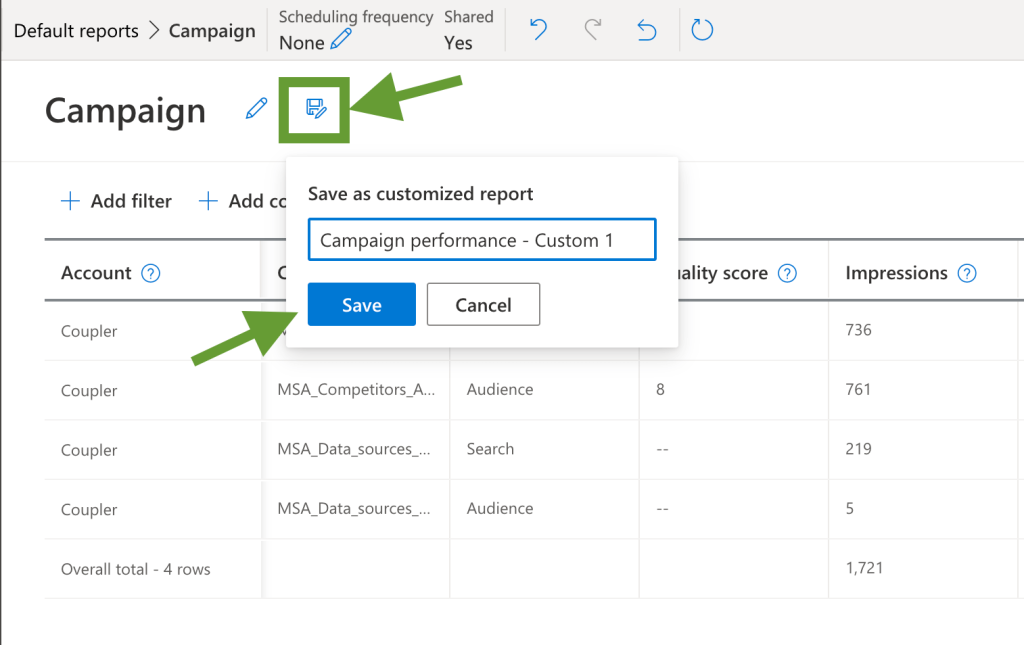
Once your customized report is ready, rename it so that you can find it later on in the list. Then, save the changes.
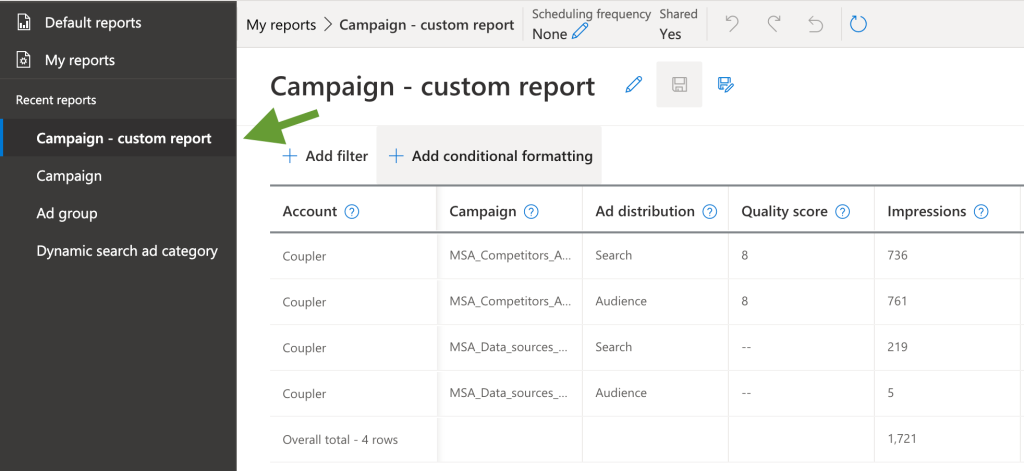
Later, you can access it by going to Reports -> Saved customized reports. Also, you will see it on the list of your Recent reports in the menu on the right.
Using custom reports, you’ll be able to analyze Bing Ads data faster and more easily.
However, as we already mentioned, customization options are still limited. If you want full freedom for manipulating your data, performing calculations, or building visualizations – it’s better to extract data from Bing Ads. In the previous section of this article, we already explained how you can automatically transfer your ad data to data viz and spreadsheet apps.
Two ways to integrate Bing Ads analytics into your cross-channel PPC analytics
Obviously, Bing Ads is not your only ad tool, and most campaigns run on several platforms at once. So how do you bring that data together and analyze a specific campaign across several PPC channels?
- You can use a reporting automation solution and import data from various PPC apps into one hub for analysis. This can take the form of a report in a spreadsheet app or data visualization in a BI tool.
- Alternatively, you can plug your Bing Ads account into another platform, such as GA4, and analyze it from there. It can be convenient if you use Google Analytics to track other PPC channels as well – for example, Facebook Ads. However, Google Analytics doesn’t pull all the data collected by other platforms due to different approaches to metrics, click tracking, etc.
Let’s explore both options in a bit more detail.
1. Creating a live cross-channel dashboard: build once, use forever
If you use Coupler.io as a reporting automation tool, you can easily integrate your ad data from various ad apps into one report or dashboard. We already described how to extract Bing Ads data automatically on a schedule with Coupler.io. You can export information from other ad apps in the same way and channel this data into one report. For example, you can connect GA4, Google Analytics, LinkedIn Ads, Instagram Ads, Quora Ads, TikTok Ads, and other social media platforms.
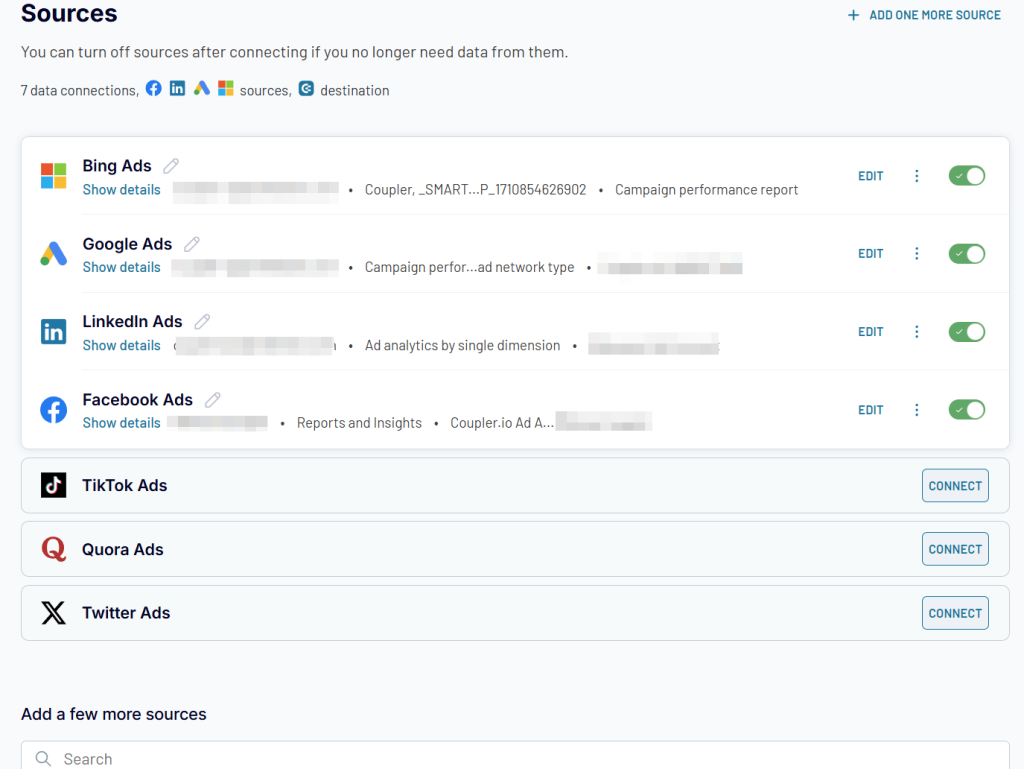
To do so, you can add a separate importer for each data source. This will look as follows:
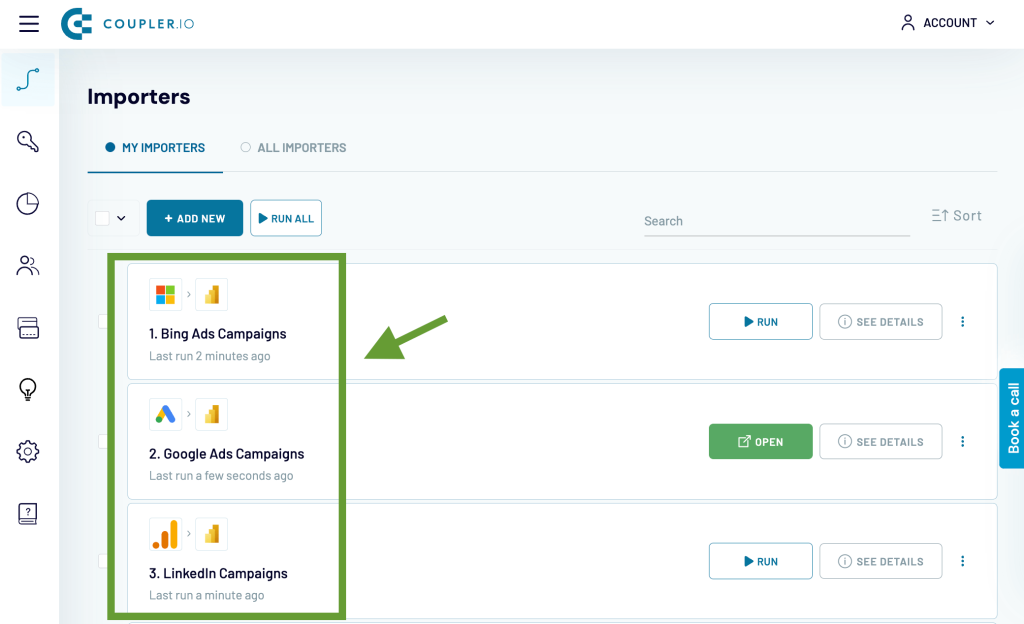
Alternatively, you can add multiple data sources to one importer – in this case, you will be able to combine this data into one dataset. To do so, just start setting up an importer as usual, then click +Add one more source. Here’s an example of an importer that exports data from several PPC channels and sends it into one Looker Studio dashboard as one dataset.
You can add as many sources as you like to one importer – in this case, Looker Studio will treat it as just one source. This is much better for dashboard performance, as Looker Studio is notorious for getting slow when you connect more than two sources.
Using Coupler.io, you can create self-updating cross-channel dashboards in your favourite BI tools. Here’s an example of how it may look – a PPC dashboard combining data from different ad applications, including Bing Ads (Microsoft Ads).
Such a dashboard is a great analytical tool for monitoring, analyzing, presenting, and sharing your ad data. You can apply different filters, switch between various periods, compare campaign performance across channels, and more.
Apart from that, of course, you can monitor each PPC channel on a separate dashboard – they can also serve as useful analytics tools for data-driven decision-making. Actually, you can get a bunch of such dashboards literally in minutes thanks to automated templates. Although we don’t have a template for a Bing Ads dashboard for now, I still recommend you take a look at the templates for other ad apps. This can be a useful addition to automating your PPC reporting.
Grab these free marketing dashboard templates:
- Google Ads report template
- Facebook Ads report template
- LinkedIn Ads report template
- Web Analytics Dashboard
- YouTube Dashboard
To start using them, open the template you need and click the Readme tab in the menu on the right. These templates are fully automated, so you will only need to plug in your Looker Studio account and your account for the selected ad source.
Check our template gallery for more dashboard templates – such as CRM templates or web analytics dashboards.
2. Tracking Bing Ads analytics in GA4
Some people might find it useful to integrate Bing Ads analytics into Google Analytics 4. This will give you an opportunity to monitor Microsoft Ads performance directly in your Google Analytics account.
The advantage is that you can have it all in one place without switching between the two platforms. The downside is that it won’t give you much flexibility. Even though you can also integrate your data from other channels, like Facebook Ads, GA4 doesn’t pull the full amount of data available, so some metrics can be missing. For this reason, we would still recommend the previous method, when you can extract all data from your ad apps and gather it in one app for analysis.
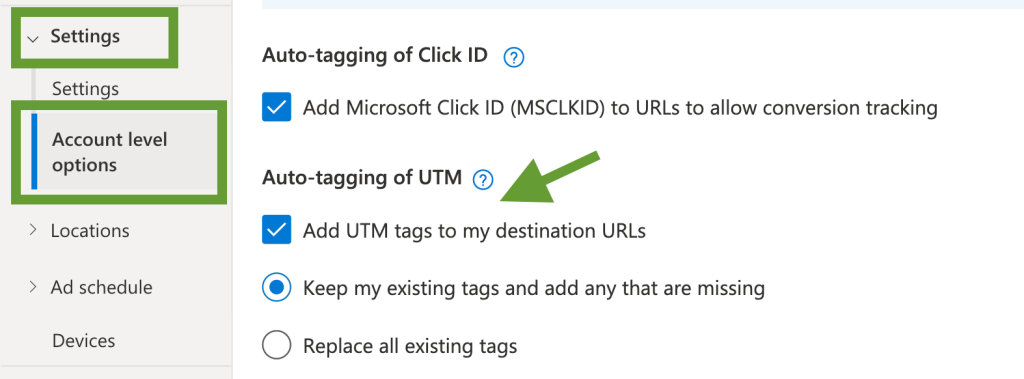
But if you want to plug in Microsoft Ads (Bing Ads) into Google Analytics 4, here’s how to do this:
- Log in to your Bing Ads account
- Go to Settings -> Account level options
- Enable Auto-tagging of UTM to my destination URLs
- Select Keep my existing tags if you already have some tags from before and want to keep using them. Otherwise, you can choose to Replace all existing UTM tags (recommended).
That’s it! Now you’ll be able to track your Bing Ads performance directly from your Google Analytics account.
This can be a rather convenient option for Google Analytics users. It allows you to track bounce rate, sessions, time on site, goals, and other metrics. You can also use Google Analytics data to compare Bing Ads performance reports to the results achieved on other PPC channels.
Learn more about performance marketing for SaaS.
What are the key Bing Ads metrics to track?
| Metric | Meaning | Formula |
| Cost per click (CPC) | How much you pay for a click on average. It’s calculated by dividing your total campaign budget by the number of clicks. | CPC = Total cost / Clicks. |
| Conversion rate | A conversion is a target action – something that you want your users to do. For example, fill out a survey, make a purchase, subscribe to a newsletter, etc. The conversion rate is the percentage of clicks that turn into conversions. | Conversion Rate = (Conversions / Clicks) * 100 |
| Click-through rate (CTR) | Click-through rate shows the percentage of users that clicked on your ad, link, or button after seeing your ad. | CTR = (Clicks / Impressions)*100 |
| Conversions value/cost (ROAS) | Return on Ad Spend (ROAS) is a metric showing the financial value obtained from conversions relative to the ad cost. | ROAS = Conversion Value / Cost; or = Total campaign revenue / Total campaign cost |
| Quality score | This indicates the quality and relevance of your digital advertising, keywords, and landing pages. The higher this score, the better ad position you can get. | Calculated by the platform |
| Assist clicks | Sometimes users click on multiple ads without converting, and then eventually make a purchase. In this case, we say that the ad that converted was “assisted” by the previously clicked ads for the same keywords. Assist clicks is a metric that shows how many times a keyword was clicked prior to a conversion (excluding the converting click). | A total number of assist clicks |
| Revenue | This shows the total revenue produced as a result of your ad campaigns by generating conversions. | Total revenue |
10 tips on how to interpret Bing Ads (Microsoft Ads) metrics
How exactly to read your Bing Ads metrics, depends on your specific goals. For example, one of the most important success metrics is the conversion rate. But if you run an awareness campaign, you might be after impressions instead – which is often considered a “vanity metric” for purchase-targeting campaigns.
However, there are some general recommendations that you can keep in mind:
1. Make sure clicks lead to conversions
In general, the more clicks you have, the better engagement. But for a PPC campaign, this also implies more cost. So it’s important to analyze clicks in conjunction with the conversion rate – to make sure that clicks actually bring tangible results, not just awareness. It’s also important to check that your universal event tracking (UET) is set up properly – this is essential for tracking conversion metrics.
2. Check how impressions correlate with clicks
If you have a low number of impressions, this can be a sign that you might be targeting your ads at the wrong audience. Another reason can be a too low bid that doesn’t let you beat the competition. If you have high impressions but a low click-through rate, this can mean that your ad copy is unappealing or confusing, or that the audience cannot find what they are looking for.
3. See how CTR relates to conversions
A good CTR score indicates that your targeting is to the point, and your ads are working well and lead users where you need them to be. However, if a high CTR doesn’t translate into a good conversion rate, there may be a problem with your landing page. Maybe it’s confusing or doesn’t show what users expect to see.
4. Find the balance between CPC and conversion rate
These two metrics are at the very core of every campaign. Ideally, your goal is to keep CPC as low as possible while ensuring that the conversion rate is as high as possible. This requires some close attention, trying different options, and analyzing the outcome to find the right balance. While low CPC helps you optimize your ad budget, if it’s too low, you simply won’t be able to get enough impressions.
5. Keep an eye on your ad quality score
If it’s 7-10, this means you can have a lower CPC and a better ad position. If the score is lower than 7, this affects your campaigns negatively. You can improve it by adjusting ad copy, working with keywords, and updating your landing page to make it more relevant.
6. Analyse cost per conversion against conversion value (ROAS)
If an average cost per conversion is higher than the average conversion value (how much profit you got), this will give you ROAS < 1. This means your campaign is not profitable, and you need to think of ways to optimize your strategy. Check our article on PPC audit for tips on how to improve performance. Ideally, ROAS value should be above 1, the more the better.
7. Compare Expected CTR to the actual CTR
If your CTR is lower than what was calculated by Bing Ads as Expected CTR, this probably means that some keywords are underperforming, and you don’t get enough impressions. So you need to make adjustments to fix this.
8. Analyze campaign results for different periods
Maybe some metrics were better in the previous month or quarter? If so, you can analyze campaign settings to see what contributed to better results in the past and how it can help you now.
9. Identify your top performers
See which campaigns, ad groups, ads, and keywords have the best results and produce the most conversions and revenue. The same goes for audiences, locations, devices, and other parameters. You can reallocate your budget in favour of top performers to make the most of it, as well as analyze success factors and update your other ads.
10. Compare results for different settings
A lot of analysis is about experimenting. Try out different bidding strategies, ad creatives, targeting options, and so on – and see what works best. Then, narrow down your options and test again. This can take different forms, from A/B testing CTAs to adjusting campaign settings.
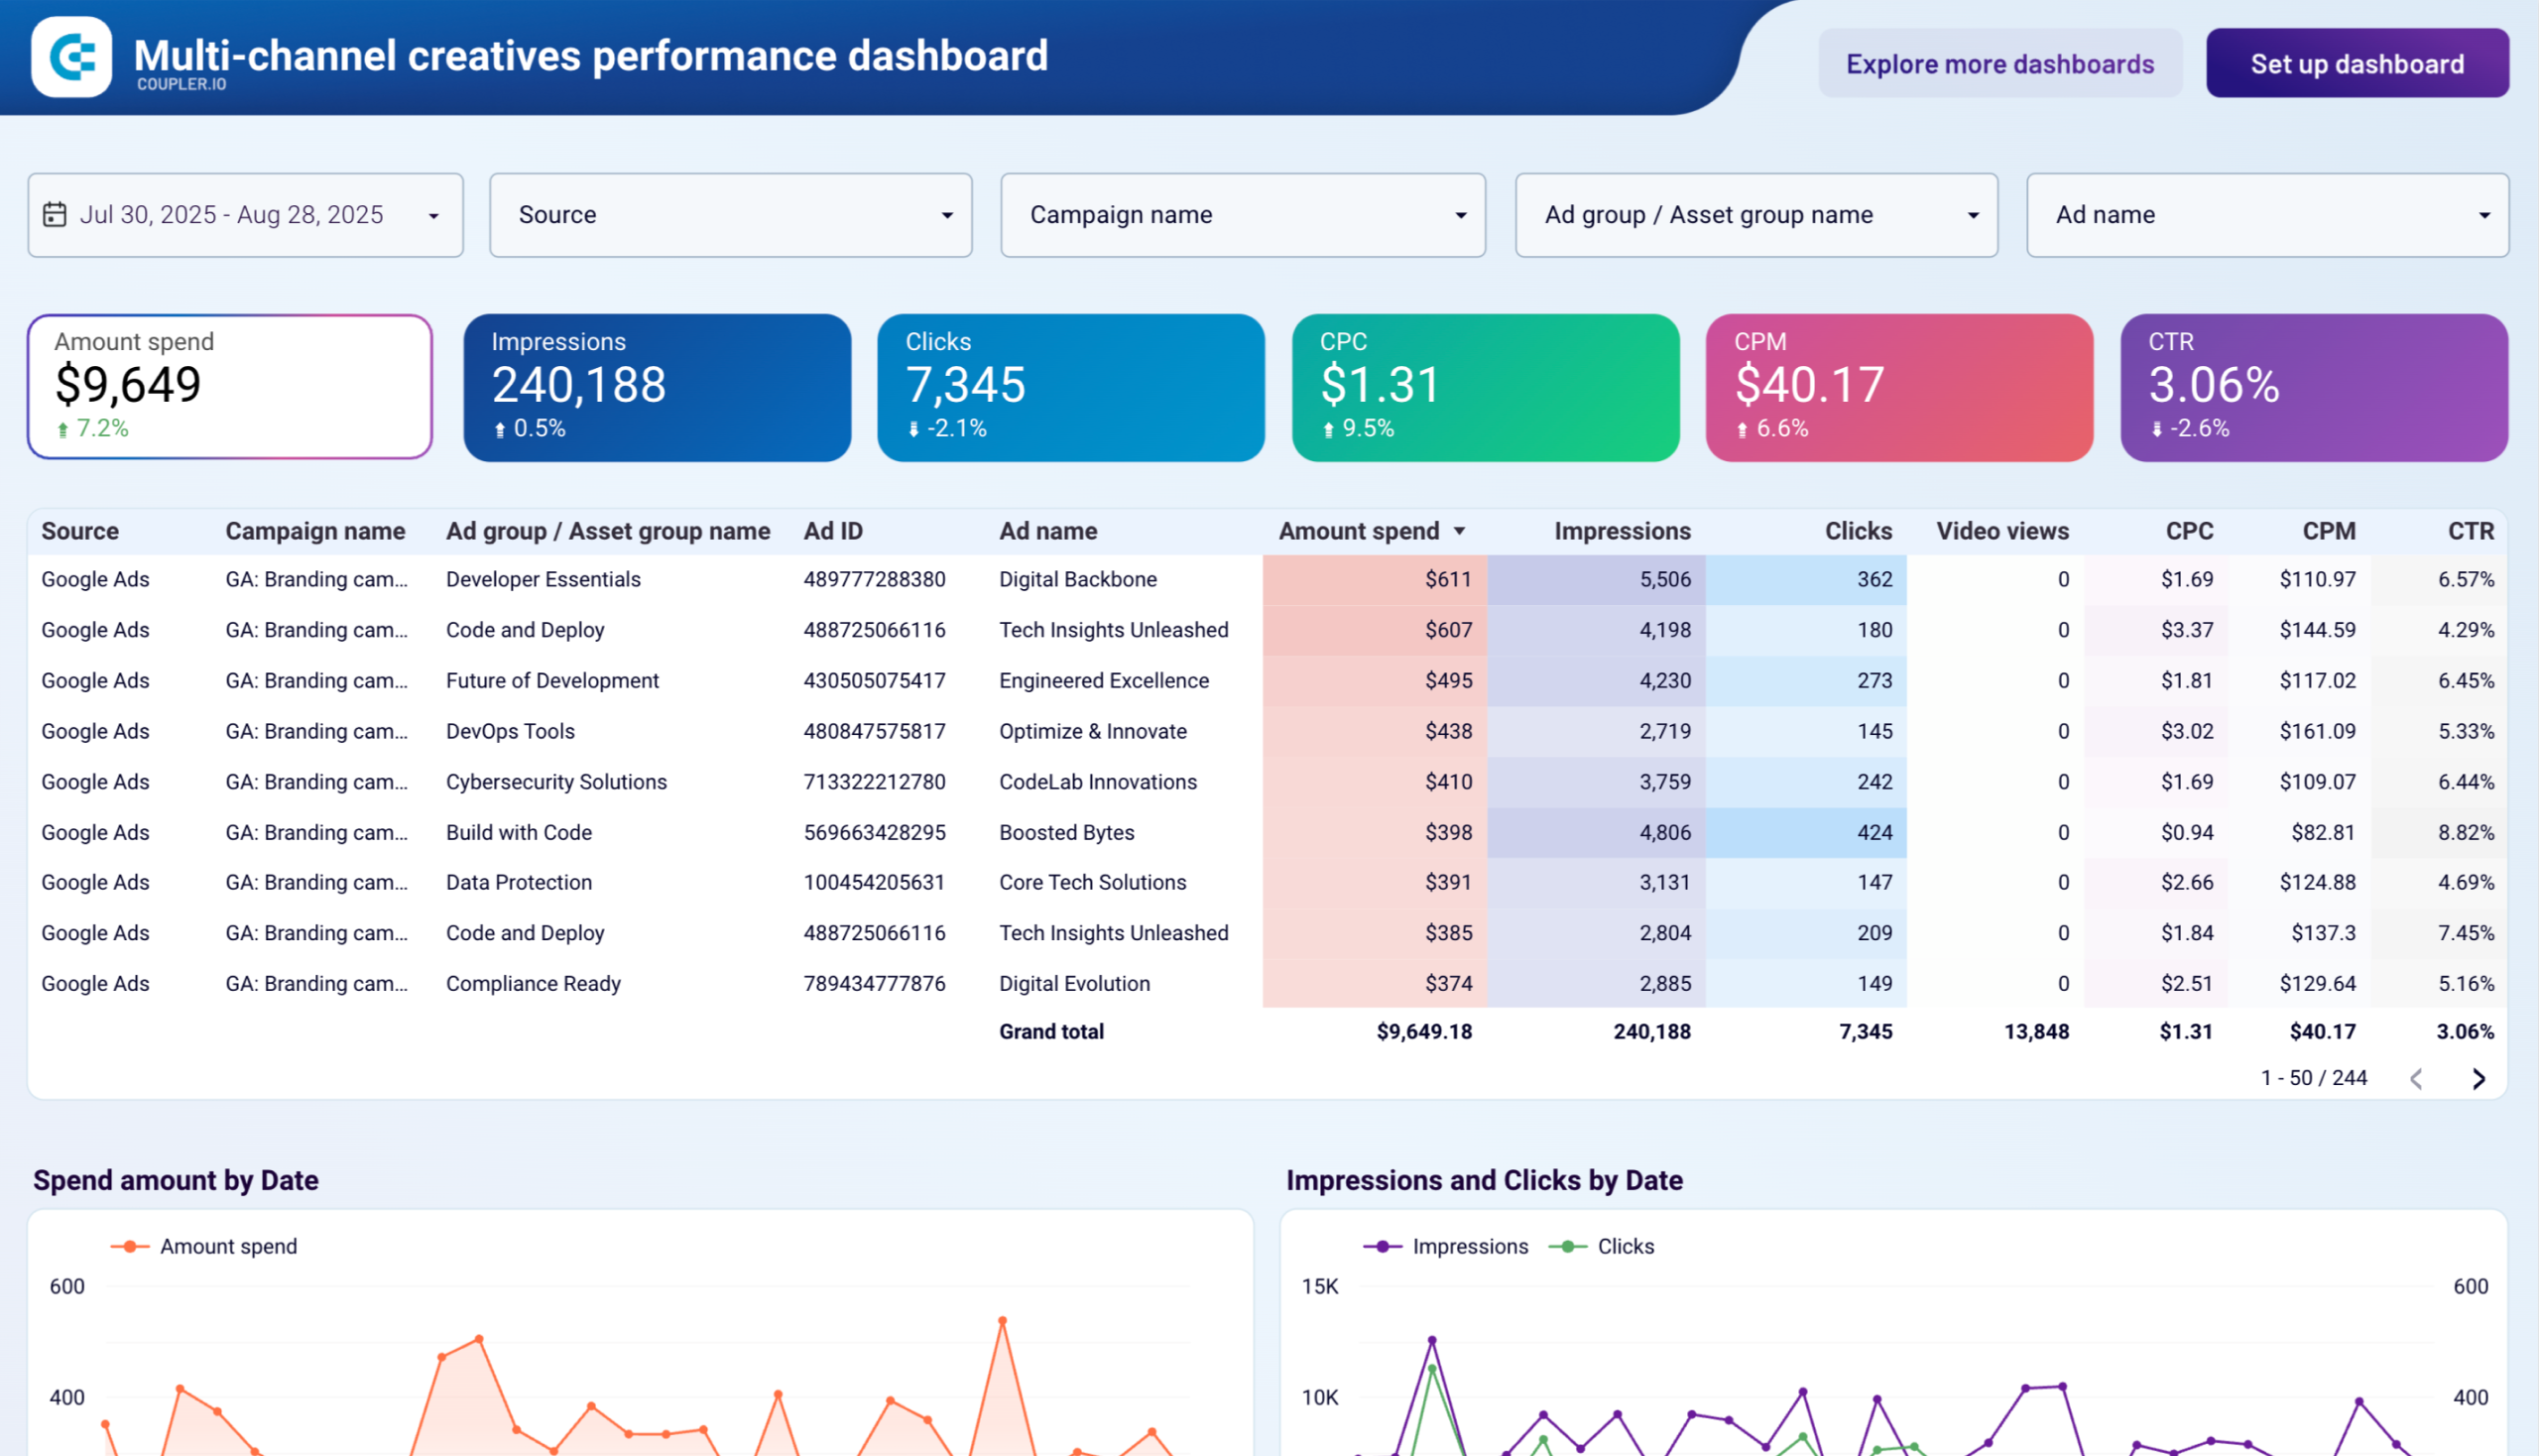
Tip: Use the dedicated Coupler.io dashboard for ad creative analysis.
Multi-channel creatives performance dashboard
 Preview dashboard
Multi-channel creatives performance dashboard
Preview dashboardAs you can see, there are plenty of factors involved, and you should work extensively with your ad data to uncover valuable insights and ideas. It might be helpful to think about PPC analytics as about following your users’ footsteps to see at which stages their path is smooth, and where issues occur. And, of course, your goal is to help them walk the path from viewers to customers as efficiently as possible. Remember, you can go beyond Bing Ads analytics and use first-party data to better understand the customer journey.
Deriving insights with Bing Ads analytics
Adding Bing Ads to your PPC strategy allows you to display ads to more people and better promote your product or services. This is beneficial not only to ecommerce companies, but also to SaaS products, and, in general, to any business that leverages digital marketing.
In this article, we’ve explored different methods to set up Bing Ads analytics and also discussed what metrics to track and how to interpret them. If you are only starting out, using native reporting features may work well for you. But our recommendation is to choose more flexibility and analyze Bing Ads data outside of the app. For example, you can easily automate your reporting process with such a solution as Coupler.io. It can also be used to collect data from multiple other ad apps and build analysis-ready cross-channel reports that auto-update on a schedule.