
The analytics built into the Facebook Ads platform is often insufficient to understand the complete picture of your advertising efforts. So, exporting data to Looker Studio, known previously as Google Data Studio, where you can create custom reports looks like a smart choice for data analysis.
In this article, I’ll go through two approaches – one manual and one automated. As a bonus, I’ll show a couple of ready-to-use Looker Studio report templates available for free.
You can also watch how to connect Facebook Ads to Looker Studio with Coupler.io right away.

Two methods for connecting Facebook Ads to Looker Studio
Unfortunately, Looker Studio doesn’t offer a native connector to Facebook with that would allow for sending data to the BI tool. To move data from one app to another you’ll need to resort to one of the following two methods:
- Export data manually as a CSV and load it to Looker Studio. It is a viable method if you need to report on data infrequently. For example, every quarter you need to extract the summary of your ad campaigns and put it on a dashboard. You’ll be perfectly fine doing so manually, and it won’t take much of your time.
- Use partner connector by Coupler.io. It lets you schedule automated transfers of data from Facebook Ads to Looker Studio. This data integration platform is more suitable for those of you who plan to build a self-updating dashboard or simply monitor your advertising data on a frequent basis. The beauty of this approach is that you set it up once and the data in Looker Studio will auto-update at a chosen frequency, for example daily.
Automated Facebook Ads to Looker Studio integration using Coupler.io
Let’s see how you can use the Facebook Ads data connector by Coupler.io to set up the Facebook Ads to Looker Studio integration in three simple steps.
1. Collect data
- Click Proceed in the form below to create a new importer for your data. If you don’t have a Coupler.io account, you’ll be offered to create one for free.

- Next, connect the Facebook account with access to your Ads Manager.
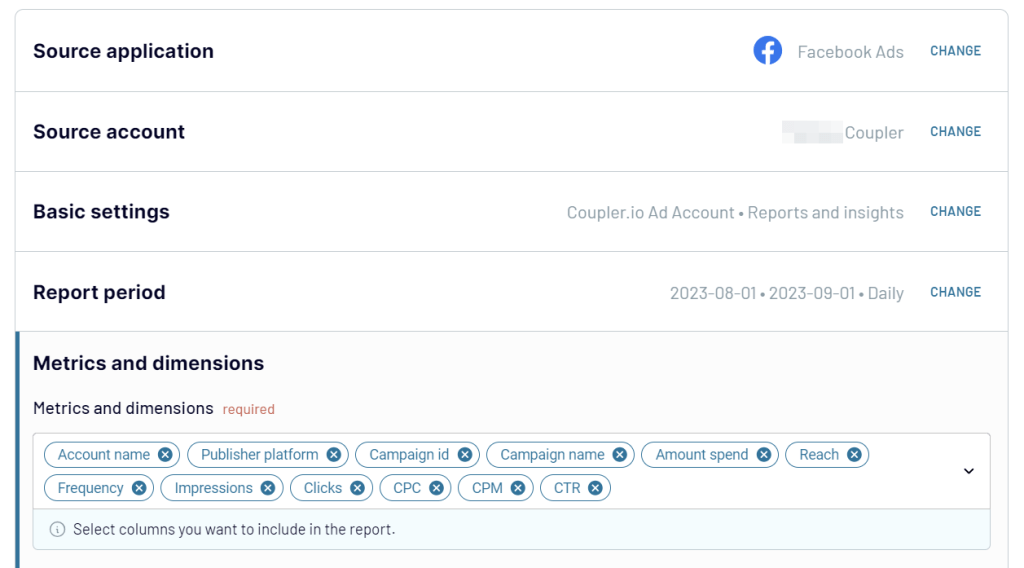
- Choose what to import from Facebook Ads. Reports and insights is the most, well, insightful data entity as they contain stats of the campaigns, ads sets, and individual ads. You’ll also need to specify the start and end data for your report, as well as choose metrics & dimensions to include.

2. Organize and transform data
You can adjust the list of columns to be imported. For example, add the conversion goals that you use or remove the columns you don’t pay attention to. If some metric doesn’t exist but can be calculated with the existing columns, you’ll be able to do it. Check out the data transformation options in this interactive form:
3. Load data and schedule refresh
- Once you’re finished, jump to the destination settings to connect your data to Looker Studio. Here, you’ll need to authorize access to Looker Studio the first time you connect. You’ll also be taken to Looker Studio to set up a data source in just a few clicks. Follow the instructions from the wizard and wait until the data is imported into Looker Studio.
- Soon, you’ll see the list of imported fields. Review them, make any adjustments if needed, and hit the Create report button.
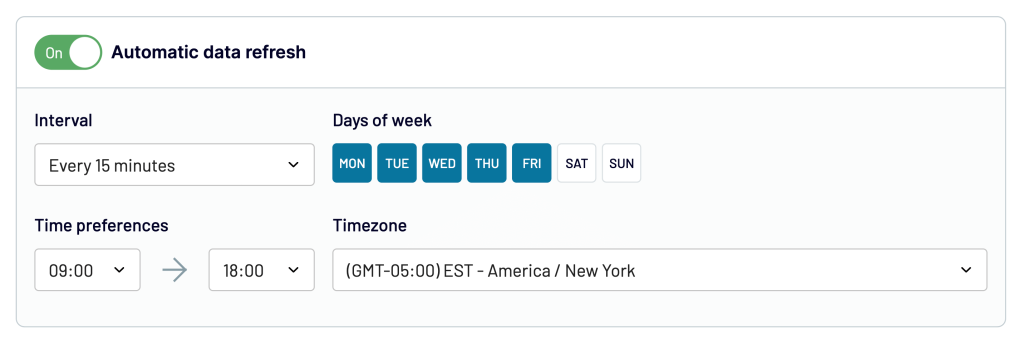
Before you move on to building your dashboards, jump back to Coupler.io and configure the schedule for data refreshes. This will ensure the data you work with is up-to-date, without any further effort on your side. Set up the desired schedule and click Save and Run.

You’re all set up. Your data is already in Looker Studio and ready to use. In a similar way, you can export Facebook Page Insights to Looker Studio or connect Twitter Ads to Looker Studio.
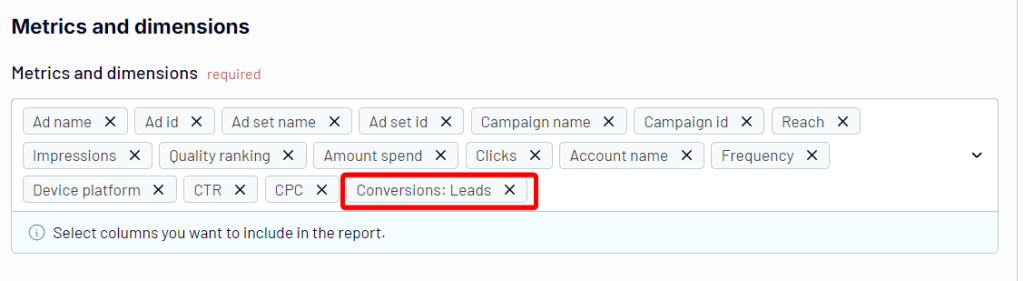
How to load Facebook Lead ads to Looker Studio
If you’re only interested in lead ads, you’ll want to start setting up Coupler.io as I did above. In the Metrics and dimensions field, add the Conversions: Leads metric.

Automate data export with Coupler.io
Get started for freeBonus asset: Facebook Ads Looker Studio templates
It’s pretty straightforward to connect Facebook Ads to Looker Studio, but building a meaningful and actionable dashboard can be somewhat time-consuming. If you’d like an easy start, have a look at the dashboard template that analysts on Coupler.io prepared for you and grab it for yourself.
Within just a few minutes, you will be able to connect to your Facebook Ads data and start monitoring your performance without any further work on your side.
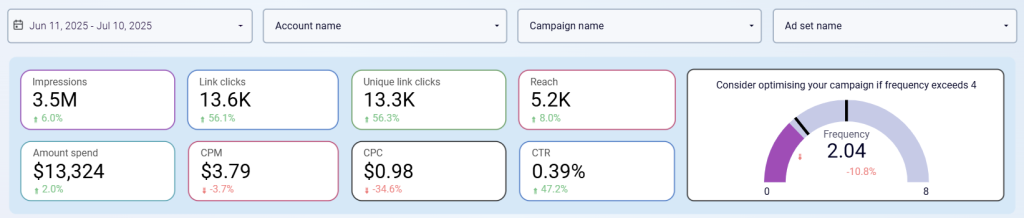
Facebook Ads dashboard in Looker Studio
The Facebook Ads Looker Studio template looks at different stages of a typical advertising funnel – impressions, clicks, and various associated metrics.

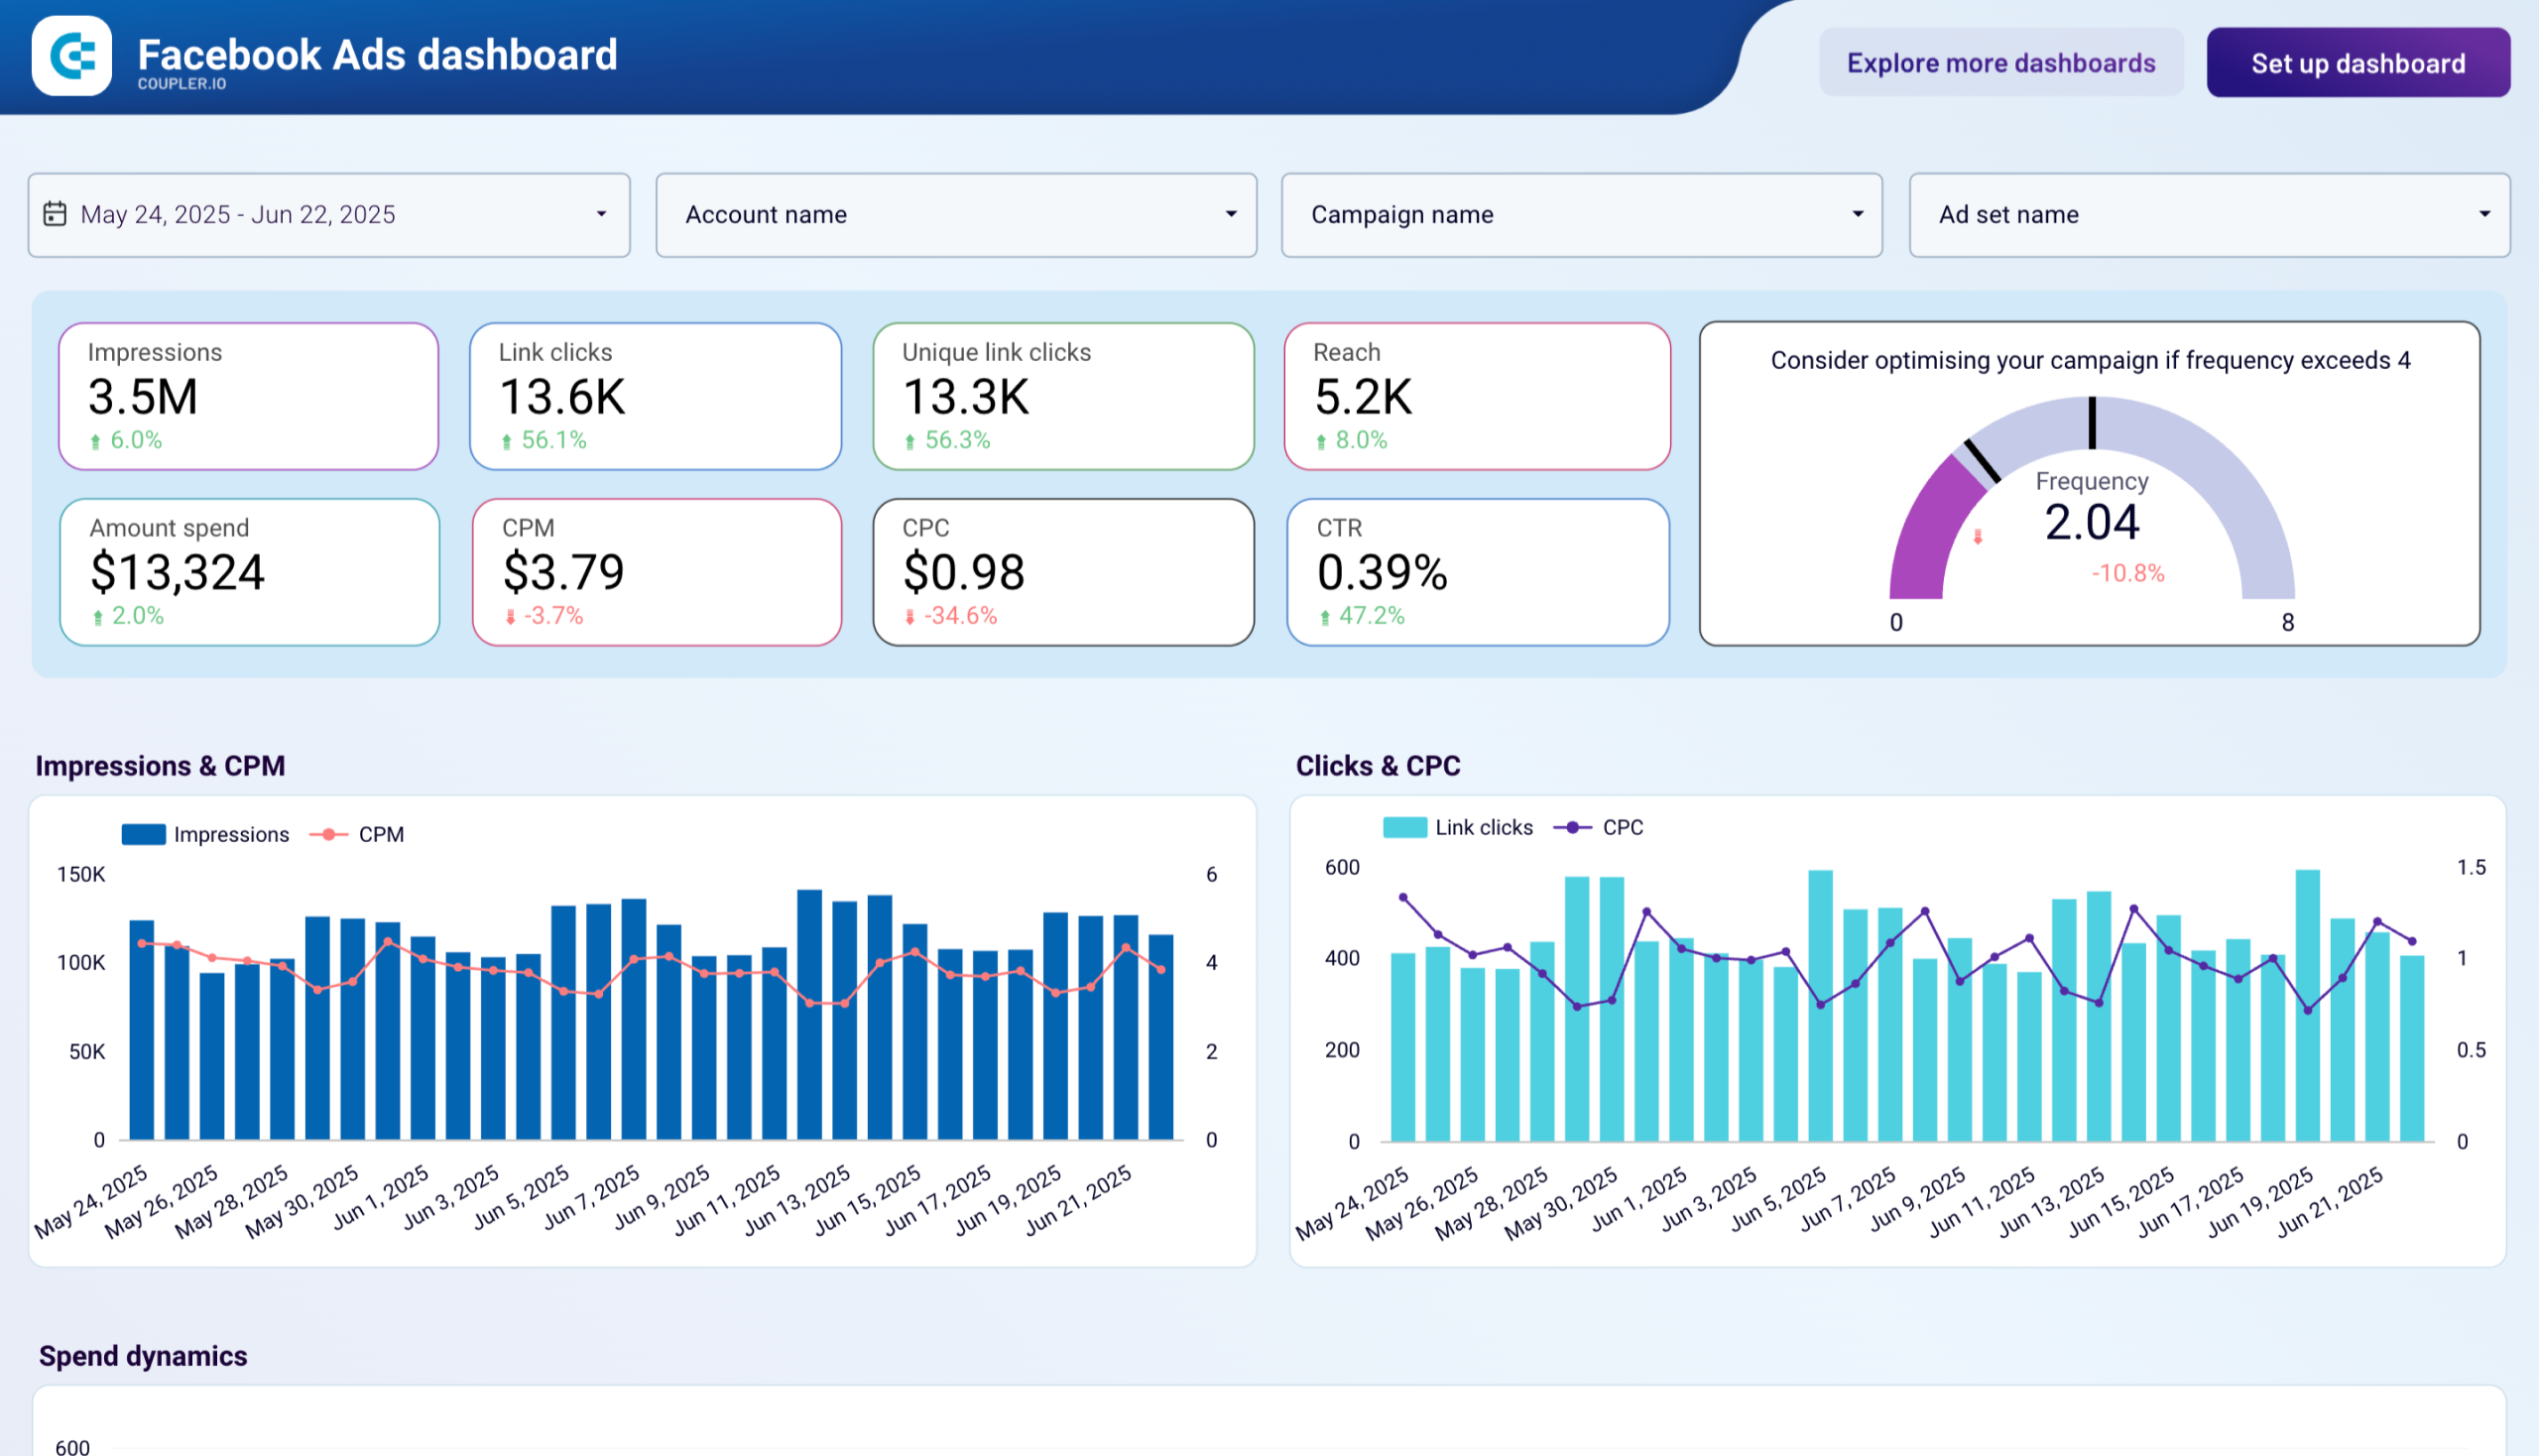
- Track the frequency of Facebook ads. You can monitor the number of times one person saw your ad and filter this value for the whole account, per separate campaign, ad set, or time period.

- Get insights into audience segments with the most clicks.

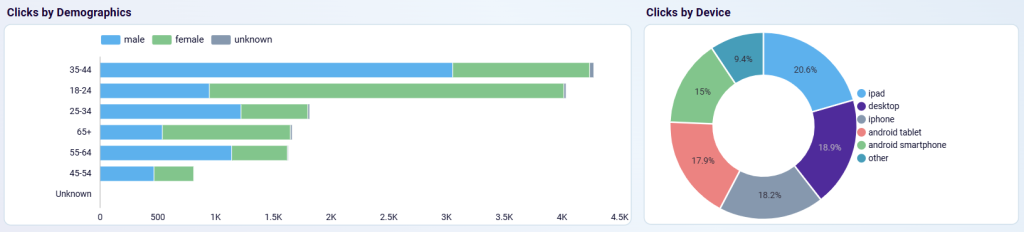
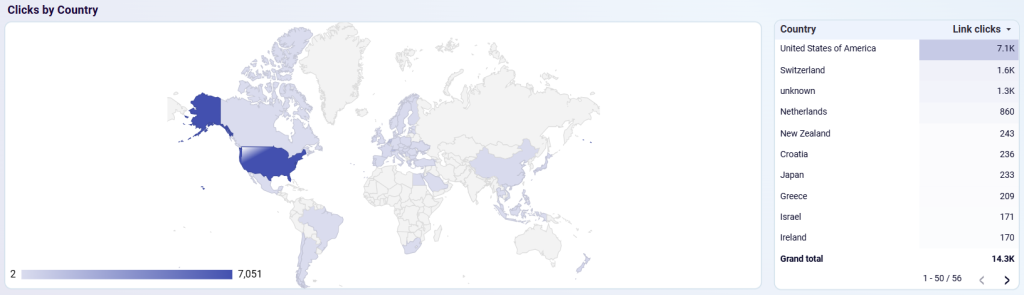
- Understand from which country the biggest part of the traffic comes in order to optimize targeting.

Under the hood, a Coupler.io importer fetches data from Facebook Ads and brings it to Looker Studio, automatically updating the values if any changes are detected. Go through the Readme tab in the Facebook Ads dashboard template to set it up. Once you have the data ready, tweak the dashboard to your liking if you’d like – for example, add a different conversion goal or create a new calculated field that makes more sense to you.
Hint: you can create calculated fields directly in the Coupler.io interface and preview right away if it gives you the expected results. Importing pre-calculated fields into Looker Studio, as opposed to adding calculations there, also helps with a better performance of the BI tool.
Meta Ads monthly performance dashboard
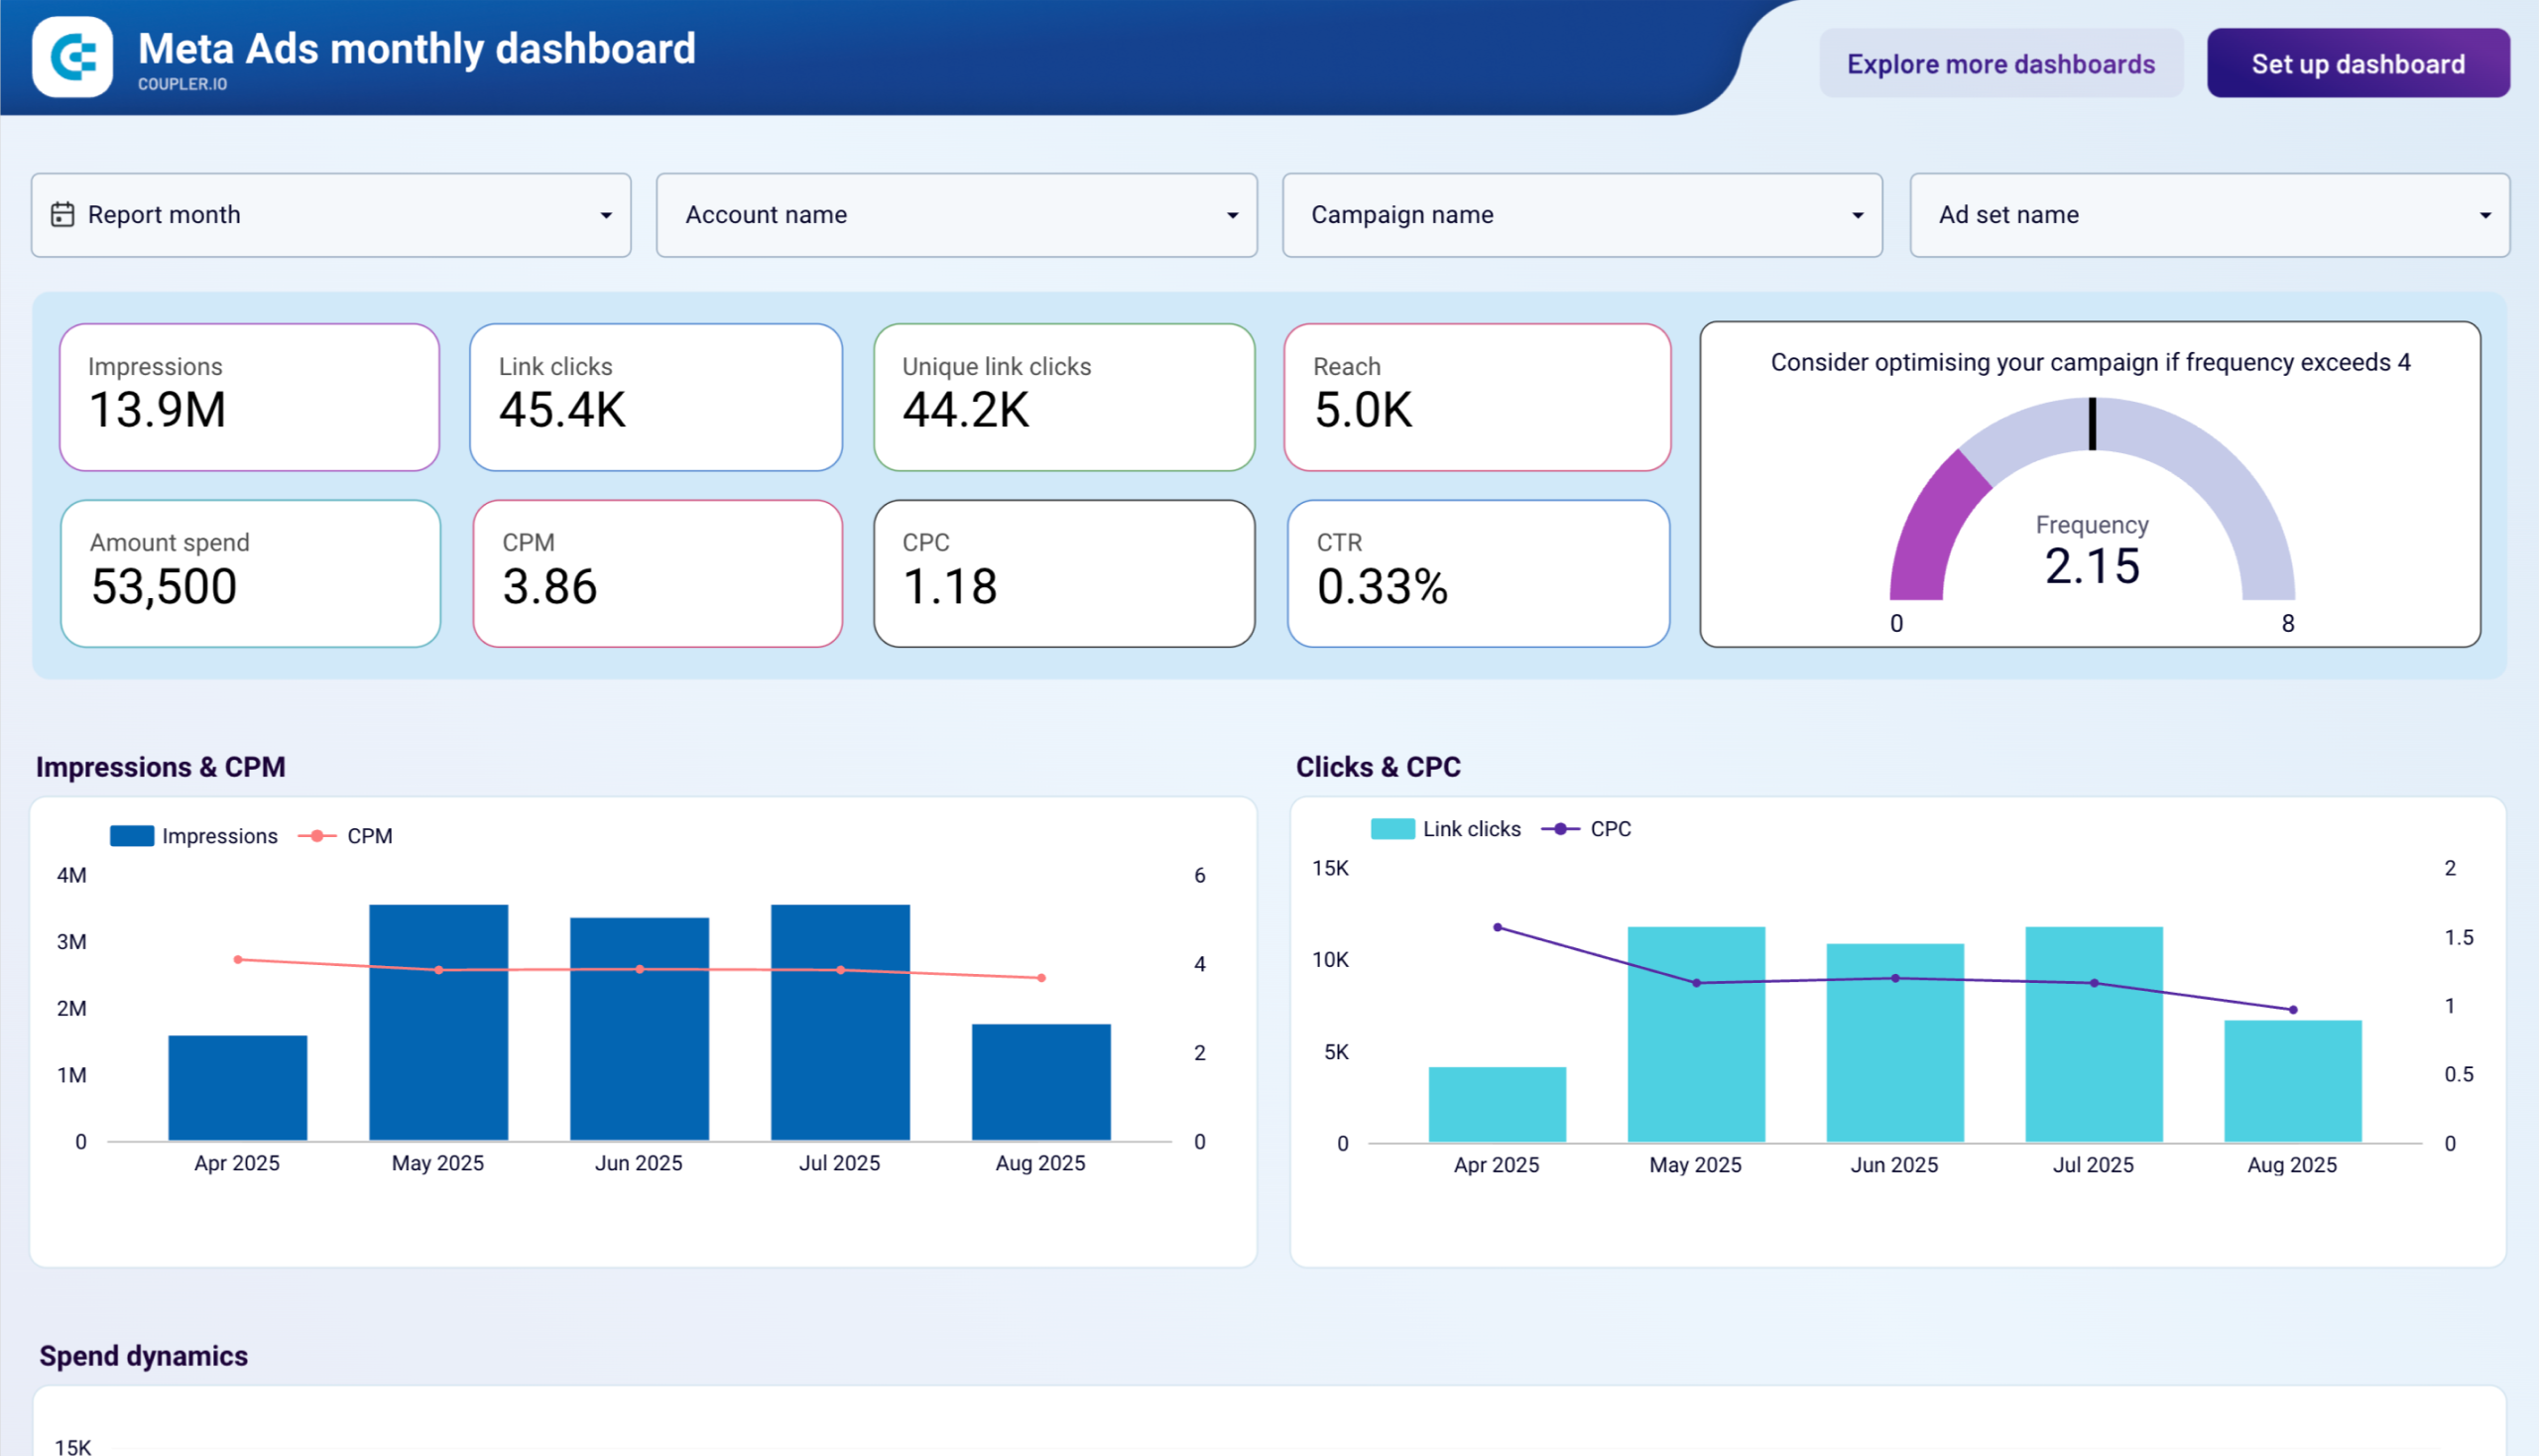
This Meta Ads monthly performance dashboard helps marketing teams track their Facebook and Instagram advertising performance with a strategic focus on monthly trends and executive reporting.
Meta Ads monthly performance dashboard
Meta Ads monthly performance dashboard
Preview dashboardWhat insights you can get:
- Monthly trend analysis across key metrics with period-over-period comparisons
- Demographic engagement patterns by age groups and gender
- Device performance monitoring across iPhone, Android, desktop, and tablet users
- Geographic market evaluation with country-level breakdowns for expansion opportunities
- Ad frequency management with visual indicators for optimal exposure levels
This Looker Studio template is powered by Coupler.io’s automated connector, ensuring your Facebook and Instagram advertising data updates monthly with strategic insights. Follow the Readme tab instructions to connect your accounts and customize the dashboard for executive reporting needs.
Meta Ads creatives dashboard
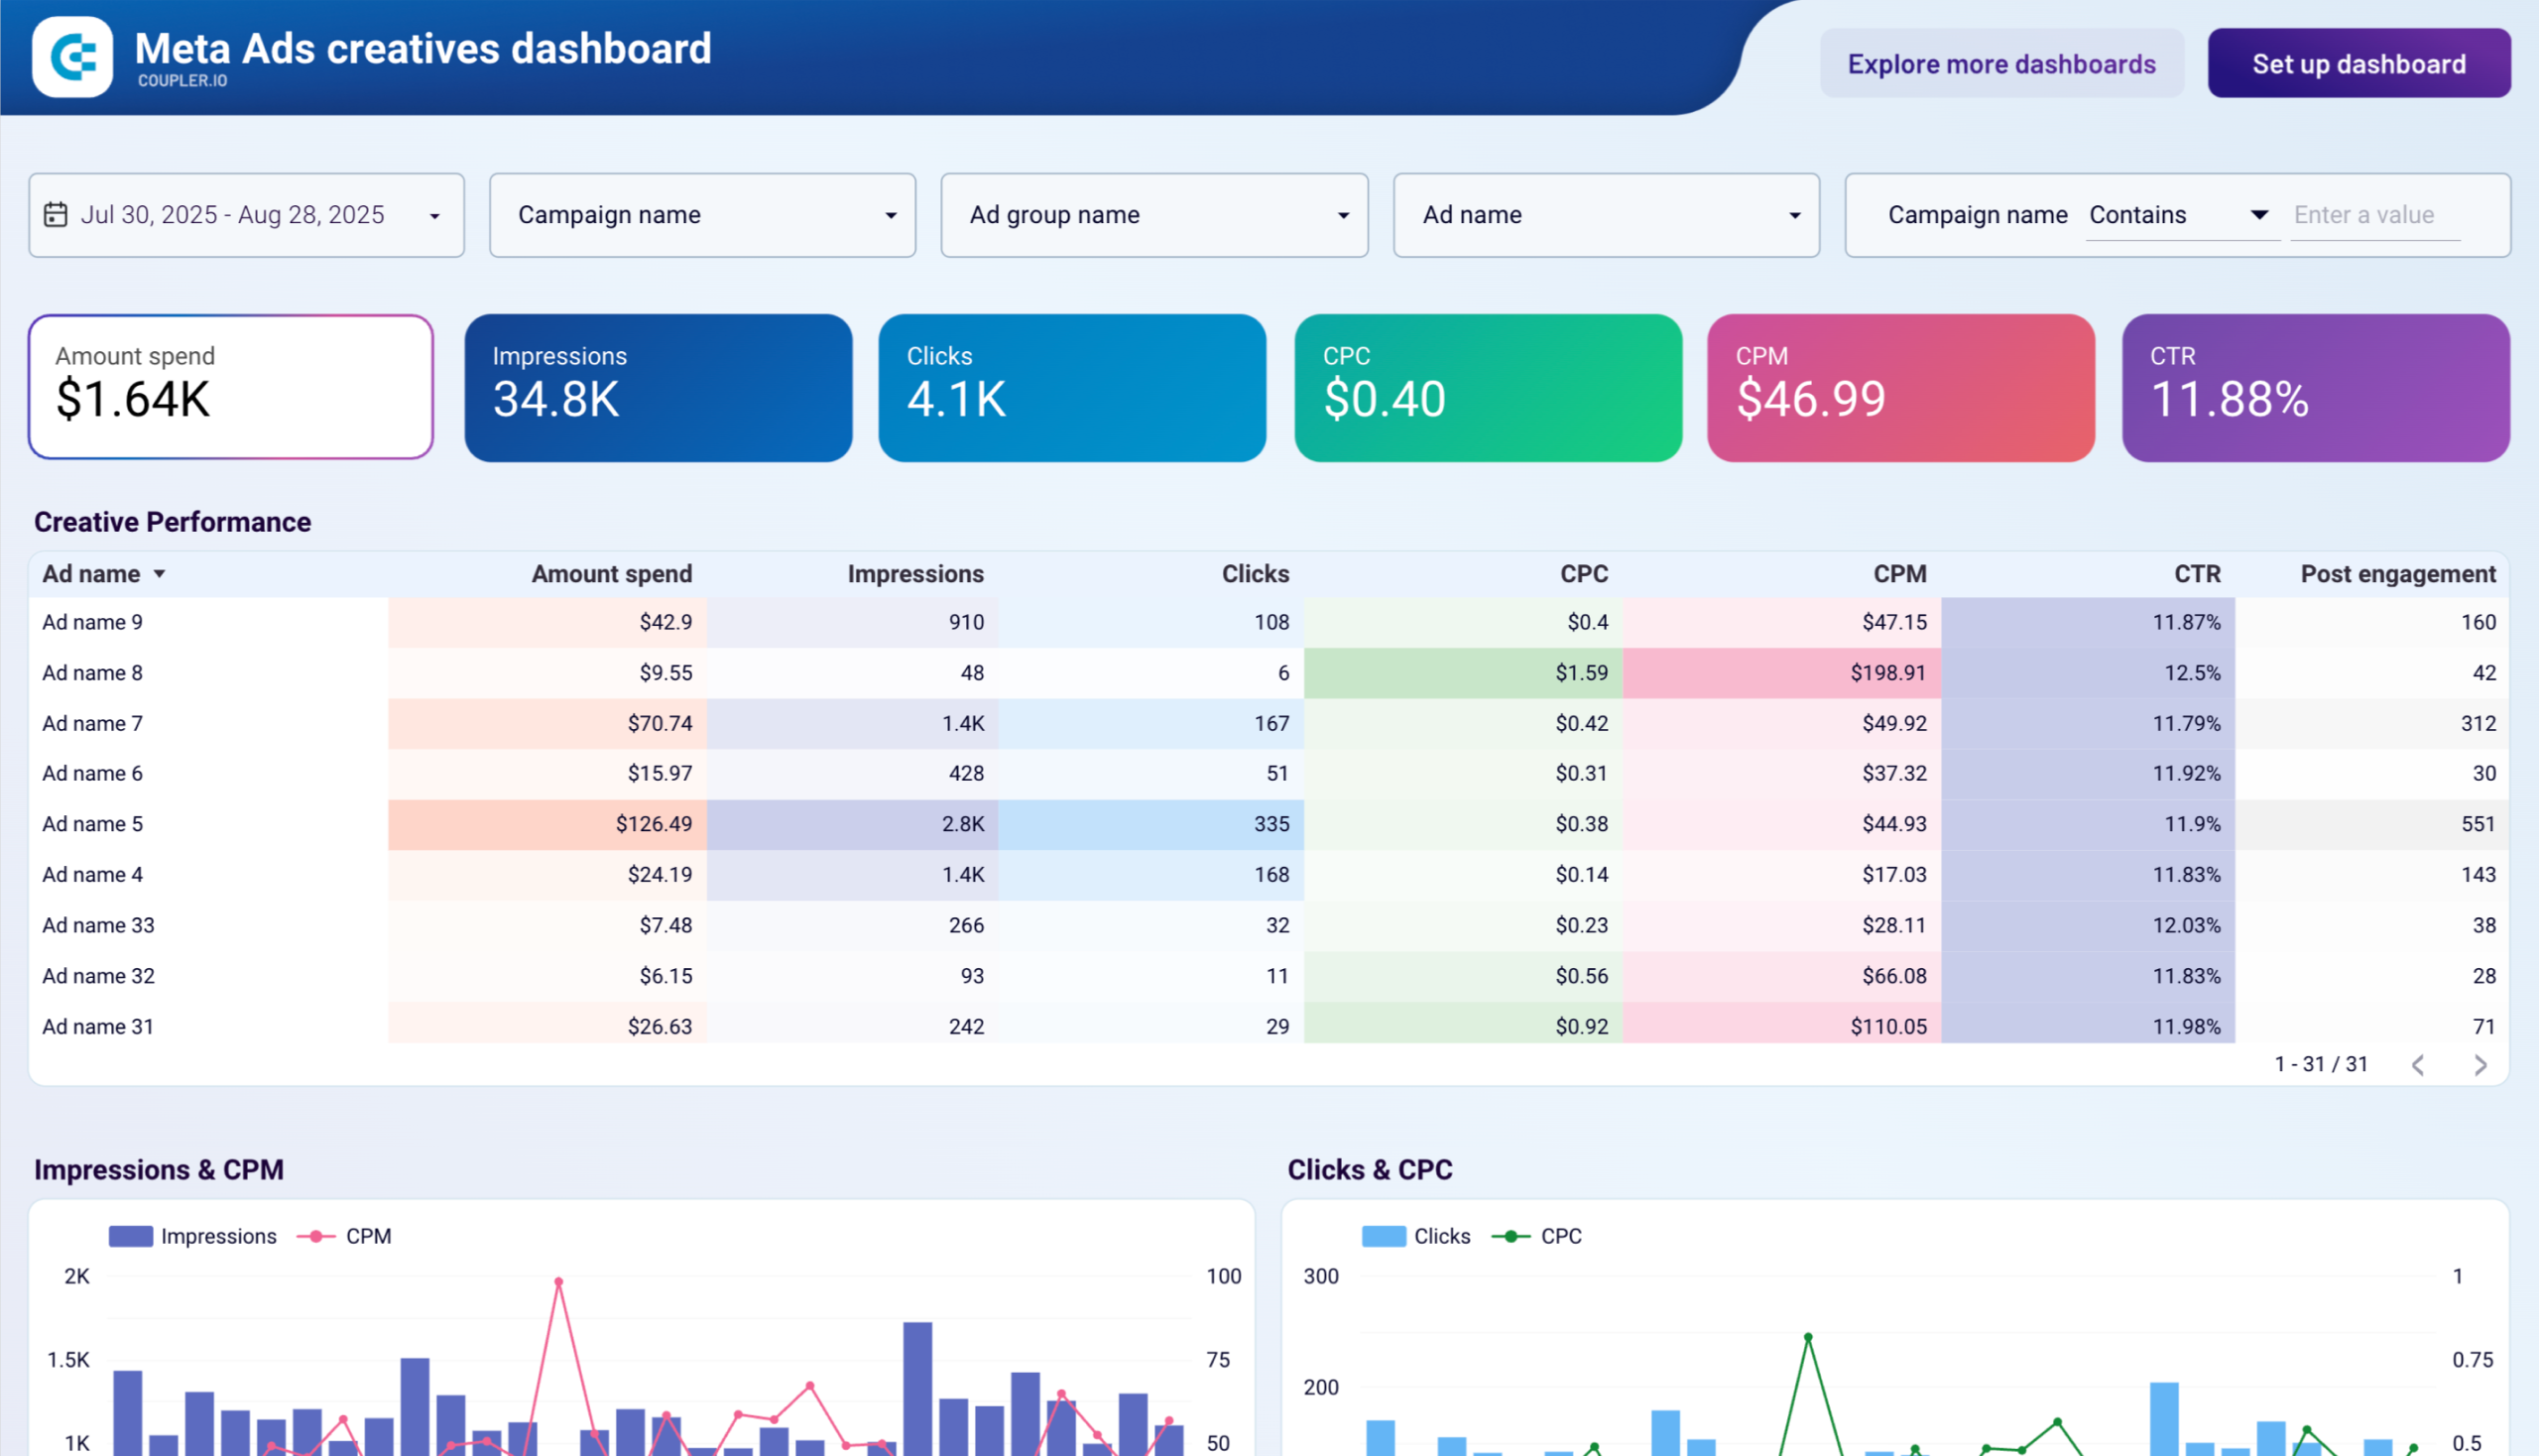
The Meta Ads creatives dashboard provides an overview of your ad creatives’ performance on Facebook and Instagram, helping you make data-driven decisions to improve engagement and maximize ROI.
What insights you can get:
- Creative performance analysis across engagements, clicks, spend, and CPM
- Cost efficiency tracking with visual comparisons of CPM and CPC over time
- Spending pattern monitoring to ensure budget alignment with campaign goals
- Audience engagement trend identification for optimization opportunities
This dashboard integrates with Coupler.io’s automated connector and pulls creative performance data from your Meta Ads accounts. The template automatically updates with fresh insights, making it easy to identify top-performing creatives and scale successful strategies.
Facebook Ads leads breakdown dashboard
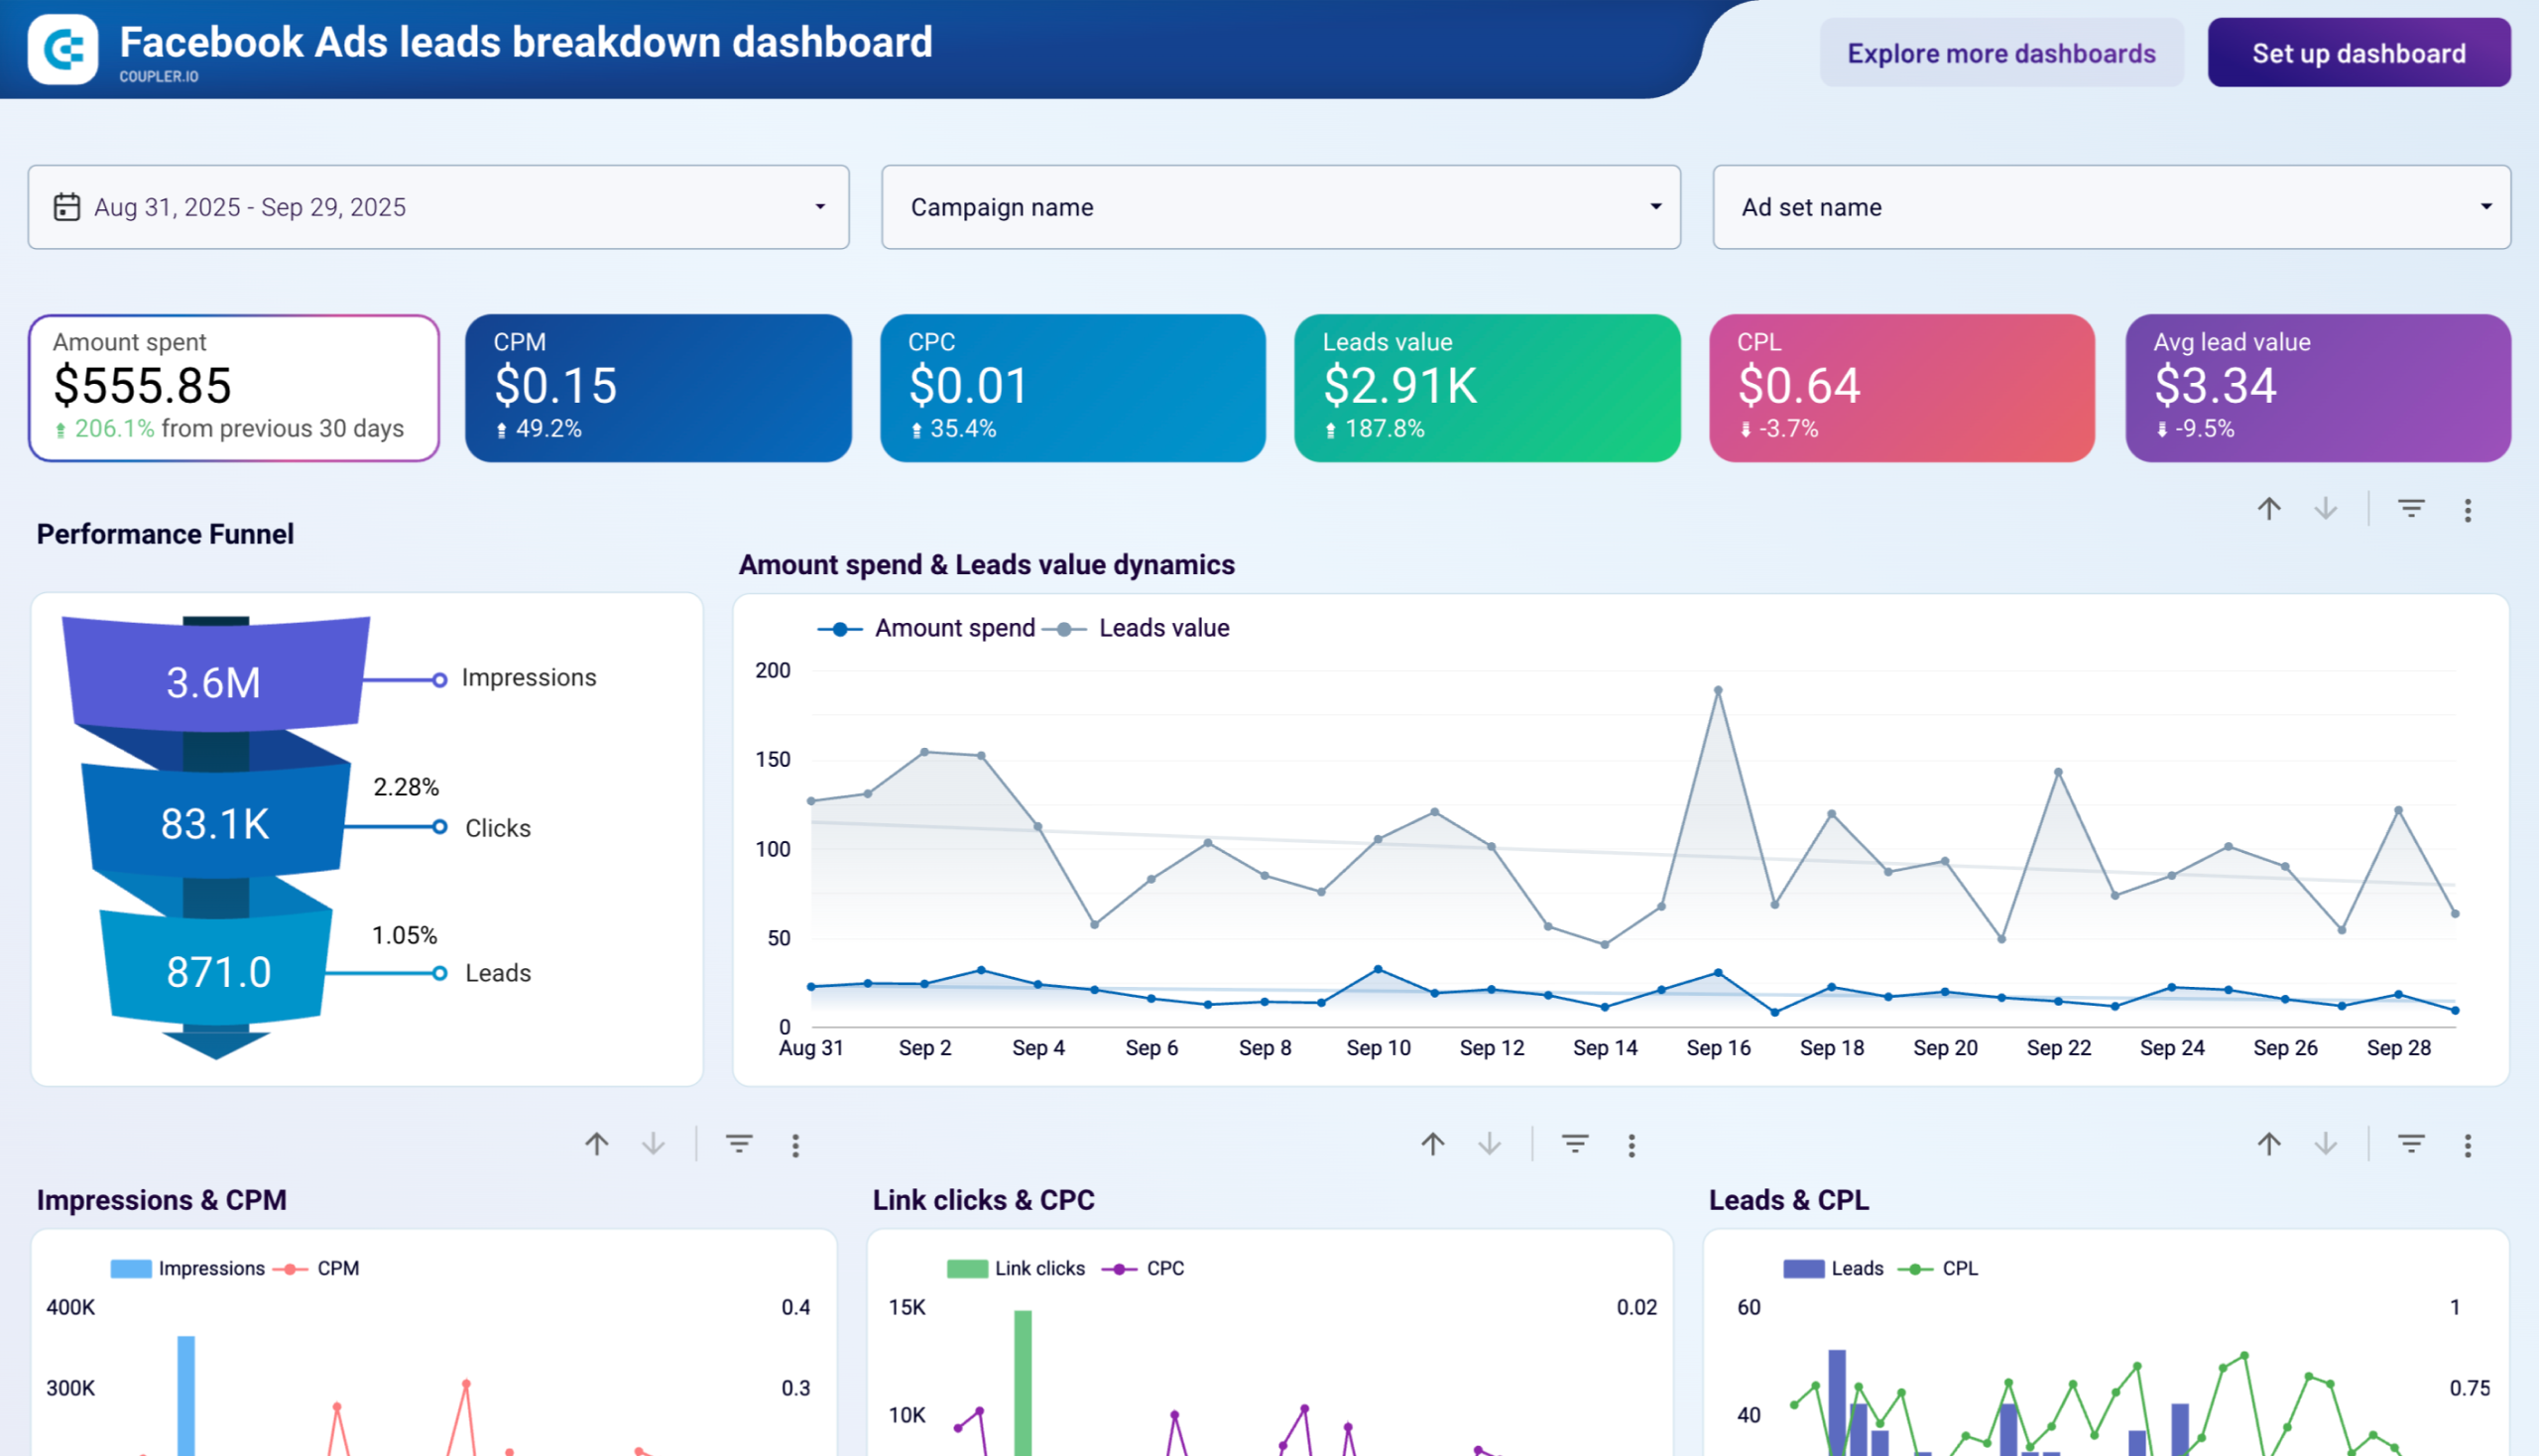
The Facebook Ads leads breakdown dashboard allows you to assess the effectiveness of your ad campaigns in generating leads, with detailed insights into lead generation performance and value.
Facebook Ads leads breakdown dashboard
Facebook Ads leads breakdown dashboard
Preview dashboardWhat insights you can get:
- Performance funnel visualization from impressions to leads with value trends over time
- Campaign performance breakdown comparing lead generation and value across campaigns
- Monthly dynamics tracking for clicks, leads, and cost per lead metrics
- Demographic analysis showing which age groups and gender segments contribute most leads
- Geographic breakdown identifying countries that drive the highest number of leads
This automated template is designed in Looker Studio and powered by Coupler.io. Connect your Facebook Ads account through the built-in connector to start tracking lead generation performance with automated daily updates.
Facebook Ads purchases breakdown dashboard
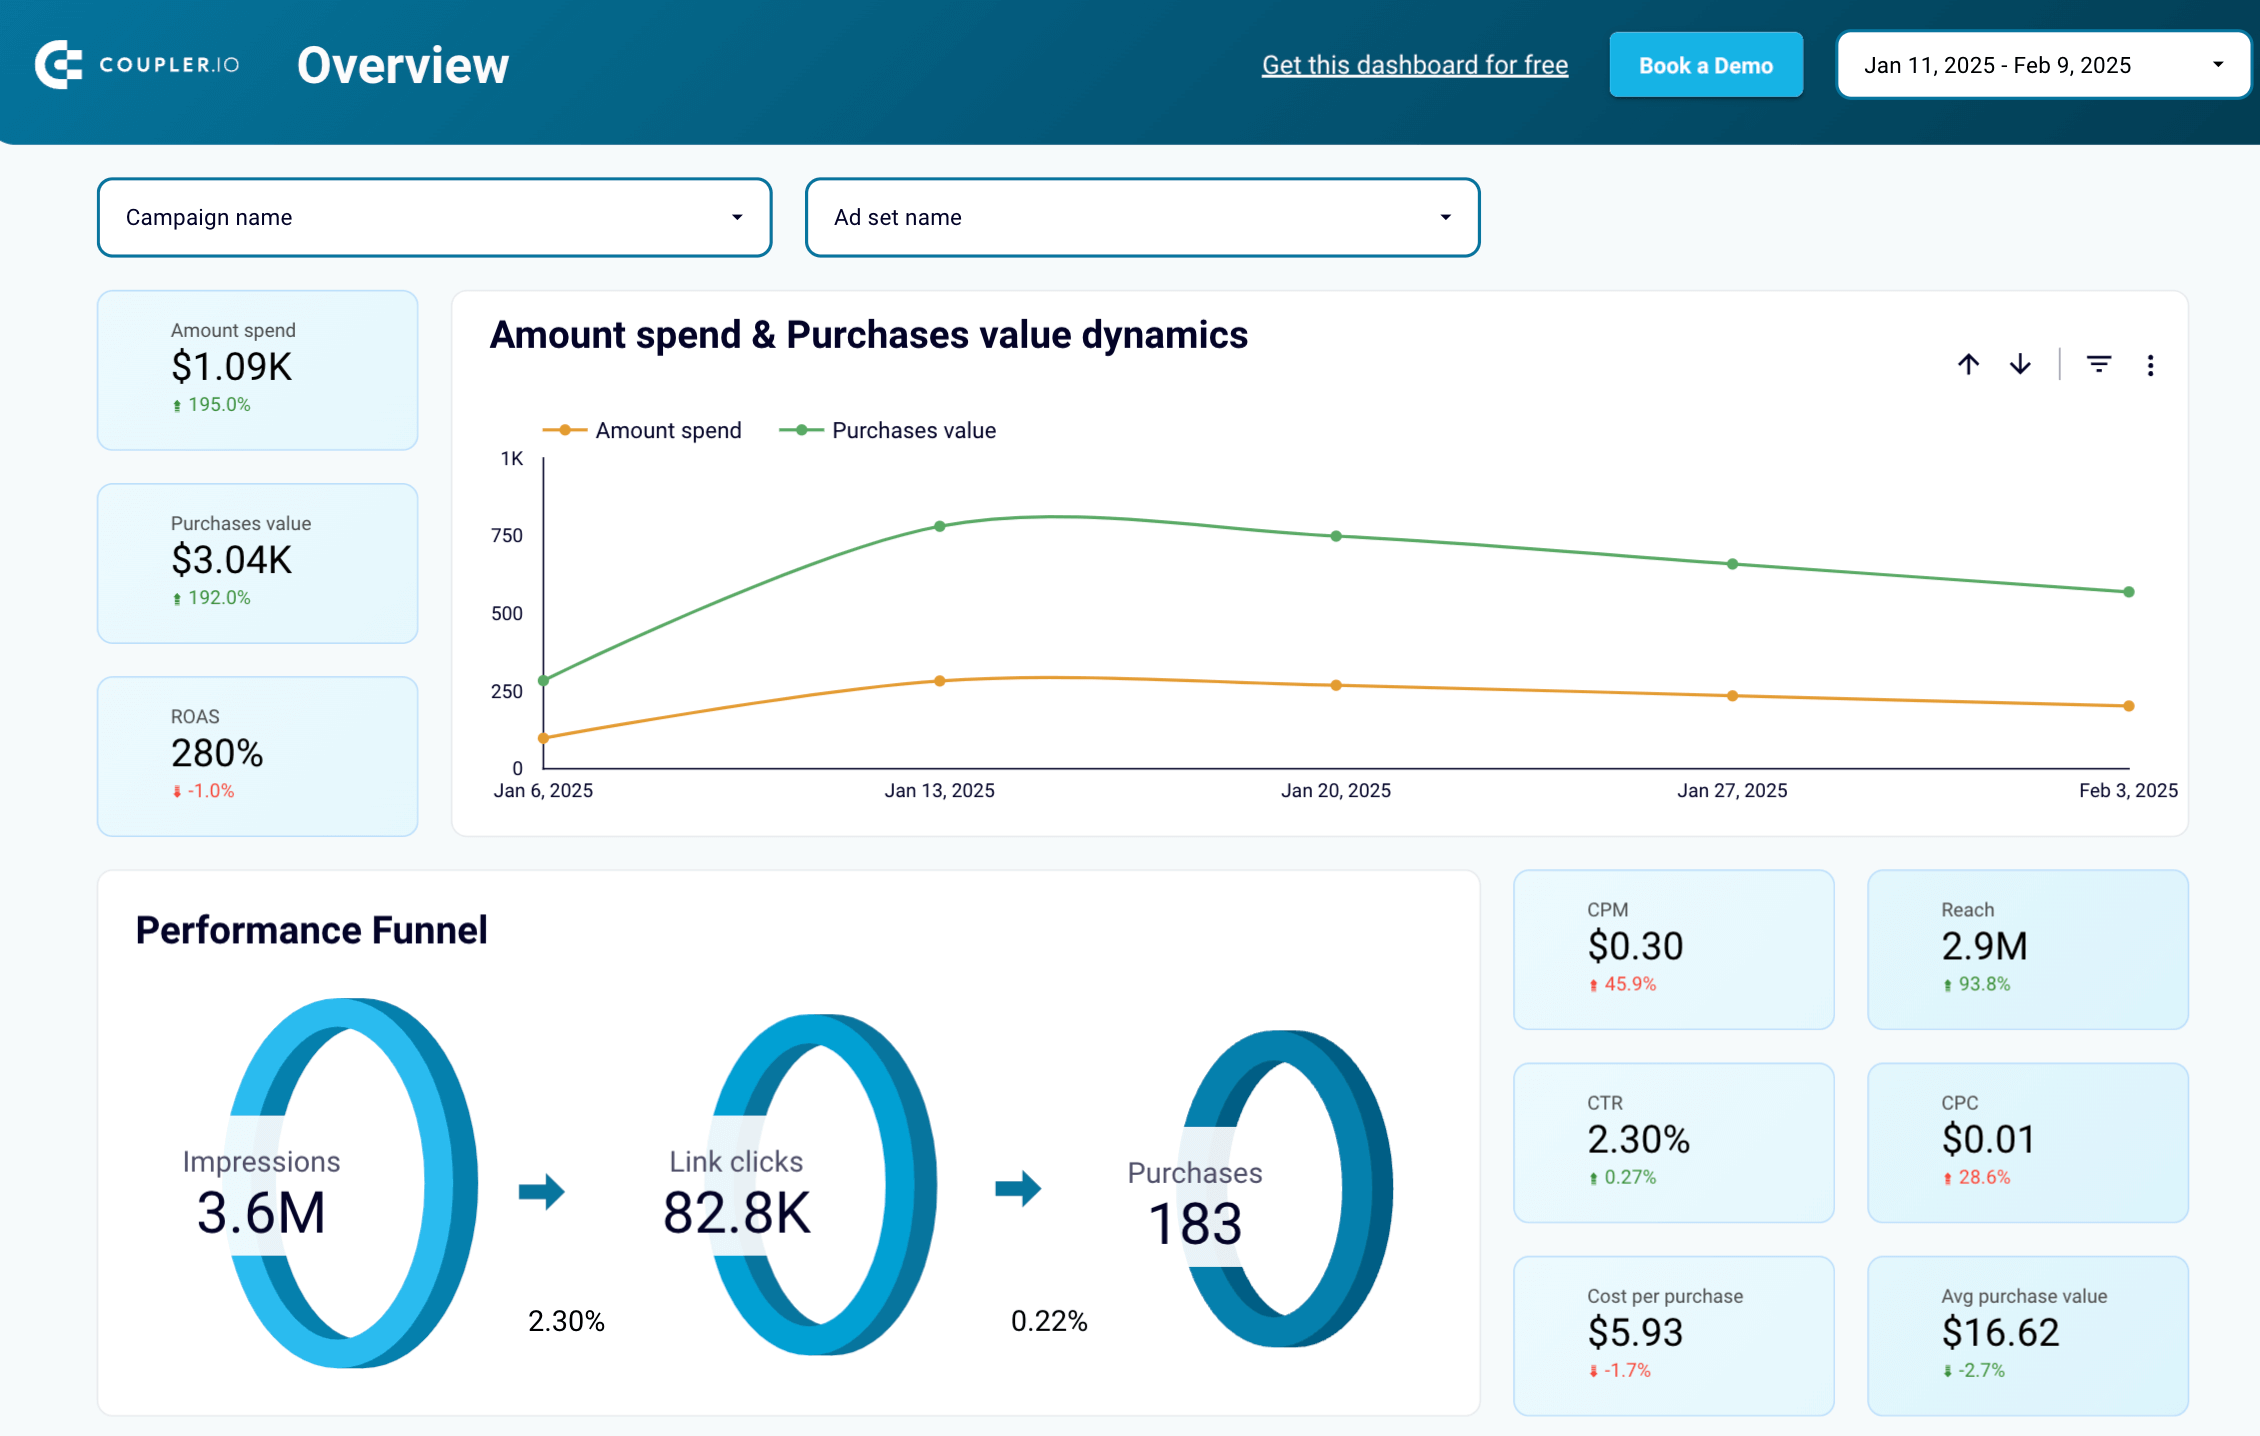
The Facebook Ads purchases breakdown dashboard provides a detailed analysis of how effectively your ad campaigns drive purchases, connecting performance metrics with actual purchase events.
Facebook Ads purchase breakdown dashboard

Facebook Ads purchase breakdown dashboard
Preview dashboardWhat insights you can get:
- Purchase value dynamics tracking over time compared to ad spend for ROAS analysis
- Performance funnel showing progression from impressions to clicks to purchases
- Campaign performance breakdown with purchase count and total purchase value per campaign
- Monthly trends analysis for purchases, spend, and return on ad spend
- Demographic insights revealing which audience segments drive the most revenue
This Looker Studio template is powered by Coupler.io, making it easy to automate data updates from your Facebook Ads account. Set custom data refresh intervals to ensure you always have up-to-date purchase performance insights.
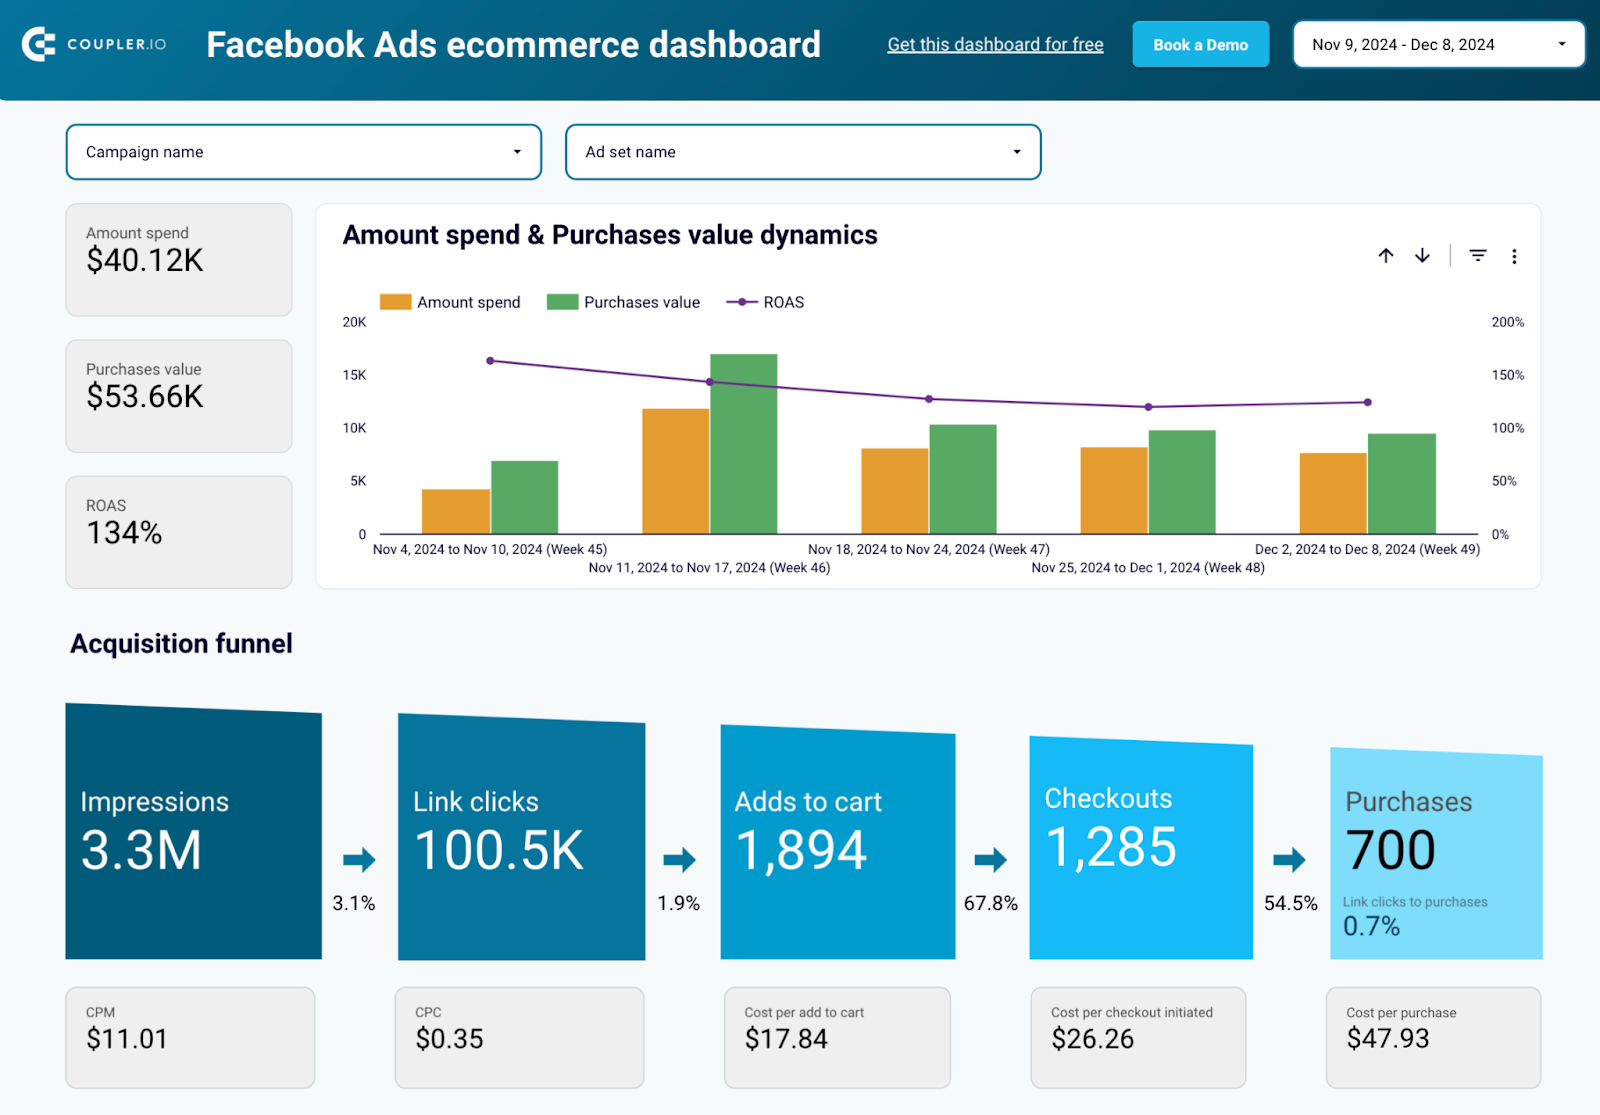
Facebook Ads ecommerce performance dashboard
This Facebook Ads e-commerce performance dashboard is designed specifically for businesses running e-commerce campaigns, providing comprehensive conversion funnel analysis and ROAS optimization insights.
Facebook Ads ecommerce performance dashboard

Facebook Ads ecommerce performance dashboard
Preview dashboardWhat insights you can get:
- Complete customer journey visualization from impressions to add-to-cart to purchases
- Conversion funnel analysis to identify bottlenecks and optimization opportunities
- Campaign performance comparison with flexible filtering by campaigns and ad sets
- ROAS tracking and spend efficiency analysis for budget optimization
- Demographic performance breakdown showing which audiences generate the most revenue
This dashboard focuses on essential e-commerce metrics and integrates seamlessly with your Facebook Ads account through Coupler.io’s automated Looker Studio connector. The template updates regularly with fresh conversion data for timely campaign adjustments.
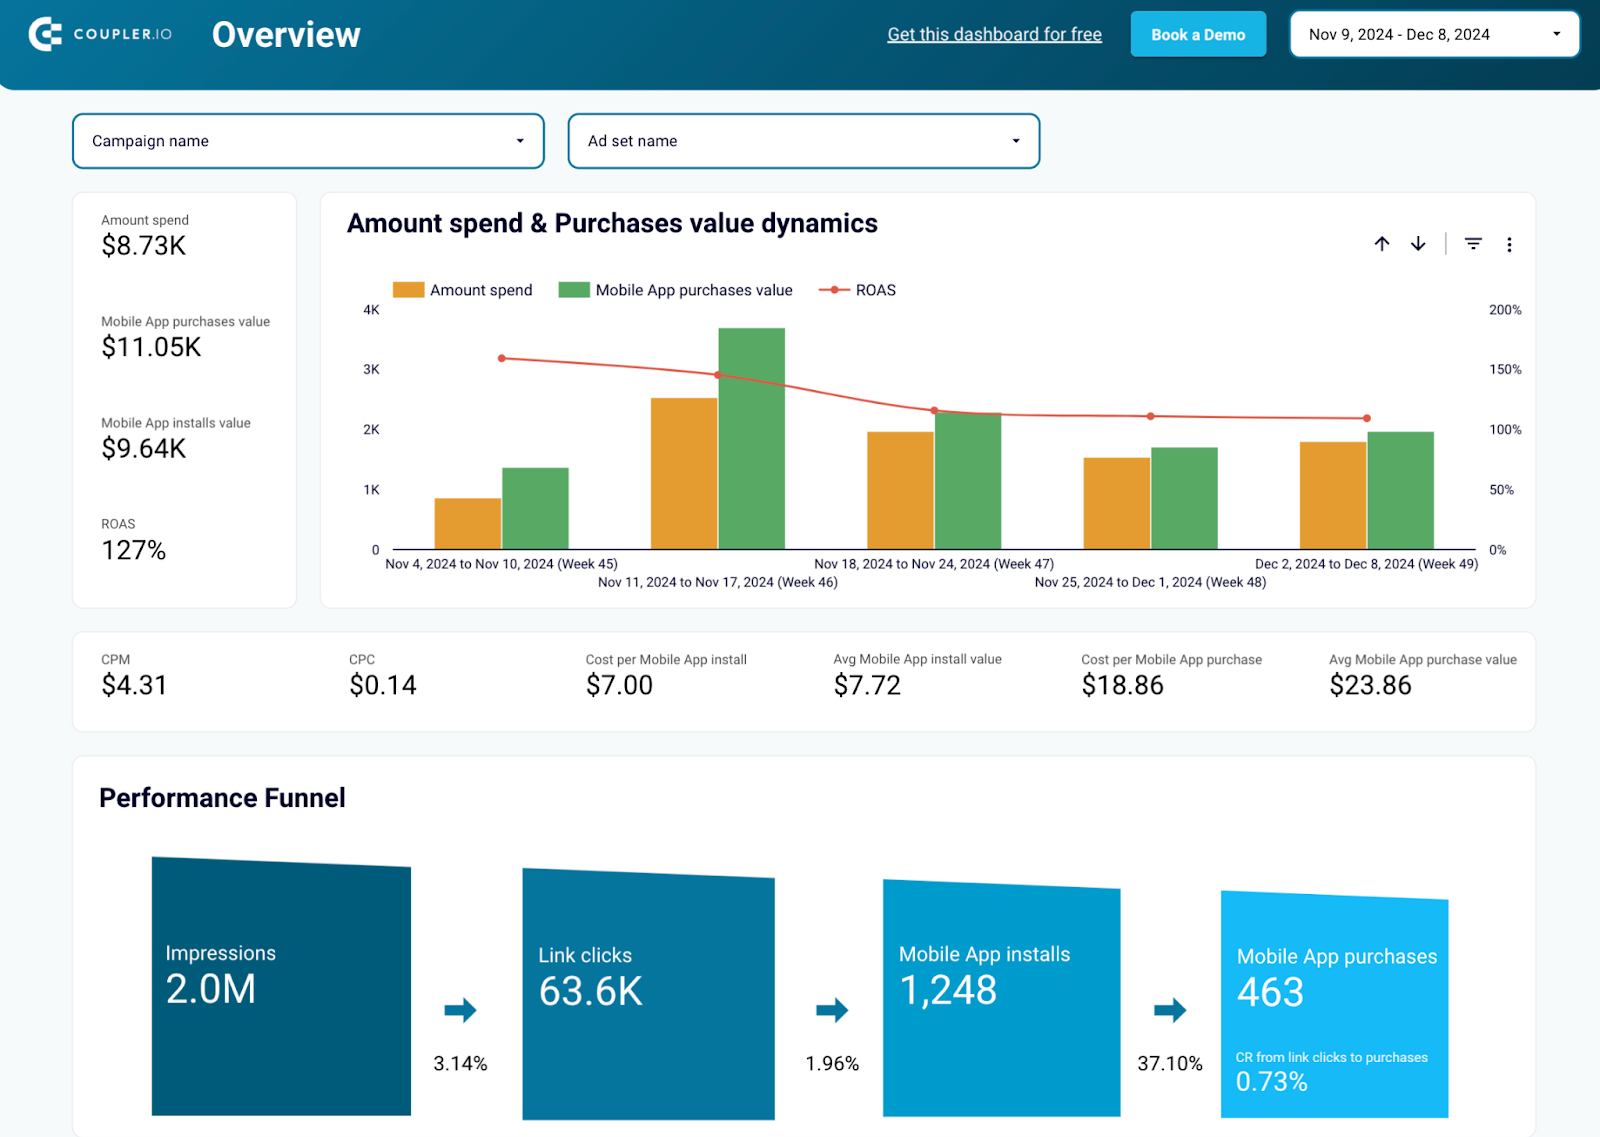
Facebook Ads performance for mobile apps dashboard
This Facebook Ads dashboard helps track your mobile app campaigns’ performance by analyzing app installs, in-app purchases, and overall campaign efficiency for mobile user acquisition optimization.
Facebook Ads performance for mobile apps dashboard

Facebook Ads performance for mobile apps dashboard
Preview dashboardWhat insights you can get:
- Mobile app performance metrics including ad spend, ROAS, app installs, and purchases
- User journey analysis from impressions and clicks to app installs and purchases
- Cost efficiency tracking with cost per install, cost per click, and cost per purchase
- App usage dynamics monitoring and retention strategy insights
- Campaign breakdown showing which ads drive the best user acquisition results
This Looker Studio template from Coupler.io allows you to easily sync mobile app campaign data from your Facebook Ads account. The dashboard refreshes automatically on your chosen schedule, ensuring up-to-date insights for user acquisition strategies.
You can also check other Looker Studio Facebook Ads templates that we reviewed recently.
Manual way to connect Facebook Ads to Looker Studio
The second method I’m going to cover is pretty straightforward. You will:
- Export data from Facebook Ads Manager as a .csv file
- Create a data source in Looker Studio
- And upload the .csv with your data
As I mentioned just moments ago, this method is suitable for some infrequent reports – for example, if you need to look at the Facebook Ads data with the team once a month to analyze what happened in the previous months. Exporting and uploading the data is quick but would probably get time-consuming and simply boring if you were to do it often.
To connect Facebook Ads to Looker Studio, follow these steps:
- Go to the Facebook Ads Manager
- Set up the view that you want to export. For example, jump to the Ad sets tab, and set the Last 30 days option in the filters menu.
- Now, open the Reports menu and choose Export table data. In the next window, choose Export as .csv.

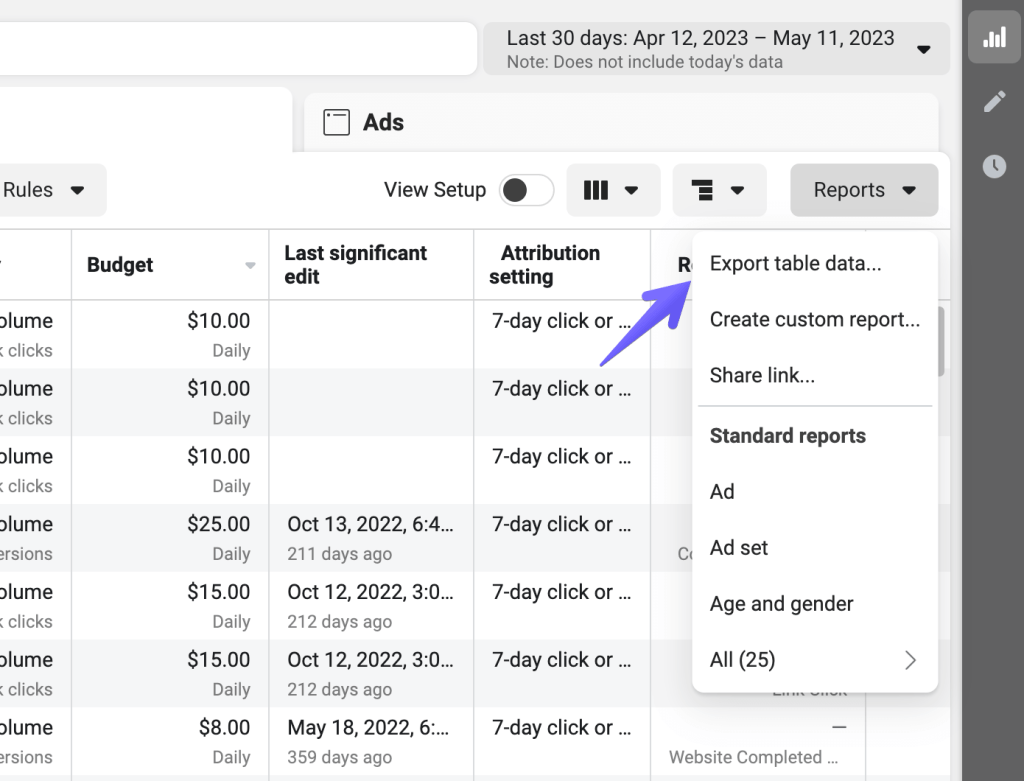
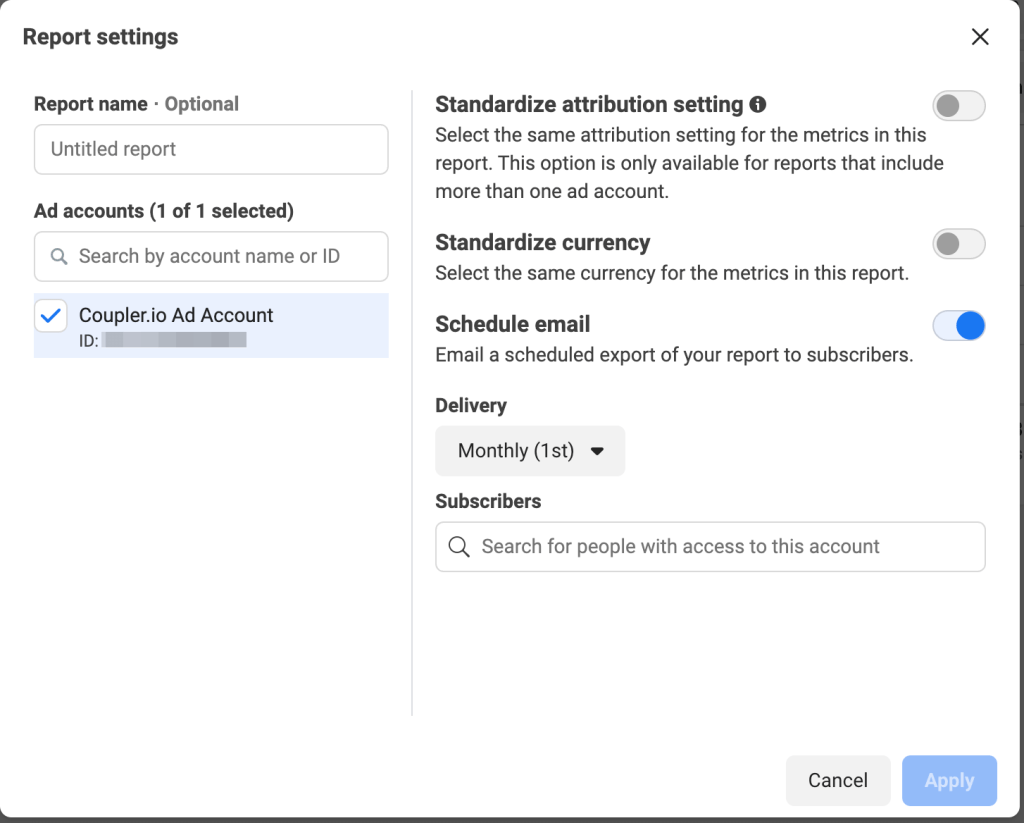
- The file will save to your device. In the window that opens, you’ll see an option to schedule this report instead. If you plan to do such exports regularly, it probably makes sense to schedule a timeline delivery of such reports into your mailbox which will save you a few clicks every time.

- Now, onto Looker Studio. Sign in and then click Create and Data Source.


- From among the Google Connectors, choose File Upload. BTW, check out the best Looker Studio connectors that we selected.


- If it’s the first time you’re uploading a file, authorize access to Google Cloud Storage where your file will be stored.
- Then, upload the file. Give it a moment to load and then click the Connect button in the top-right corner.
- As the last stage, review the imported fields, adjust the type if needed and click the Create report button.


That’s all!
Limitations of manual integration
It’s worth knowing what the limitations are of the manual Facebook Ads Looker Studio integration. The most obvious ones are the time factor and the repetitiveness of the task but there are also several technical aspects worth keeping in mind:
- You can only upload up to 100MB from both Facebook and Instagram Ads to Looker Studio
- Your total imports of Facebook Ads data can’t exceed 2GB
- You can create up to 100 uploads per day per data set every day
- Each file you upload must have the same structure, meaning you can’t add fields that weren’t in the previous imports or remove those that were present before (you would need to re-upload all data again with the new structure for this to work)
- Each new data set is appended to the previous one without checking for duplicates. You will need to carefully check if any piece of data you’re uploading hasn’t been uploaded before or otherwise you risk duplicating your data.
Benefits of Looker Studio for Facebook Ads
Now, let’s talk briefly about the primary motivations that drive thousands of Facebook Ads users to set up proper reporting in Looker Studio.
- It’s simple to use and offers a lot more than built-in Facebook Ads analytics
Looker Studio gained much of its popularity because of its simple, straightforward and easy to use interface. It’s widely used by marketers, salespeople, product managers, and many other roles that aren’t typically associated with data analytics. Albeit simple, it’s got plenty to offer to its users through the fully customizable, interactive dashboards that can be built in a matter of hours (or less). That’s a significant upgrade over the default Facebook Ads analytics that offer plenty of insights but can’t be customized or enhanced to even similar levels.
- It gives you a proper overview of your advertising efforts
Exporting data from Facebook Ads to Looker Studio gives you a much better overview of how your ads are doing. You can monitor different aspects of a business – top campaigns and ad sets, audience demographics, conversion goals, and much more. Having such an overview makes it much easier not only to find the top performers but to understand the reasons for their success. Looker Studio enables you to manipulate the raw data from Facebook to create new metrics, visualize them, and extract insights that you wouldn’t be able to access otherwise.
- It lets you compare the performance of different advertising channels
It’s most likely that Facebook isn’t the only platform where you spend your advertising dollars. So, what better way of comparing one platform to another than putting all the data on a single dashboard? This way, you can find the top performers regardless of the channel, compare the ROI of each channel separately, and decide what kind of activities bode well for the future. It’s easy to connect Facebook Ads to Looker Studio and blend it with the data from apps like Google Ads, LinkedIn Ads, or Instagram Ads.
Is a partner connector a worthy option to connect Facebook Ads to Looker Studio?
Among all the Looker Studio integrations there is no native one to load data from Facebook Ads. So, you either need to manually export data from Facebook Ads and load it to Looker Studio or use a partner connector. The latter is a better fit if you want to build an interactive Facebook Ads dashboard and have access to your data any time.
Coupler.io is very popular in the Facebook Ads community because it’s simple to use, requires no coding, and can fetch data not only from Facebook but also from other advertising platforms. You can export Facebook Public Data to Looker Studio, connect Bing Ads to Looker Studio, as well as LinkedIn Ads, Google Ads, Instagram Ads, or YouTube Ads. Many other apps, such as GA4 or Airtable, are also available. It’s simple to combine data from all these platforms into one dashboard and quickly compare campaigns, monitor the ROI of each channel, and prioritize one approach over another. If you don’t want to limit yourself to Looker Studio, Coupler.io allows you to connect Facebook Ads to Power BI or load your Facebook Ads to Tableau!
Last but not least – at Coupler.io we have a team of data experts who specialize in delivering custom data projects for our clients. We’ve already helped hundreds of businesses with extensive dashboards, automations of their workflows, connecting all sorts of business apps they use, and a lot more.
Automate Facebook Ads reporting with Coupler.io
Get started for free