49 Best Google Data Studio (Looker Studio) Marketing Dashboards for Data-Driven Decisions

Steve MacFeely, the Director of Data and Analytics at the WHO, once mentioned that dashboards still play a hugely important role in transmitting key messages and paving the way for data-driven decisions. Marketers at Coupler.io go along with this statement since almost any decision is based on data analysis. Which keyword to target, which campaign to launch, which article to update, etc. You can have data to drive your marketing activities as well if you use the best Google Data Studio (formerly Looker Studio) marketing dashboards.
Marketing is vast, and so are the dashboards for it. To make it simple, we have sub-categorized the Looker Studio marketing dashboards based on the data sources and their usage. So, you’ll find the best examples for analyzing PPC and social media performance, web analytics, marketing funnel, and email marketing.
Best Google Data Studio (Looker Studio) marketing dashboards for PPC
1. PPC multi-channel dashboard by Coupler.io
This PPC multi-channel dashboard is a perfect solution for marketers who run advertising campaigns on more than one platform. It’s a Looker Studio template, meaning that you can start using it right away.
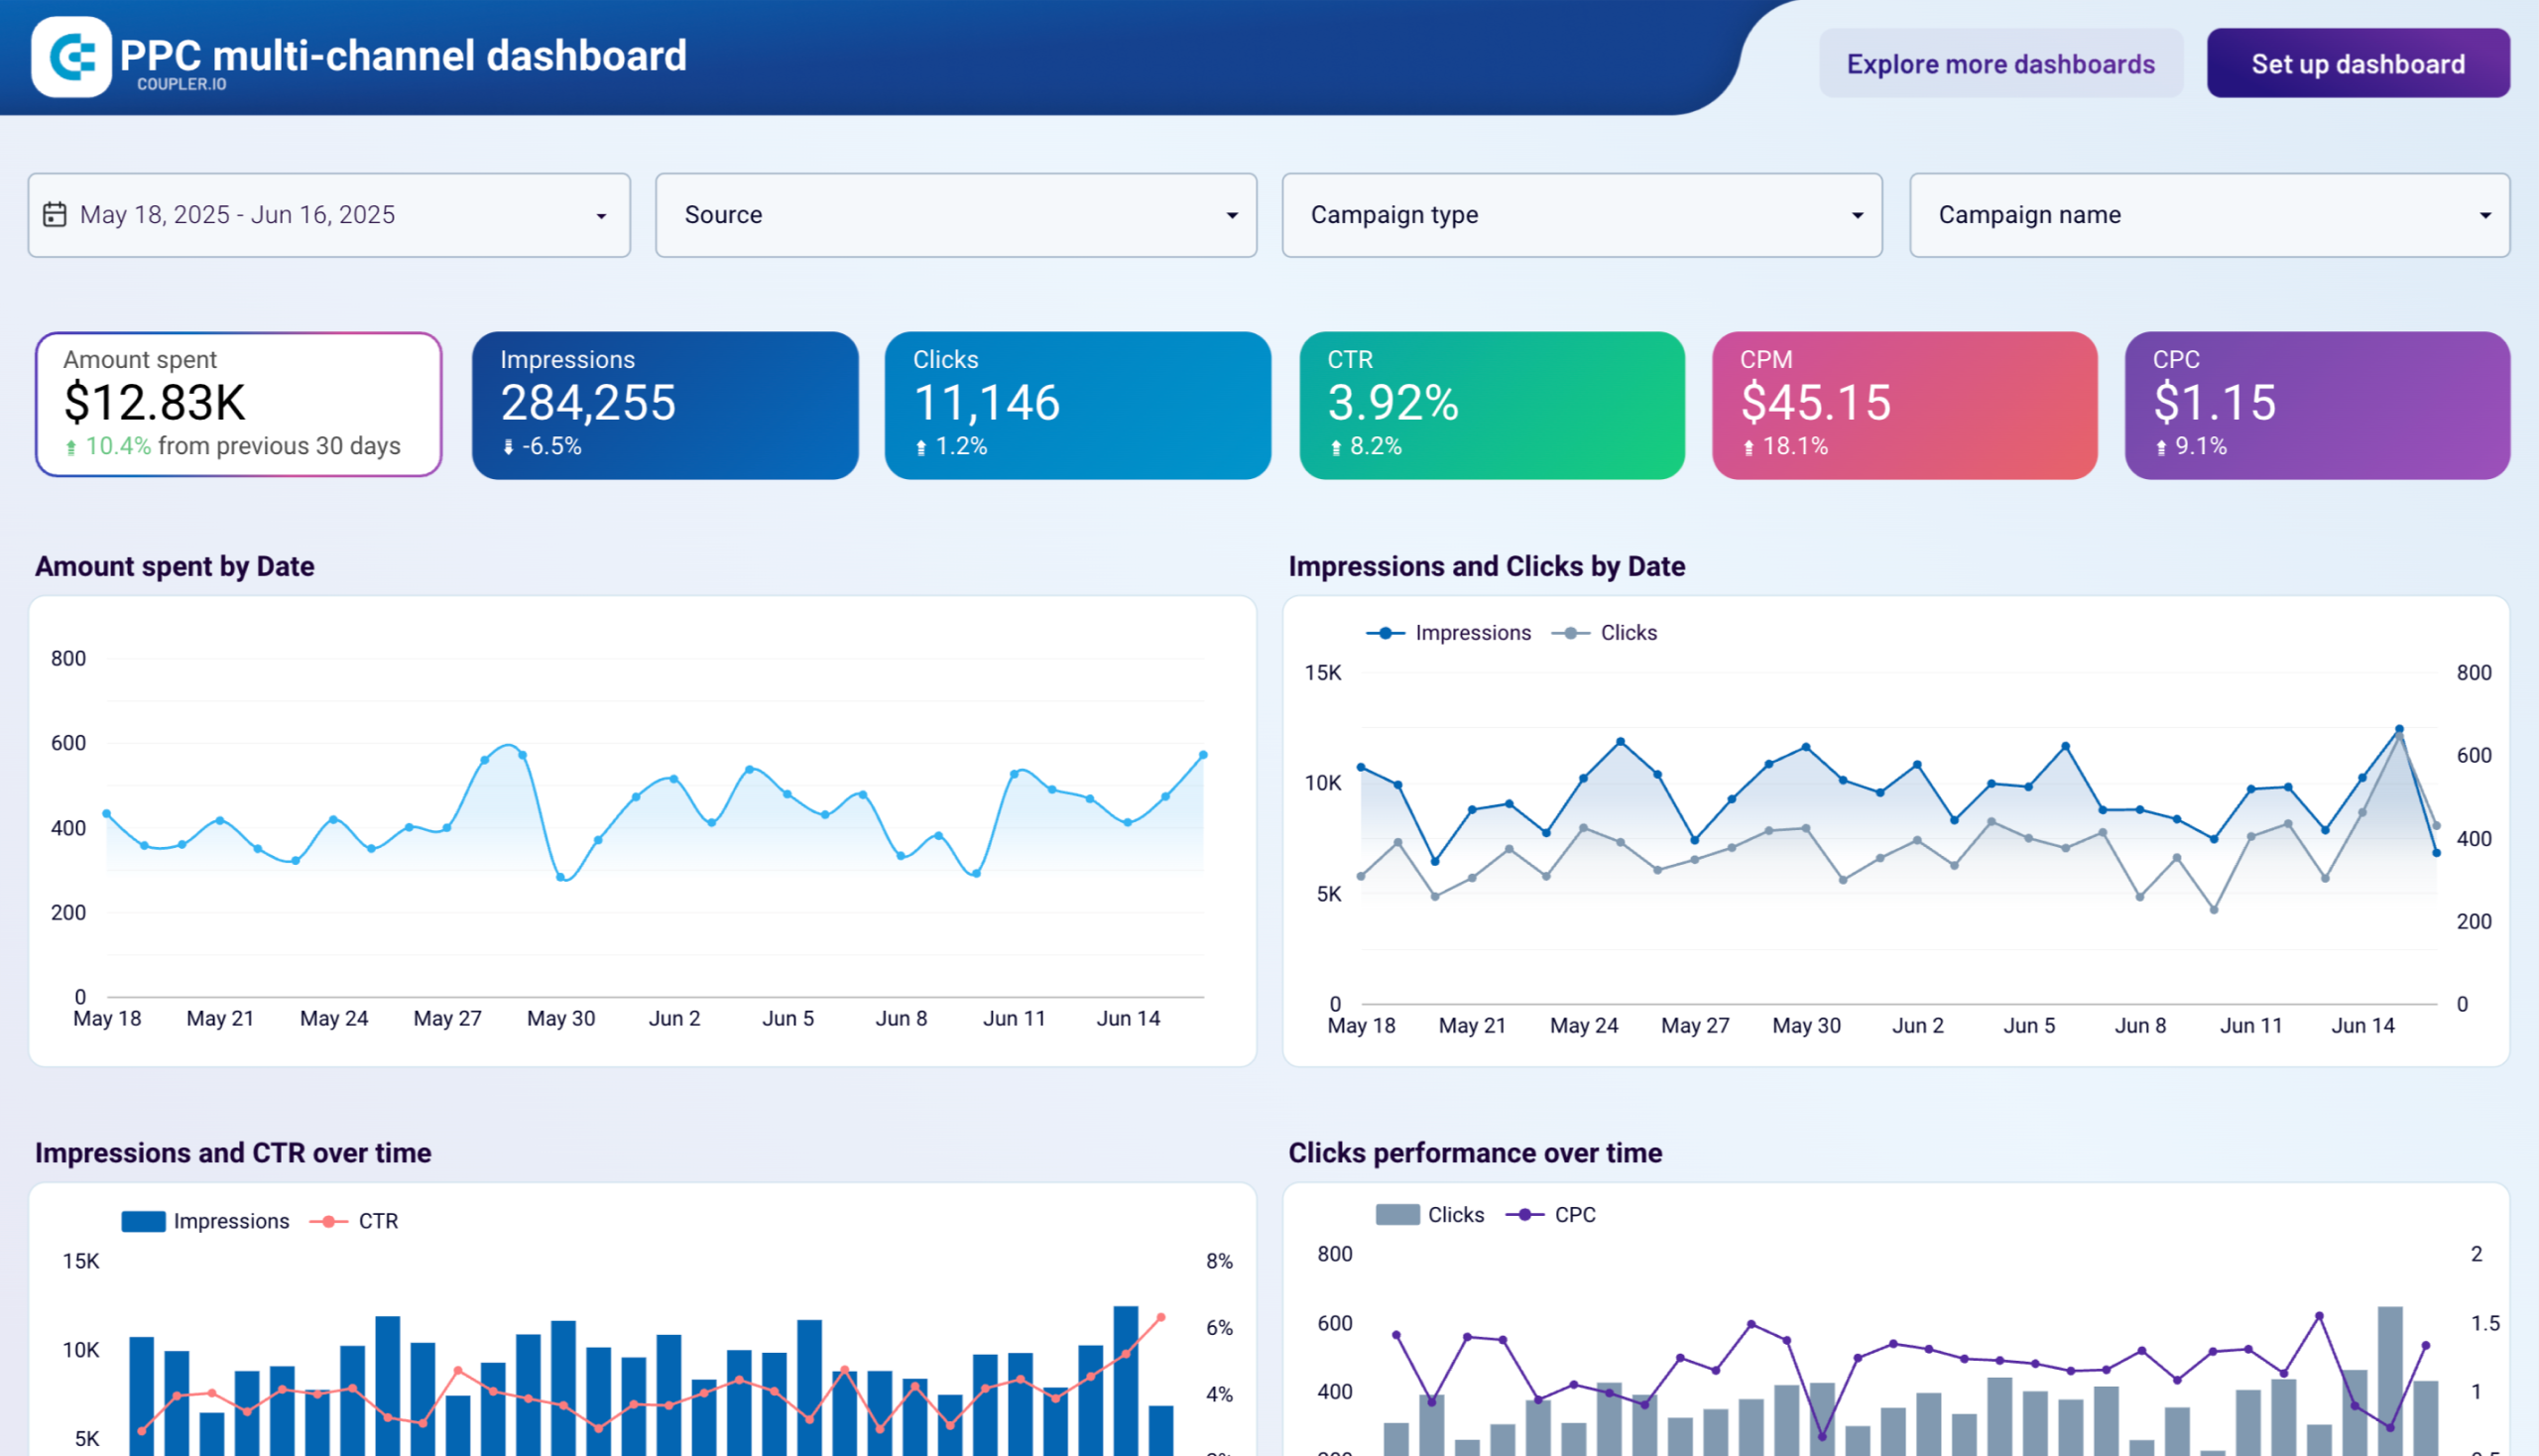
The dashboard connects to multiple ad sources, including Facebook Ads, Google Ads, LinkedIn Ads, Instagram Ads, and TikTok Ads. This way, you have an overview of all your campaigns in one place. Of course, you can only use the needed source and exclude the ones you won’t need. The setup flow takes up to 5 minutes or less if you use fewer ad data sources.
Dashboard metrics:
- Amount spent
- Impressions
- Clicks
- Click-Through Rate (CTR)
- Cost-Per-Click (CPC)
- Cost per thousand impressions (CPM), etc.
2. Facebook Ads dashboard by Coupler.io
The Facebook Ads marketing dashboard for Looker Studio by Coupler.io provides you with a convenient way to check and share your PPC campaign performance. The dashboard template has a built-in connector to Facebook Ads. So, you won’t have to worry about exporting data and loading it to your dashboard./p>
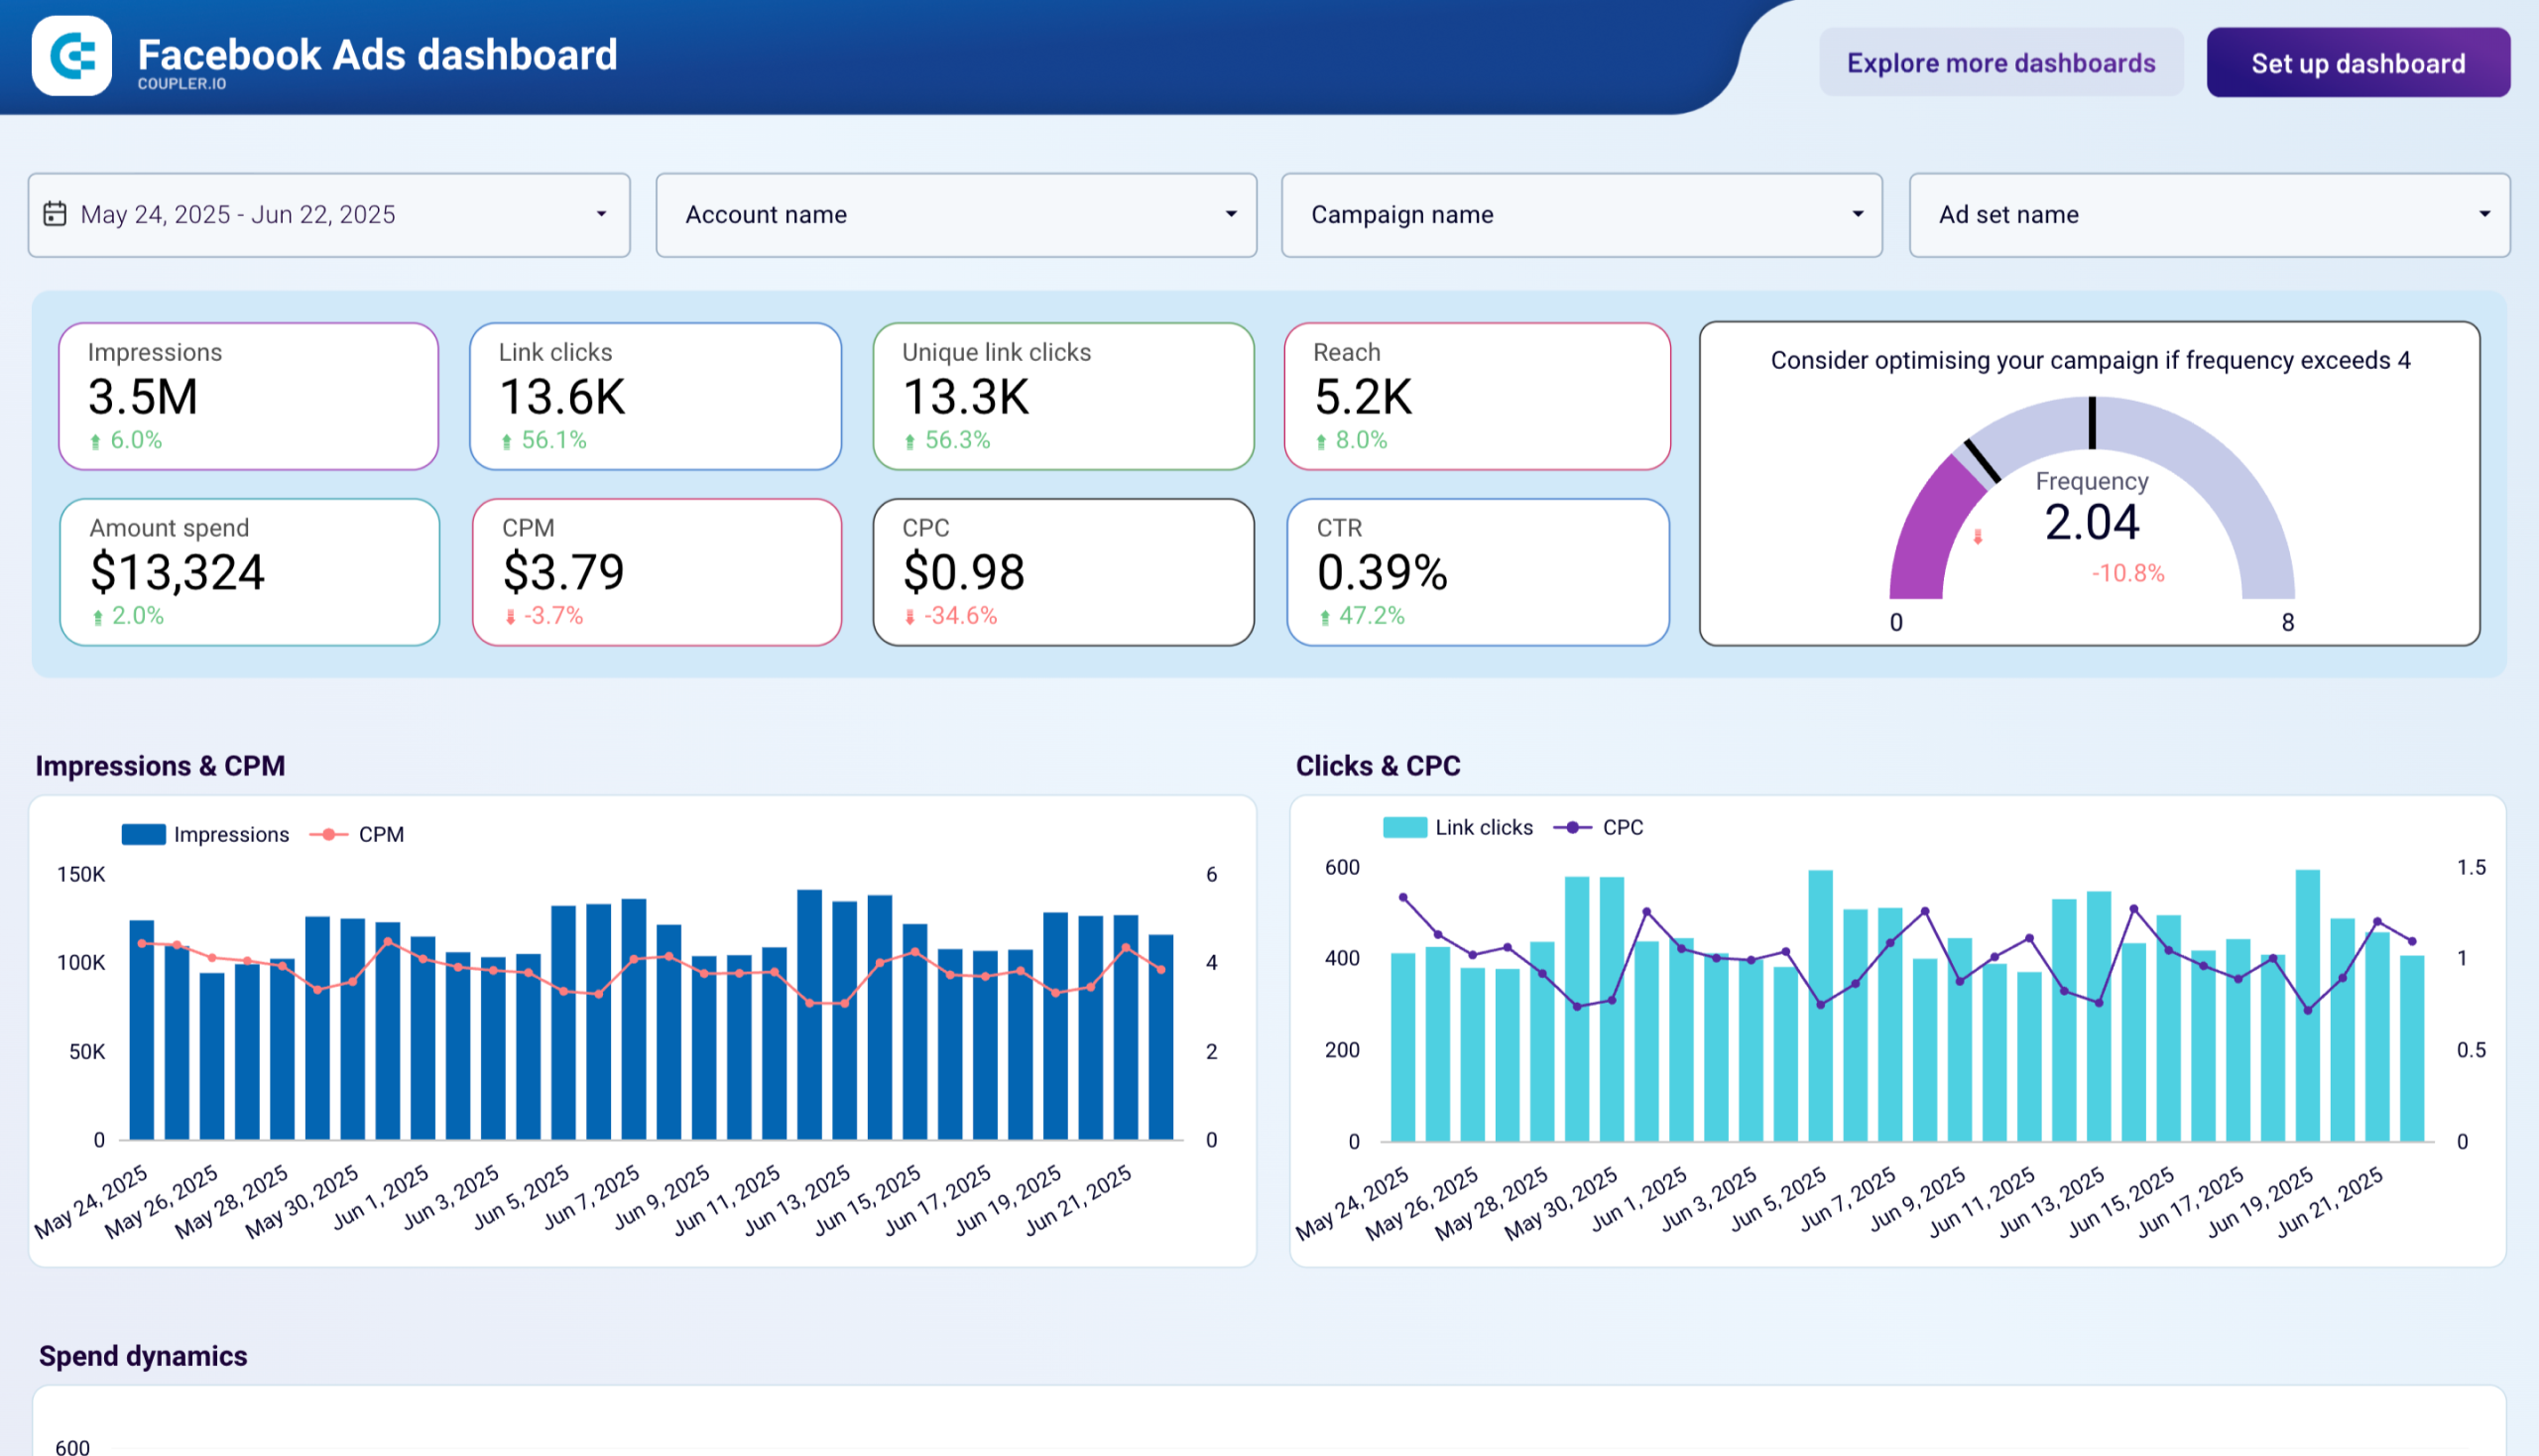
The dashboard is white-label, i.e., you can easily tune it for your brand color, add/replace metrics, and simply adjust it to your reporting requirements. It takes around 2 minutes to fork the dashboard and connect it to your Facebook Ads accounts. The template comes with instructions on how to set it up. If you need additional information on the integration, you can read this step-by-step guide to connecting Facebook Ads to Looker Studio.
Dashboard metrics:
- Impressions
- Link clicks
- CPM
- CPC
- CTR
- Frequency
- Reach
- Amount spend
- Unique link clicks
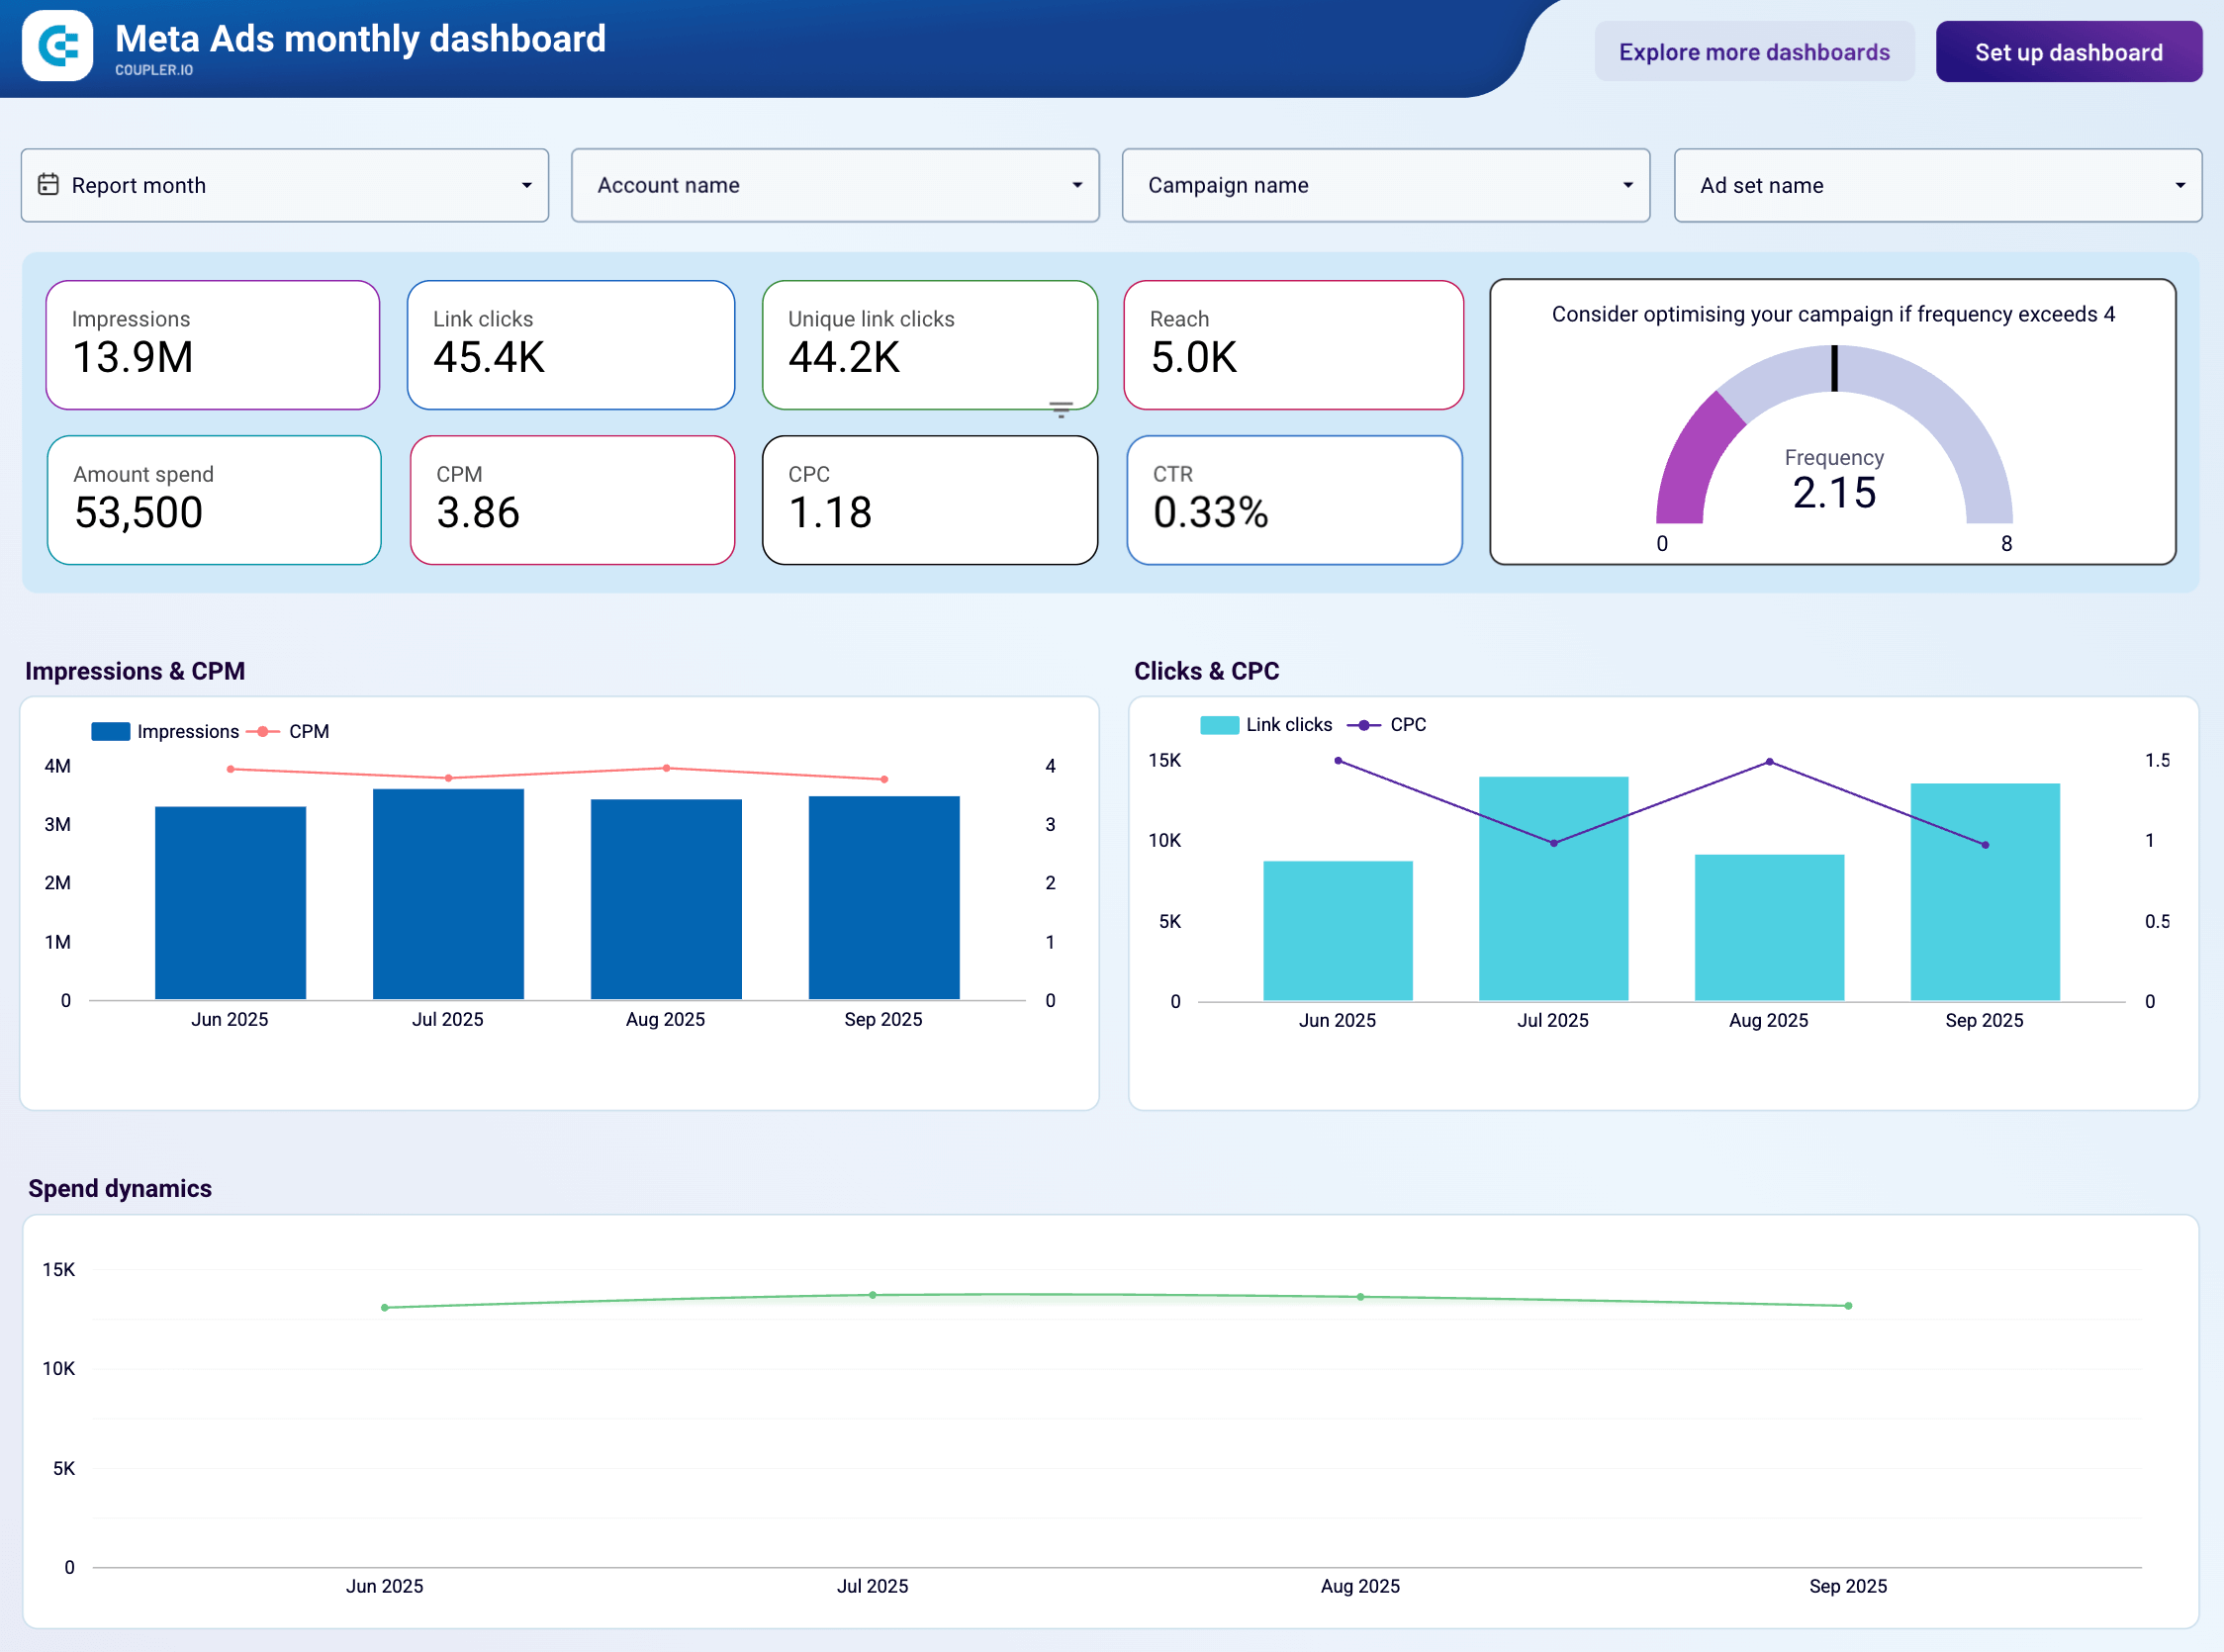
3. Meta Ads monthly performance dashboard by Coupler.io
The Meta Ads monthly performance dashboard reveals how different audience segments engage with your Facebook and Instagram advertising, helping you optimize creative formats, refine targeting, and prevent ad fatigue. This Looker Studio template answers critical questions about who responds to your ads, which devices they use, and which geographic markets offer the best opportunities.
Meta Ads monthly performance dashboard
 Preview dashboard
Meta Ads monthly performance dashboard
Preview dashboardThe dashboard helps you prevent ad fatigue by monitoring frequency—ensuring you’re not oversaturating audiences and wasting budget on people who’ve already seen your ads too many times. You can track monthly cost efficiency trends to identify whether rising costs indicate increased competition or declining ad relevance, and spot seasonal patterns that inform when to scale or reduce spending.
This dashboard is ideal for B2C businesses running campaigns across Facebook and Instagram, eCommerce stores managing product promotions, or marketing teams that need to prove social advertising ROI with demographic and geographic performance data.
To start using this template, follow the setup instructions in the Setup guide tab to connect your Meta Ads accounts via Coupler.io.
Dashboard metrics:
- Impressions
- Link clicks
- Unique link clicks
- Reach
- Amount spent
- CPM
- CPC
- CTR
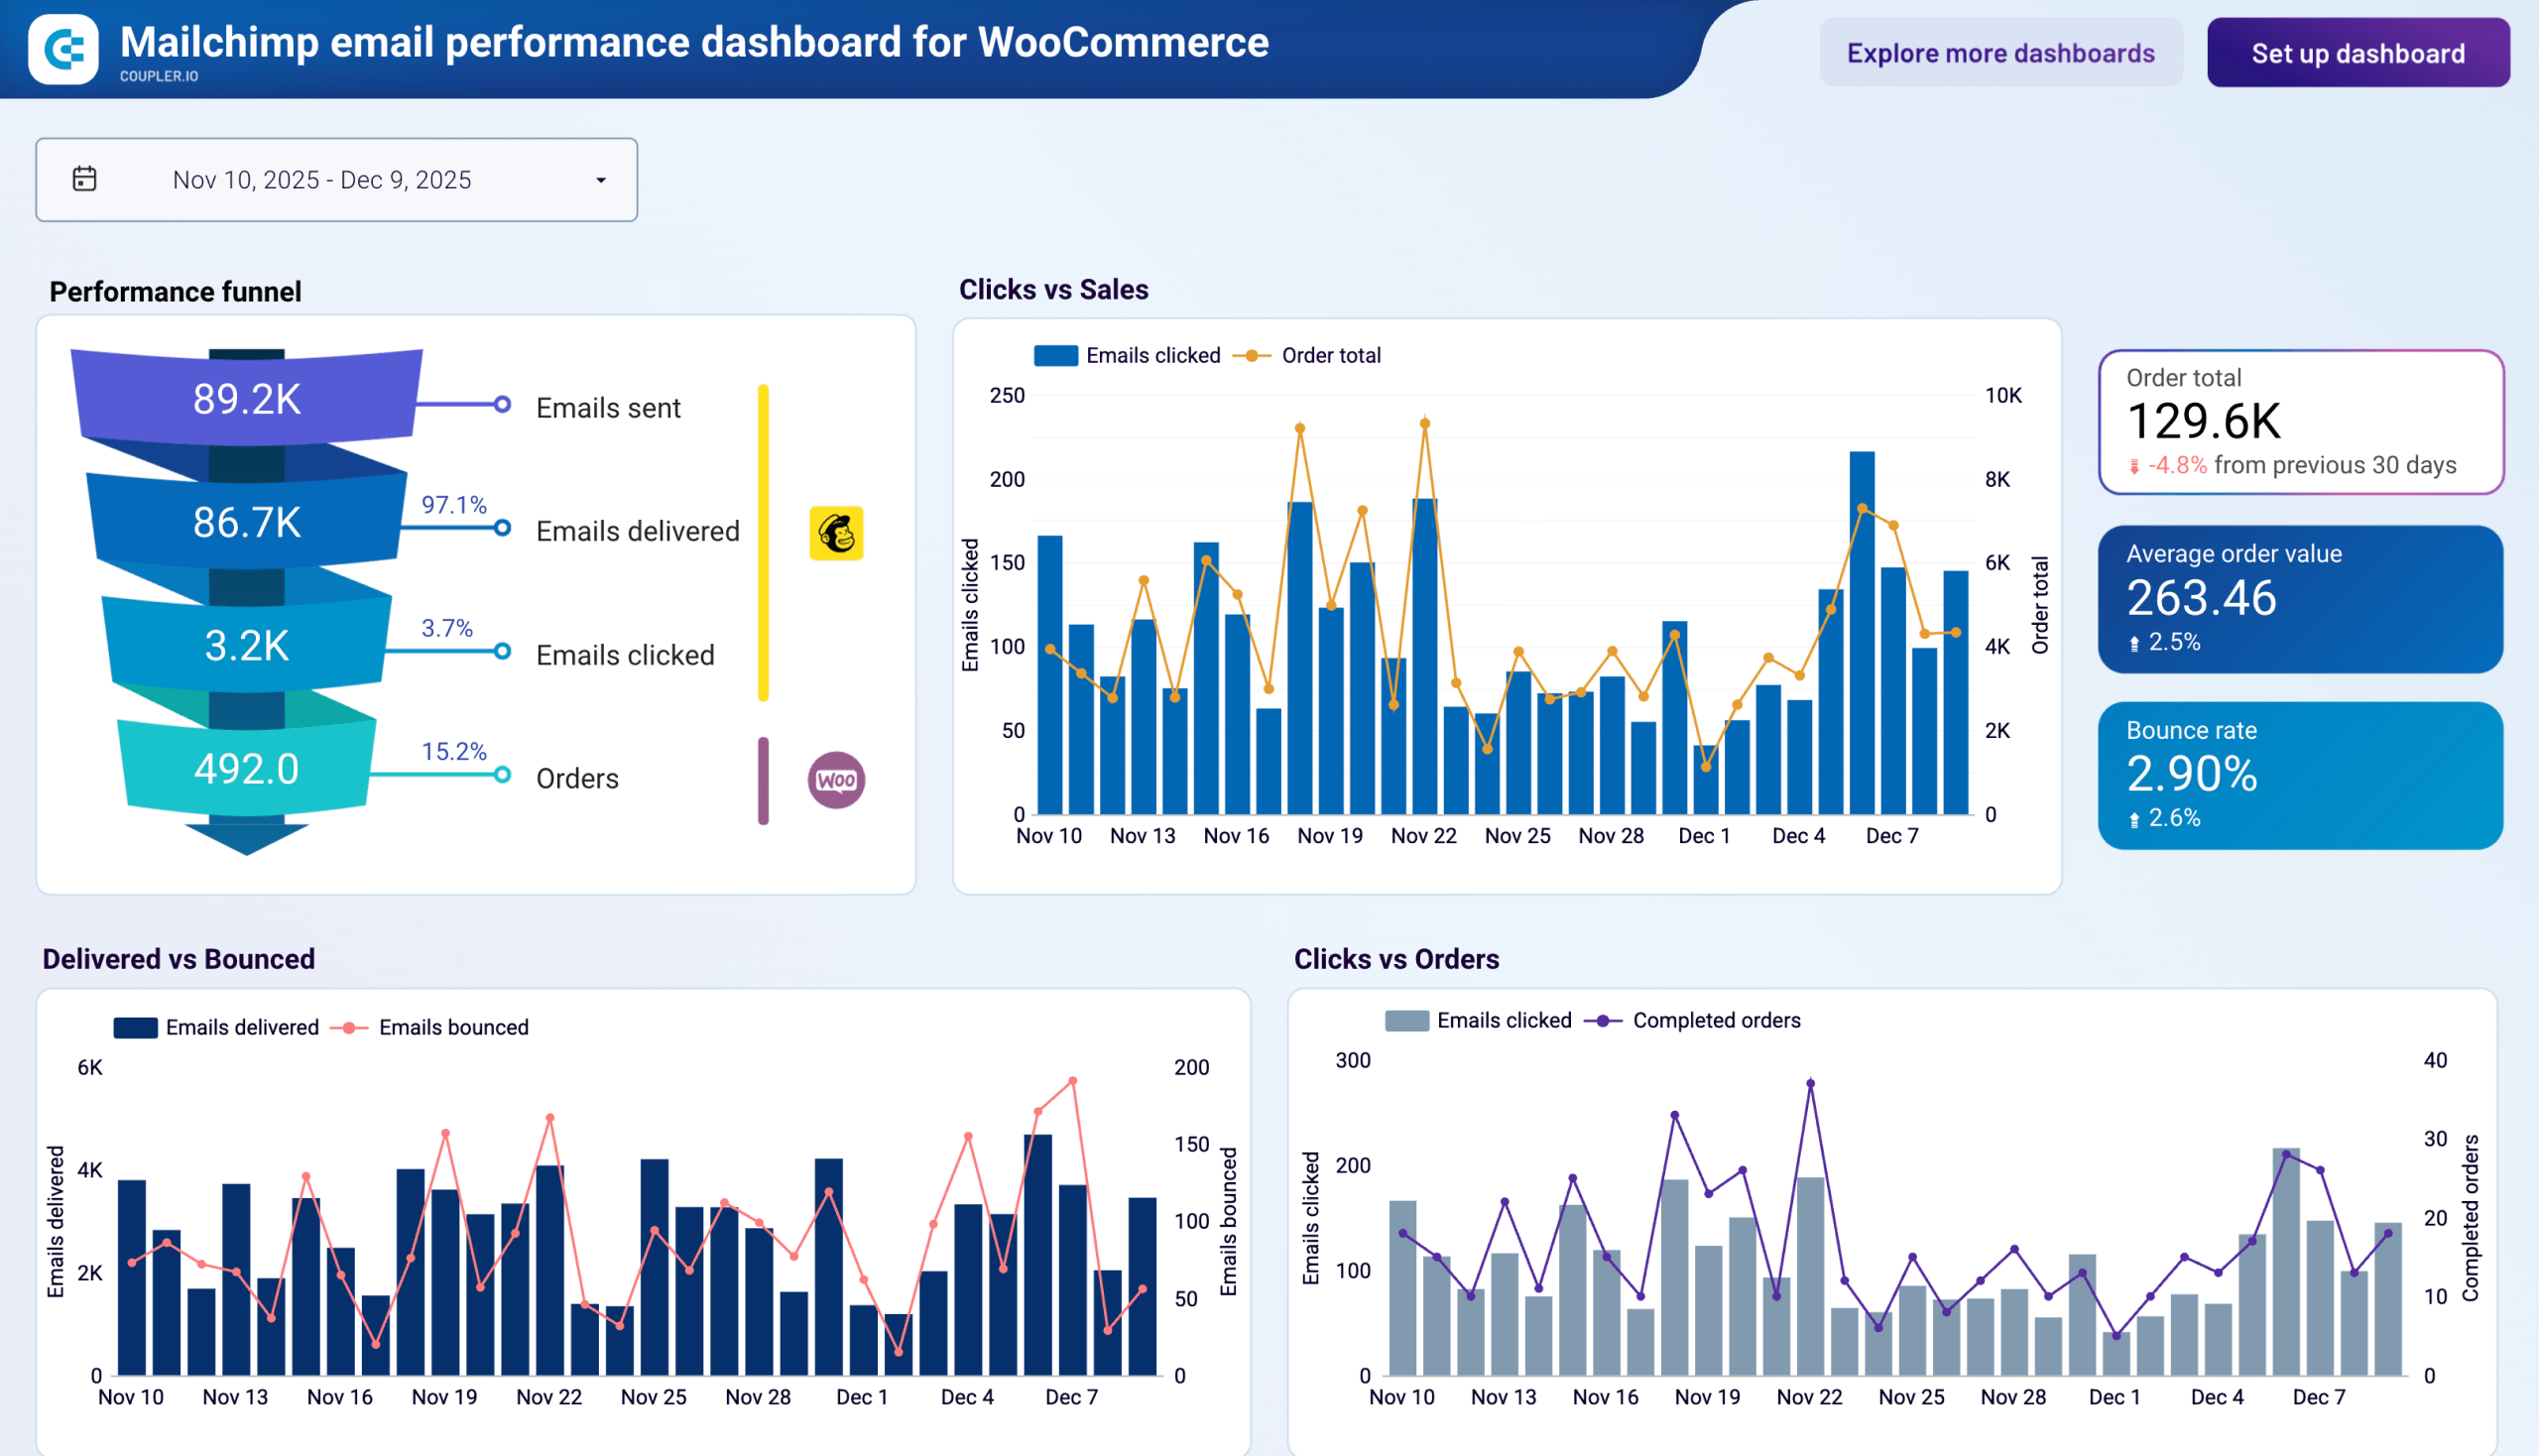
- Frequency
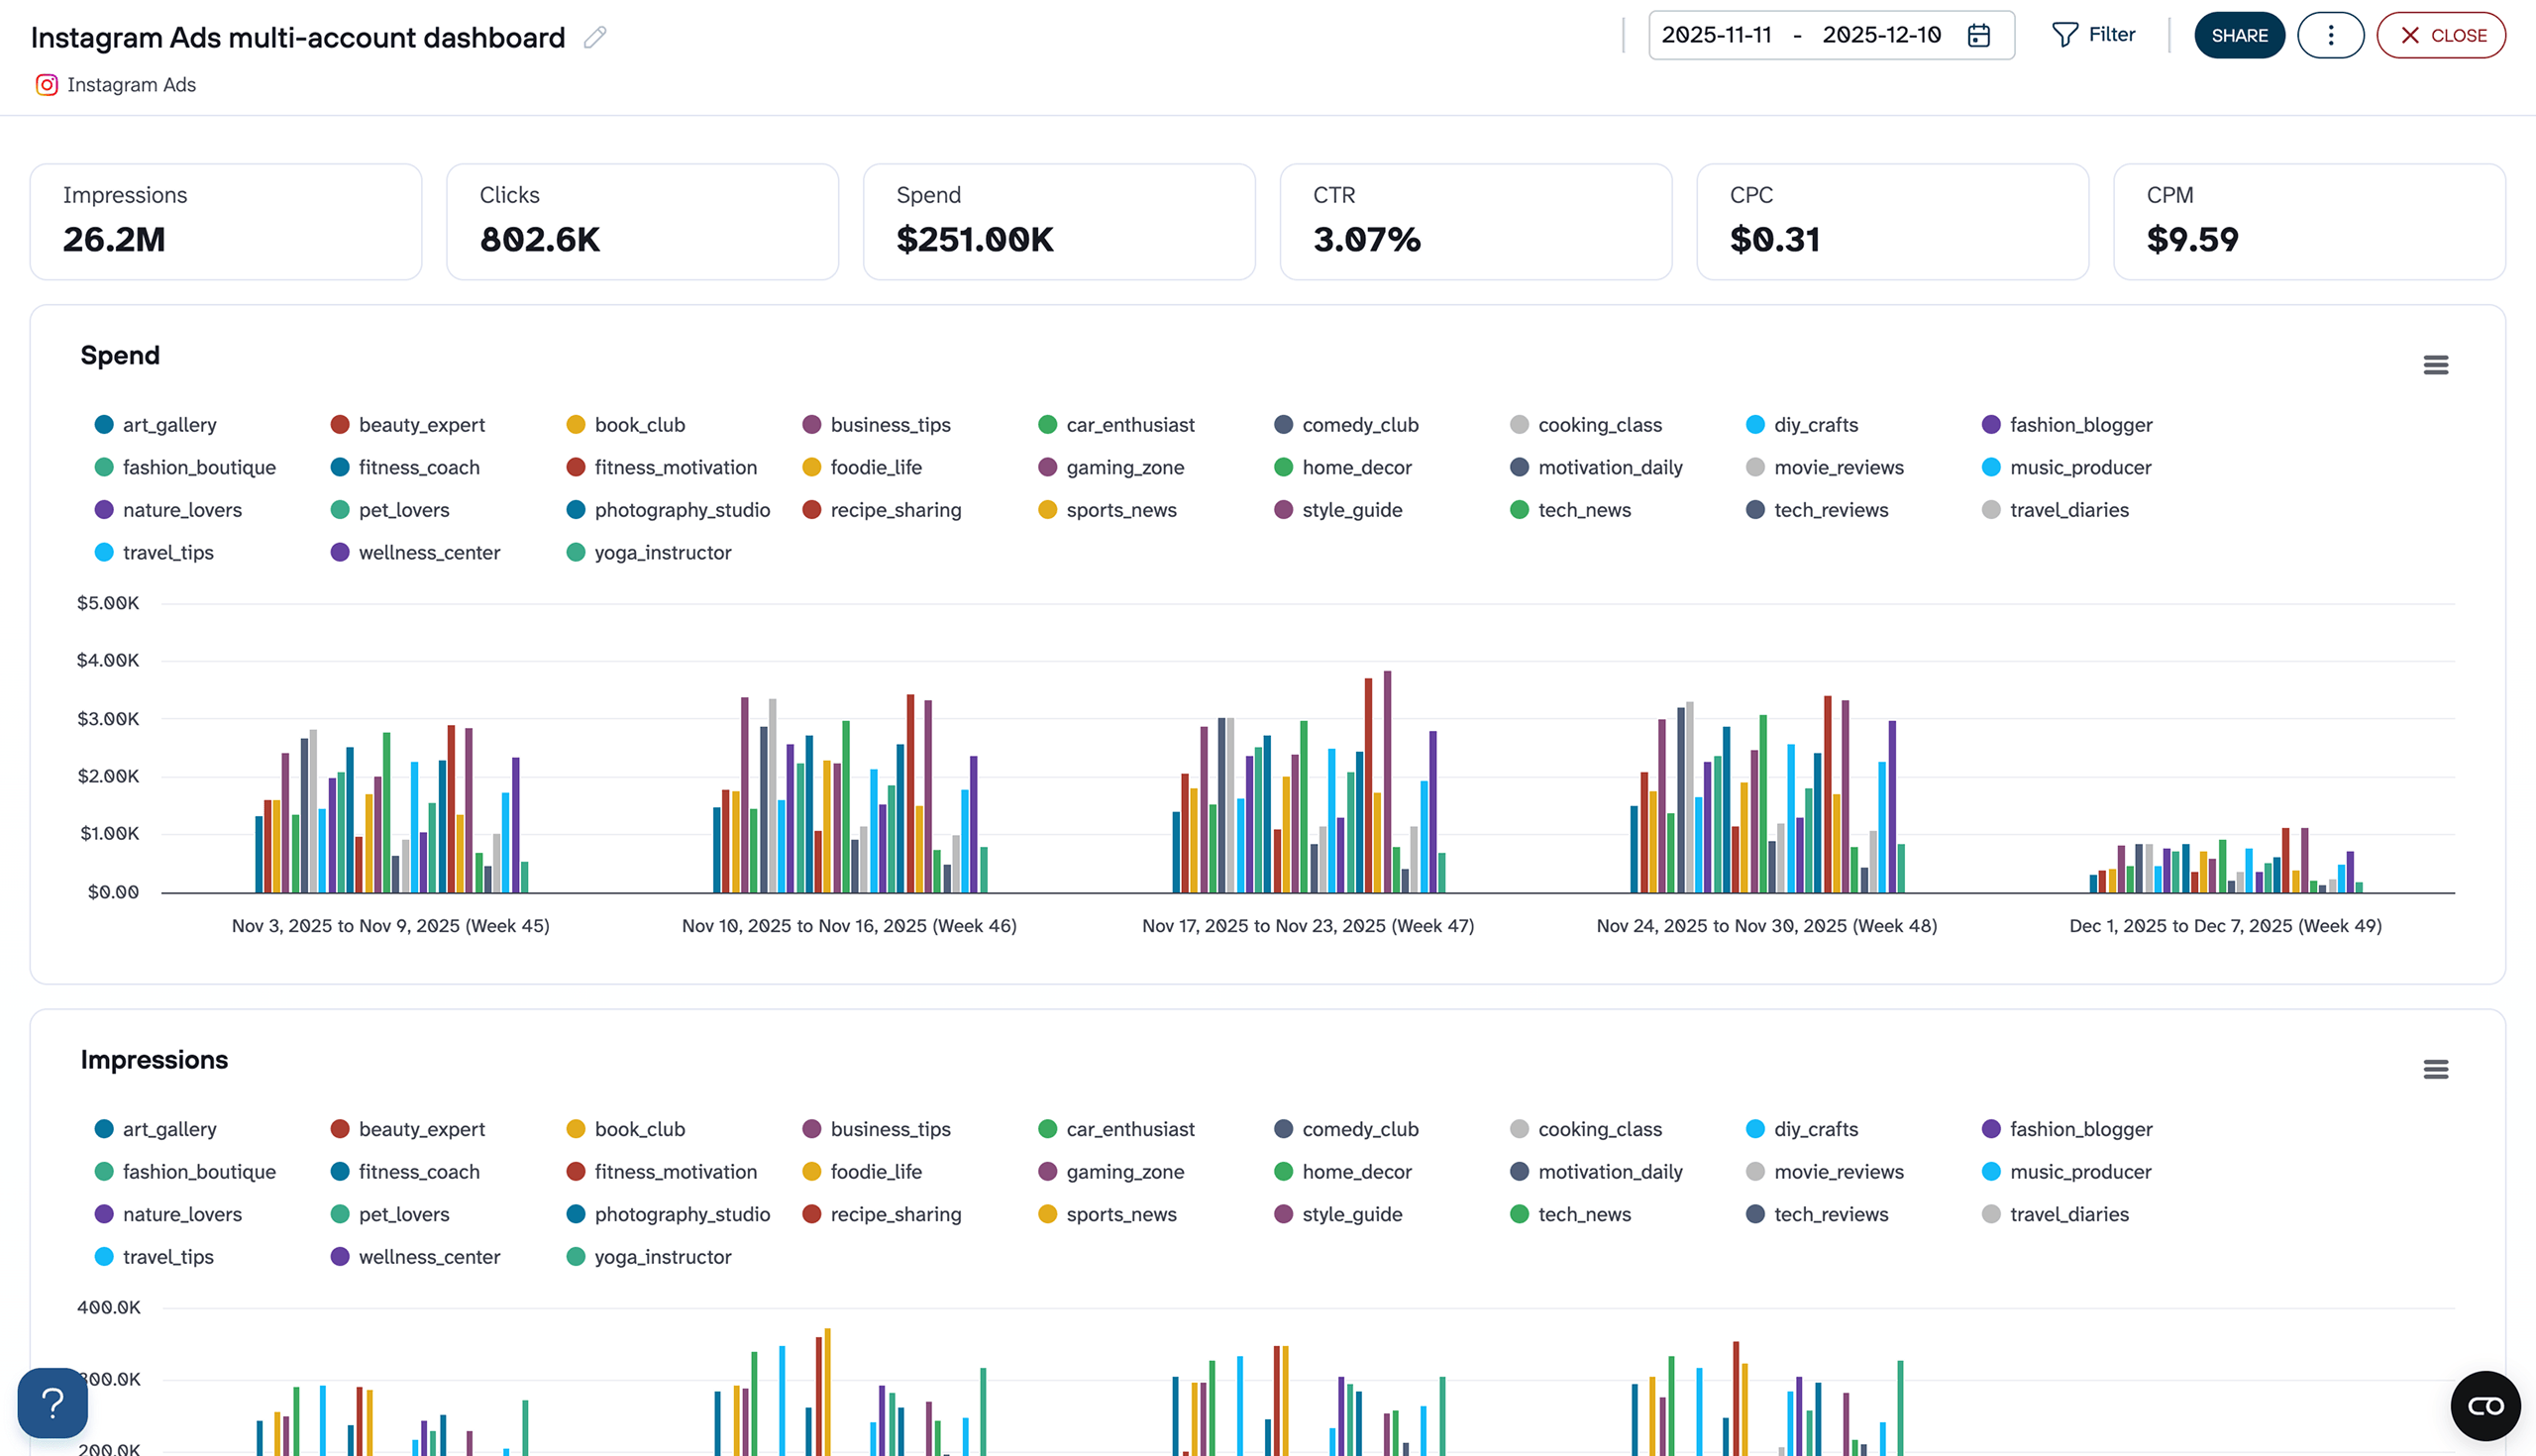
4. Instagram Ads multi-account dashboard by Coupler.io
Agencies and in-house teams running Instagram ads across multiple accounts face a reporting gap: there’s no native way to compare account-level performance without switching between ad managers. This Looker Studio dashboard connects to all your Instagram Ads accounts and shows their metrics in one ranked view.
Instagram Ads multi-account dashboard
 Preview dashboard
Instagram Ads multi-account dashboard
Preview dashboardYou can compare spend, impressions, clicks, and engagement across all accounts at once and spot which ones consume budget without delivering proportional results. The dashboard tracks reach and frequency per account, so you can catch audience saturation before it starts driving up costs. It also reveals budget pacing issues: if an account front-loads spend and risks going dark before the month closes, that shows up in the weekly spend charts.
Agencies managing client portfolios, eCommerce brands running regional accounts, and any team tired of manual exports will get the most out of this. Connect your Instagram Ads accounts in Coupler.io and start using it for free.
5. Google Ads dashboard by Coupler.io
Want to make sure that your paid ads on Google are performing well and also share the results with your managers or clients? Coupler.io offers a free Looker Studio dashboard for Google Ads that allows you to track your ad performance. This dashboard template provides insights about your most valuable metrics such as clicks, conversions, CPA, CPC, click-through rate, and so on.
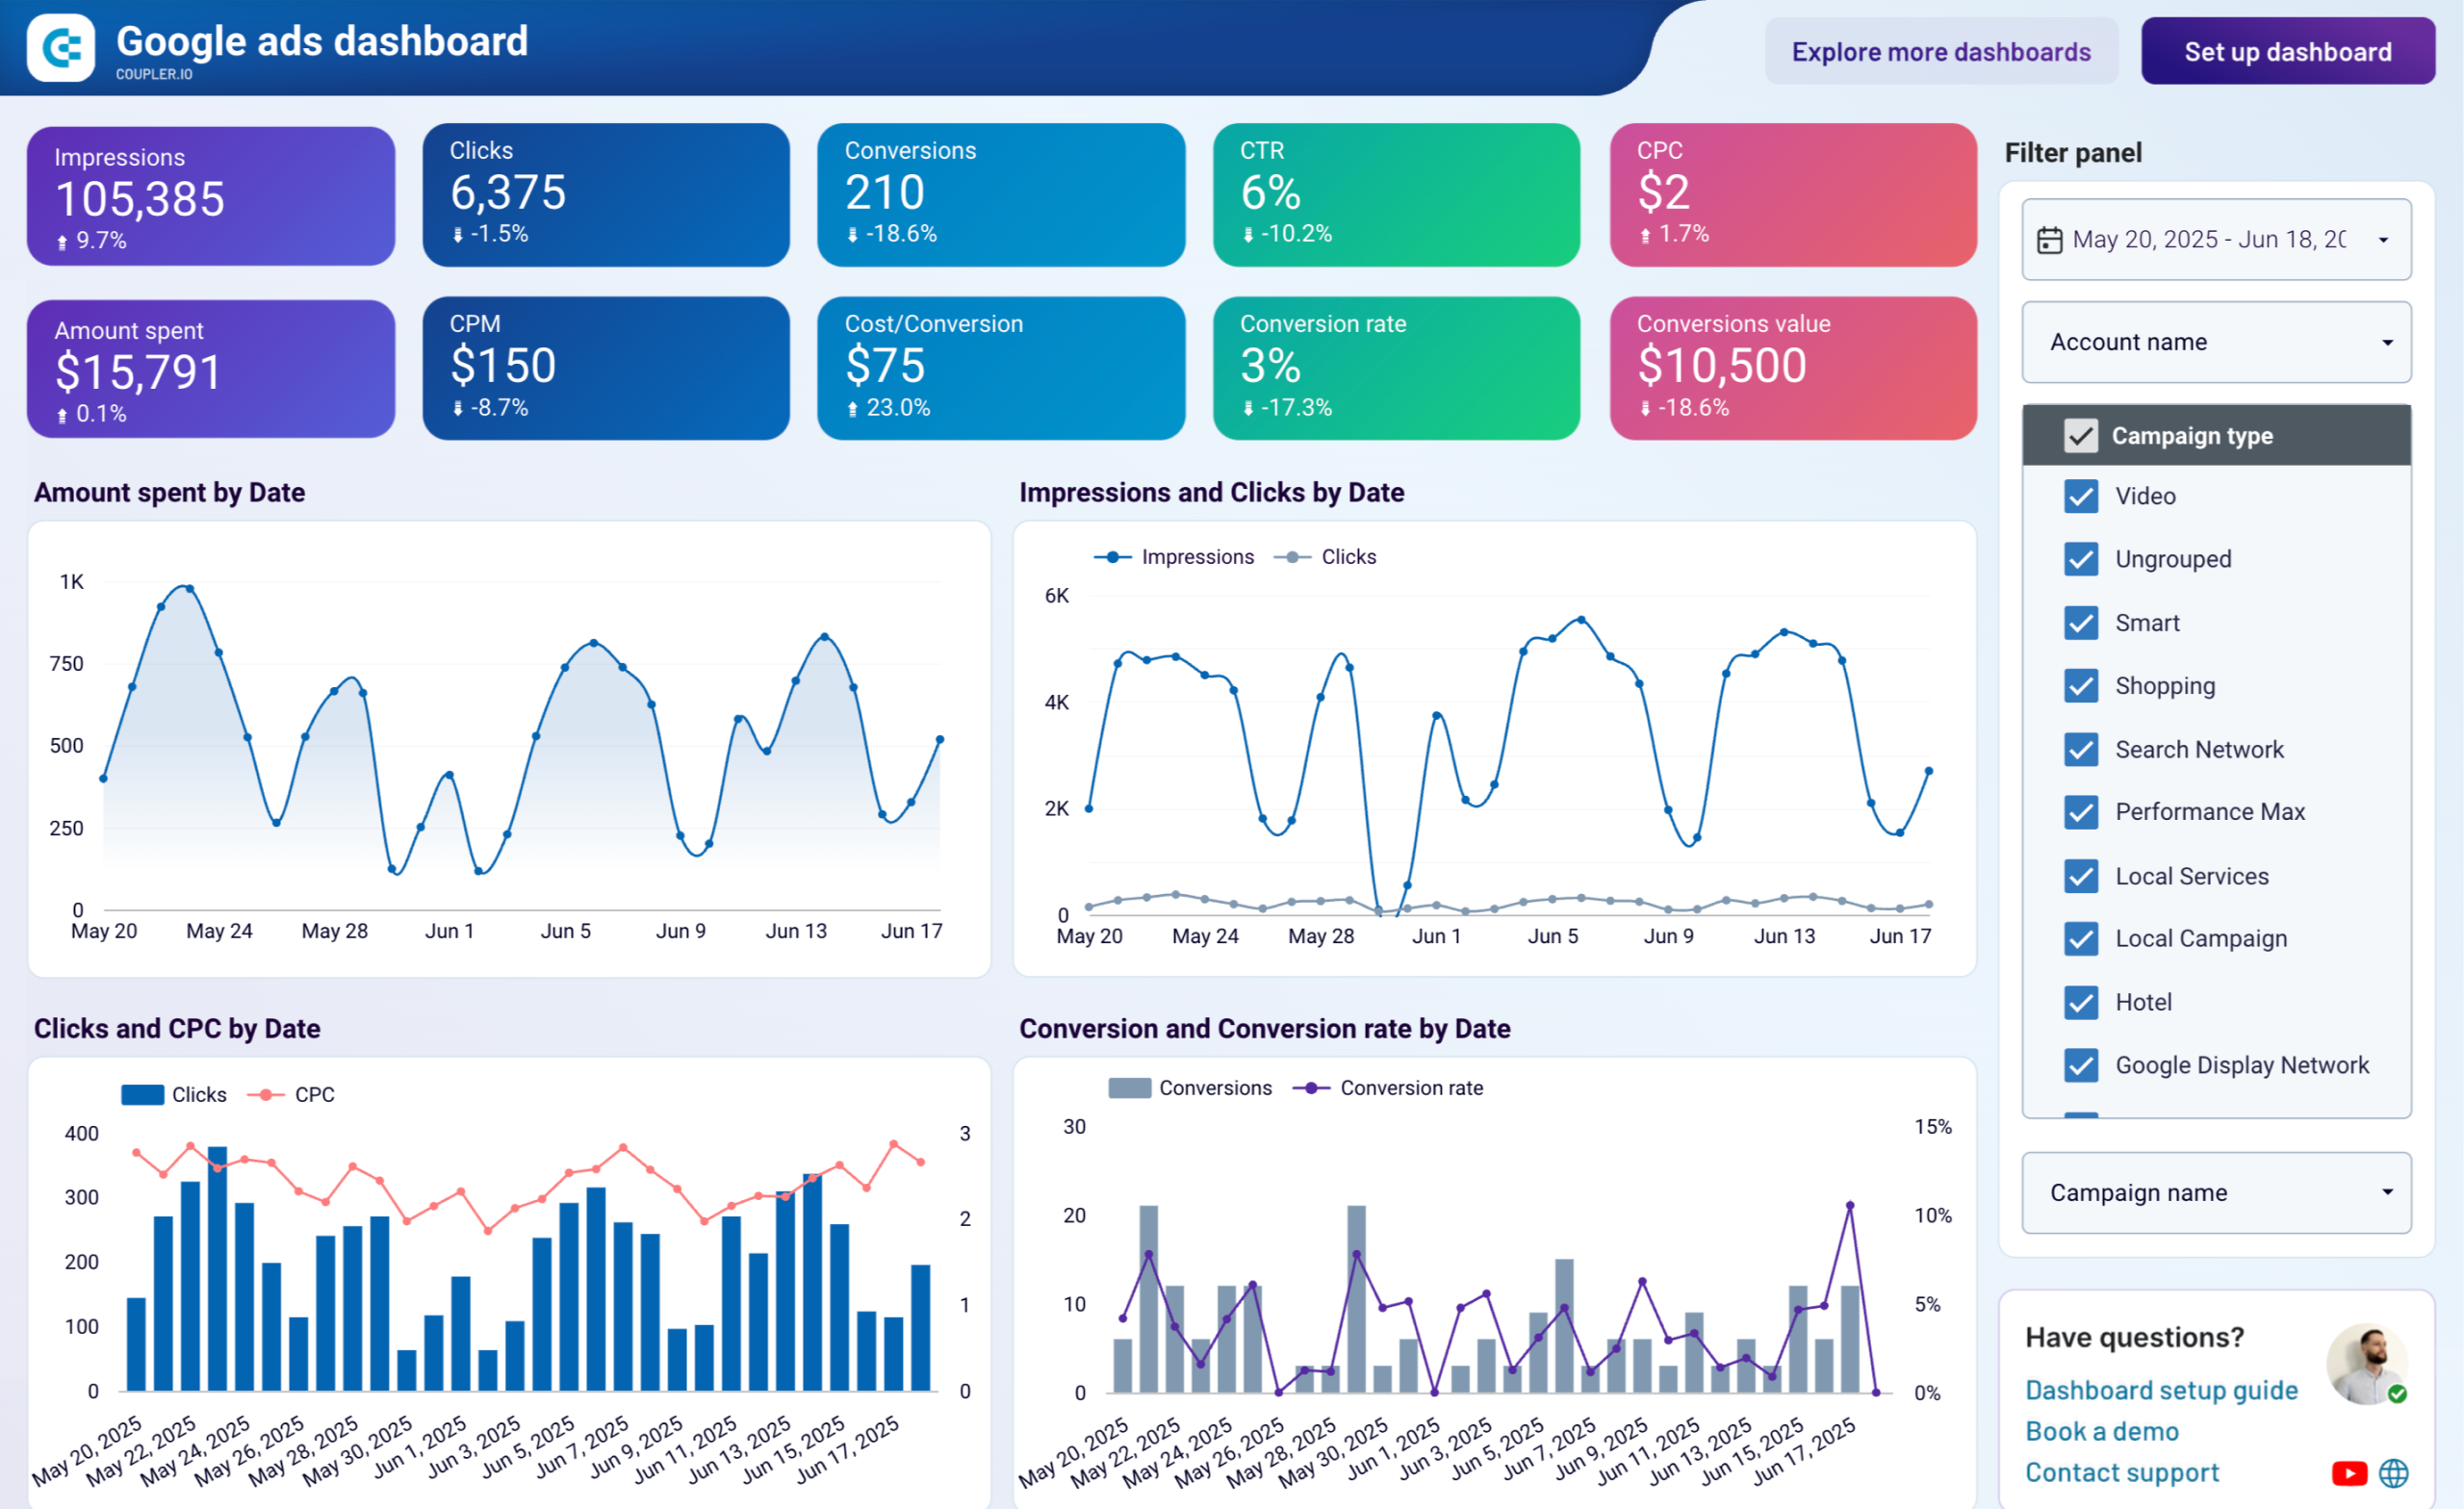
The template has an integrated Google Ads connector by Coupler.io that makes the dashboard self-update on a schedule you set out. Just like the dashboard for Facebook ads, the Google Ads one can be customized to your reporting needs. At the same time, if this dashboard is not enough for you or you’d like to build your own one from scratch, here’s a step-by-step guide on how to connect Google Ads to Looker Studio.
Dashboard metrics:
- Impressions
- Clicks
- CTR
- Average Cost-per-Click
- Conversions
- Cost per conversion
- Cost per thousand impressions (CPM), etc.
6. Google Ads leads dashboard by Coupler.io
This dashboard helps you track sales leads generated by campaigns you run on Google Ads. It provides an overview of the conversion funnel alongside key metrics such as cost per lead, total leads value, and conversion rate. You can easily identify which campaigns generate the most qualified leads at the lowest cost, compare performance, and spot correlations between spending and engagement.
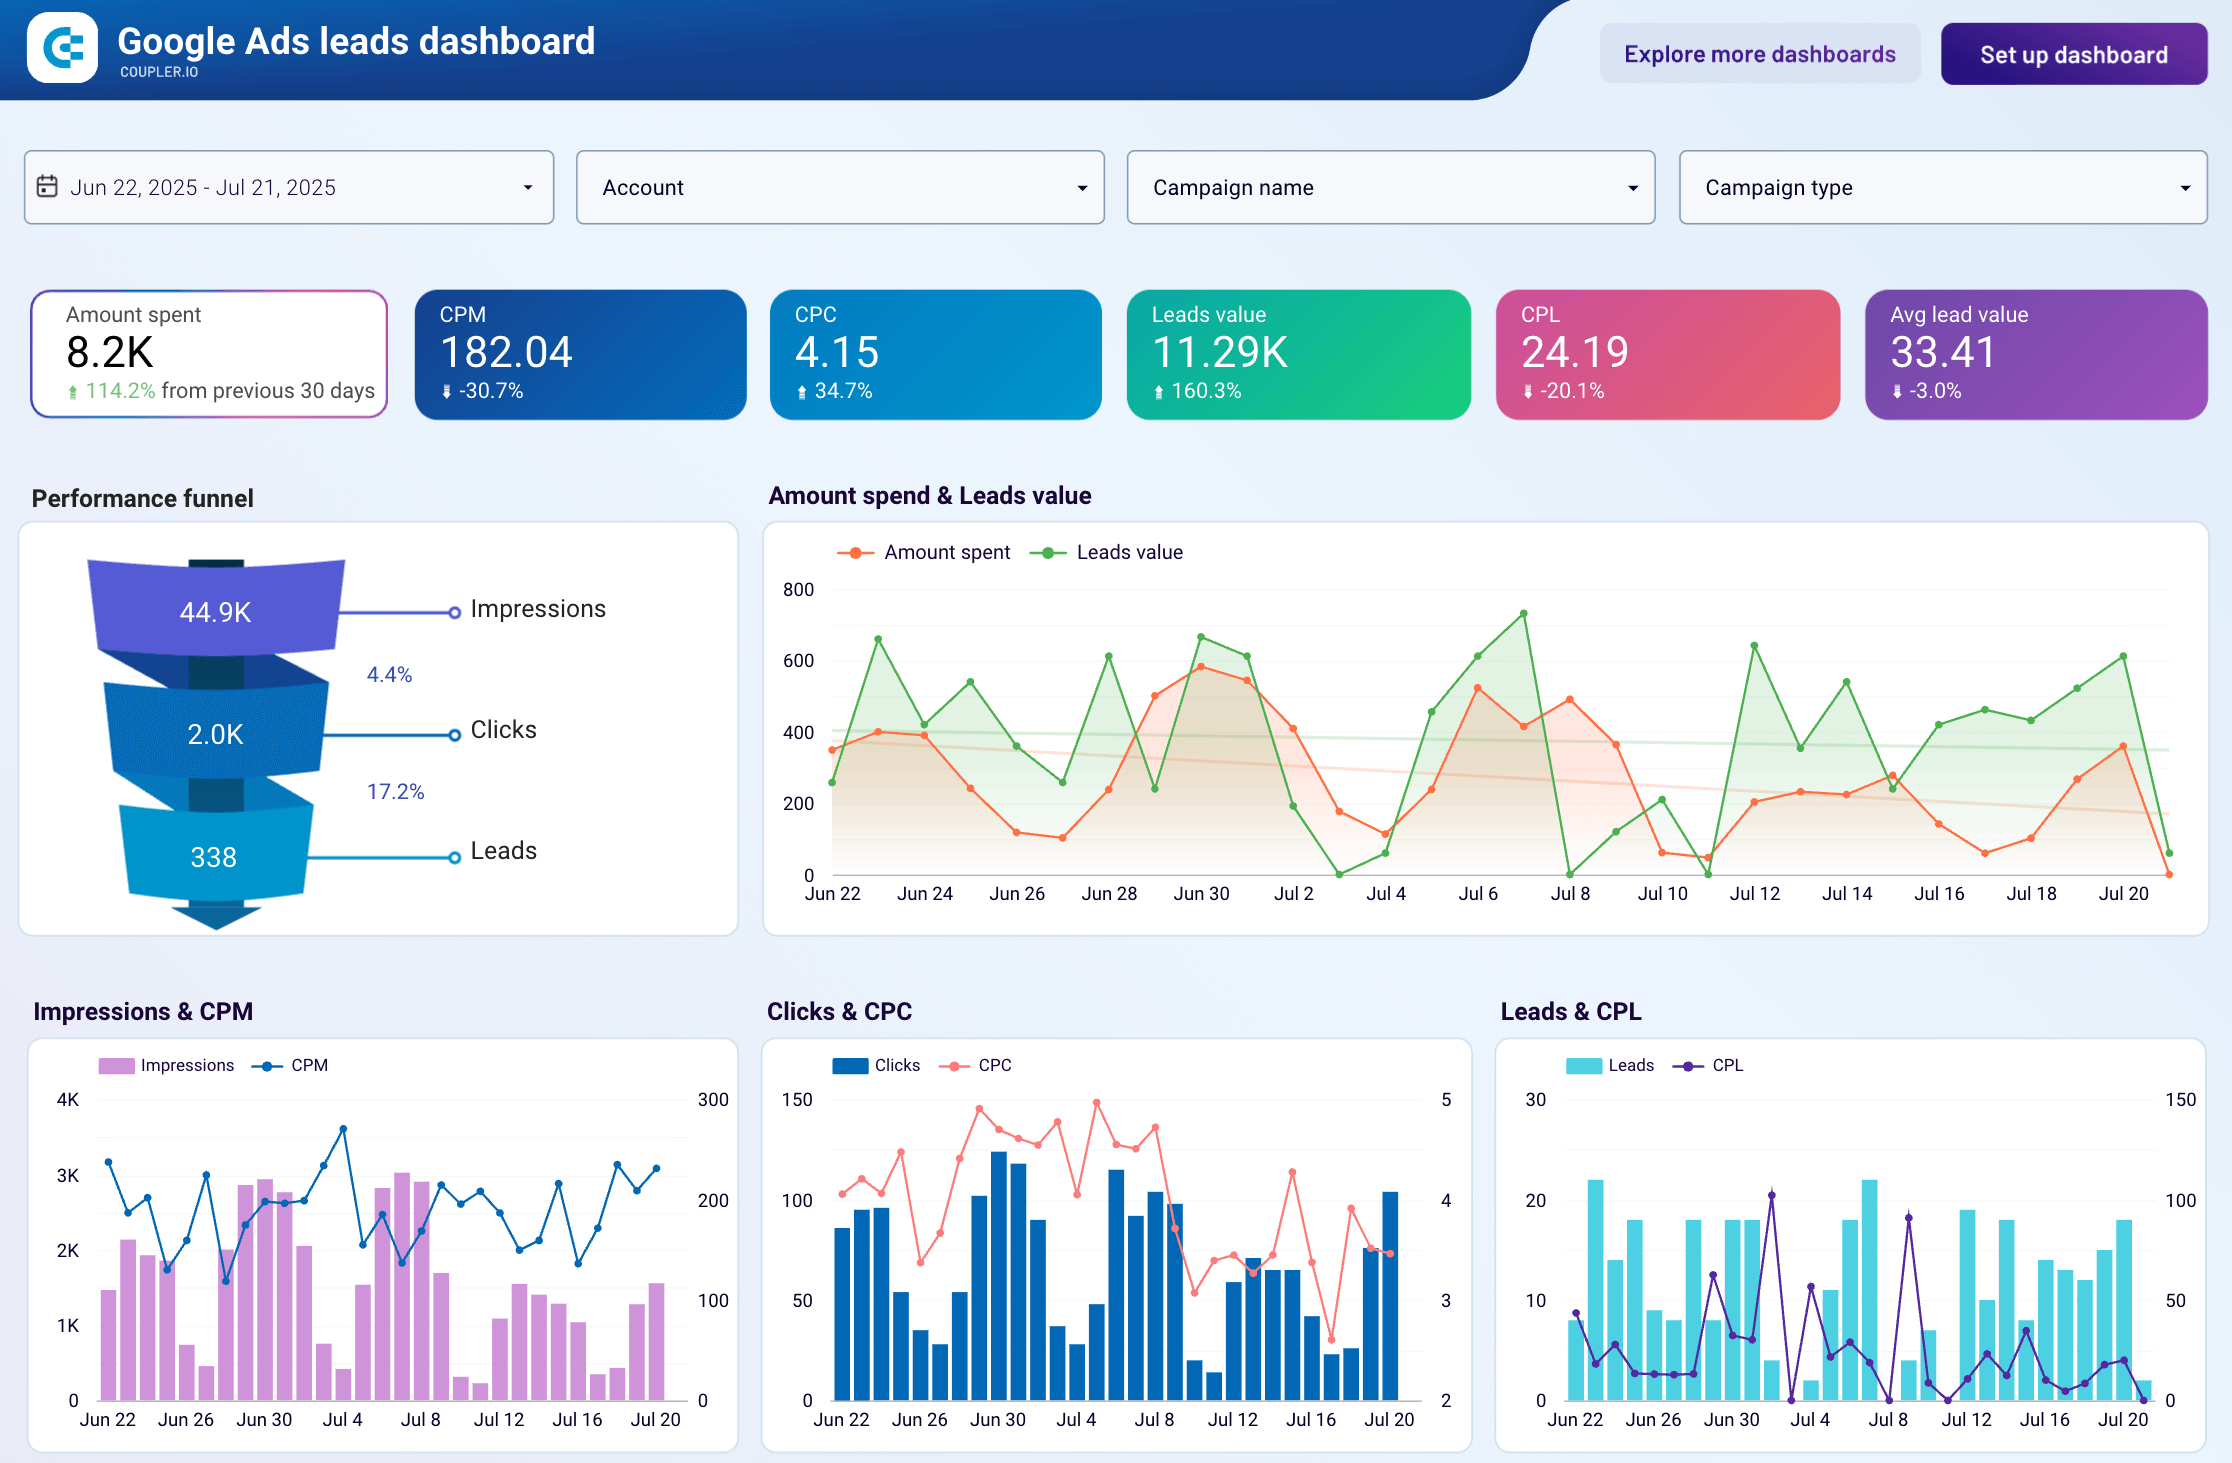
The dashboard insights are useful for optimizing your advertising spend and refining your campaign content. To make a free copy of the dashboard template, simply sign up for Coupler.io and load your data with the dedicated Looker Studio connector.
Dashboard metrics:
- Amount spent
- Impressions
- Clicks
- CPM
- CPC
- Leads
- Leads value
- Avg. leads value
- Conversions
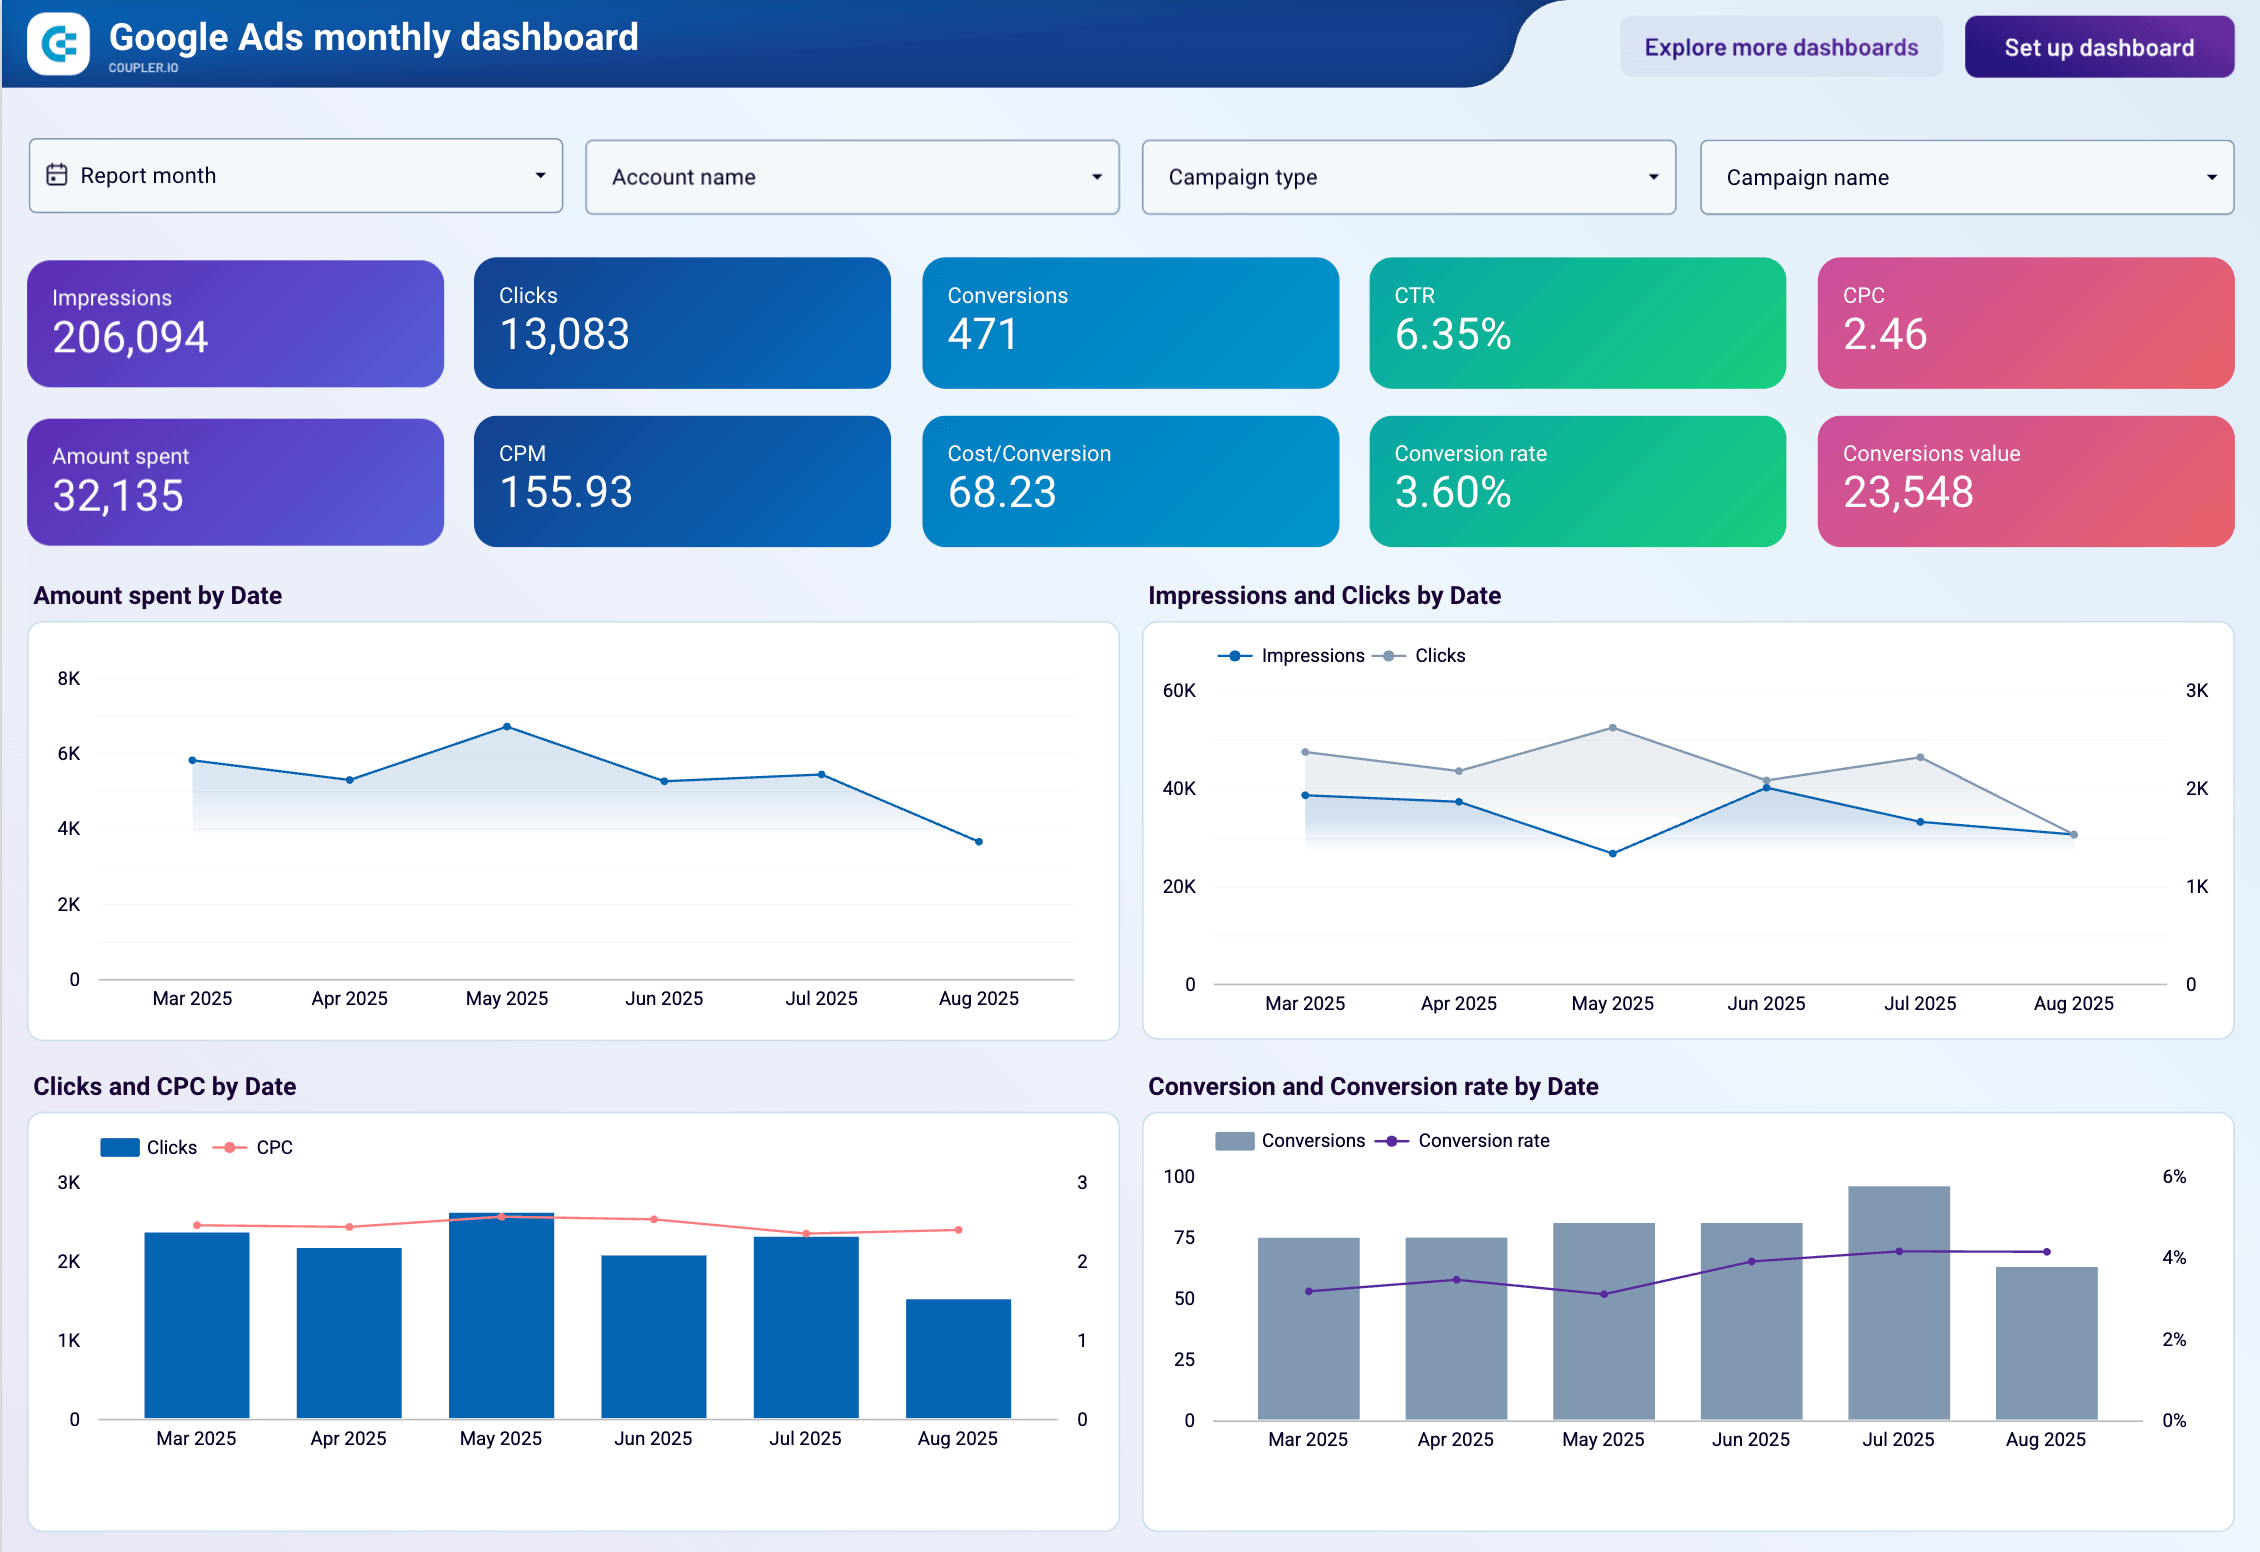
7. Google Ads monthly performance dashboard by Coupler.io
The Google Ads monthly performance dashboard provides a comprehensive monthly view of your advertising performance, helping you optimize budget allocation and improve campaign ROI. This Looker Studio template is designed for marketers who need deeper insights than standard Google Ads reports provide, with emphasis on understanding audience behavior and identifying growth opportunities.
Google Ads monthly performance dashboard
 Preview dashboard
Google Ads monthly performance dashboard
Preview dashboardWith this dashboard, you can make smarter budget decisions by identifying which campaign types deliver disproportionate value and which consume budget without generating proportional conversions. You’ll discover which demographics respond best to your advertising, which geographic markets offer expansion opportunities, and which devices drive the most cost-effective conversions.
This dashboard is particularly valuable for businesses managing multiple campaign types, agencies reporting to clients, or marketing teams that need to justify Google Ads spend with clear performance data. The template has a built-in connector by Coupler.io, so you can start using it in minutes by following the instructions in the Readme tab.
Dashboard metrics:
- Impressions
- Clicks
- CTR
- CPC
- Conversions
- Cost per conversion
- Campaign type breakdown
- Demographics (age & gender)
- Device performance
- Geographic conversions
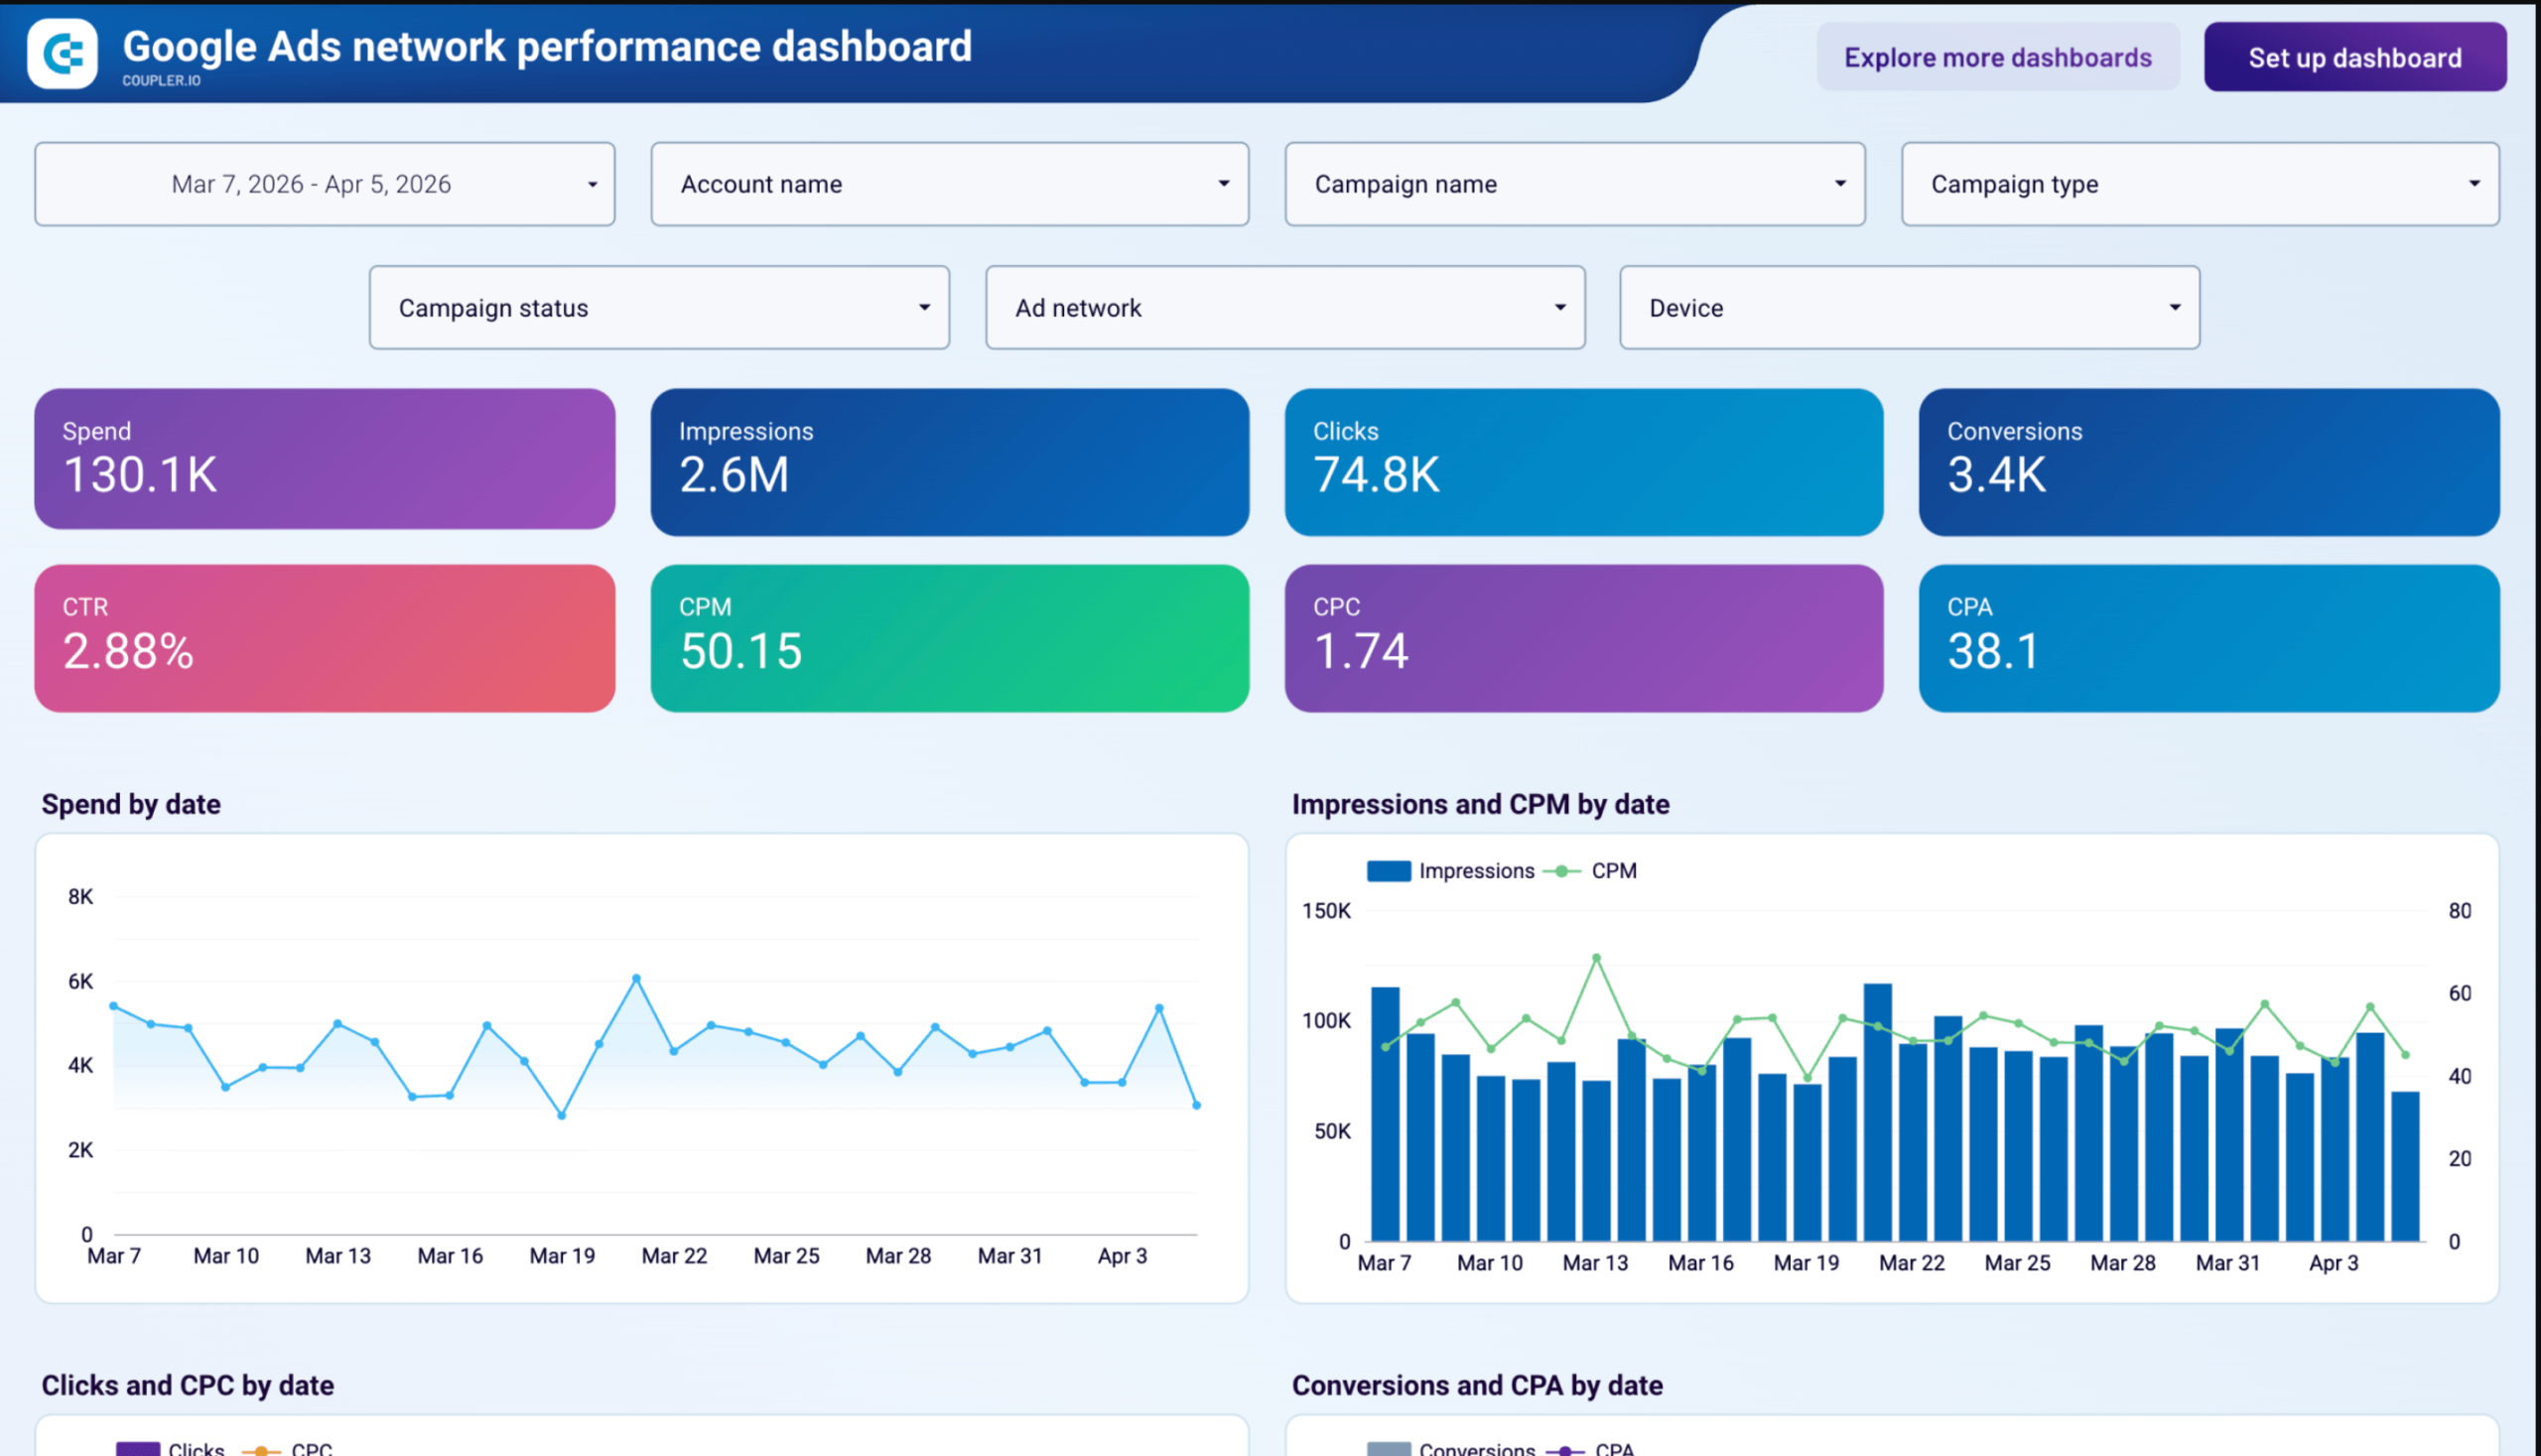
8. Google Ads network performance dashboard by Coupler.io
Most Google Ads dashboards report campaign totals. This one goes deeper by splitting spend, clicks, and conversions across ad networks, devices, and geographies, so you can see where your budget actually converts, not just how much you spent.
Google Ads network performance dashboard
 Preview dashboard
Google Ads network performance dashboard
Preview dashboardThis dashboard is particularly useful for performance marketing teams managing accounts across multiple campaign types, PPC managers who want to identify which ad networks drain budget without proportional conversions, and creative teams who need video retention data to decide which assets to retire. Connect your Google Ads account through the built-in Coupler.io connector and follow the instructions in the Setup guide to get started.
Dashboard metrics:
- Spend
- Impressions
- Clicks
- Conversions
- CTR
- CPM
- CPC
- CPA
- Impression share
- Search top impression share
- Search lost IS (budget)
- Search lost IS (rank)
- Video view completion rates (25%, 50%, 75%, 100%)
9. LinkedIn Ads dashboard by Coupler.io
This LinkedIn Ads dashboard template is a decent analytics tool to monitor the performance of your advertising campaigns on LinkedIn. The set of key metrics is similar to what the dashboards above have: amount spent, clicks, CPC, and others. However, you will also get information about leads and lead form opens.
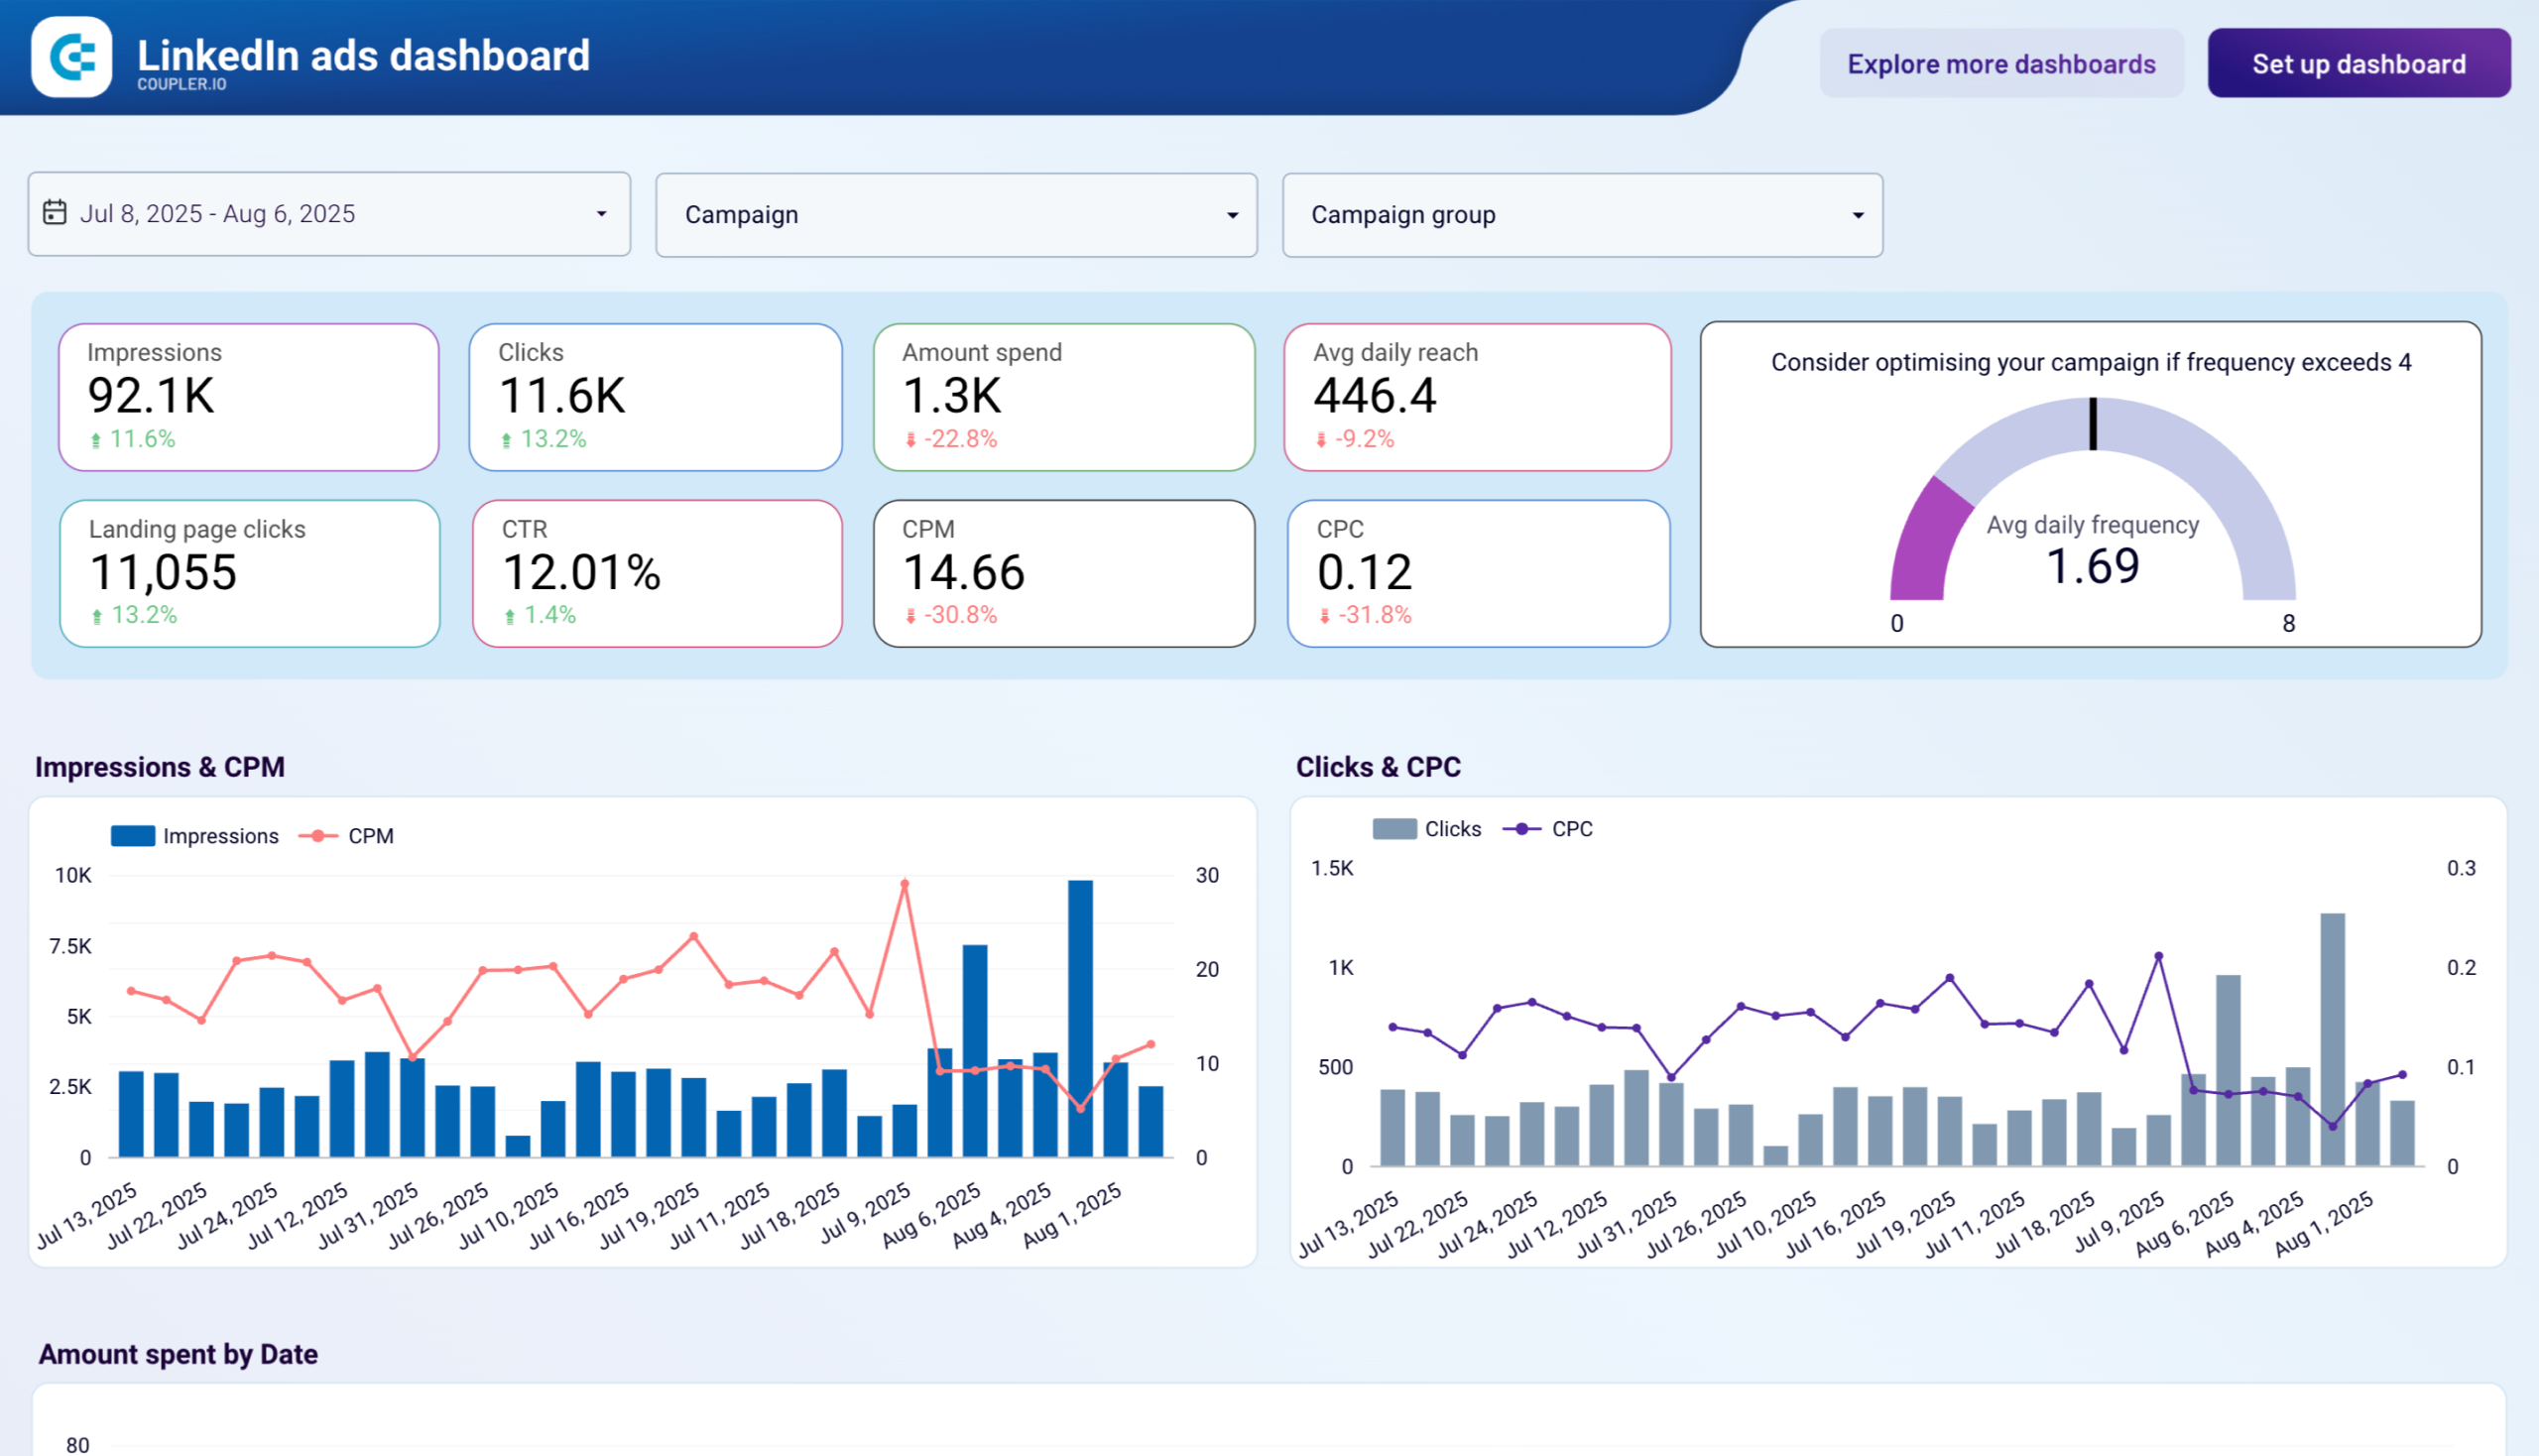
Any dashboard designed by Coupler.io has a built-in Looker Studio connector. So, you’ll only need to connect your LinkedIn account, and Coupler.io will create a data source in Looker Studio. Set a desired schedule and enjoy the up-to-date information on your marketing dashboard.
Dashboard metrics:
- Impressions
- CPM
- Amount spend
- Clicks
- CPC
- CTR
- Conversions
- Conversion rate
- Lead form opens
- Leads
- And others
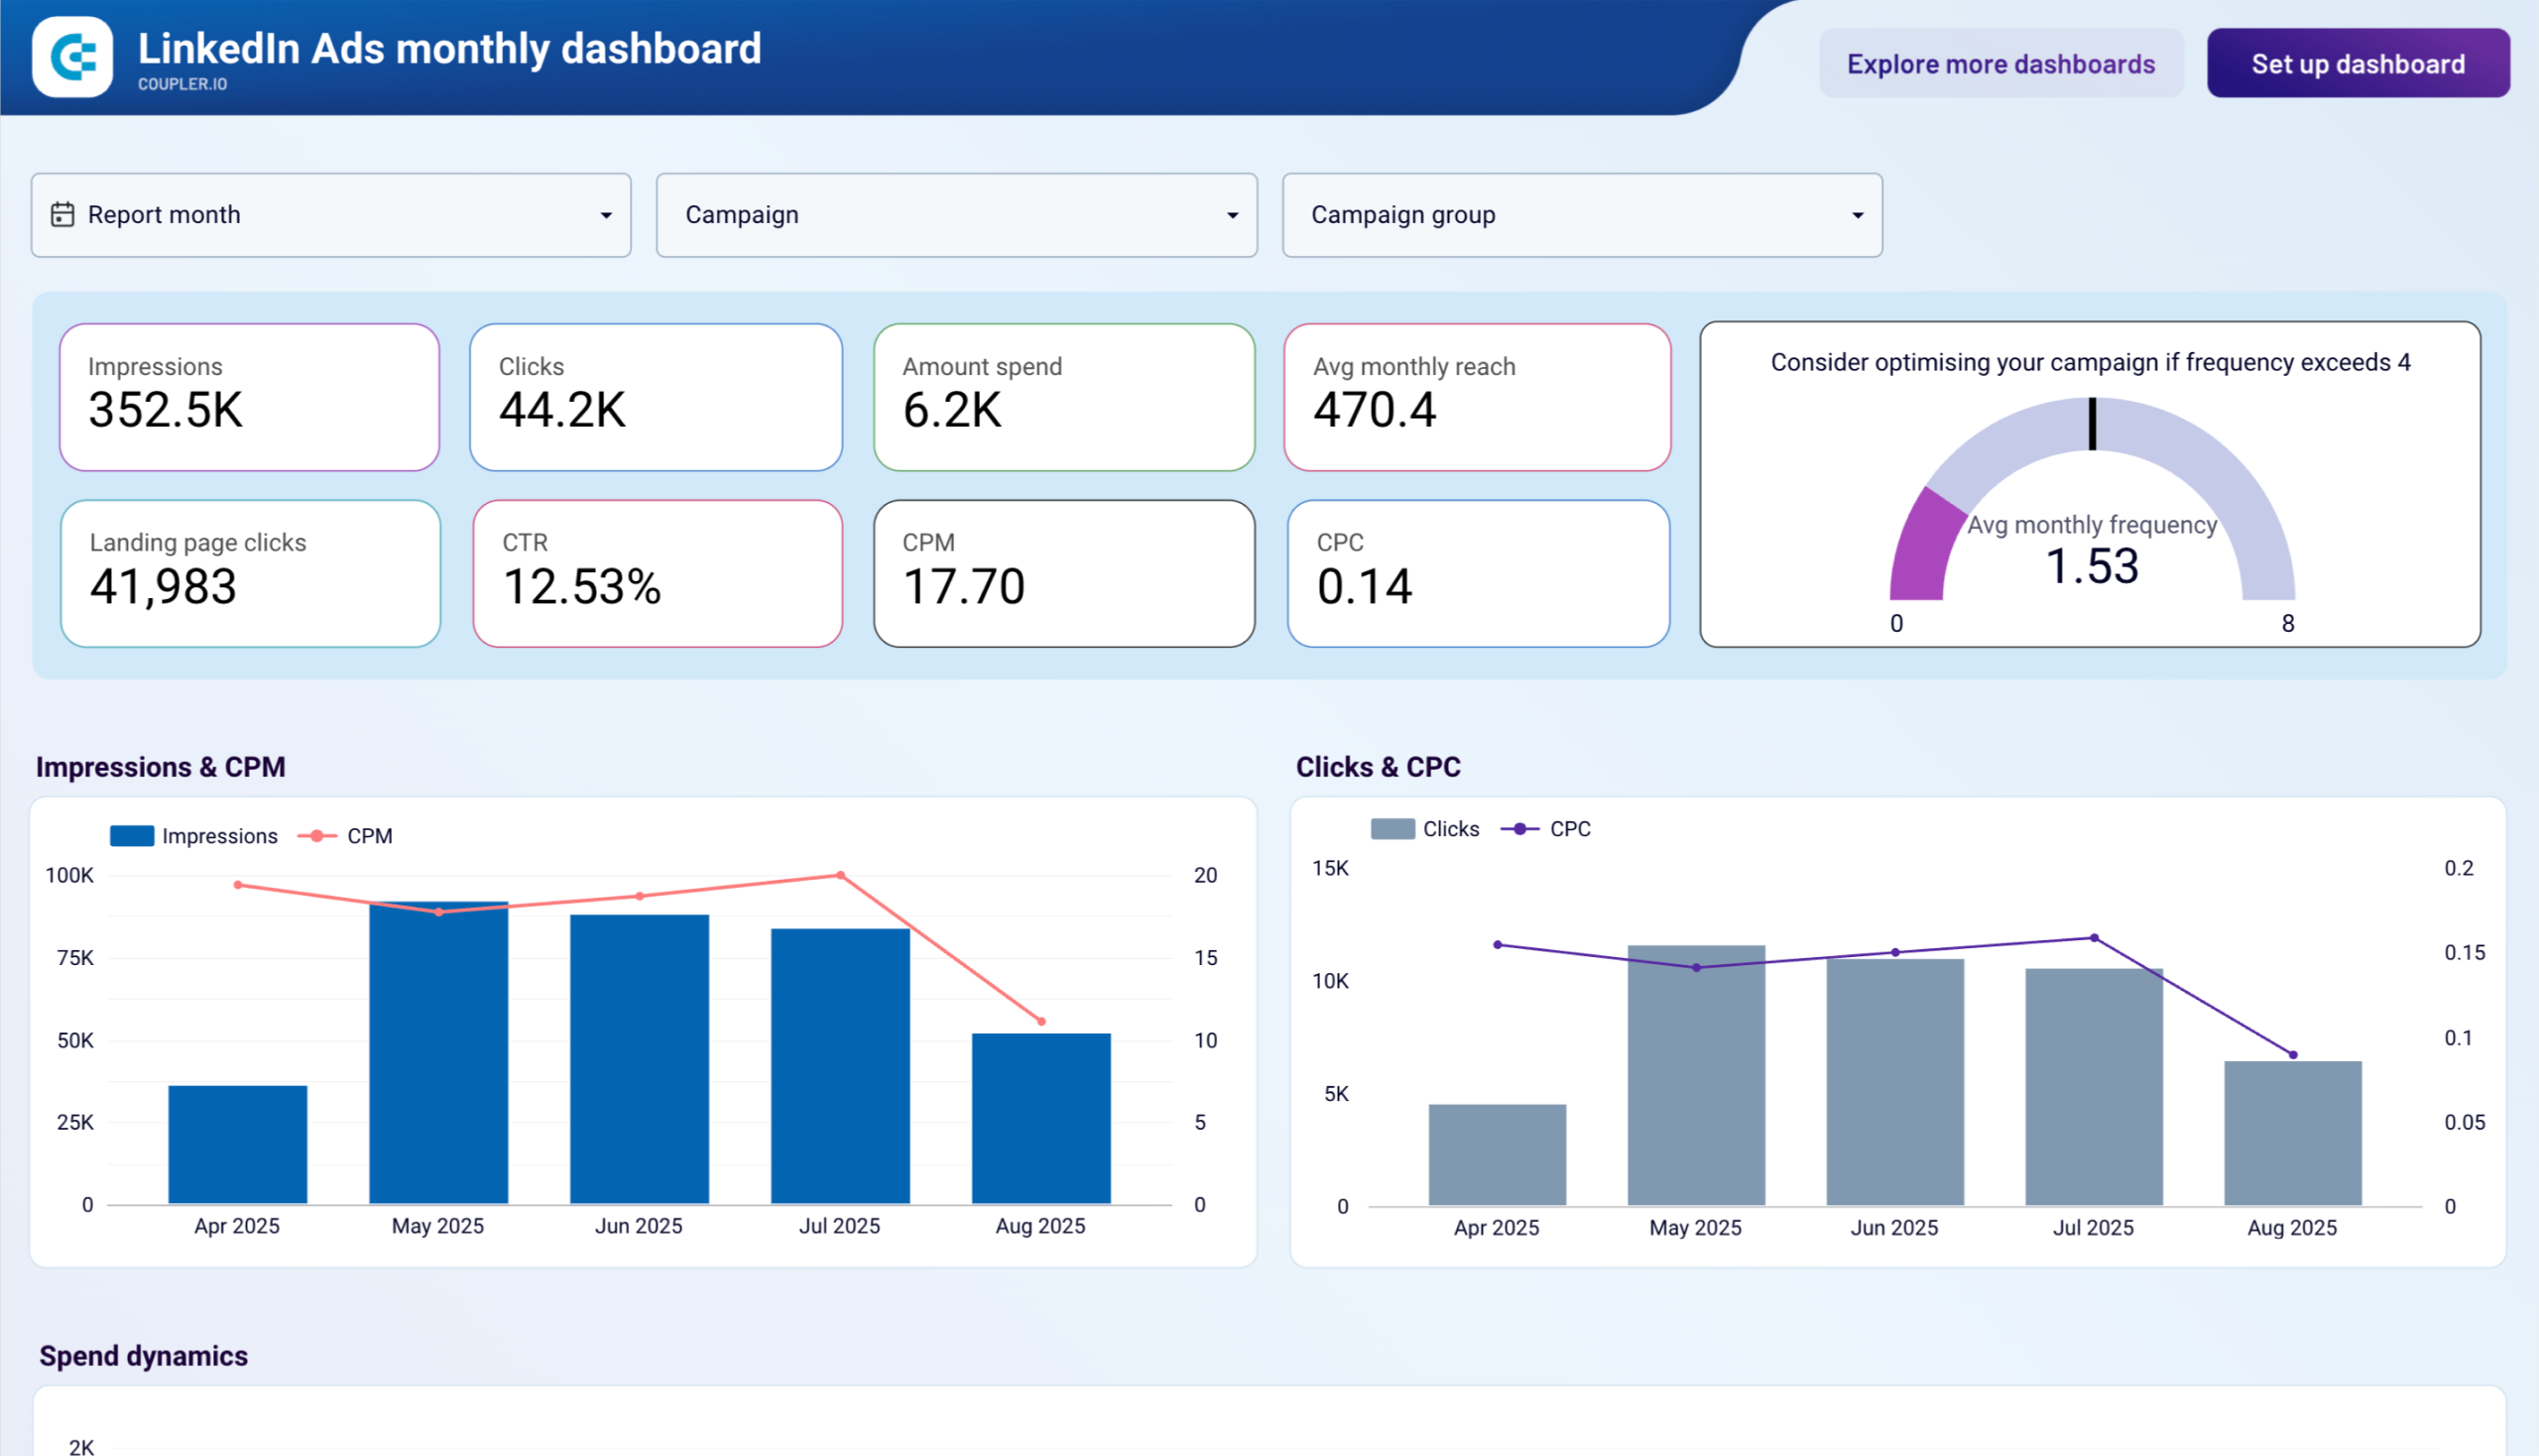
10. LinkedIn Ads monthly performance dashboard by Coupler.io
The LinkedIn Ads monthly performance dashboard tracks the complete B2B lead generation journey from ad impression to lead form completion. This Looker Studio template helps marketing teams understand which campaigns generate qualified leads at acceptable costs and where potential customers drop off in the conversion process.
LinkedIn Ads monthly performance dashboard
 Preview dashboard
LinkedIn Ads monthly performance dashboard
Preview dashboardFor B2B marketers, the critical insight isn’t just traffic volume but whether campaigns generate actual business opportunities. You can identify campaigns that generate clicks without producing leads, optimize lead forms that people open but don’t complete, and track how cost per lead trends over time to spot budget inefficiencies before they become expensive problems.
This dashboard is essential for B2B companies where lead quality matters more than quantity, marketing teams managing LinkedIn advertising budgets, or agencies that need to prove LinkedIn’s value in multi-channel B2B campaigns. To use this template, follow the instructions in the Setup guide tab to connect your LinkedIn Ads account and populate the dashboard with your data.
Dashboard metrics:
- Impressions
- Clicks
- Spend
- Monthly reach
- Landing page clicks
- CTR
- CPM
- CPC
- Conversions
- Cost per conversion
- Leads
- Lead form opens
- Form completion rate
- Cost per lead
11. LinkedIn Ads leads dashboard by Coupler.io
This dashboard tracks the effectiveness of LinkedIn Ads campaigns in generating B2B leads for your business. You can analyze the complete conversion path from impressions to leads and compare campaign performance across key metrics like clicks, cost per lead, CPC, etc. These insights enable you to optimize budget allocation by investing in campaigns that consistently deliver high-value prospects.
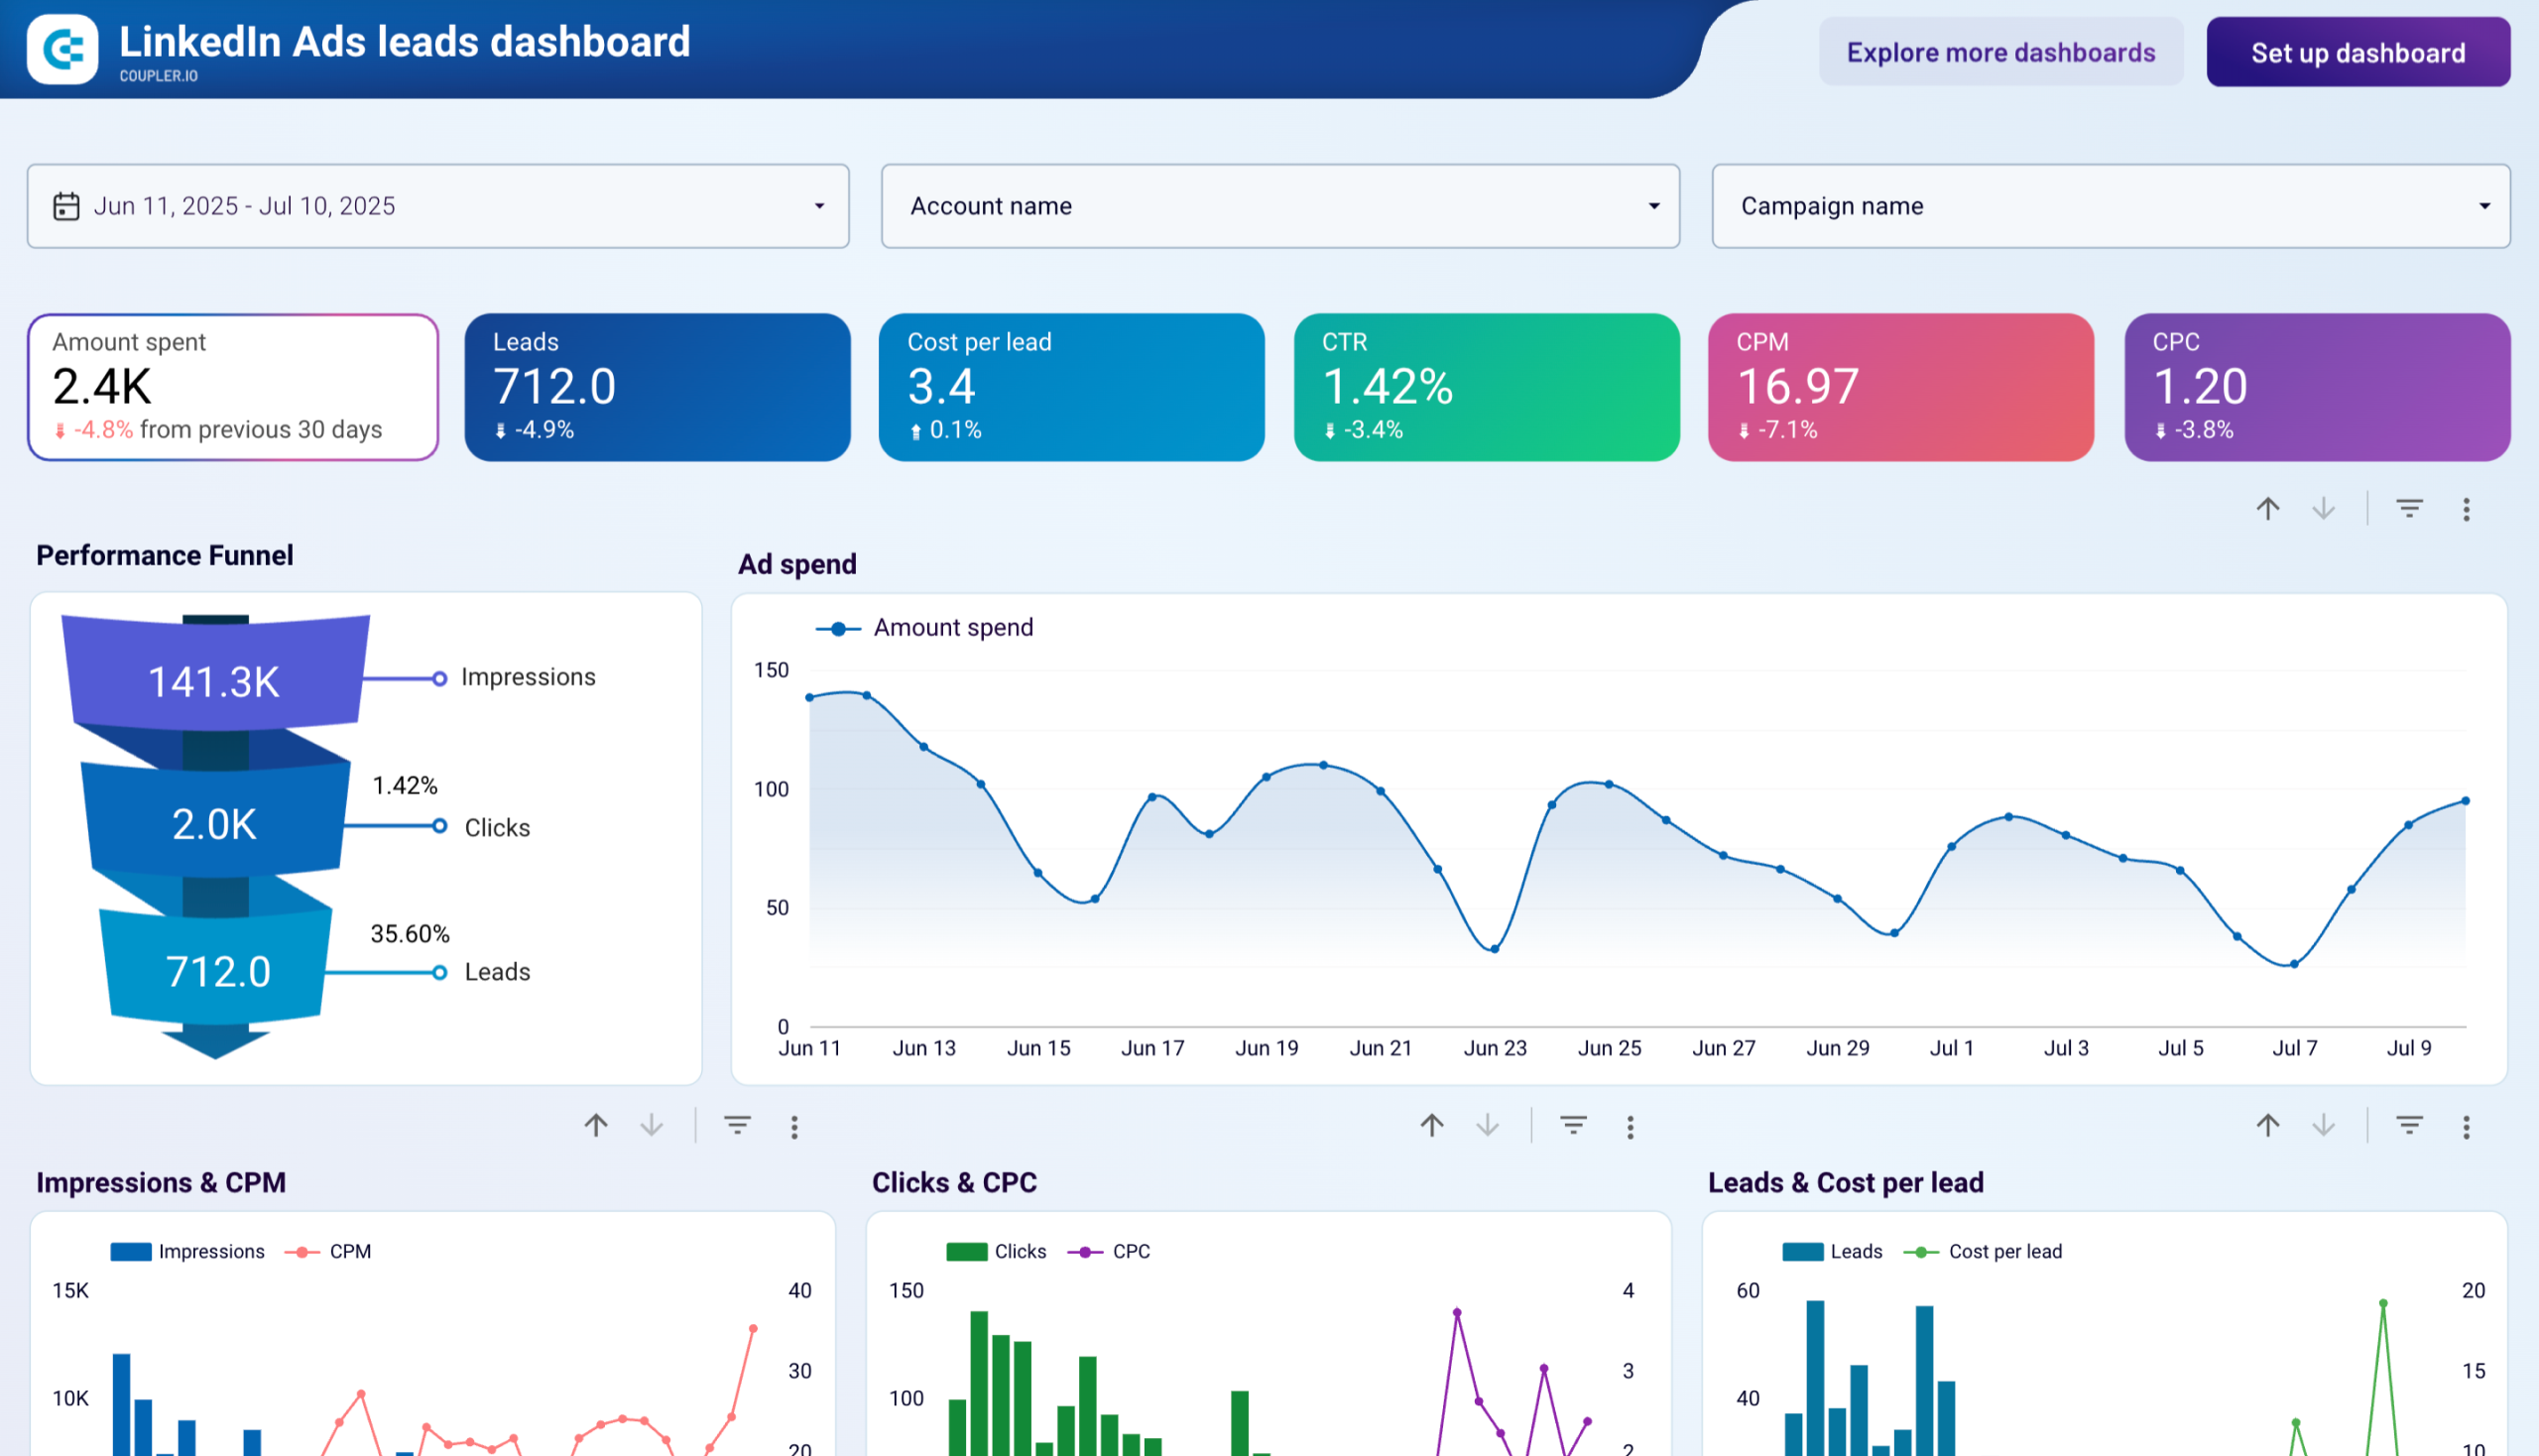
A free dashboard template is available with a Coupler.io account. It takes less than 5 minutes to make a copy, sync your LinkedIn Ads data, set up scheduled data refreshes, and start using the white-label dashboard for PPC and sales decision-making.
Dashboard metrics:
- Amount spent
- Impressions
- Clicks
- CTR
- Leads
- Cost per lead
- CPM
- Clicks to leads
12. Pinterest Ads dashboard by Coupler.io
If you’re running Pinterest advertising campaigns, this dashboard provides the analytics you need to understand how your pins perform. It brings together engagement metrics, video data, and cost analysis to reveal which visual strategies generate the best results for your investment. Budget tracking charts help you understand spending patterns, while campaign rankings identify your top performers. Additionally, a comprehensive data table breaks down each campaign’s results, including outbound click costs and video metrics.
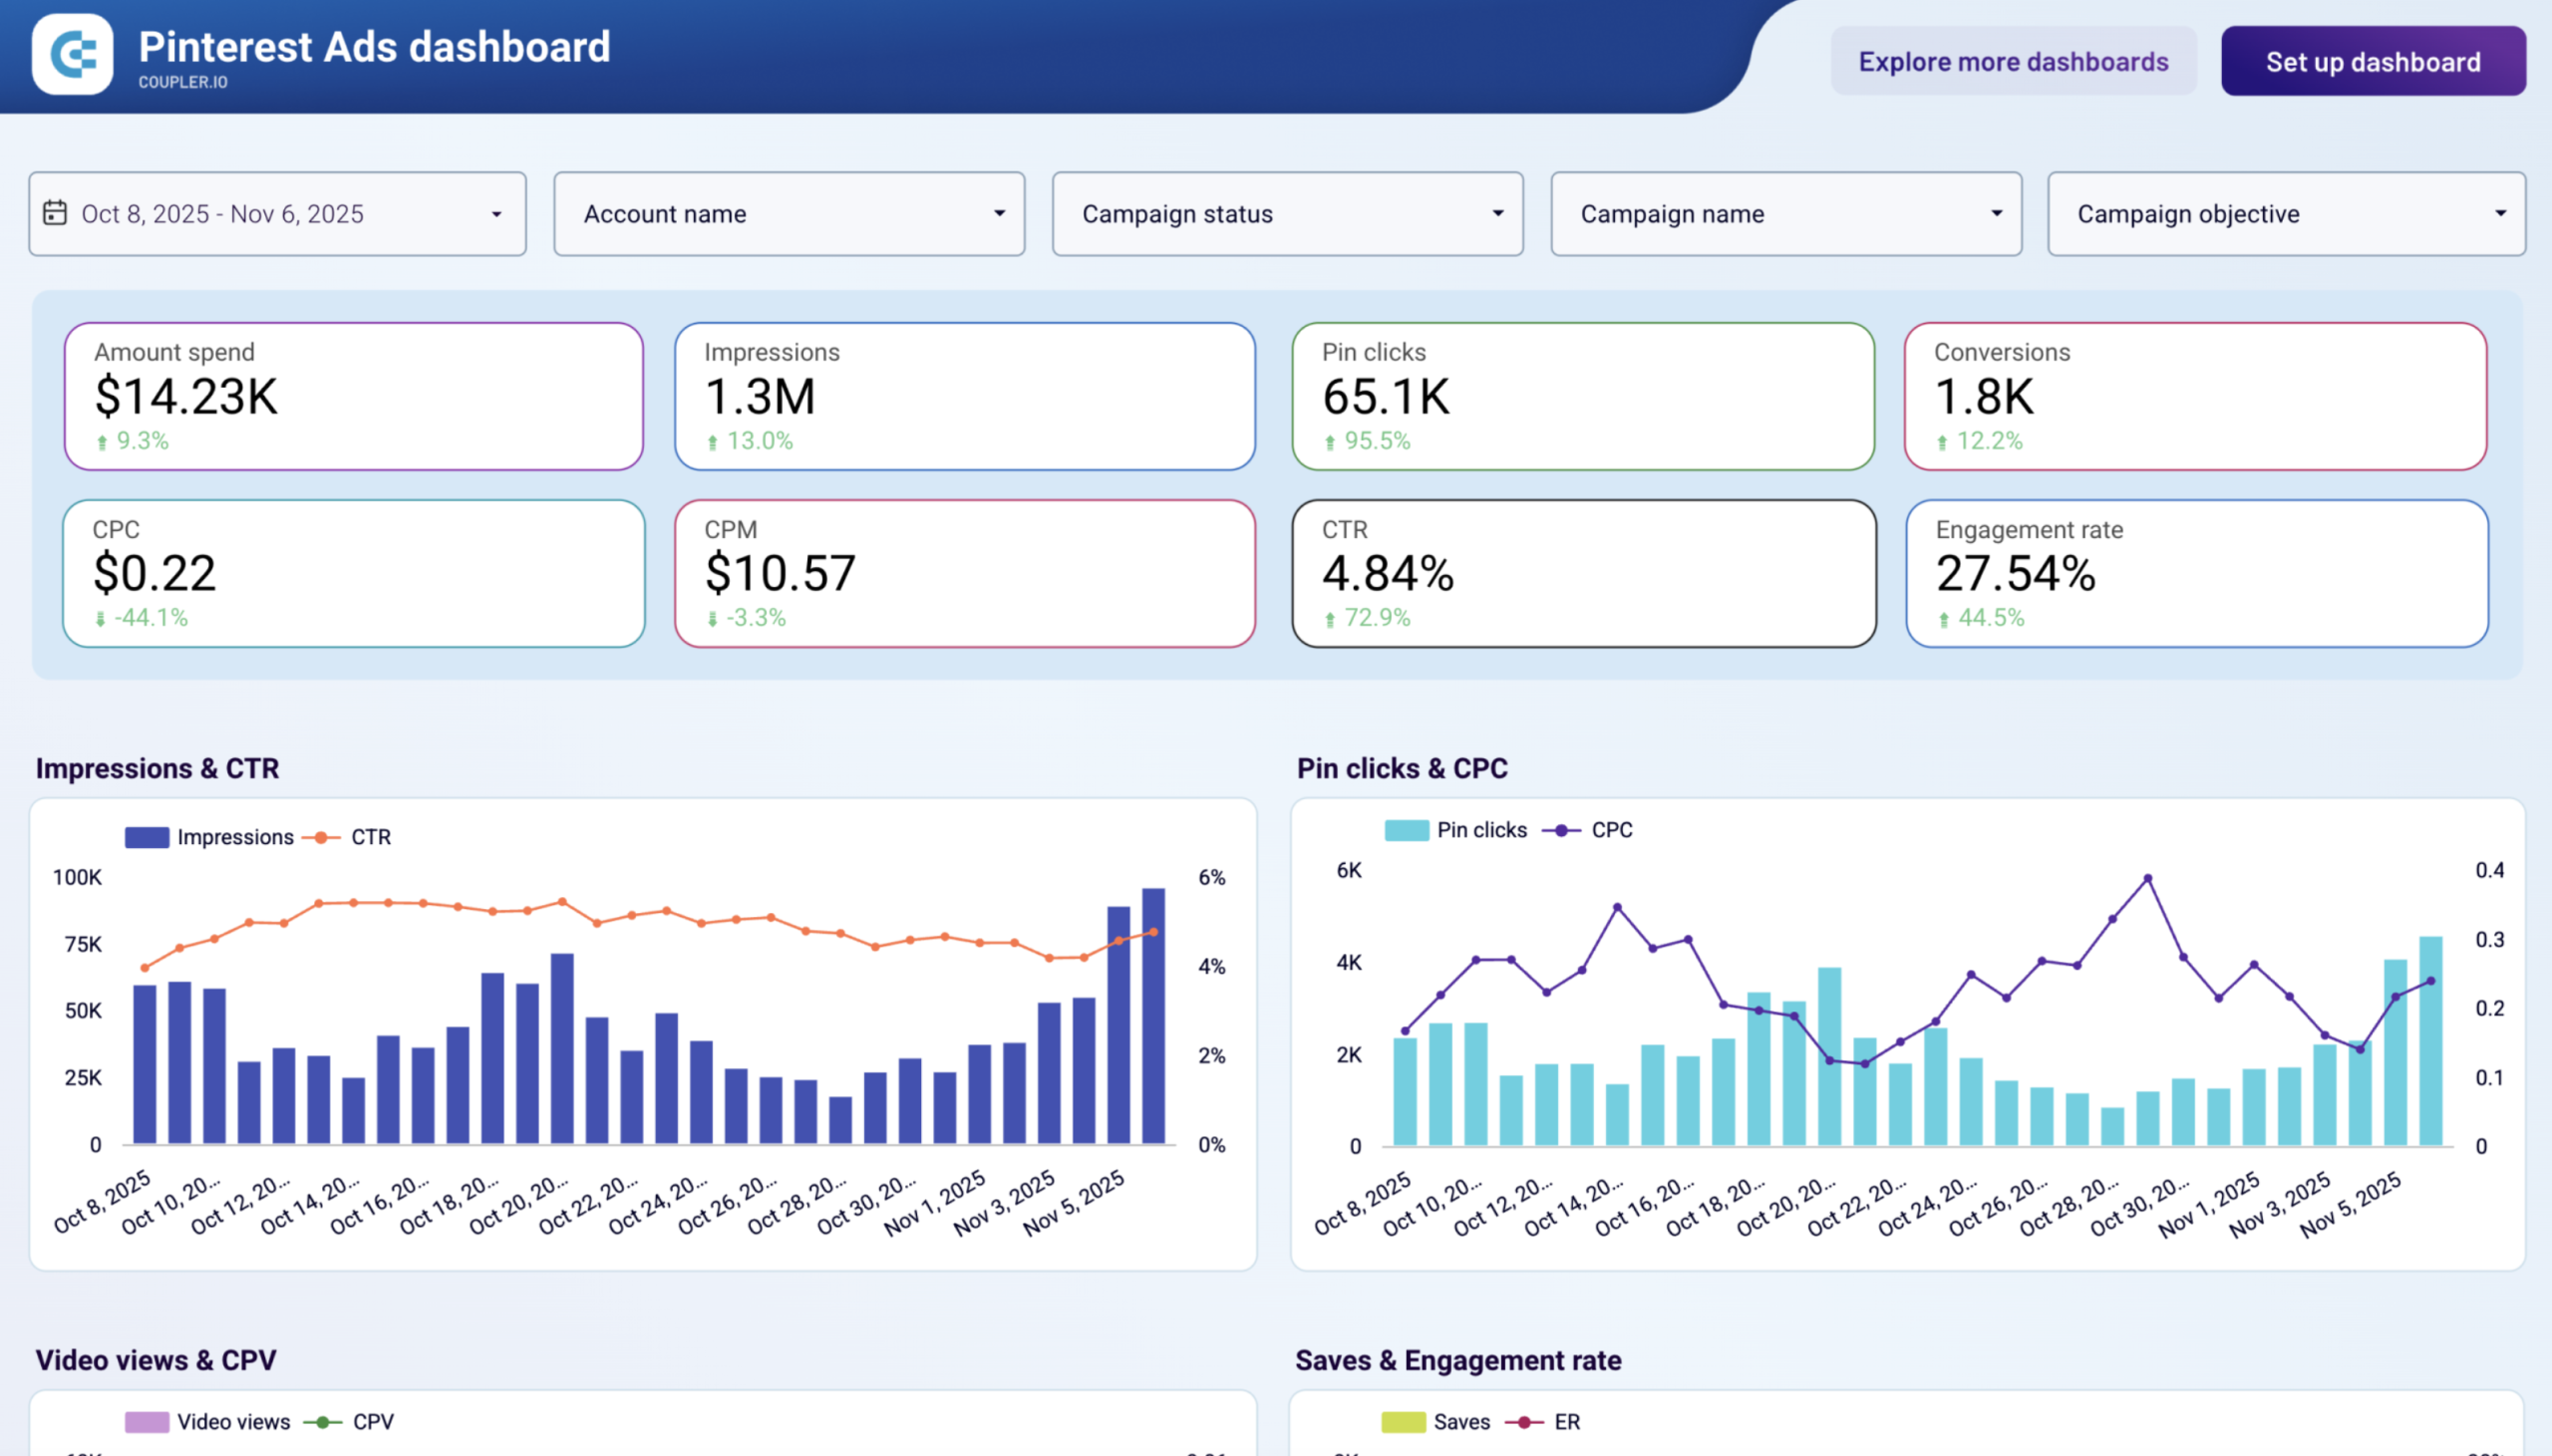
This Looker Studio template features a built-in Coupler.io connector that simplifies data loading. Check the Setup guide tab for connection instructions and get your Pinterest analytics running in minutes.
Dashboard metrics:
- Amount spent
- Impressions
- Pin clicks
- Conversions
- CPC
- CPM
- CTR
- Engagement rate
- And others
13. Pinterest Ads monthly performance dashboard by Coupler.io
This monthly performance dashboard aggregates data by month to reveal seasonal patterns, cost efficiency cycles, and long-term campaign trends for annual budget planning. Monthly scorecards display key metrics, including amount spent, impressions, pin clicks, etc., with period-over-period comparisons. Besides, the spend dynamics chart shows monthly investment patterns, while campaign rankings reveal which campaigns maintain strong performance over extended periods.
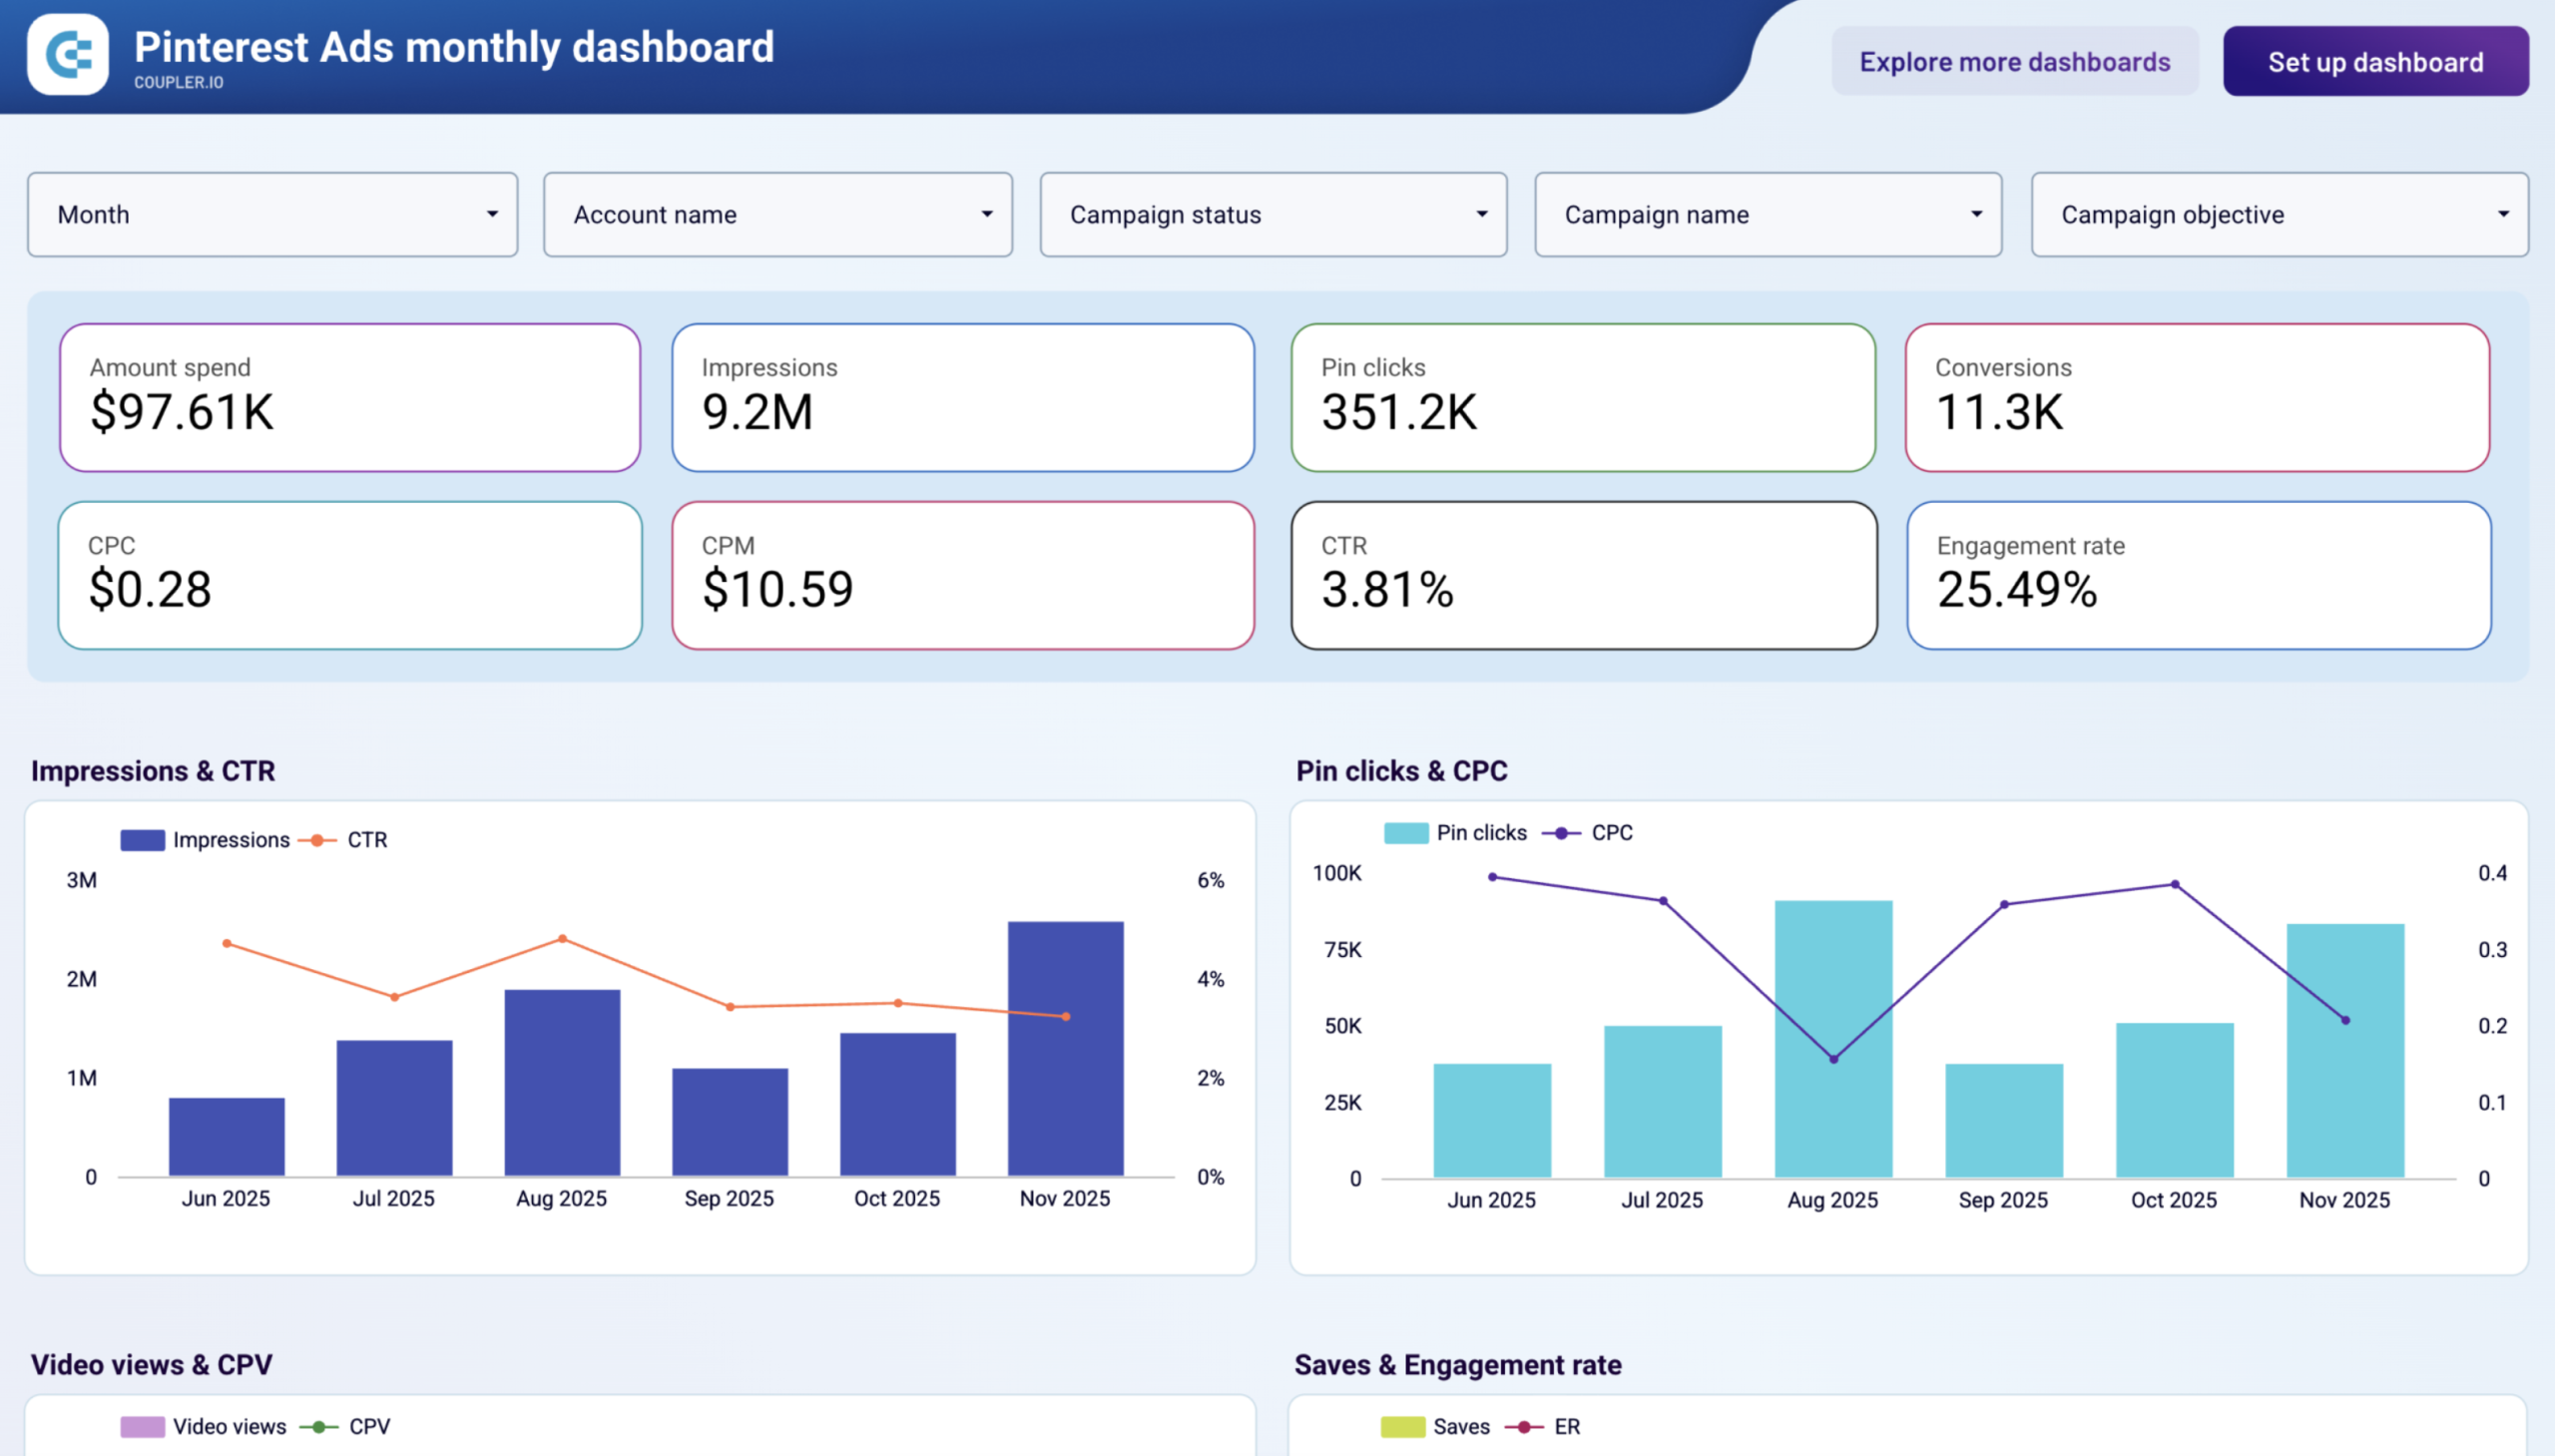
This Looker Studio template is designed by Coupler.io with a built-in connector for automatic monthly data aggregation. Follow the instructions in the Setup guide tab to connect your Pinterest Ads account and start tracking monthly advertising performance.
Dashboard metrics:
- Amount spent
- Impressions
- Pin clicks
- Conversions
- Engagement rate
- Outbound clicks
- Video views
- Monthly trends
- And others
14. Bing Ads conversion tracking dashboard by Coupler.io
Microsoft Advertising rarely gets its own reporting layer since most paid search teams fold it into a multi-channel view and move on. This dashboard gives Bing a dedicated Looker Studio report, focused on what actually matters: which campaigns produce conversions at an acceptable cost and which are spending without results.
Bing Ads conversion tracking dashboard
Bing Ads conversion tracking dashboard
Preview dashboardYou can track spend efficiency and conversion performance at both the campaign and goal level. If you’re tracking multiple conversion types, filtering by goal separates high-value outcomes like purchases from softer signals like video views. It’s useful when you need to present a clear picture before a budget review.
This is built for PPC managers running Microsoft Advertising as a secondary search channel who need conversion-level visibility without building reports from scratch. Follow the setup instructions to connect your account via the Coupler.io connector.
15. Reddit Ads dashboard by Coupler.io
Reddit advertisers tend to face the same question early: is this channel working, or are we burning budget on a platform that doesn’t convert? This dashboard consolidates spend, reach, engagement, and conversion data from your Reddit Ads account into one place so you can actually answer it.
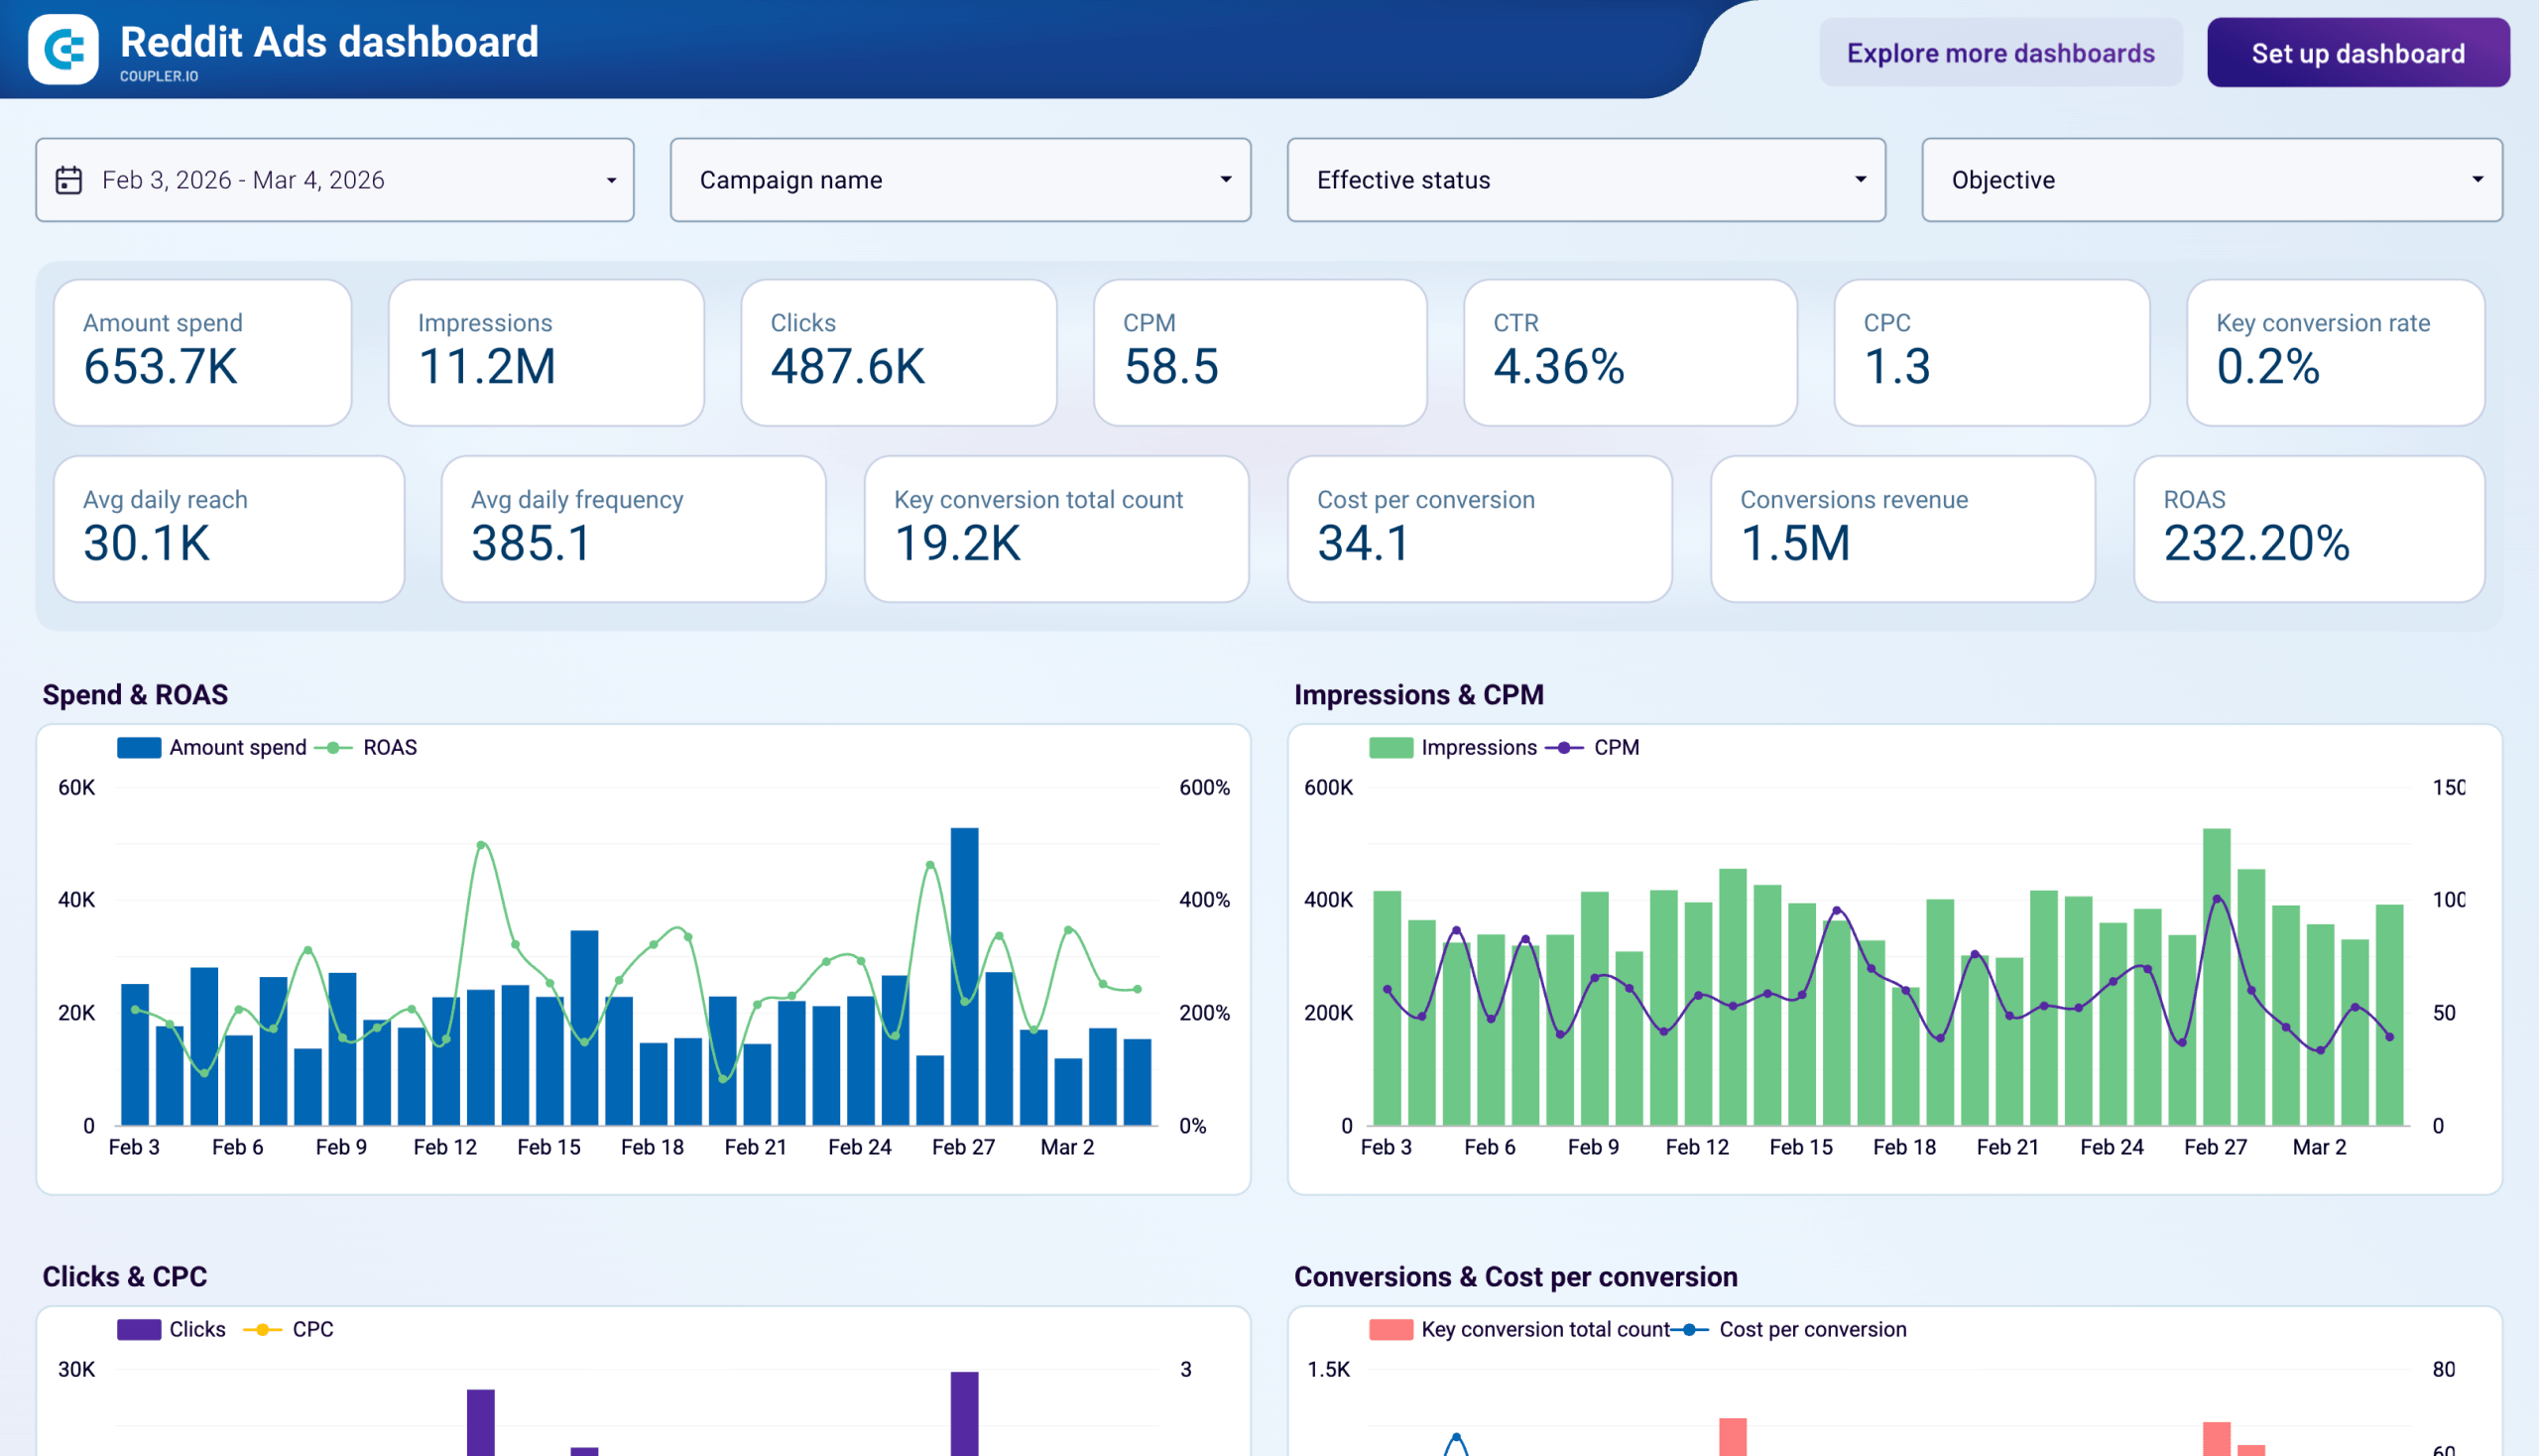
ROAS is broken down by campaign objective — Traffic, Conversions, Awareness, Video Views. You can see which types of campaigns deserve more budget rather than optimizing by gut feel. Reach and frequency tracking helps you catch audience saturation before performance drops. When you need to justify Reddit as a channel to stakeholders, the cost-per-conversion and ROAS data is already here.
Performance marketers testing Reddit as a paid social channel and teams already running campaigns who need structured reporting will find this most useful. Connect your Reddit Ads account via the built-in Coupler.io connector to get started.
Brand awareness and cross-channel marketing dashboards in Looker Studio
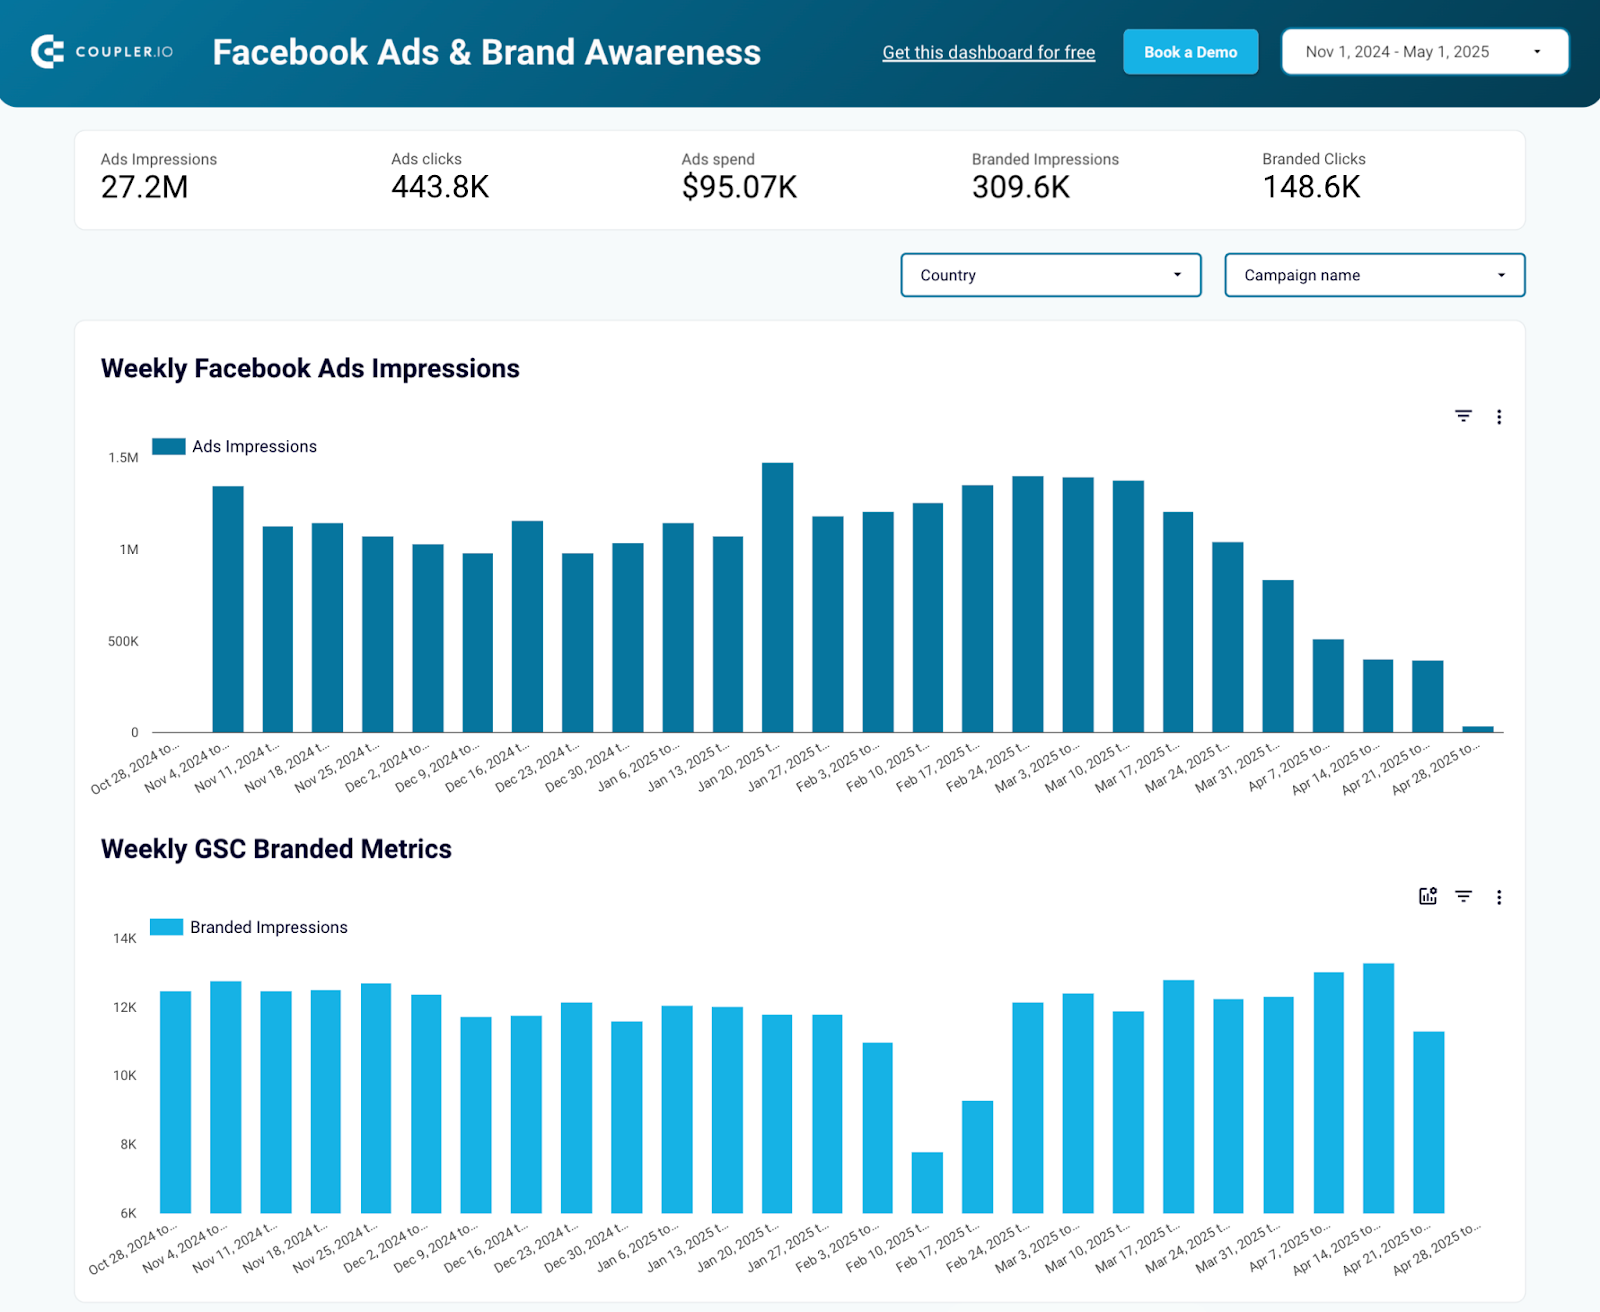
16. Facebook Ads and brand awareness dashboard by Coupler.io
Individual or multi-channel PPC dashboards are only limited to analyzing PPC campaign performance. The Facebook Ads and brand awareness dashboard is perfect for comparing PPC and brand awareness campaigns. It’s especially useful if you run awareness Facebook Ad campaigns and want to see their effect on Google SERPs.
Facebook Ads & brand awareness dashboard
 Preview dashboard
Facebook Ads & brand awareness dashboard
Preview dashboardThis dashboard collects data from Facebook Ads and Google Search Console and compares results in the form of interactive bar charts. You can select specific Facebook ad campaigns to check how the overall branded impressions and clicks correlate with branded search results. It is useful for optimizing ad spend, refining strategies, and boosting brand visibility.
To use this dashboard by Coupler.io, follow the steps in the Readme tab.
Dashboard metrics:
- Ads impressions
- Ads spend
- Ads clicks
- Branded impressions
- Branded clicks
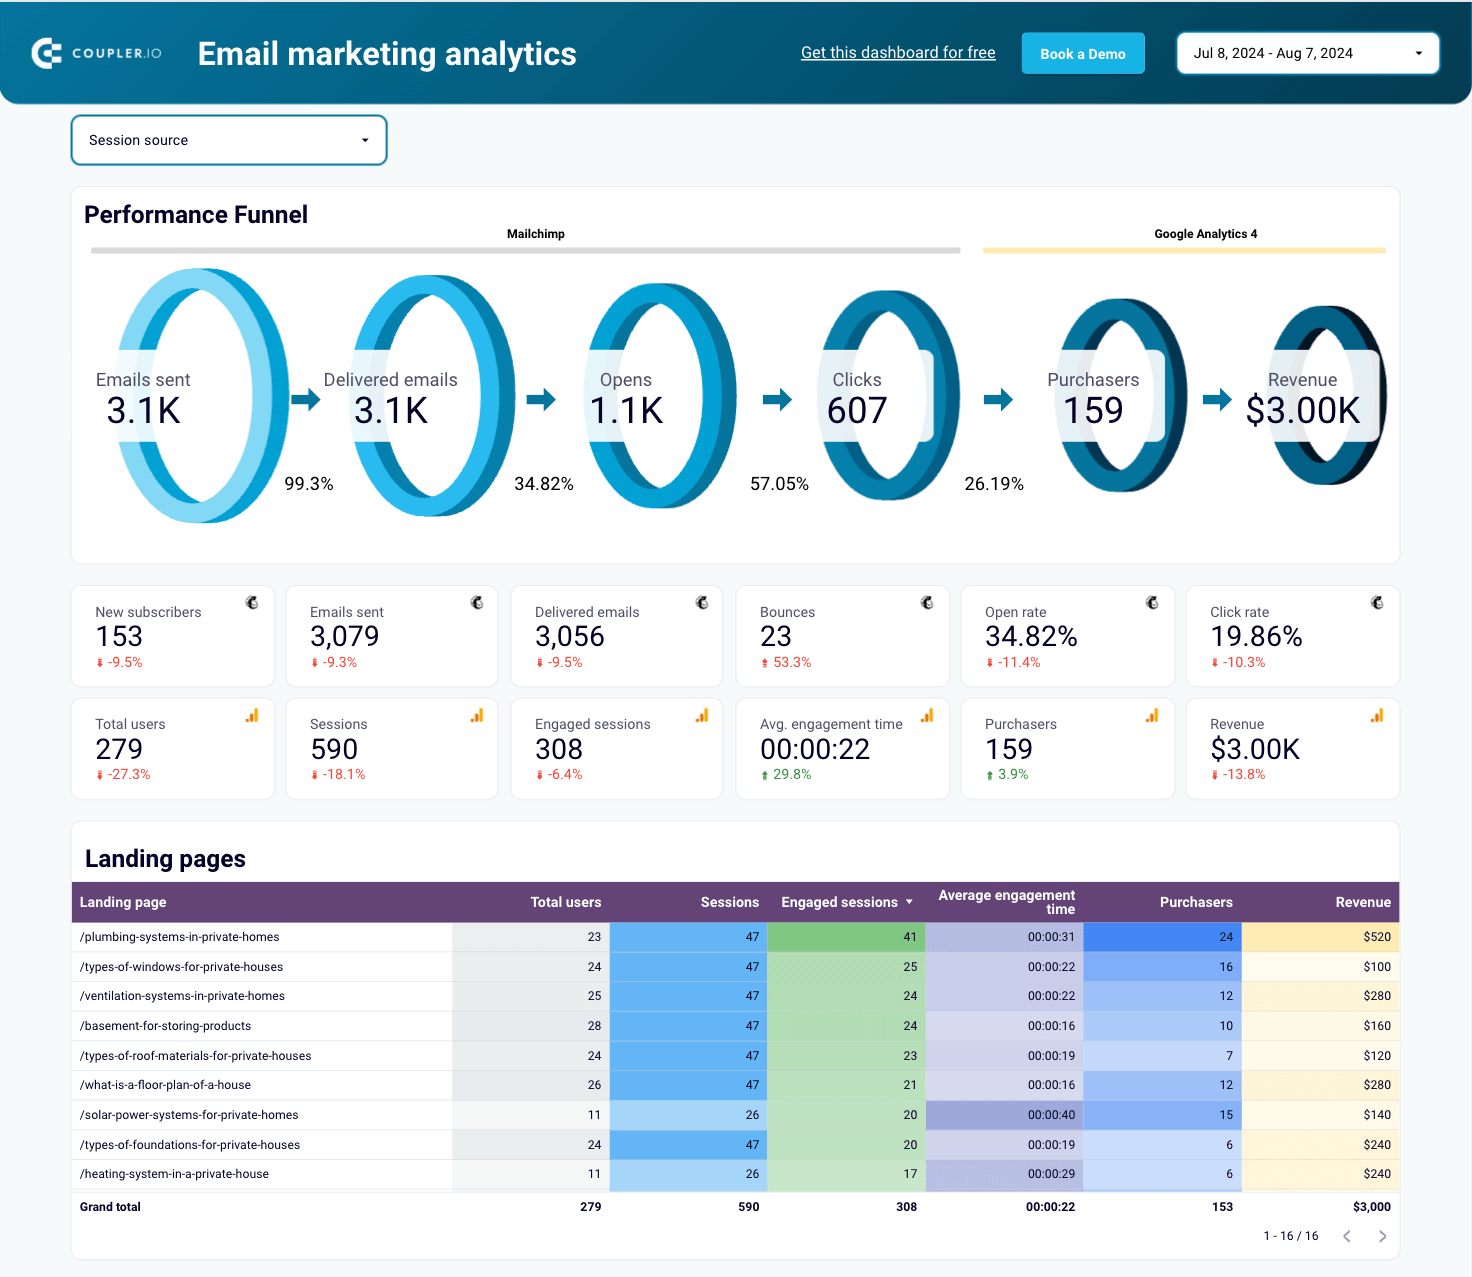
17. All-in-one marketing dashboard by Coupler.io
The all-in-one marketing dashboard provides a unified view of your marketing efforts across various channels. It integrates data from Google Analytics, Google Search Console, ad platforms, social media, email tools, and YouTube.
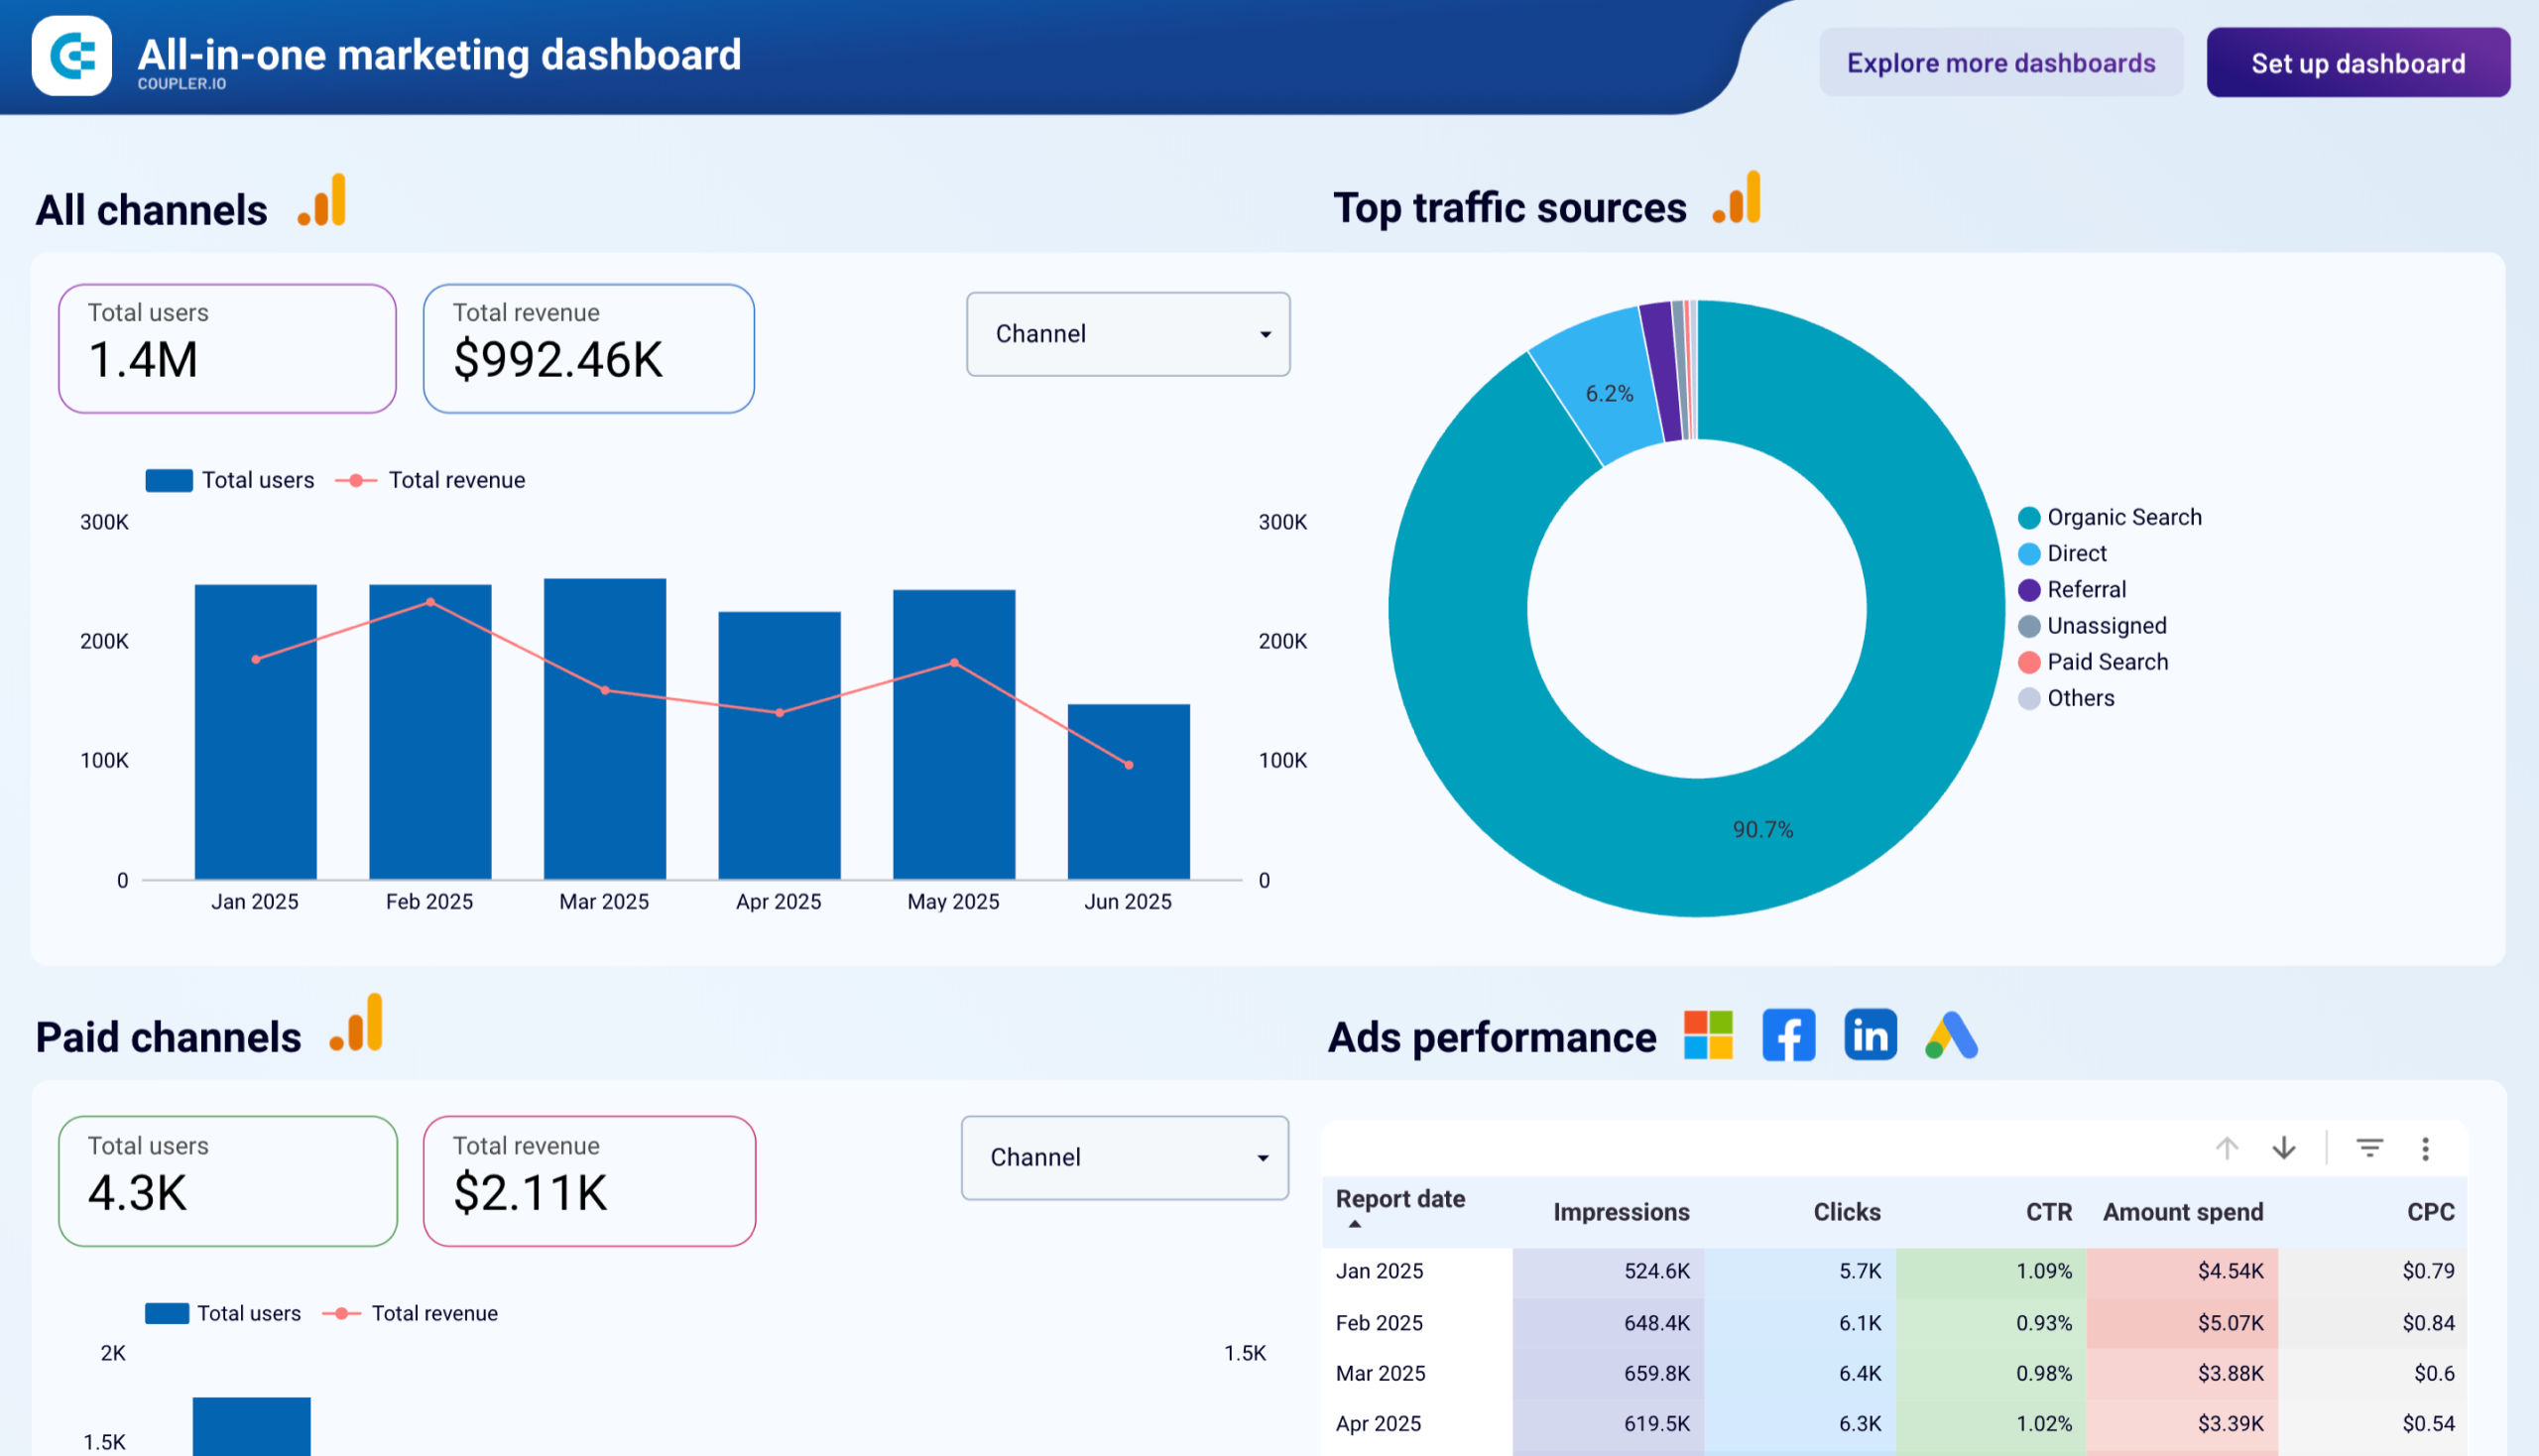
Using this dashboard, you can track the performance of paid ads, organic searches, social media interactions, and email campaigns in a single interface.
Follow the instructions inside the template to connect your accounts and proceed to actionable data insights.
Dashboard metrics:
- Ad performance: impressions, clicks, CTR, amount spent, CPC
- Google search performance: impressions, clicks, CTR, average position
- Social media performance: impressions, page views
- YouTube performance: views, minutes watched, engagements
- Email performance: emails delivered, open rate, bounces, unsubscribes, clicks
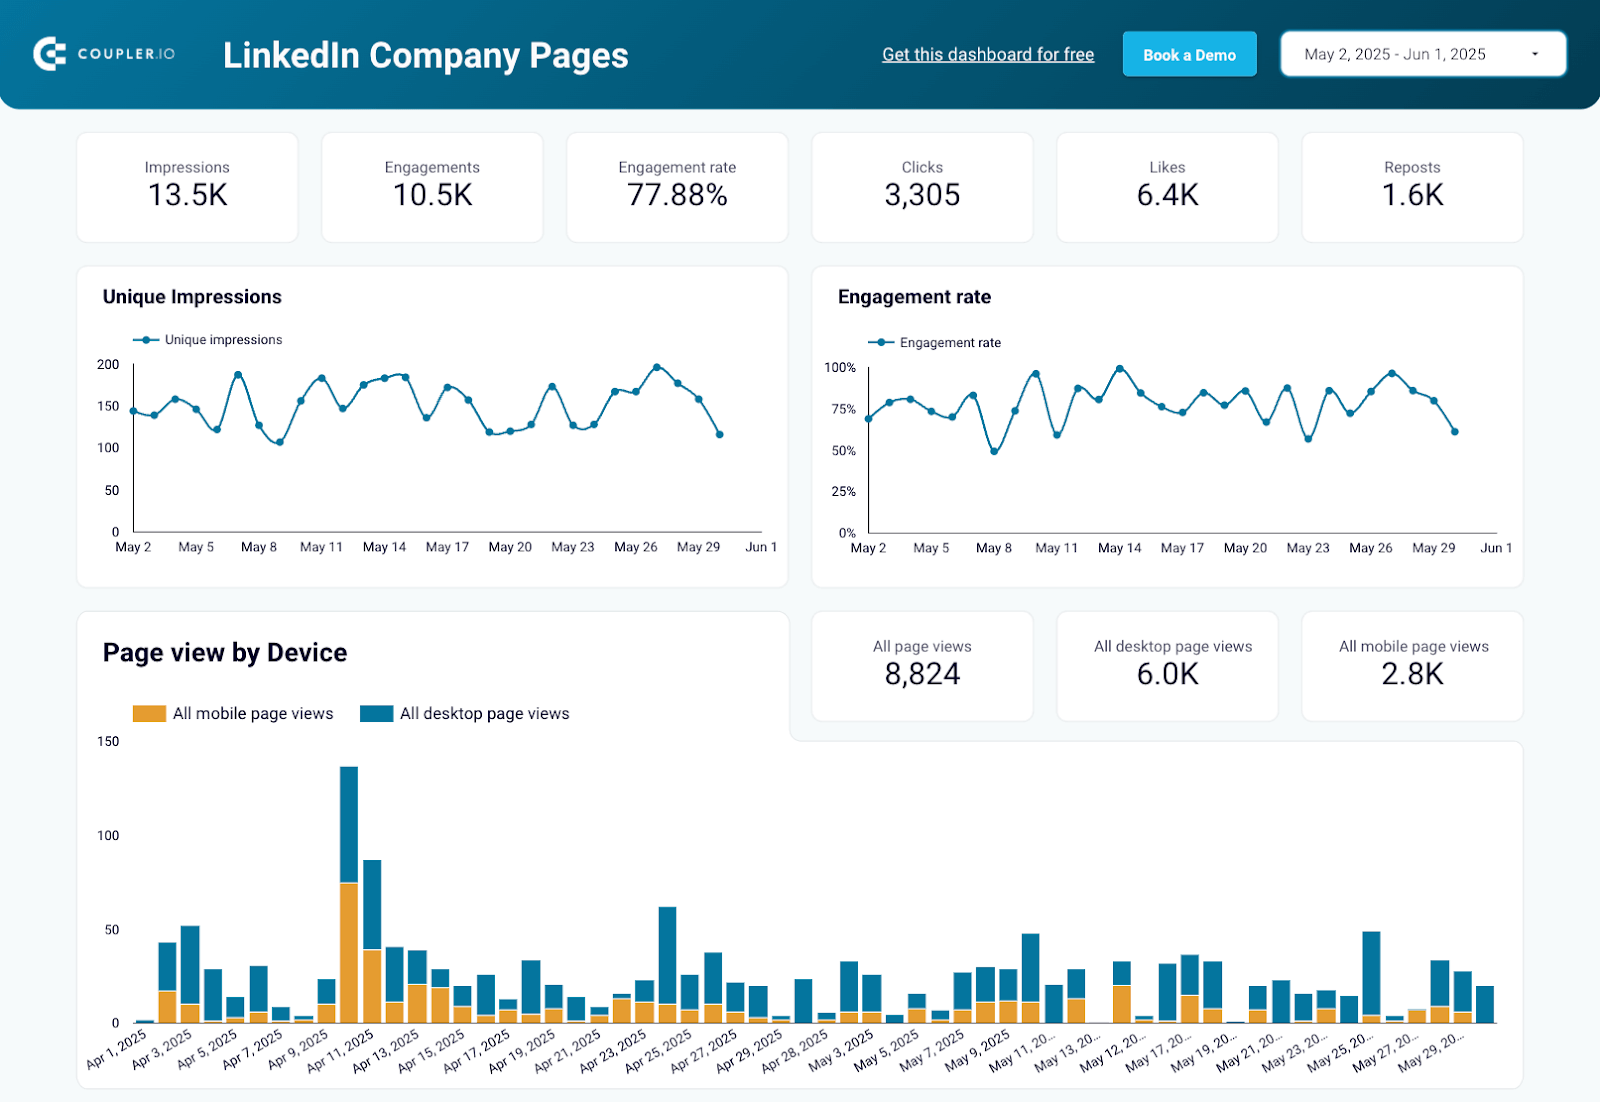
18. LinkedIn Company Page performance dashboard by Coupler.io
The LinkedIn Company Page performance dashboard lets you track your company’s performance and presence on LinkedIn. It provides insights into content engagement and follower growth, helping you optimize your LinkedIn strategy for lead generation and brand awareness.
LinkedIn Company Page performance dashboard
 Preview dashboard
LinkedIn Company Page performance dashboard
Preview dashboardThe dashboard helps you evaluate individual post performance and monitor organic versus paid follower growth over time. You can also analyze audience demographics by company size, seniority, industry, and location to better target your professional audience and refine your content approach for maximum business impact.
This dashboard is equipped with Coupler.io’s dedicated LinkedIn Company Pages connector. To use the template, simply sign up for a free Coupler.io account and sync your LinkedIn data. It takes no more than 3 minutes to get a ready-to-use report at your fingertips.
Dashboard metrics:
- Impressions
- Clicks
- Engagements
- Engagement rate
- Likes
- Reposts
- Page views
- Followers
19. YouTube dashboard by Coupler.io
In our selection of the best marketing dashboards in Looker Studio, we included this YouTube dashboard template. It provides a complete overview of your YouTube channel performance and three reports for subscribers, reach, and traffic sources.
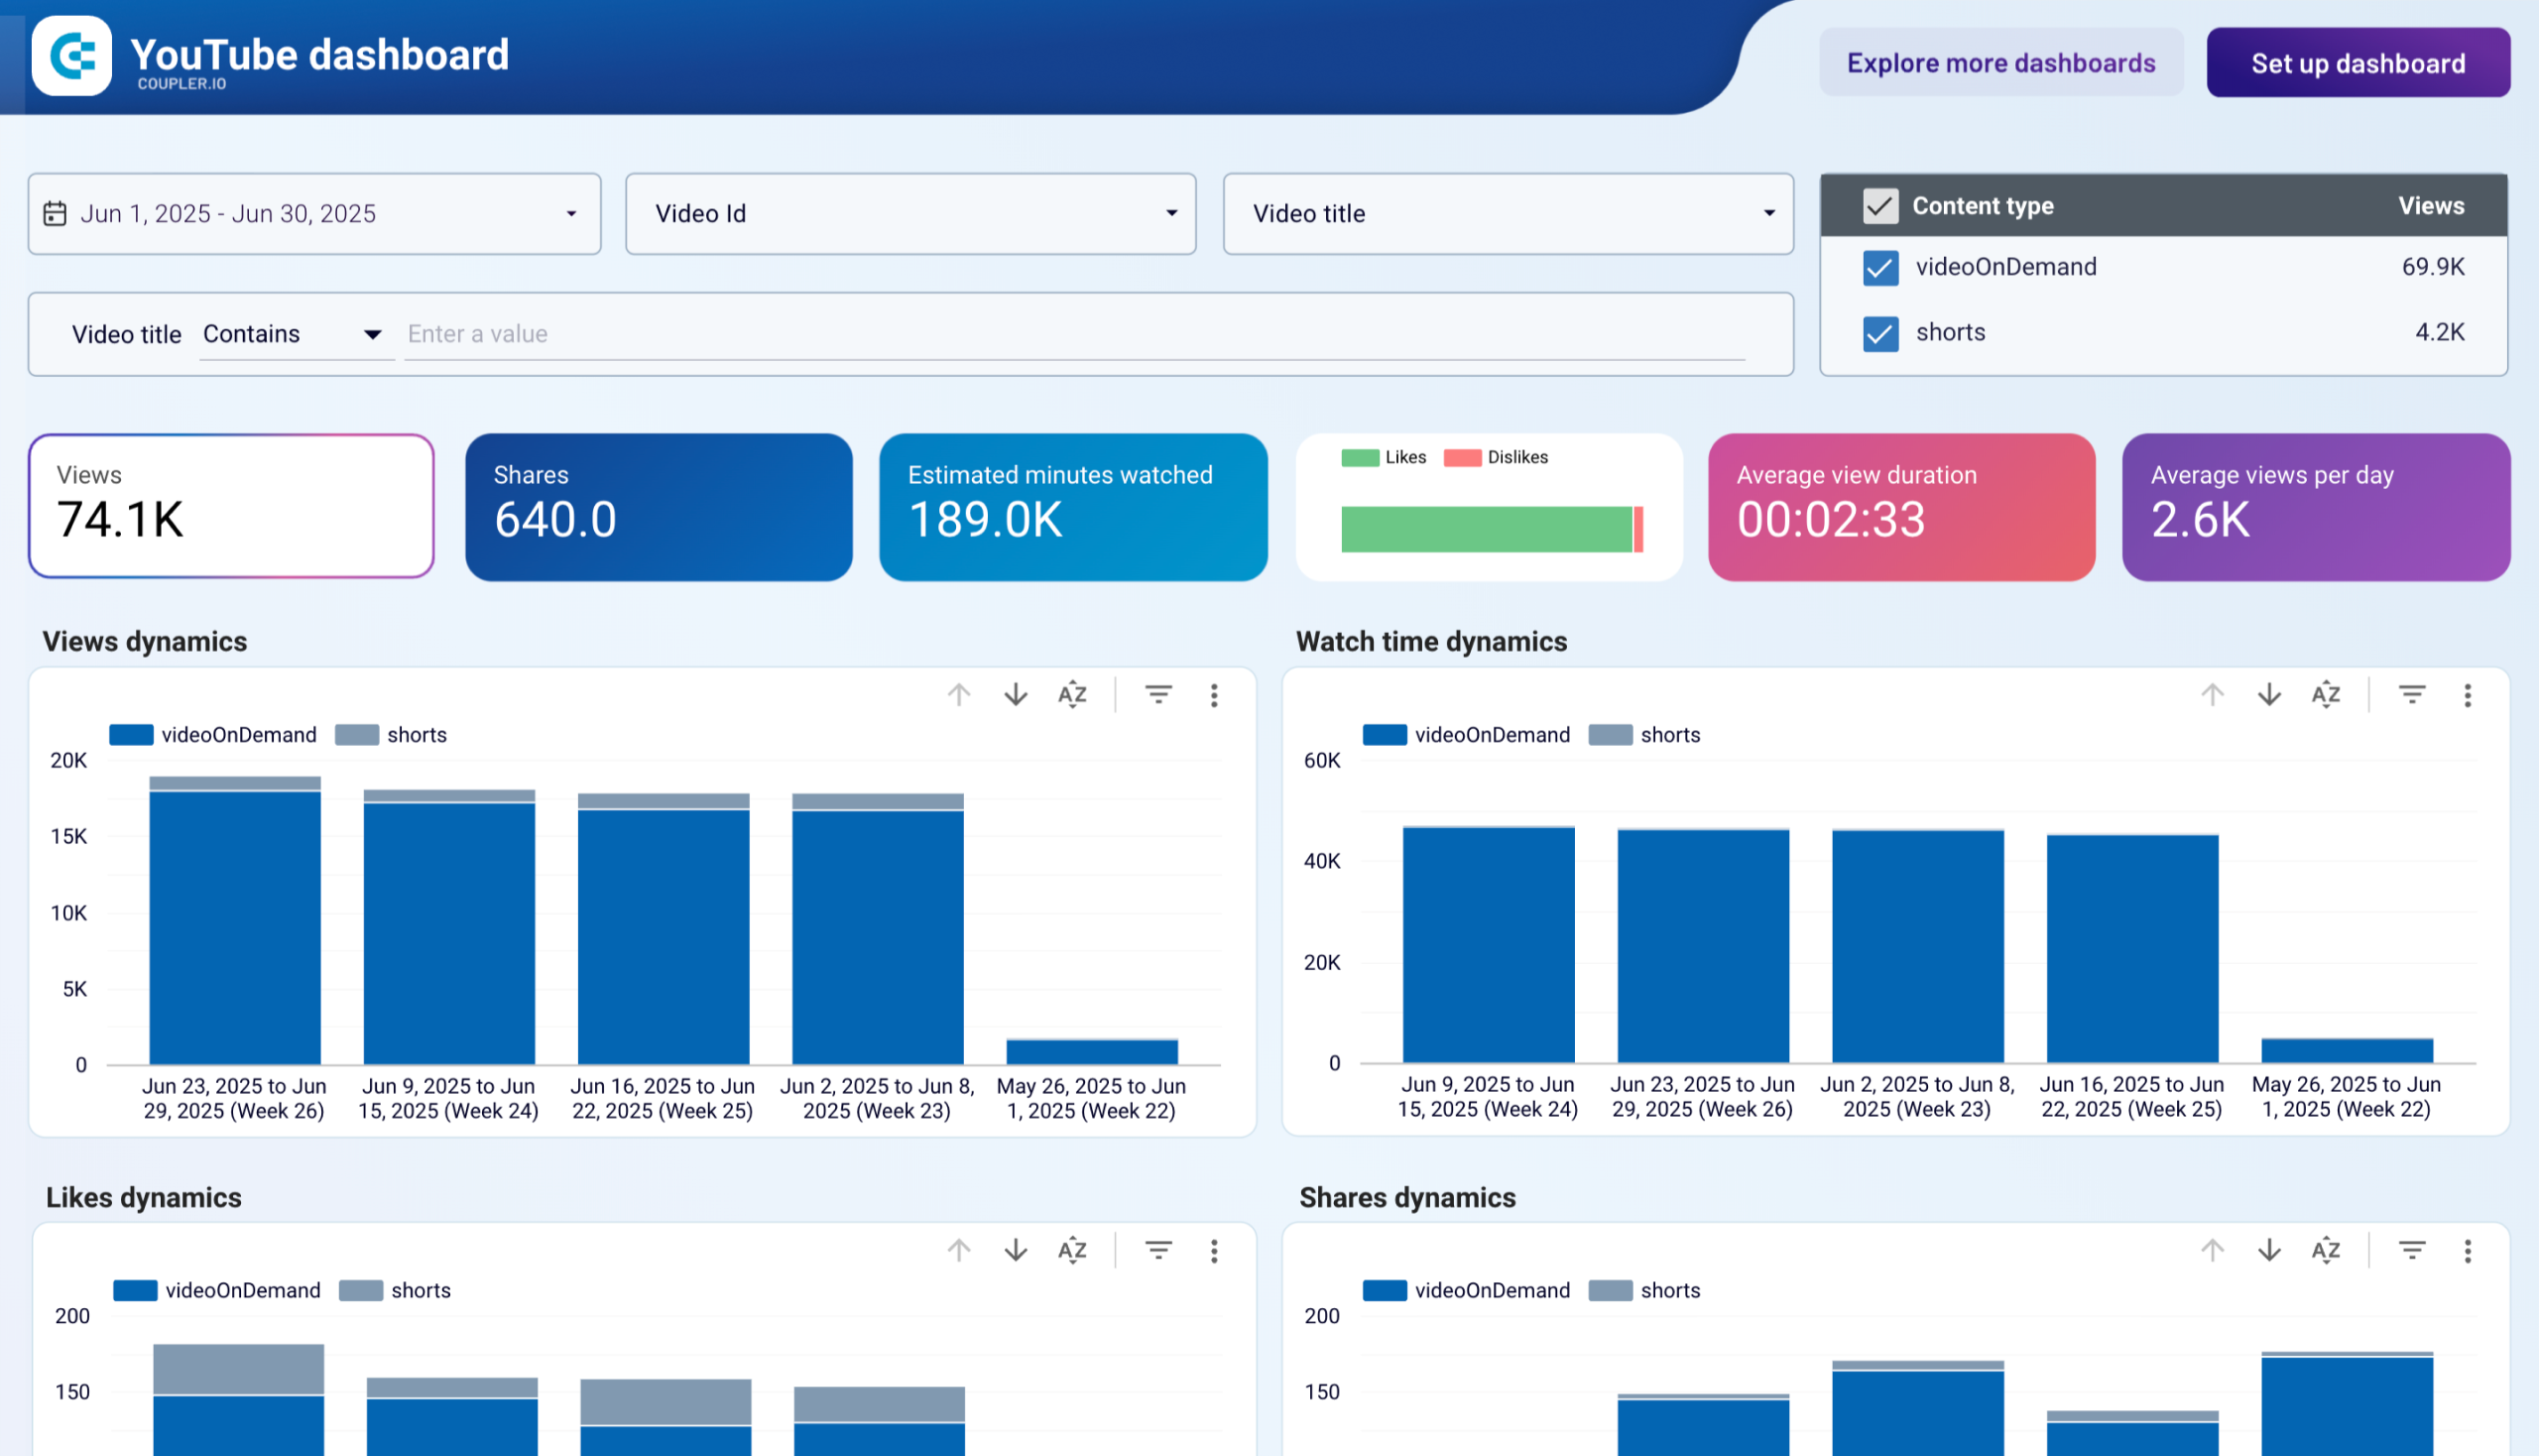
The dashboard displays insightful information about video performance, viewer engagement, and content strategy. It loads data from YouTube analytics using the built-in connector. It is one of the influencer marketing dashboards by Coupler.io, and it allows you to monitor channel dynamics, analyze audience segments, and drill down into every video’s performance on your channel.
Dashboard metrics:
- Views
- Likes/dislikes
- Shares
- Average view duration
- Average views per day
- Subscribers gained/lost, etc.
20. TikTok dashboard by Coupler.io
If you want to grow on TikTok, this dashboard is a must-have. It visualizes every crucial TikTok metric in an intuitive and interactive way.
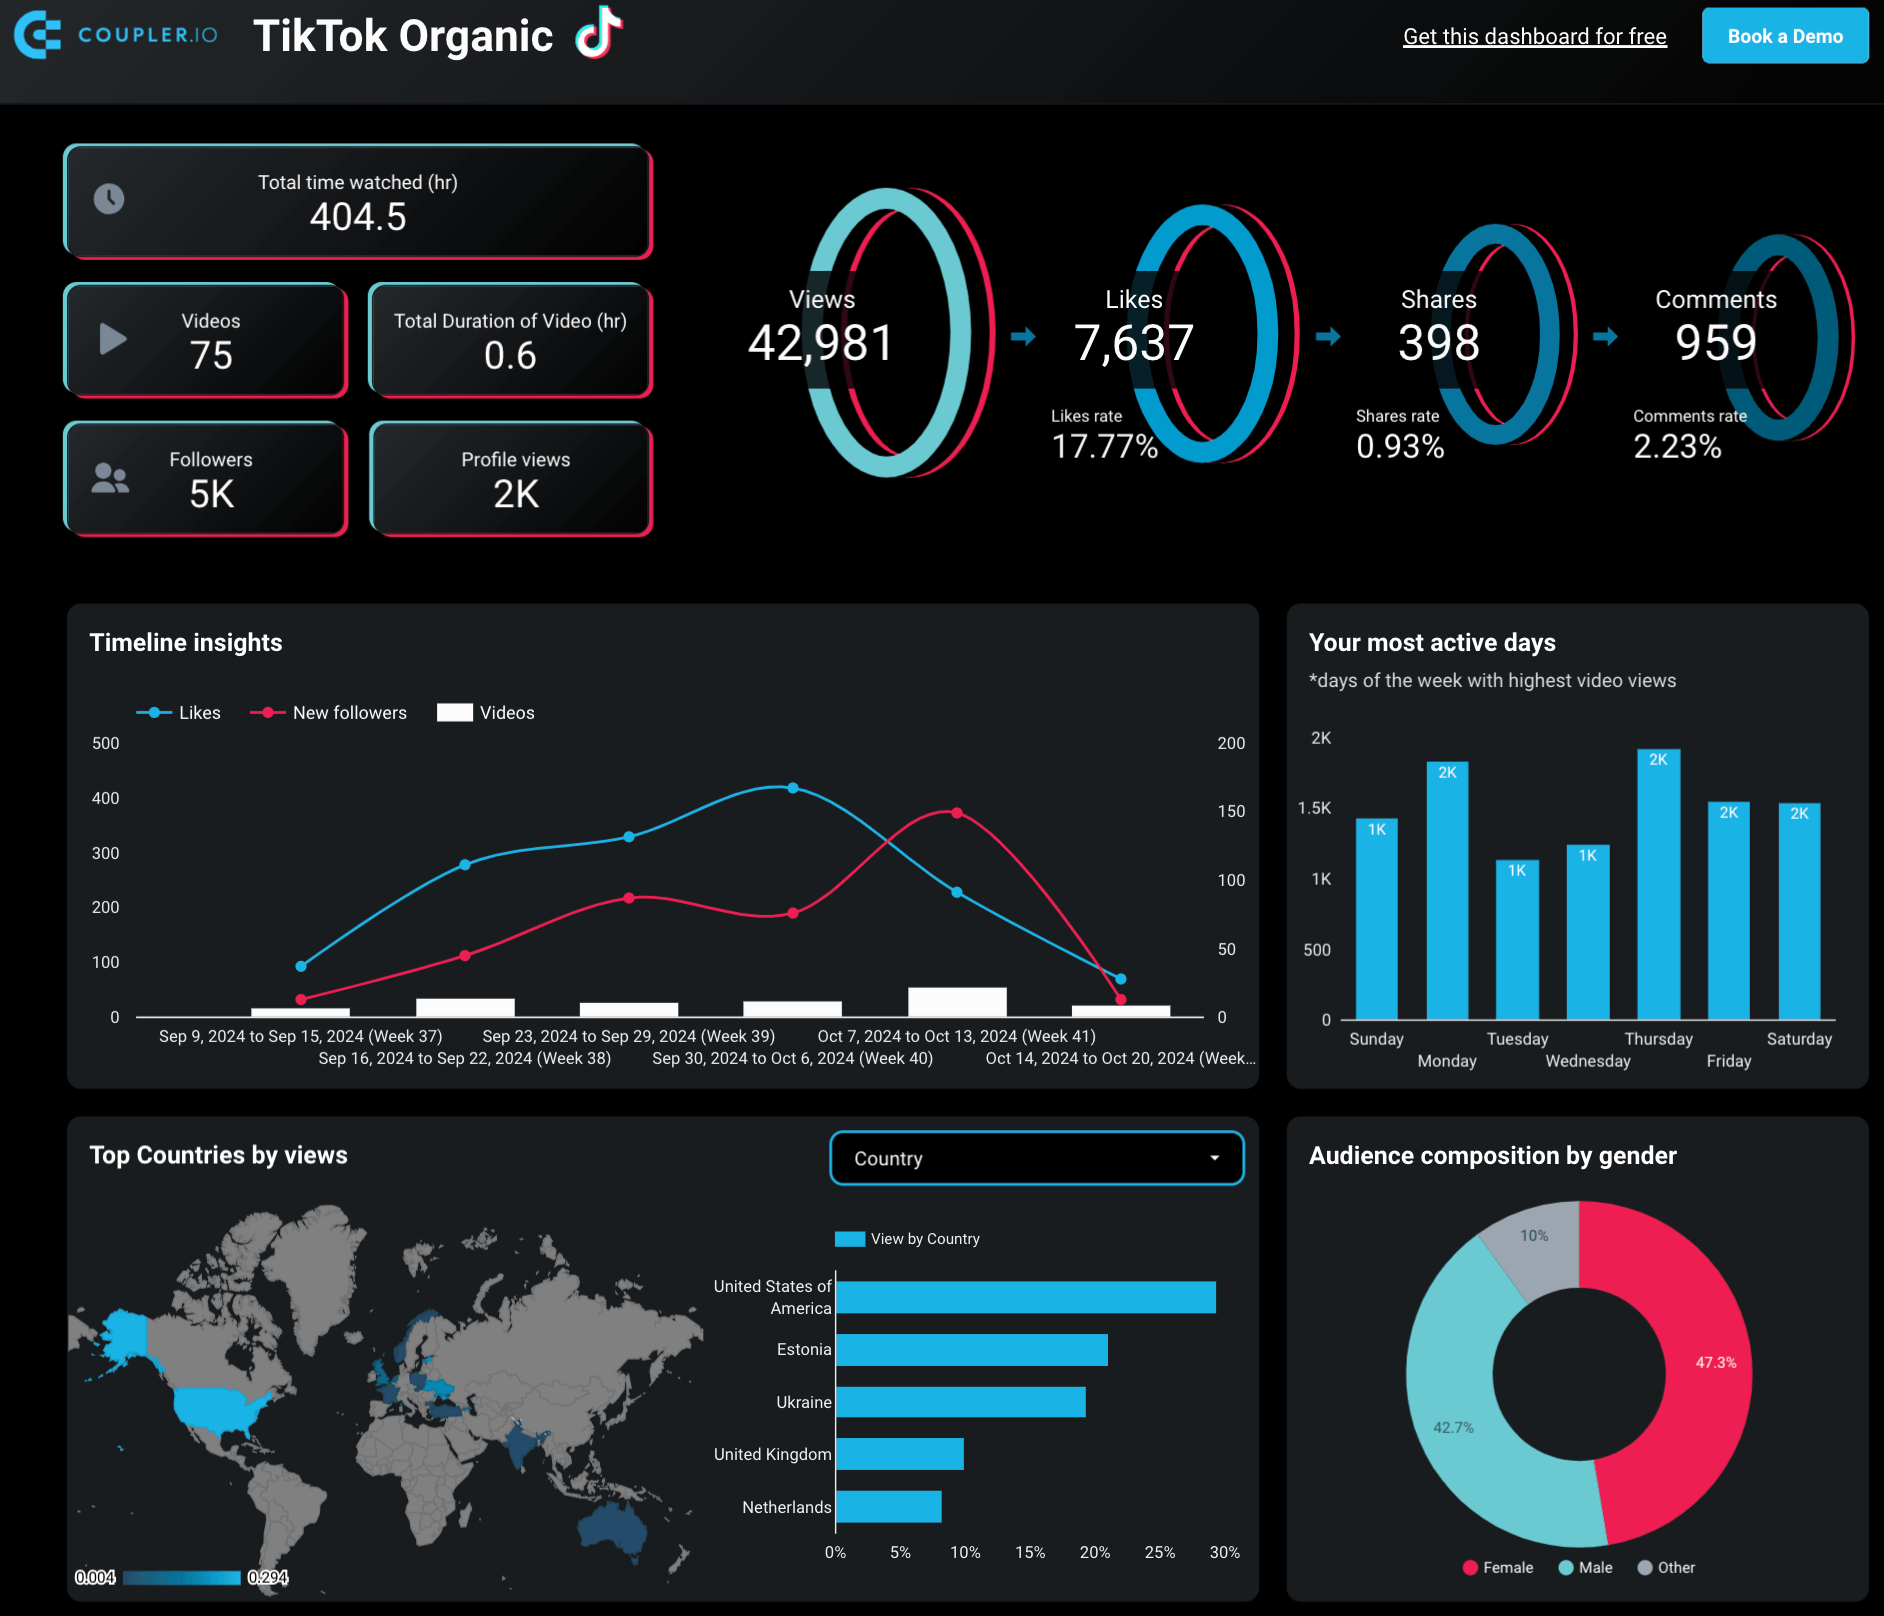
The TikTok dashboard highlights key metrics like watched hours, videos posted, followers, and profile views. The engagement funnel shows total views, likes, shares, and comments, resembling an acquisition funnel. This helps you understand engagement on the platform.
The timeline graph shows which videos bring in the most followers or likes so you can focus on similar content. These insights help to create a better content strategy and grow on the platform.
To use this Coupler.io dashboard for your TikTok account, follow the simple instructions in the Readme tab.
Dashboard metrics:
- Total time watched
- Video
- Total duration of videos
- Followers
- Profile views
- Views and views by country
- Likes, comments, and shares
- Active days
21. Instagram business dashboard by Coupler.io
The Instagram business dashboard provides centralized performance tracking for businesses and agencies managing multiple Instagram accounts. This Looker Studio template helps you understand what content resonates with your audience, identify growth opportunities, and optimize posting strategies based on actual performance data rather than guesswork.
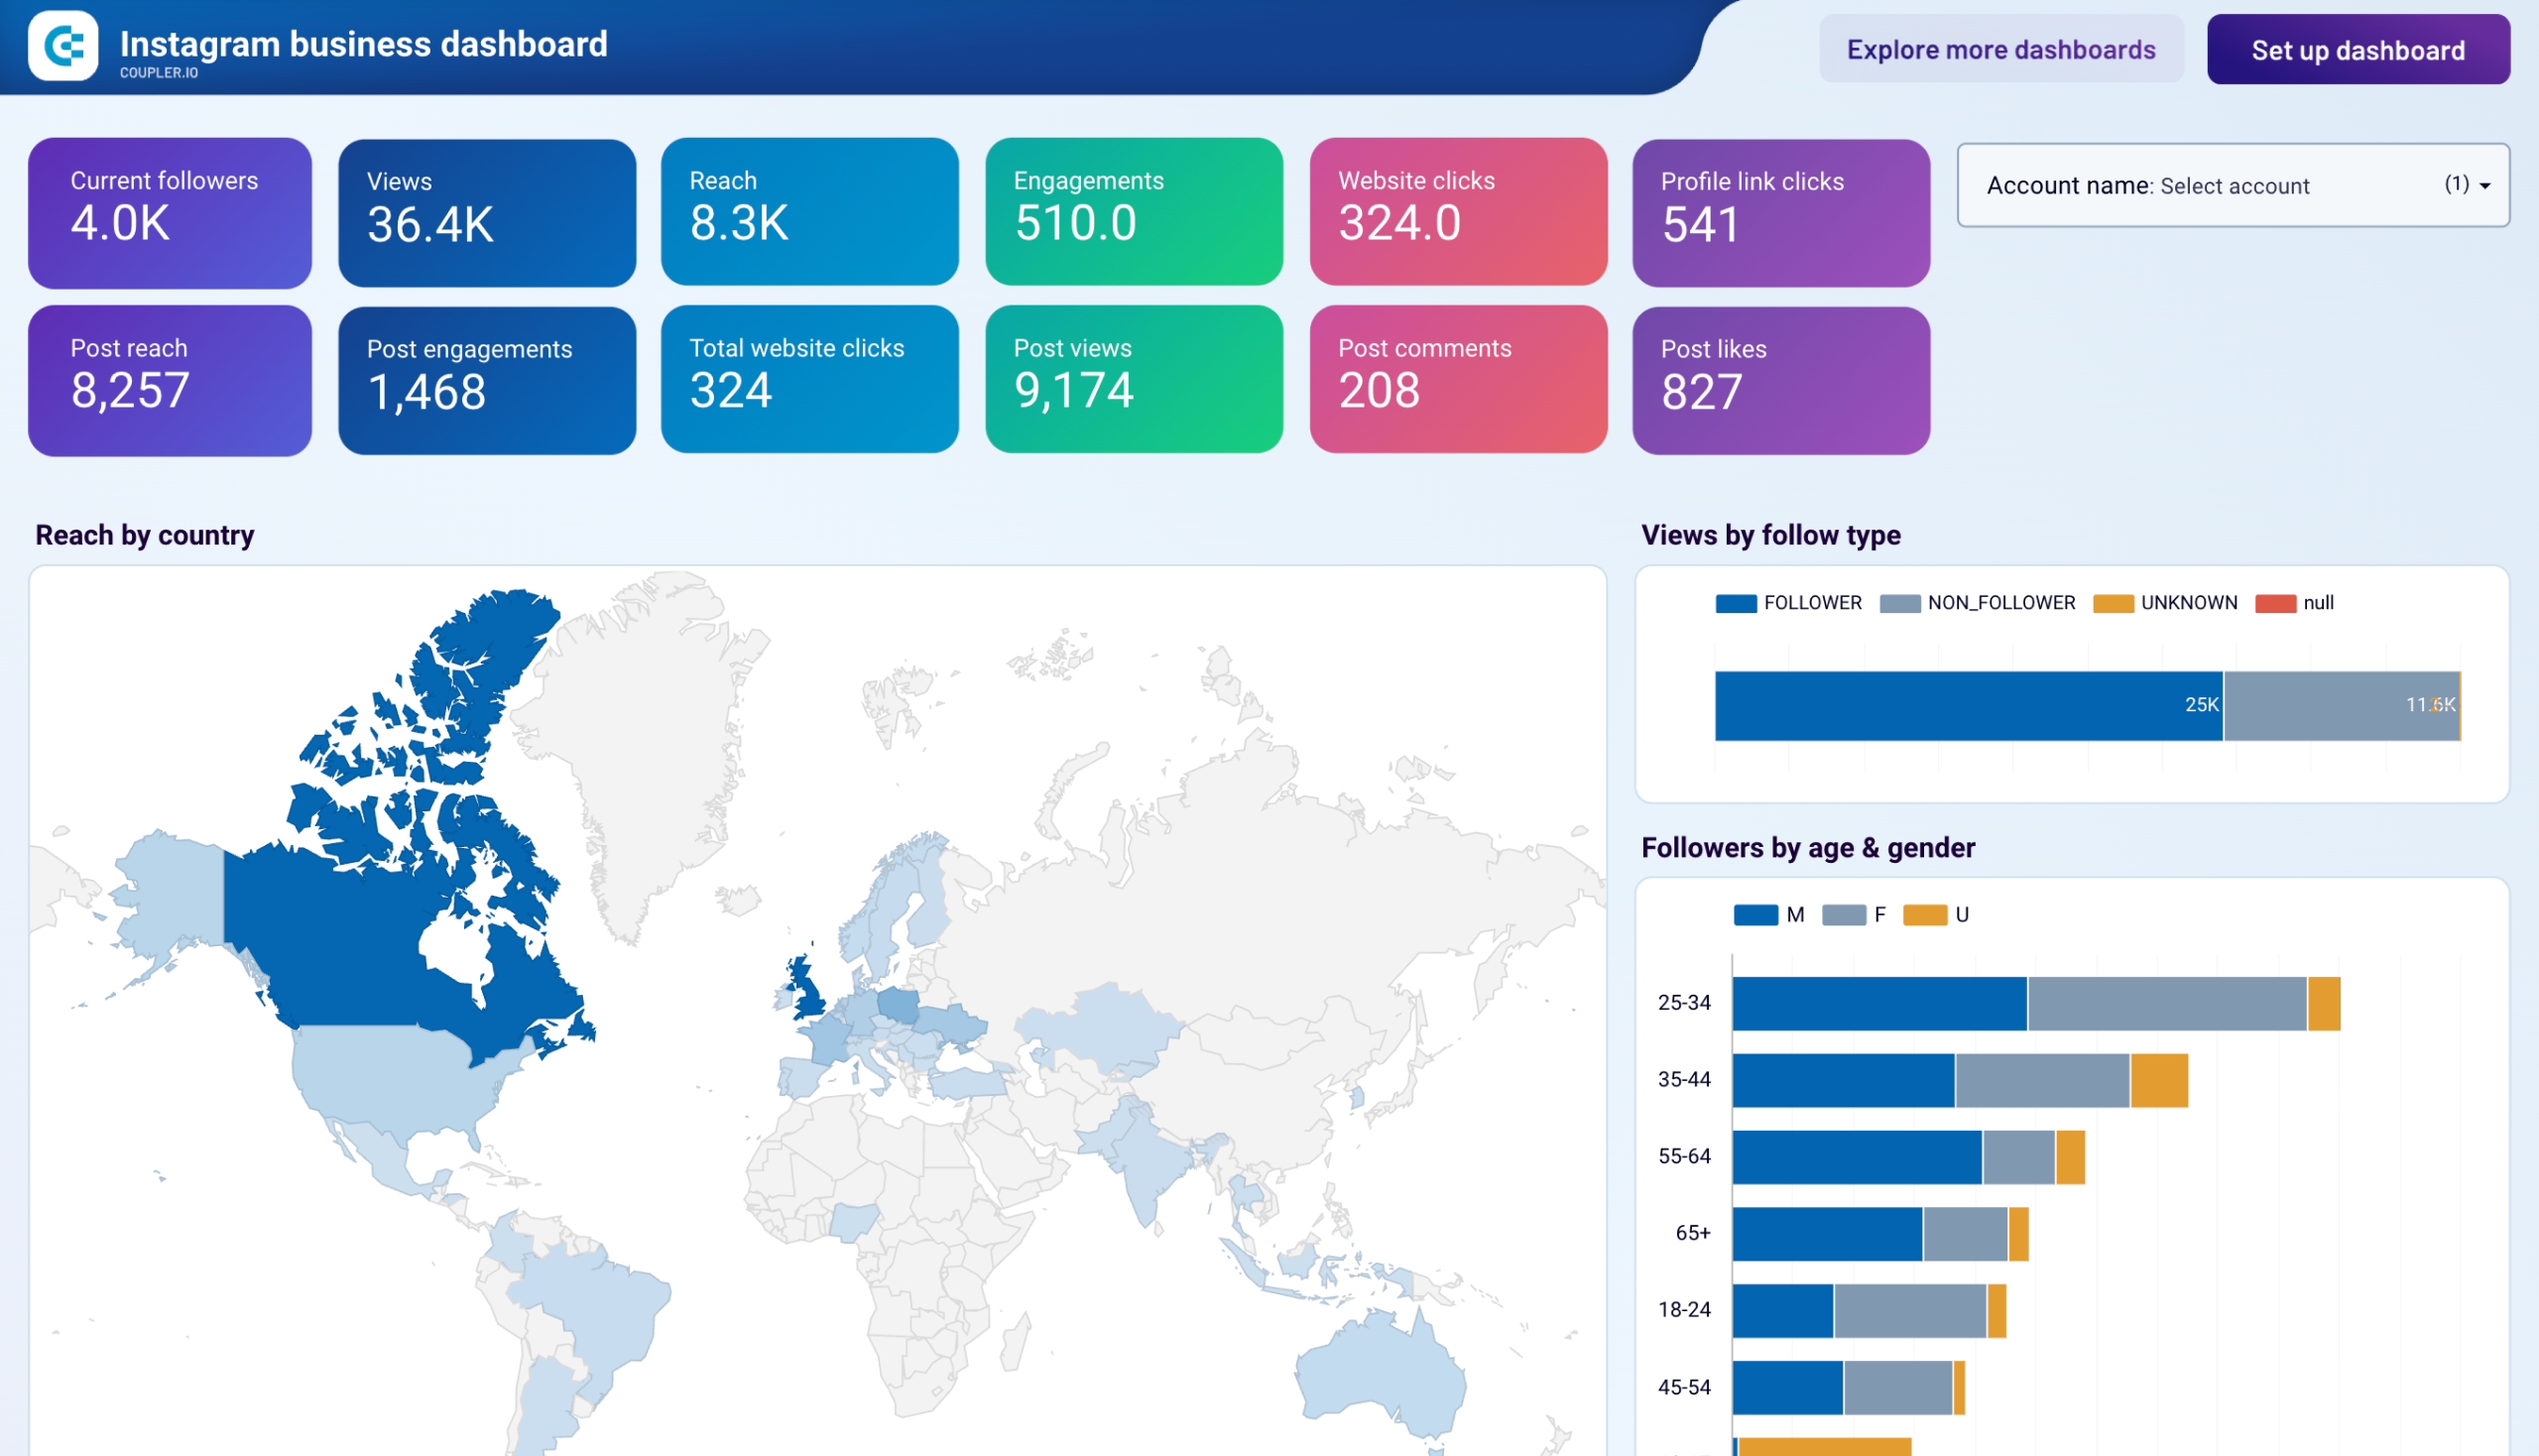
With this dashboard, you can discover whether your content reaches beyond existing followers to attract new audiences organically, identify unexpected geographic markets where your content performs exceptionally well, and understand whether your actual audience demographics match your intended target. For agencies, the multi-account capability enables quick comparison across client portfolios to identify successful strategies worth replicating.
This dashboard is particularly valuable for social media managers handling multiple brand accounts, agencies reporting on client Instagram performance, eCommerce businesses driving traffic from Instagram, or influencers who need professional reporting for sponsor negotiations. To use this template, follow the instructions in the Setup guide.
Dashboard metrics:
- Followers
- Views
- Reach
- Engagements
- Website clicks
- Profile link clicks
- Likes
- Comments
- Accounts engaged
- Subscribers gained/lost
- Geographic reach
- Demographics (age & gender)
- Post performance details
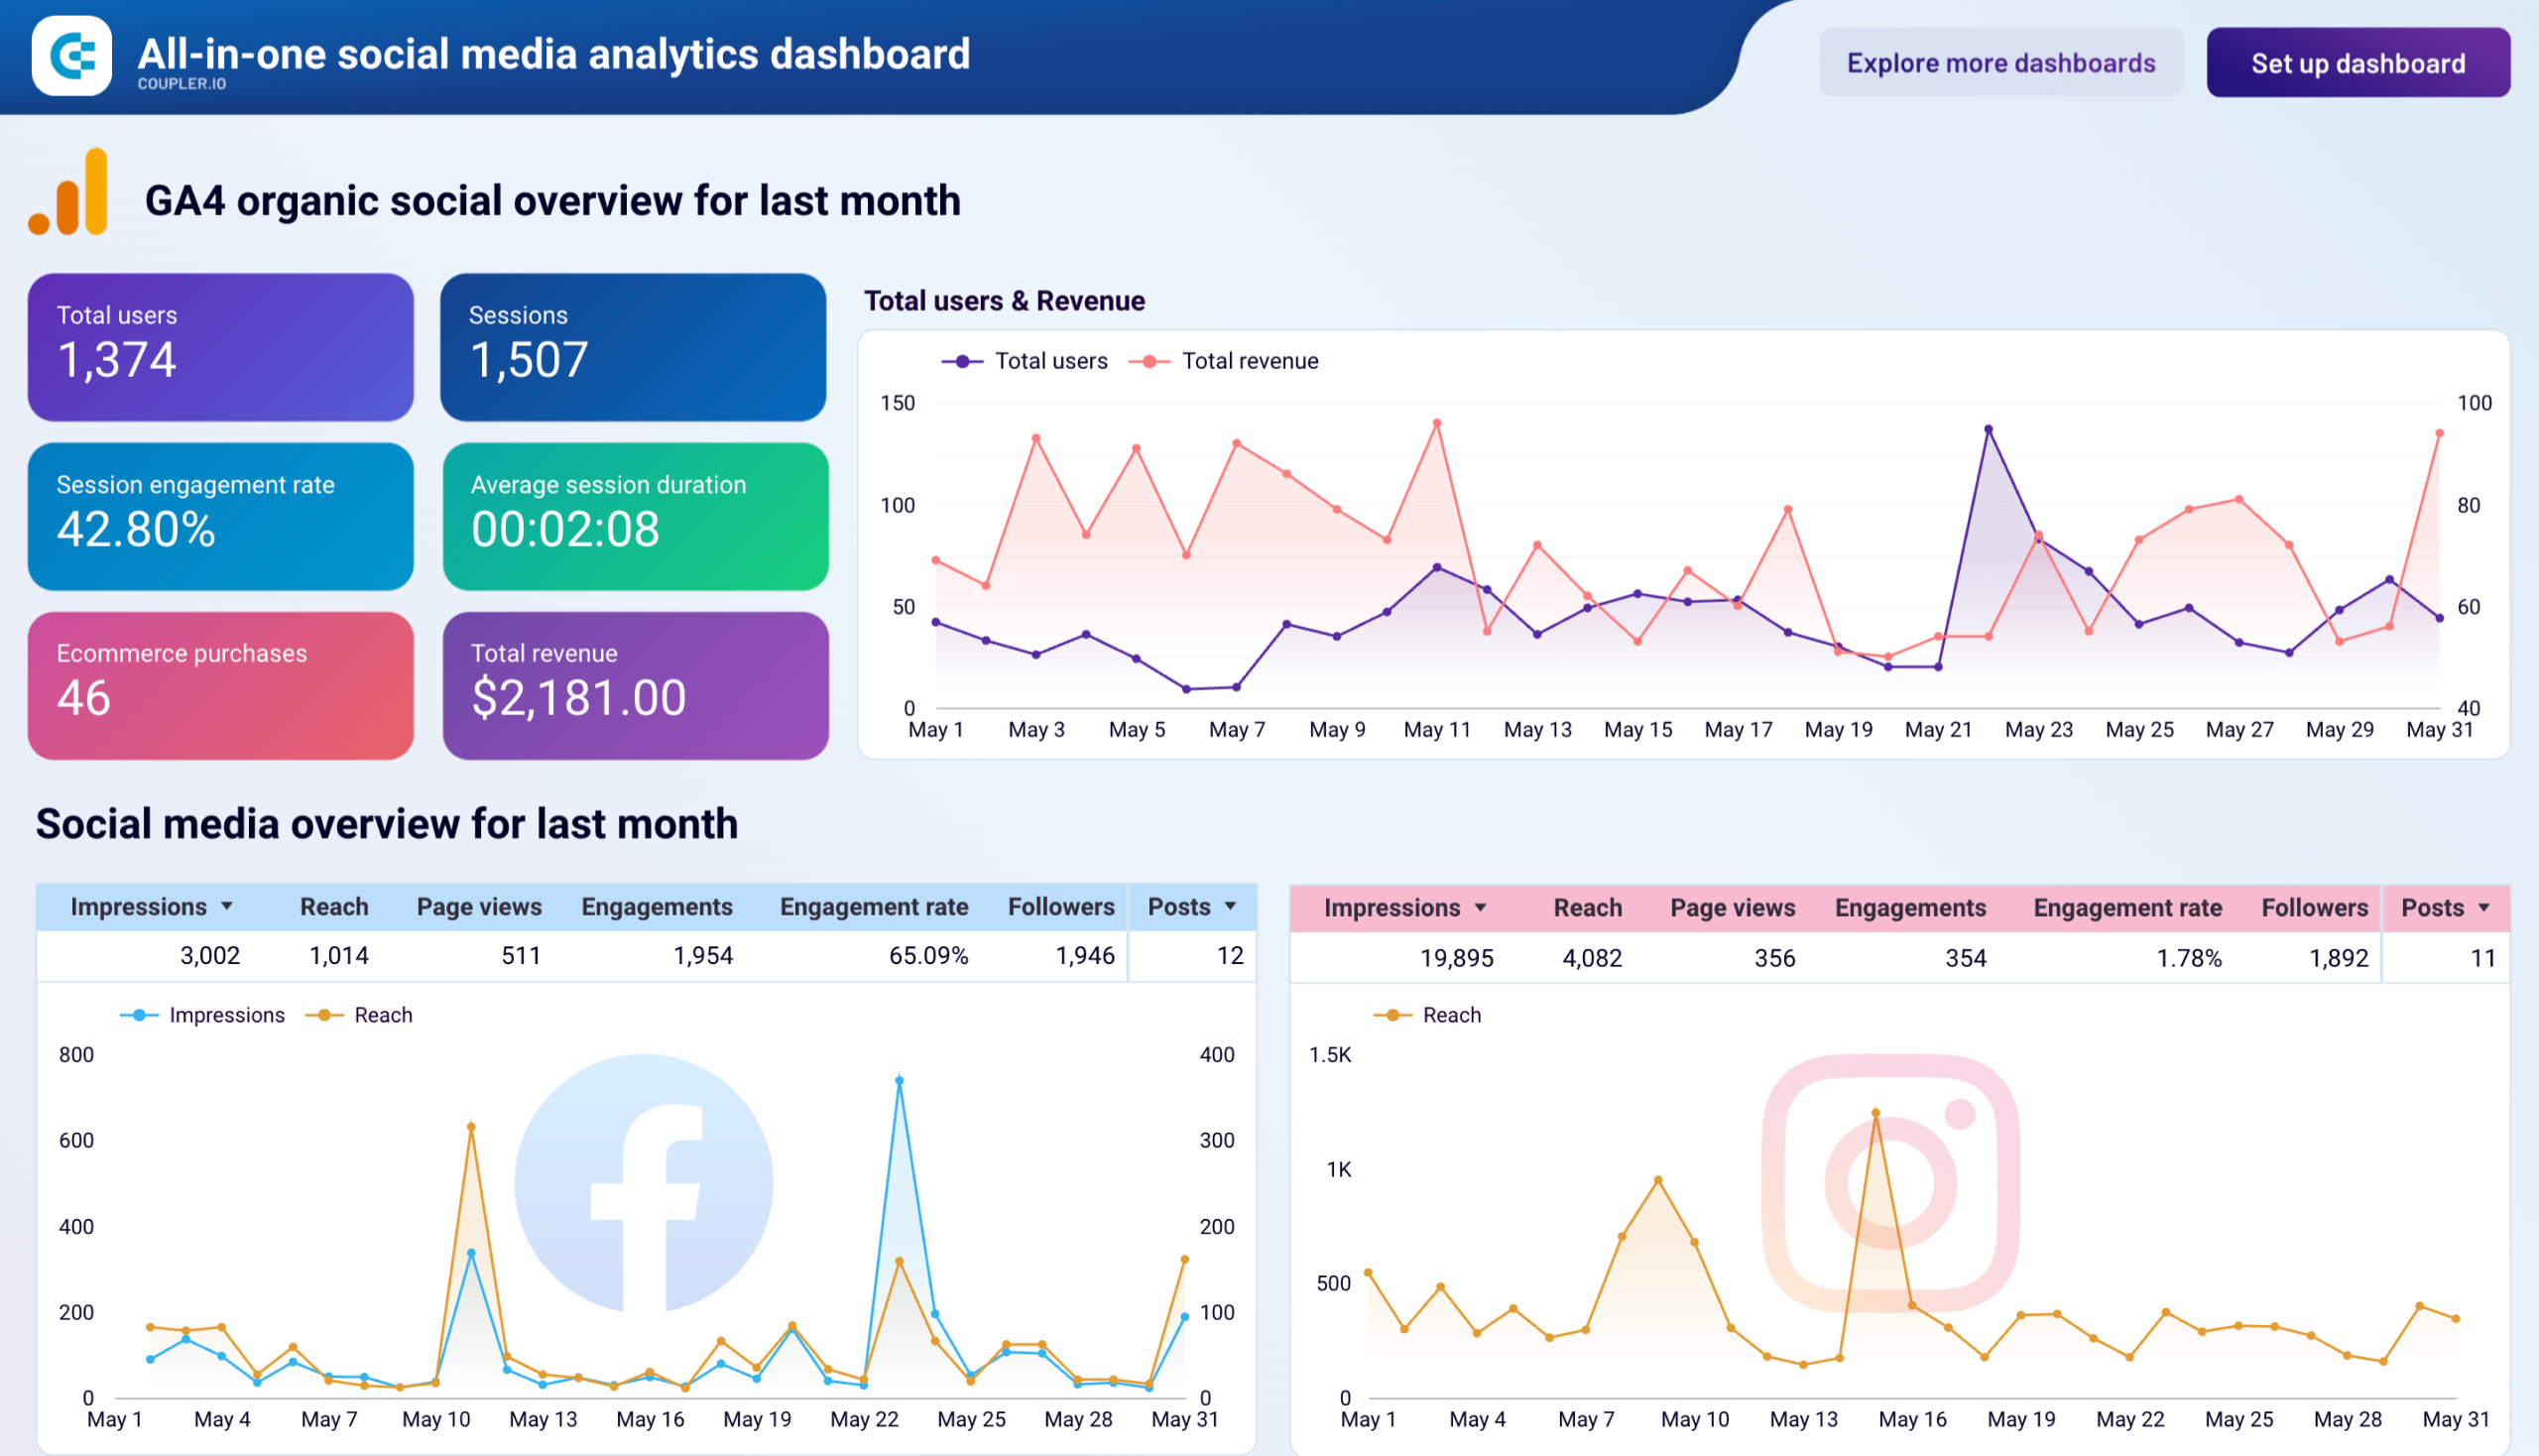
Use this dedicated social media dashboard to overview the performance of major social media platforms: Facebook, Instagram, LinkedIn, and YouTube.
All-in-one social media analytics dashboard
 Preview dashboard
All-in-one social media analytics dashboard
Preview dashboardWith integrated data from GA4, you can analyze how these social channels contribute to your website traffic and total results. Additionally, the dashboard provides insights into last month’s dynamics for each platform.
To get started, follow the instructions inside the template to connect your social media accounts and dive into analytics.
Dashboard metrics:
- Total users
- Impressions, reach
- Page views, video views
- Engagement rate
- Followers
- Posts
- Total revenue, etc.
Web analytics dashboards in Looker Studio
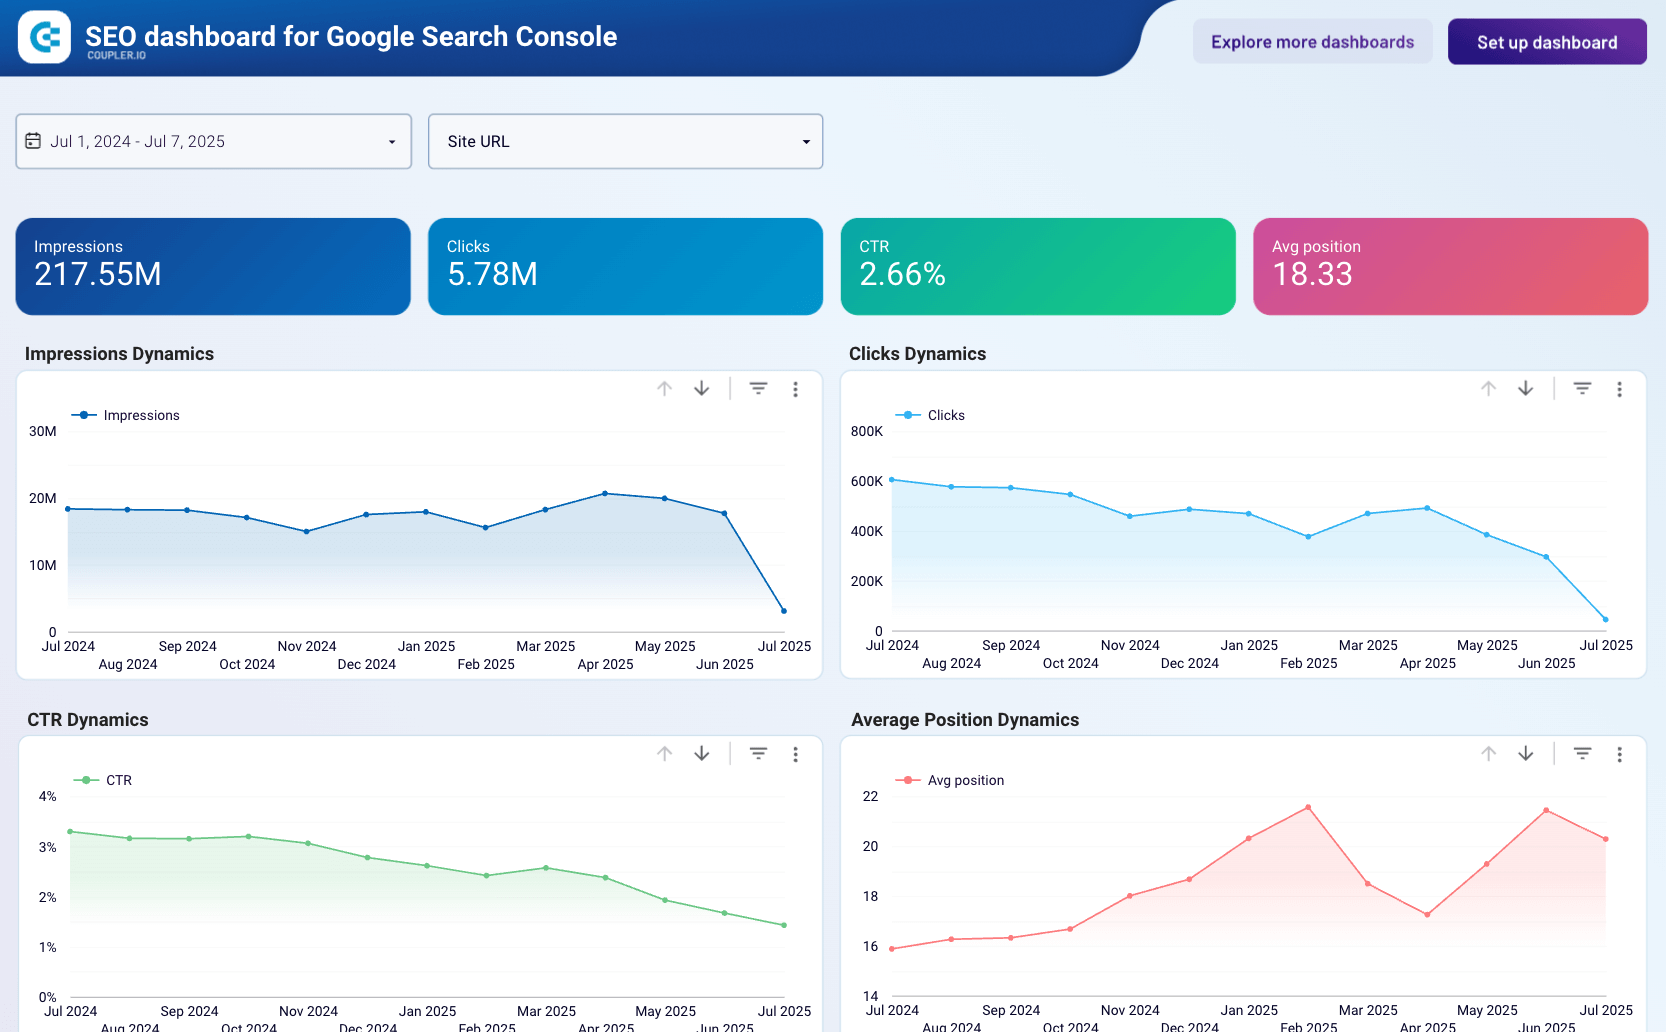
23. SEO dashboard for Google Search Console by Coupler.io
It makes sense to have a dedicated Looker Studio dashboard for SEO to track and understand your SEO performance. For this, you can try this dashboard template for Google Search Console.
SEO dashboard for Google Search Console
 Preview dashboard
SEO dashboard for Google Search Console
Preview dashboardIt’s designed to answer many questions such as how many indexed pages you have, which pages have clicks, what are the best and worst performing pages, etc.
You can connect the template to your GSC account using the integrated connector and start using the dashboard right away. It will take around 2 minutes to obtain a valuable SEO report with ease.
Dashboard metrics:
- Indexed pages
- Pages with clicks
- Impressions
- Clicks
- CTR
- Average position
- Click dynamics
- Best and worst performing URLs, etc.
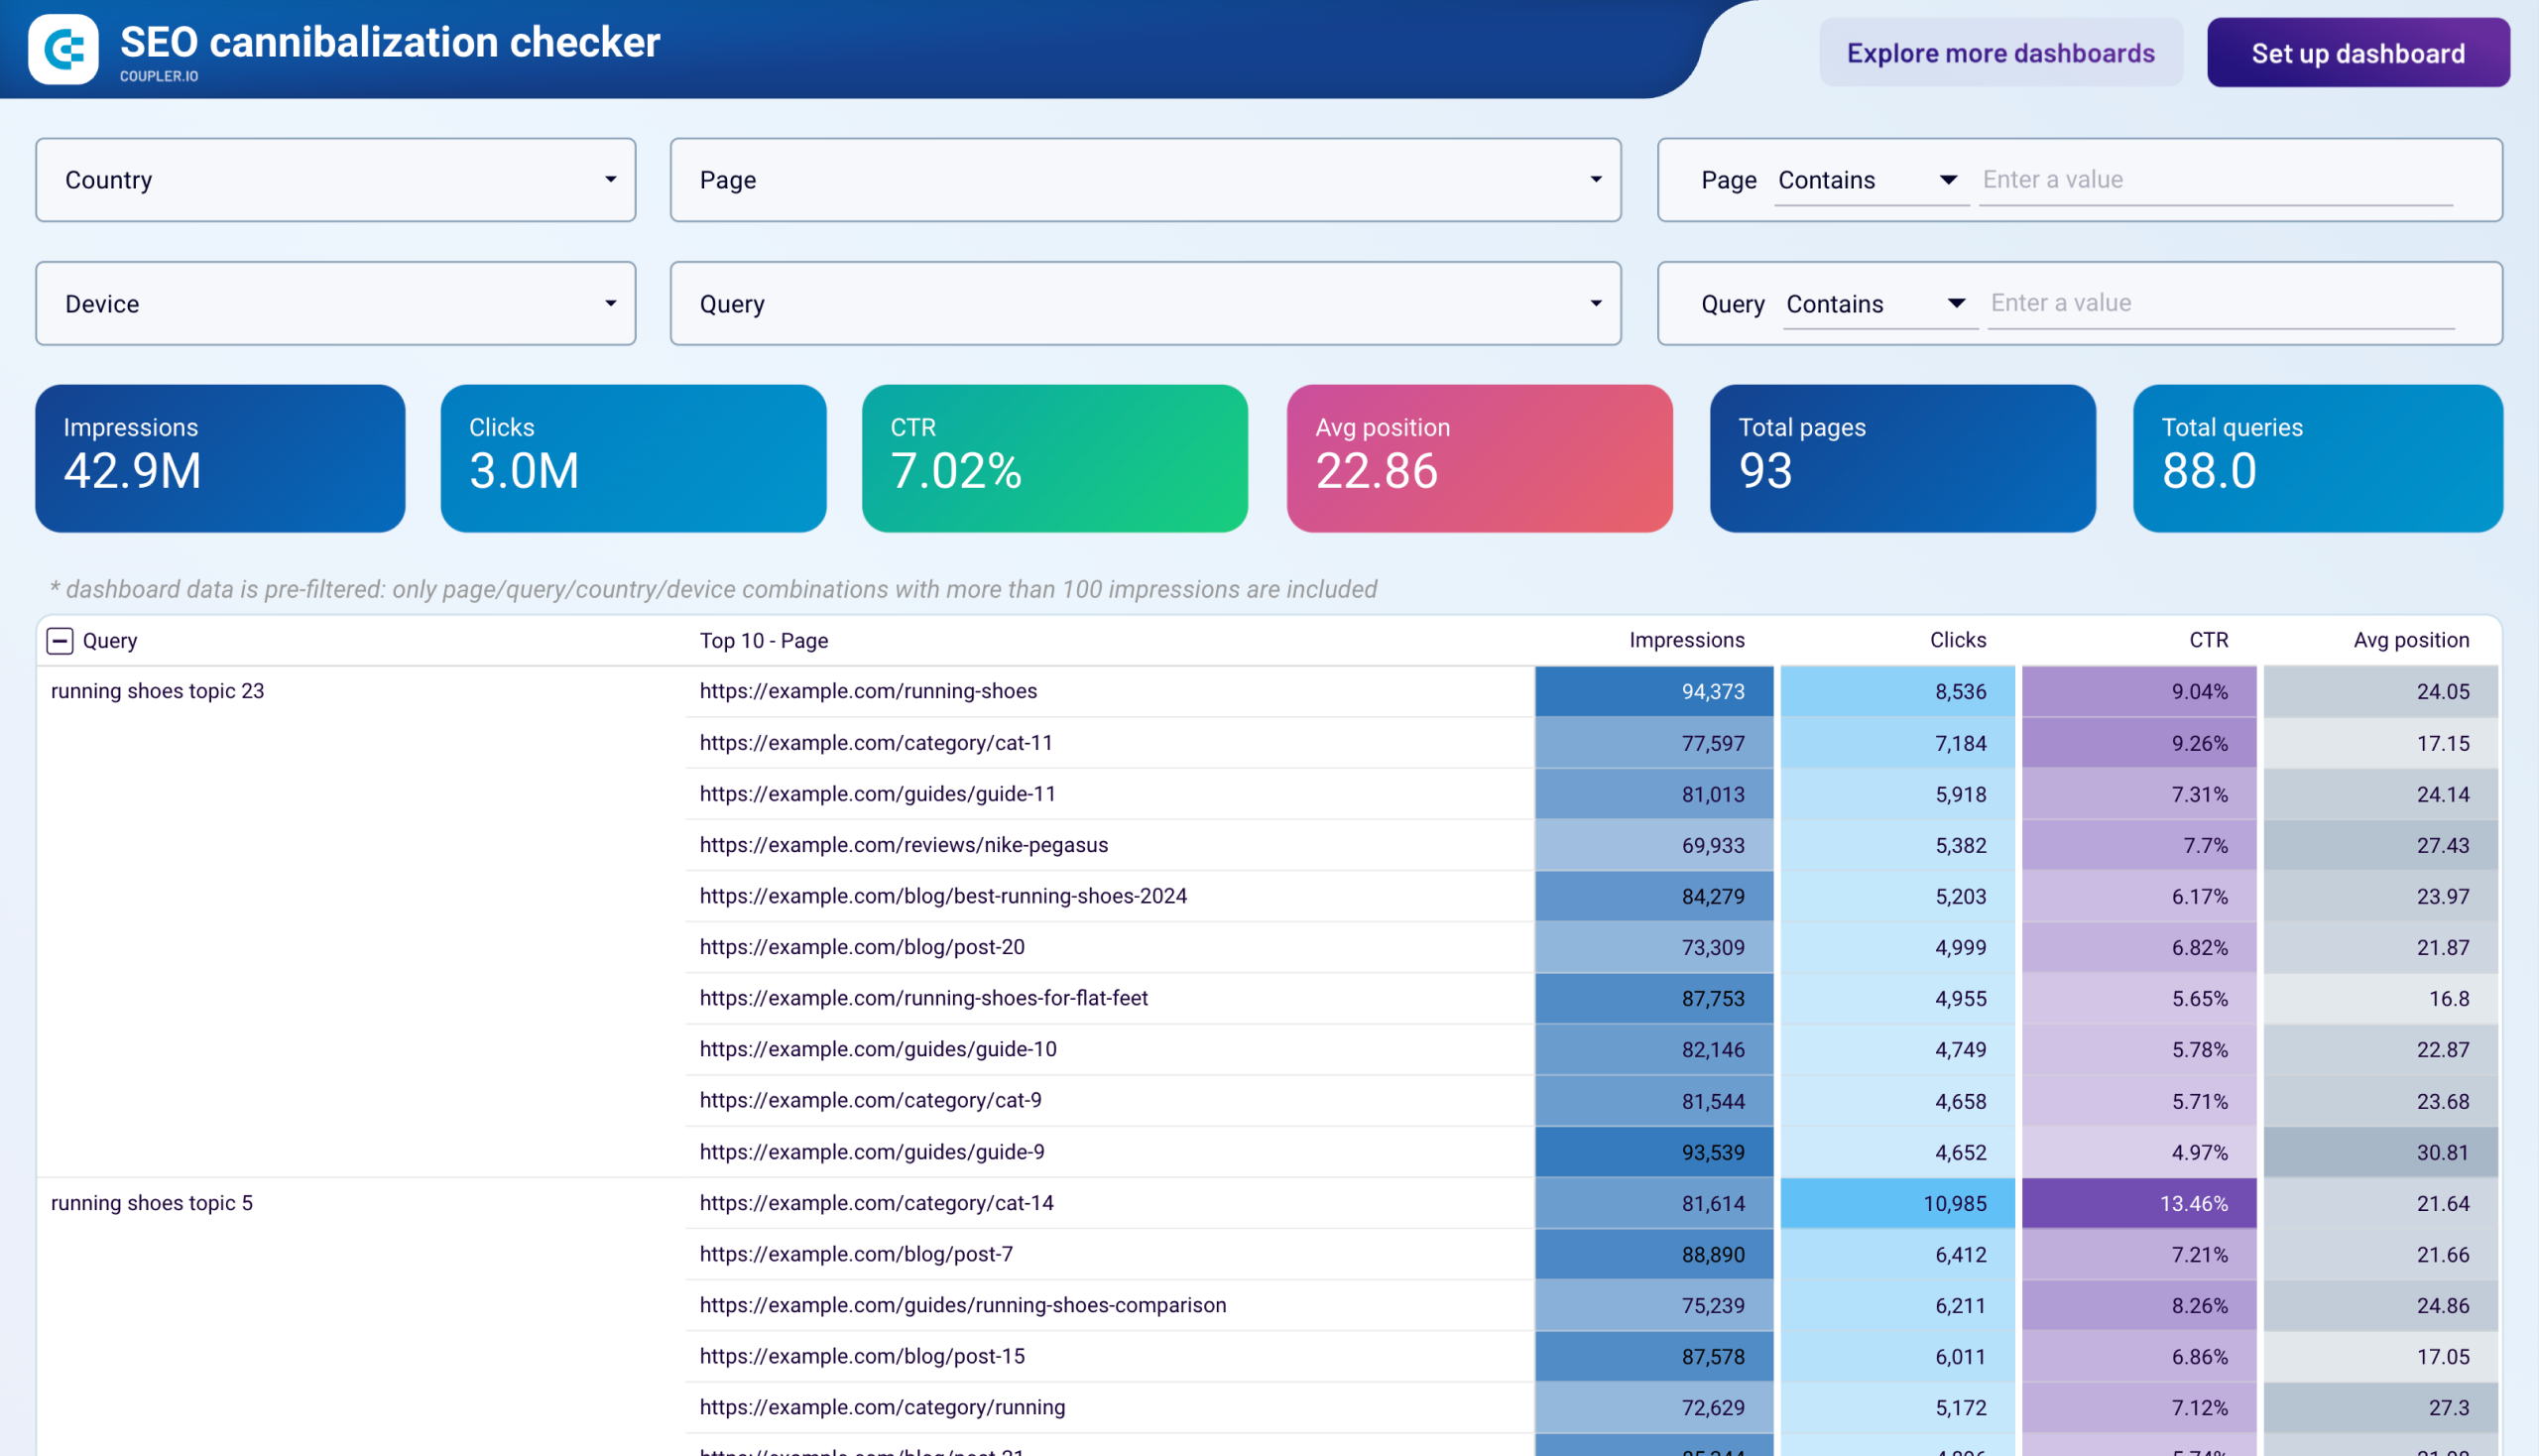
24. SEO cannibalization checker dashboard by Coupler.io
Most SEO dashboards tell you how your pages perform individually. What they don’t show is when your own pages are working against each other. If two blog posts target the same keyword, Google has to choose between them on every search, and the result is usually worse rankings for both. The SEO cannibalization checker dashboard by Coupler.io is built specifically to find these overlaps.
SEO cannibalization checker dashboard
 Preview dashboard
SEO cannibalization checker dashboard
Preview dashboardThe dashboard connects to Google Search Console and restructures your data around queries rather than pages. Each query appears as a group with every competing URL listed underneath, showing impressions, clicks, CTR, and average position per URL. This makes it easy to compare how Google distributes visibility across your pages for the same search term.
This Google Data Studio template is free to use. Connect your Google Search Console account through the built-in Coupler.io connector, and the dashboard will populate with your data and refresh on a schedule you configure.
Dashboard metrics:
- Impressions
- Clicks
- CTR
- Average position
- Total pages
- Total queries
25. Web analytics dashboard by Coupler.io
Google Analytics is the single source of truth for your website performance data. The Web Analytics dashboard by Coupler.io visualizes GA4 data so you can make better sense of your traffic, engagement, and user activity.
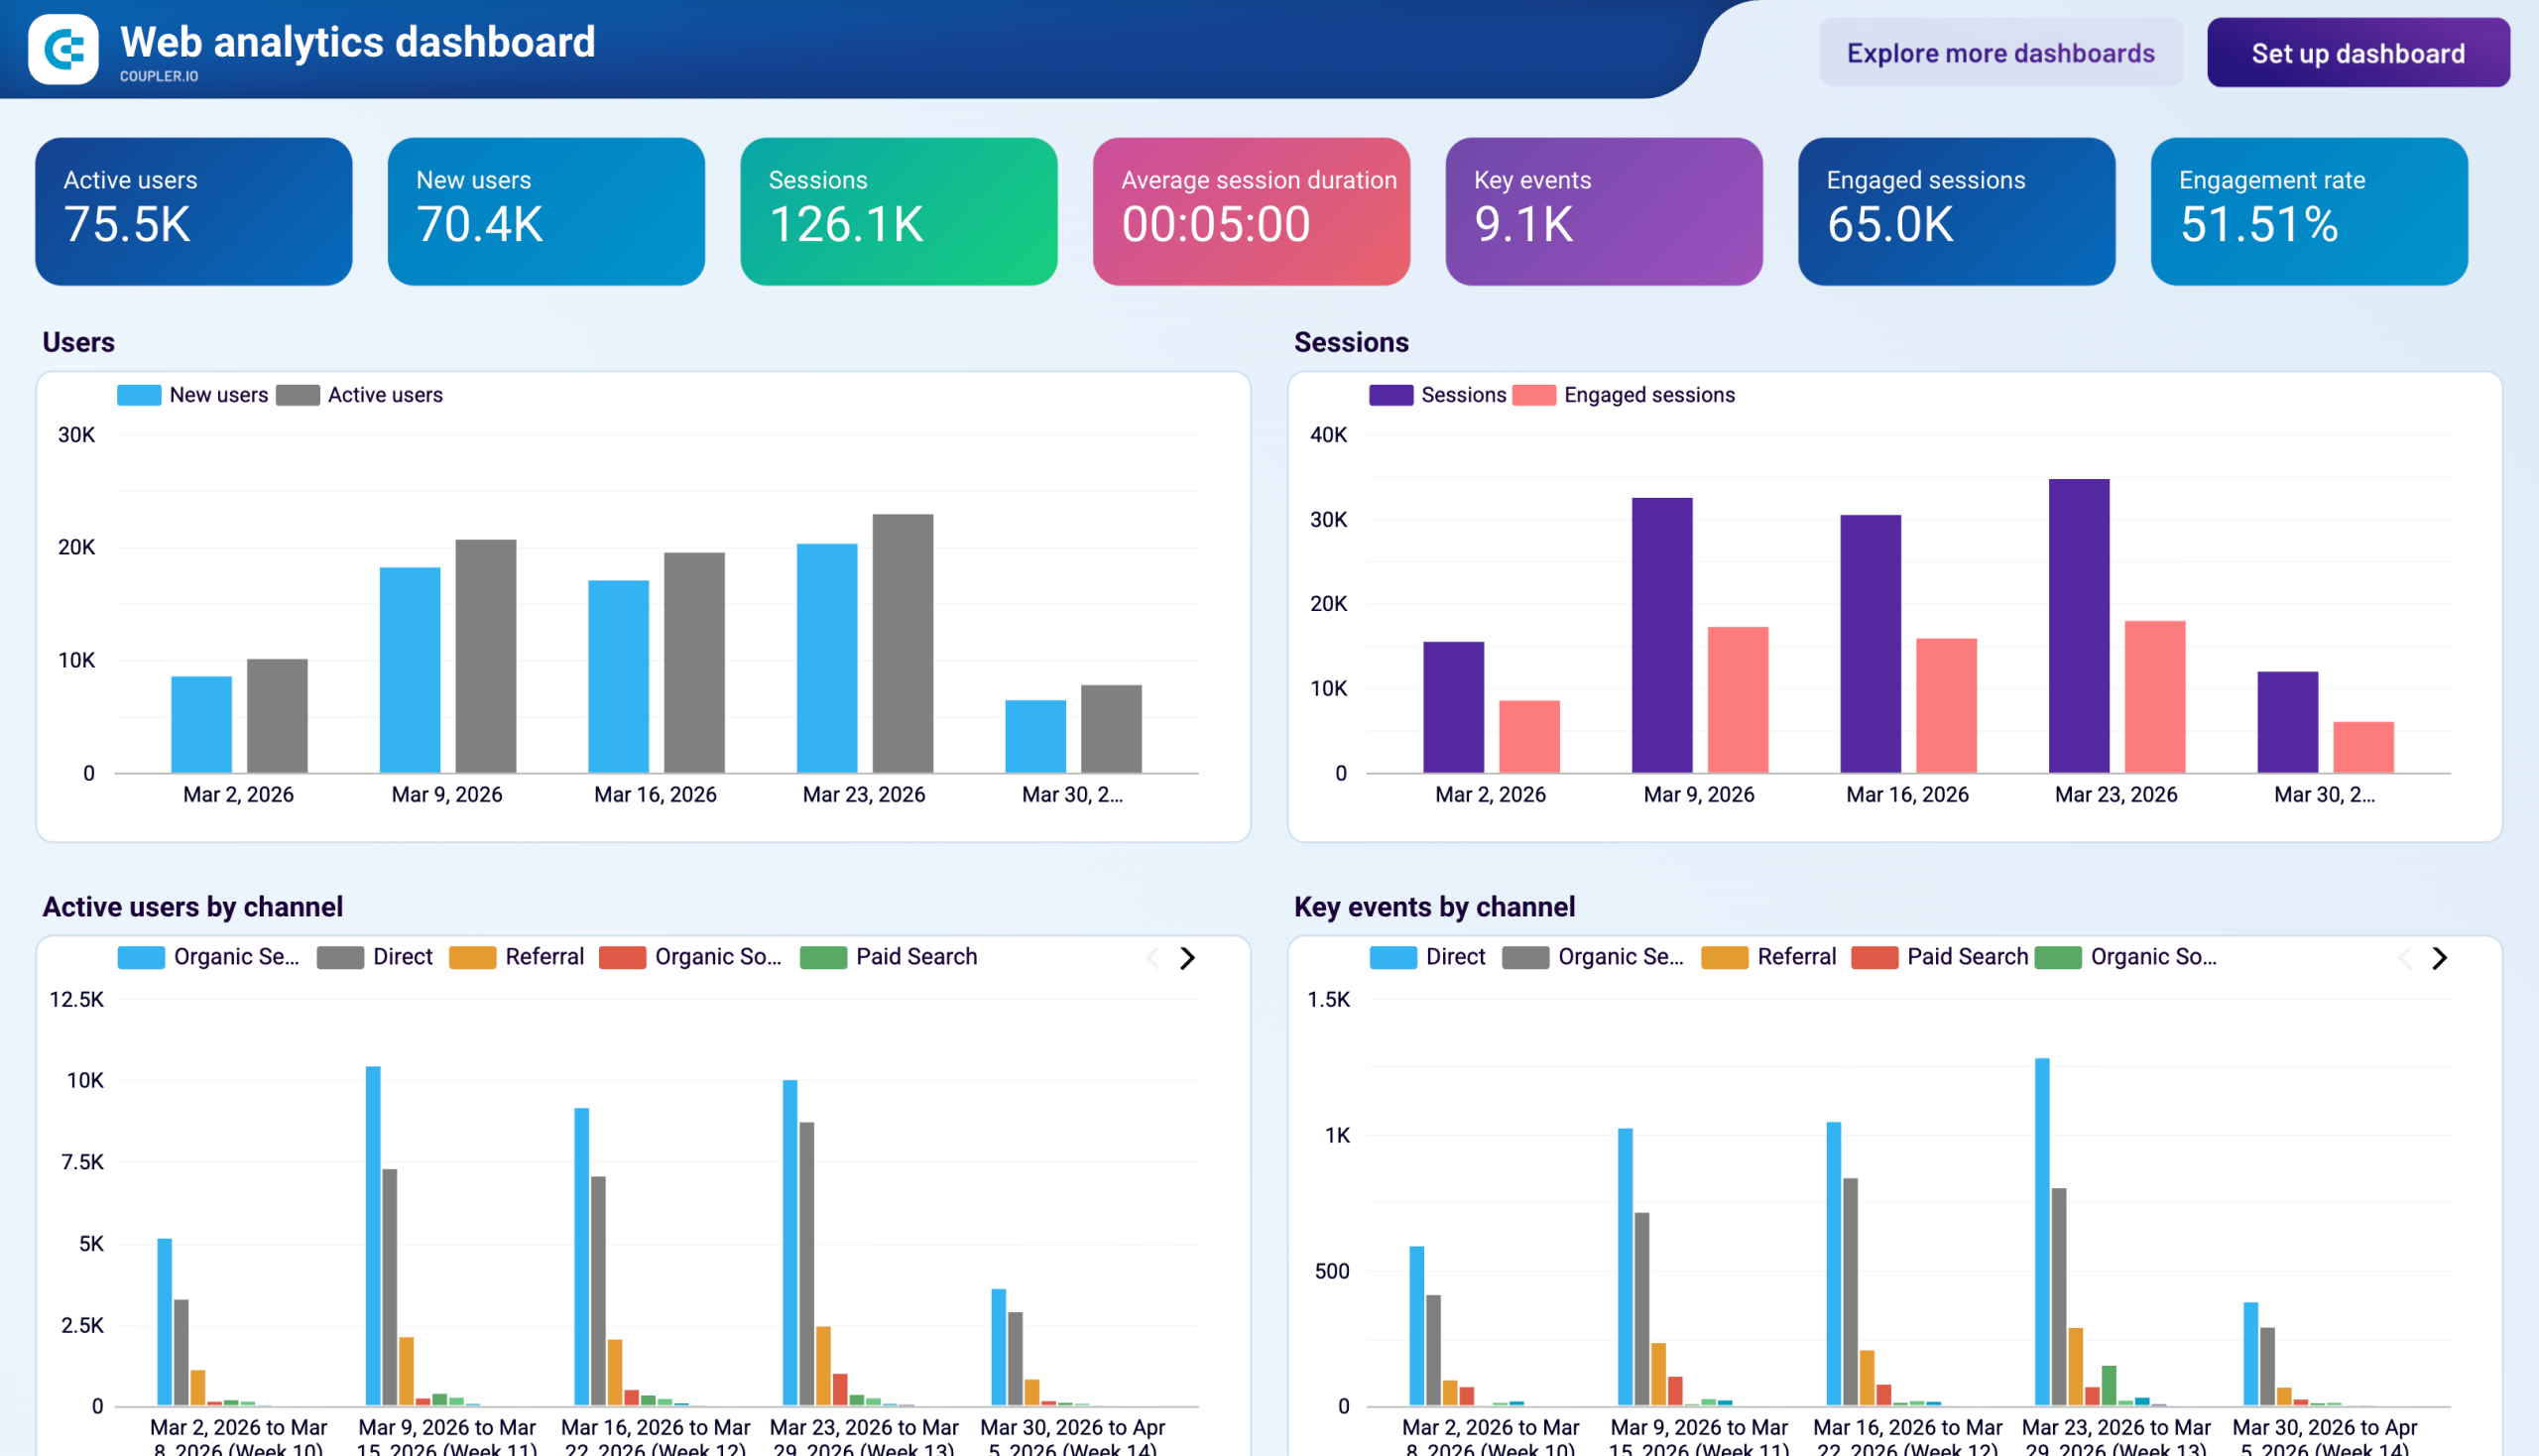
The dashboard presents everything in a single-page layout covering several areas of website performance:
- Landing pages: A table comparing pages by active users, sessions, engagement rate, and key events to show which content attracts and retains visitors.
- Traffic overview: KPI cards for active users, new users, sessions, average session duration, key events, engaged sessions, and engagement rate, with weekly trend charts showing user growth and session quality over time.
- Channel acquisition: Stacked time-series charts and a detailed table breaking down active users, sessions, engagement rate, session duration, and key events by channel — Organic Search, Direct, Referral, Paid Search, Organic Social, and others.
- Events: Two tables tracking all events and key events separately, each with active user counts, event counts, and completion rates.
- Geography: A world map and country-level table showing where your visitors are located, with engagement and session metrics per market.
This dashboard is your one-stop shop for all your web analytics needs. To use this template for your website, follow the enclosed instructions.
Dashboard metrics:
- Active users
- New users
- Sessions
- Average session duration
- Key events
- Engaged sessions
- Engagement rate
- Event count
- Event completion rate
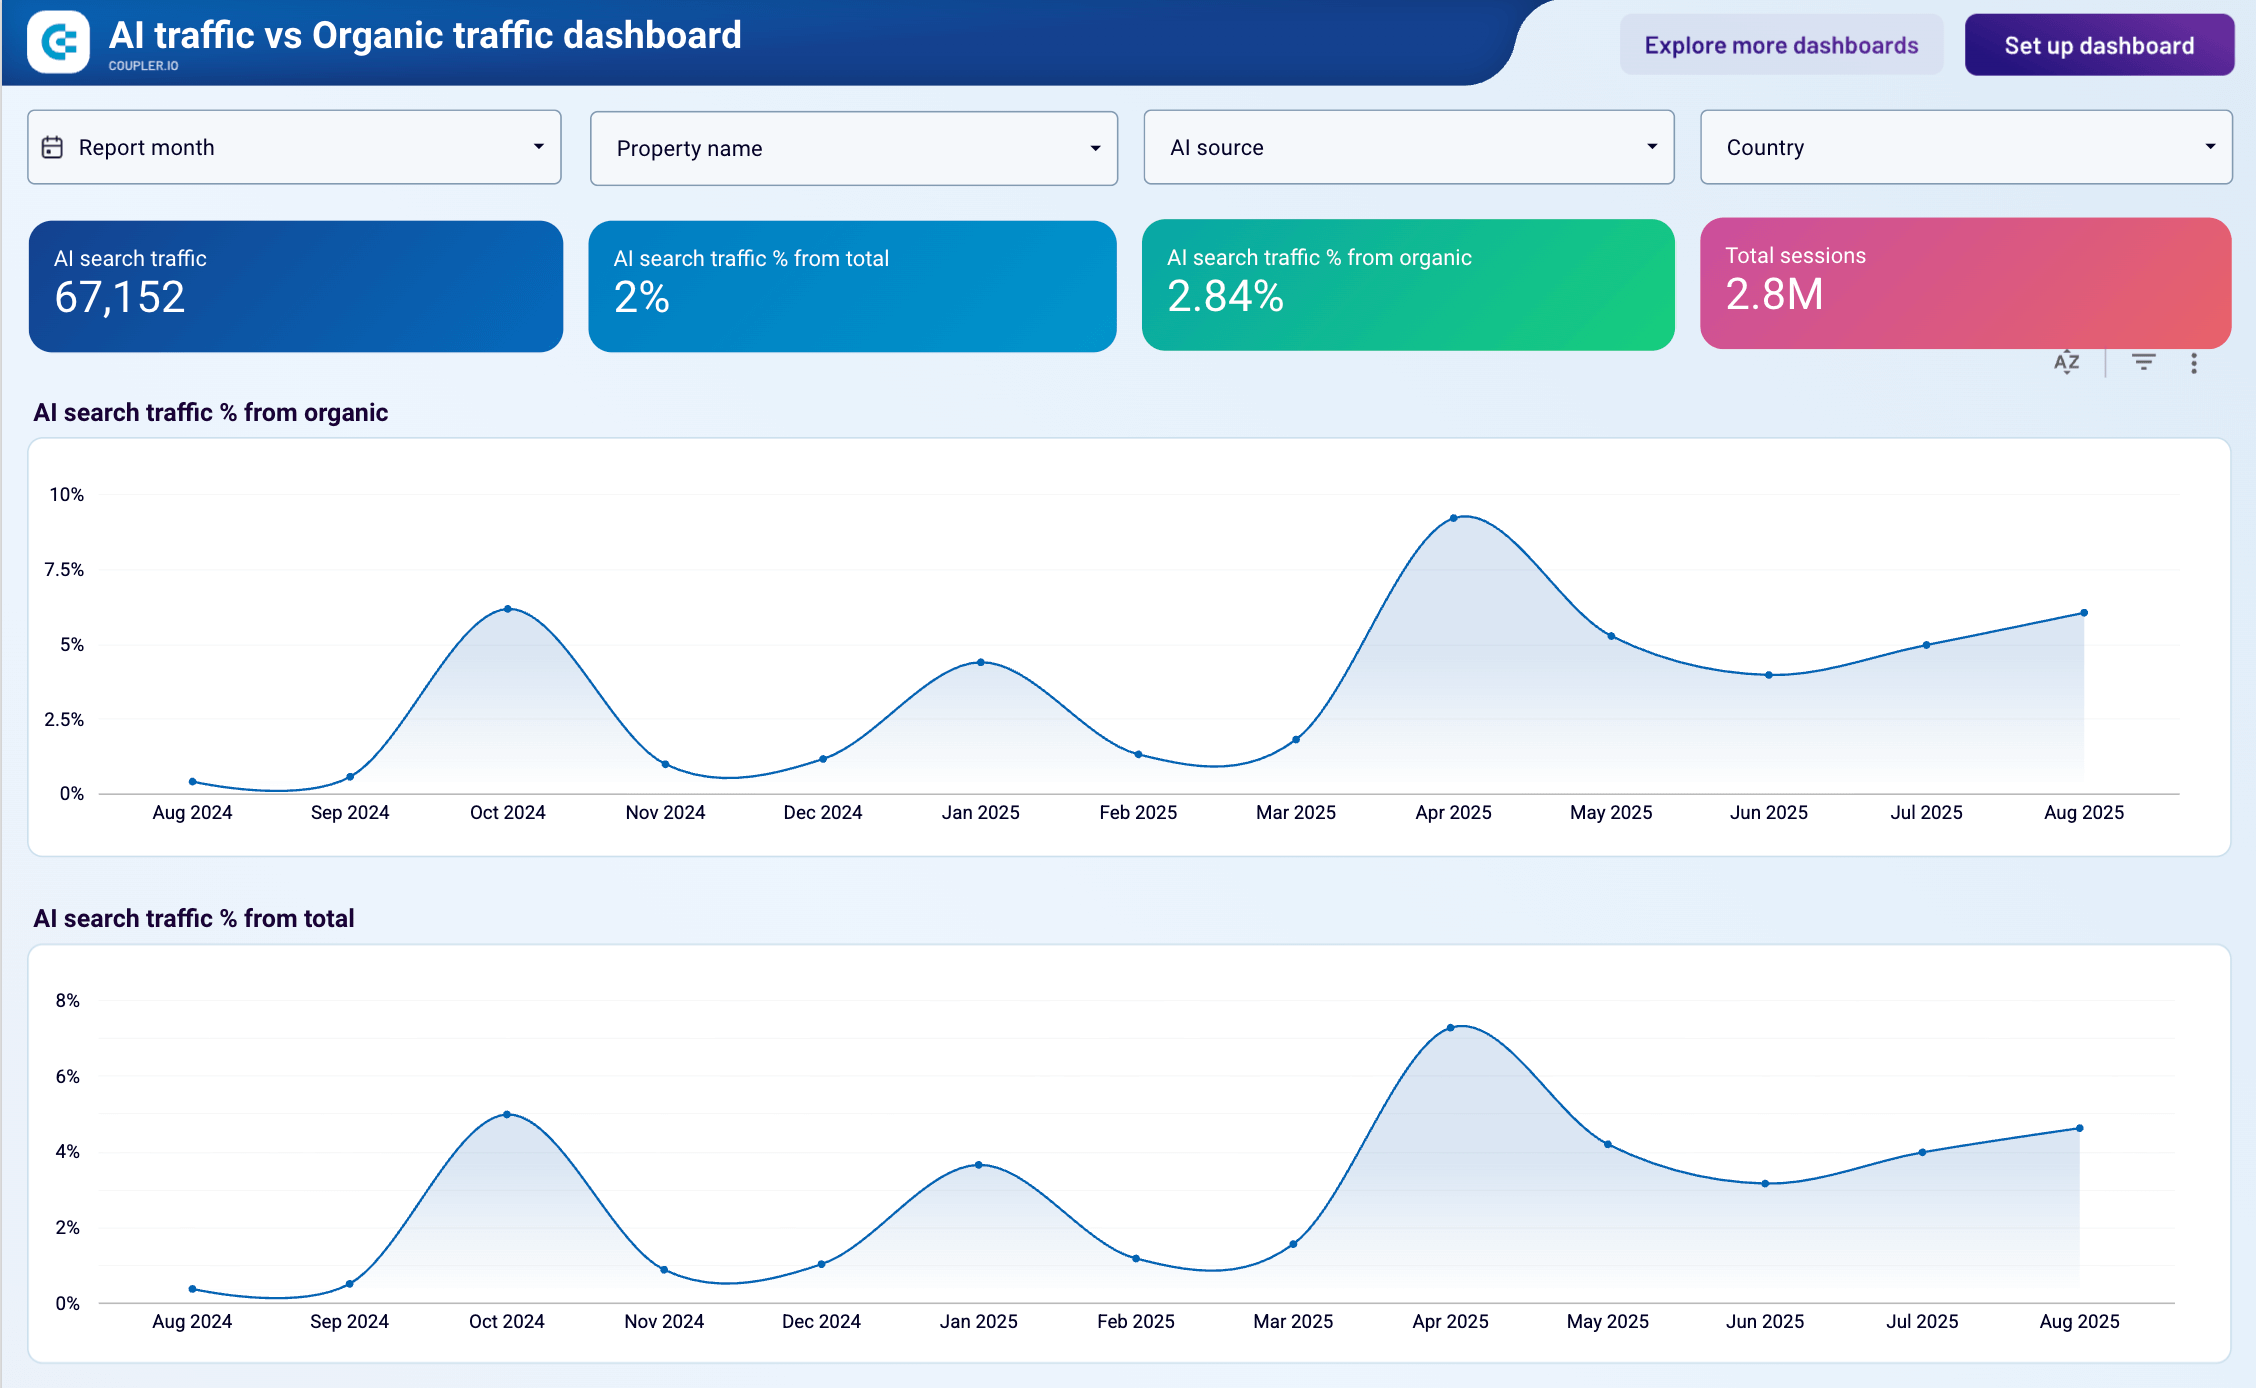
26. AI traffic vs Organic traffic dashboard by Coupler.io
The AI traffic vs Organic traffic dashboard helps marketers understand how AI tools like ChatGPT, Claude, and Perplexity are changing website discovery patterns. This Looker Studio template reveals whether AI-driven traffic converts better than traditional search, which AI platforms send the most valuable visitors, and whether your traffic sources are diversifying beyond Google’s control.
AI traffic vs organic traffic dashboard
 Preview dashboard
AI traffic vs organic traffic dashboard
Preview dashboardAs AI tools reshape information discovery, understanding the quality and conversion rates of AI-referred traffic becomes critical for content strategy. You can determine if AI traffic performs better or worse than organic search visitors, identify which specific AI platforms drive the most traffic, and track whether AI discovery is growing, declining, or plateauing compared to traditional search.
This dashboard is essential for content marketers adapting to emerging traffic sources, SEO professionals who need to understand how AI discovery differs from traditional search optimization, and digital publishers concerned about Google algorithm vulnerability. To use this template, follow the instructions in the Setup guide tab to connect your GA4 account using the built-in Coupler.io connector.
Dashboard metrics:
- Total users
- AI search traffic
- Organic search traffic
- Direct traffic
- Traffic percentages
- AI sources breakdown (ChatGPT, Claude, Perplexity)
- Key events total
- Conversion rates by source
- Monthly trends
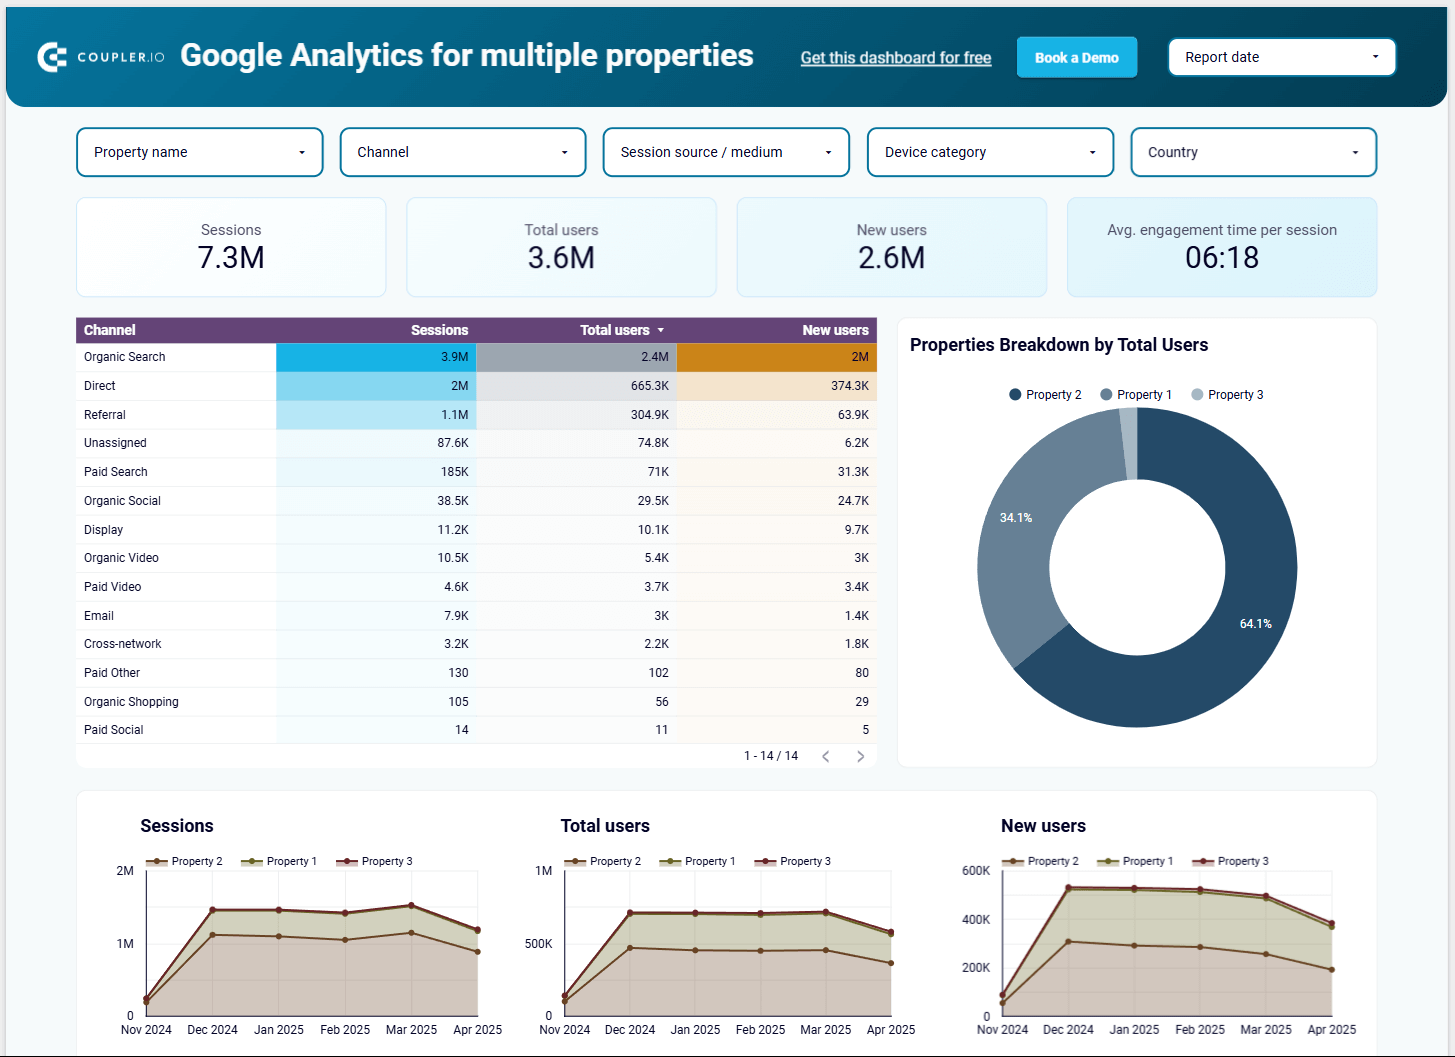
27. GA4 dashboard for multiple properties
The Google Analytics dashboard is perfect for managing multiple websites or apps and tracking the performance of different GA properties in one place.
GA4 dashboard for multiple properties
 Preview dashboard
GA4 dashboard for multiple properties
Preview dashboardIt tracks sessions, users, conversions, and average engagement time. You can analyze the traffic sources to see where users come from.
With this dashboard, it is easy to understand user behavior and engagement metrics to know which channels work best. You can use this template with your own data in minutes by following the steps in the Readme tab.
Dashboard metrics:
- Total users and new users
- Sessions
- Traffic
- Average engagement time per session
28. Digital Analytics Dashboard for eCommerce by Treffsikker
How is your eCommerce performing? Discover with the help of this Looker Studio dashboard. The digital analytics dashboard provides valuable insights into the performance of your online store. Some of the metrics included in the template are Revenue, eCommerce Conversion rate, Transactions, and Sessions.
The dashboard has 4 pages: users, traffic, behavior, and conversions. On each page, you’ll find answers to questions associated with your different marketing activities, for example, how do channels perform, which product is most visited, how are the campaigns performing, etc.
Dashboard metrics:
- Sessions
- Bounce rate
- Conversion rate
- Transactions
- Average order value
- Revenue
29. Google Analytics for Firebase Report by Google
Firebase is a platform that helps you create and grow apps. At the heart of Firebase is Google Analytics, which integrates across Firebase features and provides you with unlimited reporting. This Looker Studio dashboard for Firebase is designed to present some of these reports using the power Looker Studio data visualization.
The dashboard has 4 pages: dashboard, events, users, and conversions. You can easily use this dashboard template for your data since it’s equipped with a built-in native BigQuery connector. Mind that this will only work if you have linked your Firebase project to BigQuery.
Dashboard metrics:
- Active users
- Events
- Conversions
- Users
30. Site Speed Performance Dashboard by DataBloo
Did you know that 40% of visitors will leave a website if it takes longer than three seconds to load? This shows that website performance is not just about how many people visit it but also about how fast it loads and if it has any indexing problems.
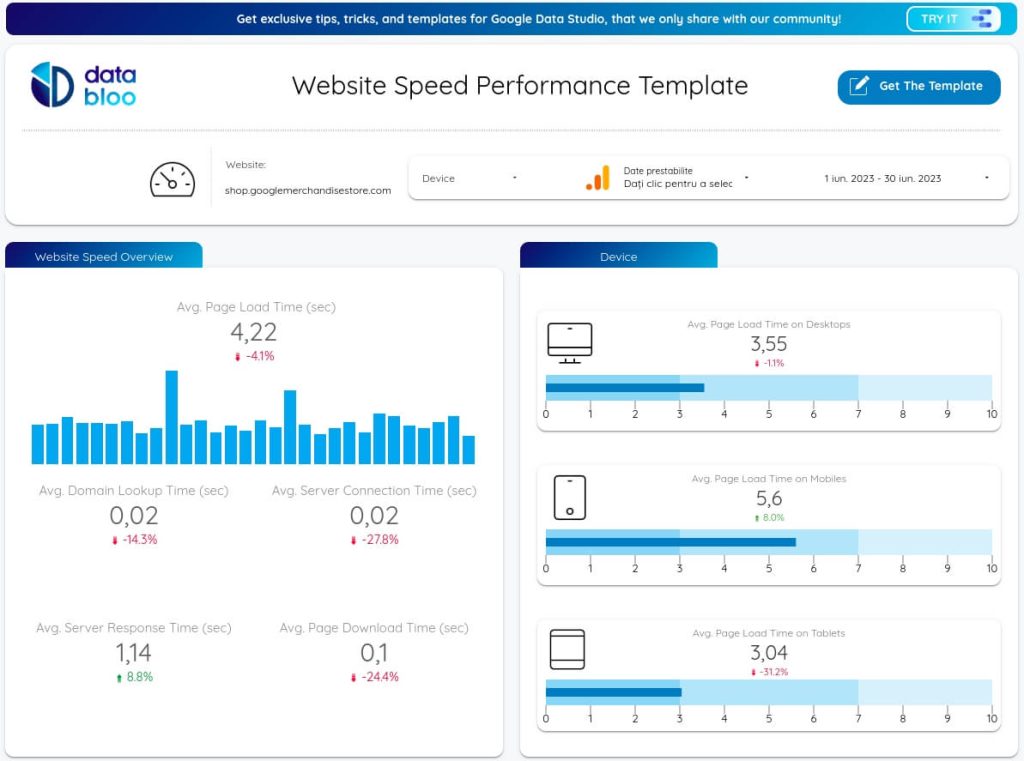
If you want to make sure that your site loads at the speed of light, then you should check out this site speed performance dashboard by Data Bloo. It’s a template, so you can easily reuse it without handling the connection part yourself. It has a connector to Google Analytics which contains all the necessary information for this dashboard.
Dashboard metrics:
- Avg. Page Load Time
- Average Domain Lookup Time
- Avg. Server Connection Time
- Avg. Page Download Time
- Avg. Page Load Time on Mobiles
Marketing funnel dashboards in Looker Studio
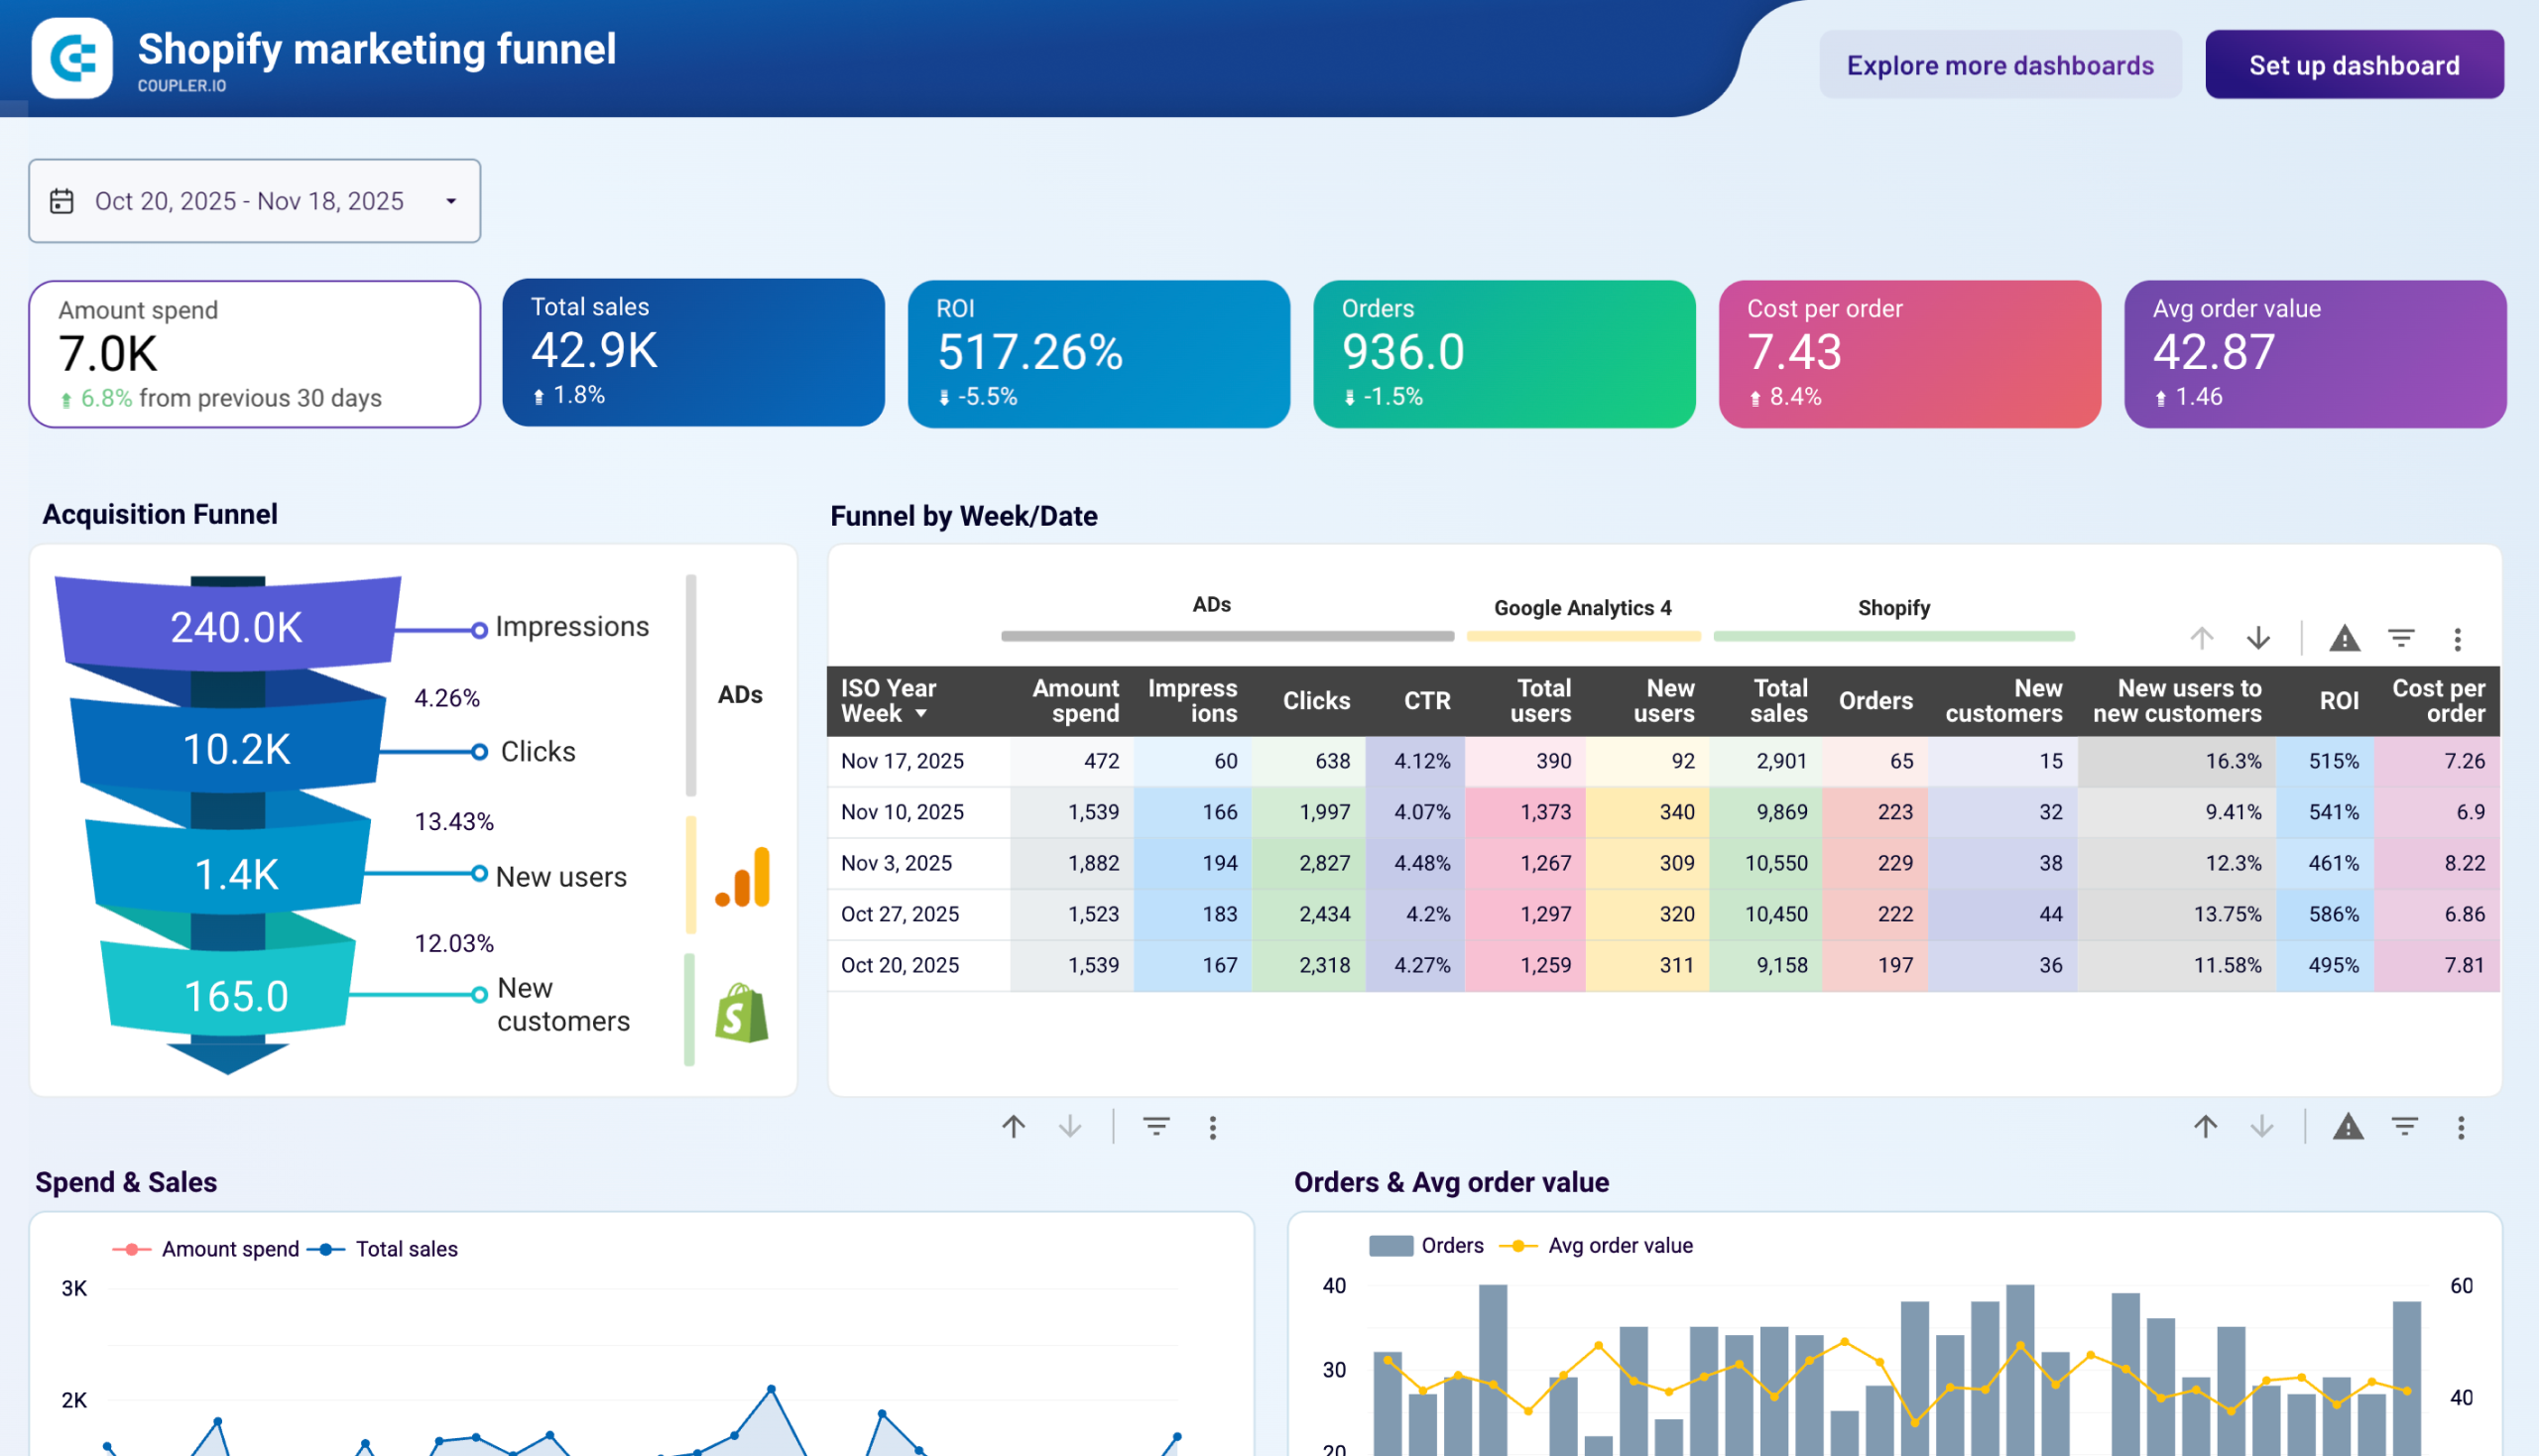
31. Shopify marketing funnel analytics dashboard
The Shopify marketing funnel dashboard tracks your marketing efforts and sales funnel performance. It highlights key metrics like the amount spent, revenue, orders, and ROI. The acquisition funnel intuitively visualizes the journey from ad impressions to new customers.
Shopify marketing funnel analytics dashboard
 Preview dashboard
Shopify marketing funnel analytics dashboard
Preview dashboardThe weekly data for impressions, clicks, total users, and new users helps you understand how ad spending translates into sales. With the insights from this Shopify dashboard, you’ll be able to make data-driven decisions and boost your ecommerce store’s performance.
You can use this template to make a dashboard with your own data. Just follow the instructions to set it up.
Dashboard metrics:
- Amount spend
- Orders
- Revenue
- Cost per order
- ROI
- Avg. order amount
- Impressions
- Clicks
- Conversions
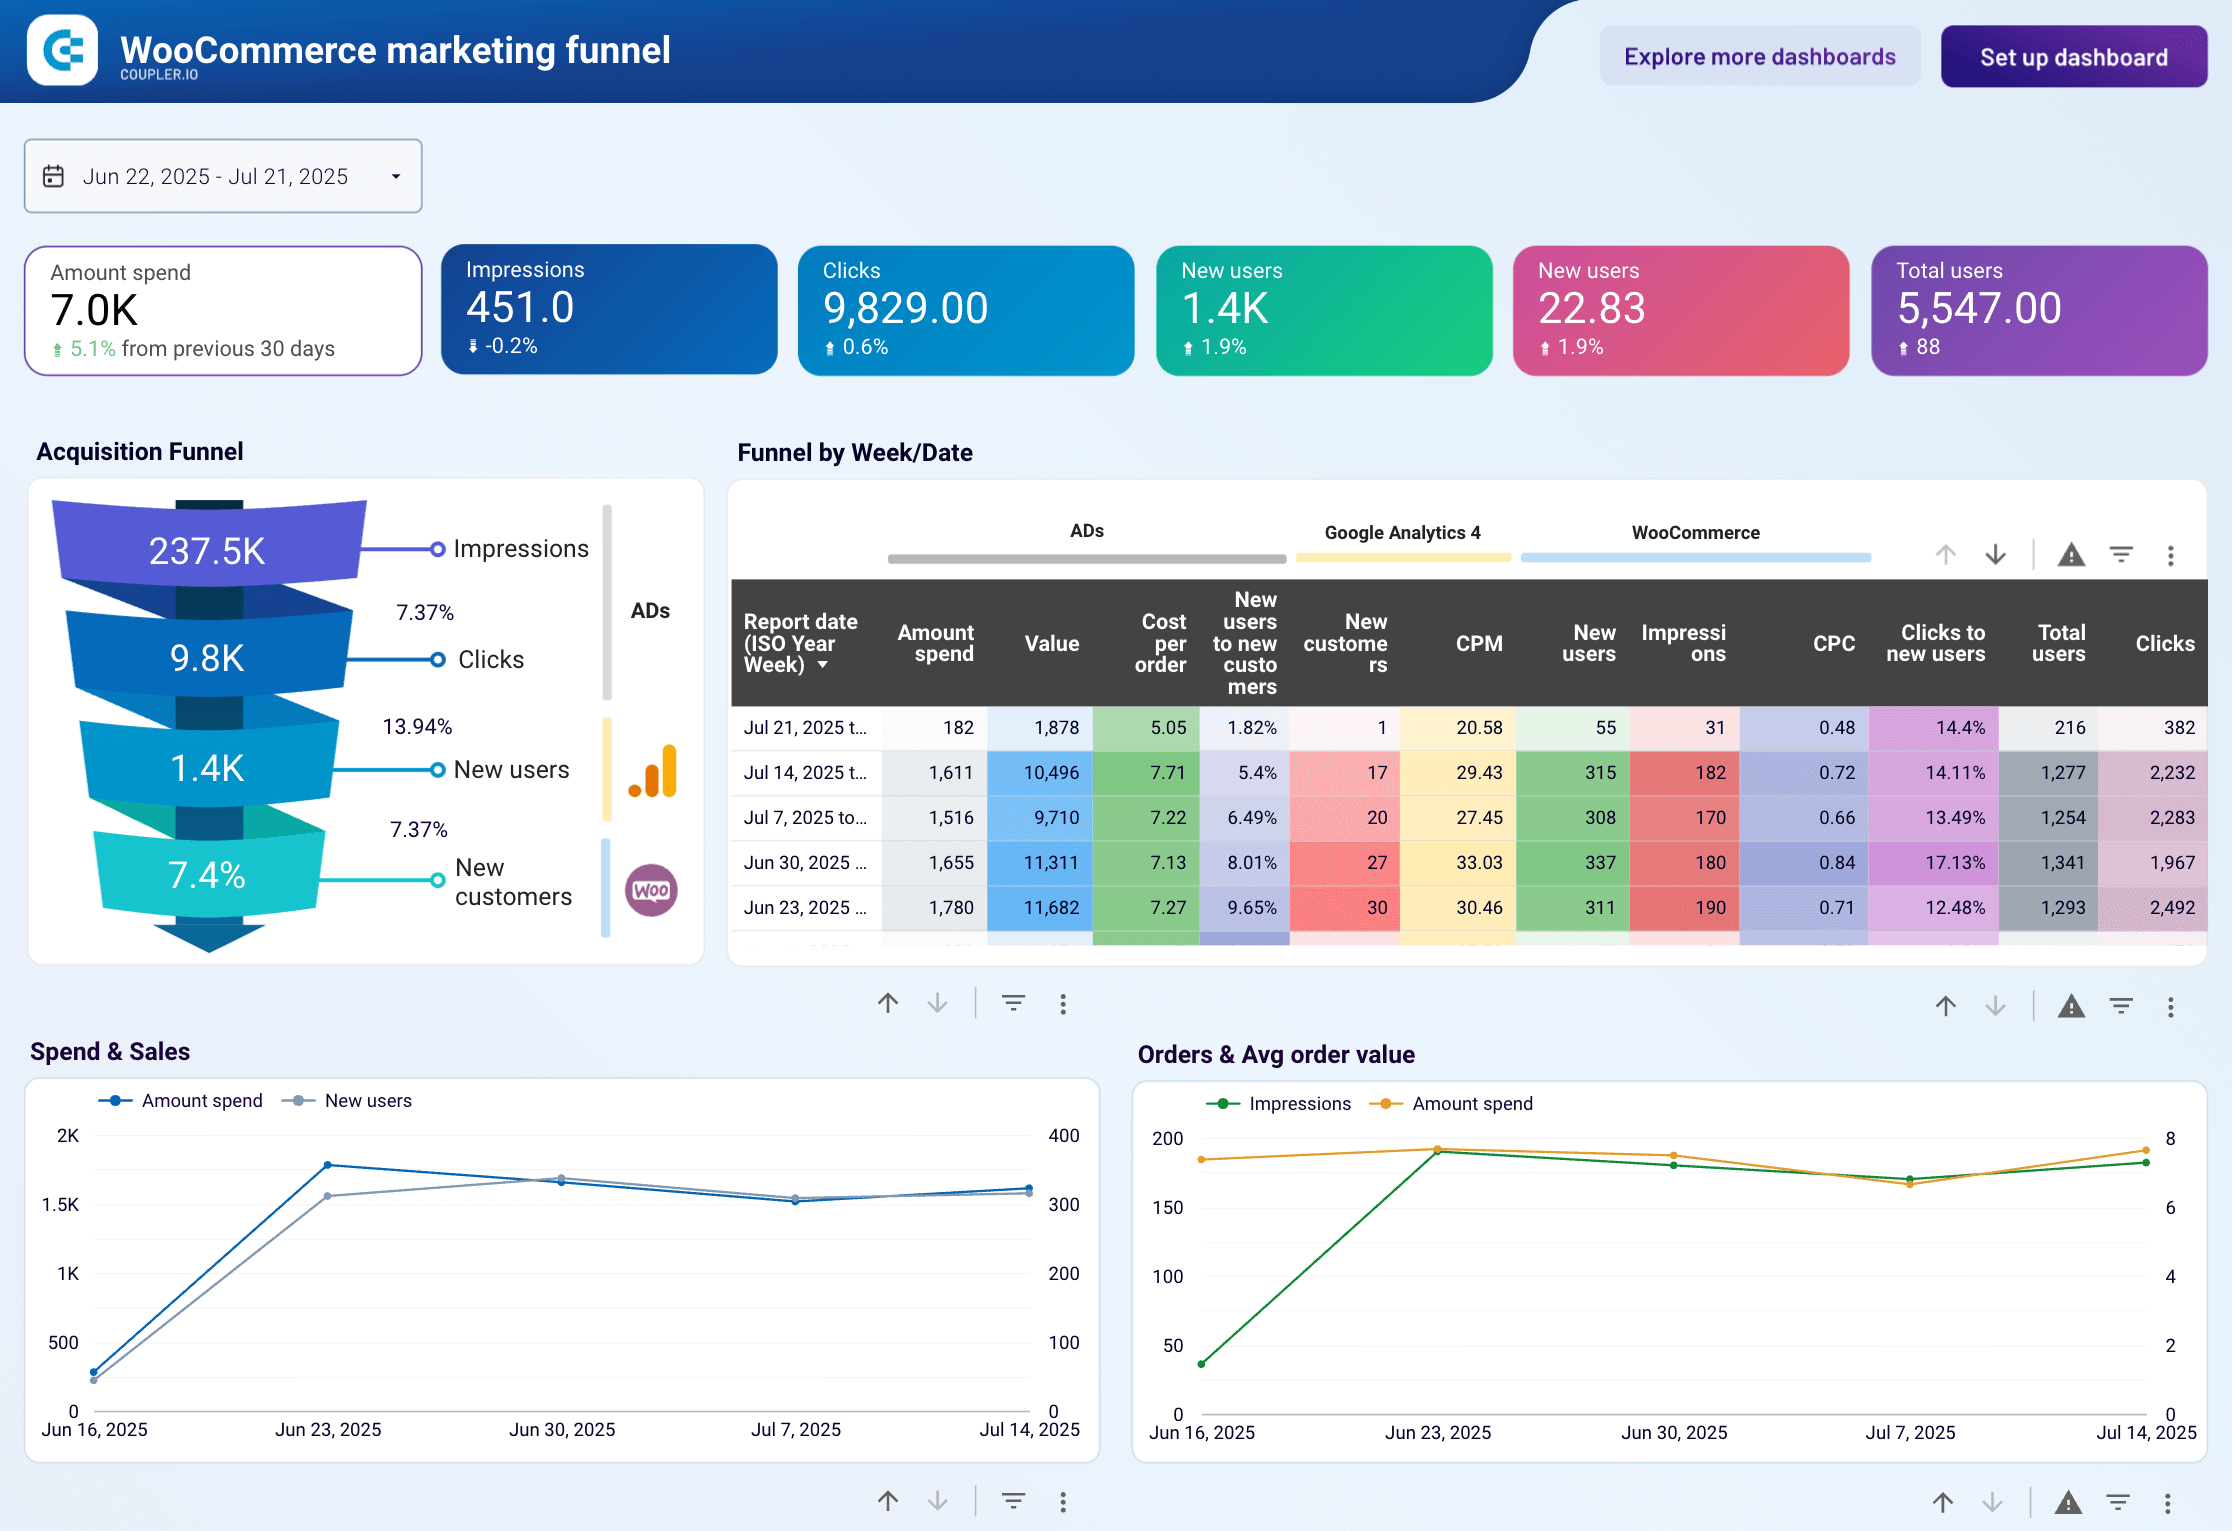
32. Marketing funnel dashboard for WooCommerce by Coupler.io
This WooCommerce marketing funnel dashboard consolidates advertising data from multiple platforms (LinkedIn, Facebook, Google, etc.) with your store’s sales performance to visualize the complete customer journey from ad impression to purchase. You can monitor weekly breakdowns of spend, traffic, orders, and new customer acquisition while analyzing correlations between advertising investment and sales revenue.
WooCommerce marketing funnel dashboard
 Preview dashboard
WooCommerce marketing funnel dashboard
Preview dashboardThe dashboard provides insights to help you optimize budget allocation, identify high-value customer sources, and fix time-sensitive bottlenecks in your conversion funnel. A template is available in Looker Studio with a Coupler.io account.
Dashboard metrics:
- Amount spent
- Impressions
- Clicks
- New users
- New customers
- Total users
- Orders
- Sales
- & more
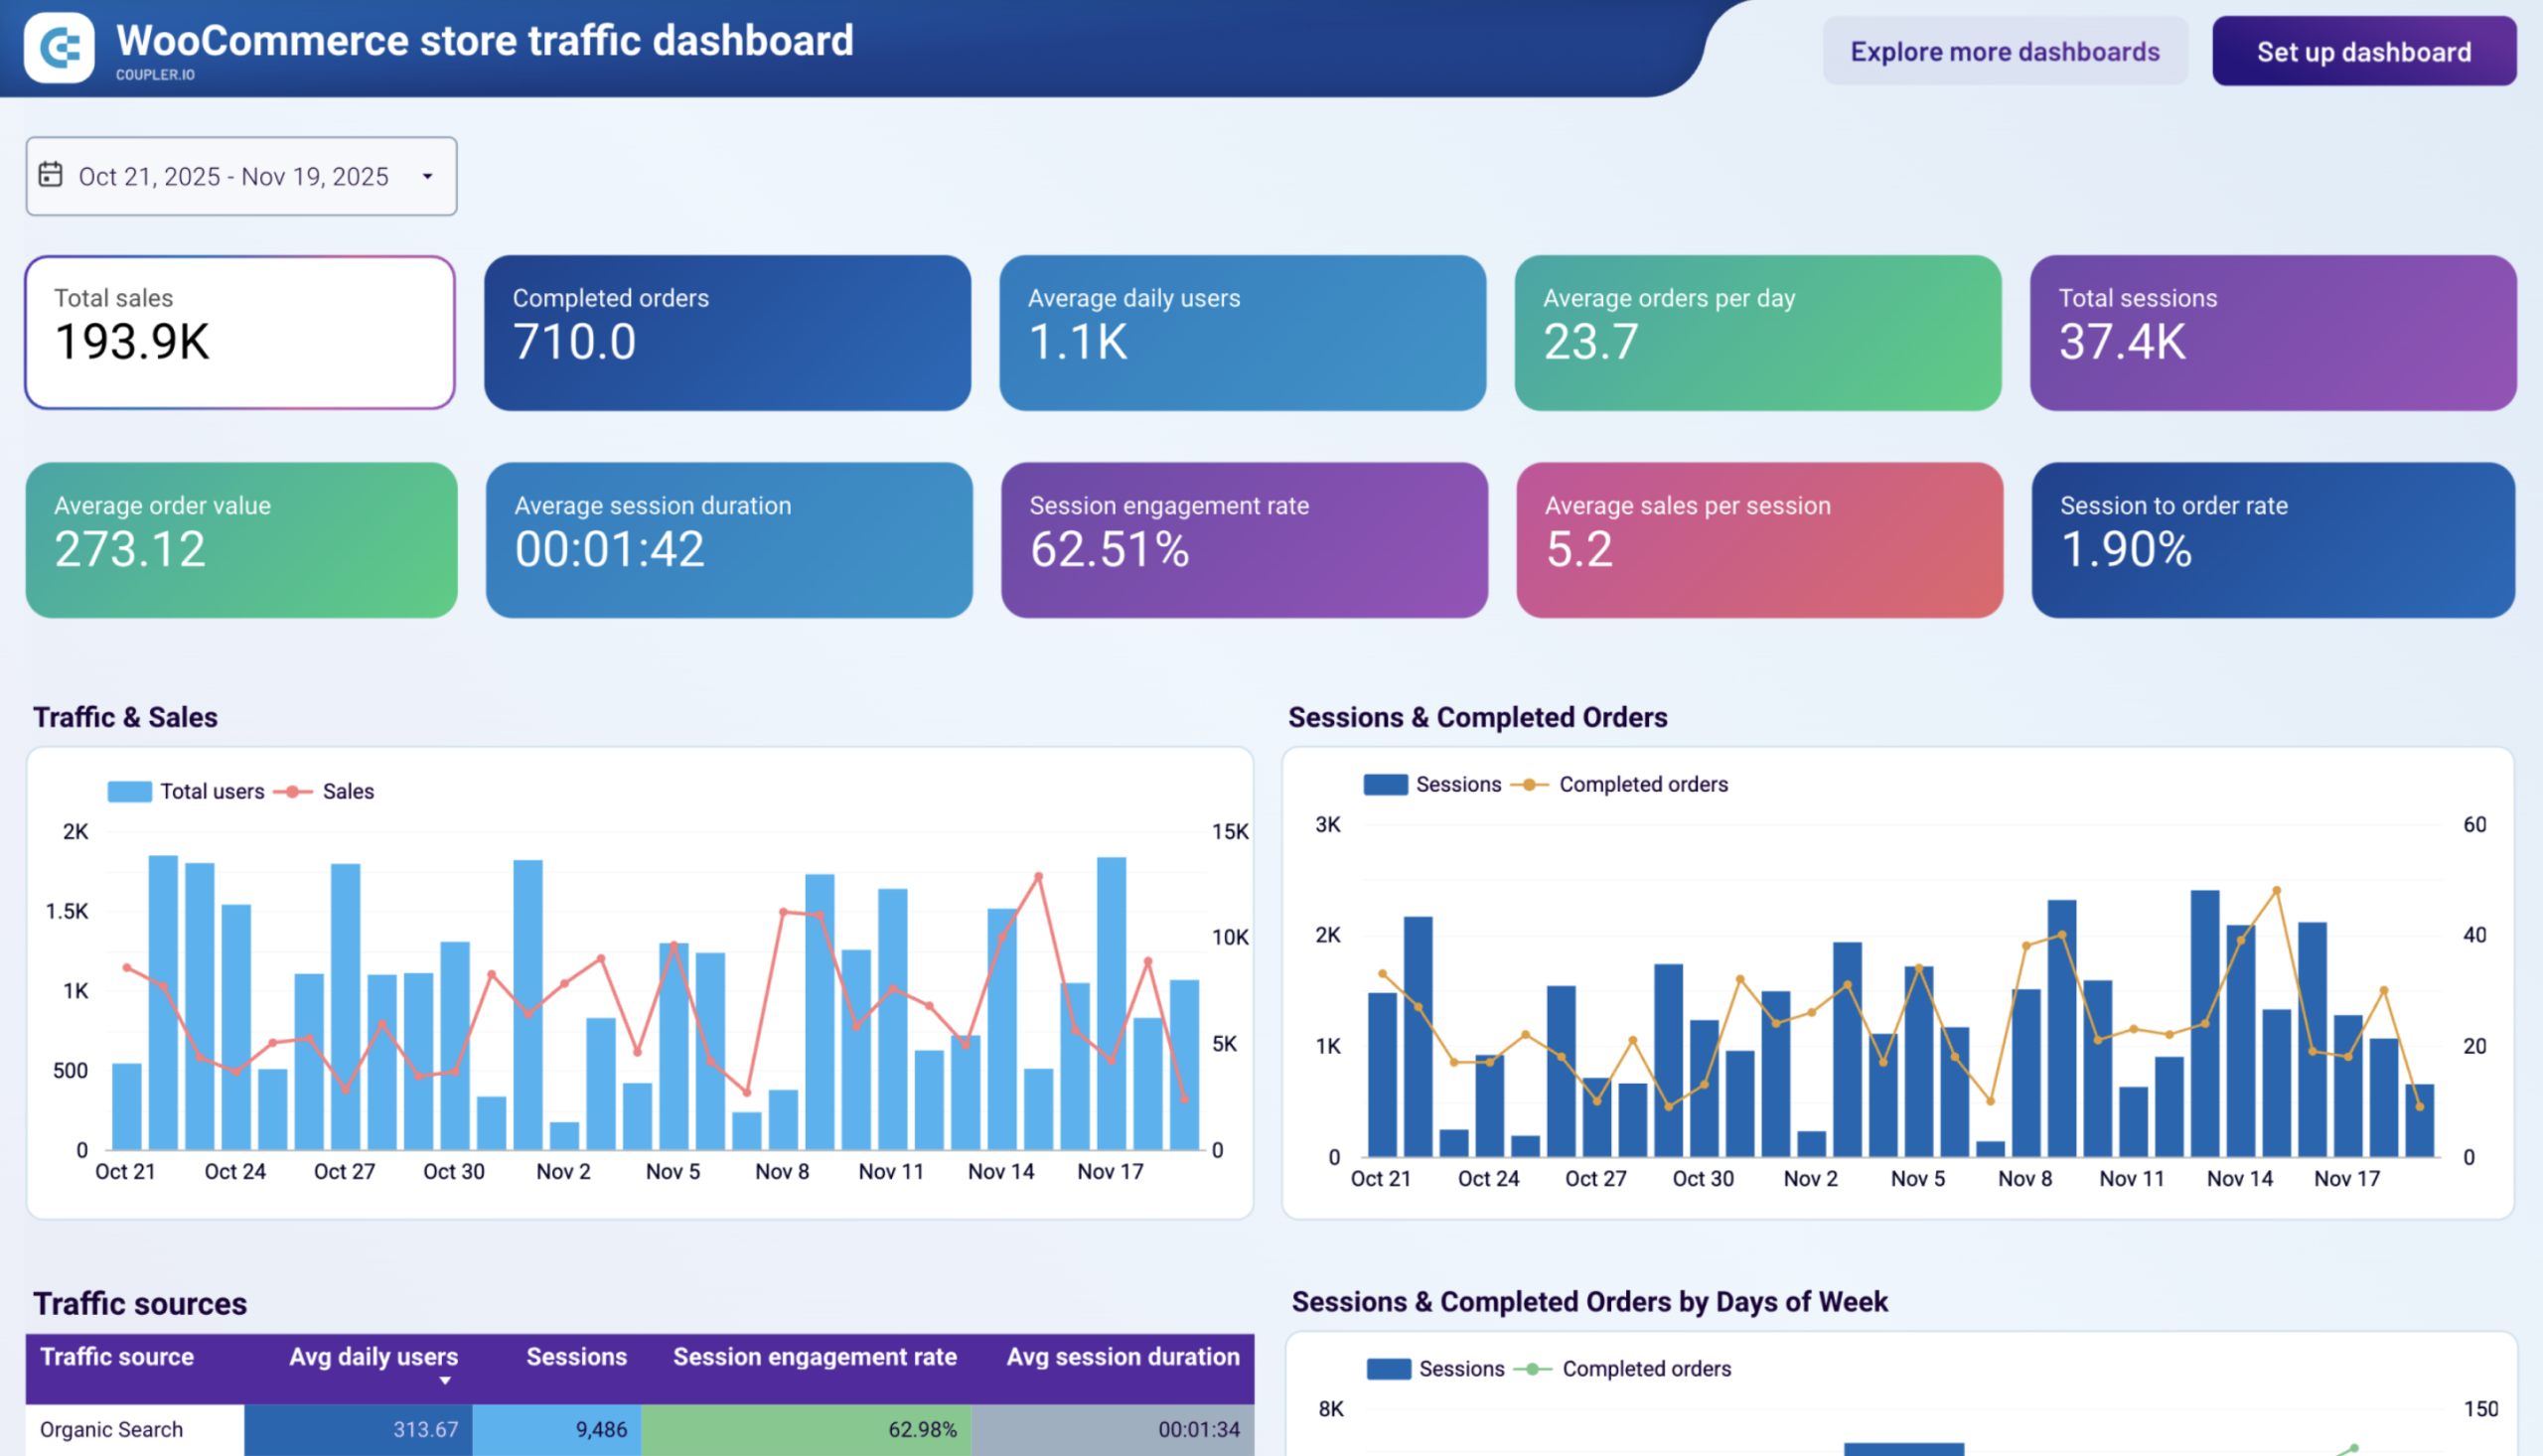
33. Store traffic dashboard for WooCommerce by Coupler.io
The dashboard shows how ad spend drives traffic into your store. This dashboard shows what that traffic does once it arrives. It combines Google Analytics 4 session data with WooCommerce sales records in a single Looker Studio report, letting you evaluate which acquisition channels, geographic markets, and days of the week actually produce completed orders.
WooCommerce store traffic dashboard
 Preview dashboard
WooCommerce store traffic dashboard
Preview dashboardThe channel-level breakdown is the most actionable part of the template. Rather than showing traffic volume alone, the traffic sources table includes session engagement rate, average session duration, and session-to-order rate side by side. This makes it possible to distinguish channels that send browsers from channels that send buyers, and adjust budget allocation accordingly.
The dashboard is a free Looker Studio template with the Coupler.io connector built in.
Dashboard metrics:
- Total sales
- Completed orders
- Average daily users
- Total sessions
- Average order value
- Average orders per day
- Session engagement rate
- Average session duration
- Session-to-order rate
- Average sales per session
34. Orders dashboard for WooCommerce by Coupler.io
Where the traffic dashboard tracks how visitors become buyers, this one tracks what happens to those buyers afterward. The WooCommerce orders dashboard pulls order data directly from WooCommerce into Looker Studio to give store owners and operations teams a clear read on fulfillment performance, customer purchase behavior, and geographic revenue distribution in a single automated report.
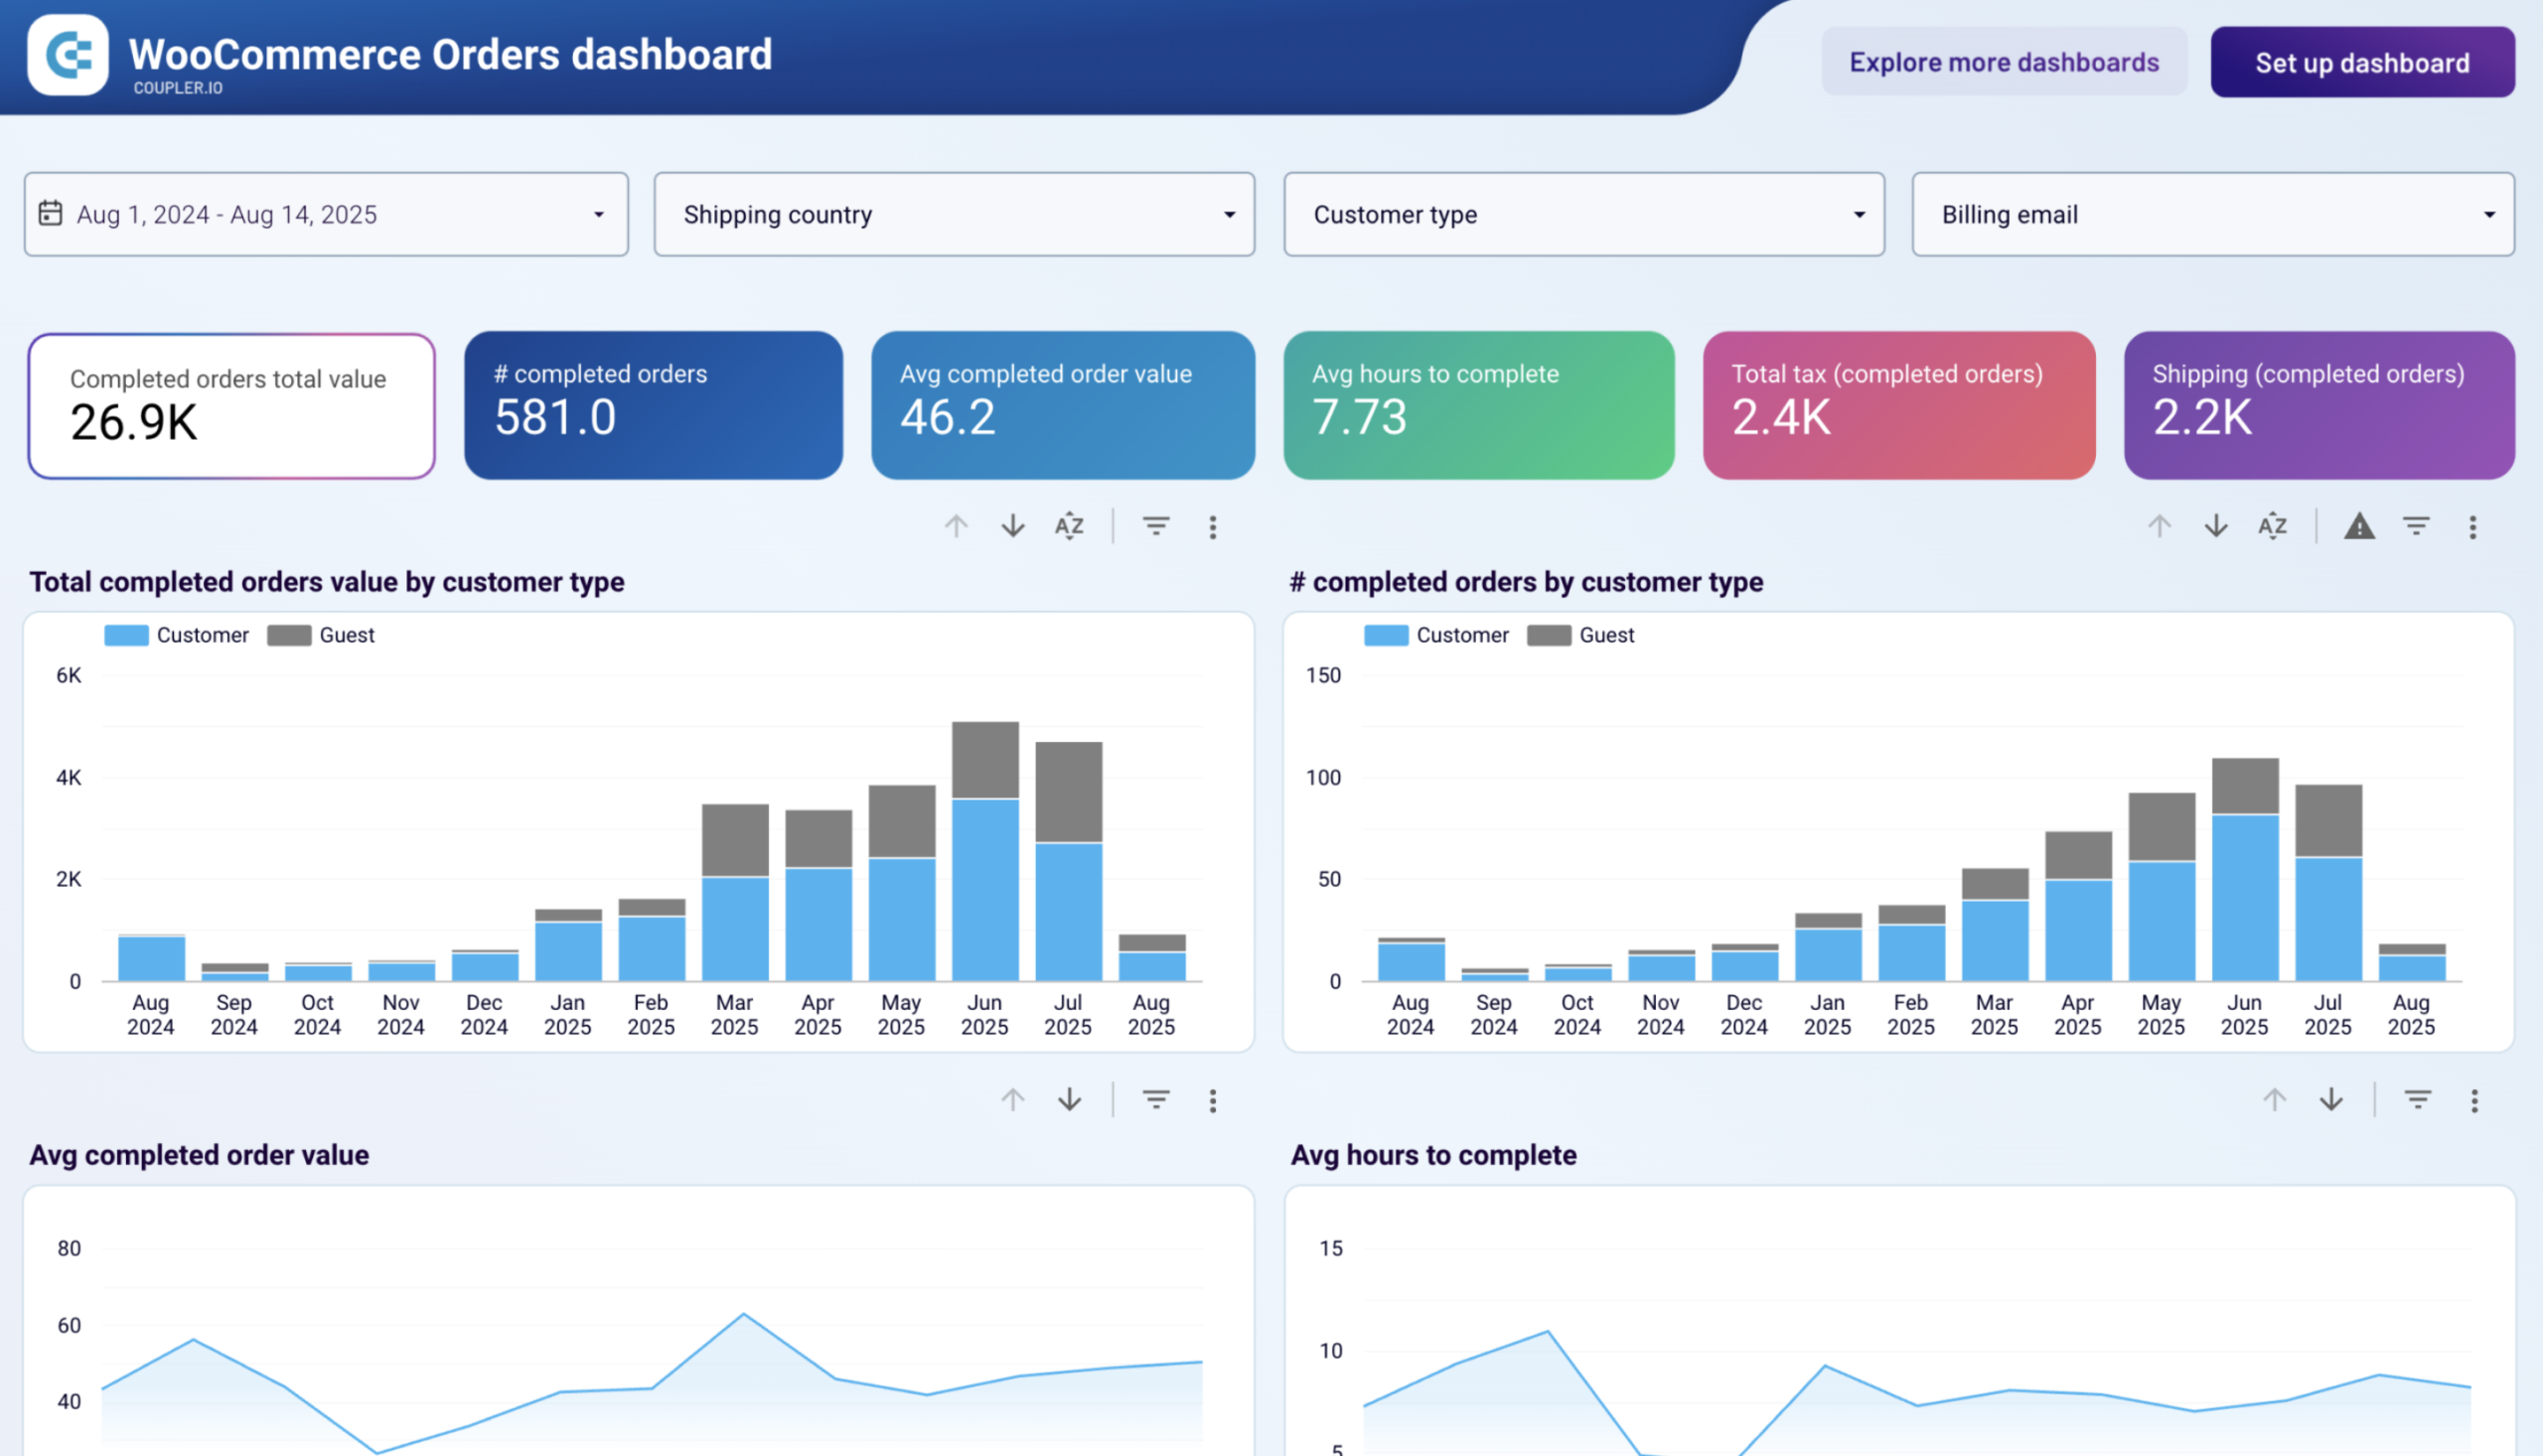
The average hours to complete trend chart is the dashboard’s most operationally useful view. It tracks how fulfillment time shifts over time, making it easy to spot slowdowns and determine whether they correlate with order volume spikes or something structural in the workflow. For marketing teams, this matters because campaign-driven traffic surges can expose fulfillment bottlenecks that damage customer experience and repeat purchase rates.
The template is free and uses the built-in Coupler.io connector. Connect your WooCommerce account, configure your refresh schedule, and the dashboard populates automatically.
Dashboard metrics:
- Completed orders total value
- Number of completed orders
- Average completed order value
- Average hours to complete
- Order status distribution (completed, pending, on-hold, refunded)
- Total shipping on completed orders
- Total tax on completed orders
35. Customer acquisition dashboard for Pipedrive by Coupler.io
The Pipedrive customer acquisition dashboard tracks your marketing funnel from ad impressions to new leads. It shows key metrics like cost per lead, impressions, clicks, and new users.
Customer acquisition dashboard for Pipedrive
 Preview dashboard
Customer acquisition dashboard for Pipedrive
Preview dashboardThe monthly data table for impressions, clicks, total users, and new users shows how advertising efforts translate into new leads.
The trends in ad spend, conversion rates, and cost per lead help to keep the budget in line with performance. This dashboard is useful to make data-driven decisions, boost customer acquisition efforts, and improve ROI.
If Pipedrive is your go-to sales and CRM tool, then use this dashboard template with your data in minutes.
Dashboard metrics:
- CPM
- CPC
- Amount spend
- Cost per lead
- CTR
- Impressions
- Clicks
- Leads
36. HubSpot customer acquisition dashboard
The HubSpot customer acquisition dashboard helps you track and analyze your customer acquisition process using the HubSpot data. You can see how much you spend and the cost per lead, SQL, and customer.
Customer acquisition dashboard for HubSpot
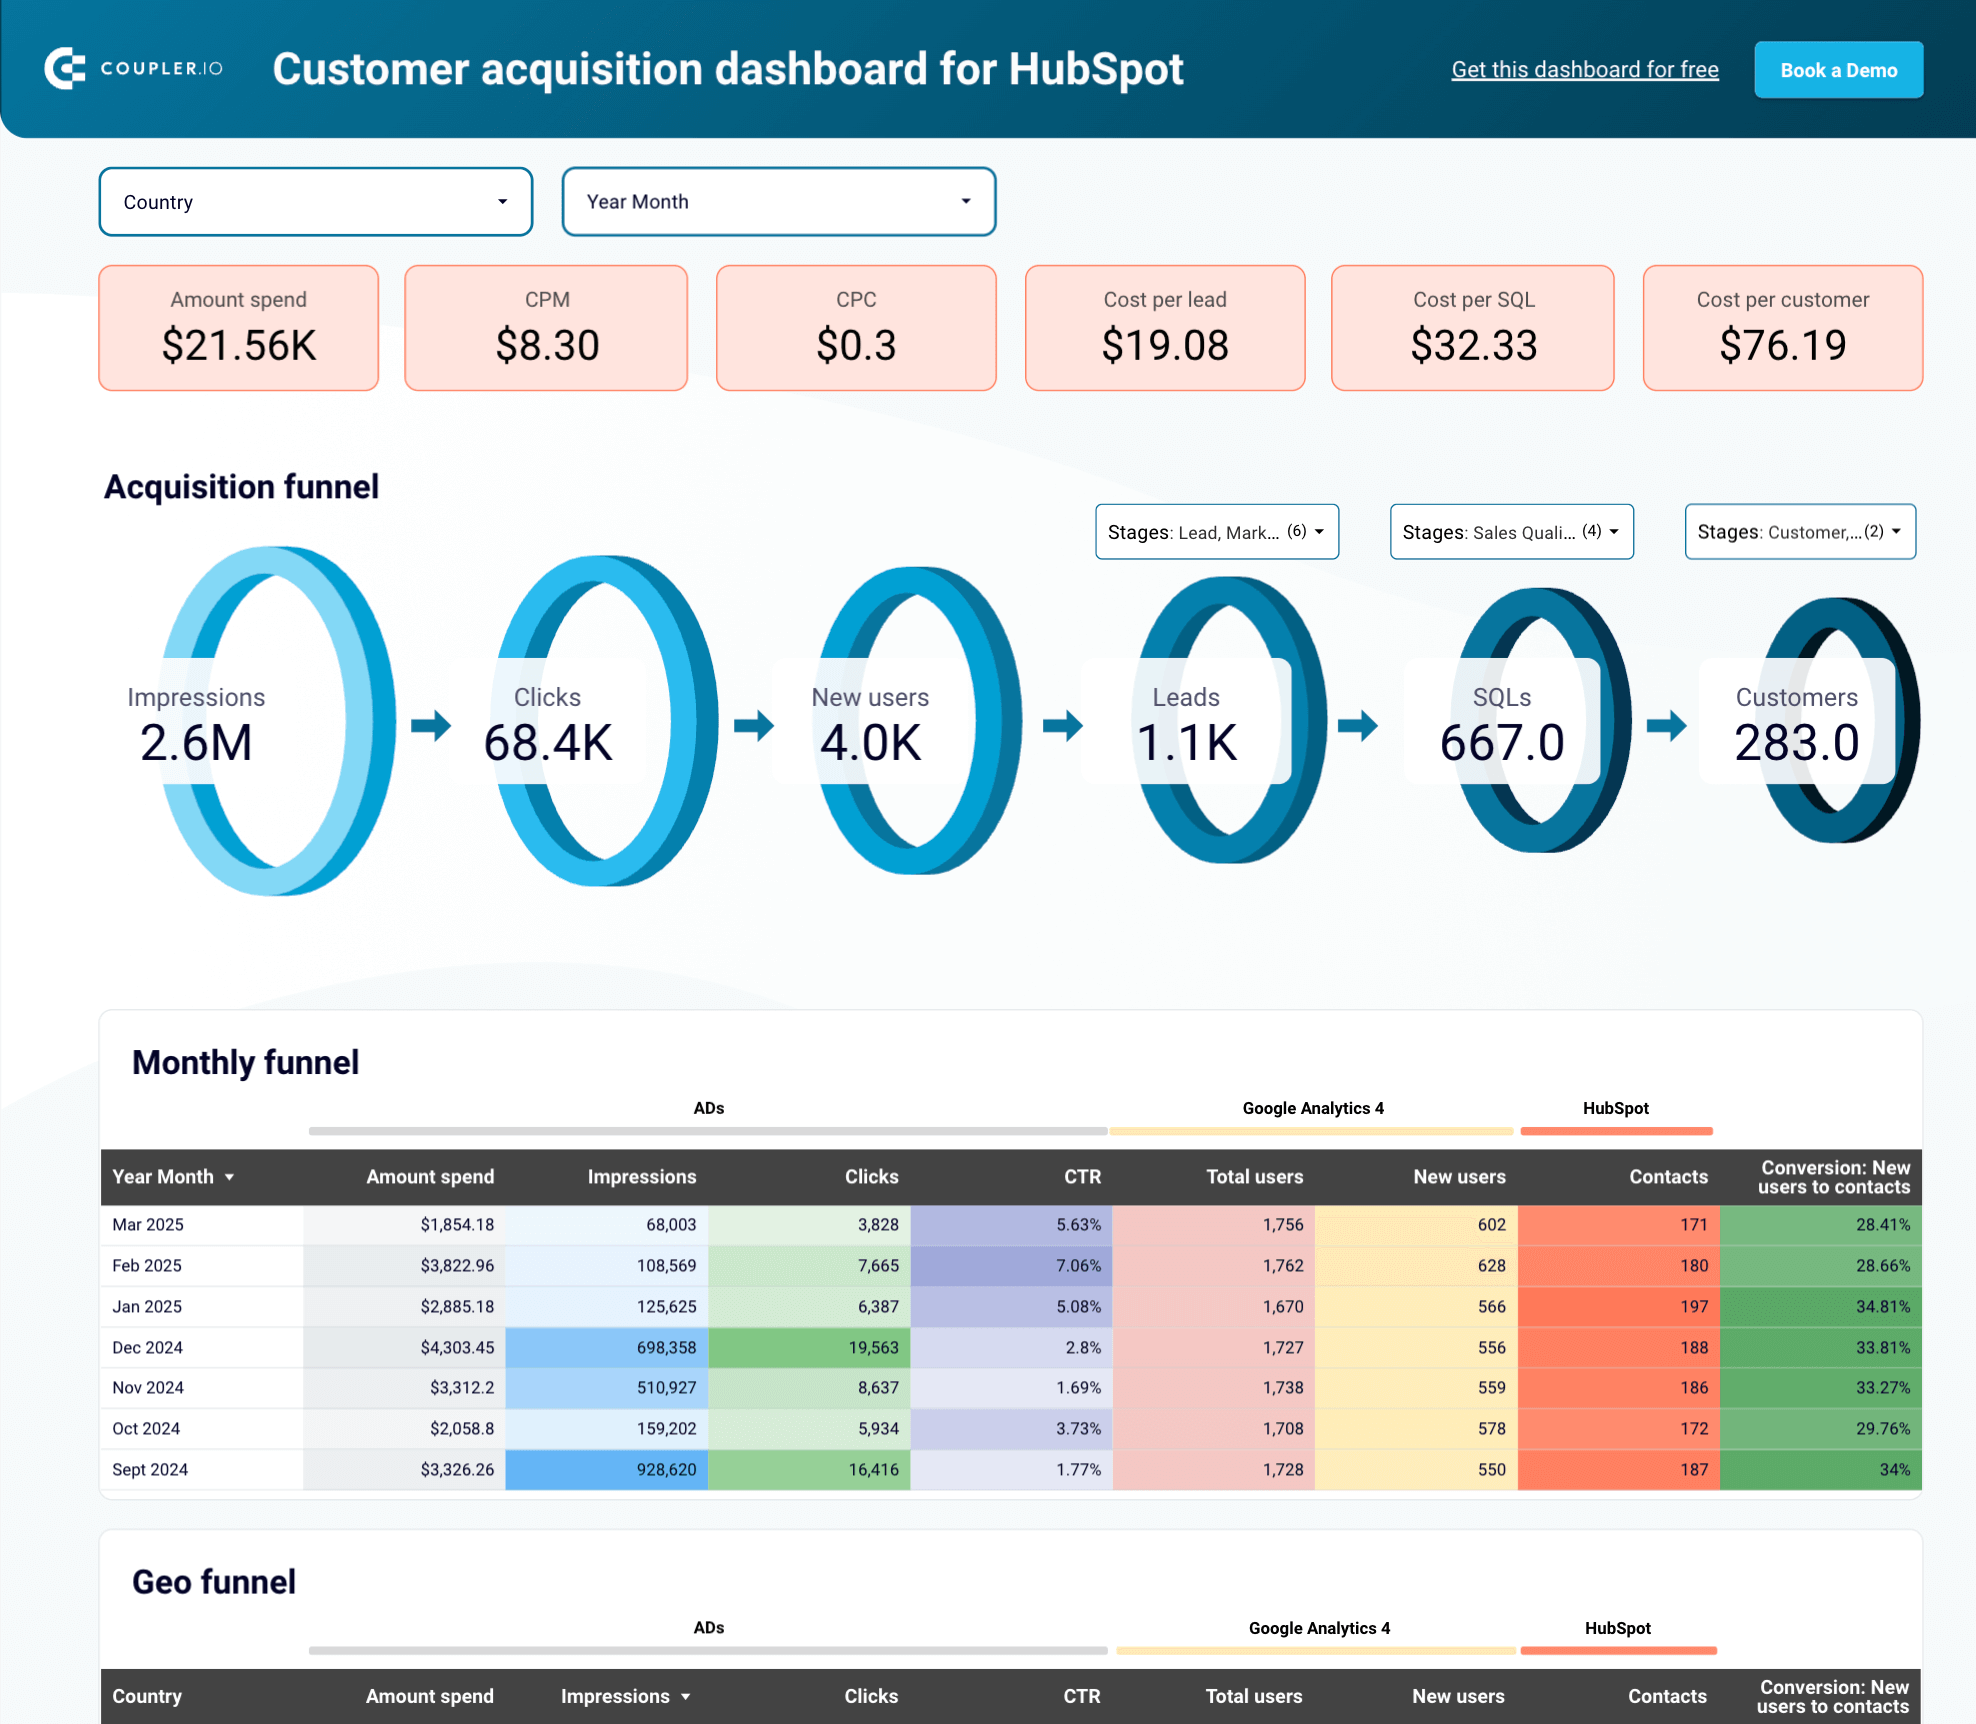 Preview dashboard
Customer acquisition dashboard for HubSpot
Preview dashboardIt displays key metrics like impressions, clicks, new users, leads, SQLs, and customers. The monthly and geographic data show you where your efforts are most effective. This dashboard is ideal for understanding your marketing performance, optimizing sales processes, and improving ROI.
Use this dashboard template with your own data by following the simple steps in the Readme tab.
Dashboard metrics:
- CPM
- CPC
- Amount spend
- Cost per lead
- Cost per SQL
- CTR
- Impressions
- Clicks
- Leads
- Conversions
37. GoHighLevel customer acquisition dashboard by Coupler.io
This dashboard is designed for GoHighLevel users who run ads on multiple platforms (e.g., Bing, LinkedIn, Pinterest). It combines CRM, GA4, and advertising performance data to reveal the efficiency of your customer acquisition funnel.
GoHighLevel customer acquisition dashboard
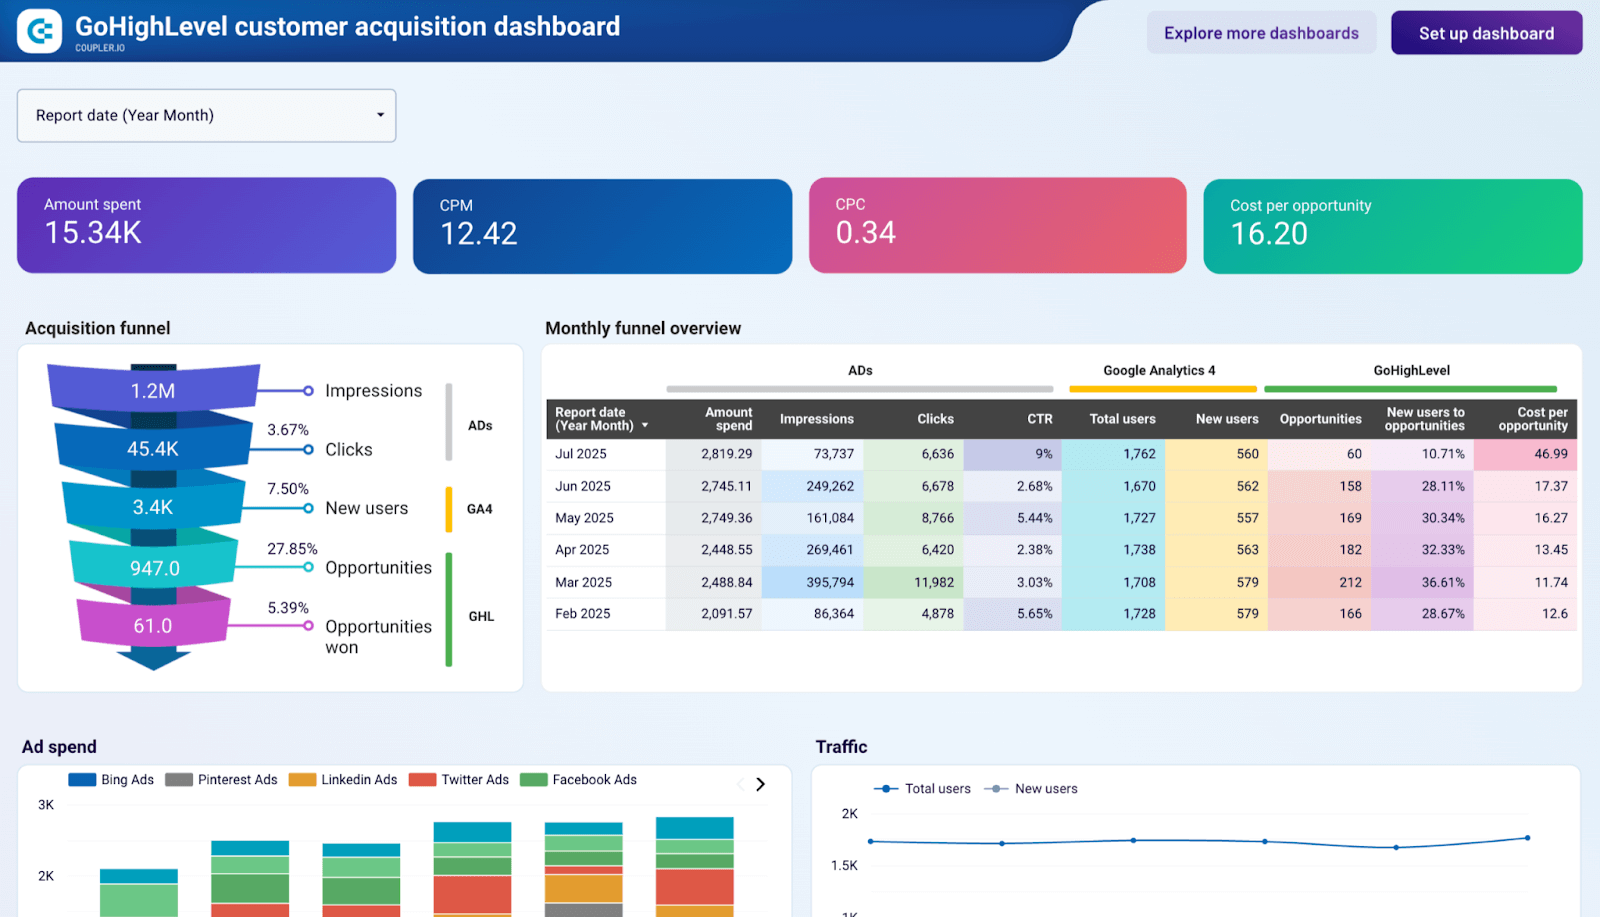 Preview dashboard
GoHighLevel customer acquisition dashboard
Preview dashboardYou can monitor conversion rates from new users to opportunities, track seasonal performance patterns, and analyze the relationship between advertising investment and opportunity generation. The insights can help you optimize budget distribution across channels and improve conversion rates at every funnel stage.
To access this dashboard template in Looker Studio, sign up for a free Coupler.io account. You’ll be able to sync data from all your platforms and automate data refreshes in under 5 minutes.
Dashboard metrics:
- CPM
- CPC
- Amount spend
- Cost per lead
- Cost per SQL
- CTR
- Impressions
- Clicks
- Leads
- Conversions
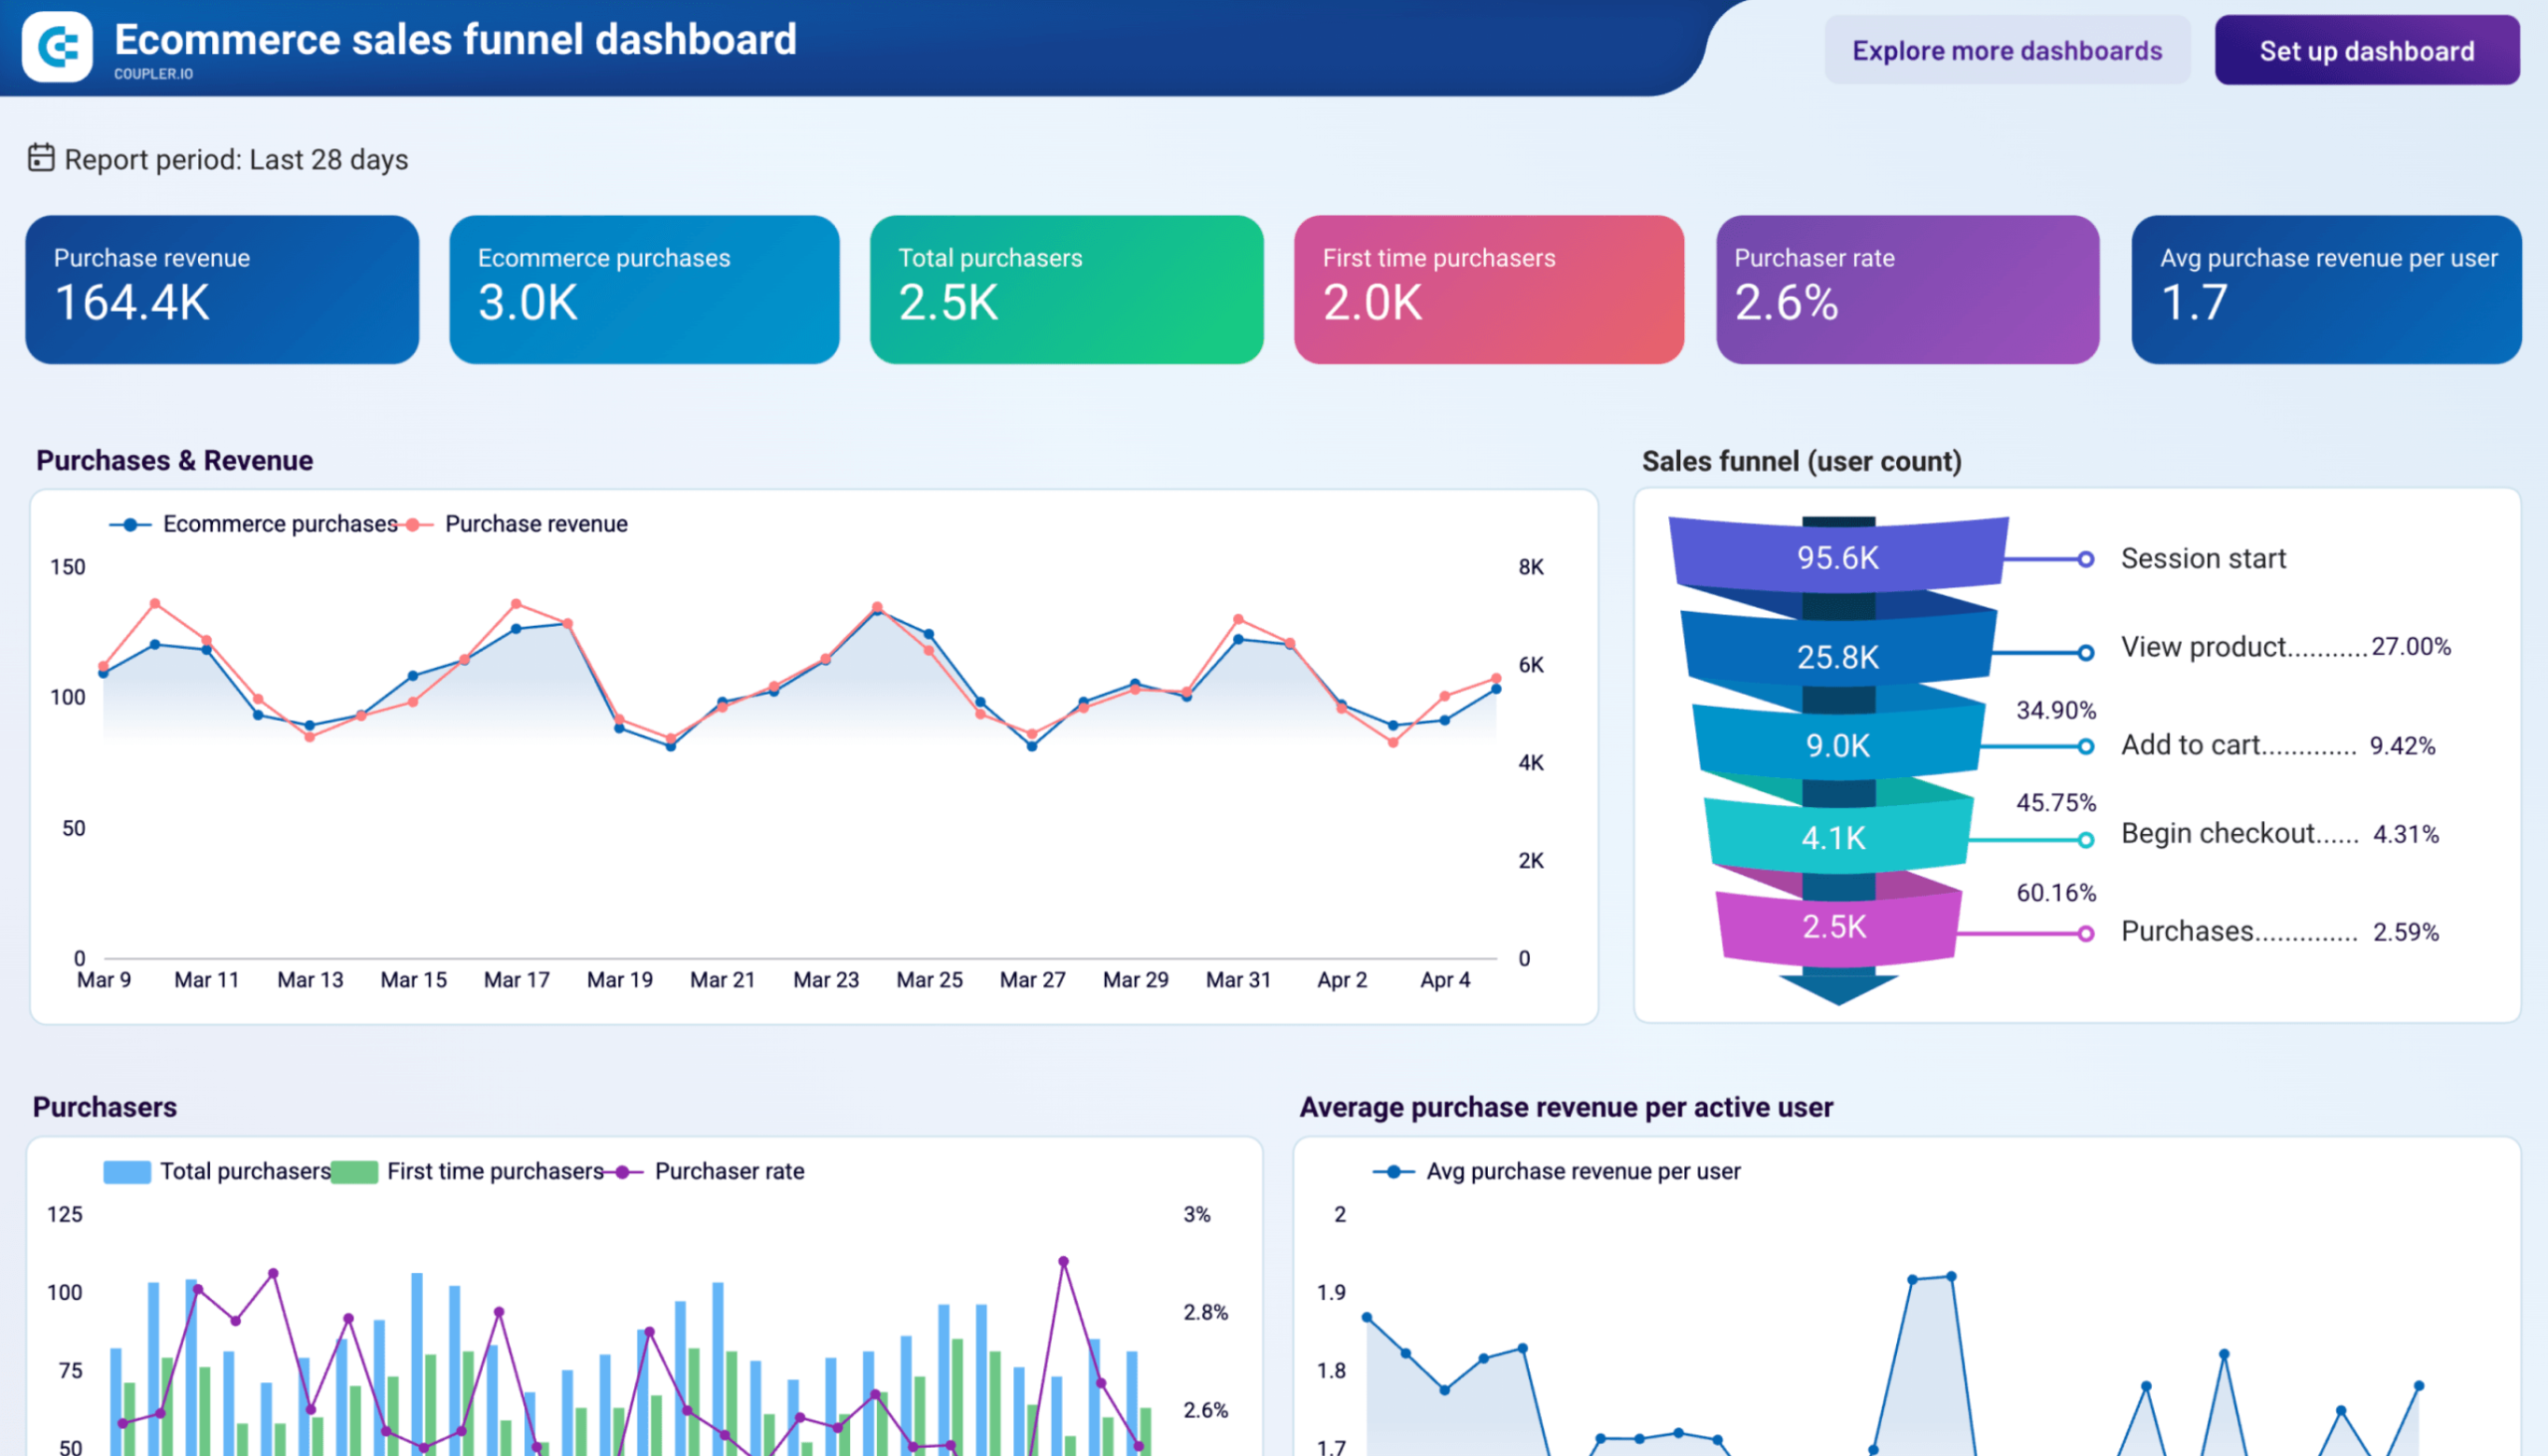
38. Ecommerce sales funnel dashboard for GA4 by Coupler.io
Most funnel dashboards show you traffic numbers. This one shows you where revenue is being lost. The GA4 ecommerce sales funnel dashboard by Coupler.io maps the full purchase path (from session start through product view, add to cart, begin checkout, and purchase). It’s built for ecommerce teams that need to move beyond aggregate traffic data and pinpoint exactly which funnel stage costs the most in missed revenue.
GA4 ecommerce sales funnel dashboard
 Preview dashboard
GA4 ecommerce sales funnel dashboard
Preview dashboardThe dashboard covers four tabs: an overall funnel overview, sales by country, sales by device, and sales by individual product. Each tab applies the same set of metrics (purchase revenue, purchaser rate, first-time purchasers, total purchasers, and ARPU) to a different dimension. This means you can identify a checkout drop-off at the aggregate level and then immediately check whether it’s a mobile UX issue, a market-specific problem, or isolated to particular products.
The overview tab also tracks new users by acquisition channel alongside the funnel, connecting traffic sources to conversion outcomes. If a channel drives volume but produces a low purchaser rate, that gap shows up directly. The dashboard is powered by Coupler.io, which connects to your GA4 account and refreshes data on a schedule.
Dashboard metrics:
- Purchase revenue
- Ecommerce purchases
- Total purchasers
- First-time purchasers
- Purchaser rate
- Average purchase revenue per user (ARPU)
- Step-to-step funnel conversion rates (session start → product view → add to cart → begin checkout → purchase)
- New users by acquisition channel
Email marketing dashboards in Looker Studio
39. Mailchimp analytics dashboard by Coupler.io
The Mailchimp analytics dashboard provides comprehensive email campaign analysis to help you identify exactly why campaigns succeed or fail. Instead of jumping between multiple Mailchimp reports, you get all key metrics in one place, making it easier to understand your audience behavior, optimize send strategies, and improve campaign effectiveness.
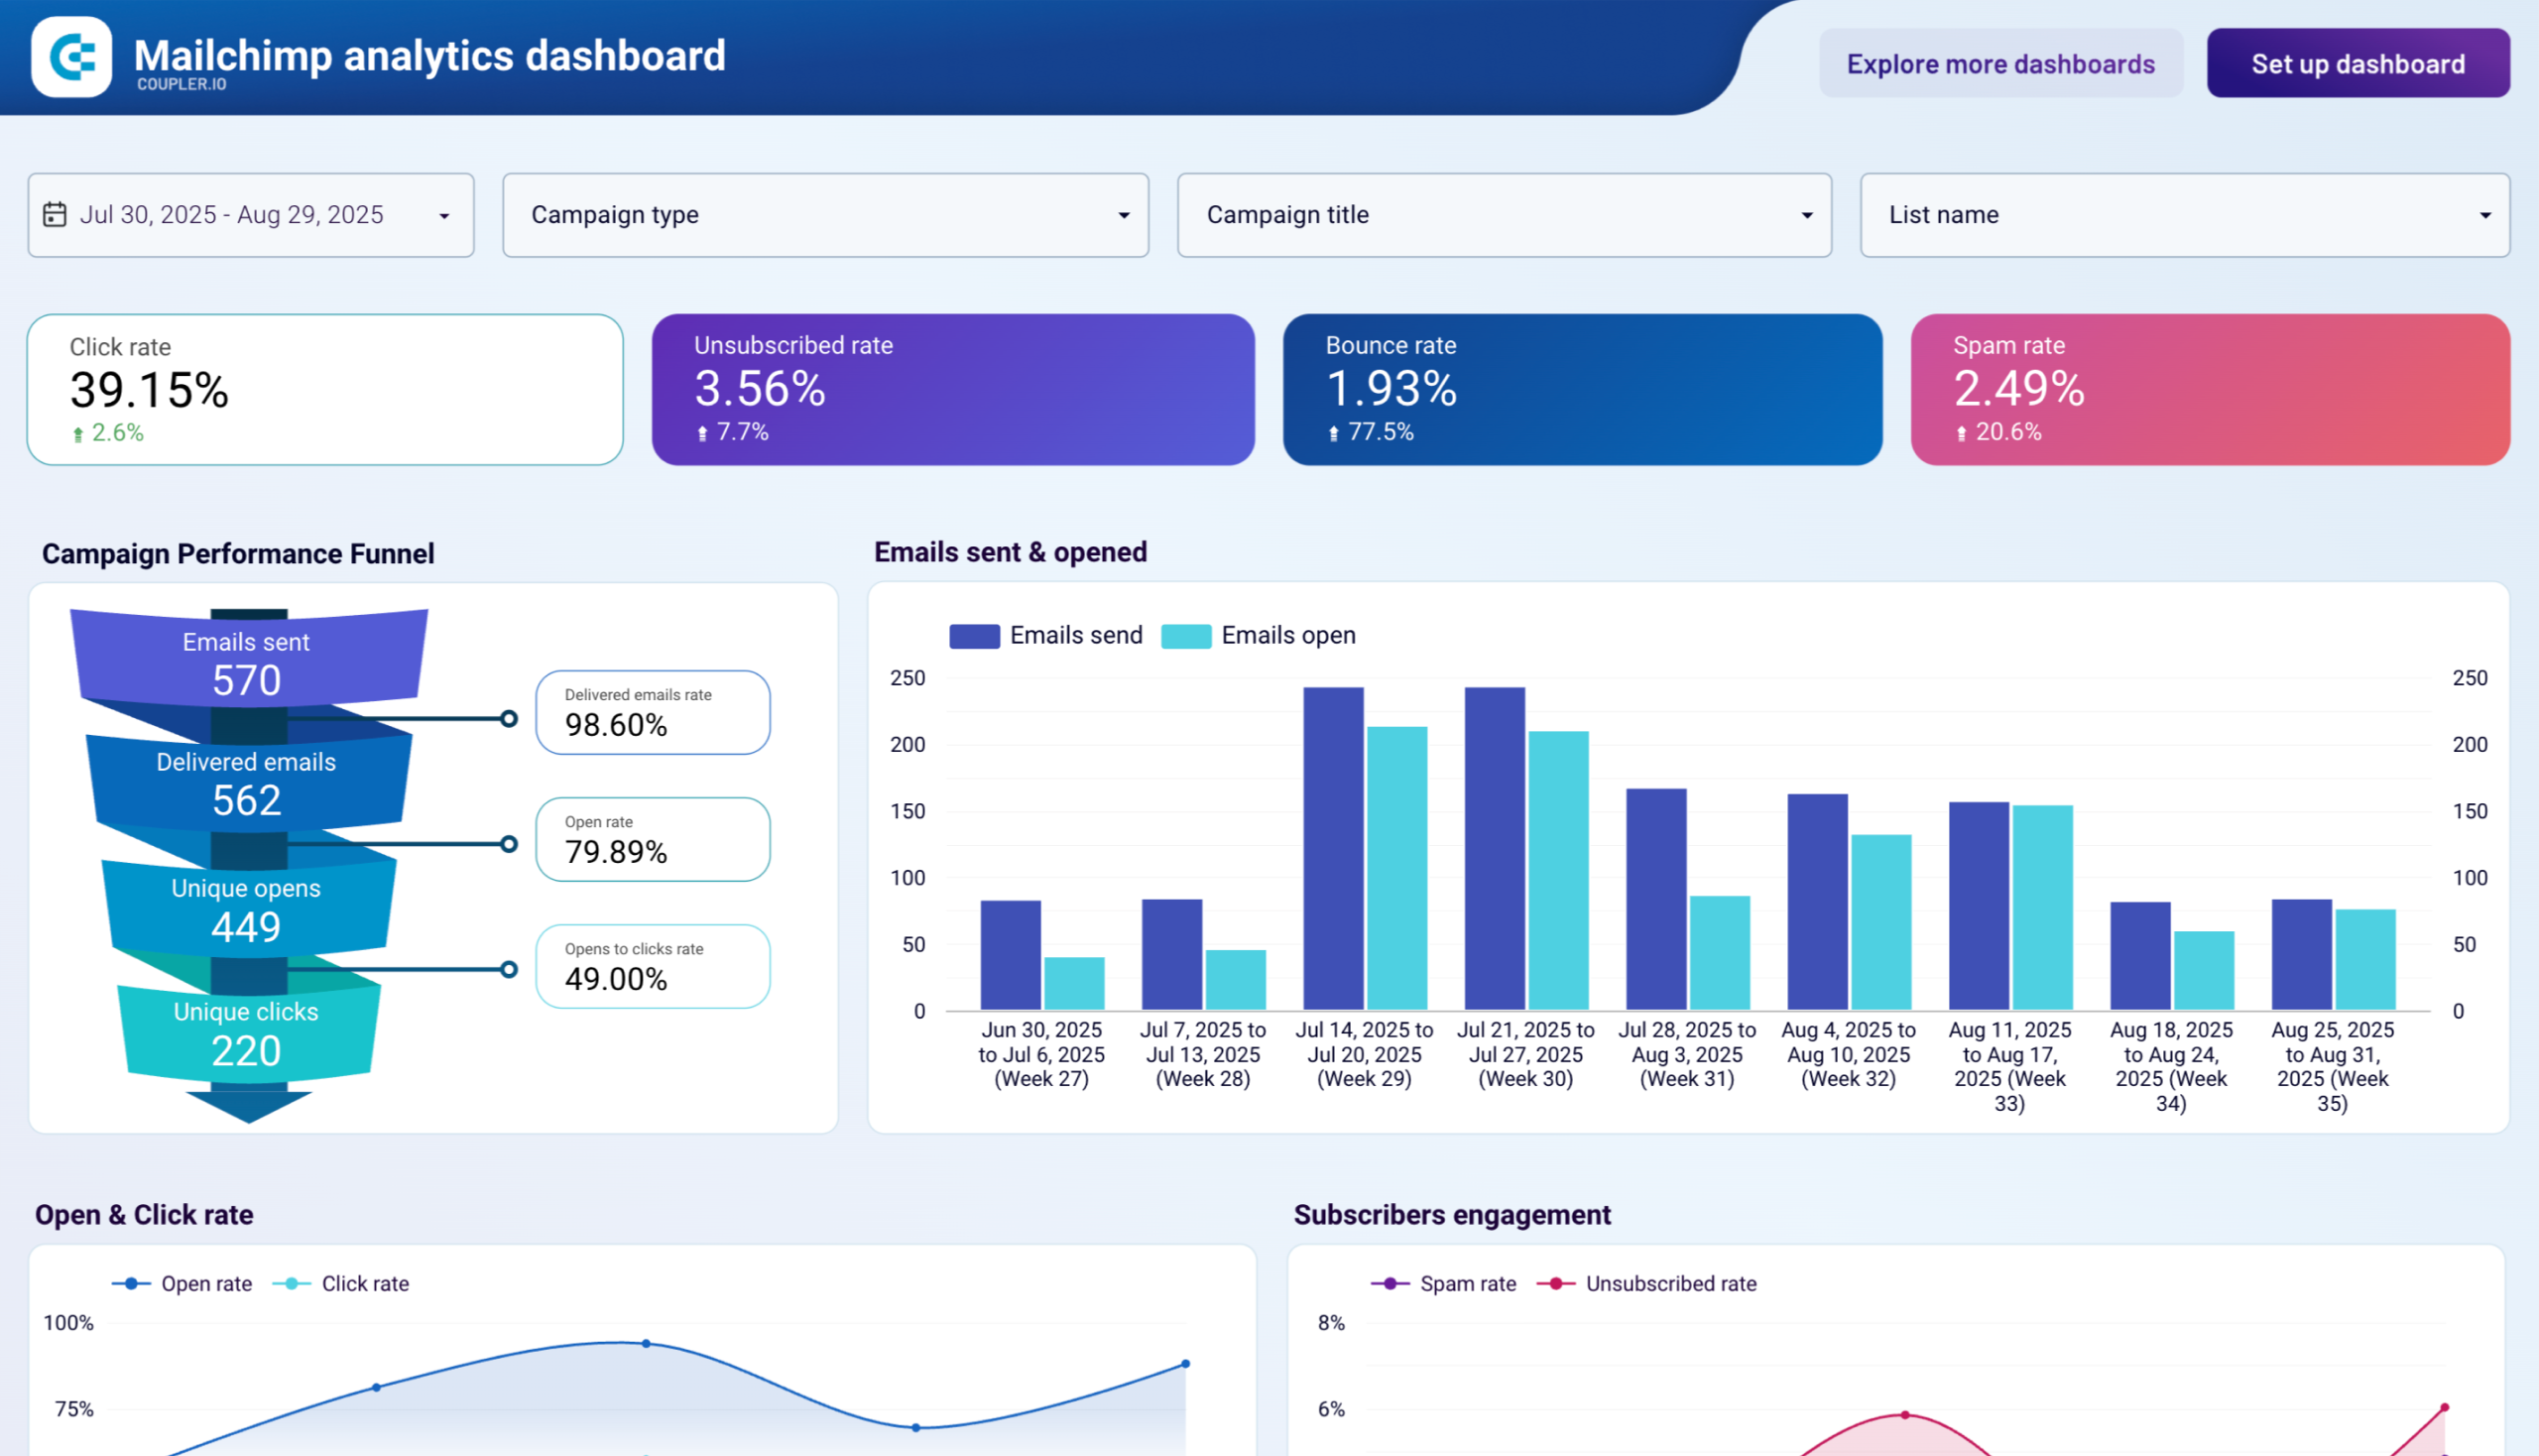
With this dashboard, you can pinpoint where subscribers drop off in your email journey—whether at delivery, opens, or clicks—enabling targeted improvements. You’ll identify which campaigns drive the highest engagement and revenue, spot deliverability or reputation issues before they escalate, and understand subscriber preferences based on geography, devices, and engagement timing.
This dashboard is ideal for email marketers managing multiple campaigns, businesses that need to prove email ROI to leadership, eCommerce stores relying on email for customer acquisition, or marketing teams optimizing send strategies based on subscriber behavior data. To use this template, follow the instructions in the Setup guide tab to connect your data using the Coupler.io connector for Mailchimp.
Dashboard metrics:
- Emails sent
- Emails delivered
- Opens
- Clicks
- Bounces
- Unsubscribes
- Spam reports
- Open rate
- Click rate
- Campaign performance
- Geographic distribution
- Device breakdown
- Send time optimization
40. Klaviyo analytics dashboard by Coupler.io
The Klaviyo analytics dashboard helps email marketers optimize campaign timing, subscriber targeting, and content strategy by revealing when subscribers engage most and what drives clicks. This Looker Studio template provides clear answers about whether you’re reaching subscribers at the right time with content they actually want.
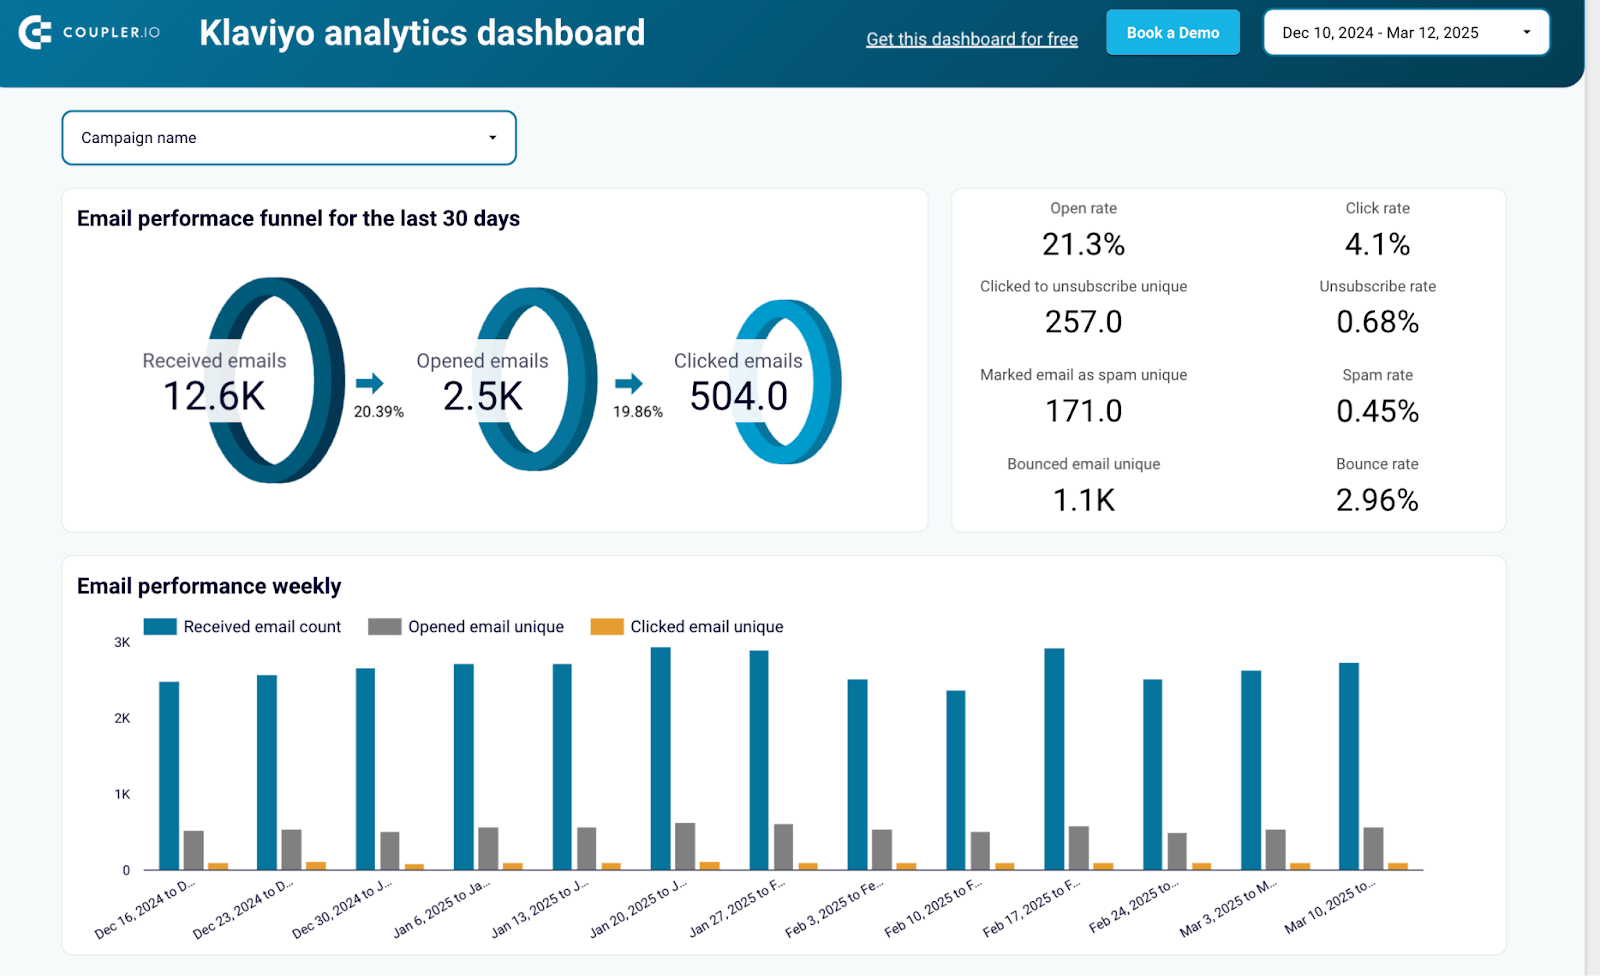
The dashboard reveals subscriber preferences across different platforms and devices, helping you customize emails for maximum engagement. You can spot patterns in weekly and daily performance to schedule important campaigns during peak engagement windows, monitor list health through subscription changes, and identify which content types and offers drive the most clicks.
To use this template, follow the instructions to integrate data from your Klaviyo account using Coupler.io.
Dashboard metrics:
- Emails sent
- Opens
- Clicks
- Bounces
- Unsubscribes
- Open rate
- Click rate
- Email client breakdown
- Domain performance
- Geographic distribution
- Daily/weekly trends
- URL click tracking
- Subscriber profiles
41. Email marketing analytics dashboard for Mailchimp by Coupler.io
The email marketing analytics dashboard for Mailchimp connects email campaign performance to actual business outcomes by integrating Mailchimp data with Google Analytics 4. This Looker Studio template answers the critical question: which email campaigns generate revenue, not just engagement?
Mailchimp email marketing analytics dashboard
 Preview dashboard
Mailchimp email marketing analytics dashboard
Preview dashboardMany campaigns get opens and clicks but fail to drive purchases—this dashboard reveals which campaigns convert engagement into revenue and which generate activity without business impact. You’ll understand the complete journey from email send to purchase, identify landing pages that convert email traffic effectively, and discover which subject lines drive both opens and eventual conversions.
This dashboard is essential for eCommerce businesses where email drives online sales, B2C companies with transactional websites, or marketing teams that need to justify email marketing budgets with revenue attribution rather than just engagement metrics. To use this template, follow the instructions in the Readme tab to connect both Mailchimp and GA4 accounts.
Dashboard metrics:
- Emails sent/delivered
- Opens
- Clicks
- Users acquired
- Engagements
- Purchases
- Revenue
- Landing page performance
- Campaign traffic analysis
- Subject line performance
- GA4 integration metrics
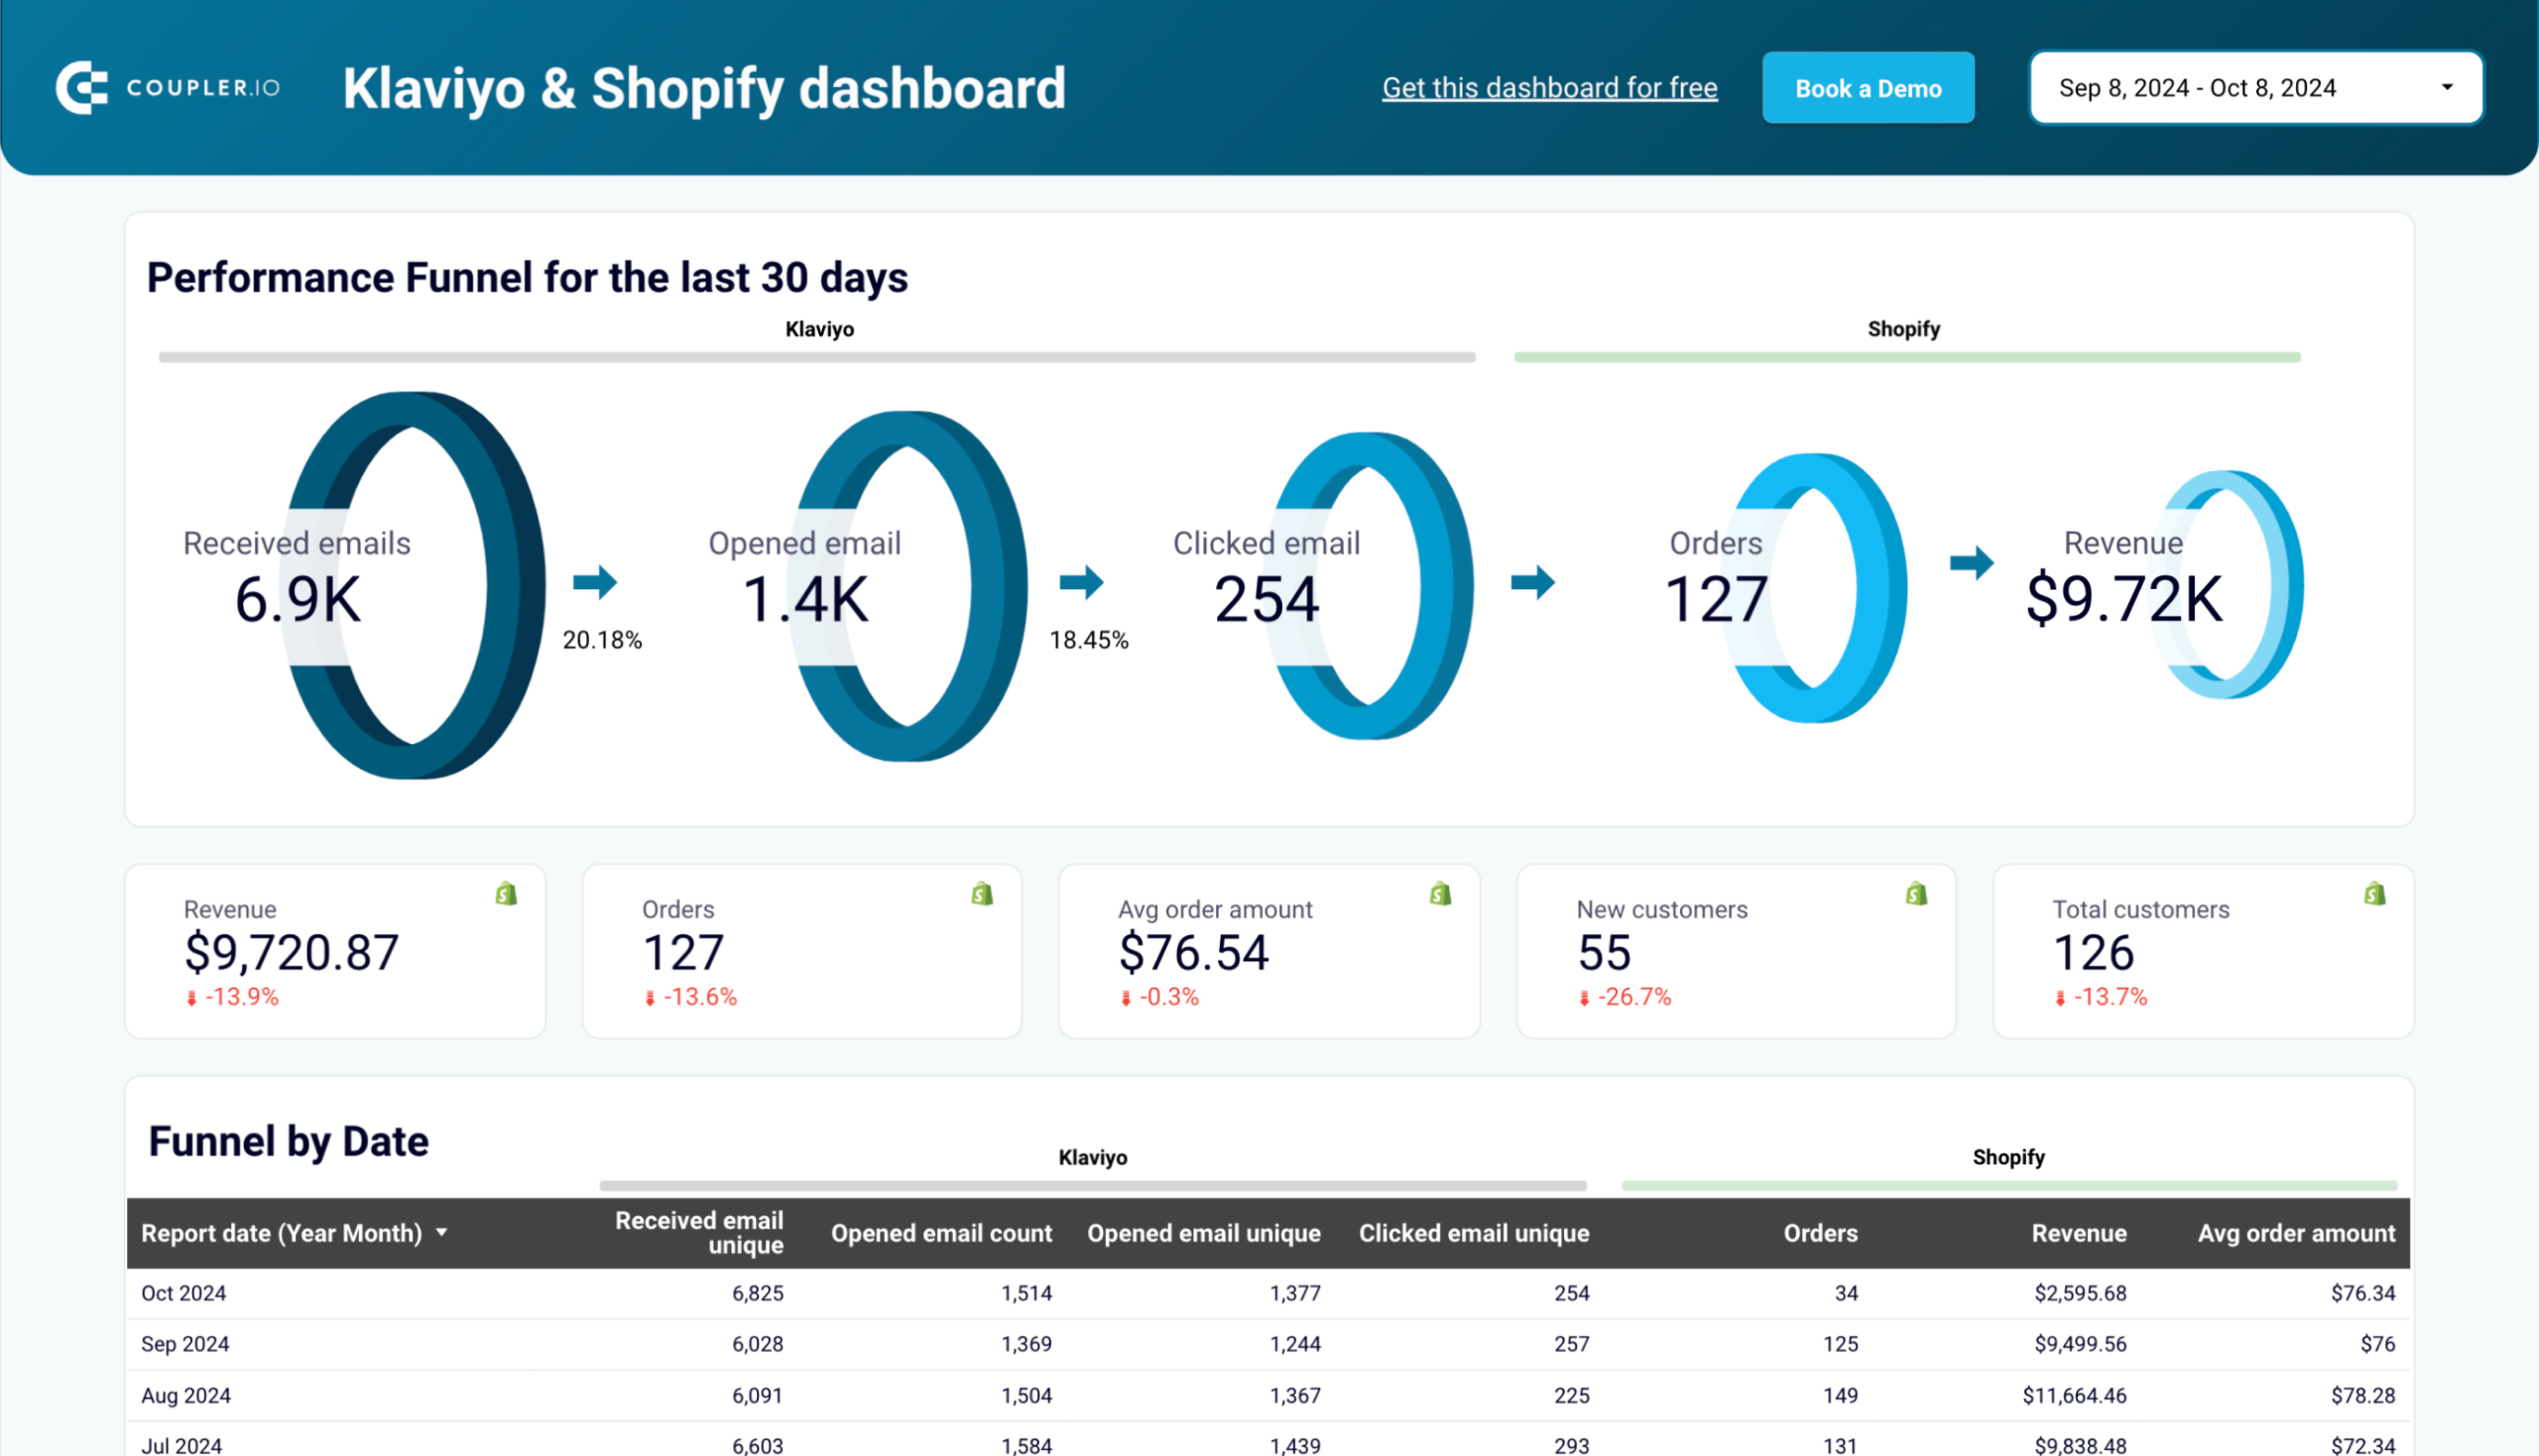
42. Email marketing analytics dashboard for Klaviyo by Coupler.io
The email marketing analytics dashboard for Klaviyo tracks the complete path from email engagement to purchase revenue by integrating Klaviyo campaign data with GA4 metrics. This Looker Studio template helps eCommerce businesses understand which campaigns generate actual orders versus those that create traffic without conversions.
Klaviyo email marketing analytics dashboard
 Preview dashboard
Klaviyo email marketing analytics dashboard
Preview dashboardFor online stores, the critical insight isn’t whether subscribers open emails but whether those opens translate to purchases and revenue. You’ll discover which campaigns drive new customer acquisition versus repeat purchases, identify landing pages that convert email traffic effectively, and understand which subject lines generate both engagement and sales.
This dashboard is particularly valuable for Shopify, WooCommerce, and other eCommerce platforms where email marketing is a primary revenue driver. It helps justify email spend by directly connecting campaigns to revenue, optimizing send strategies based on purchase behavior, and identifying which email approaches drive the highest order values. To use this template, follow the instructions in the Readme tab to connect both Klaviyo and GA4 accounts.
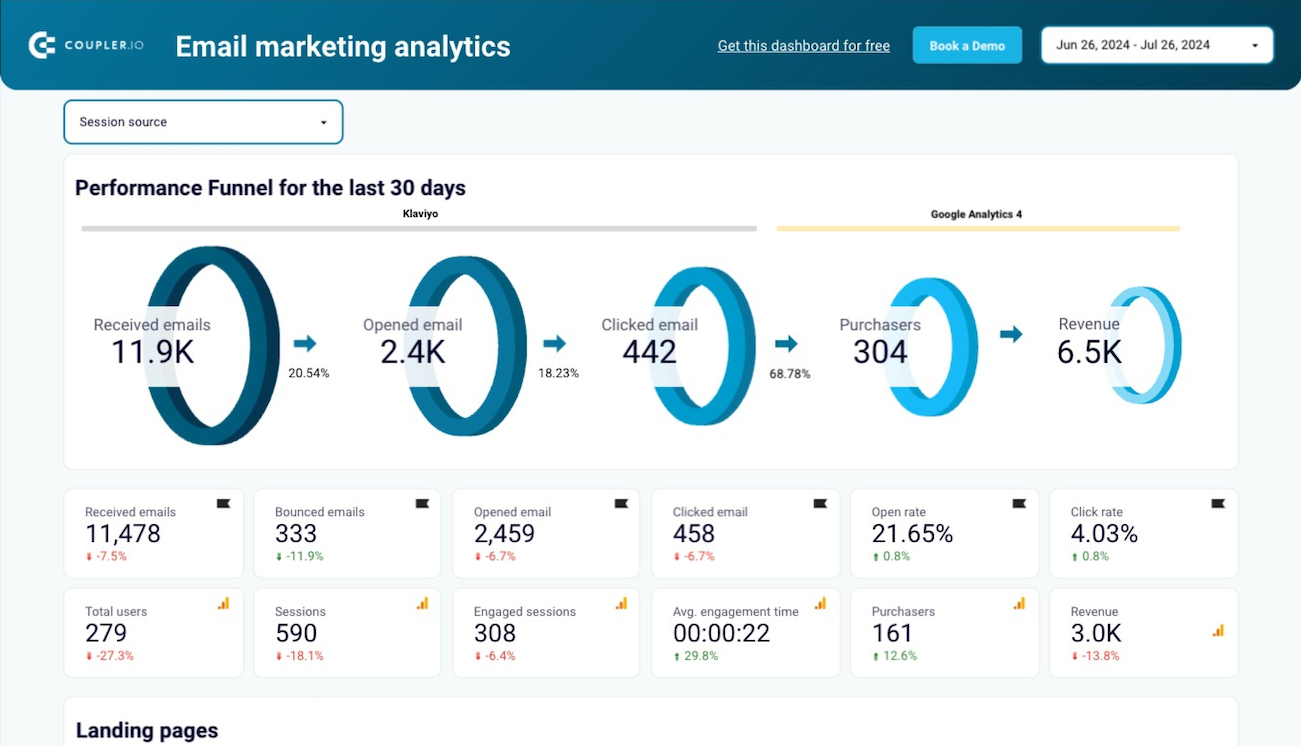
Dashboard metrics:
- Emails received
- Opens
- Clicks
- Revenue
- Orders
- Average order amount
- Total/new customers
- User acquisition
- Engagement metrics
- Landing page performance
- Campaign traffic analysis
- Top subject lines
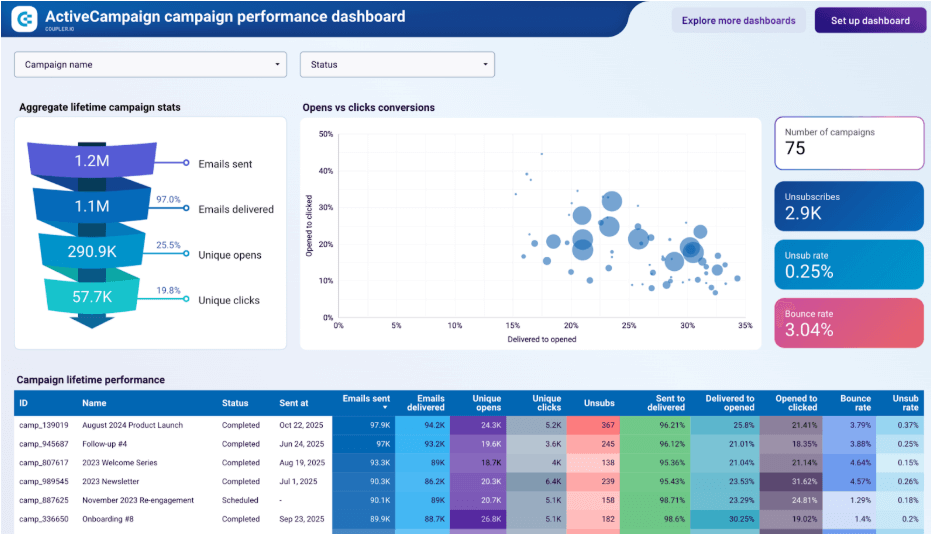
43. ActiveCampaign campaign performance dashboard by Coupler.io
This ActiveCampaign dashboard lets you assess engagement trends without navigating between individual campaign reports. It’s designed for marketing managers who need to understand not just how a single send performed, but how their email program is doing overall.
ActiveCampaign campaign performance dashboard
 preview dashboard
ActiveCampaign campaign performance dashboard
preview dashboardThe dashboard answers a question that ActiveCampaign’s native reporting makes difficult: is a low click rate a subject line problem or a content problem? By mapping open rates against click rates for every campaign, you can tell whether subscribers are ignoring your emails entirely or opening them and leaving without clicking. You can also filter the campaign table by status to focus on completed, scheduled, or draft campaigns — useful when benchmarking a new launch against past results or auditing which sends drove the most unsubscribes.
Connect your ActiveCampaign account via Coupler.io to populate the template. The setup takes about 2 minutes.
Dashboard metrics:
- Emails sent
- Emails delivered
- Unique opens
- Unique clicks
- Sent to delivered rate
- Delivered to opened rate
- Opened to clicked rate
- Bounce rate
- Unsubscribes
- Unsub rate
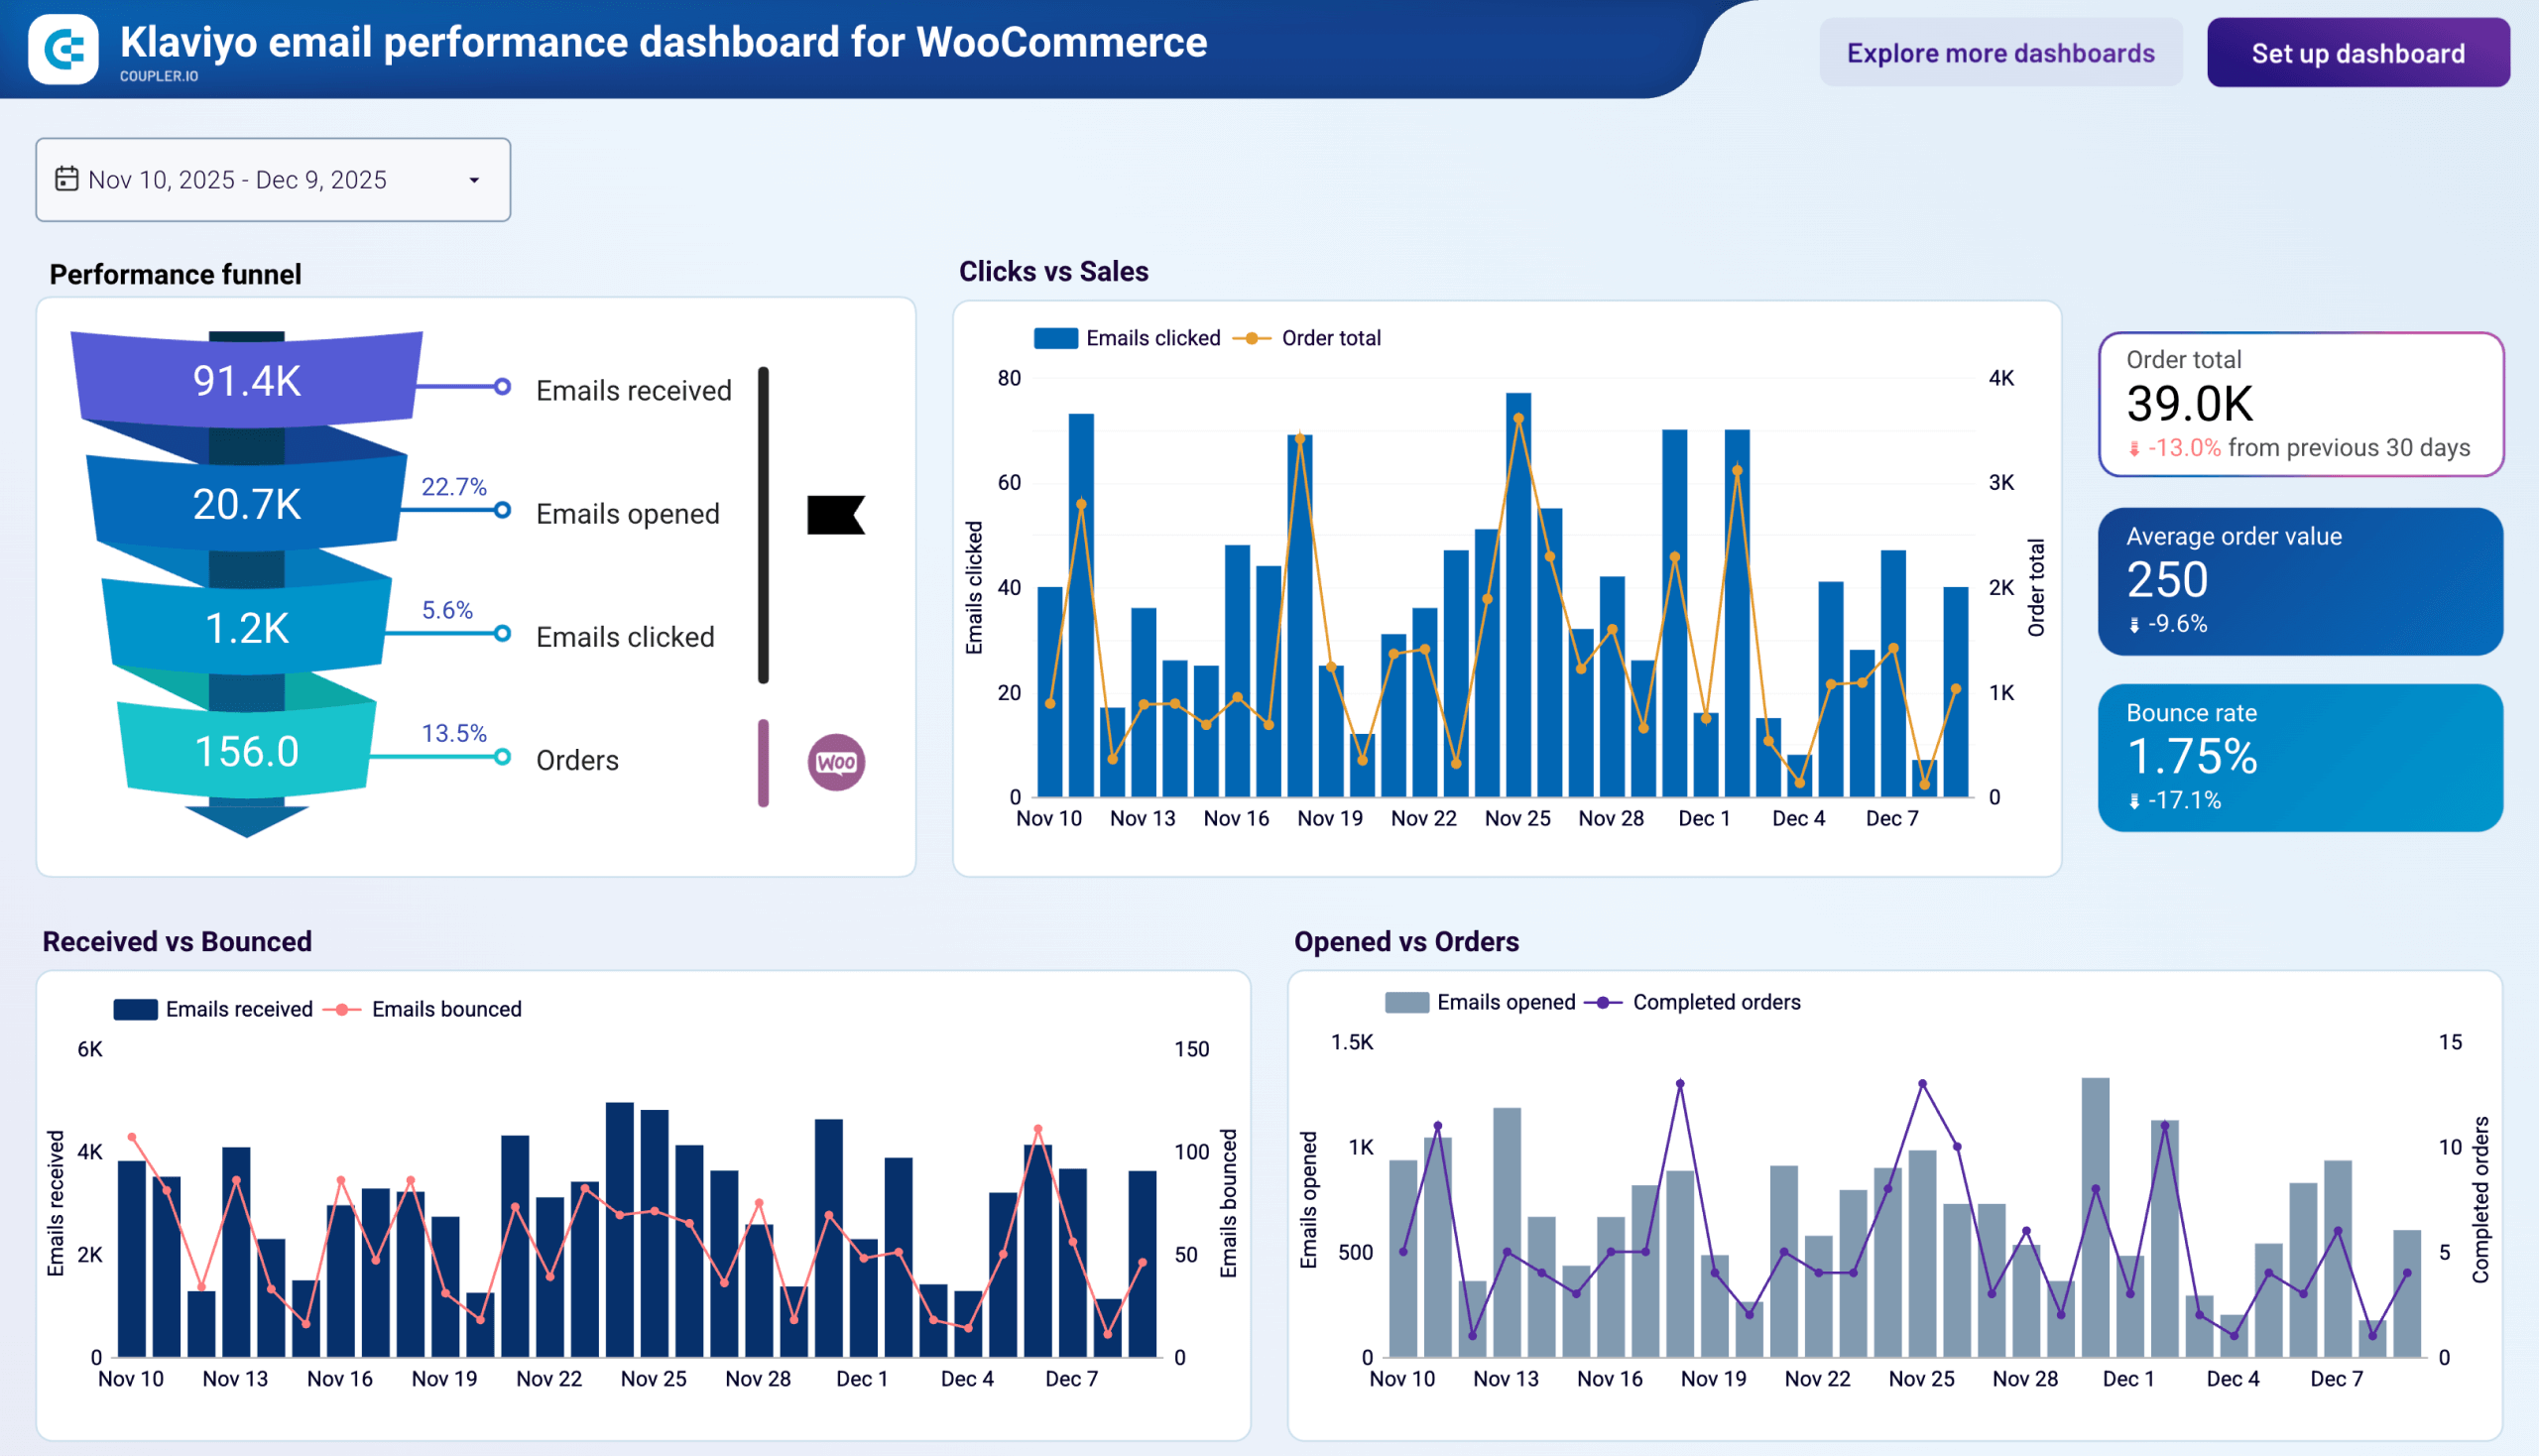
44. Klaviyo email performance dashboard for WooCommerce/Shopify by Coupler.io
While the Klaviyo analytics dashboard focuses on email engagement metrics, this template goes a step further. It connects Klaviyo with WooCommerce to show whether email clicks actually translate into store purchases. It’s built for e-commerce CRM managers who need to justify email marketing spend with revenue data, not just open rates.
Klaviyo email performance dashboard for WooCommerce
 Preview dashboard
Klaviyo email performance dashboard for WooCommerce
Preview dashboardOne of the most actionable features of this Looker Studio marketing dashboard is the ability to detect timing gaps between clicks and orders. If your customers tend to click on Monday but buy on Wednesday, your attribution window might be too narrow — and you could be undervaluing campaigns that actually drive revenue. The dashboard also tracks bounce trends against delivery volume, giving you an early signal when list hygiene needs attention. A day-of-week open rate breakdown helps you move send scheduling from guesswork to data.
In addition to WooCommerce, Coupler.io also provides a Klaviyo dashboard for Shopify.


Dashboard metrics:
- Order total
- Average order value (AOV)
- Bounce rate
- Emails received
- Emails opened
- Emails clicked
- Orders
- Clicks to orders rate
- Open rate by day of week
45. Mailchimp email performance dashboard for WooCommerce/Shopify by Coupler.io
This template serves the same purpose as the Klaviyo + WooCommerce dashboard above but for Mailchimp users. It connects your Mailchimp account with WooCommerce to show how email engagement drives store orders. One important distinction: Mailchimp’s API doesn’t expose open-rate data at the same granularity as Klaviyo, so this dashboard centers on delivery health, click behavior, and purchase outcomes — the signals Mailchimp can reliably measure.
Mailchimp email performance dashboard for WooCommerce
 Preview dashboard
Mailchimp email performance dashboard for WooCommerce
Preview dashboardFor WooCommerce/Shopify store owners, the day-of-week conversion breakdown is especially practical. Rather than showing when people open emails, it shows when clicked recipients are most likely to complete a purchase — a more direct input for deciding when to schedule your weekly sends. The dashboard also makes it straightforward to monitor whether your click-to-order rate is holding steady or gradually declining, which can indicate checkout friction or offer fatigue before it shows up as a visible revenue drop.
In addition to WooCommerce, Coupler.io also provides a Mailchimp dashboard for Shopify.

Dashboard metrics:
- Order total
- Average order value (AOV)
- Bounce rate
- Emails sent
- Emails delivered
- Emails clicked
- Orders
- Clicks to orders rate
- Clicks to orders rate by day of week
46. MailerLite campaign performance dashboard by Coupler.io
Reviewing campaigns one at a time inside MailerLite makes it hard to spot patterns across your full sending history. This dashboard pulls all your campaigns into a single Looker Studio report so you can evaluate engagement and deliverability at scale.
MailerLite campaign performance dashboard
 Preview dashboard
MailerLite campaign performance dashboard
Preview dashboardYou can see which campaigns drive both opens and clicks versus those with strong subject lines but weak content. Performance is broken down by campaign type to check whether resends are recovering missed opens or just adding noise. Campaigns with elevated bounce or spam rates get flagged, giving you time to investigate before deliverability takes a hit.
Email marketers managing regular sending schedules in MailerLite who want a consolidated view rather than per-campaign snapshots will get the most from this. Set it up by connecting your MailerLite account via the Coupler.io connector.
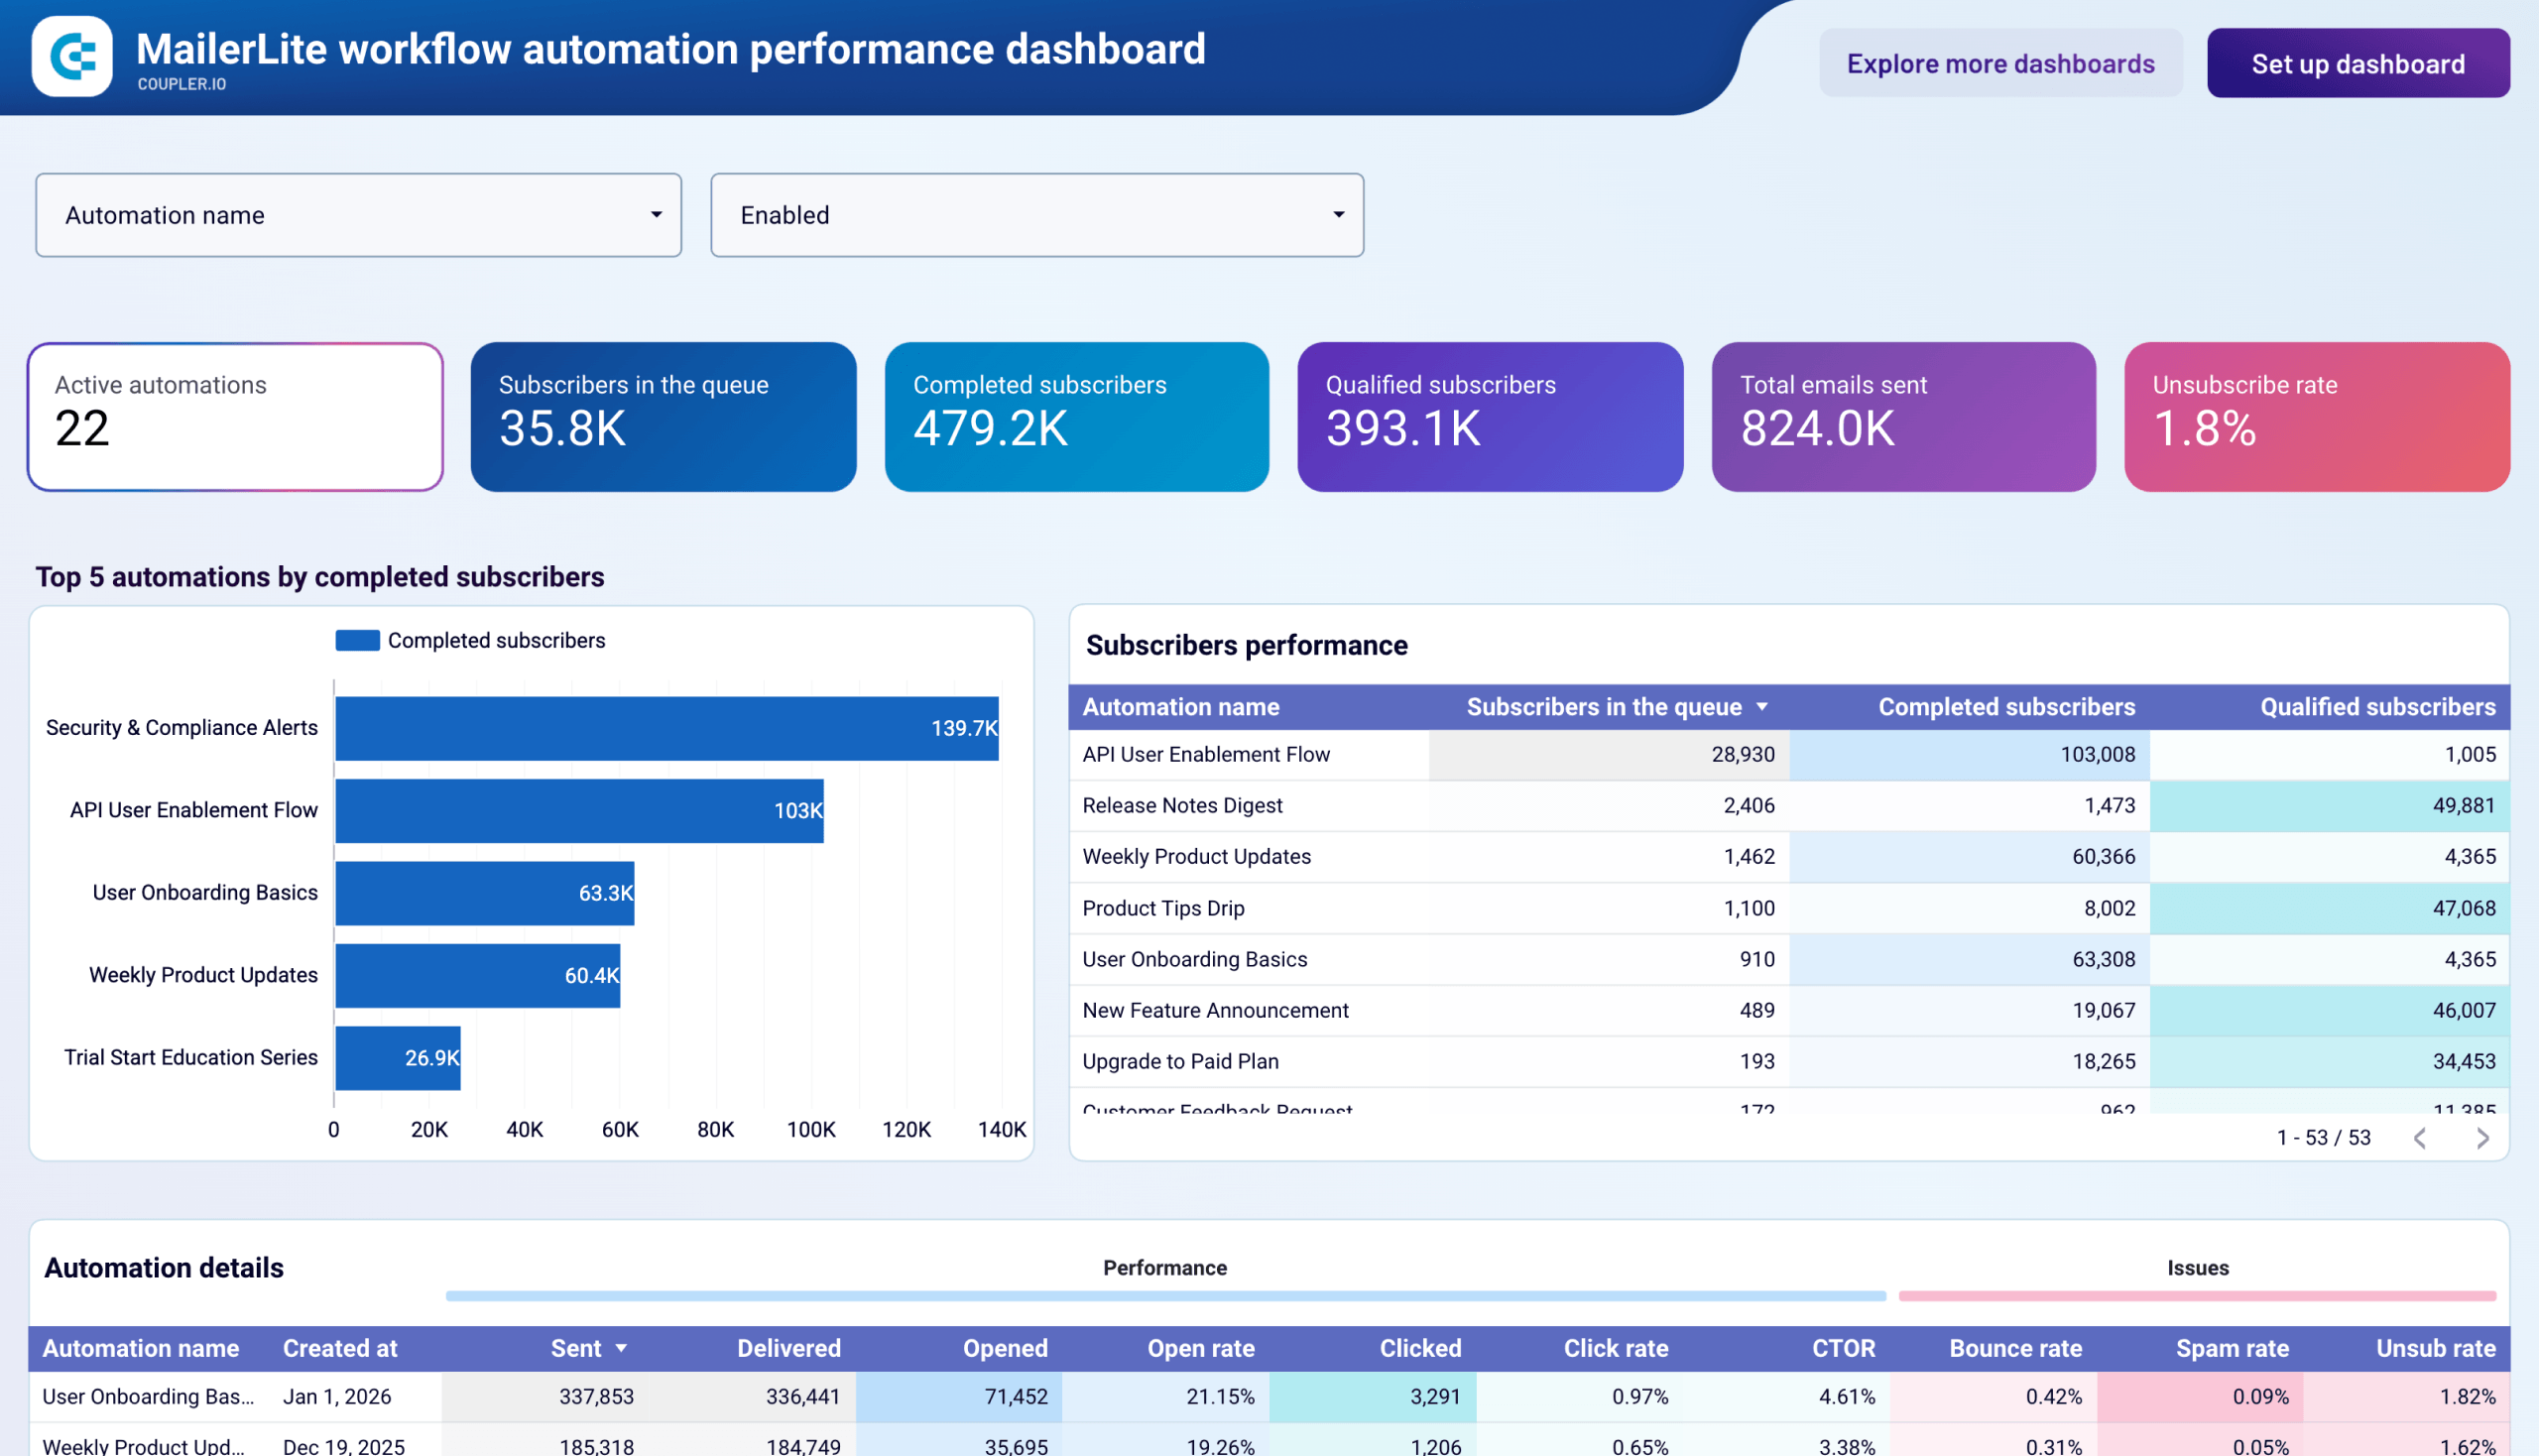
47. MailerLite workflow automation performance dashboard by Coupler.io
Campaign metrics tell you what happened with individual sends. This dashboard tells you what’s happening across all your active MailerLite automations. You will learn which workflows are moving subscribers toward a goal and where they’re dropping off mid-sequence.
MailerLite workflow automation performance dashboard
 Preview dashboard
MailerLite workflow automation performance dashboard
Preview dashboardCompletion and qualification rates are compared across all automations. This allows you to prioritize where optimization will have the most impact rather than fixing things in the order you happen to notice them. Broken workflows where subscribers are getting stuck show up clearly, as do deliverability issues within specific sequences before they affect your overall sender reputation.
This is most useful for marketing operations teams scaling their automation program in MailerLite who need to decide which workflows to fix or improve first. Connect your MailerLite account via the Coupler.io connector to use this template.
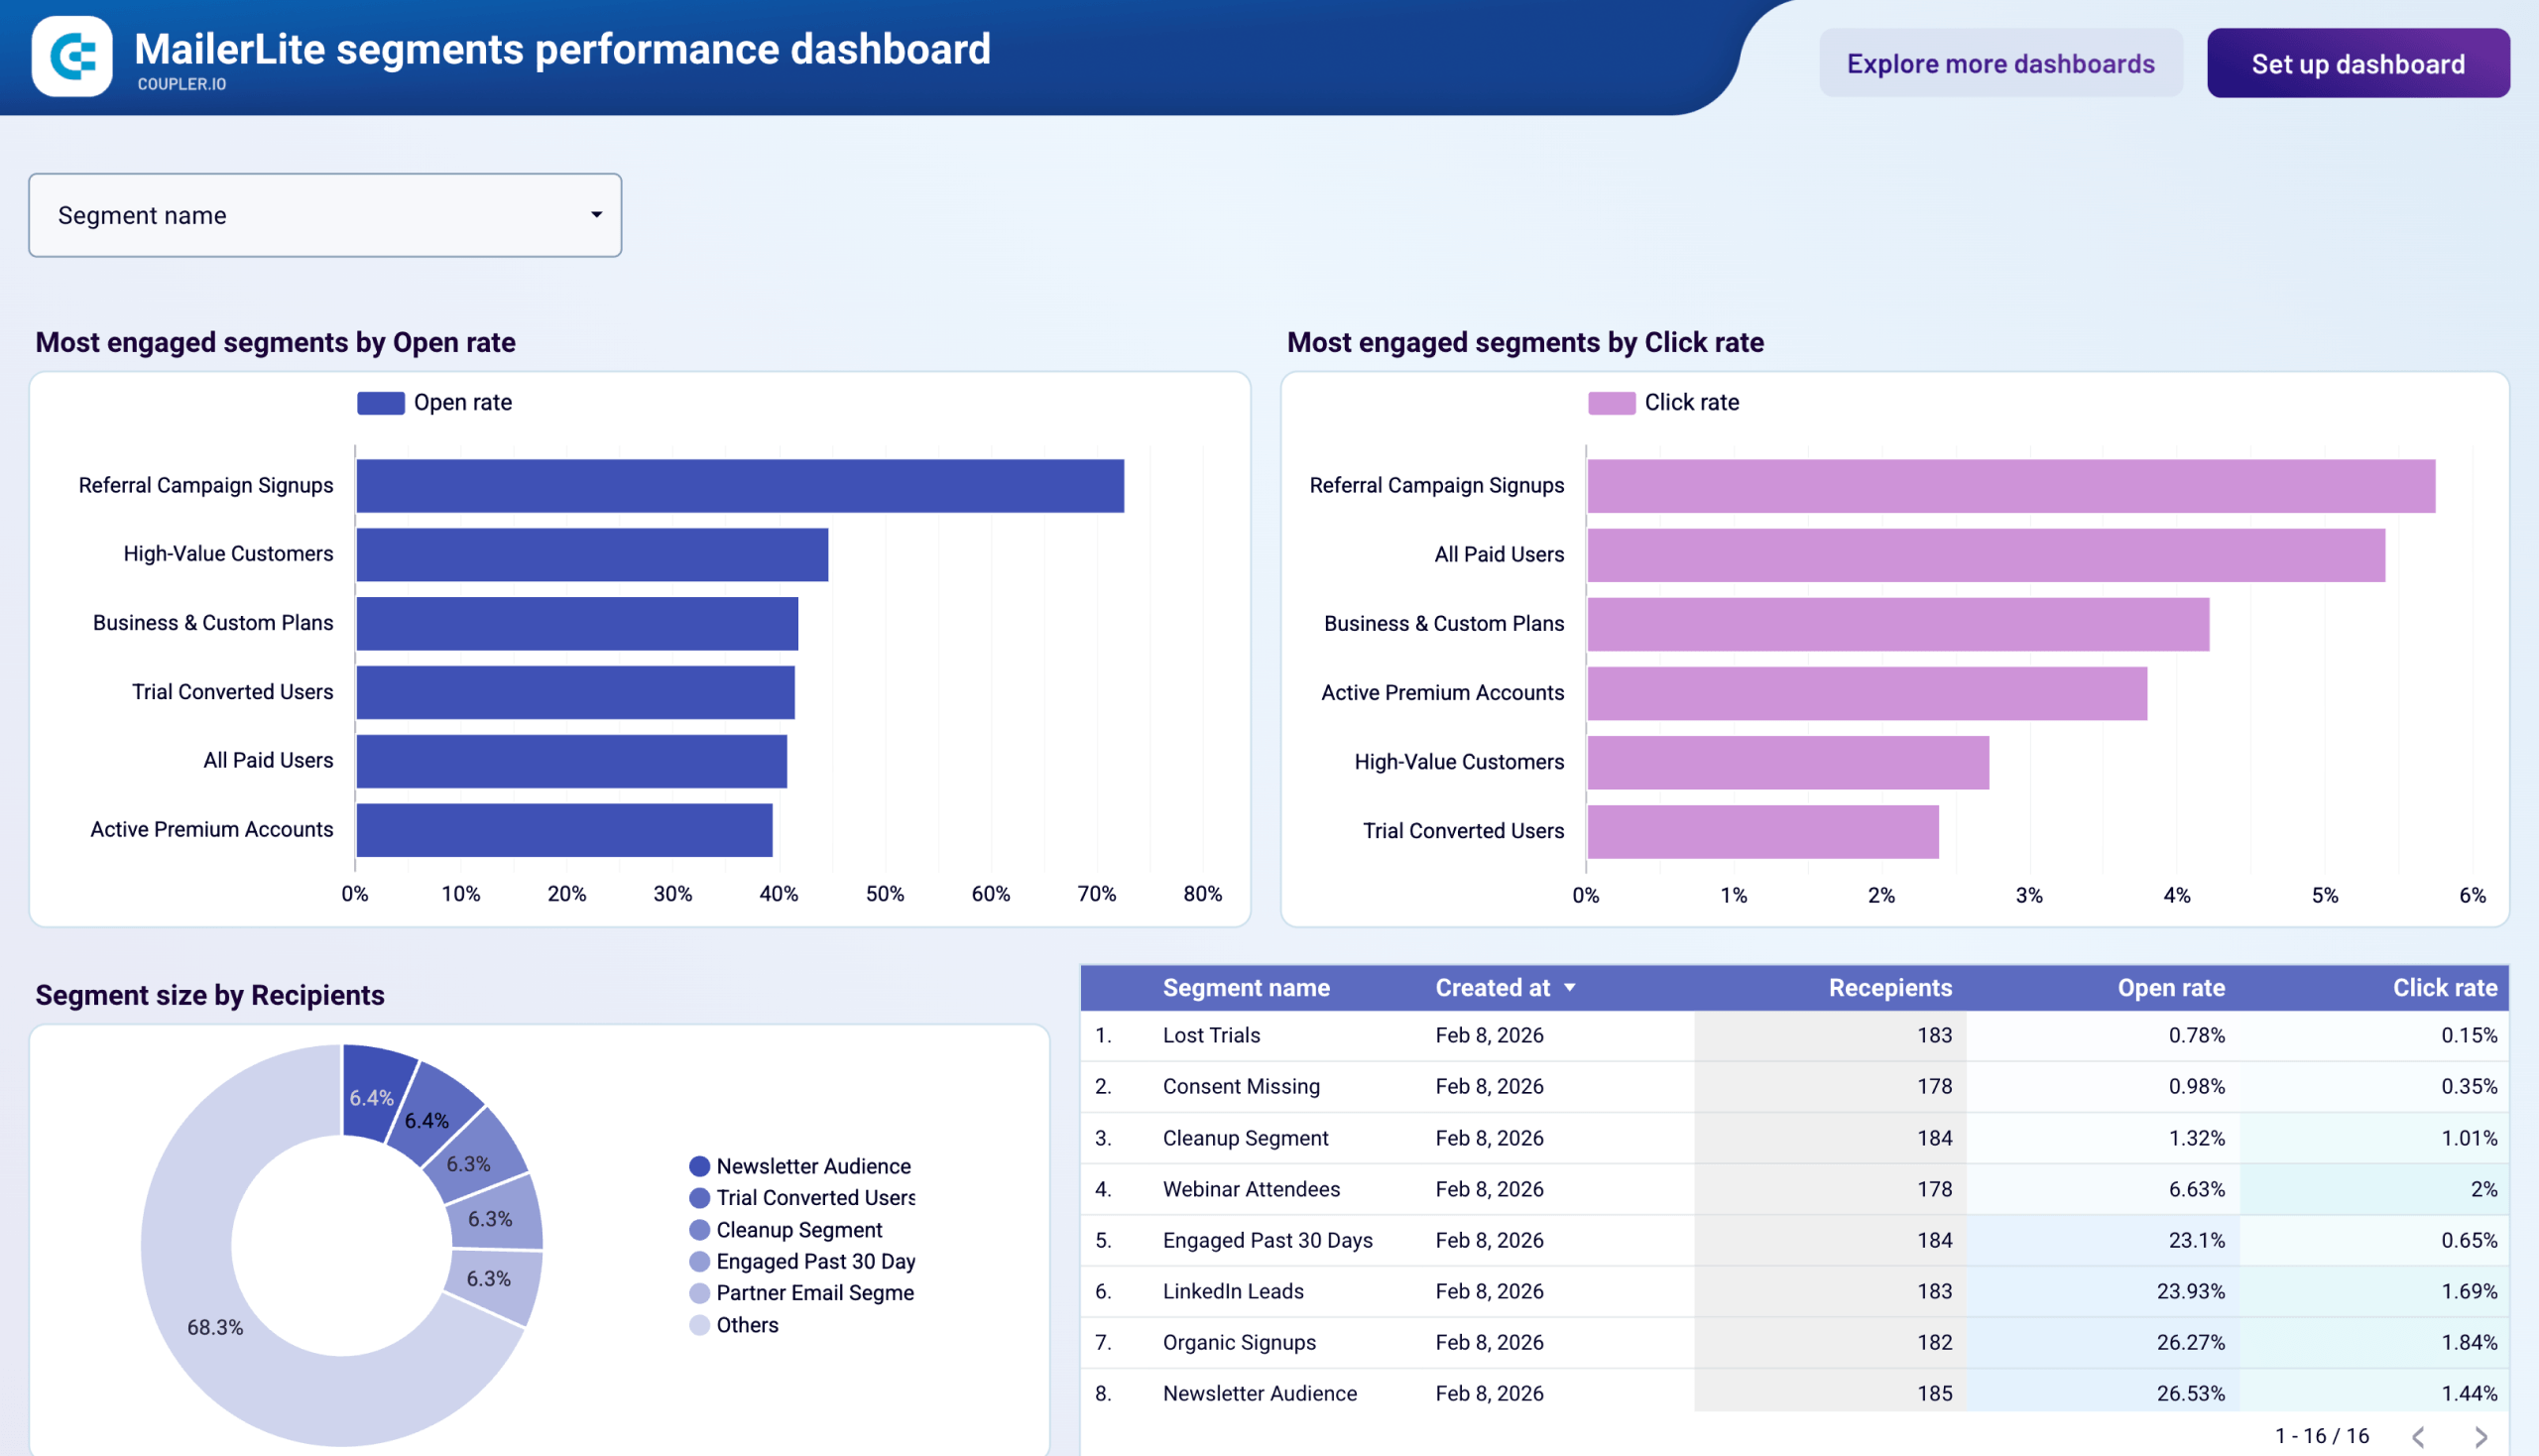
48. MailerLite segments performance dashboard by Coupler.io
Aggregated account metrics hide what’s actually driving performance. This dashboard breaks results down by subscriber segment, showing which groups respond to your campaigns and which have gone cold enough to start hurting deliverability.
MailerLite segments performance dashboard
Preview dashboard
MailerLite segments performance dashboard
Preview dashboardSegments are ranked by open rate and click rate, so it’s easy to see which audiences are genuinely engaged and which need re-engagement or cleanup. Relative segment size is included in the view, so you don’t overread strong numbers from a group that represents a small slice of your list. Filtering to a single segment lets you track how a newly created audience performs across its first few campaigns.
To use this template, connect your MailerLite account via the Coupler.io connector.
Customer support dashboards in Google Data Studio
Marketing shapes the first impression, but support shapes whether customers stay. A Google Data Studio dashboard for your support tool shows how quickly your team responds and how satisfied customers are once they reach out. Below is a template for teams running support through Intercom.
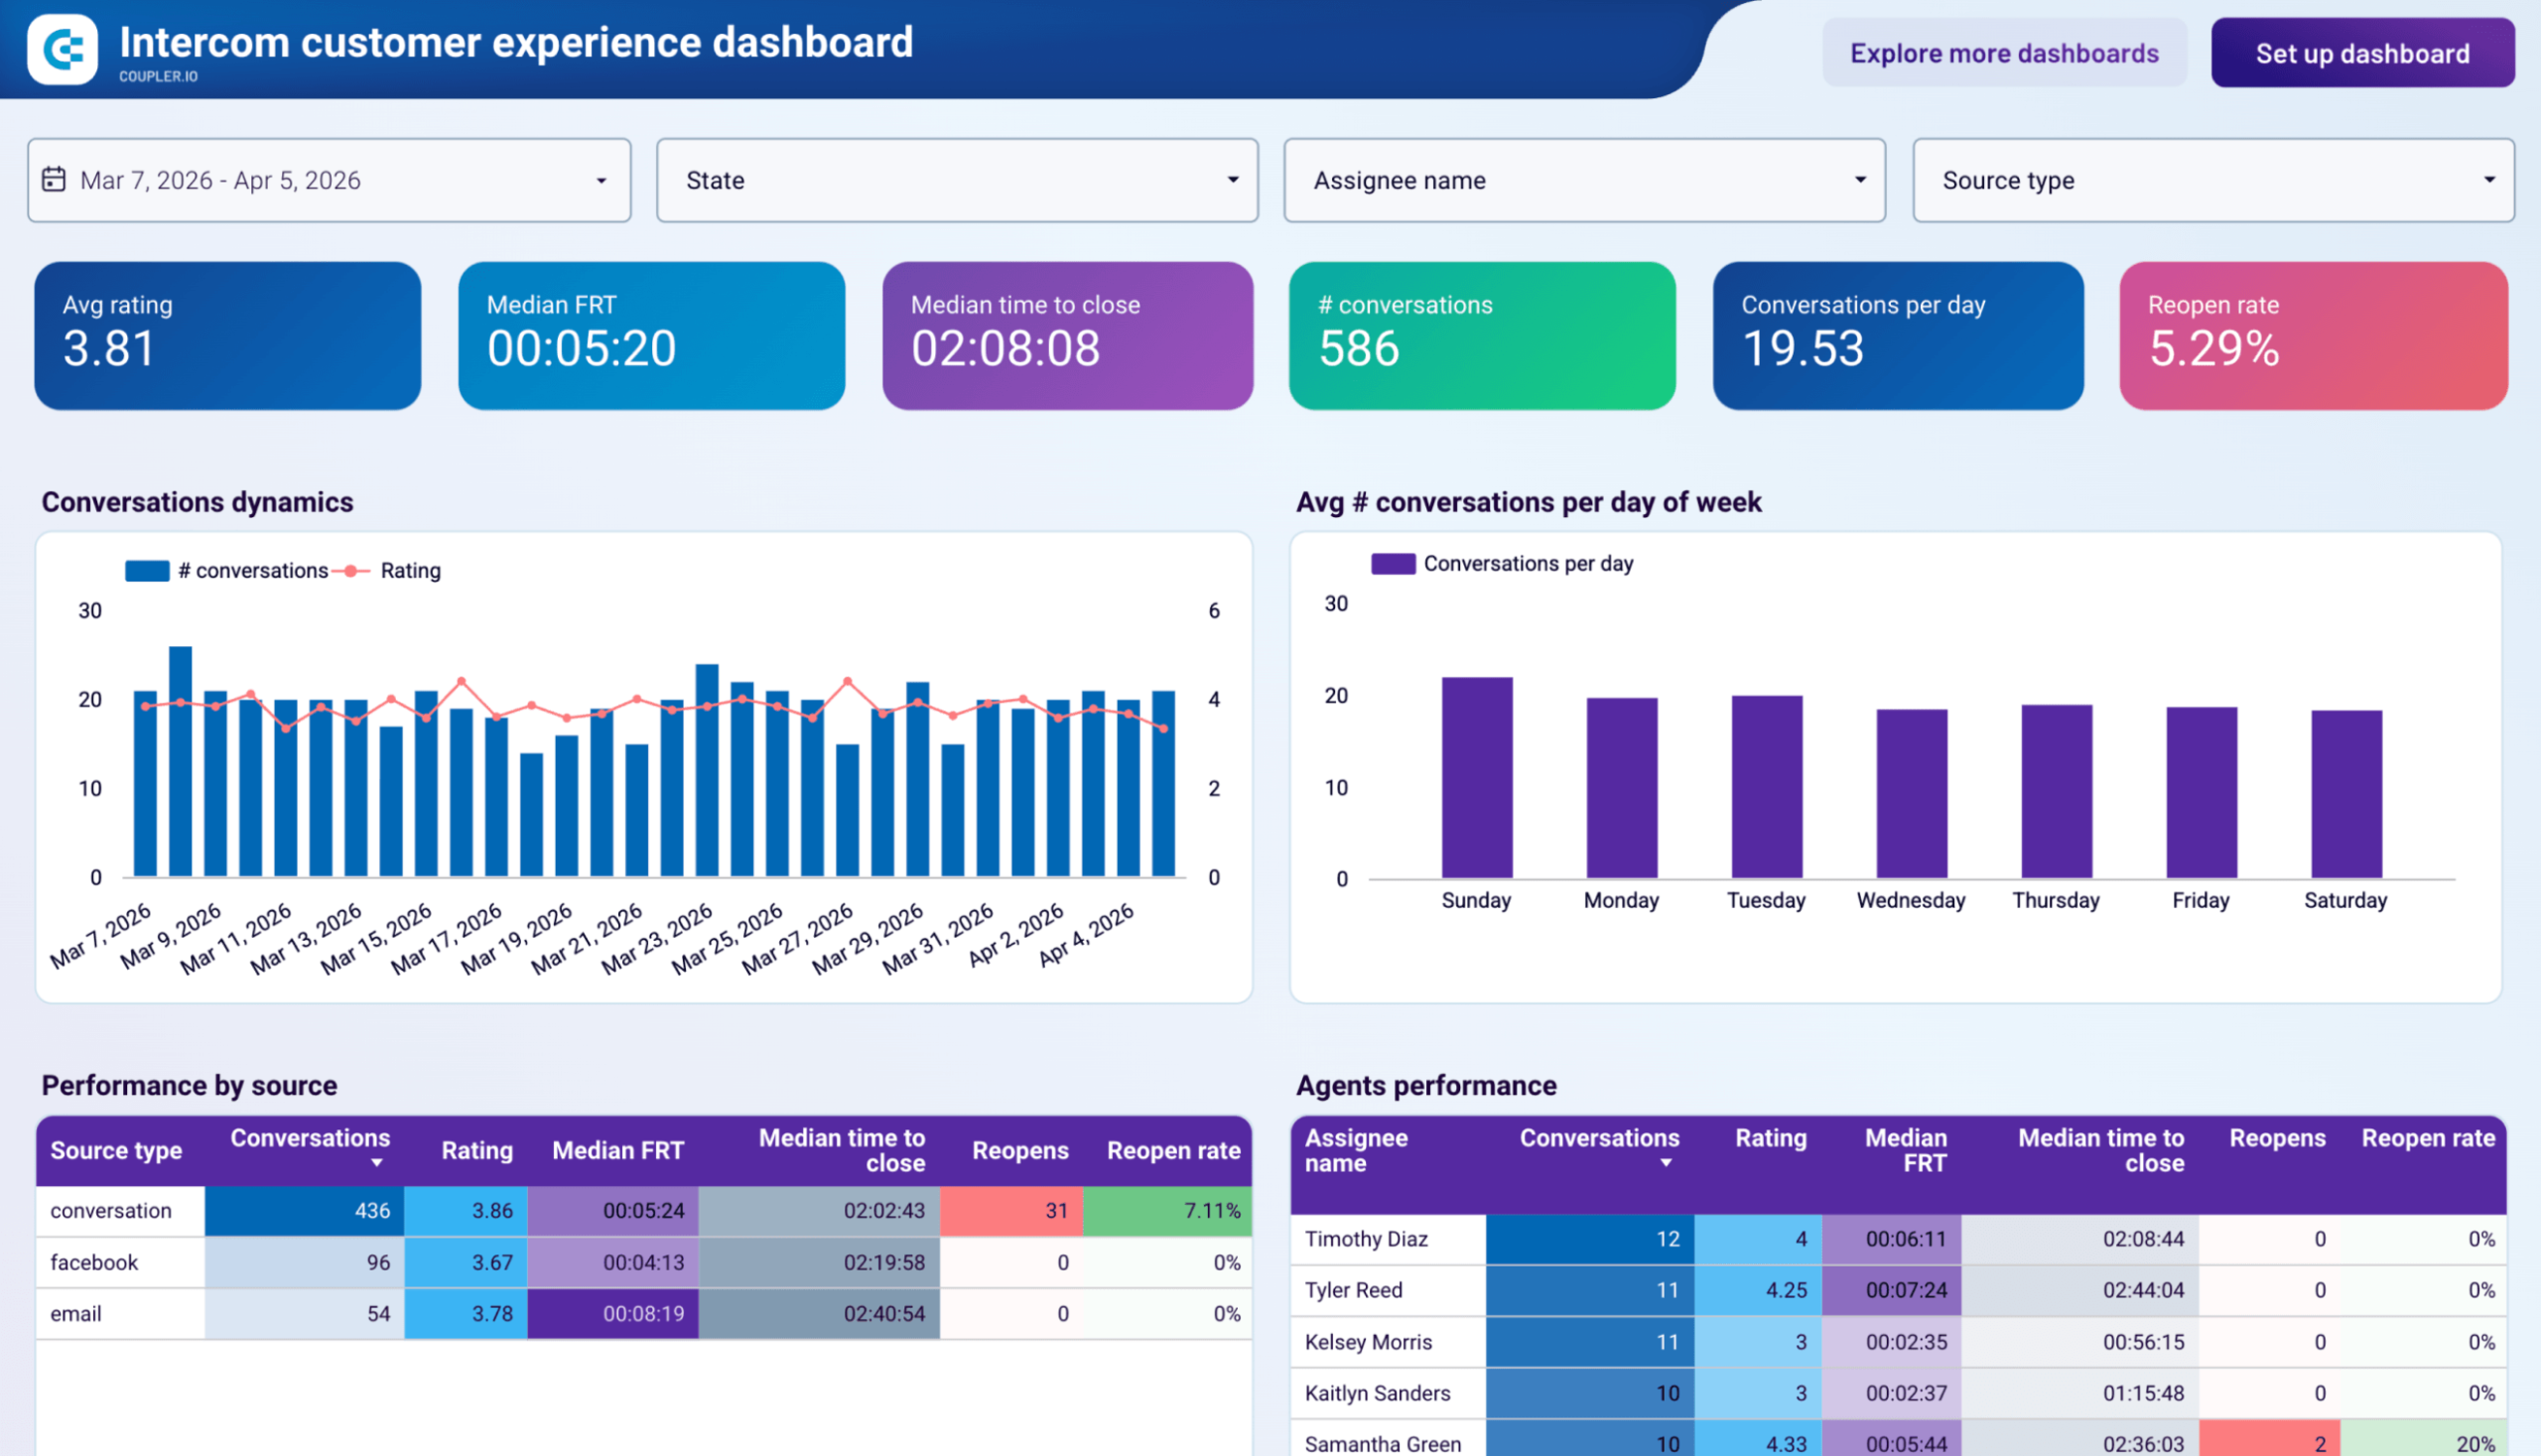
49. Intercom customer experience dashboard by Coupler.io
The Intercom customer experience dashboard by Coupler.io gives support leads and CX managers a single read on how their Intercom conversations are performing. It connects to your Intercom account and reports conversation volume, first response time, resolution speed, and customer satisfaction across channels and agents.
Intercom customer experience dashboard
 Preview dashboard
Intercom customer experience dashboard
Preview dashboardThe Conversations dynamics chart plots daily volume against customer ratings on one timeline, so you can catch periods where a spike in demand drags service quality down. The Agents performance table ranks the team by conversation count, rating, median first response time, etc., which gives managers real numbers to coach on. Drop-down filters for state, assignee name, and source type turn the same view into either a team overview or a focused investigation.
The template has a built-in Intercom connector by Coupler.io, so you can start using it in minutes by following the instructions in the Setup guide.
Benefits of using marketing reporting dashboards in Looker Studio
Why Looker Studio and not another option? Why use a pre-made marketing reporting dashboard? Well, because there are a lot of advantages compared to creating your manual reports from scratch.
- Better data visualization: Most Looker Studio marketing reporting dashboards come with graphs, charts, and other data visualization elements that will make your report easy to understand and share with stakeholders or managers.
- Easy to use: All of the templates we are going to share are configured and include the most important metrics you need to monitor for each activity or channel. All you will have to do is to use your own data. This means connecting your source (Google Analytics, YouTube, Google Spreadsheets, Facebook Ads, etc.) to Looker Studio so that the data can be exported and modified.
- Customizable: Don’t need all of the metrics showcased? No worries, you can make changes to the marketing reporting dashboard to suit your needs better.
- Collaboration and Shareability: Looker Studio reporting dashboard can be shared with your manager or clients. Also, your co-workers can have access to them so that they can add their own insights and data.
- Free and fast: Most of these Looker Studio templates are free to use, while for some you just need to pay a monthly subscription that is budget-friendly. However, it is worth it considering that it will take you a few minutes to add your data instead of spending hours collecting and introducing data manually.
Convinced? Let’s take a look at the best Data Studio templates.
Best practices for marketing reporting dashboards in Looker Studio
Want to use one of the examples we’ve added above? We’ve prepared a few best practices you should consider before getting started.
- Check the metrics: The whole meaning of using a reporting dashboard is to have a clear overview of the most important metrics and KPIs for your campaigns. While you might like the design of any of the marketing reporting dashboards presented, you will need to check and see if they include all of the metrics you want to monitor and analyze.
- See if the template is free: Check to see if the dashboard is free to use or if it is just a demo. Some of the dashboards are just demos, so you have limited content that you can use.
- Read the instructions: These dashboards usually come with a few instructions on how to use them. The dashboards from Coupler.io also show you how to automatically extract data from Facebook Ads or Google Ads directly to Looker Studio. This way, the report will be updated automatically, on a schedule.
- Customize the report: Don’t forget to add your branding assets such as your logo to the report to make it your own. It will make the report ready to share with stakeholders.
How to create marketing reporting dashboards in Looker Studio
Want to create your own report from scratch? No worries, we’ve prepared a short step-by-step tutorial that will help you make dashboards and reports in Looker Studio like a pro.
- Open Looker Studio and select the account you want to use. Then, select Blank Report.
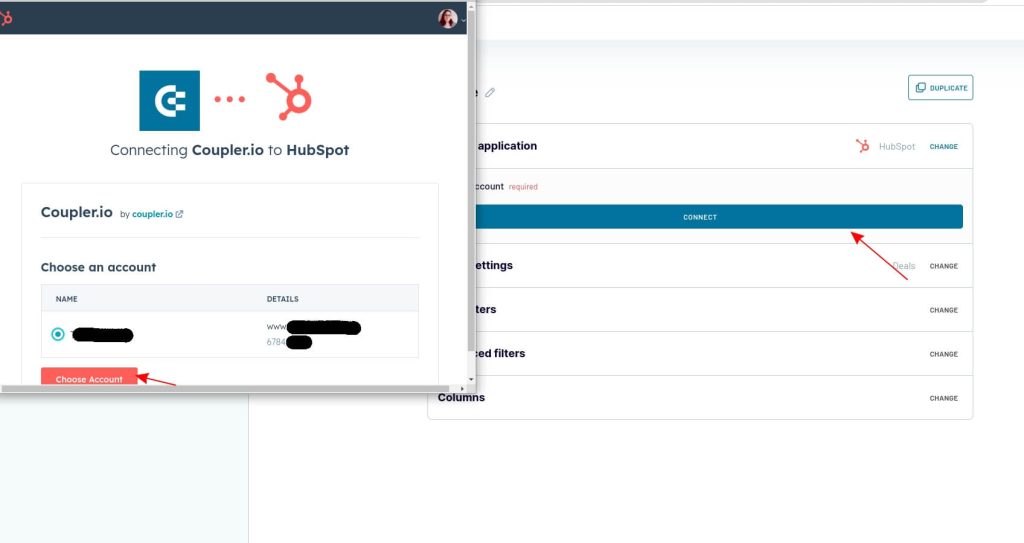
- Looker Studio will ask you to choose one of its connectors from which you want to import data. For this example, we are going to use Coupler.io to export data from Hubspot. Before we get started with the connector, let’s configure the export from Hubspot to Looker Studio so that you can schedule exports and benefit from real-time data.
- Please log in to your Coupler.io account and add a new importer. Select Hubspot as a source and Looker Studio as the destination.
- You will need to authorize Coupler.io’s access to Hubspot data. Select an account and offer permissions to Coupler.io to allow this export.
- Select the data entity you want to export from Hubspot. For this example, we selected “Contacts”.
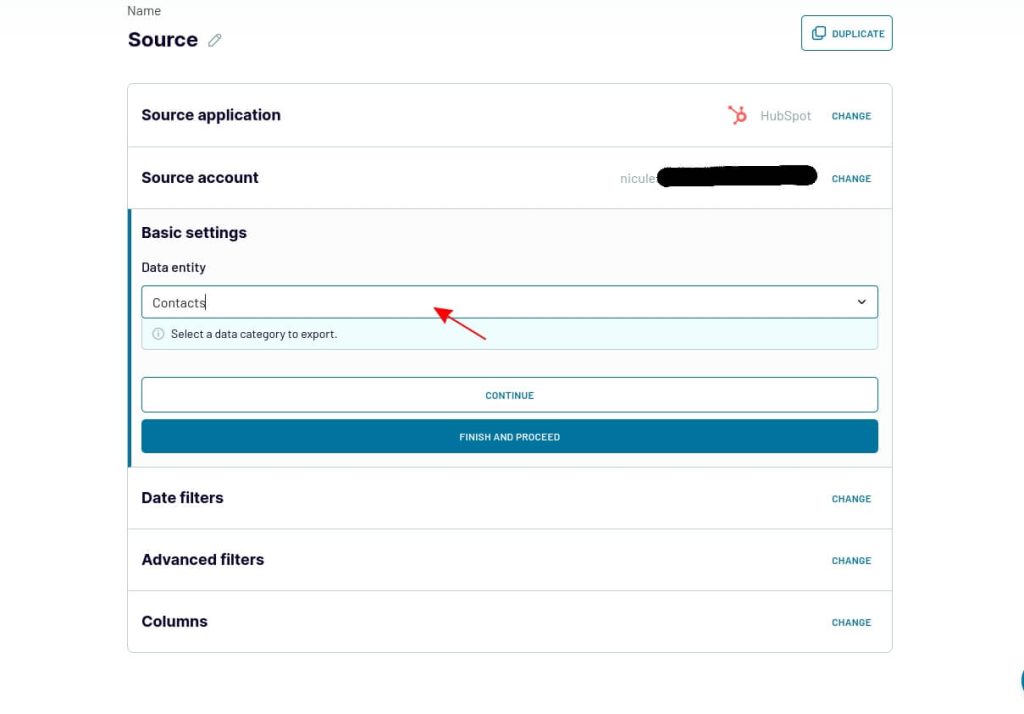
- You can click finish and proceed if you don’t need to add date filters and other advanced filters. Next, you will need to set up the destination.
- Generate an access token if you did not do that earlier and copy it. Click the button to create a data source in Looker Studio and follow the instructions.
- Authorize Looker Studio and Coupler.io’s connection. After this, you will be able to complete the connection between Coupler.io and Looker Studio. The data you’ve selected will be added to Looker Studio.
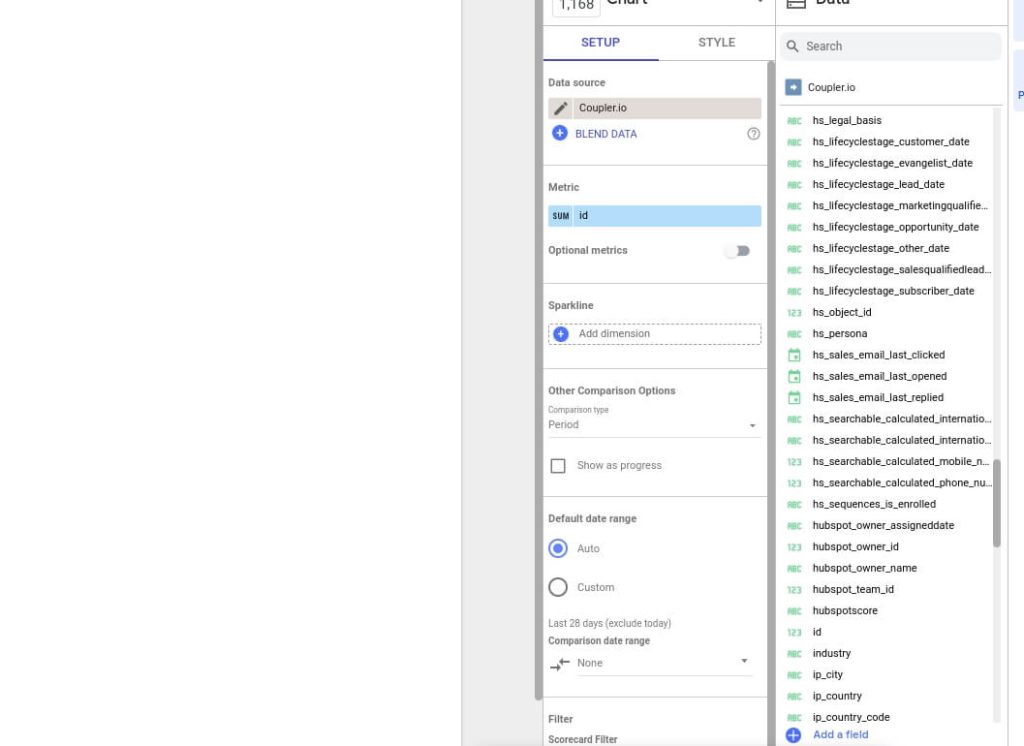
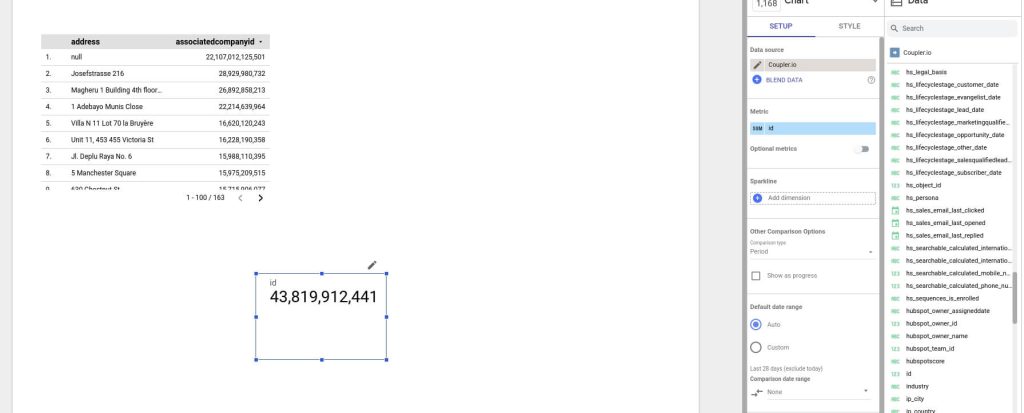
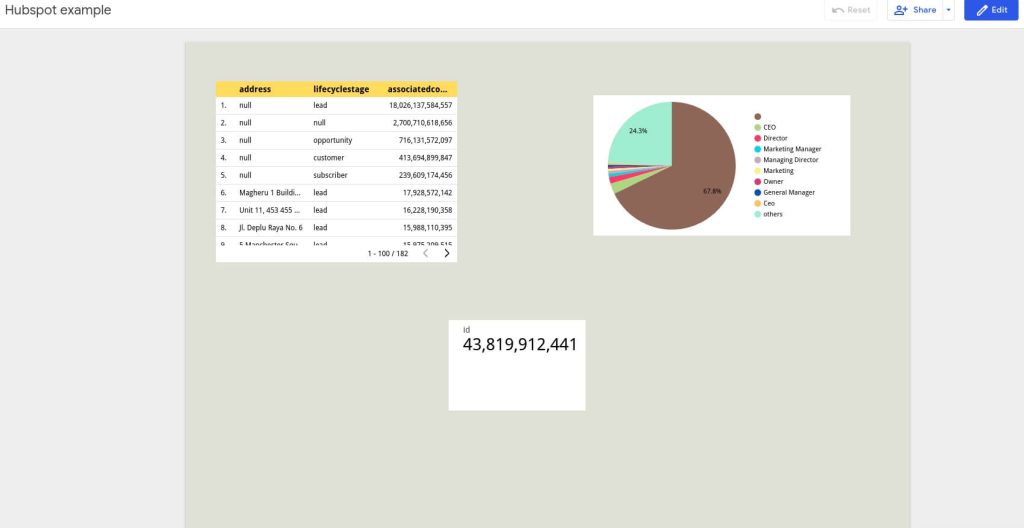
- After your analytics data is pulled from Hubspot, it’s time to add some scorecards. Click on Insert, and a dropdown menu will appear from which you can select the scorecard.
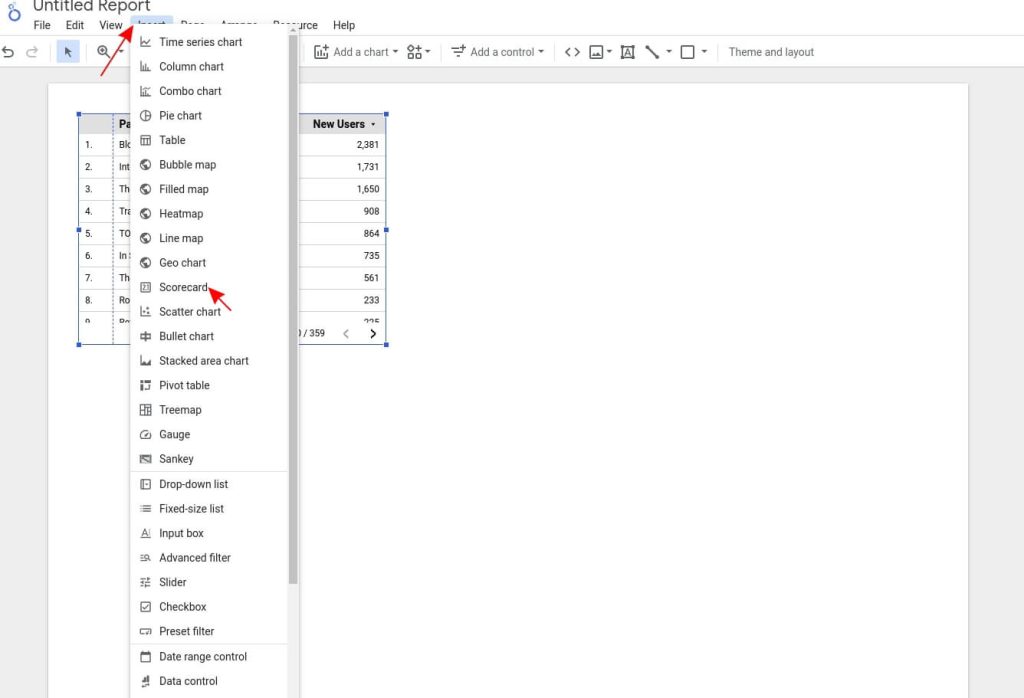
- Once you have selected the scorecard and placed it on your dashboard, you just need to select the right metric. For this example, we used “ID”.
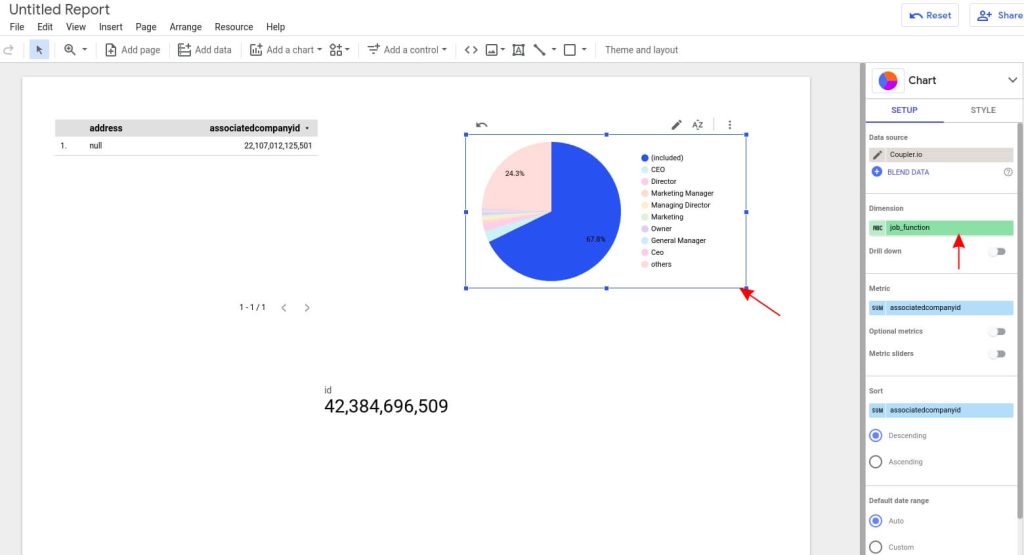
- To make data easier to analyze, you will need to add some data visualization elements like graphs. Click on Insert once again and add the chart.
- We’ve added a pie chart. Now, select the metric you want to display. For this example, we selected “Job Function” to see the jobs of our contacts and make a comparison.
- It’s time to make this dashboard your own. You can style it just the way you like. To do so, you will need to click on Theme & Layout and select what you like.
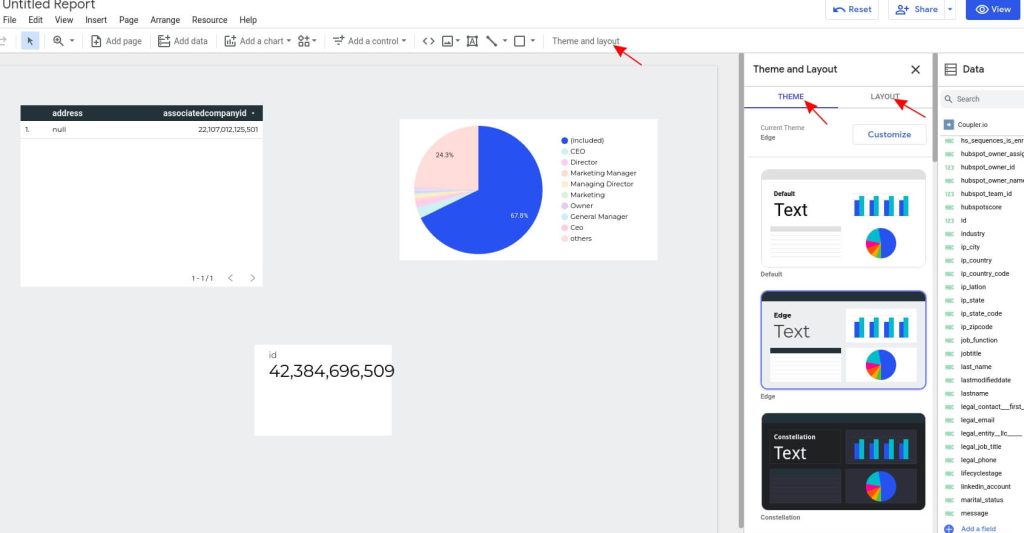
That’s it! Now, you can add the scorecards, graphs, and charts you need to showcase your data better. Click on View to see your dashboard. Here’s how ours looks:
Also, don’t forget to give a name to your report and add all of the branding elements necessary such as a logo. Personalize the dashboard and share it with stakeholders, managers, or co-workers.
Should you use dashboard templates or create marketing reports in Looker Studio from scratch?
If you want to make sure that your marketing efforts are not in vain, then you should monitor and analyze the most relevant metrics for your marketing campaigns. There are hundreds of ready-to-use templates that you can choose from in Looker Studio.
The templates that we included in the article focus on the most important metrics for each marketing strategy. However, if you need an in-depth report, then you might need to create a custom dashboard. Creating a Looker Studio dashboard from scratch can be a bit challenging. However, it allows you to have a tailored report where you can include any metric you need.