Running a Shopify store, you need to be making informed decisions. Every sale, product listed, and customer generates lots of raw data that’s difficult to analyze by solely looking at Shopify reports. For that reason, many shop owners choose to connect Shopify to Microsoft Power BI and let the powerhouse crunch their numbers – with some great results!
In this article, we’ll explore the no-code approach to integrating both tools. We’ll also share some tips on getting started with Power BI and building your first chart.
Ways to set up a Shopify to Power BI integration
Shopify API opens up opportunities to connect the tool with many external applications. However, Power BI does not provide a native connector to Shopify. So, you’ll have to take advantage of one of the third-party Shopify to Power BI integrations.
There are plenty of tools that offer direct Shopify to Power BI integration. They promise a quick setup and a smooth migration of data from your store to Microsoft’s business intelligence tool. How you connect Shopify and Power BI very much depends on how you want to use the data. Your experience level with visualization tools and Microsoft Power BI, in particular, will also play its part.
We’ll show you how to integrate Shopify with Power BI using Coupler.io. It’s a reputable solution for reporting automation. Coupler.io allows you to automate data flow from many business apps to Power BI. Shopify is one of our most popular integrations. We’ll also explain how to set up Shopify integrations in the following chapter.
How to connect Shopify to Microsoft Power BI
To start using Coupler.io, create a Coupler.io account. You can sign up for free without providing any sensitive data like a credit card. Then, click on the button to create a new importer and select the source and destination apps you need: Shopify and Power BI.
Proceed with the setup which requires you to complete the following 4 steps:
Step 1. Extract data
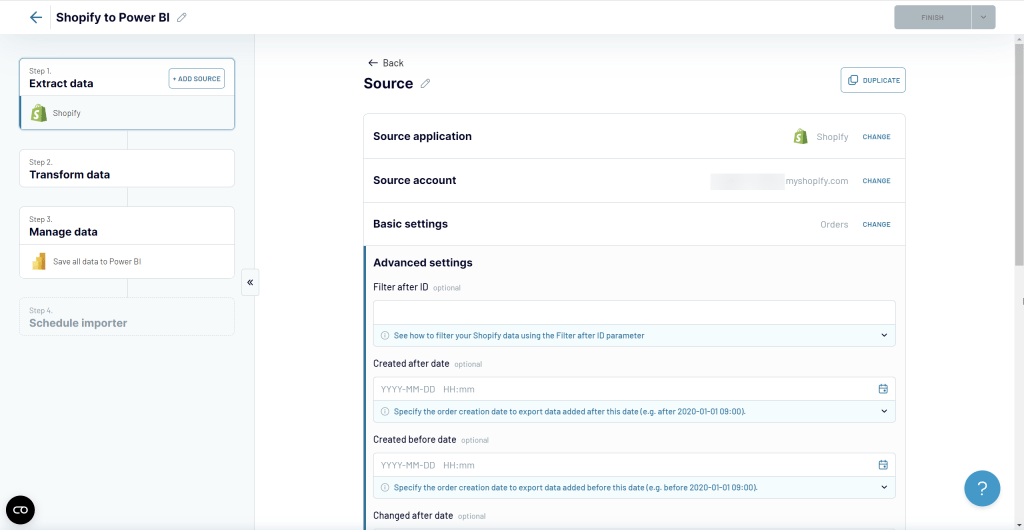
- Connect to your Shopify account. You’ll need to enter your full shop name and then log in to Shopify.
- Select the data entity to export from Shopify: customers, inventory, products, orders, and so on.
Optionally, you can specify the reporting dates for the records, filter them by status or by ID.
Coupler.io allows you to create reports using data from multiple sources. This means that you can collect information from different stores or even different apps. You can do this by clicking on the Add one more source button.
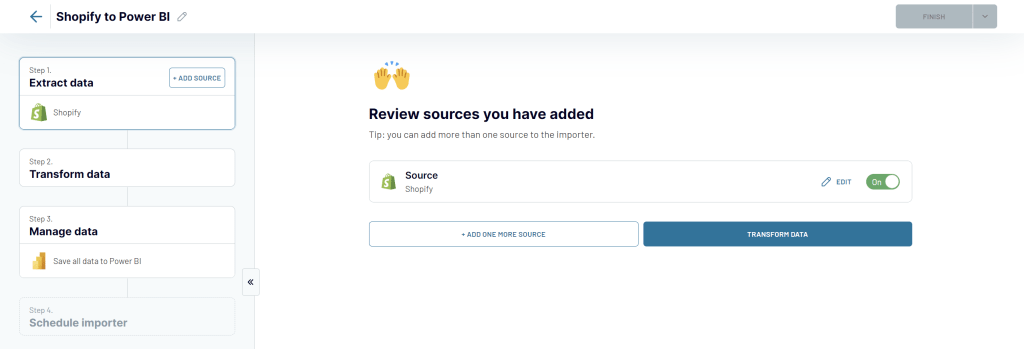
In our example, we won’t need this, so, let’s get to Transfrom data.
Step 2. Transform data
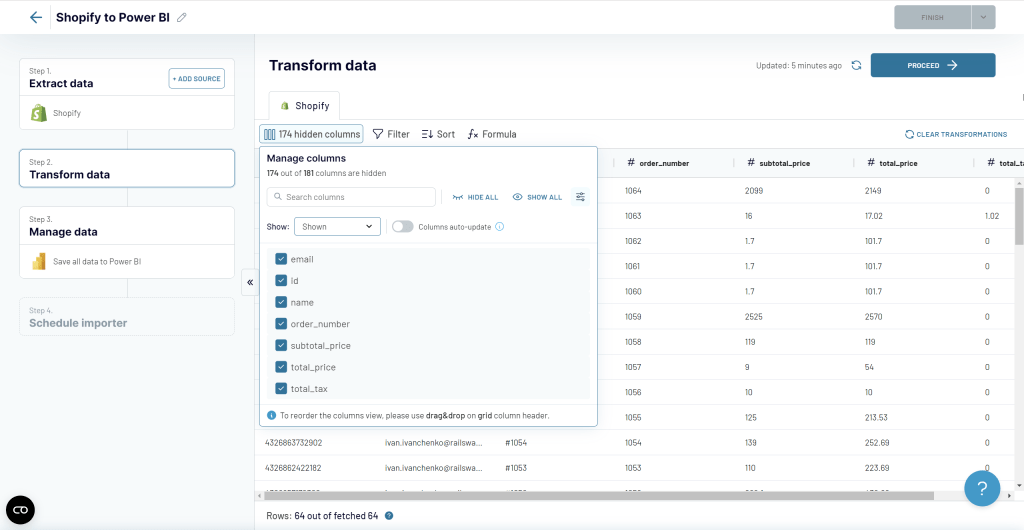
With Coupler.io, you can make your Shopify data analysis ready before it’s loaded to Power BI. This includes:
- Column management – you can hide and rename columns, as well as edit column types.
- Filter – you can filter data by different criteria
- Sort – you can add data sorting to your report
- Formula – you can create new columns using the supported formulas.
Step 3. Manage data
Once the data preparation is complete, you can connect Shopify to Power BI. Follow the instructions in the wizard which include the following steps:
- Save and Run the importer
- Copy the Power BI integration URL
- Go to Power BI desktop and navigate to Get data => Web.
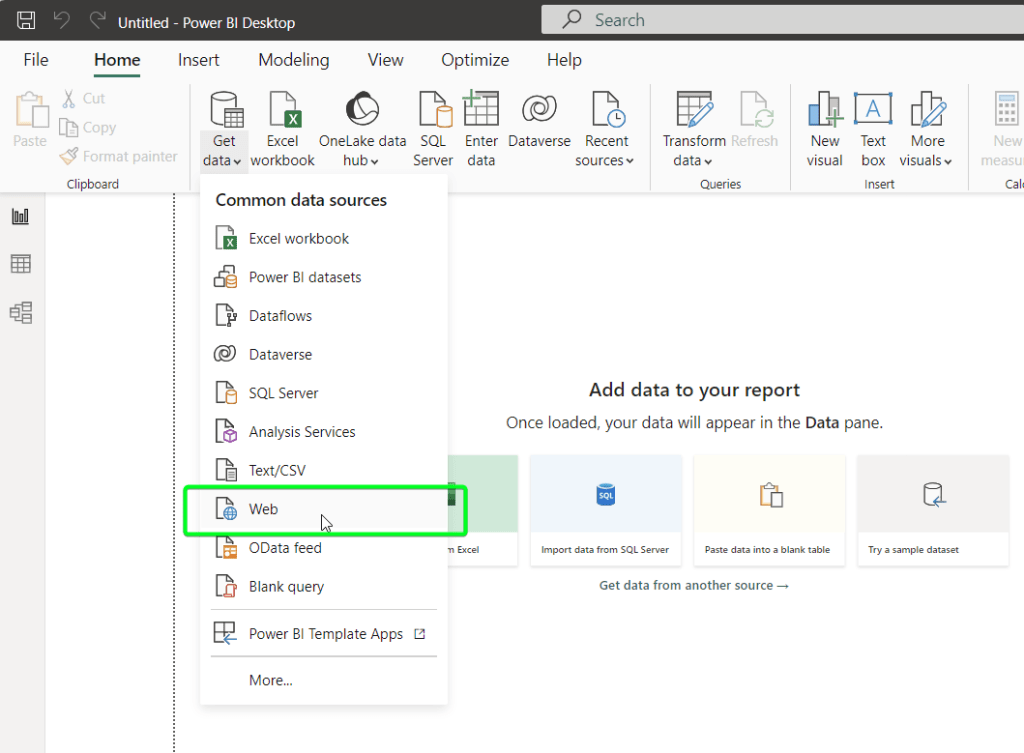
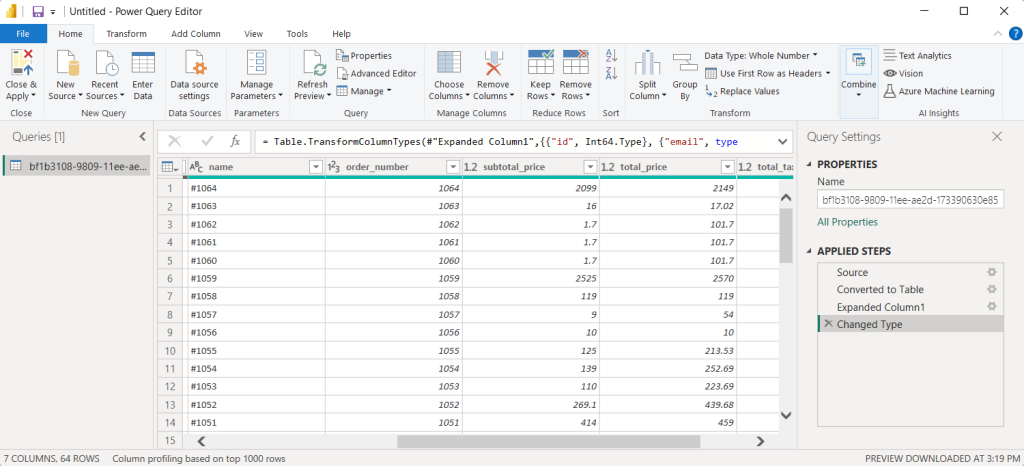
- Insert the integration URL and click OK. In a few moments, a Power Query Editor with your Shopify data will open.
From this part, you can get onto creating your report…hold on! We forgot about one crucial step that allows you to automate data flow from Shopify to Power BI.
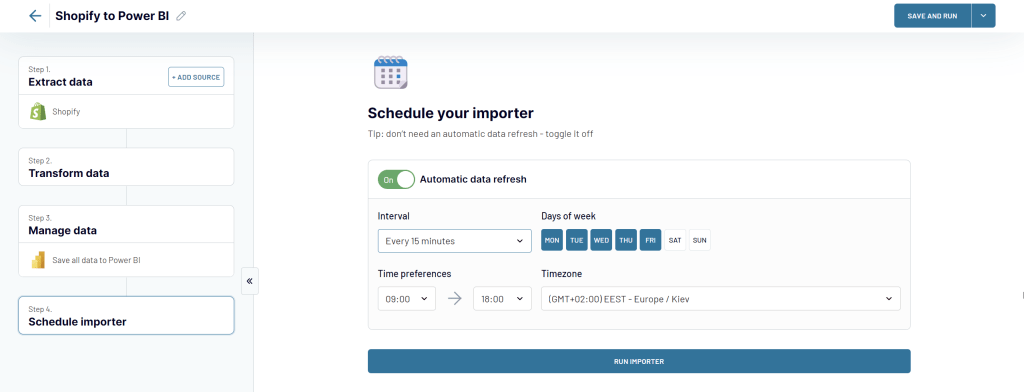
Step 4. Schedule importer
Get back to Coupler.io and toggle on the Automatic data refresh. You’ll see a schedule with the following parameters: interval, days of week, time preferences, and time zone. Customize it to your liking and enjoy the fully automated data flow from Shopify to your report in Power BI. You can have your data refreshed as frequently as every 15 minutes!
That’s it! In about 3 minutes, we’ve set up a no-code automation that integrates Shopify with Power BI.
Coupler.io supports other destinations including Google Sheets, BigQuery, Looker Studio, and Microsoft Excel. The latter can be used as a part of an alternative approach to connecting Shopify to Power BI. It looks as follows:
You need to import your Shopify data to an Excel workbook and then get data from it into Power BI. This method takes a bit more time to set up but is advantageous because you can:
- Analyze the raw data in Excel – check the latest sales, look up which products have sold, and find trends you wouldn’t have otherwise found in your Shopify dashboard.
- Import data from other applications into a workbook and jointly load it into Power BI – these could include Airtable, Pipedrive, Hubspot, QuickBooks, and many others.
- Finally, if you haven’t worked with your Shopify data before, you’ll have an easier time building charts in Power BI – simply because you’ll have the raw data in front of your eyes and will be able to pick meaningful metrics and build charts around them.
Let’s see how it works.
Сonnect Shopify to Power BI via Excel
The method of integrating Shopify to Power BI via Excel includes the following stages:
- Connect Shopify to Excel.
- Connect the Excel file to Power BI.
Stage 1: Connect Shopify to Excel
If you haven’t already done so, create a free Coupler.io account. Then, click on the button to create a new importer.
The first step is to choose the source and destination applications that you wish to pull the data from and to. Of course, in our case, the source app will be Shopify. The destination app will be Microsoft Excel to use the Shopify to Excel connection.
Complete the 4 steps of the setup process described in the section How to connect Shopify to Power BI. The flow is the same.
The only difference is that instead of Power BI, you’ll need to configure Excel as a destination. You’ll need to connect your Microsoft account and select a workbook and a worksheet to load data to.
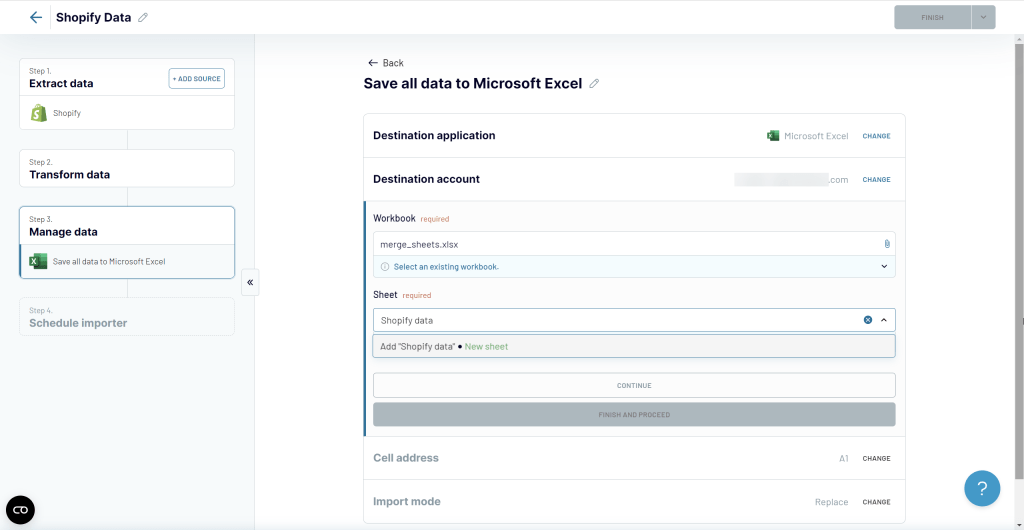
Once you run the importer, the data from Shopify will be loaded into the selected Excel workbook.
Stage 2: Adding an Excel workbook to Power BI
With your Shopify data now in Excel, the next step is to add the dataset to a report in Microsoft Power BI.
Doing so in the web version of Power BI is quite problematic, and lots of people report not being able to finish the process. We tried it as well while writing our Google Sheets to Power BI article and trying to import the Excel data but sadly we failed as well.
Eventually, we chose to resort to Power BI Desktop, and we’ll continue on this tool in this article.
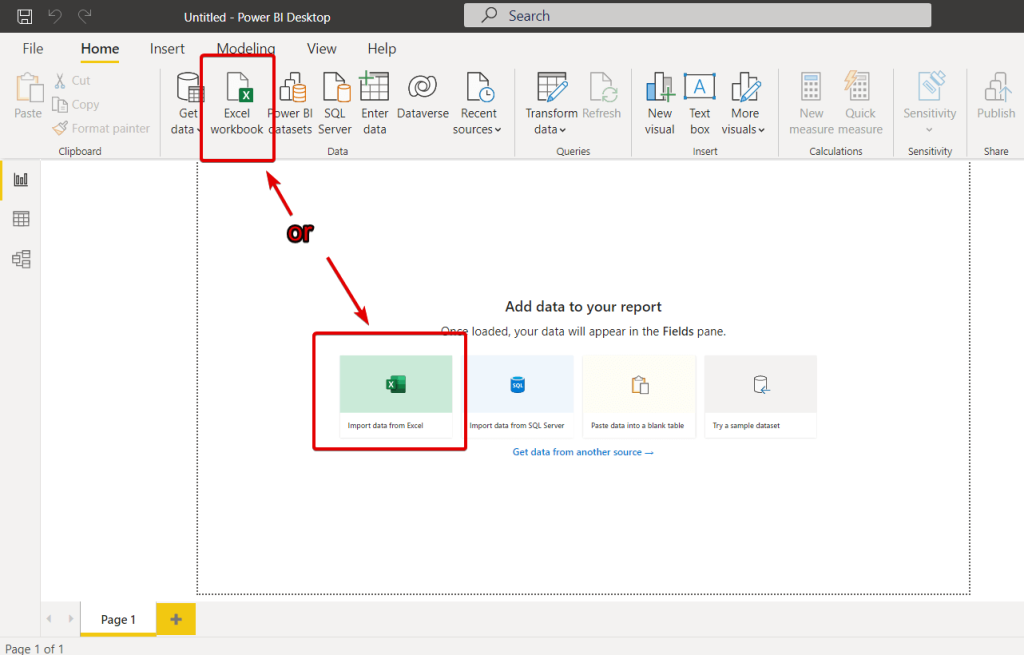
Launch Power BI and click the Import data from Excel icon on the home screen. You can also click the Excel Workbook button on the Home ribbon.
In your One Drive, find the Excel file with the Shopify data.
Important: Keep the Excel file in the OneDrive folder on your device to enable regular syncs with its equivalent in OneDrive storage. As the new data is imported from Shopify, the local Excel file will be updated and so will your Power BI charts.
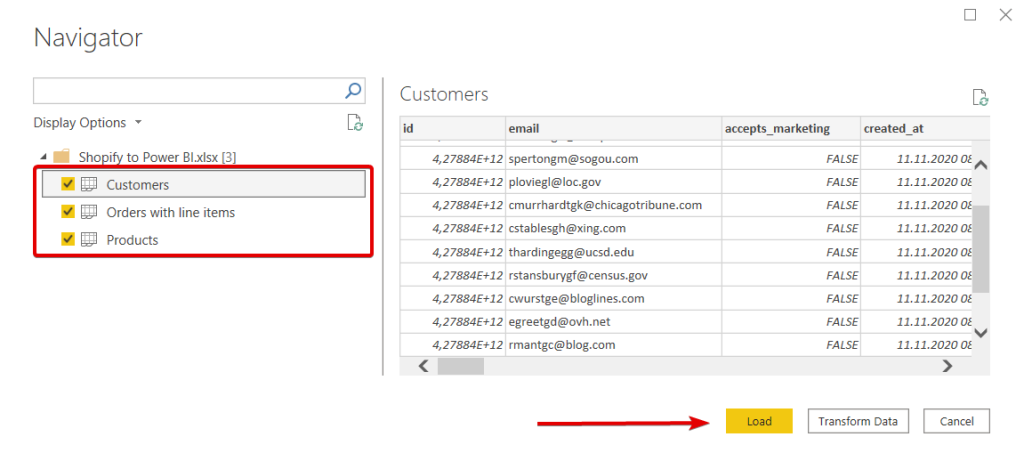
In the Navigator window, mark one or more worksheets to load the data to Power BI. Click Load.
That’s it! Your Shopify data is now ready to be used in Power BI.
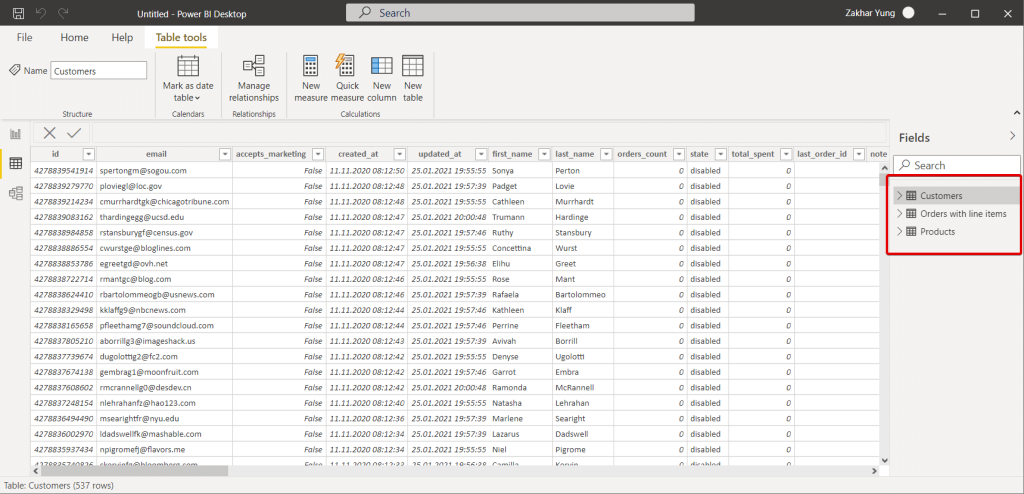
Analyze your Shopify data in Power BI
Now you can enjoy all the benefits of data visualization and analytics provided by Power BI. For starters, you’ll need to select fields from your dataset and choose the desired visualization. Check out our Power BI tutorial if you need a refresher.
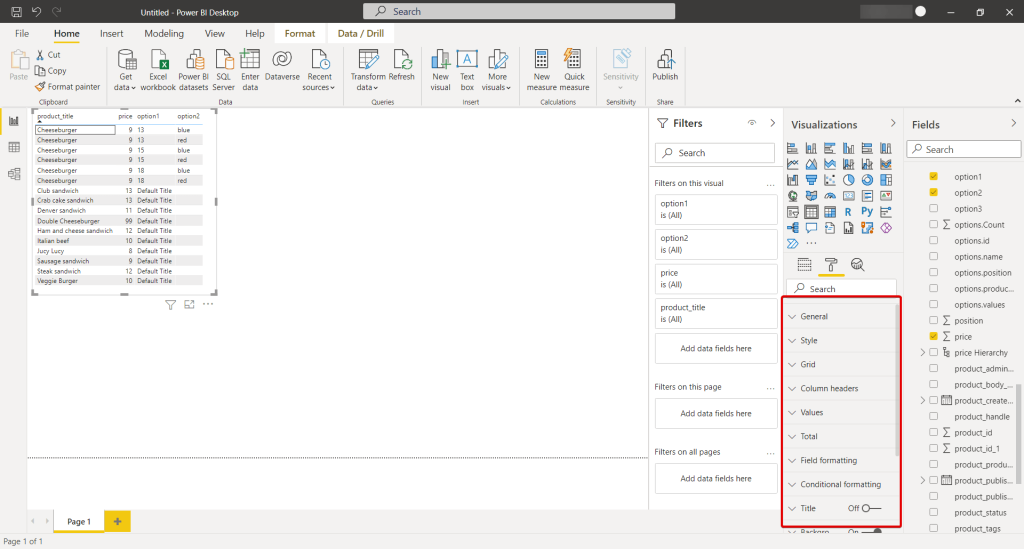
If you only select fields, a simple table will be generated containing your data. Naturally, you can customize its appearance, style, field formatting, and many other elements. Here is how it may look:
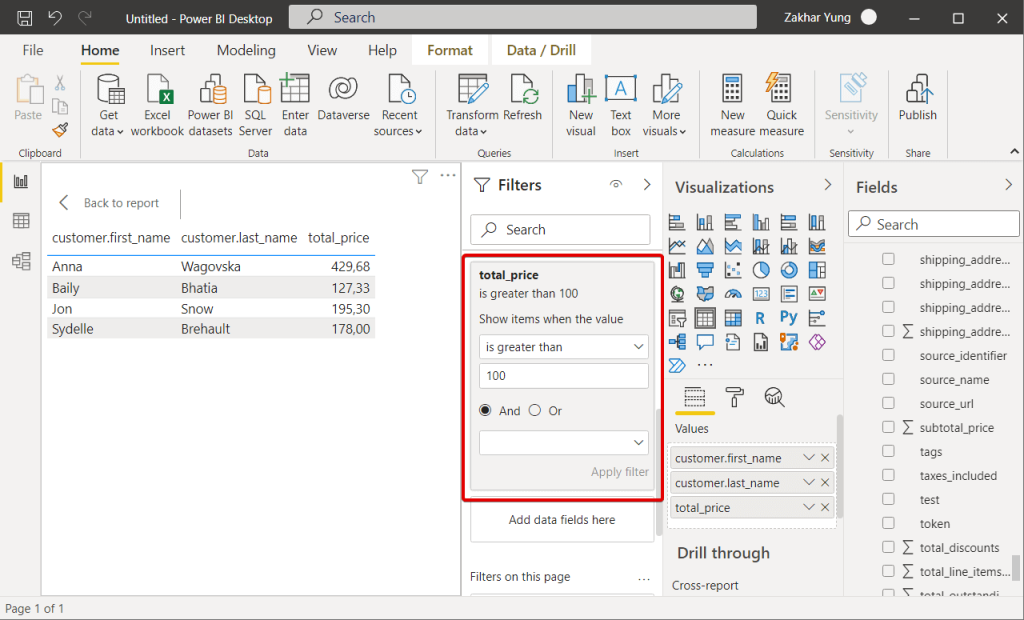
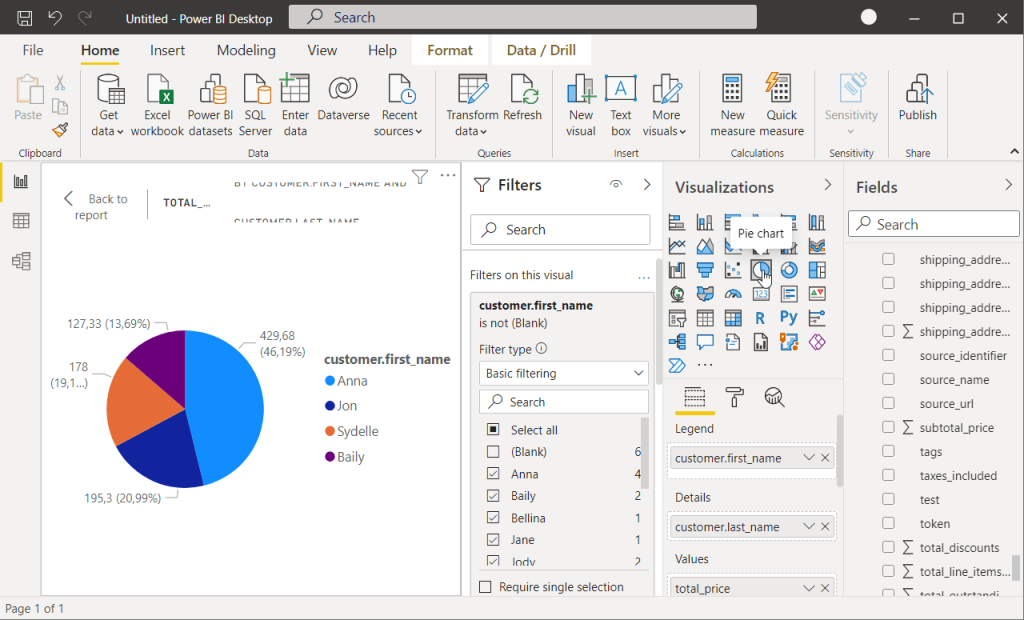
You can also filter the data you want to be displayed in the table. For example, we picked three fields from the Orders with line items Shopify import:
- customer.first_name
- customer.last_name
- total_price
However, we don’t need the list of all customers who have ever bought from us. Instead, we prefer to display only the customers with orders greater than $100. We applied this condition in the Filter section, and here’s the outcome:
It would be cool to also visualize this as, for example, a pie chart. To do so, click on the respective icon in the Visualizations section, and there you go:
Of course, you can do a lot more with the data at your disposal. Power BI provides plenty of amazing functions and features for reporting and analytics. Enjoy them and have fun building your Shopify analytics dashboard and other charts for your business.
Connecting Shopify to Power BI: Recap
As you can see, it’s easy to connect Shopify to Microsoft Power BI, whether you choose a direct integration or decide to import to Excel first. The latter in particular is very beneficial because you get to see the essential data of your store in your favorite spreadsheet tool.
And if Excel isn’t exactly your favorite, you’ll be happy to know that you can also connect Google Sheets and Power BI. In another article, we also described how to create a graph in Google Sheets – maybe that’s something that would work well for your Shopify data?
Finally, Google Data Studio is a popular choice with Shopify store owners. They love it for its simplicity and seamless connection with other Google services. You can find out a lot more about this integration in our Shopify to Data Studio guide.
Choose what works best for you – there are plenty of possibilities. Thanks!


