Impressions, clicks, reach, and the list of Instagram Ads metrics go on.
It can be overwhelming at first to track each one of them for your ad campaigns. You might end up focusing on irrelevant metrics, which can lead to lost opportunities and money.
In this article, we’ll take you through the Instagram Ads metrics that can help you understand the performance of your ad campaigns. Additionally, we’ll also look at the different ways to track and measure Instagram marketing effectively.
10 Instagram Ads metrics you should track
1. Impressions
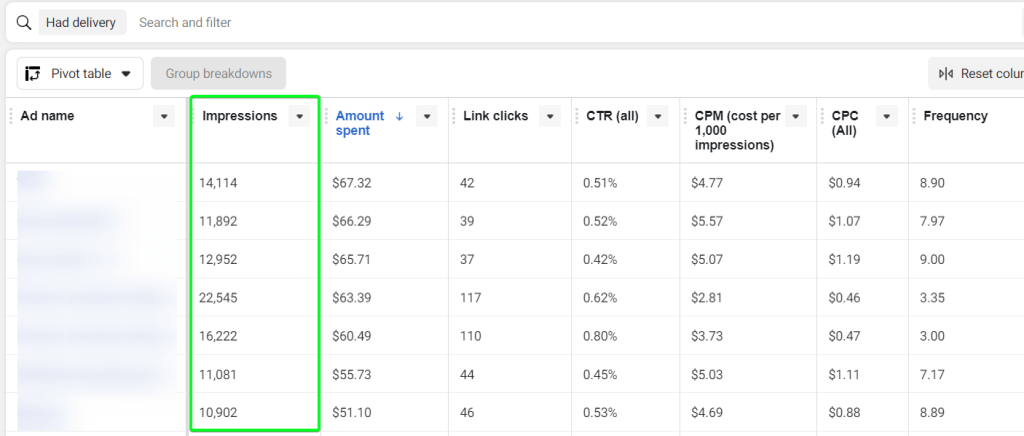
Impressions are the total number of times an ad is shown to the users. If the ad is displayed 20 times to the same user, then you have 20 impressions.
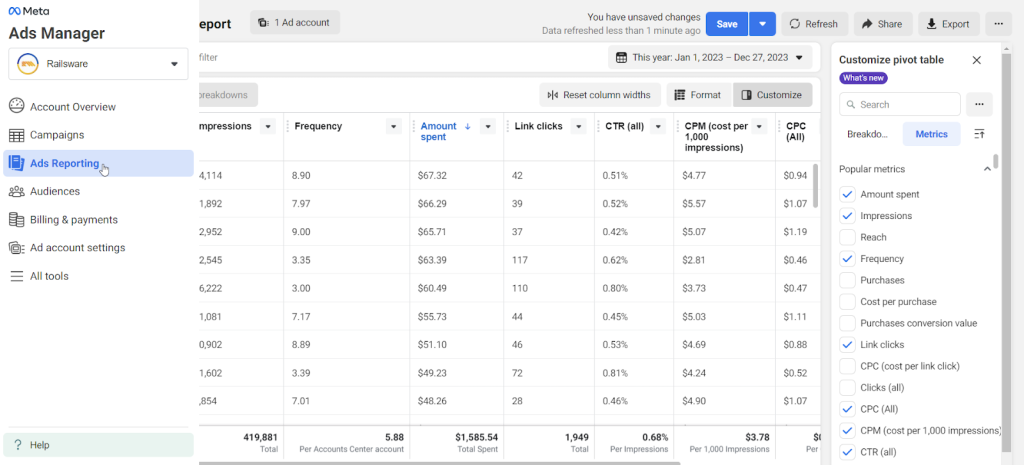
You can find the number of impressions of your ad in the Meta Ads Manager for a specific timeframe.
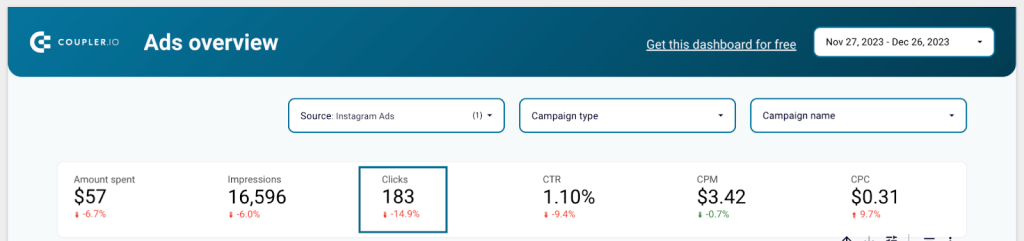
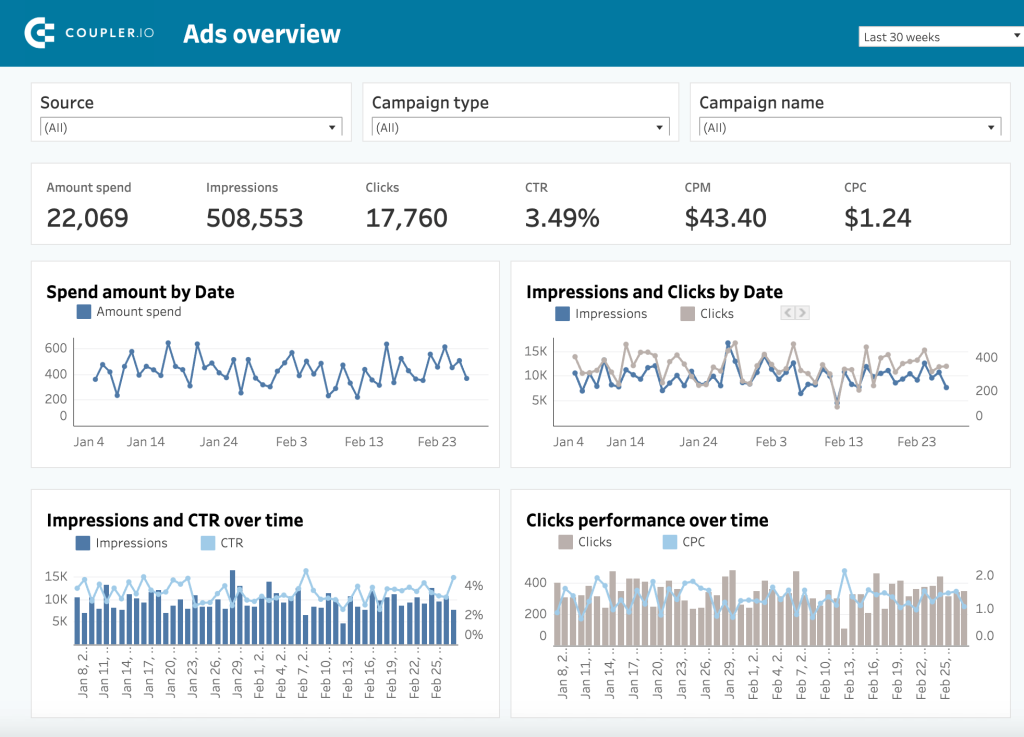
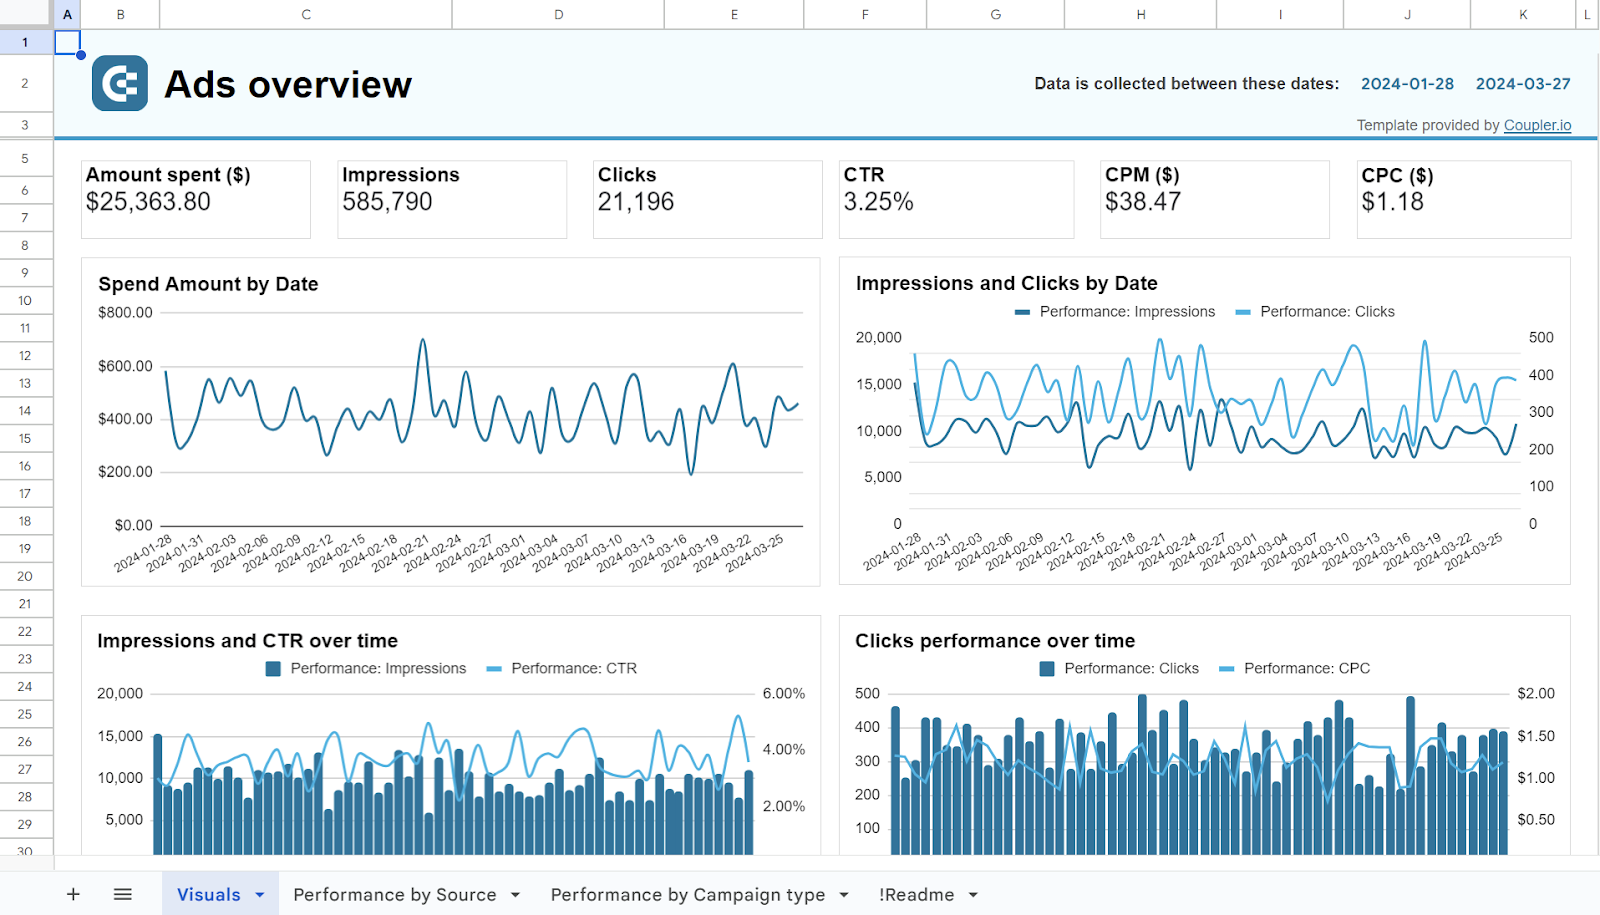
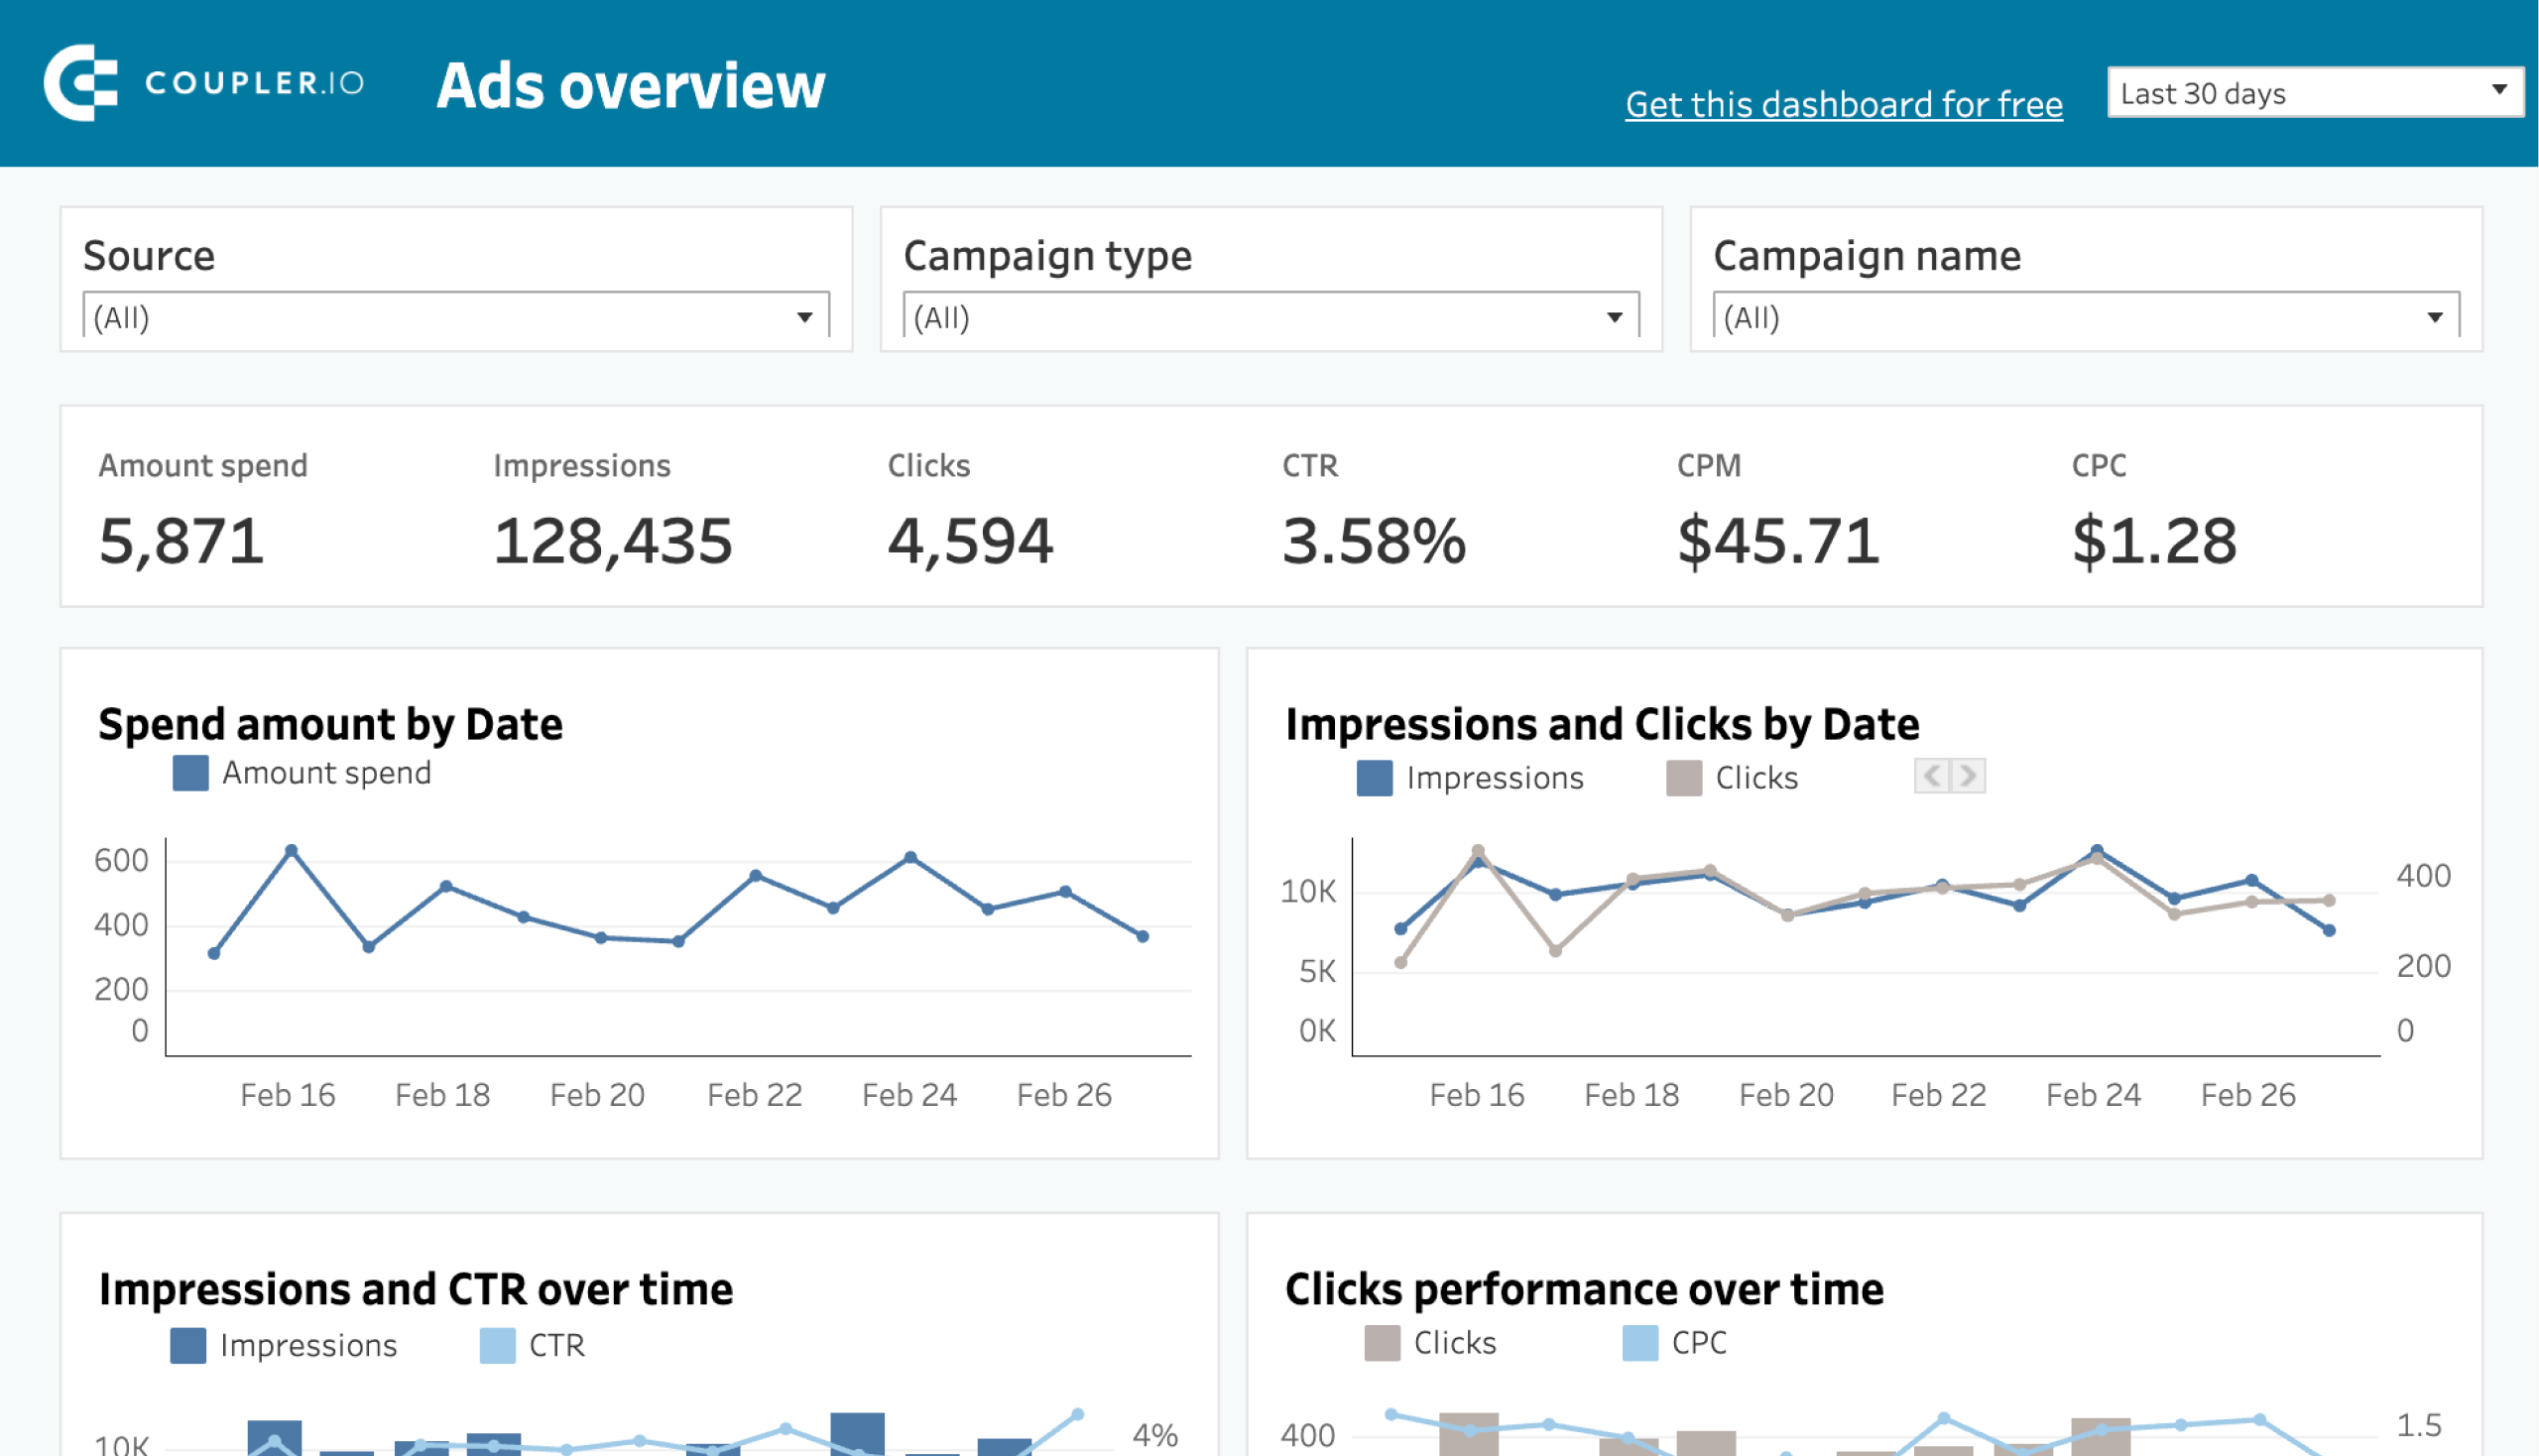
When you use an interactive PPC dashboard like the one Coupler.io offers for free, the number of impressions can be visualized better.
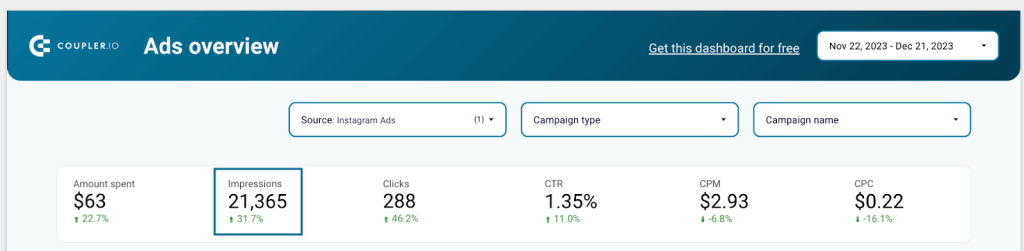
By tracking impressions, you can understand the visibility of your social media ad. If the number is low, you can adjust your budget and targeting. If the number of impressions was high in the beginning and is gradually dropping, then it is time to change the creatives (videos, reels, Instagram posts, Instagram stories, etc) and make it more interesting.
For an awareness campaign, impressions can be an important metric. You can combine it with other key metrics for Instagram Ads like clicks, CTR, and more to understand the ad performance better.
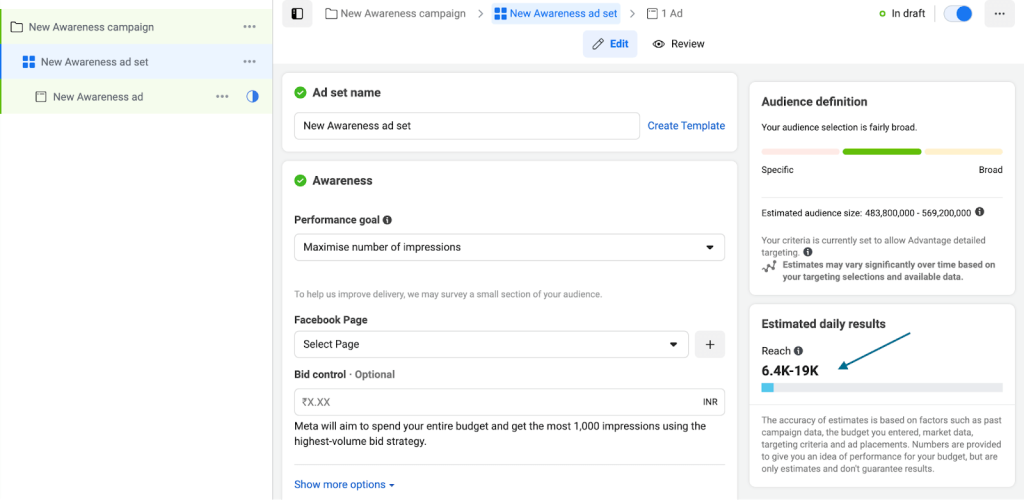
There is no standard benchmark for impressions. It will completely depend on your performance goal, budget, demographics, and targeting. When you are setting up the ad set of an awareness campaign, you can see an estimated reach on the right side of the screen. While reach is the number of unique users that saw your ad, and it is not equal to impressions, it can still be used as a relevant benchmark for reference.
2. Link clicks
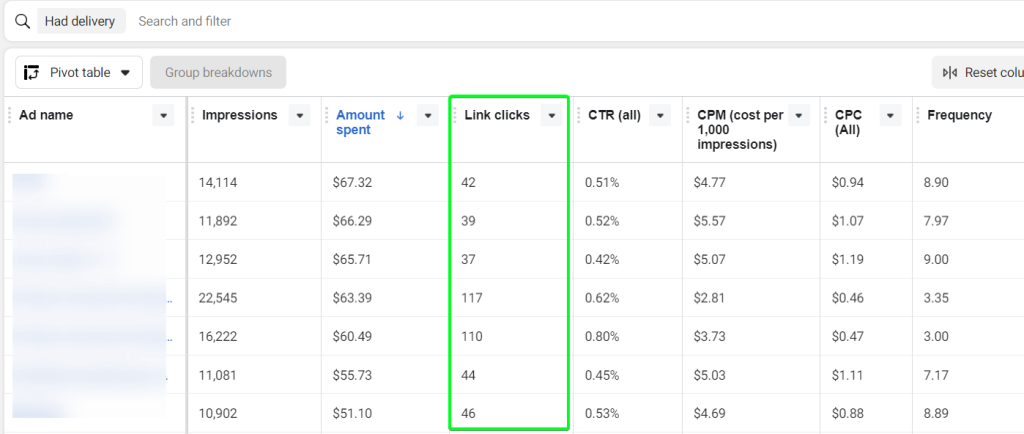
Link clicks are measured as the number of times users click on your ad. This link can be directed to a website, app, messaging app, Instagram account, or call.
You can view the number of link clicks in a table using Meta Ads Manager.
You can also see the number of link clicks on a PPC dashboard like this.
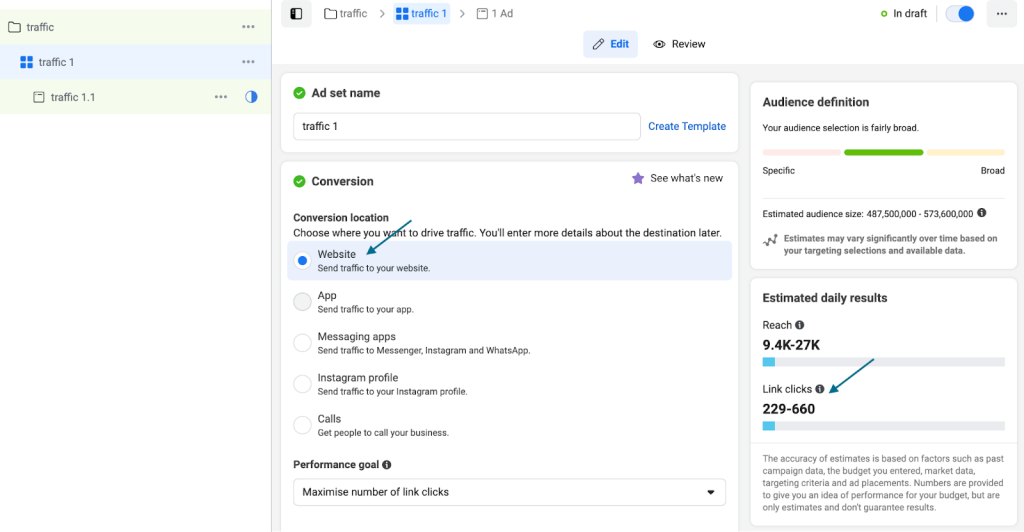
Knowing the number of link clicks can help you understand the post engagement if the ad was interesting to your target audience. Similar to impressions, there is no set benchmark for link clicks but you can check the estimated link clicks while setting up the ad set of your campaign.
Please note that your campaign objective should be set to ‘traffic’ and select the conversion location as ‘website’ to see the estimated number of link clicks.
If the link clicks are less than the lower limit, then you need to check if the CTA is clear and compelling, the target audience is relevant, and the ad creative is engaging.
3. CTR
The link clicks are more than you expected. But at the cost of how many impressions?
CTR (Click-through rate) is a percentage of how often users who see your ad end up clicking on it. Here is the formula to calculate CTR:
CTR = (total number of clicks/ Total number of impressions) * 100You can view this under Ad Reporting in the Meta Ads Manager.
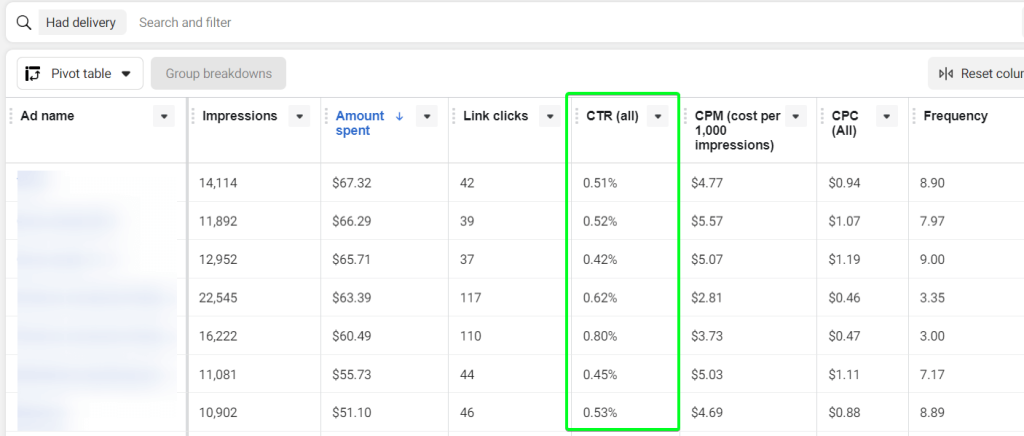
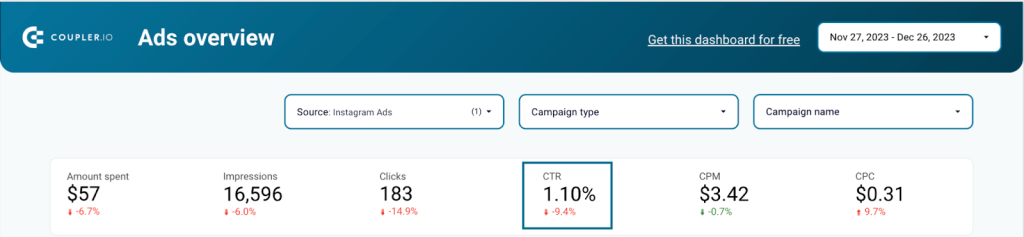
Or, you can also choose to see this in an interactive PPC dashboard like the one below.
The industry standard benchmark for CTR is 0.5% to 1%. This number can vary slightly for different industries and ad formats.
A high CTR means more people who see your ad are interested enough to click on it. You can use this metric to understand the ad relevance and ad creative effectiveness. You can also replicate them in future Instagram marketing campaigns. For a low CTR, you can consider checking the ad’s quality, its relevance to the targeted audience, and any potential ad fatigue factors. You can use A/B testing for creatives and ad copy.
4. Amount spent
Spend amount tells you the total amount of money spent on the ad campaign for a specific period. This information is automatically tracked by Meta Ads Manager and is visible in the Ad reports.
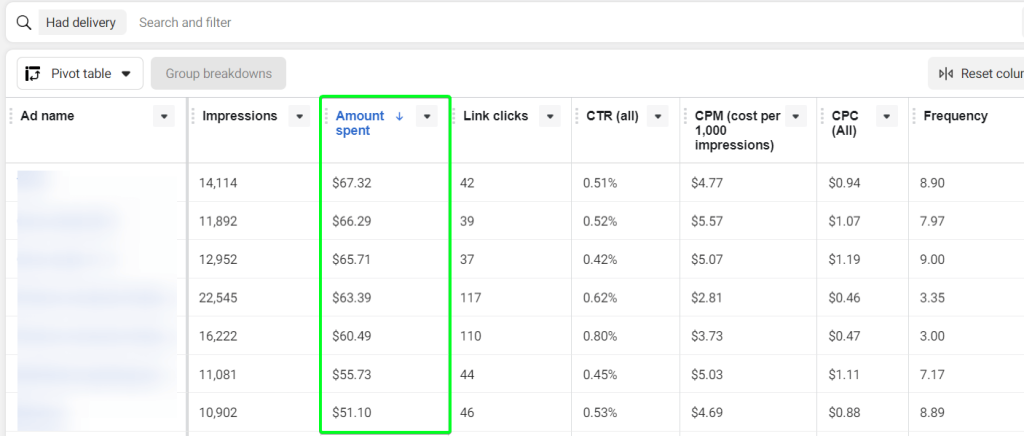
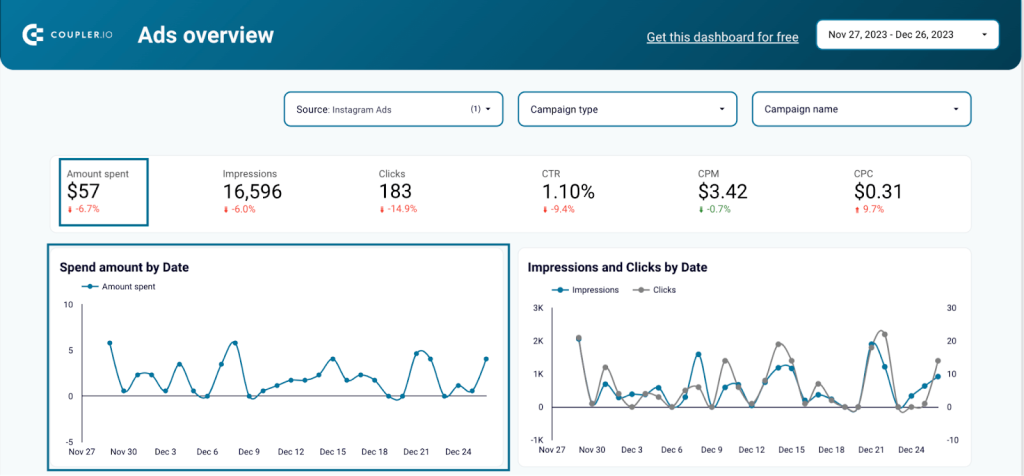
Just select the time period. You can see the total spend amount and a line chart of the amount spent every day during that period.
The spend amount gives a clear picture of the campaign’s reach and how the budget is allocated to achieve ad objectives on Instagram. A high spend usually means a broader reach and aggressive ad delivery. But if you are not seeing proportional results in terms of reach, impressions, or conversions then it shows inefficiencies in social media marketing strategy.
There is no specific benchmark for how much amount you should spend on an Instagram ad campaign. It depends on your advertising goals and total budget. But Instagram suggests you start testing your campaigns with at least $5 every day.
5. CPM
CPM (Cost Per Mile) represents the cost of your ad displayed to users 1000 times.
The cost per single impression can be very low, making it difficult to include in the performance calculations. When it is multiplied by 1000 it gives a significant value which can be used for further analysis.
CPM = (Total amount spent/ Total number of impressions) * 1000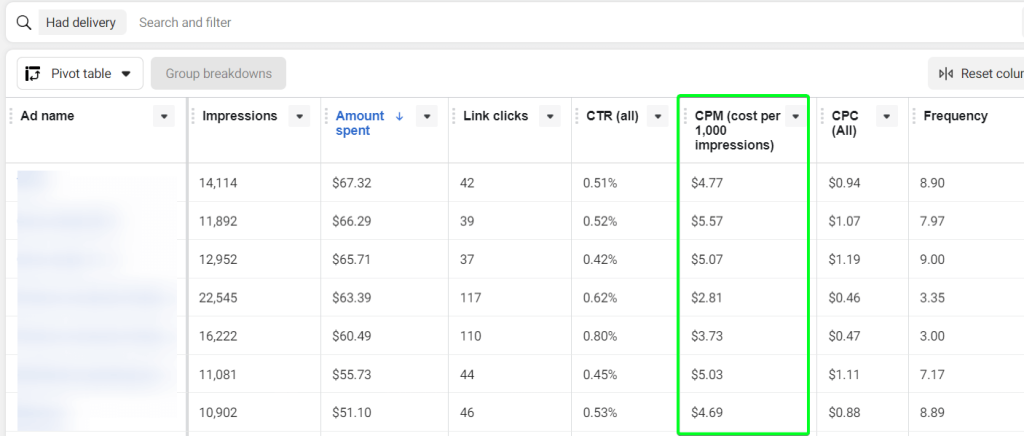
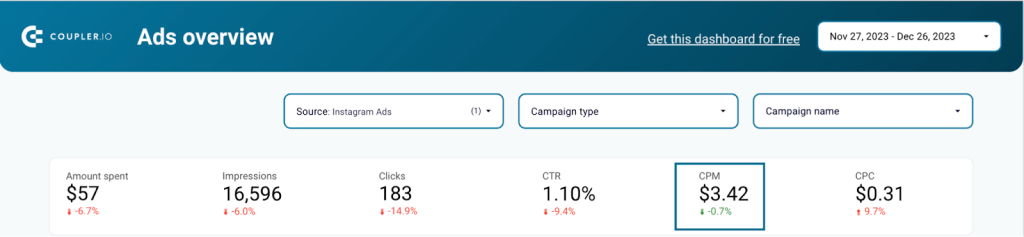
The CPM can look like this on your Instagram reporting dashboard.
Understanding CPM helps in evaluating the cost efficiency of your ad campaign. It tells you how much you are paying to get your ad in front of people.
An average CPM benchmark is $7.91. It is subject to change for different days, weeks, and months of the year. A low CPM means you’re reaching more people for less money, whereas a high CPM might be due to increased competition or targeting a more in-demand audience.
You can use A/B testing to find the ad placements, creatives, and targeting that can work well for you.
6. CPC
CPC, or Cost Per Click, is used to measure the cost of each click on your ad. CPC helps you understand the cost-effectiveness of your campaign in generating user engagement.
It is calculated as below.
CPC = Total ad spend/ Number of clicksThis metric is automatically tracked by the Meta Ads Manager and displayed in the Instagram ad performance metrics.
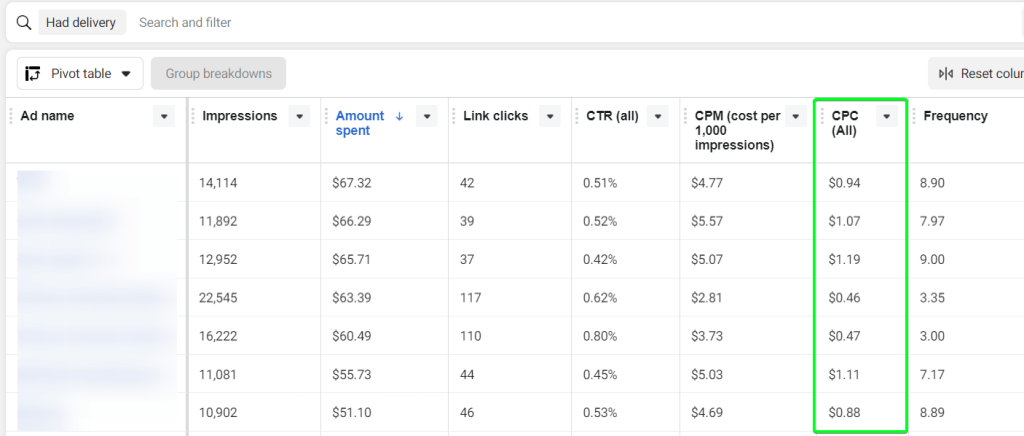
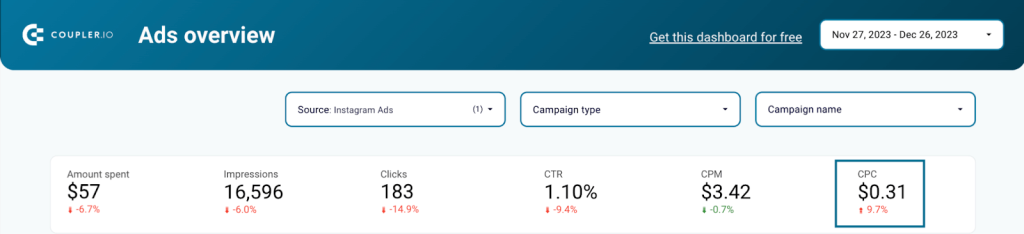
You can view the CPC highlighted in the top metric of our PPC dashboard.
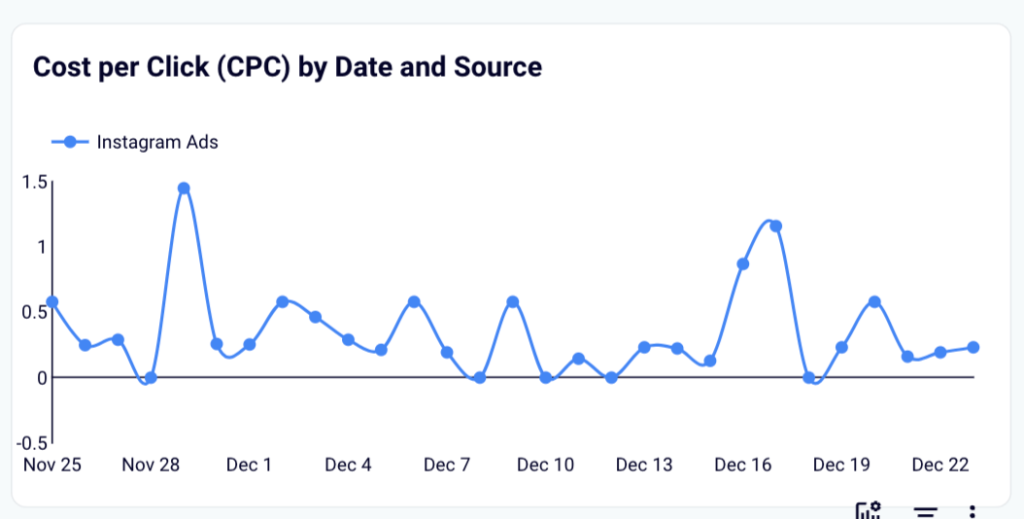
By tracking CPC as a line graph by date, you can identify trends in the cost fluctuations over time.
The benchmark for CPC can vary significantly based on industry, target audience, and competitiveness of the ad environment. Generally, it ranges from $0.5 to $3 on Instagram. A lower CPC means you are paying less money for more clicks, which leads to higher efficiency in engaging potential customers.
To improve your CPC, focus on creating more relevant ad content that resonates with the target audience. This will improve the CTR and eventually result in a lower CPC. Regularly monitoring and optimizing for CPC is important to maximize ROAS and manage ad budget effectively.
7. Ad Frequency
Ad frequency indicates the average number of times each user has seen your ad. This metric is calculated by the following formula:
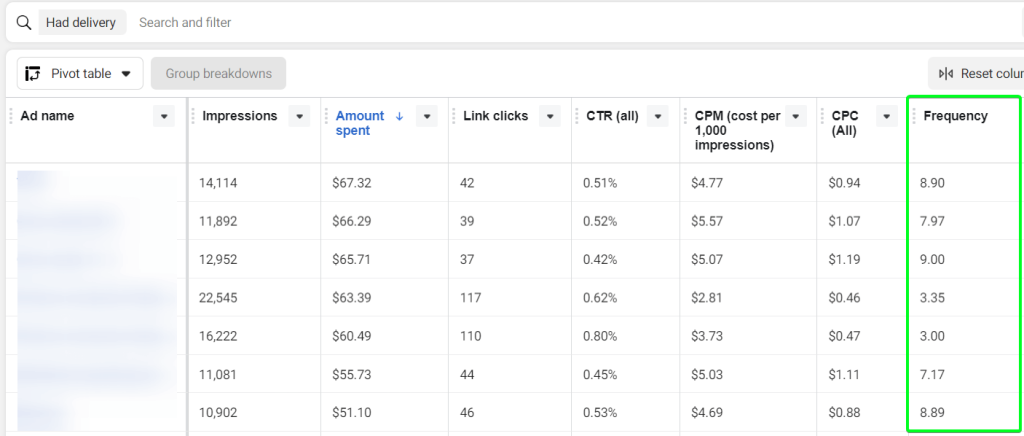
Ad frequency = total number of impressions/ total reachIt is also readily available in the Meta Ads Manager under campaign performance reports.
Ad frequency is used to understand the repetition of the ad’s display to the same audience. While repetition can help in brand recall, a higher frequency can also lead to ad fatigue, where Instagram users can become less responsive to the ad.
A frequency of 1 to 2 can be effective for short-term campaigns. However, for brand-building or awareness campaigns, a higher frequency is preferred.
If the frequency is too high for regular campaigns, you can broaden the target audience and rotate different creatives to keep the audience engaged.
8. Conversions
Conversions are the number of times users complete a desired action after interacting with your ad. This action can be making a purchase, signing up for a newsletter, or downloading an app.
To track these conversions and conversion rates effectively, you need to define a conversion for your campaign on Instagram and set up appropriate tracking using Facebook Pixel or API. Then the Meta Ads Manager will calculate and show the number of conversions from your ads.
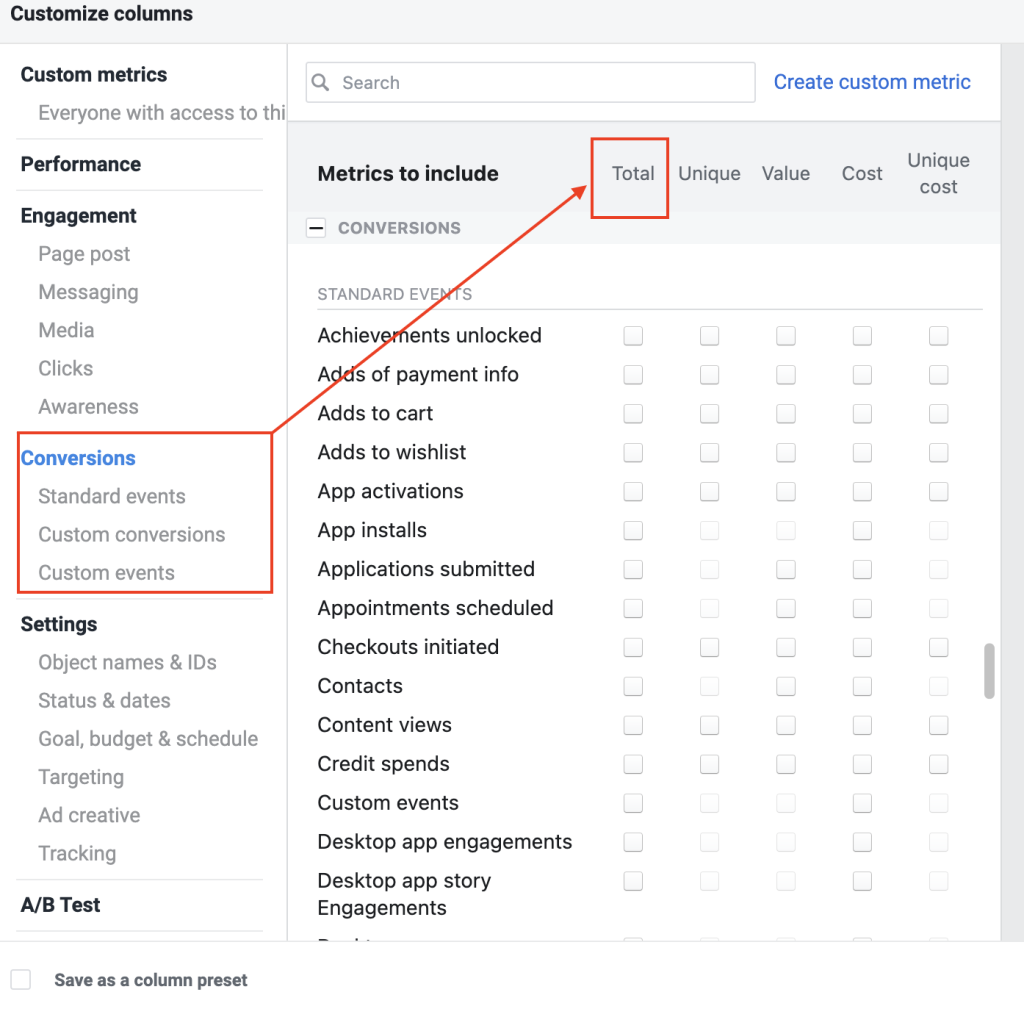
Depending on the type of conversion, you can choose the conversion metrics from the list of Instagram ad performance metrics. Make sure to click on ‘Total’ to get the total conversions.
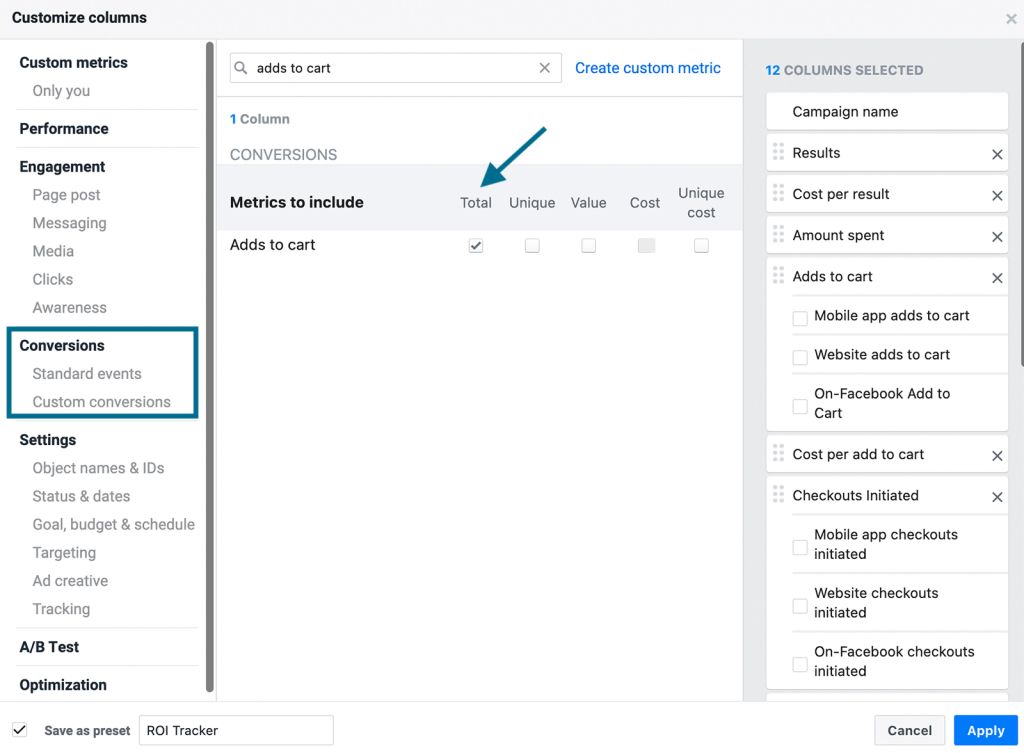
Conversions have a direct impact on your business goals and are a key indicator of return on investment (ROI). It shows if the amount spent is converted into tangible results.
It is difficult to have a set benchmark for conversions as it largely depends on the type of conversion, the funnel stages, and the industry. The best way to assess your conversion campaigns is by comparing them with industry averages and your past campaign performances.
If your conversions are low, then it is very important to identify the core problem. It can be creatives, the target audience, landing pages, and the funnel. You need to continuously test different elements, analyze the conversion data, and fine-tune your strategies.
9. Cost per conversion
Cost per conversion is used to calculate the amount spent to convert a single user. It is calculated by the following formula;
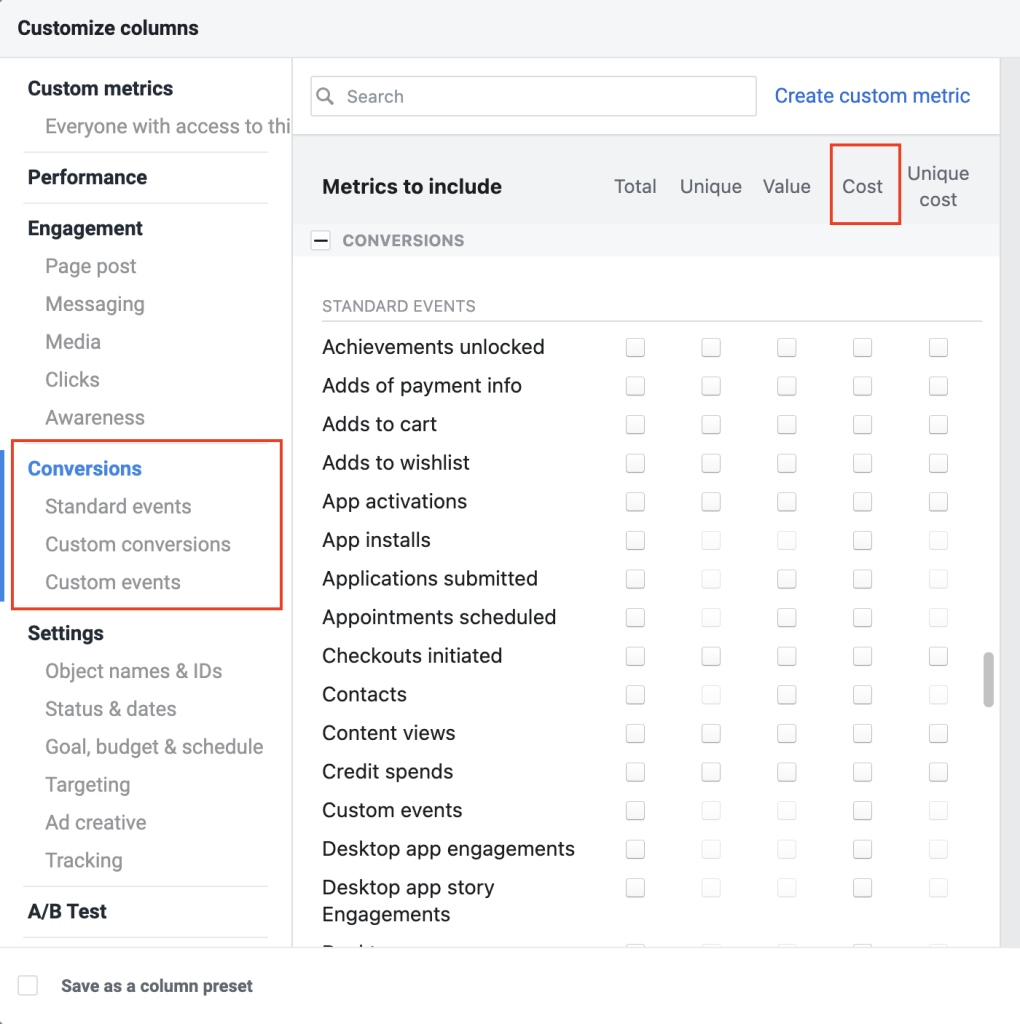
Cost per conversion = Total amount spent on the ad campaign/ Number of conversionsOnce you set up the conversion on Meta Ads Manager, you can select the ‘cost’ button while choosing the conversion metrics.
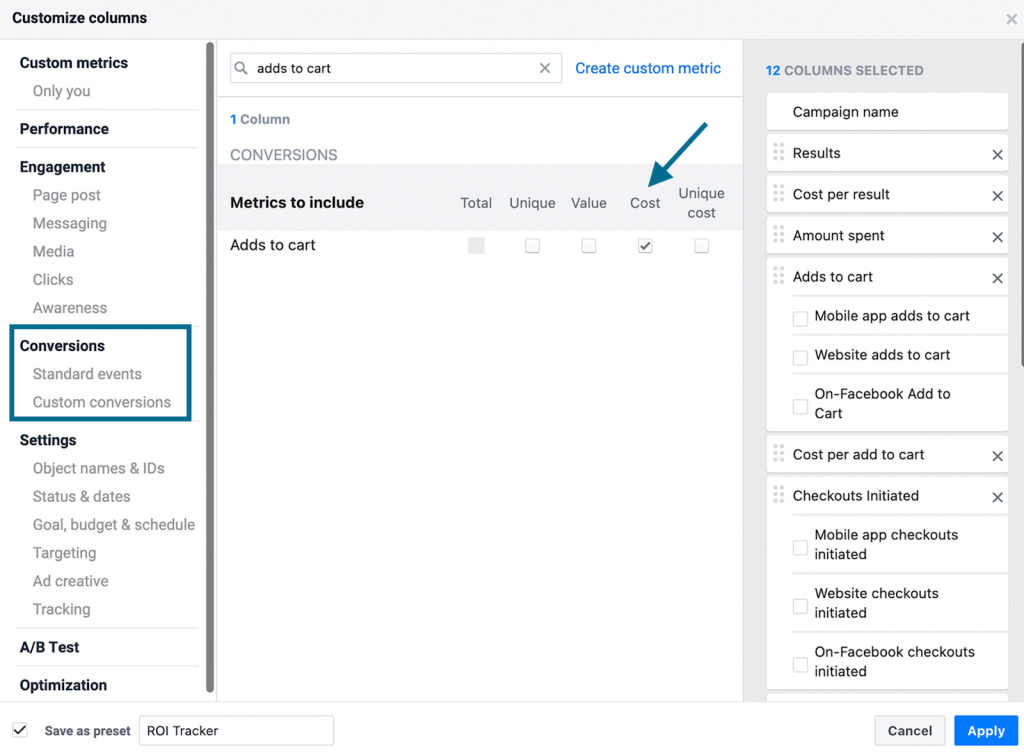
You can also create a custom metric for cost per conversion in the Ads Reporting. For example, we considered the conversion action as ‘unique landing page views’ and created a custom metric for cost per unique landing page view using the formula;
Cost per unique landing page view = Total amount spent on the ad campaign/ Total number of unique landing page views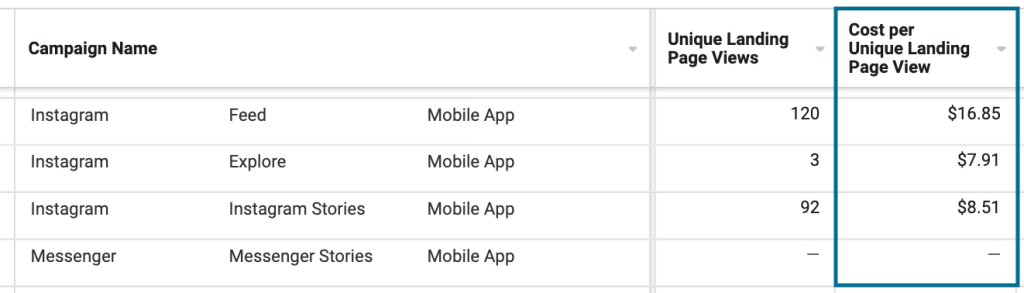
Cost per conversion helps in measuring the effectiveness of the ad campaign in driving the desired actions like landing page views, sign-ups, purchases, and more. It shows how efficiently the ad budget is used.
Similar to conversions, there is no standard benchmark for cost per conversion as it depends on the nature of the action and the complexity of the funnel. You can always check for industry averages and past performance to set a benchmark for your future campaigns.
A high cost per conversion means you are spending more money than usual for a particular action. To optimize this cost, regularly testing and adjusting various aspects of your campaign, like the ad creatives, targeting parameters, and bidding strategies, can lead to a more favorable cost per conversion.
10. ROAS
ROAS, or Return on Ad Spend measures the revenue generated for every dollar spent on Instagram ads. This is calculated as below:
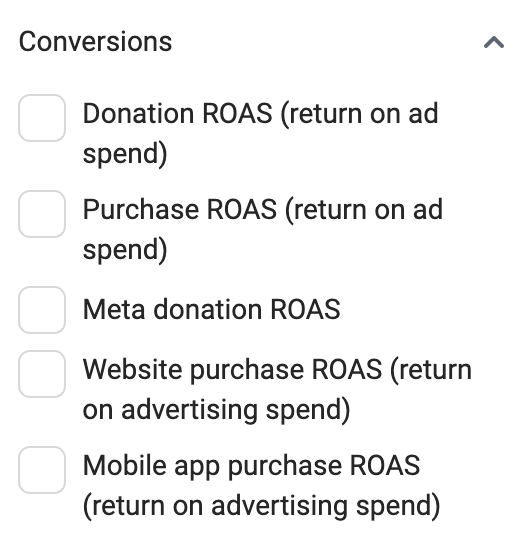
ROAS = Total revenue generated from the ad campaign/ Total ad spendThe Ad Reporting in Meta Ads Manager has different ROAS metrics based on the type of conversions.
A healthy benchmark for Instagram Ads ROAS is 4:1, which means you earn $4 in revenue for every $1 spent on ads. A high ROAS shows that your ads have successfully reached and converted the users into paying customers, making your ad spend profitable.
If you have a low ROAS, you can start by allocating budgets effectively and optimizing your social media strategy. This includes optimizing ad targeting to reach more potential buyers, refining ad creatives, landing page optimization, regularly analyzing the ad data, and more.
How to measure and track Instagram Ads performance metrics?
To understand and get actionable insights from these Instagram Ads metrics, it is important to measure and track them correctly. Otherwise, you might risk making decisions based on incorrect data.
You can measure and track Instagram Ads metrics in three different ways.
- Meta Ads Manager: This is formerly called Facebook Ads Manager where you set up all your Facebook and Instagram Ads analytics. Under Ads Reporting, you’ll see all the past and running campaigns. You can select the Instagram ad performance metrics you want to see in the Ad report and build a pivot table accordingly. For better visualization of insights, you can export Instagram Ads data to a data visualization platform like Looker Studio.
- PPC dashboards and report templates: You can use Coupler.io’s PPC dashboard template that allows you to analyze the performance of multiple advertising platforms including Instagram. Explore other available Instagram report templates.
- Instagram Ads Insights: This method can be used in the Instagram app, where you can see some basic metrics like Instagram profile visits, website traffic, accounts reached, Instagram followers, and more. You cannot see other metrics for Instagram ads like engagement rate, CPC, CTR, conversions, and ROAS.
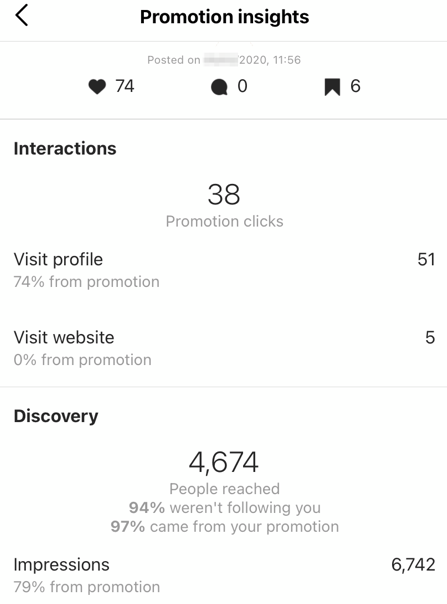
Instagram Ads Insights is limited to view-only and cannot be used for advanced reporting. It is good to get a quick look at the basic metrics for Instagram ads. But if you want to analyze the ad data, then let’s look at the next methods.
Now let’s see how you can use each one of these methods to turn the Instagram Ads data into actionable Instagram insights. We’ll not be discussing the Instagram Ads Insights method, as it does not support advanced reporting.
How to turn Instagram Ads metrics data into actionable insights with Coupler.io?
Coupler.io is an all-in-one reporting automation solution that can turn complex data into simple reports.
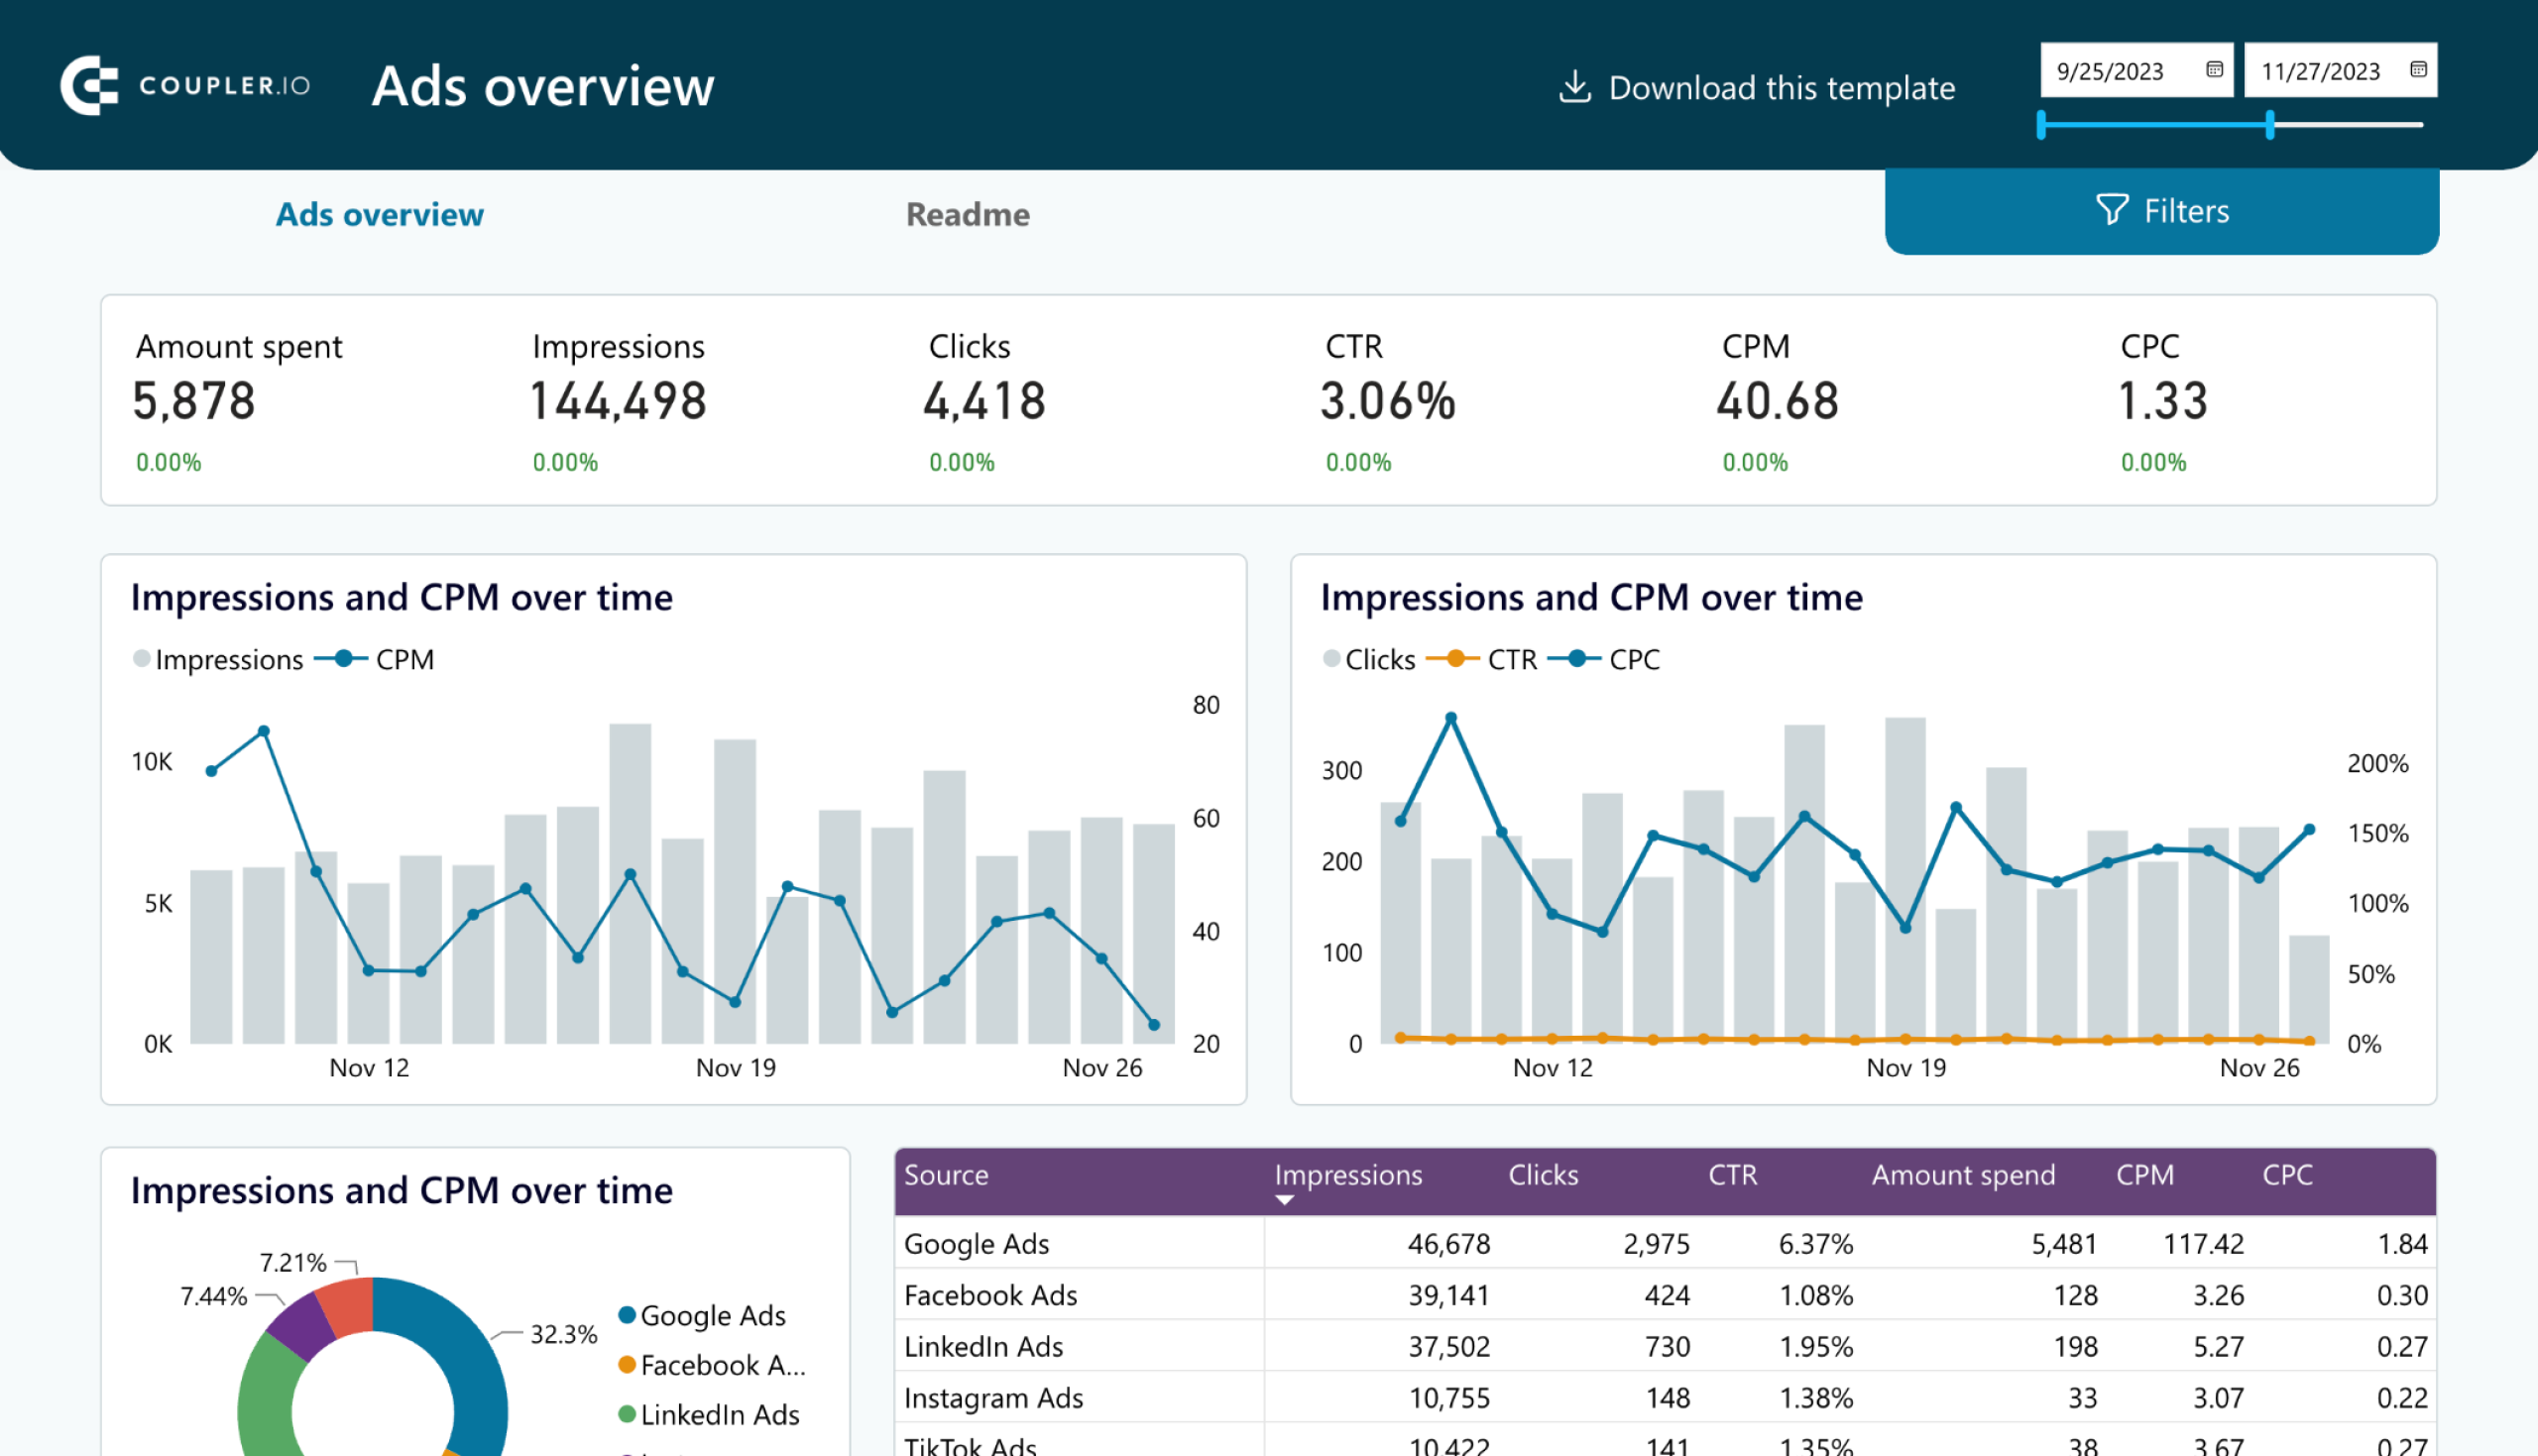
It provides a set of PPC reporting templates for different ad channels. To analyze the performance of Instagram Ads, you can start with the PPC-multi-channel dashboard. It supports multiple ad sources but you can only select Instagram Ads to get an exclusive Instagram Ads performance report.
Follow the steps in the setup guide of the dashboard template to connect your Instagram Ads account. Once the applications are connected, you can now see the Instagram Ads dashboard with your own data.
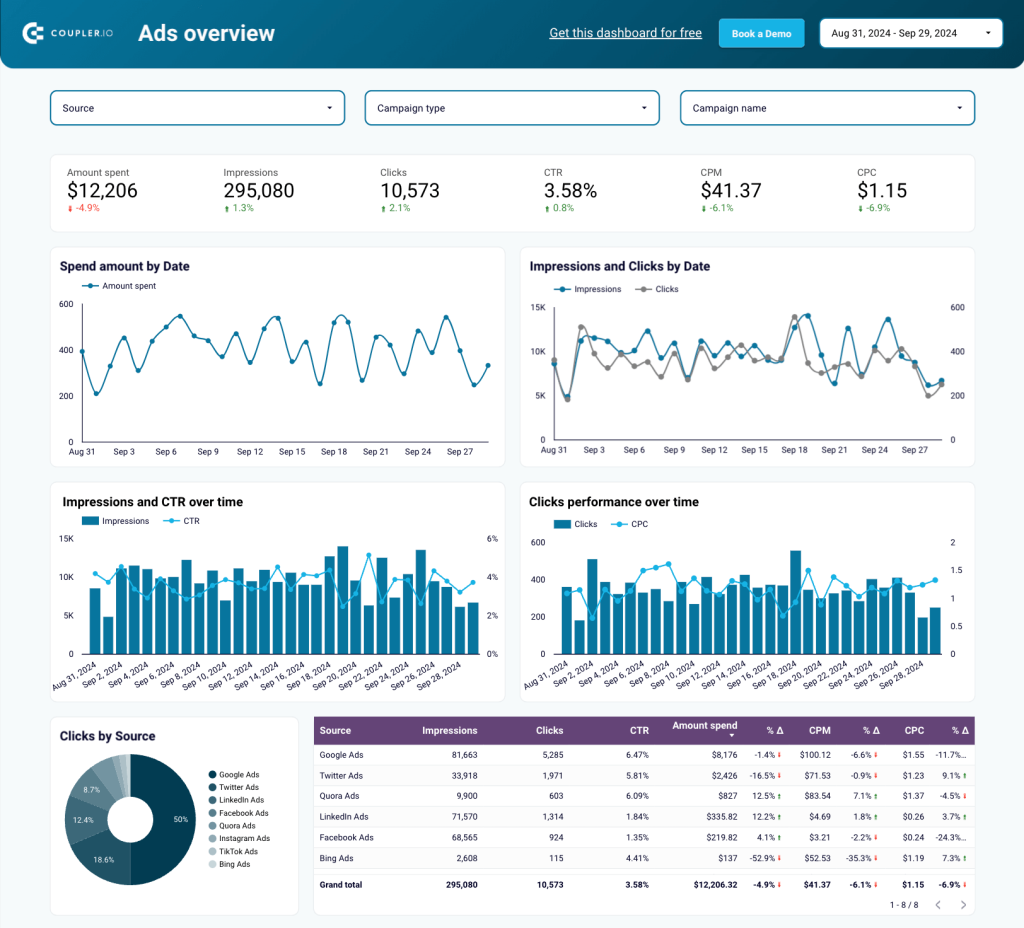
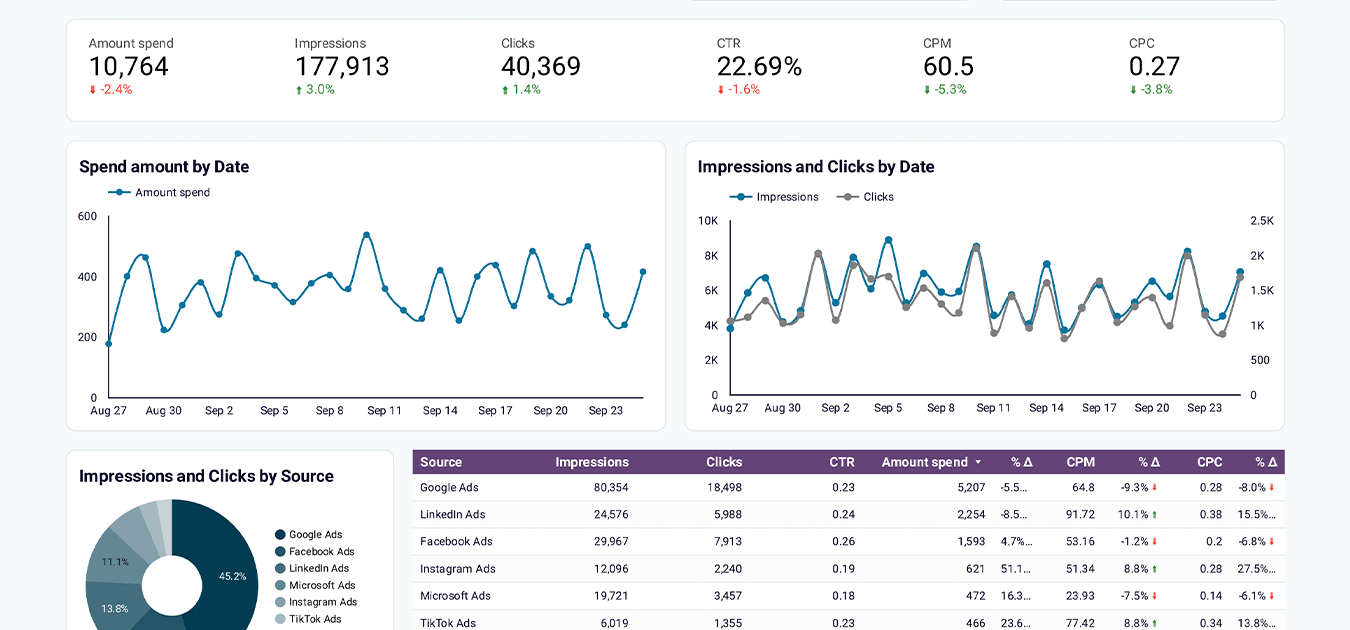
Inside the dashboard, you have a clear visualization of some of the top Instagram Ads metrics like impressions, Link Clicks, CTR, CPM, and CPC. Now you can easily keep an eye on the important KPIs and gain actionable insights.
The dashboard also allows you to analyze the performance of each campaign separately to identify the most profitable campaigns and spend your ad budget wisely.
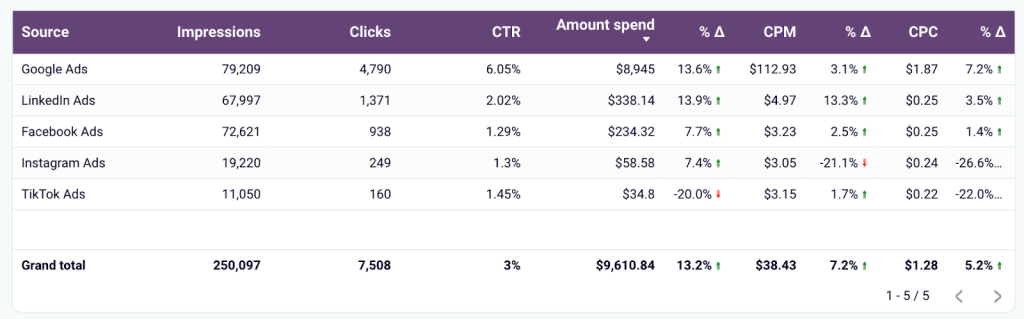
To take this dashboard one step further, you can also connect other social media platforms like Google Ads, Facebook Ads, LinkedIn Ads, and TikTok Ads to easily compare the metrics between different channels. You will save countless hours switching between applications with this one-stop PPC dashboard showing the metrics of all channels in one place.
For example, in the screenshot below, Instagram Ads CPM is lower than LinkedIn Ads CPM. You can choose to allocate more budget to Instagram Ads if your goal is to increase brand awareness.
Similarly, you can compare the performance of different metrics and make data-driven digital marketing decisions. The dashboard is available for different destinations including Google Sheets, Looker Studio, Power BI, and Tableau.


Coupler.io provides you with ready-to-go report templates but you can also create custom ones using its data integration functionality. It can connect 60+ source applications to destinations like Looker Studio, Power BI, Tableau, Google Sheets, and others. All you need is to select the desired source and destination apps and take 4 simple steps to create the integration.

How to turn Instagram Ads metrics data into actionable insights with Meta Ads Manager?
The native ad reporting of Meta Ads Manager is also effective in getting actionable insights from Instagram marketing data. All you need to do is go to the ‘Ads Reporting’ in the Ads Manager where you’ll see all your campaigns.
You can choose the metrics for Instagram Ads you want to measure and create a pivot table. Let’s look at some of them which are not included in our previous dashboard.
- Ad frequency: In the Meta Ads Manager UI, it is named ‘Frequency’.
- Conversions: This metric is not predefined and should be set up based on the desired action. The ‘total’ represents the number of conversions in Meta Ads Manager UI.
- Cost per conversion: Under conversions, you will see the cost for each conversion under the ‘cost’ column.
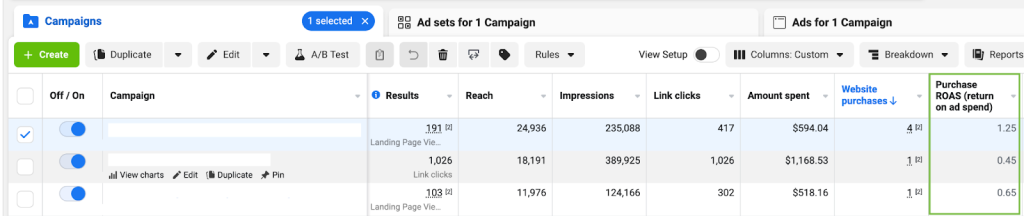
- ROAS: You can select the total of ‘Purchase ROAS’ to measure the ROAS of the campaign. Alternatively, you can also calculate it outside the Meta Ads Manager as a ratio of ad spend and revenue.
What are good metrics for Instagram Ads?
Knowing which Instagram Ads metric to measure and track is crucial to understanding the performance of your ad campaigns. In this article, we discussed 10 Instagram Ads metrics in detail that can help you analyze your ad data and gain actionable insights from it.
We also looked at different ways to measure and track Instagram Ads data. The Instagram Ads Insights is a view-only way to know your ad metrics and you cannot create a report from it. The Meta Ads Manager is good at tracking different metrics and creating custom metrics too. It lets you choose the desired engagement metrics and create an Instagram Ads report from scratch. If ad reporting is an everyday task for you, then using a data automation platform like Coupler.io is the best way to track metrics for Instagram Ads. You can use the pre-defined dashboard templates and create your own Instagram Ads dashboard with real-time data in minutes.