There are 3 steps to measure PPC campaign success
1. Set up conversion tracking
Start collecting information on user actions at different stages – from clicking on your ad to consequently visiting your website and making a purchase.
2. Organize performance monitoring
Decide how and where you will work with this data. For example, you can create a report in spreadsheets or visualize your data in a dashboard.
3. Analyze PPC metrics
Once you have collected the data you need and have it in an analysis-ready format, you can interpret your metrics and evaluate performance.
In this article, we walk you through all three stages. First, we explain how to get started with PPC tracking. Then, we show you how to create a PPC dashboard with a free template and how to analyze the key metrics.
Set up conversion tracking
This is the most important thing you need to do to measure PPC campaign performance.
Here are the main stages you need to complete:
- Create a conversion action on your PPC platform
- Implement the conversion action on your website
- Connect your website and ad platforms to an analytics platform
Let’s take it step by step and see how you can set up conversion tracking for your ad campaigns.
Create a conversion action on your PPC platform
First, you will need to identify what the conversion is for your campaign. It can be a product purchase, a sign-up for your newsletter, or downloading an eBook.
Next, go to your ad platform and create a conversion action. For each platform, you need to follow similar steps to set up the conversion.
- For Google Ads – You will need to create a conversion action. Simply click Create in the Google Ads dashboard and select Conversion action.
- For Facebook Ads – First, from Facebook Events Manager, set up Meta Pixel, and then you can create Custom Conversions or use Standard Events for tracking. You can set up custom conversion events to track specific actions. Click on Event Manager and select Custom Conversion.
- For LinkedIn Ads – Go to LinkedIn Campaign Manager, click Analyze, and select Conversion tracking.
- For X (Twitter) Ads – Similar to the Facebook setup, you first need to install X Pixel on all your website pages and then add events to track certain conversions.
Implement the code on your website
After the setup, you will get a code to add to your website. Once added, you need to test it to ensure that the conversion data is recorded in your PPC platform. There are two methods you can use to implement this code on your pages.
Manually: Simply copy the code from your ad platform and add it to the website pages where you want to track conversions.
With 3rd party tools: You can use tools like Google Tag Manager or Adobe Experience Platform Launch, which means you won’t have to edit your website code every time you want to set up a new conversion. You just create a new tag in the tool and set up a trigger. However, first, you need to set up a container tag and then you can add numerous tags on your website.
Connect your website and ad platform to an analytics platform
If you want to discover more insights about your audience and their behavior on your website, you should also connect your website and your ad platforms to an analytics tool.
You have a variety of options to choose from, including Google Analytics 4 and Adobe Analytics. Depending on the platform you choose, you will need to follow different steps to set up the connection between your website and the analytics platform.
Also, depending on the analytics tools you use, you can connect your ad platforms to create audiences based on user behavior on your website.
Now that we’ve set up conversion tracking and connected both analytics and ad platforms to our website, let’s go back to the PPC platforms and see how to track PPC performance.
Organize performance monitoring
Since you have already started collecting information on conversions, it’s time to decide where and how you are going to work with this data. You will need to monitor and analyze it to ensure good performance and make improvements based on your findings.
Learn more about performance marketing for SaaS.
You can check PPC performance on native platforms such as Google Ads, Facebook Ads, and GA4. Also, you can build a live ads dashboard in your preferred business intelligence tool or create a report in spreadsheets.
Building dashboards and reports outside of ad and ad analytics platforms is often a better option. It gives you more flexibility as you can perform calculations, aggregate data from different sources, calculate custom metrics, and so on. Creating reports to share with clients or other stakeholders is also more convenient outside of PPC platforms.
Let’s take a closer look at some of the options you have.
Check performance on your PPC platform
Google Ads
For Google Ads, you can click on the Campaigns button located on the left in the main dashboard. There, you can check the budget, campaign type, and other important details.
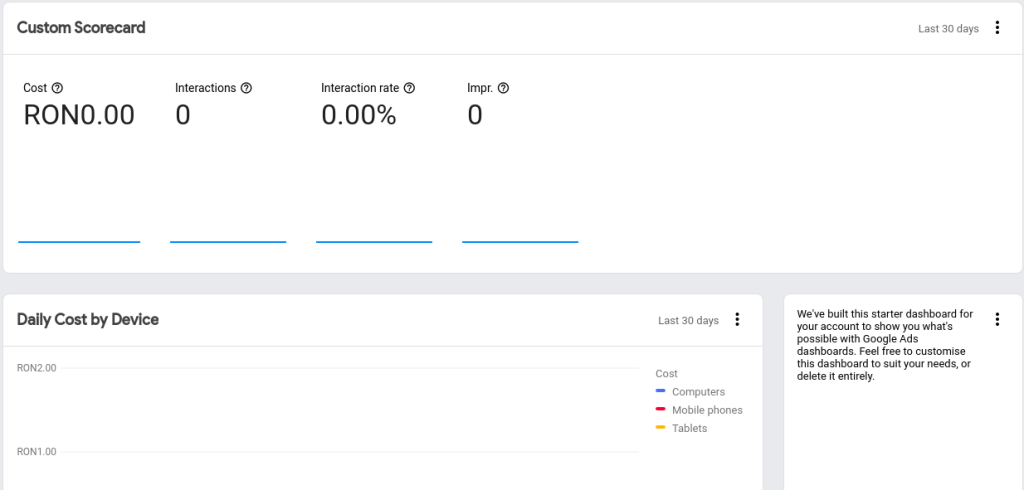
If you want a more in-depth analysis, go to Insights and Reports and click Dashboards. There, you can create your own dashboard and add filters and metrics that interest you. Here’s how the Starter Dashboard looks:
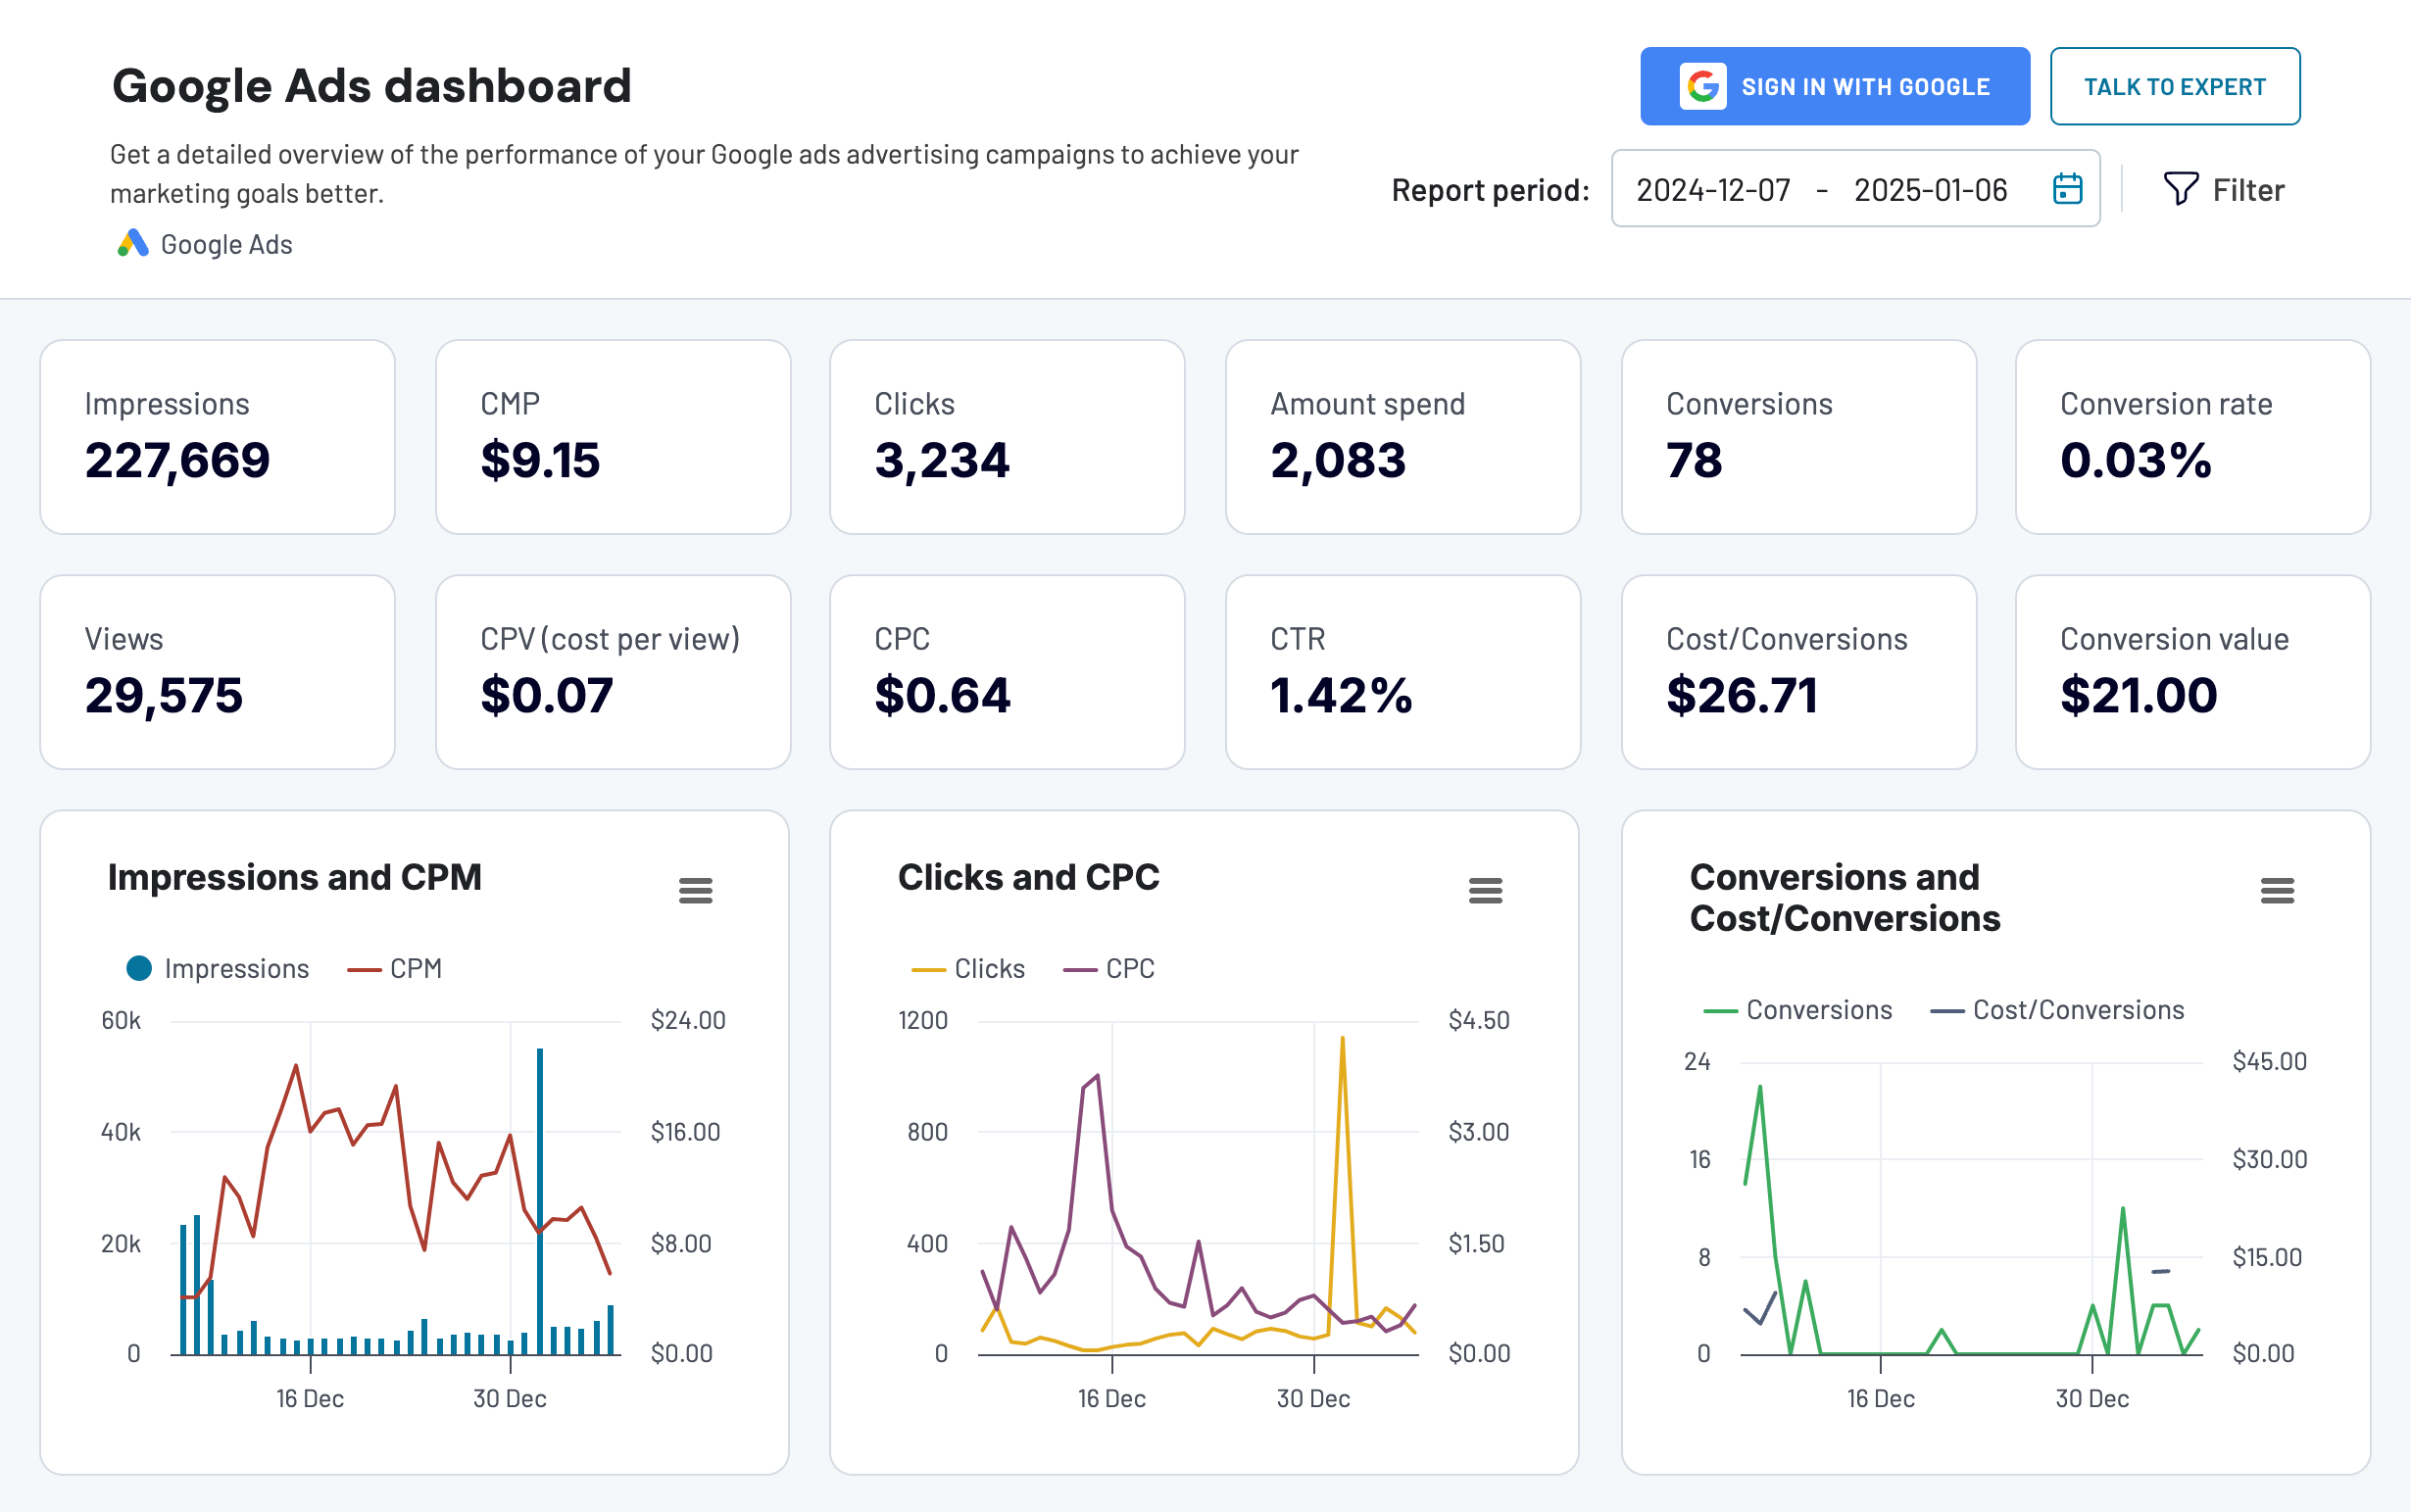
Or use the dedicated Google Ads dashboard by Coupler.io.
Facebook Ads
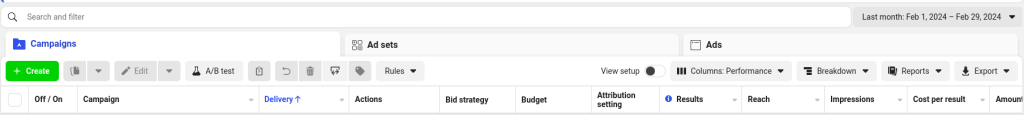
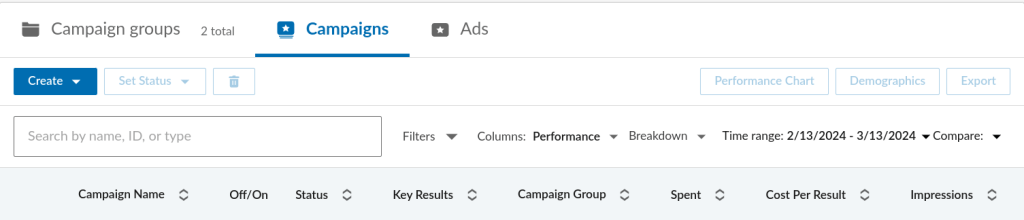
For Facebook ads, you will need to go to Ads Manager from Facebook Business Manager. Click on Campaigns to track PPC campaign performance. You can add more metrics or remove those that are irrelevant to your ads.
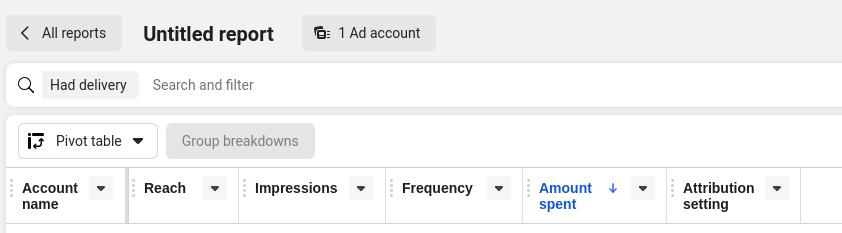
Also, for more in-depth analysis, you can go to Ads reporting. There, you can filter the PPC ads based on account, objective, delivery, or audience. Also, you can customize the metrics to match your needs.
LinkedIn Ads
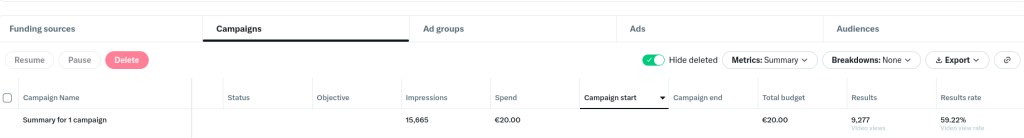
For LinkedIn Ads, you can track PPC campaign performance in the Campaign Manager. There, click on Advertise and you will be able to see a complete overview of your campaigns and spot key metrics.
X (Twitter) Ads
To check performance on this platform, you need to go to X for Business, click on Campaigns, and select Ads Manager. There, you can see the results of each campaign.
Are you running ads on all of these platforms and more? Don’t worry, there’s an easy way to have an overview of all of your campaigns without having to switch from one platform to another.
Use a multichannel dashboard to monitor PPC campaign performance
This option is very helpful for marketers who need to measure PPC campaign performance across different platforms.
Coupler.io provides cross-channel dashboard templates that can be used for both PPC tracking and reporting. All these templates blend data from ads sources automatically and are available for free.
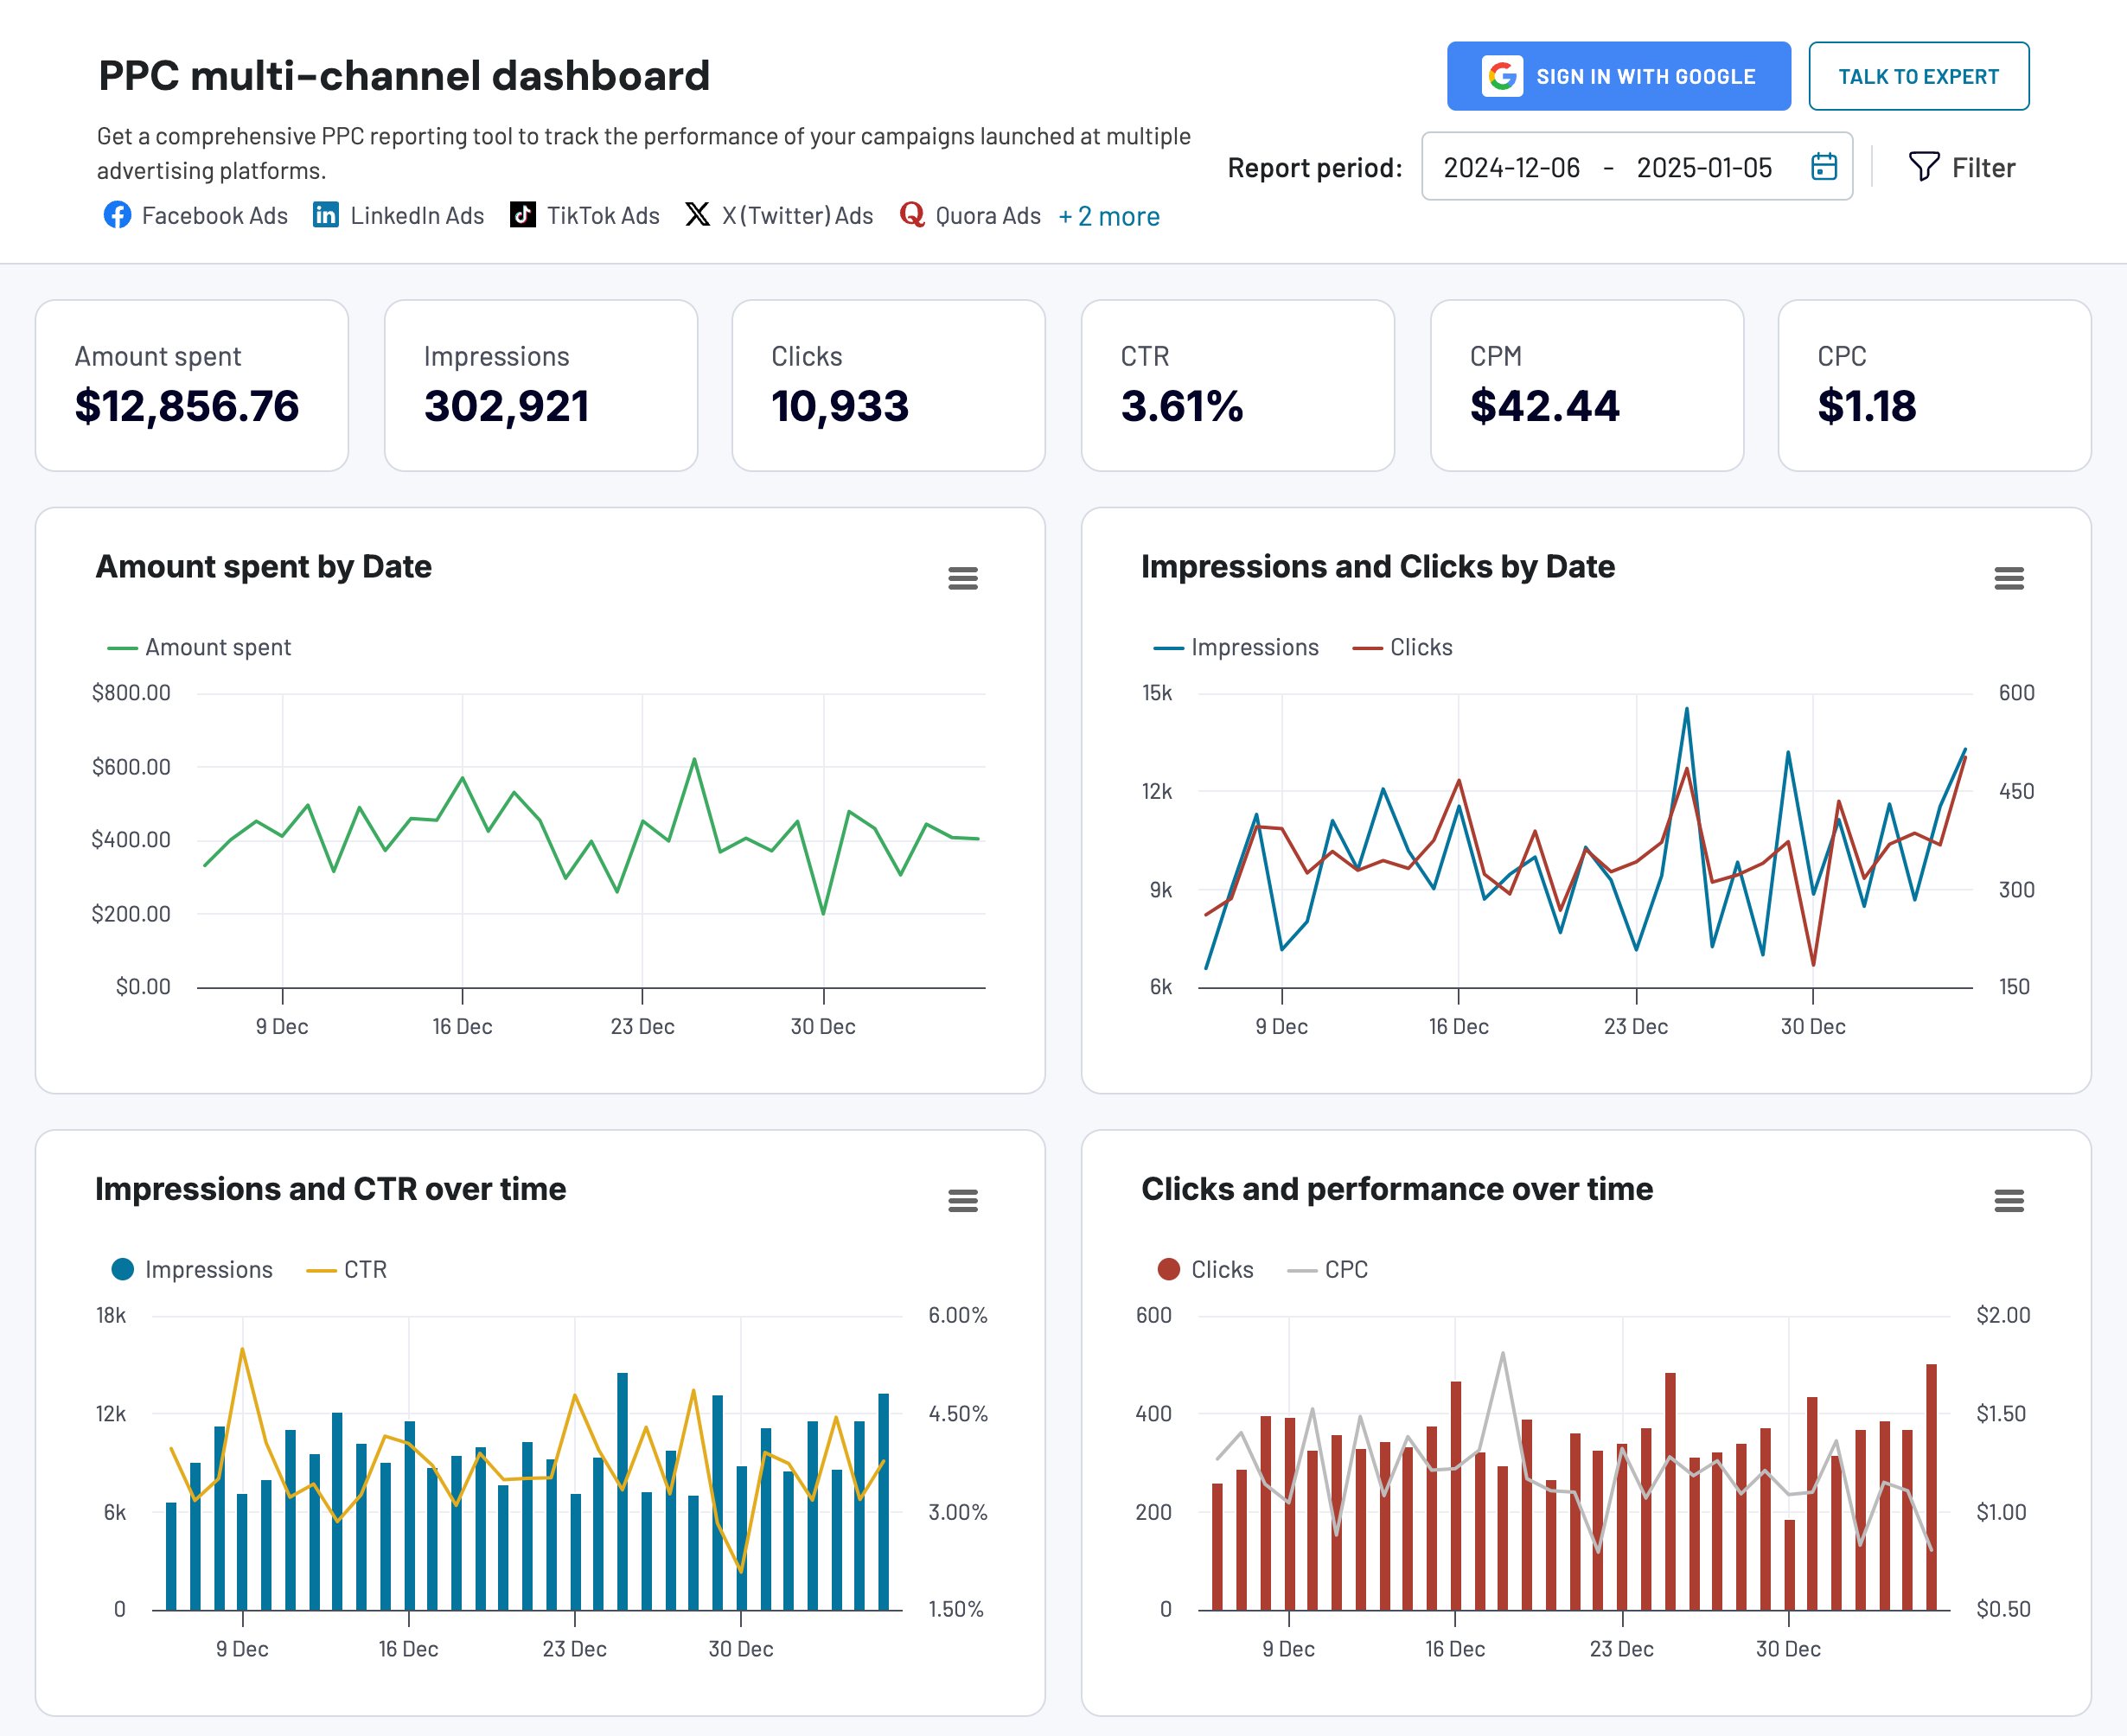
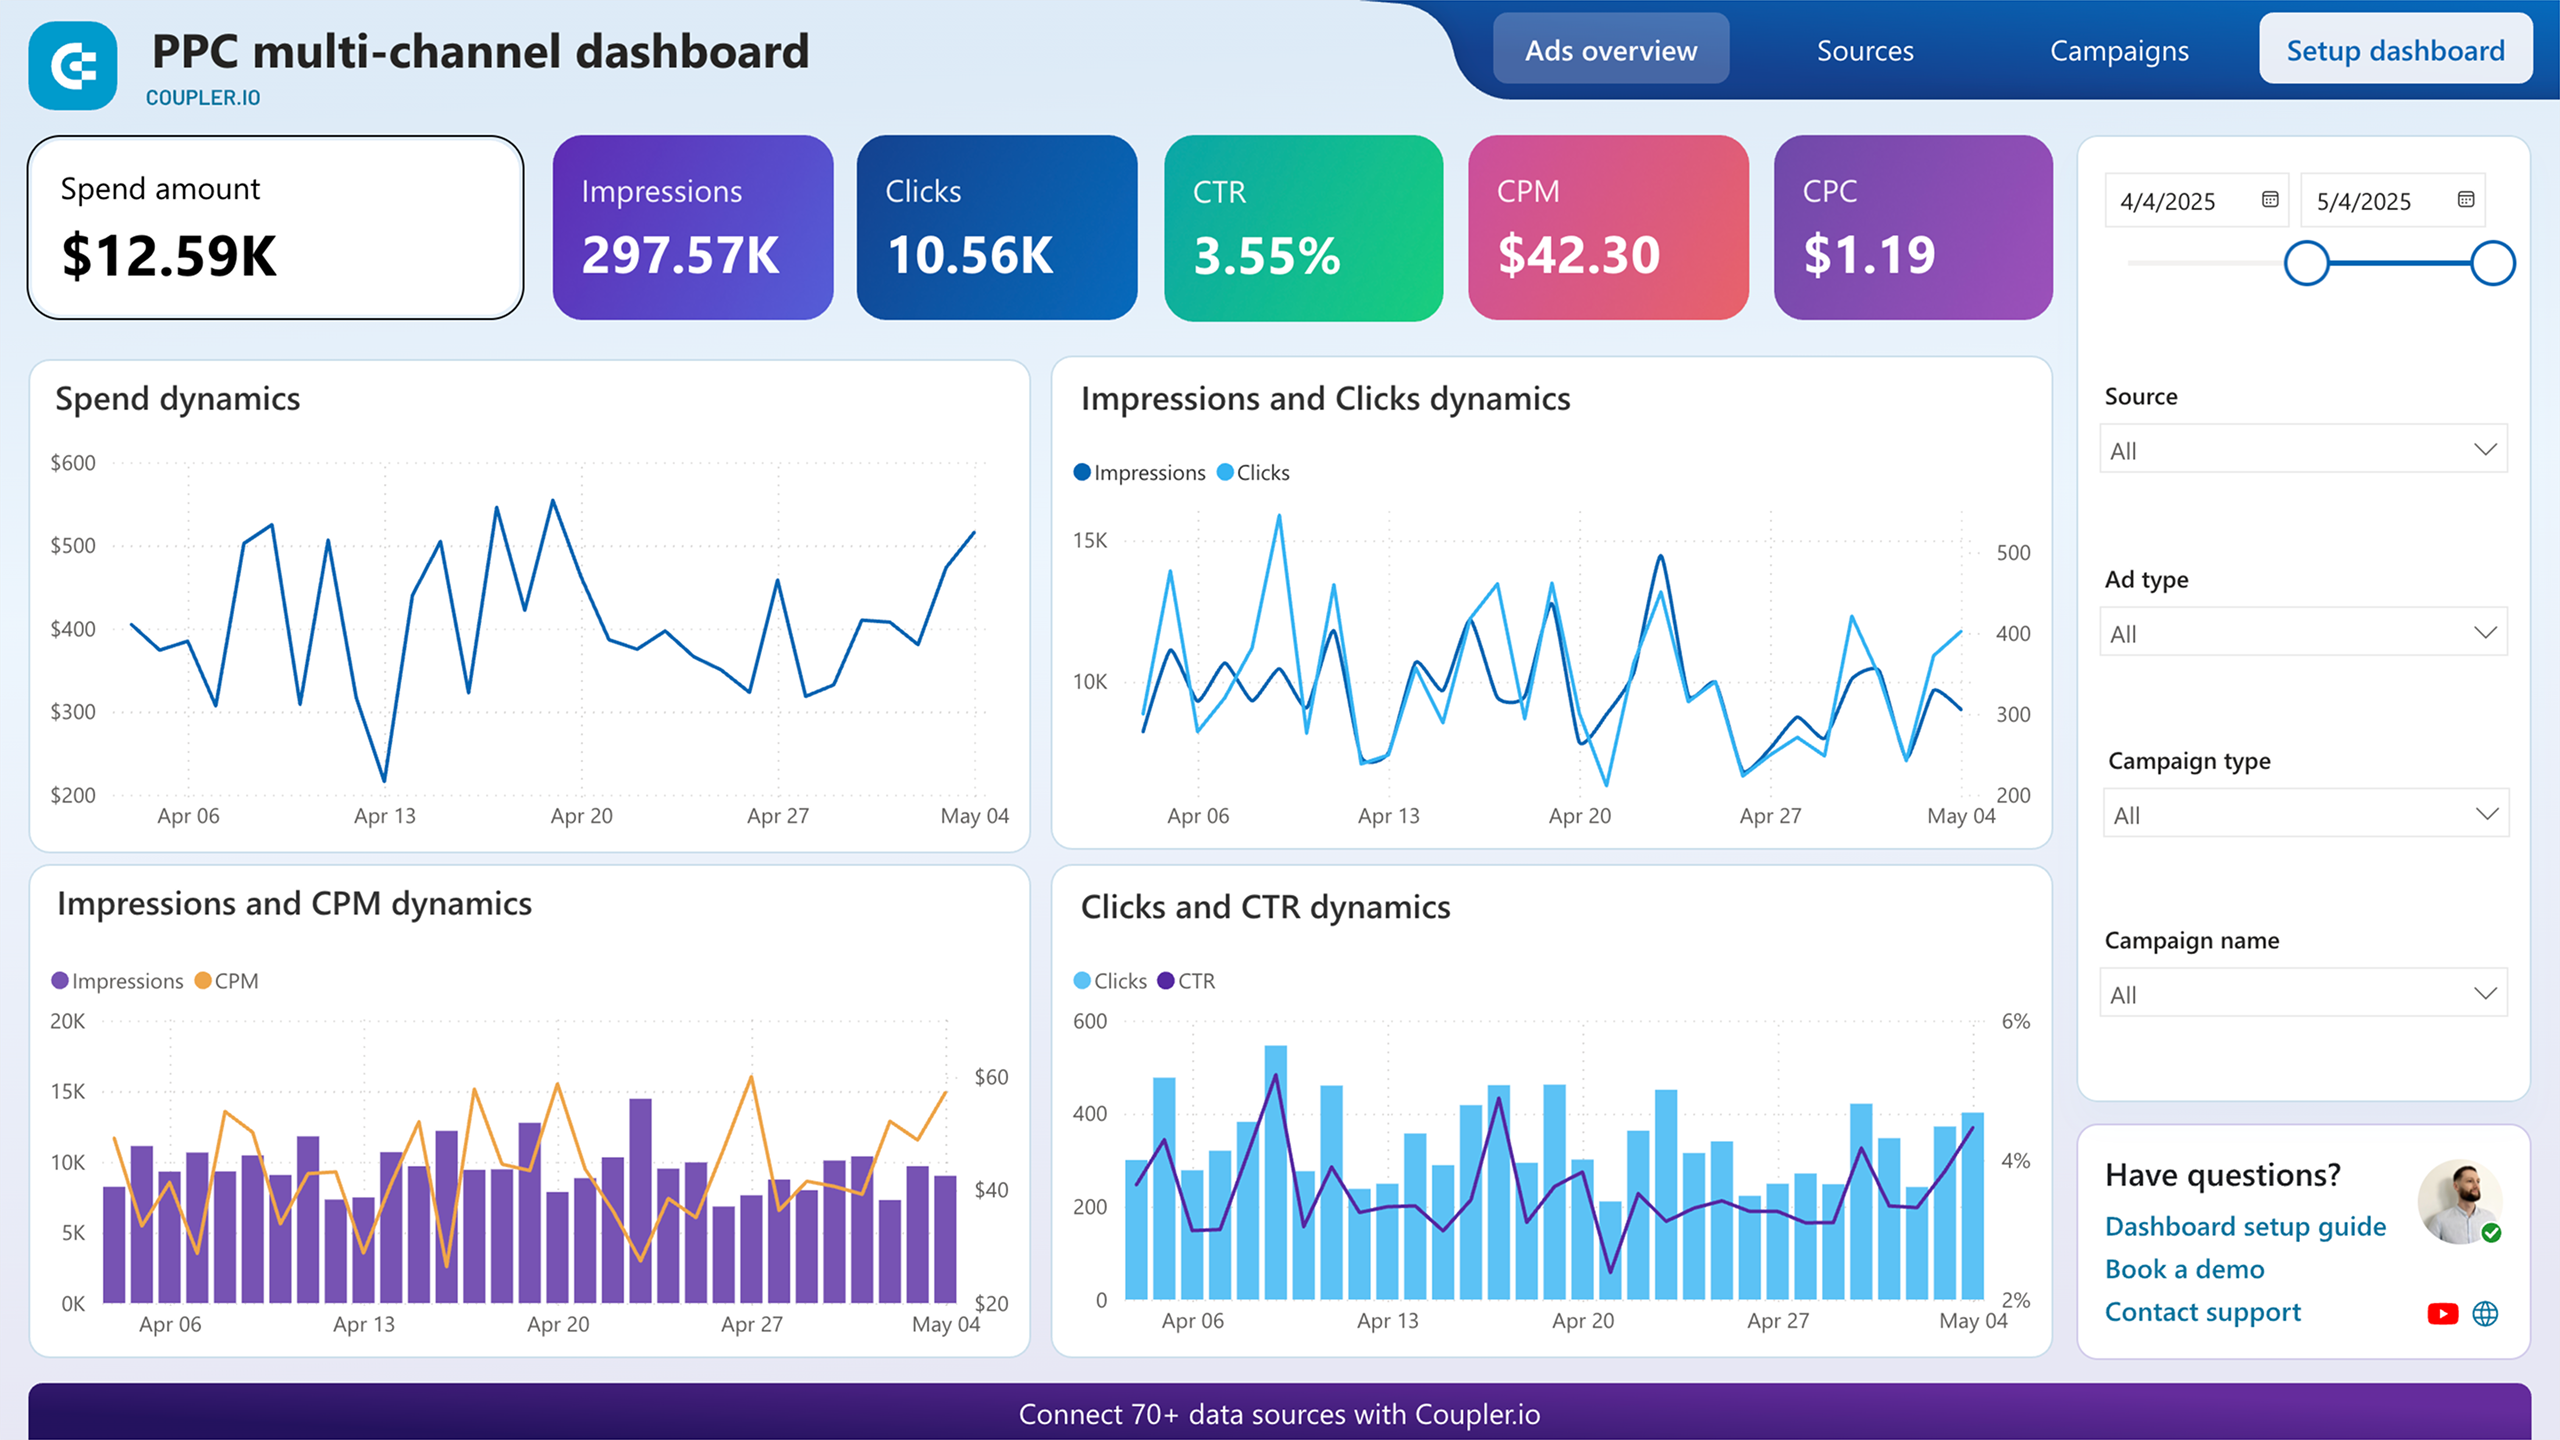
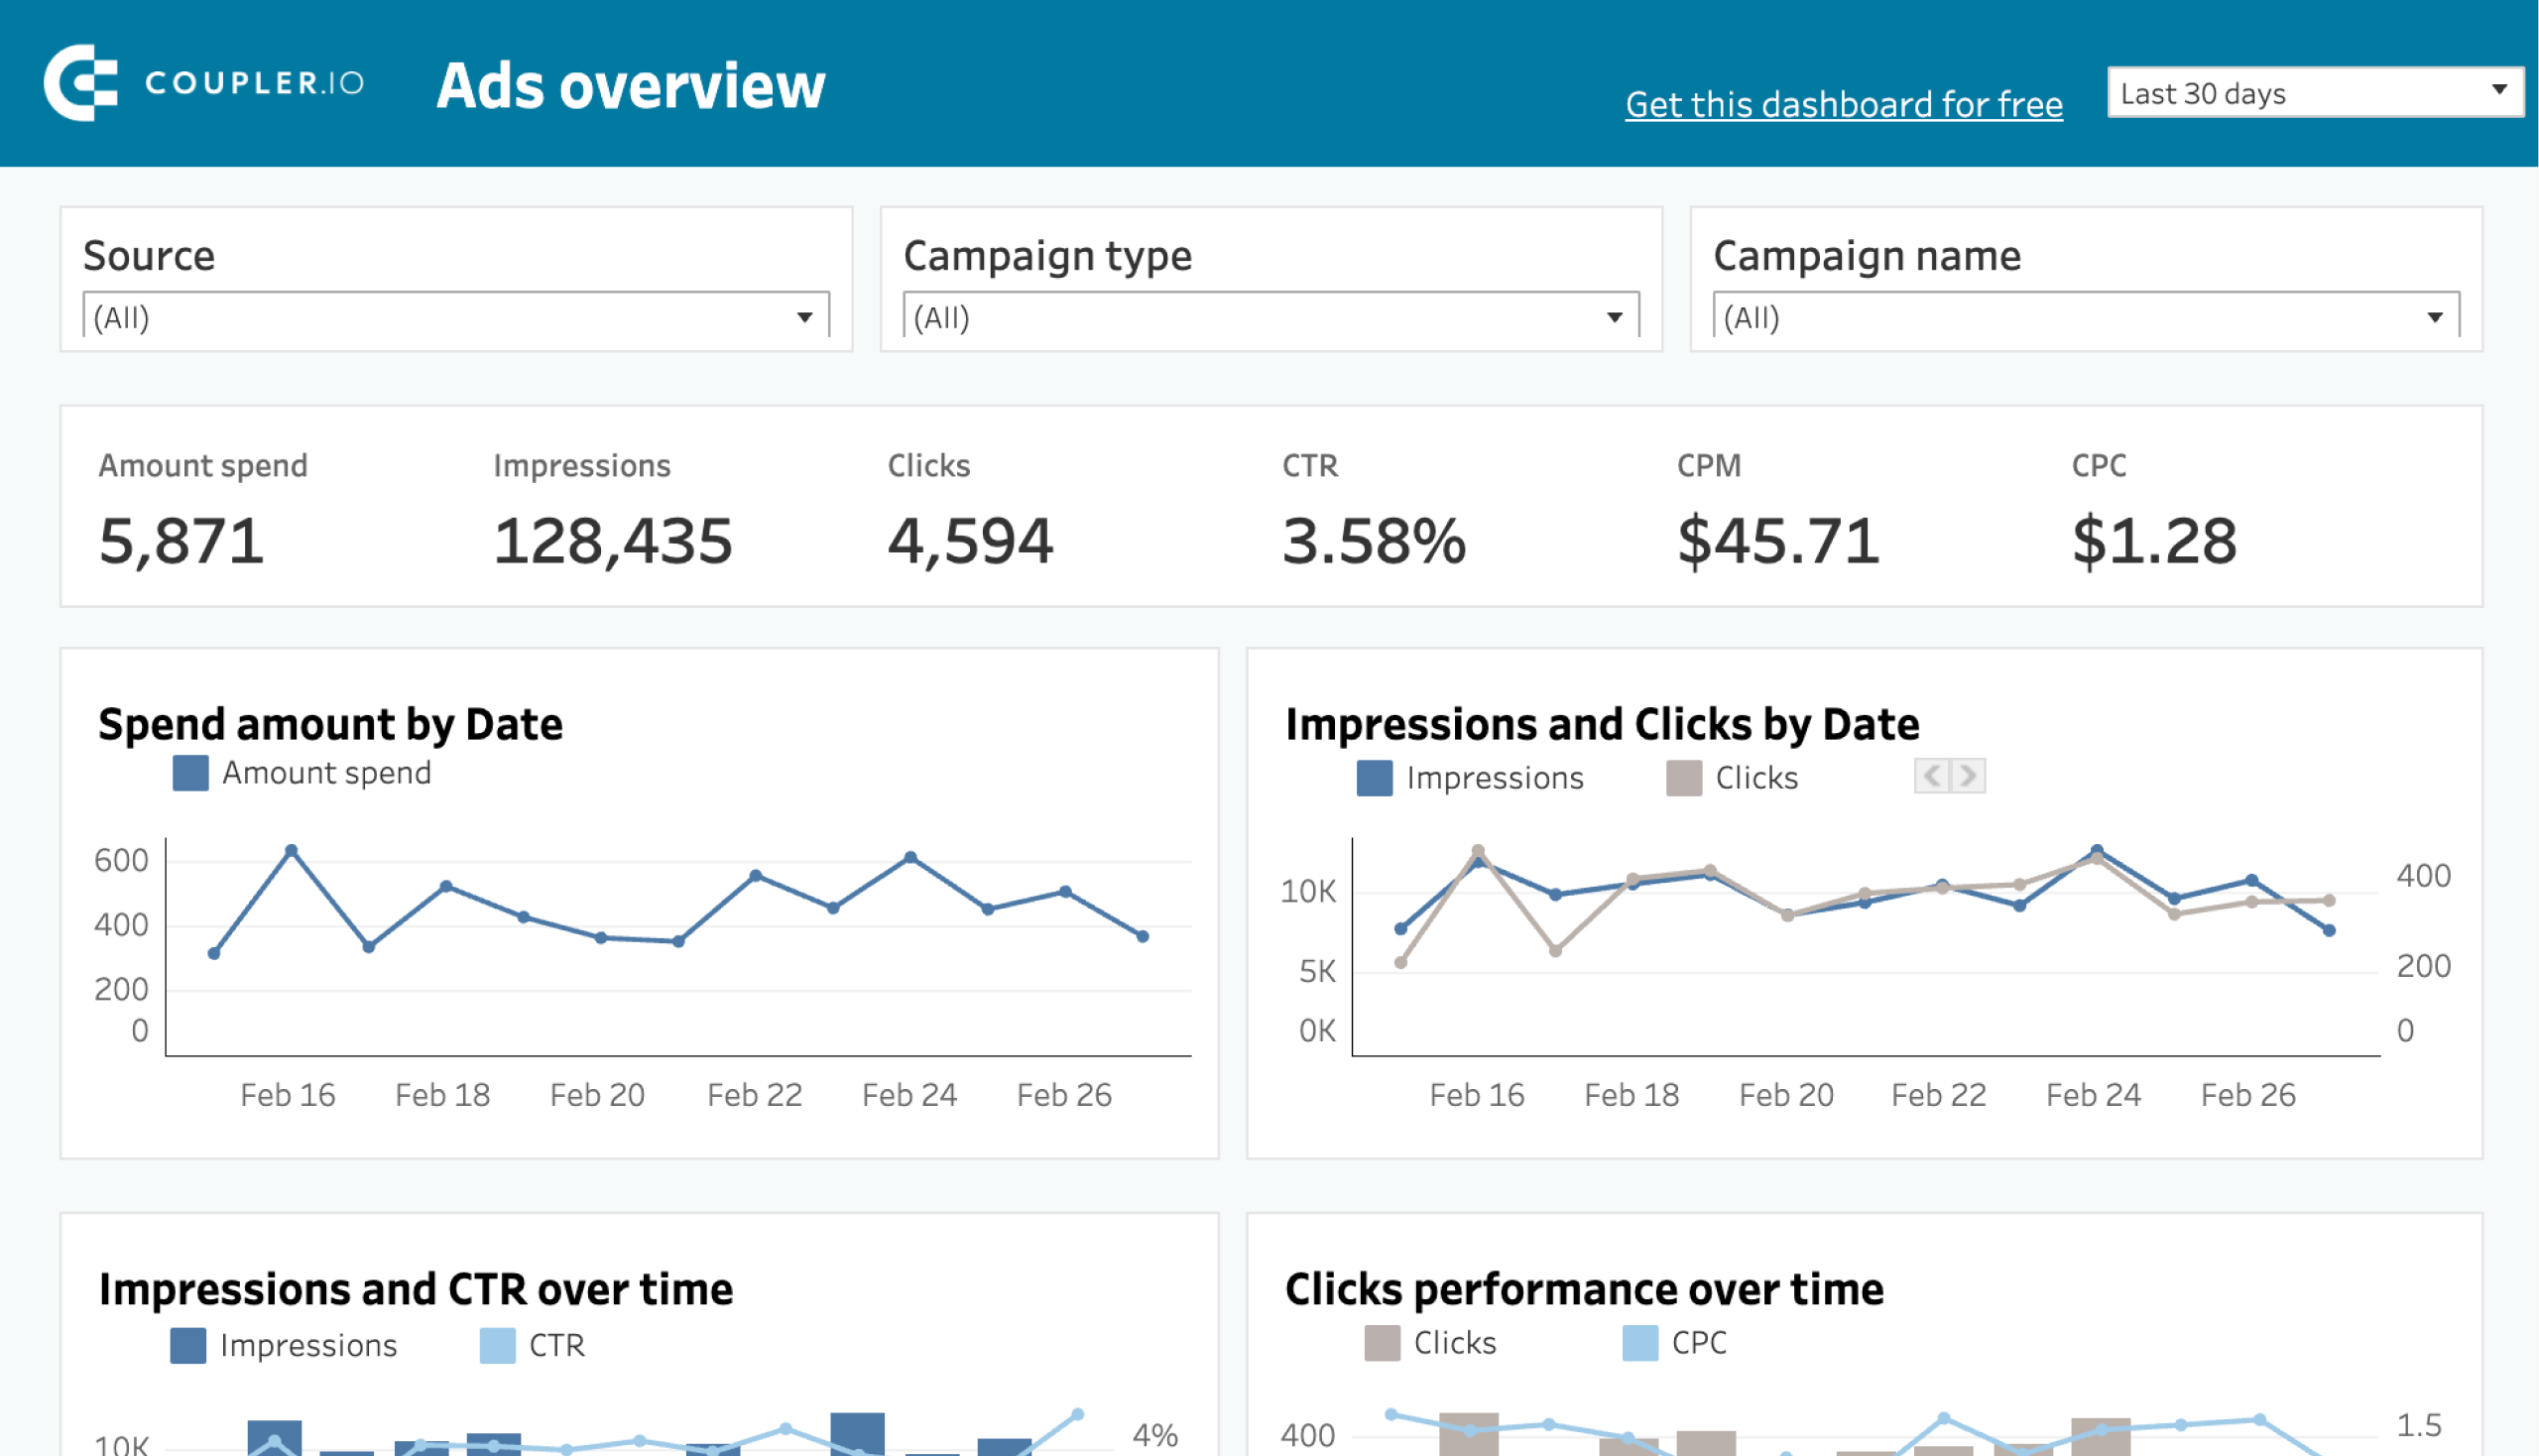
PPC multichannel dashboard template
This is a free, easy-to-use, and customizable dashboard to track the PPC campaign performance of your ads from various platforms. You can analyze data from platforms like Facebook Ads, Google Ads, Quora Ads, LinkedIn Ads, and TikTok Ads, all in a single report.
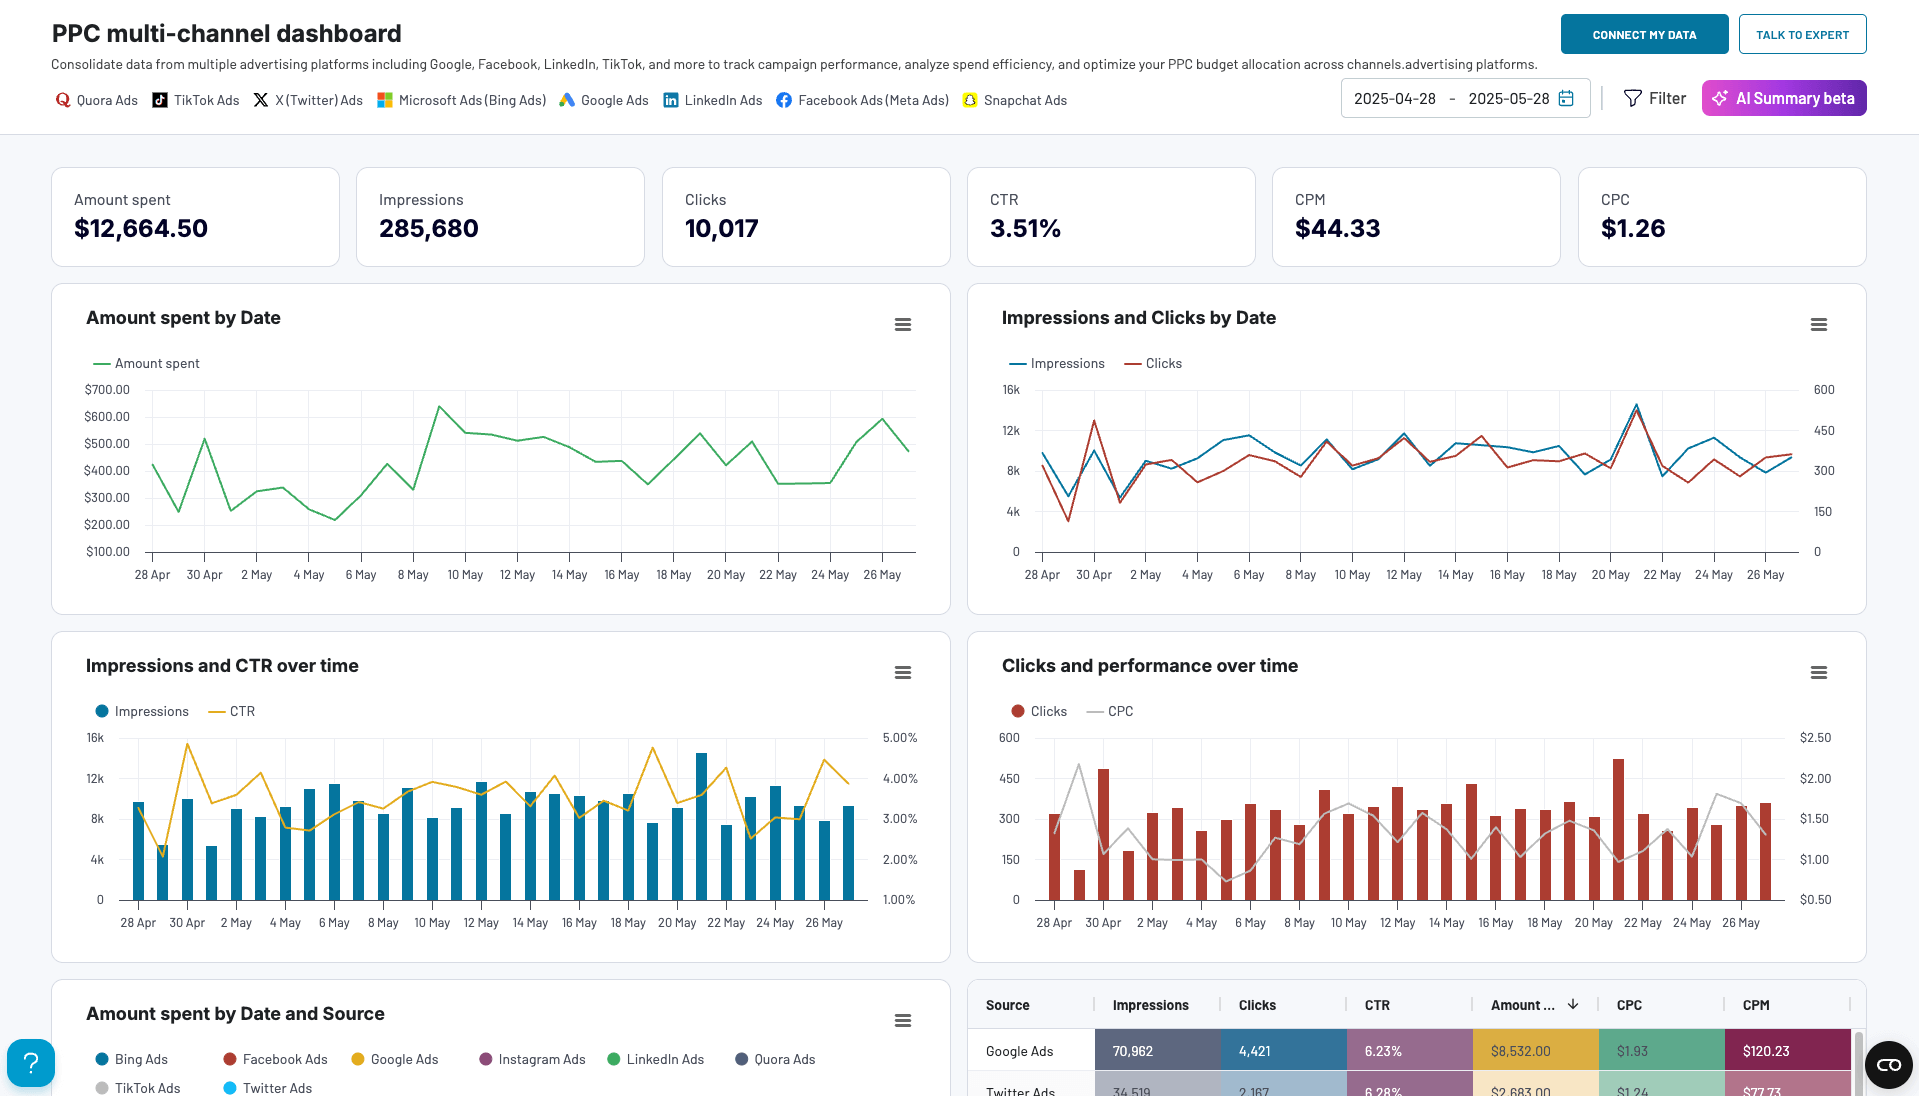
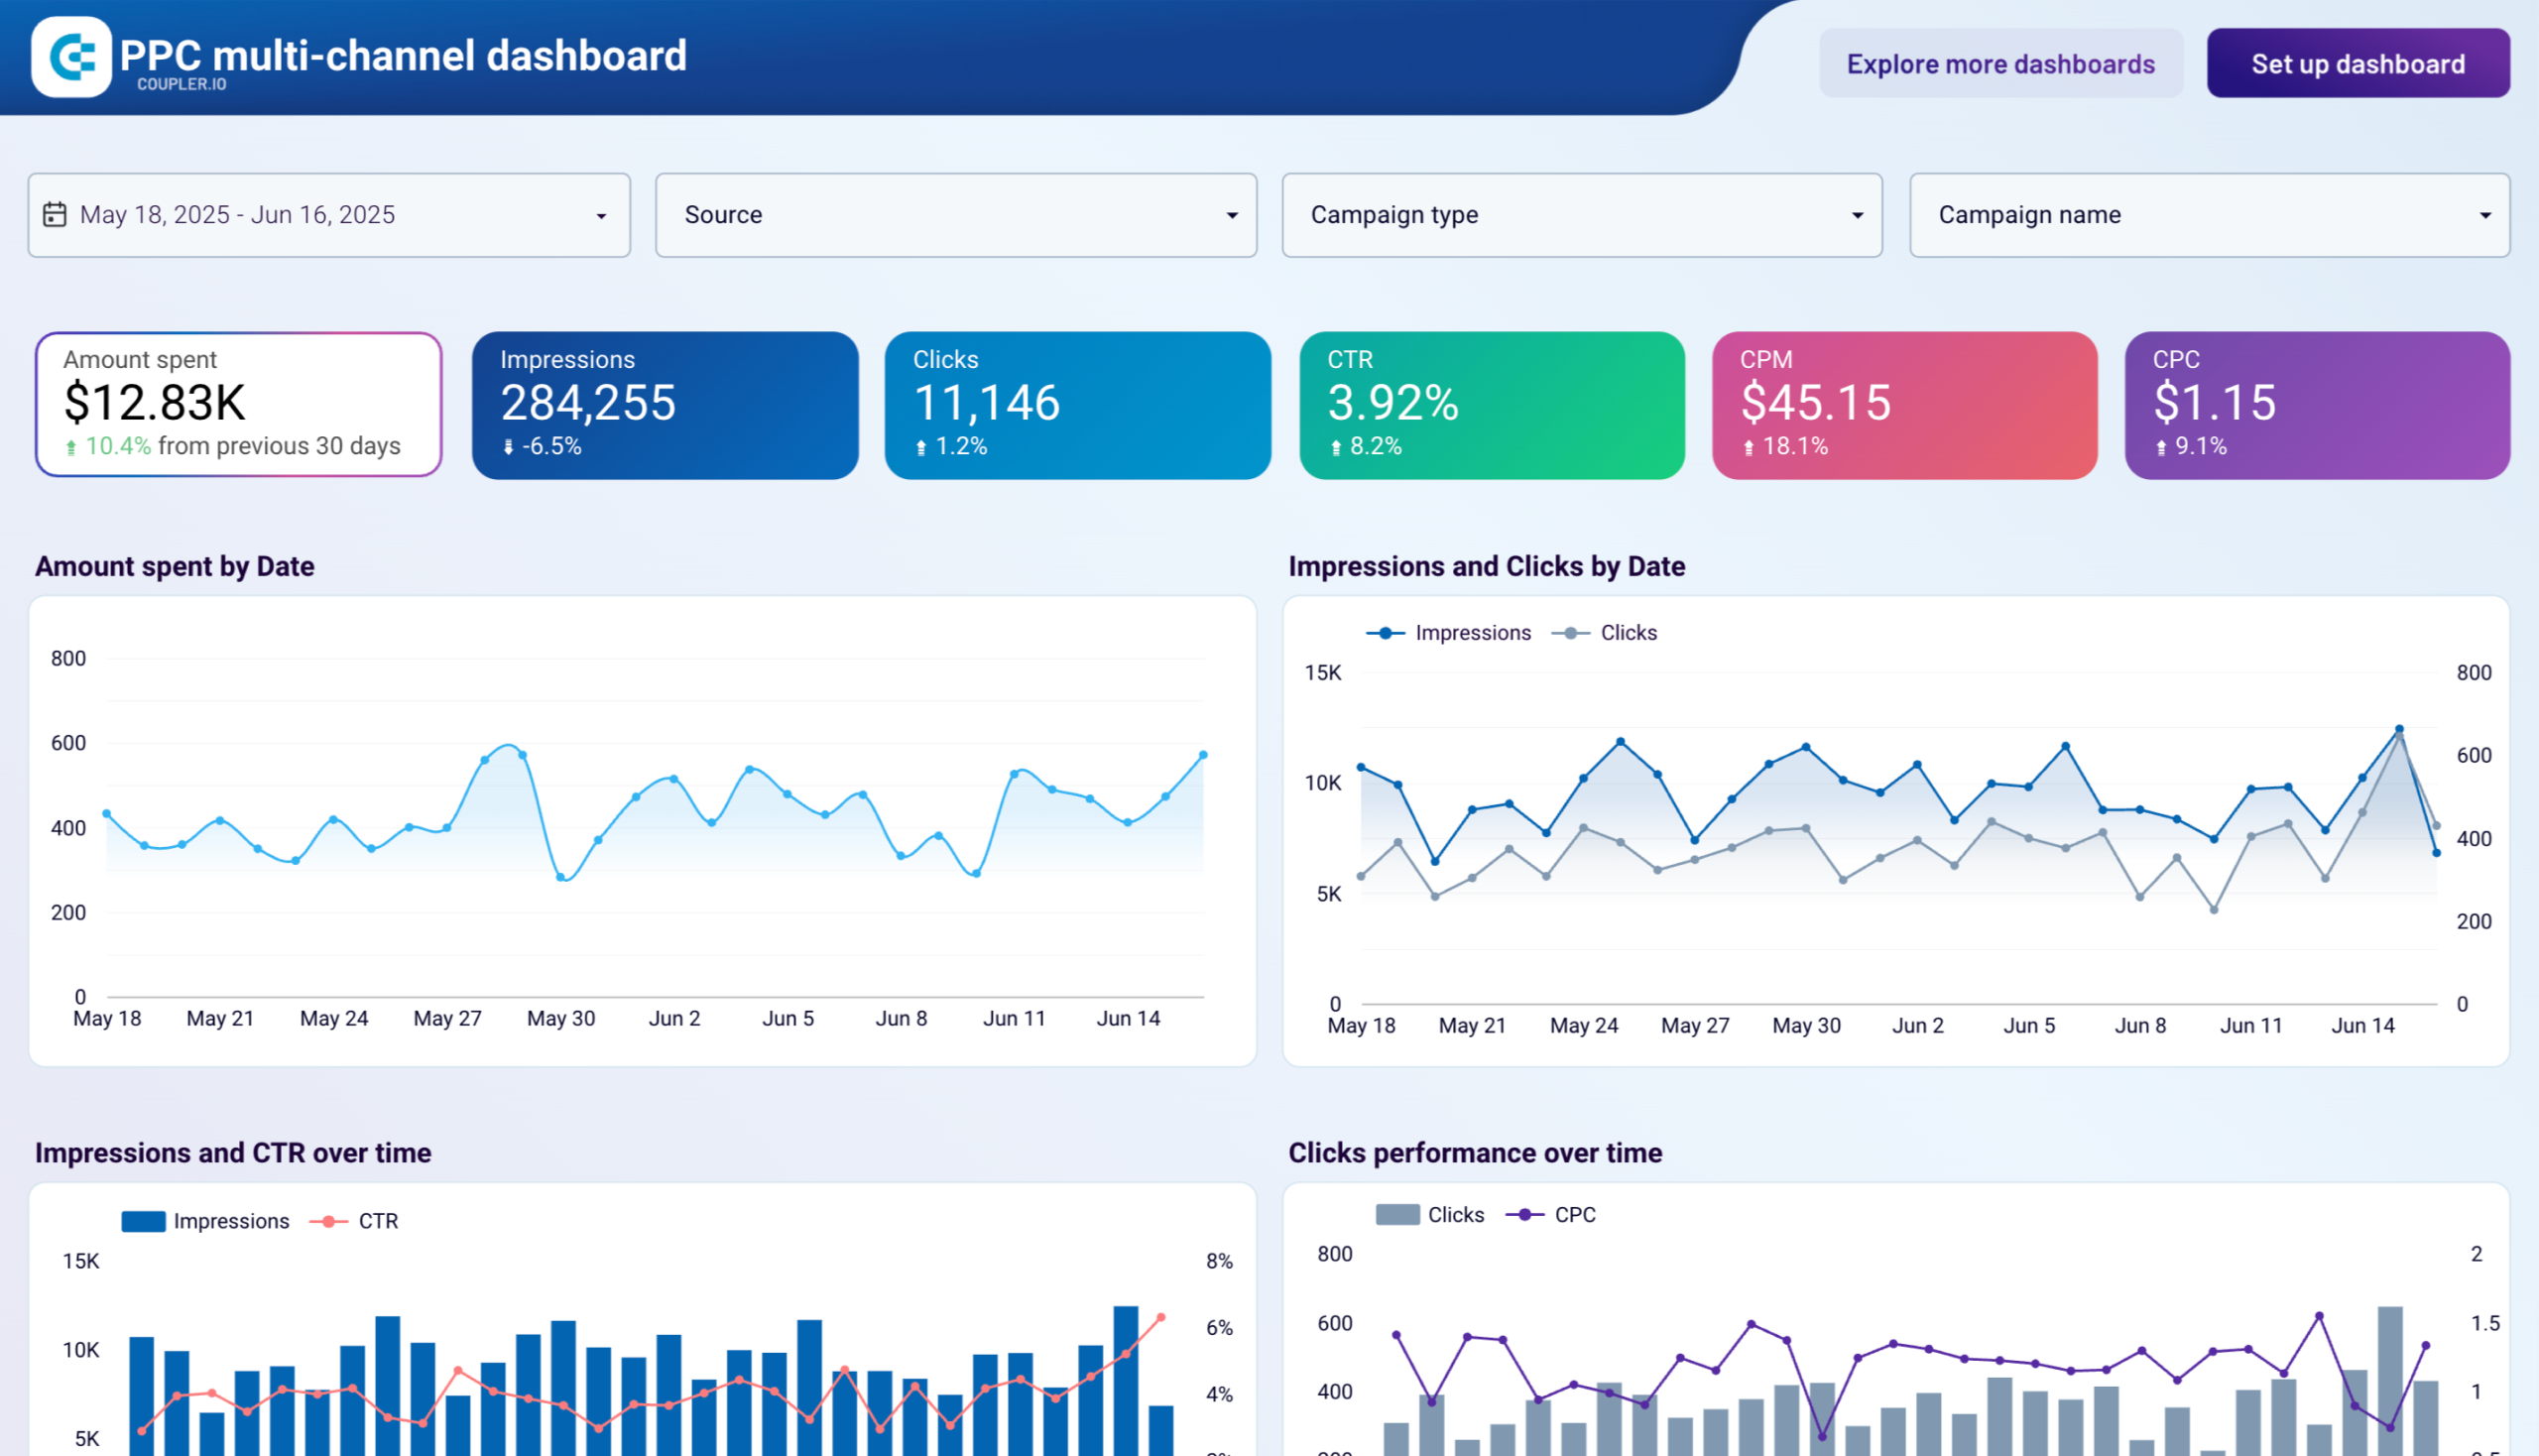
As well as offering a complete overview of the performance of your campaigns, this dashboard allows you to perform a more in-depth analysis. It highlights key metrics such as the amount spent, clicks, impressions, etc.
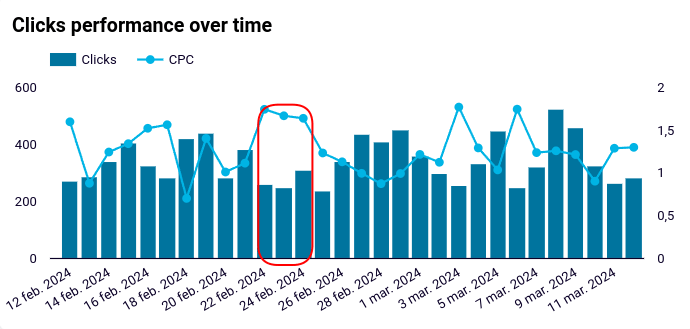
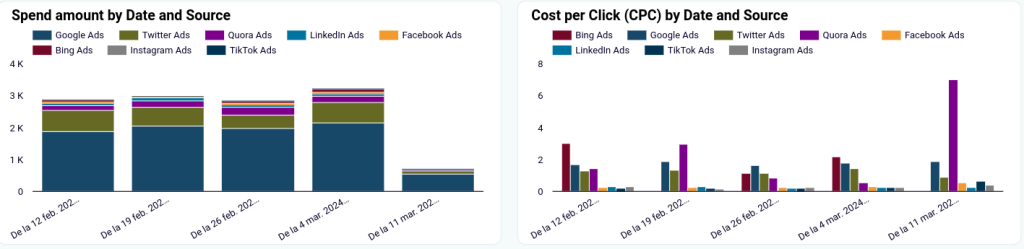
The PPC multichannel dashboard comes with helpful graphs and visualizations to help you spot trends and patterns. For example, you can look at click performance over time and discover on which days of the week you have fewer clicks and when the cost per click is higher. This allows you to make informed decisions regarding your PPC budget management.
If you are testing out different ad platforms and want to reallocate the budget to top-performing channels, this dashboard can help. It allows you to make a clear comparison between the platforms based on Cost per Click (CPC) and Amount spent.
The best thing about this dashboard is that you can schedule automated data updates from the ad platforms, saving you the time and effort of doing this manually.
To use this campaign performance dashboard for free, follow the instructions in the Setup guide to connect your ad source accounts and populate the report with your data. The template is available in different reporting and BI tools, including Google Sheets, Looker Studio, Power BI, and Tableau.


For more details on building a PPC dashboard with these templates, check out this video.
Multi-channel creatives dashboard template
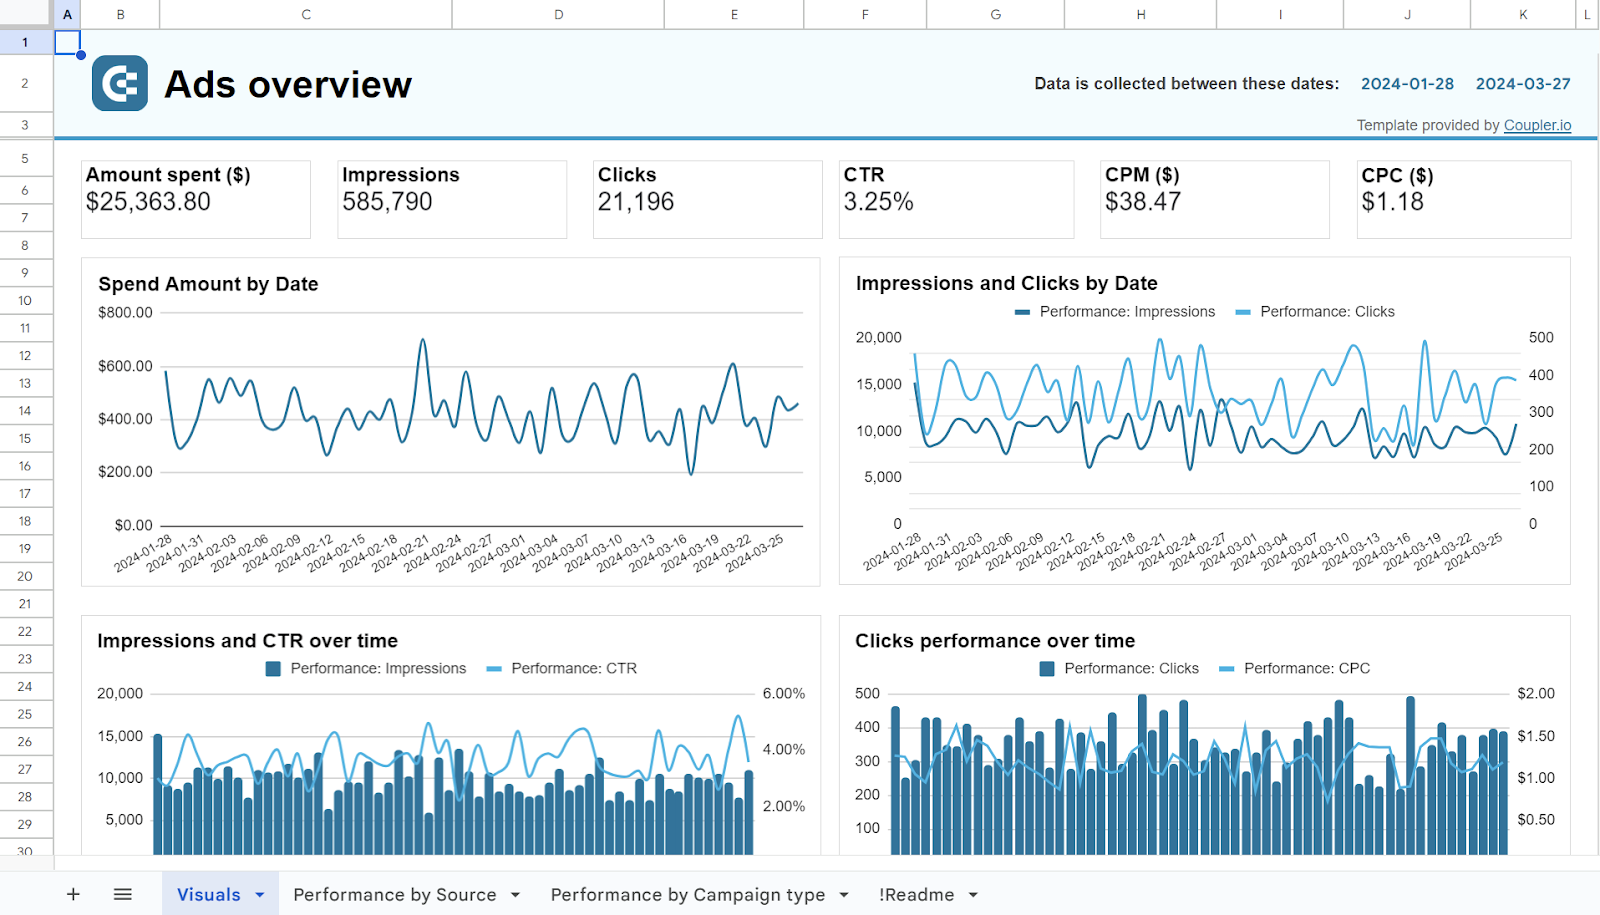
While the PPC multichannel dashboard tracks the performance of ad campaigns across various PPC channels, this multi-channel creatives dashboard focuses on understanding the effectiveness of the creatives used in those campaigns.
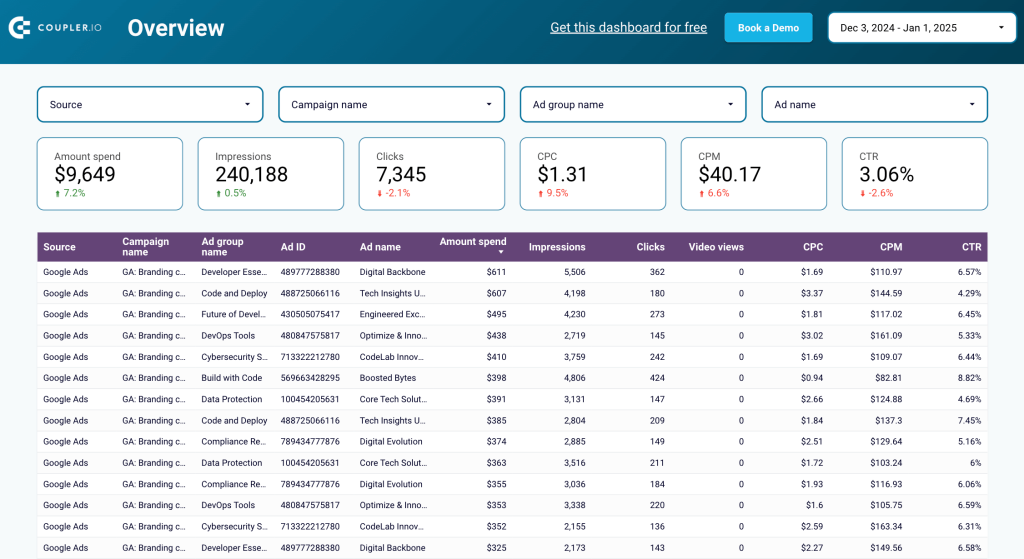
It allows you to evaluate your ad creatives on platforms like Facebook Ads, Google Ads, LinkedIn Ads, TikTok Ads, and more. It also provides a detailed analysis of impressions, clicks, CTR, CPC, CPM, and spend, giving you the insights needed to optimize your campaigns.
With charts like Spend Amount by Date and Impressions & CTR Over Time, you can identify patterns in budget allocation and analyze how improved visibility drives engagement.
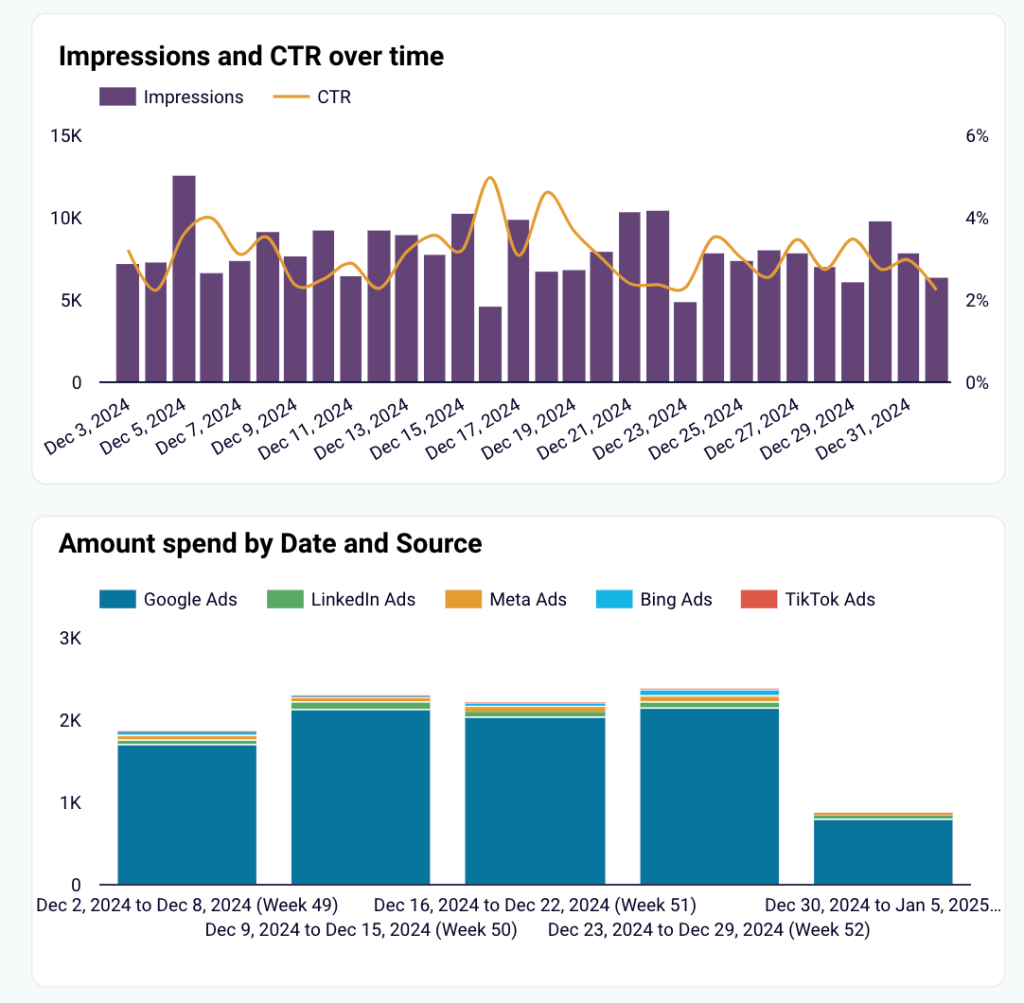
The top-performing charts highlight creatives with the highest CTR and click counts, allowing you to quickly identify and double down on them.
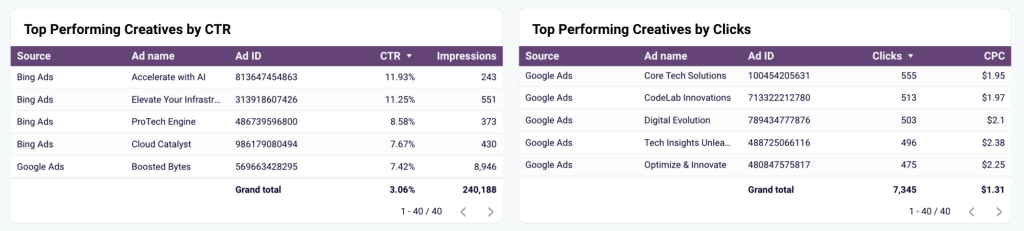
Along with creative performance analysis, you can also get a quick visual performance summary of the connected ad platforms with individual scorecards and tables.
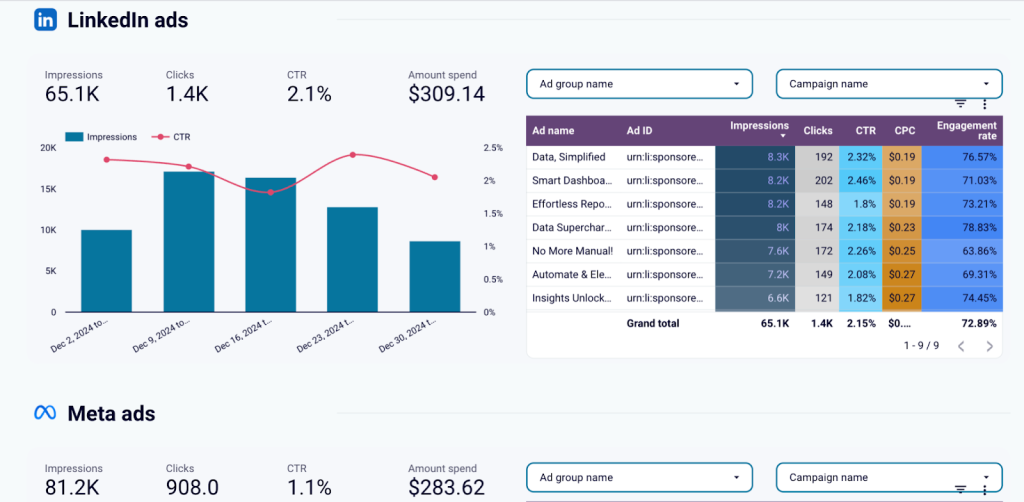
With the multi-channel creatives dashboard, you can identify creatives that resonate with your audience, spot underperforming campaigns early, and optimize ad creative performance to reduce CPC and maximize ROI.
It is available for free in Google Sheets and Looker Studio. To use it with your data, follow the instructions in the Readme tab and connect your ad accounts.
PPC monthly budget dashboard template in Google Sheets
PPC tracking also includes the monitoring of ad expenses and budget. For this, you can use our PPC monthly budget dashboard template. It provides a budget overview for the current month with spending predictions and alerts to avoid budget overspending.
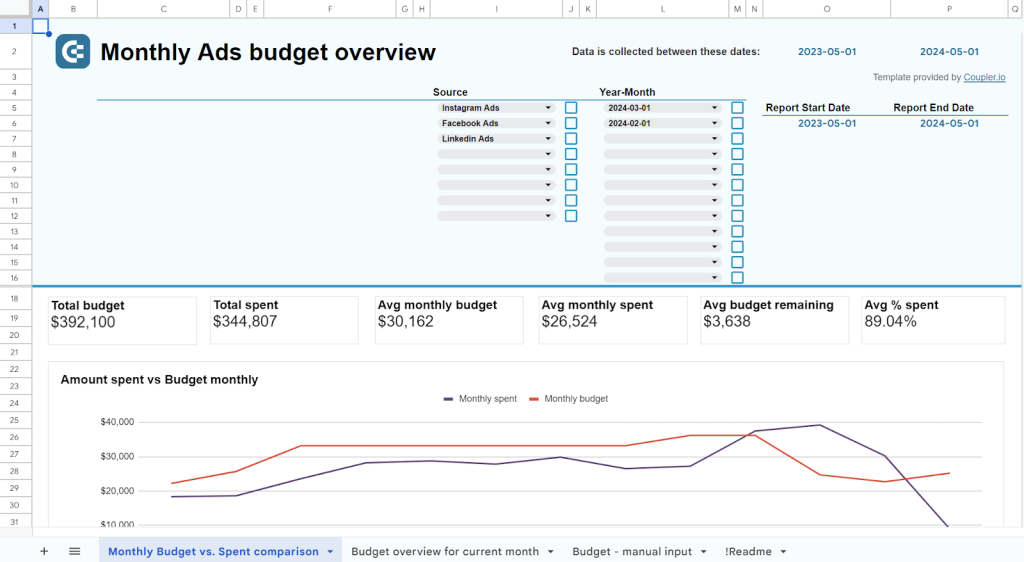
With this PPC dashboard, you can also track the dynamics of spending on advertising. The template is designed in Google Sheets and lets you connect multiple ad source accounts to the dashboard.
Build a custom PPC report in spreadsheets
Want to monitor PPC campaign performance in a custom report? You can easily create one in Google Sheets or Excel. Even better, you can make it self-updating with Coupler.io’s help.
To start exporting data for your report, select your ad platform in the widget below and click Proceed.
Before your data can be transferred, you need to create a Coupler.io account if you don’t have one already (no card required).
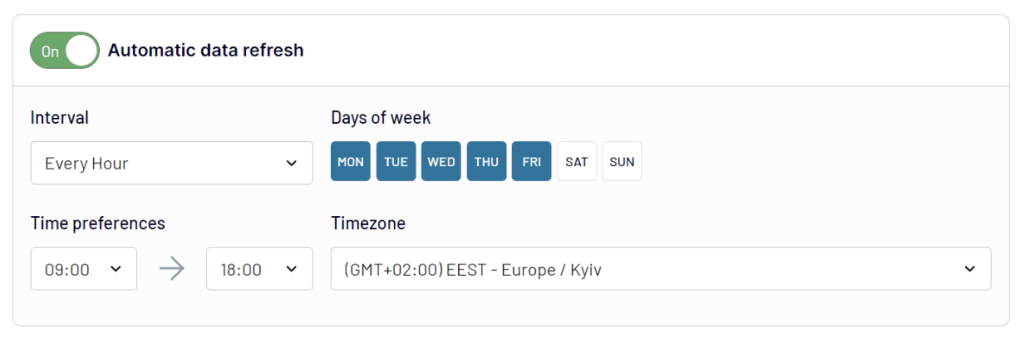
After setting up the connection between your selected ad platform and Google Sheets, you can schedule updates. Your data will be refreshed automatically on the schedule you selected, with the update interval ranging from every 15 minutes to once per month.
Once everything is ready and you run the importer, your data will be added to the worksheet and sheet you selected. It will look like this:
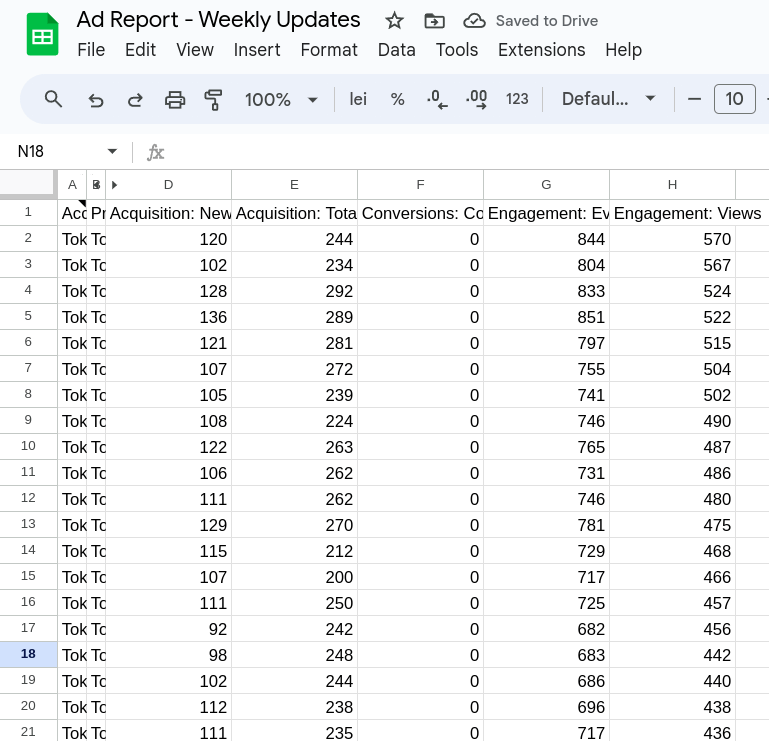
Now, you can work with your data and customize the report to your liking.
As you can see, reporting and analyzing PPC campaign data can be done in many ways, depending on your needs. Each option has its advantages. However, using a multichannel dashboard helps you save time and makes it easier to have a complete overview of your PPC performance. We recommend trying it out, especially as the templates are available for free.
Analyze PPC metrics
Now that you know how to track campaign performance, it’s time to see how to analyze it. For example, to ensure your campaign is successful, you can compare your results against benchmarks or historical campaign data. Another important thing is to check how the results align with your business goals.
Let’s take a look at some of the most important PPC metrics and their benchmarks, as well as key business metrics and how to interpret them.
Click-Through Rate (CTR)
This metric shows you the percentage of people who clicked on your ad. You can use the following formula to calculate CTR:
CTR = (Clicks ÷ Impressions) x 100
To see if your CTR is good or not, you can compare it against benchmarks:
- 0.5% to 1% is considered a good result in social ads
- 5%-6% is considered a good result in Google Search Ads
Take into consideration the platform, industry, and ad platform when making the comparison.
Cost Per Click (CPC)
Another important metric that shows you how well your ads are performing is the cost per click. This KPI highlights how much you spend per click. To calculate it, you can divide the total number of clicks by the total cost.
Here are the benchmarks for the most popular ad platforms:
- Google Ads – a good CPC is around $2.50
- LinkedIn Ads – it can reach $5
- Facebook Ads – a good CPC is less than $2
Conversion Rate
This metric shows how often your users convert compared to the number of clicks. For instance, if you have 1000 visitors and 20 of them convert, then the conversion rate is 5%.
It is fairly hard to provide a single benchmark because it depends on the industry and the conversion type. However, the average conversion rate for ecommerce is 2-3%.
Quality Score
While it is not a direct financial metric, this is an important key performance indicator for Google Ads campaigns. It’s a measure from 1 to 10 that ranks the quality of your ads. This metric can impact the cost and ad position.
You should aim for 7 or higher.
This indicates the percentage of impressions your ads received compared to the total number they could’ve received. Impressions share has a great impact on visibility and that’s why you should aim for above 90%.
Customer Acquisition Cost (CAC)
This KPI shows the total cost of acquiring a customer. To calculate this metric, you can use this formula:
CAC = Total Marketing Expenses/ Number of New Customers Acquired
?Remember that the total marketing expenses are not just the cost of the PPC marketing campaign, especially if you are using different marketing tactics to attract customers. You will need to combine the costs of various marketing campaigns, including the PPC costs.
Cost per Acquisition (CPA)
Yes, this KPI is similar to the previous one, but it is not the same. This metric shows the cost necessary to make a user perform an action. CPA focuses on the cost associated with acquiring a single action/conversion, while CAC shows the cost of acquiring an actual customer, which might involve multiple actions or engagements.
To calculate cost per acquisition, you can use this formula:
CPA = Total Cost of the Campaign/Number of Conversions
Lifetime Value (LTV)
Customer Lifetime Value is an important business key performance indicator. It shows the total amount of money a customer is expected to spend on your business during their lifetime as your customer.
LTV formula:
LTV = Average Purchase Value × Average Number of Purchases × Average Customer Lifespan
where
Average Purchase Value is calculated by dividing the total revenue over a period by the number of purchases in that period.
Average Number of Purchases is the average number of times a customer buys from you in a specific period.
Average Customer Lifespan is the average amount of time a customer continues to purchase from your business.
Return on Ad Spend (ROAS)
This metric measures the effectiveness of a PPC advertising campaign. It calculates the revenue generated for every dollar spent on advertising. This helps you see how well your ad spend contributes to revenue generation.
Formula:
ROAS = Revenue from Ad Campaign: Cost of Ad Campaign
For example, if you spend $1,000 on a Google Ads campaign and generate $5,000 in revenue directly from that campaign, the ROAS would be 5:1.
While it is hard to set a benchmark, generally, a 4:1 ratio ($4 revenue to $1 in ad spend) is considered a good result.
Revenue
As you might expect, this shows the total revenue generated by your business. It is considered a primary indicator of a company’s success and growth prospects. However, it is important to take into account that revenue doesn’t equal profit. A business can have a high revenue but still lose money if its expenses exceed its income.
Now you know what key performance indicators you need to check to measure the success of your campaign.
Tips on how to interpret metrics
- Identify trends and patterns
By constantly monitoring and analyzing your PPC campaigns, you will start to spot trends and patterns. For example, see how your ads perform in the morning vs late evening or on Mondays vs during the weekend. Also, you can check geographical performance to see what countries you should target and which ones are not performing as expected.
- Check conversions against clicks
Not every website visitor is going to bring a conversion. However, you need to make sure that the ratio is good. At least 3% of visitors should be taking the desired action.
- Compare clicks and impressions
If your ad has a lot of impressions but only a few people make it to your website, it’s time to check the copy and the creatives used in the ad. A high number of impressions but a low number of clicks indicate that your ad is visible but it’s not engaging or clear enough for your audience.
- Check CTR against the conversion rate
A high CTR shows that your ads are visible and engaging. But, if that doesn’t lead to a good conversion rate, then your landing page has issues. Make sure that your landing page is providing exactly what you promised in your ads. There’s nothing more annoying than clicking on an interesting ad and seeing a landing page that gives different information.
- Compare cost per conversion and ROAS
ROAS is one of the most important business KPIs you should be examining. If your ROAS is lower than 1, you should optimize your campaigns or implement a different strategy. Ensure your average cost per conversion is 2 or even 4 times lower than the average conversion value.
Read about key PPC statistics and benchmarks to understand how your performance compares to industry standards.
How to optimize PPC campaign performance
Simply checking out PPC data is not enough. The most important part of the process is to actually use the findings from your analysis.
Pay-per-click advertising is not an exact science. While you can follow all of the recommendations, you need to test and optimize your ads constantly. Here are some of the areas where you should perform A/B testing and optimize:
Ad copy and creatives
The copy and the creatives are the most important part of your PPC campaign. They can make it or break it. This is why you should test and optimize headlines, descriptions, call-to-actions (CTAs), and other creative assets, such as banners or videos.
Landing page
Make sure that your landing page provides enough details without being boring. In the first fold, you should grab the customer’s attention and share the benefits of a user making the desired action, whether it is to make a purchase, join an event, or submit a form. Test with different layouts, fonts, banners, and copy to see what works best for your audience.
Keywords
Keywords are crucial for your ad campaigns. If you don’t optimize them constantly, your campaigns are going to underperform and your costs are going to increase. Focus on high-performing keywords and pause underperforming ones.
Bids
You should consider experimenting with manual bidding. In some cases, automated bidding targets a broad audience which can lead to higher costs. Also, you should increase bids on top keywords and lower them on keywords that are not performing as expected.
For more on this topic, check our guide on conducting a PPC audit.
How to nail PPC tracking
It can be challenging to get started with PPC tracking. However, if you follow the steps from this article – set up tracking, organize performance monitoring, and analyze your data – it should be easy to keep track of the performance of your ad campaigns. Also, testing and optimizing your campaigns is crucial to ensure the best results.
We wish you low costs and highly converting campaigns!

Analyze PPC performance with Coupler.io
Get started for free