
A client report does more than recap the month. It’s how the client decides whether your work is worth the fee, and often what they pass along when someone else has to decide.
When trust slips, the cause is often in the data. A metric means something different on the client’s side, or your numbers don’t match their own records, and an AI summary built on the same data makes everything worse. This guide covers where reports lose trust and how to close each gap. It also shows how to set up the data in Coupler.io, so the report and the AI summary work from numbers the client recognizes.
Why client reporting matters for agencies
Your client sees most of your work through the report. So it affects how they rate your agency, sometimes more than the results do.
Reporting shapes how clients judge delivery
Delivery is the work itself: the campaigns launched, the budgets moved, the creatives tested, and the pages changed. Most of it happens where the client can’t see it, so the report is where they find out what your team did.
Agencies tend to underestimate how much this matters. In Setup’s 2025 Marketing Relationship Survey, 61% of clients who ended an agency relationship cited dissatisfaction with delivery. When asked the same question, only 18% of agencies named delivery. Most pointed to client budget cuts.
A good report shows the work behind each result, so the client can understand what their fee paid for.
Your report is where the numbers turn into a plan
A client can pull a platform summary, give ChatGPT their targets, and get the numbers, an analysis, and even a suggested next step in seconds. But the model only knows what’s in the export. It doesn’t know that a new landing page goes live next week, or that your team already tried raising bids in March and it didn’t help. Here’s what each part of a report adds:
- Data: CPL rose from $42 to $51, up 21%.
- Analysis: Search CPC went up while conversion rate fell on the highest-spend campaign.
- Recommendation: Move part of that campaign’s budget to campaigns still under the client’s target CPL while the landing page is tested.
A context-rich recommendation is where your report earns its place, because it draws on what your team knows about the account.
Decision-makers you never meet read it too
Before a budget review, your contact often forwards the report to their manager or others outside the day-to-day work. They often have a say in whether the budget continues, but they don’t know the account history. All they have is what the page shows:
- “Paid social CTR rose to 1.8%” doesn’t tell them what the budget bought.
- “Paid social brought 64 qualified leads at $58 each, against a $75 target” does.
These readers look for what the client got, what it cost, and whether it hit the target. A percentage change on its own shows neither.


Set up client reporting once with Coupler.io
Book a demoWhy clients stop trusting agency reports and how to fix it
Clients rarely say outright that a report isn’t working. It shows up in smaller ways, like repeated questions about one metric or a request to see the raw numbers.
Nobody agreed on what the metrics mean
A lead can mean one thing in your report and another on the client’s side. Here’s how that plays out when the client checks your numbers against their own:
| Your report | Client’s interpretation | |
| Leads counted | 300 (all form submissions) | 120 (sales-accepted) |
| Cost-per-lead | $40 | $100 |
Both calculations use accurate data. But the client sees $100 against your $40, and your results look inflated.
Fix: Agree on the definitions before the first report
Ask the client how they calculate each KPI they already track. For each one, record:
- What it means and which platform it comes from
- How it’s calculated, including the attribution window
- The target
- The reporting period
Send the list to the client and get it confirmed. For help choosing the KPIs themselves, see the marketing agency reporting guide.
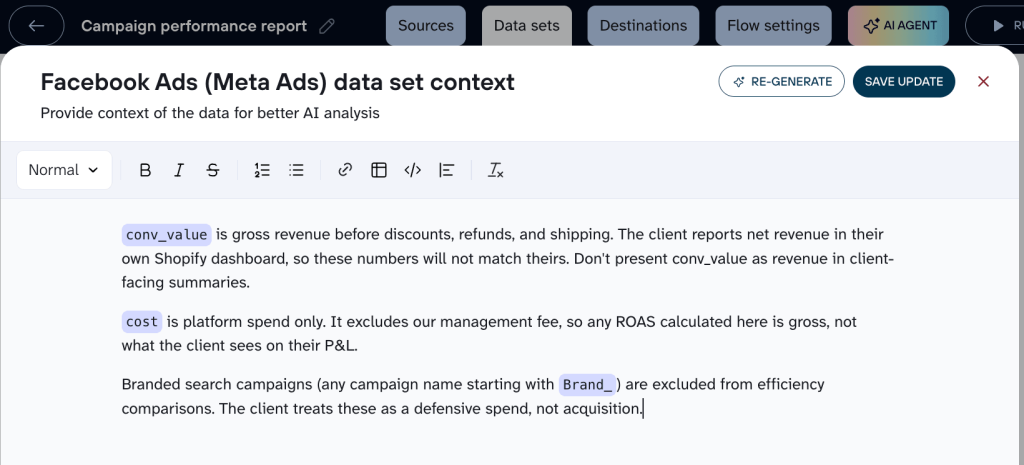
Agreed definitions in a doc only hold if someone reads the doc. The same gap shows up when you ask AI about the numbers, because a model has no way to know what’s “true.” In Coupler.io, you can add the agreed definition as AI context on the client’s data, and it goes to the model with every question about that data:

The client can’t see the work behind the results
Most of your team’s work happens behind the scenes. When results sit in one section and tasks in another, the client has to guess which action caused which change, and a change nobody can trace usually gets credited to the platform.
Fix: Connect each result to what your team did
Put them side by side instead. For a B2B SaaS client, it might look like this:
| Result | What we did | When |
| LinkedIn cost per demo request fell from $210 to $164 | Paused two ads with frequency above 4 and moved their budget to the best-performing carousel | May 8 |
| Google Ads conversions dipped for a week | Tested a new landing page, then rolled back to the old one after conversion rate fell | May 12–19 |
The dates let the client check the claim themselves. They can open the trend chart in their dashboard and see the change starting the week you made it. That’s what dynamic reporting gives you over a static PDF.
If a result changed for reasons outside your control, such as a competitor raising bids, say so on a separate line in the report.
Follow-up questions take days to answer
Once a report goes out, the client often replies with a question it doesn’t cover:
“Did the Black Friday email campaign bring in any of those leads?”
The answer sits in two tools, the email platform and the CRM. Exporting from both and matching the records takes time you didn’t plan for.
Fix: Answer from connected data instead of raw exports
Handing the files to an AI tool like ChatGPT speeds up the analysis, but someone still has to pull the exports, and the model works out the numbers itself. Its answer may not match your report.
With the client’s email and CRM data connected, Coupler AI answers without any exports. The Analytical Engine runs the calculation, and the model explains the result, which keeps the answer consistent with the report.
Let Coupler AI do the data work for you
Tell Coupler AI what you need to know, from which source, and how often. It connects your account, sets up the data flow, keeps it refreshed, and lets you analyze the results inside Coupler.io or another AI tool.
Try for free

The report shows results, not value
Many reports open with impressions and clicks because that’s what ad platforms show first. The client is looking for something else: whether last month was worth what they paid.
Fix: Lead with numbers that prove value for money
Say you run paid search and paid social for a B2B SaaS client across Google Ads, LinkedIn Ads, and Meta Ads. Keep the same order in every report:
- Headline KPIs with trend. Start with the results the client pays for, such as clicks and cost per conversion, each with the change from last period.


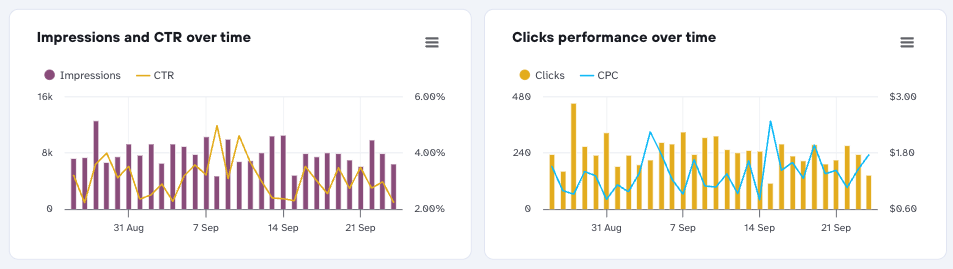
- Key trends over time. Show how performance shifted throughout the month. Pick chart types the client can read at a glance (see these data visualization tips).

- Channel and creative breakdown. Make it easy to see which platforms and ads drove the change.

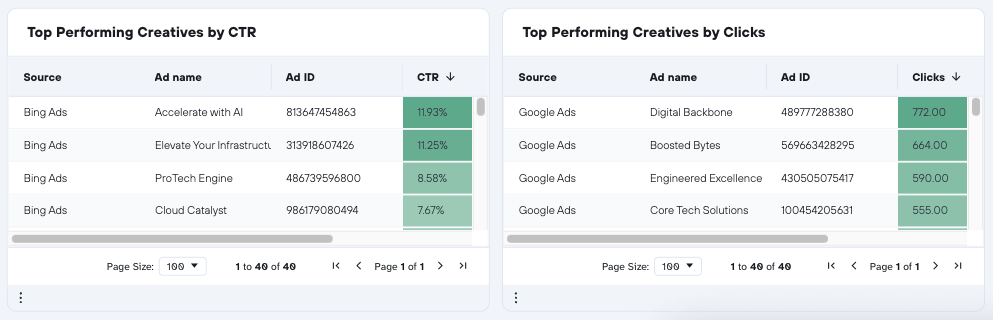
You don’t have to build this layout for each client. The screenshots above come from Coupler.io’s Multi-channel ad creatives performance dashboard. Connect the client’s ad accounts and share it with them; it refreshes on a schedule so they can check the numbers any time.
The numbers don’t match the client’s own records
Meta, Google Ads, and GA4 each count results their own way, and none of them will match the client’s store exactly. Say GA4 shows 82 purchases this month and the client’s Shopify store shows 95 orders. Both numbers can be correct: GA4 misses purchases from visitors who block tracking or decline cookies, while Shopify records every order placed.
The client checks Shopify, sees 95 → starts doubting the rest of the page.
Fix: Show both numbers and name the difference
Put the client’s own figure next to yours and say in one line why they differ. “GA4 recorded 82 purchases; Shopify recorded 95. GA4 misses buyers who decline cookies” costs you a sentence and settles the question before the client asks it.
That only works if both numbers are in front of you when you write the report. If your team summarizes a raw GA4 export with AI, the model has only the 82 to work with and repeats it confidently. With Coupler.io, you can combine GA4 and Shopify data in a single, pre-built report, so the analysis and the AI summary work from the same numbers.
Shopify store traffic dashboard

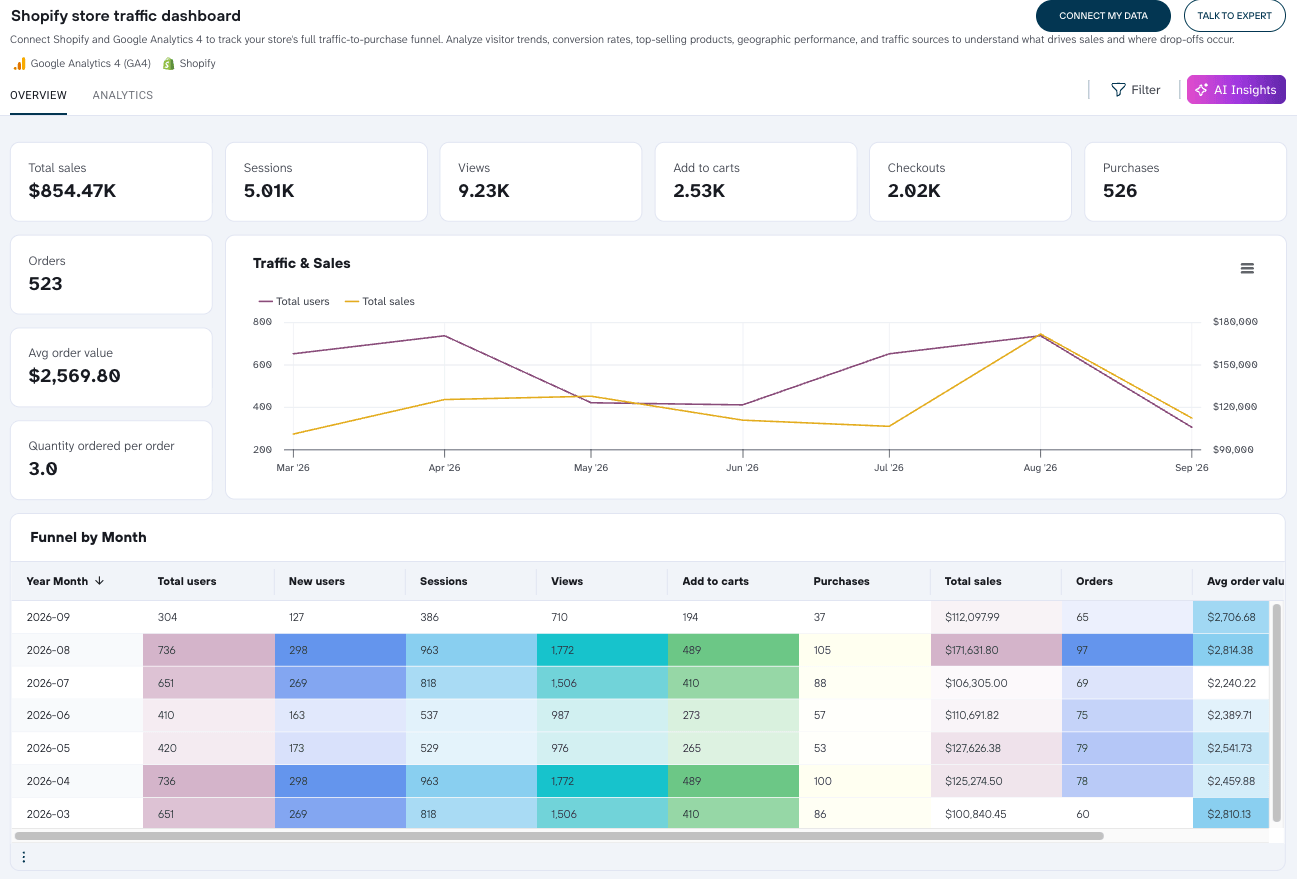
Shopify store traffic dashboard
Get the free dashboardBudget requests arrive without the evidence
The person approving often can’t see what the last increase bought. A case built on opportunity asks them to take your word for it, and a finance lead reading a forwarded report has no reason to.
Fix: Tie budget requests to real results
Use numbers the client has already accepted. Compare these two:
❌ “We recommend increasing the search budget to capture more demand.”
✅ “Last quarter’s extra $3,000 in search brought 41 qualified leads at $73 each, under the $75 target. Another $3,000 at that rate would add about 40 more next quarter.”
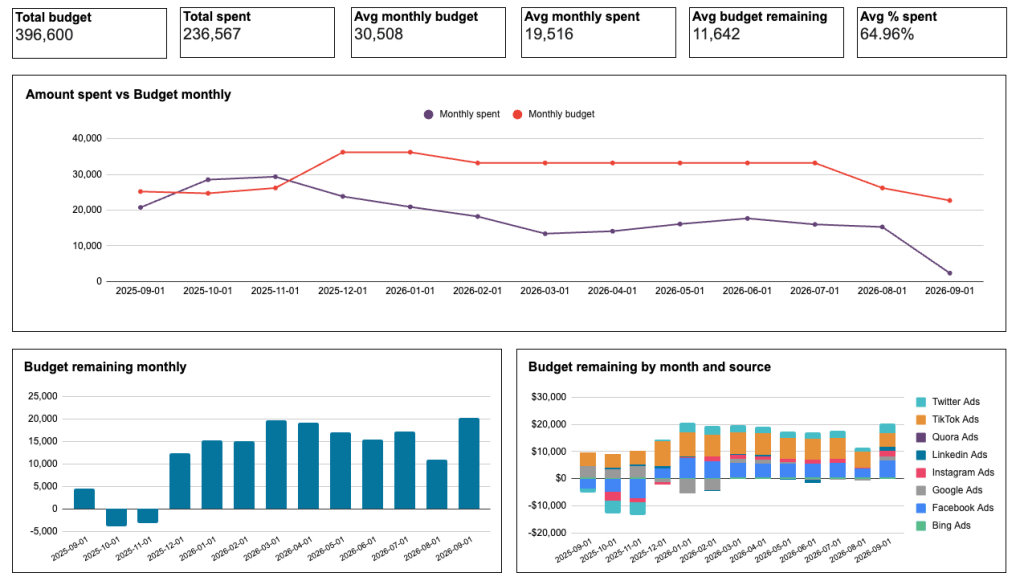
Show spend against budget on the same page, and the client can see you’ve kept to what they approved. Coupler.io’s PPC monthly budget dashboard puts monthly ad spend next to the approved budget across platforms.

End the report with next month’s actions, the decision you need from the client, and when you’ll report back on the result.
Give clients numbers they can trust with Coupler.io
Book a demoWhat your client reporting tool needs to handle
The fixes above are easy for one client. Whether they hold at 10, 25, 50 depends on your client reporting tool’s capabilities. A few things to check:
- Marketing data coverage. If the tool covers every source your clients use, and what happens when one isn’t supported. Omnichannel reporting breaks on the first gap: one unsupported platform means a manual export every month, and that export is where the numbers drift from everything else in the report.
- Delivery methods, or where the numbers end up. Some clients want a basic spreadsheet, some want Power BI or Google Sheets dashboards they can edit themselves, and your own team may want the same data in an AI tool. A tool that only sends to one destination means rebuilding the report per audience.
- Useful AI features. Check which parts of reporting the AI can handle, such as setting up data flows, drafting summaries, creating SQL queries, and answering follow-up questions.Each one should work from the same data as your reports.
- Upkeep. Whether refreshes run on a schedule you set. If someone has to press a button before every client call, the reporting cycle stays manual no matter what the dashboard looks like.
- Cost as you scale, or what the bill is actually charged on. Per-seat pricing gets expensive when a reporting tool has to be open to everyone who touches a client account.
Coupler.io is a data integration and AI analytics platform. As one of the top client reporting tools for agencies, it connects 400+ sources into one prepared data set per client, refreshed on your schedule. Start from a template or build the report with AI, then ask questions of the same data. Pricing is per connected account rather than per seat, and white label reporting puts every report under your agency’s brand.
Build a client report from one connected data set in Coupler.io
This might all look like extra work for every client. It isn’t, because everything above runs off the same prepared data: the report the client opens, the numbers your team checks, and the answers to their follow-up questions. You can set it up with Coupler.io in just a few minutes.
1. Describe the report you need. Tell Coupler AI the sources, metrics, and refresh schedule you want to configure. For example:
"Create a monthly report for Client X with Google Ads, Meta Ads, and Shopify data.
Show spend, orders, and ROAS by channel, and refresh the data daily."
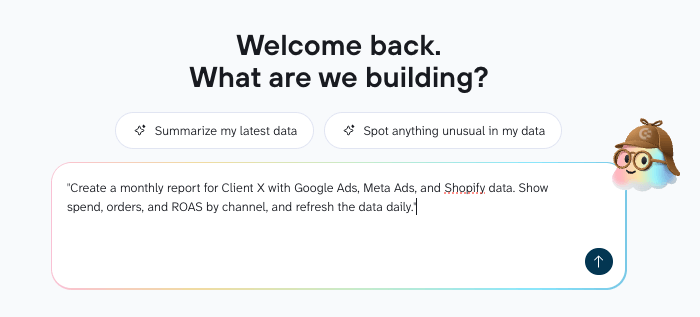
Coupler AI prompts you to connect the accounts, then builds the data flow. You can schedule reporting around the client’s review calls later.
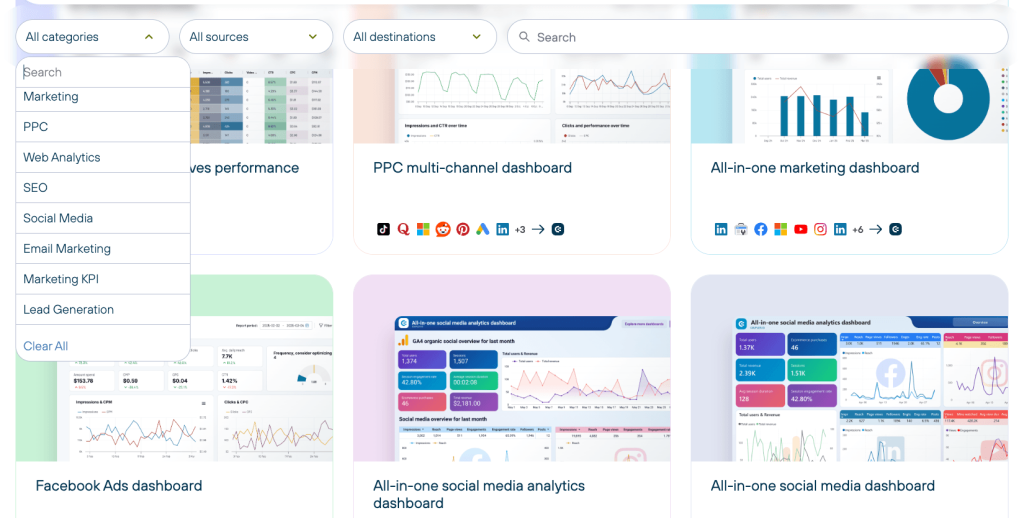
If a client reporting dashboard already covers the client’s channels, you can connect the data there instead. Examples include a YouTube KPI report in Data Studio or a Web Analytics report in Power BI. Find 250+ dashboard templates in Coupler.io’s library, from PPC to SEO dashboard reporting:

2. Check the setup and add the agreed calculations. Review the sources, fields, and metrics before the first run. Coupler.io works as data blending software and puts ad spend and store revenue in one table. Then add the client’s definitions, such as ROAS on Shopify net sales. Ask the AI to save that context to your data set for future reference.
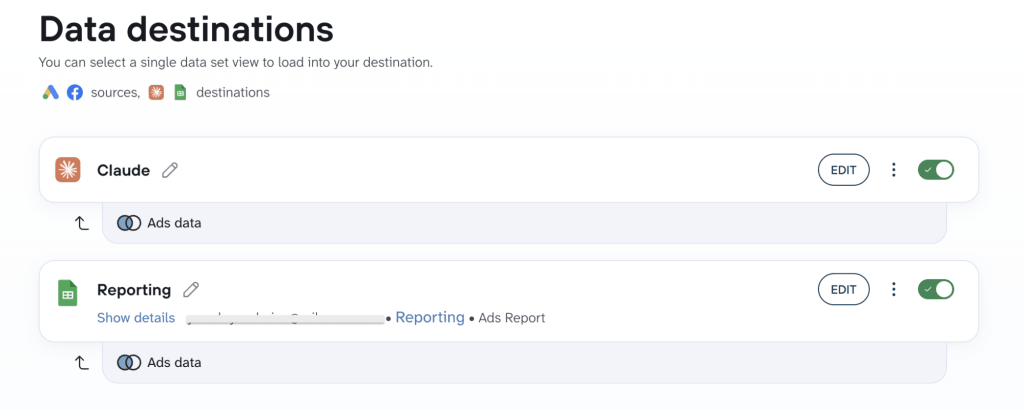
3. Connect the same data to your AI tools. The data flow that feeds the client’s dashboard can also go to Claude, ChatGPT, or Gemini through Coupler AI. Your team then works from the same numbers the client sees.

4. Draft the analysis. Ask Coupler AI or your connected AI tool to summarize what changed and why. For the same analysis every cycle, run a pre-built Skill like the Google Ads client report or the LinkedIn Ads client report for B2B accounts Your team reviews the draft before it goes out.
Once the data flow is in place, the dashboard, the report, and the AI summary all use the same numbers. Your team’s time goes to the part clients can’t get from their own tools: the recommendation and the fix. For a more detailed walkthrough, see how to set up automated client reporting.
Get answers built on verified data with Coupler.io
Book a demoHow to keep client reporting accurate when using AI
Most agencies already use AI somewhere in their reporting. Some draft commentary with it, and others build the entire report in ChatGPT or Claude. The risk in AI reporting is the same either way: every figure depends on the model’s own arithmetic, and with a long export it may not read every row.
Coupler AI divides the work differently. The model sees the structure of the client’s data set and a sample of rows, and turns your question into a query. The Analytical Engine runs that query on the full data set and returns the result for the model to explain:
"What was blended ROAS last month, using Shopify revenue and total spend across Google Ads and Meta?"
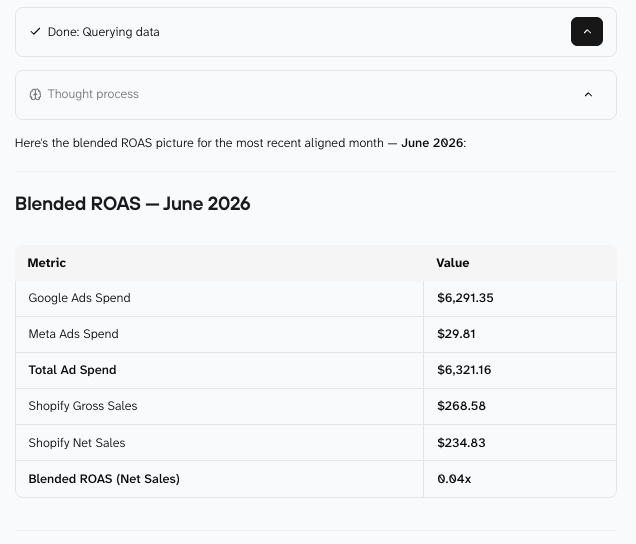
This split matters most when the numbers go straight to a client. Gabe Solberg at Right Percent relies on it for his campaign reviews and stakeholder reports.


How Gabe Solberg reduced PPC reporting time with AI and Coupler.io
Solberg manages more than $1M a month in ad spend. After he connected the agency’s ad data to Claude through Coupler.io, his daily campaign reviews dropped to under 10 minutes. Overall, he cut his reporting time by 60%.
Read the case studyThe same connection works with ChatGPT, Gemini, and other AI tools. Whichever you use, your account team still edits the summary before it goes out, adding what the data can’t show, like a campaign the client paused. For the full workflow, see how to build client reports with AI.
Clients also notice when a report changes shape from one month to the next, usually because each one starts from a new prompt. Coupler AI Skills hold the instructions for a repeatable job, so a pre-built Skill like Facebook Ads waste and scale runs the same analysis on each client’s data every month.

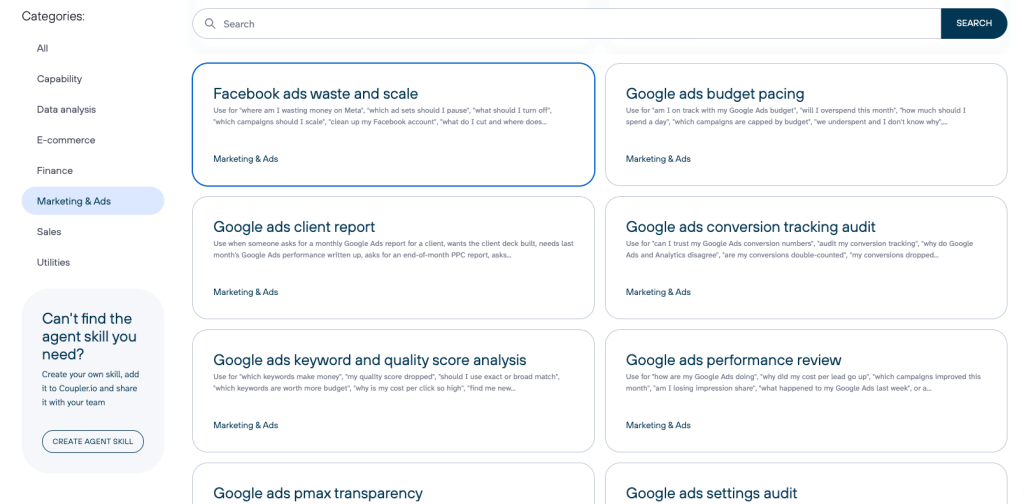
For LinkedIn accounts, the LinkedIn Ads creative fatigue skill flags creatives that are wearing out and estimates how many new creatives you need each month.
As for where the client’s data goes, Coupler AI connects read-only and never receives the credentials to the client’s accounts. You choose which fields it can reach, and Coupler.io is SOC 2 Type II certified and compliant with GDPR, HIPAA, and DORA.
Start with your next client report
Pick one recurring report and check it against these questions:
- Would someone who has never spoken to your team understand what the client got for their money?
- Is each KPI’s definition, source, calculation, and target agreed with the client?
- Where your numbers differ from the client’s own records, does the report show both?
- Does each result sit next to the work that caused it?
- If AI drafted any commentary, can you trace every number back to the data?
Fix the first gap you find, and start with the definitions if they aren’t agreed yet. Most of the other gaps come from how the data is set up: sources kept apart, definitions saved in a doc, or AI working from an export. Data integration in one Coupler.io data flow per client covers those. From there, you can automate the recurring parts of your data reporting and keep the commentary for your team.
Connect 400+ sources for client reports with Coupler.io
Start for free