Omnichannel Reporting: How to Get a 360 View of Your Sales and Marketing Performance Data

Data is a powerful tool for any sales or marketing team. But when you start building omnichannel views of that data you unlock its actual benefits.
In this article, we’ll cover omnichannel reporting, how to start building reports, and the best tools for the job.
What is omnichannel reporting?
Omnichannel reporting is the process of collecting, visualizing, and analyzing sales and marketing data from different platforms in one unified dashboard view with the purpose of improving your business results.
An omnichannel analytics report provides insights into how customers engage with your brand, products, and services across different touch points, be it in-store, online, offline, or with your customer support department. This information can help you uncover behavior patterns, understand customer needs, optimize marketing strategies, and allocate resources more effectively across different channels.
Why is omnichannel reporting important?
Without data, there’s no way of understanding what works, what doesn’t, and what needs to be optimized.
You can get access to customer engagement data from different channels at specific touchpoints in the journey through individual platforms’ analytics dashboards, but without pulling all these together it can be hard to see the whole story, and you also risk missing important details.
That’s exactly why omnichannel reporting is important. By pulling data from your top channels, think all your social media platforms, Google Ads, or your Shopify eCommerce store, you get:
- A 360 view of your customer data: Prevent data silos and understand which channels are more profitable and where you need to work to improve the omnichannel customer experience.
- Team collaboration across the entire customer journey: Sales will have a better understanding of where leads are coming from, and marketing will be able to optimize acquisition for the channels with higher conversion rates.
- Better decisions based on real-time data: Identify friction points across the customer journey and optimize your messaging and engagement strategies based on data.
Challenges when implementing an omnichannel report
The main challenge when getting started with omnichannel reporting is having a disconnected tech stack and naming discrepancies across your data.
What does this mean exactly?
A disconnected tech stack refers to having tools that don’t integrate with each other or with your reporting tool. This means you can’t easily pull data from all your sources without custom API integrations that are time-consuming and require technical expertise.
But let’s say you get all your data inside a reporting tool. Lack of consistency across it will lead to inaccurate tracking.
For example, if you are tracking your signups from different channels using custom events named differently in each, you will end up with both the number of “signup” and “signed_up” events instead of how many times a conversion happened across each channel.
To overcome these challenges it’s important to be intentional when choosing your tech stack, standardize your data for accuracy and configure the reports using the right tools.
If this sounds like a lot, Coupler.io can help you get started with setting up your analytics from scratch across various data sources or configure custom omnichannel dashboards for you, based on your needs.
How to create an omnichannel report in 4 steps
Want to get started on your own? Here’s what you need to do.
1. Define the metrics you need to track
Sales, marketing, or customer support will each need different data visualization dashboards with a focus on specific metrics. Based on your goals and activities you will want to have an omnichannel approach to a specific part of the journey.
Let’s say you own an eCommerce store and you want your marketing team to better understand conversion rates by measuring digital marketing performance.
When it comes to marketing data visualization you’d want your eCommerce KPI dashboard to include engagement data on your website. Think total orders, average order value, abandonment rate, and even customer lifetime value (LTV). Something that looks like the live and interactive custom report below, built by Coupler.io.
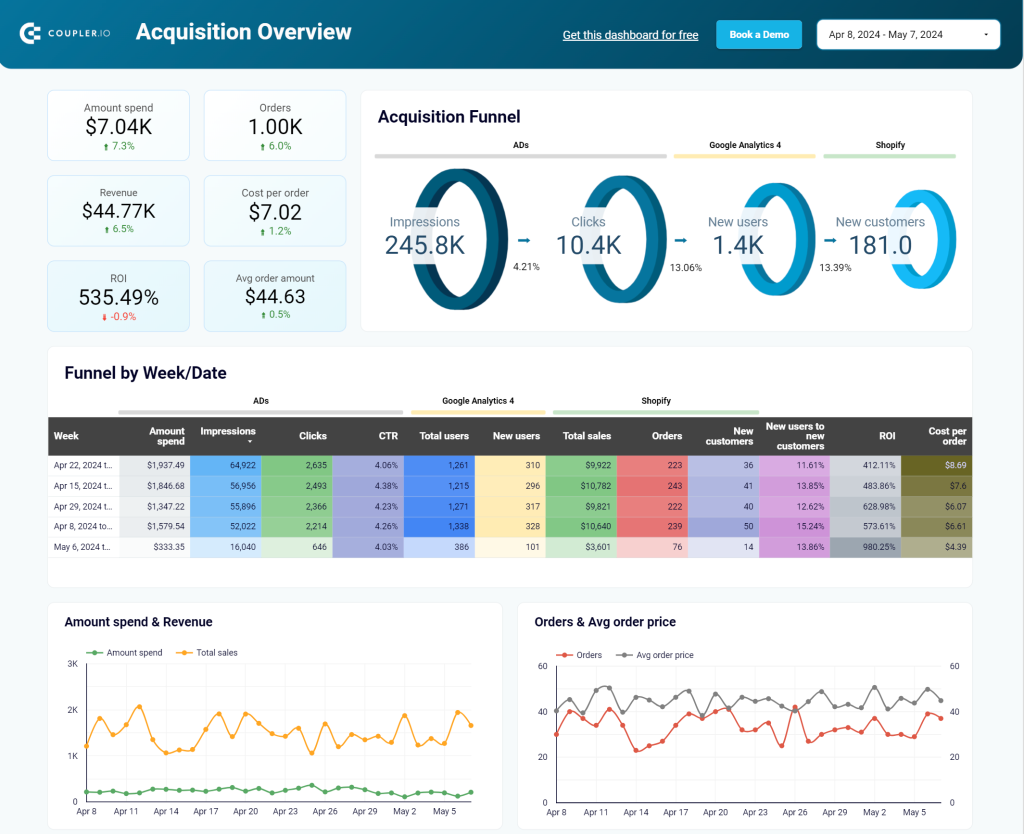
To spice this up, you can also merge other acquisition data like traffic sources by channel to understand how to improve ROI.
As you can see, the omnichannel data you’d want to track will be highly correlated to your business, your goals, and the part of the customer journey you want to focus on.
Learn more about marketing funnel reporting.
To make it easier to understand, here’s how customer support and/or success dashboard might look like, tracking metrics like customer satisfaction score or the number of support tickets opened and closed across multiple channels with the average handle time per agent.
Spice it up with interactions with your contact center, chatbot, or email engagement.
When building these reports, you get live and interactive data at your fingertips.
2. Build a list of data sources relevant to your team
Once you understand the metrics relevant to you, move to the next step and build a list of all the data sources you will need to pull data from.
You might need to export data from Google Analytics, Google Ads dashboard, social media tools, your CRM, Shopify, or WooCommerce store or even merge data from your offline sources to build a comprehensive reporting dashboard. The list will vary depending on the metrics you need in your report.
3. Standardize your data for accuracy
Next, to avoid inaccuracies, as we discussed above, you need to standardize your data.
Events, especially conversion ones, and user attributes should be named following some standard conventions you define.
For example, naming an account signup action in different ways (“sign-up” vs “signup” vs “signed up”) will lead to tracking the same event 3 separate times across different platforms and ruin your omnichannel dashboard data accuracy.
To achieve this, you’ll first need to define your naming standards and make sure to use them when setting up your tools for data tracking. Next, automate your data flows to avoid errors that may occur while collecting data manually.
Coupler.io data automation platform can help with that. With this data blending software, you can preview your data from multiple sources before importing and merging it. Let’s say you want to combine data sets from HubSpot and Mailchimp to better understand your customers’ needs.
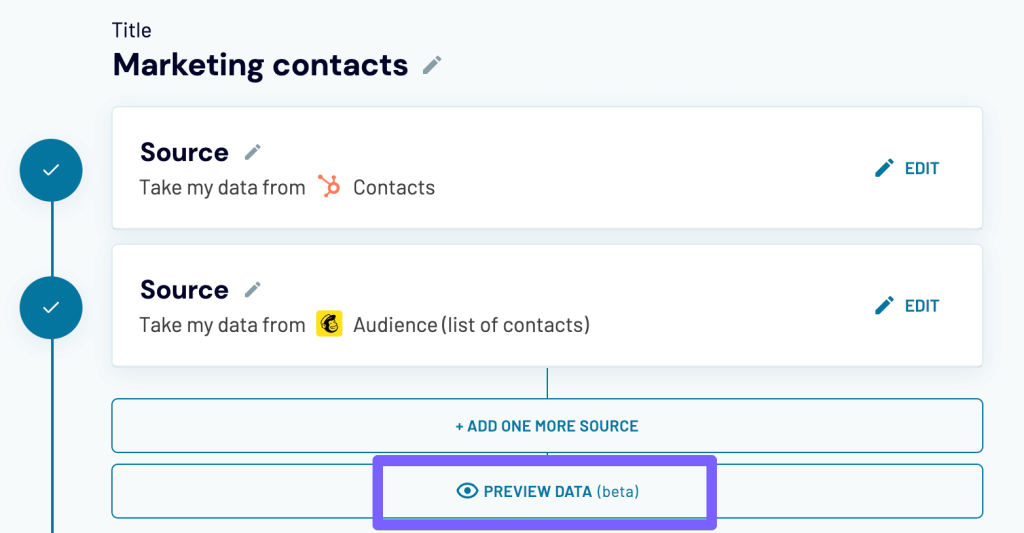
Select your data sources, then click on preview data before moving forward. This way, you can easily spot discrepancies across different data sources, and make adjustments to the data, like renaming or hiding columns.
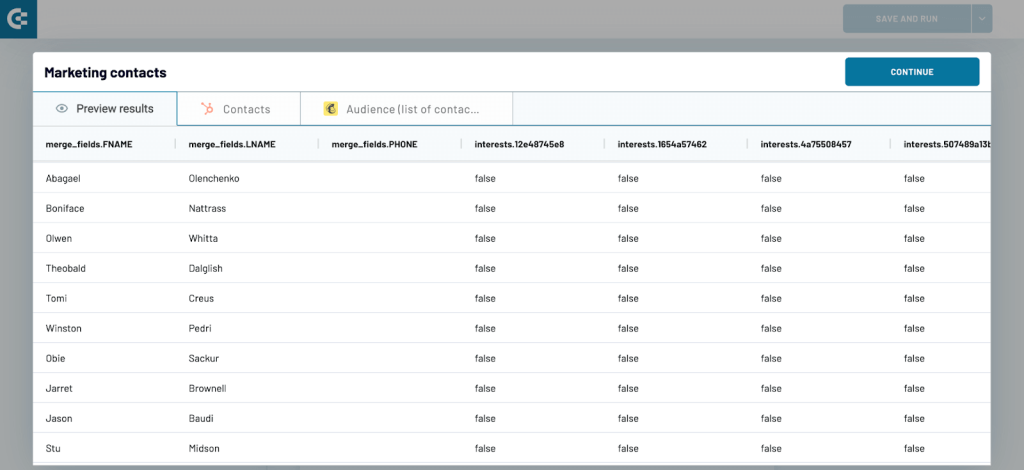
This helps especially when you are trying to merge data from tools that have predefined data naming. In the example below, Hubspot uses “firstname” to define the contact’s first name, while Mailchimp uses “FNAME”, this would have caused data inaccuracies when merging if you did not check and rename them.
Once all looks good, automate the data flow to make sure you have your data updated in as close as real-time as possible.
4. Configure your omnichannel report
When all the above is sorted out, it’s time to start building your report by routing data from multiple tools, collected at various touchpoints, to get the 360 view of your omnichannel data. To achieve this, you can:
- Do it in-house: This is the most time-consuming and resource-intensive option, and it can lead to inaccuracies due to a lack of expertise. If you are just starting out and have limited resources available, stick to a non-omnichannel approach to your data. Individual analytics reports from the tools you use should be a good starting point.
- Choose a tool: You can use ETL tools like Coupler.io to extract and merge all your data inside a data warehouse for manipulation and reporting at scale or go for customer data platforms like Segment to integrate data from multiple channels. We’ll go over tools in more detail in a bit.
- Outsource this task to a specialist: This is the stress-free option if you want actionable dashboards with all the needed data without having to deal with setting up integrations and data automation at scale. With 15 years of experience in workflow automation and data analytics, Coupler.io’s team of experts can help you set up advanced data visualization dashboards to understand your product’s omnichannel performance. Need more details on how this partnership can work? Get in touch with a Coupler.io specialist here.
Types of omnichannel analytics and reporting tools you can use
ETL tools
ETL stands for “Extract, Transform, and Load.” These tools are designed to extract data from one or more sources like Salesforce or Google Analytics, transform it into a proper format and import it into a system, such as a data warehouse like Google BigQuery.
The process of extraction involves collecting data from various sources, such as databases, spreadsheets, and other file formats.
An example of an ETL tool is Coupler.io. It allows you to gather, transform, and analyze data to see the holistic picture of your business and stay ahead of the curve, starting at $24/month only.
You can try Coupler.io at no cost for 14 days to see how easy it can be to bring your data in one place, on auto-pilot. In addition, Coupler.io offers free automated templates that let you build rich reports in minutes. For example, see our article on Google Sheets dashboards for more details.
ETL tools are not the same as reporting tools, in that they are used for data manipulation and integration, rather than reporting. ETL tools are designed to handle large amounts of data from multiple sources and to transform the data into a format that can be used by the target system.
Reporting tools, on the other hand, are designed to create reports and visualizations based on the data that has already been processed and transformed by ETL tools. We’ll cover these next.
Apart from Coupler.io, these are some of the most popular ETL tools available:
- Integrate.io: Cloud-based low-code data integration platform with multiple connectors available, price starts at $15.000 /year for 2 connectors (extra $2000/year/connector)
- Google Cloud Dataflow: Cloud-based tool for streaming data analytics with speed and low latency, pay-as-you-go pricing model (billed per second based on the use of Dataflow batch or streaming workers)
- Oracle Data Integrator: Enterprise tool with many features and integrations, pricing available on request only
Customer Data Platforms (CDPs)
Tools like Segment that work to integrate data from different platforms and let you build specific reports are called customer data platforms.
These are reporting tools that offer pre-built integrations with different platforms, with the sole purpose of bringing together customer data from multiple sources, like your website, your SaaS product or eCommerce store, email platforms, CRMs, etc.
One of the main benefits of using a CDP is that it allows for a more personalized customer experience.
By combining data from different channels, CDPs can create a complete view of customers’ interactions with a brand or product. This allows for better targeting and segmentation, as well as more effective marketing campaigns.
CDPs can also help businesses to comply with data privacy regulations, such as GDPR and CCPA. By providing a single source of truth for customer data, CDPs can help ensure that data is stored and managed in a way that is compliant with these regulations.
The downside of customer data platforms is that they can get expensive, fast.
For example, using Segment is free if you have below 1000 visitors per month and don’t need data from more than two sources. But when you need even just a little more, you already have to pay $120/month for up to 10.000 visitors. It only goes up from there.
Apart from Segment, these are some of the most popular CDPs available:
- Amplitude: For marketing and sales dashboards, this CDP tool offers tons of integrations offering a free plan too.
- Lytics: CDP tool focused on helping with brand marketing and advertising efforts, offering a free plan.
- BlueVenn: Enterprise software for building an omnichannel marketing hub with an intuitive UI, starting at $2333/mo.
Data Analytics Tools
Analytics tools are like the downsized version of reporting tools. These are still reporting tools but are specialized for a specific channel only, since they are meant to provide data on a specific part of the customer journey.
Google Analytics is one such tool, that allows you to monitor conversions and traffic across your website.
GA is free to use, but it comes with its limitations. The most important one is access to a limited set of data (1000 rows) when visualizing reports inside the GA dashboard compared to access to all data when you use an ETL tool and export GA data to a data warehouse for manipulating and reporting purposes.
In the same way, Google offers website data analytics, most of the tools in your stack will offer at least some sort of analytics and reporting. Your Facebook ad account will provide social media reporting that includes conversion data, your Mailchimp account will give you insights into your email marketing efforts, and so on.
For a true omnichannel data analysis, you will still need to use an ETL or CDP tool.
How Coupler.io can help with omnichannel reporting
As already mentioned in this article, Coupler.io can help with your analytics in two ways. First, you can use the tool to set up automatic data integrations between tools like Salesforce or Google Analytics and a data warehouse like Google BigQuery.
However, the true value of using Coupler.io relies on its data analytics services.
Imagine not having to deal with data exporting, transformation and manually updating reports. From advising, data infrastructure recommendations, and building custom omnichannel dashboards to data automation at scale, Coupler.io has your back.
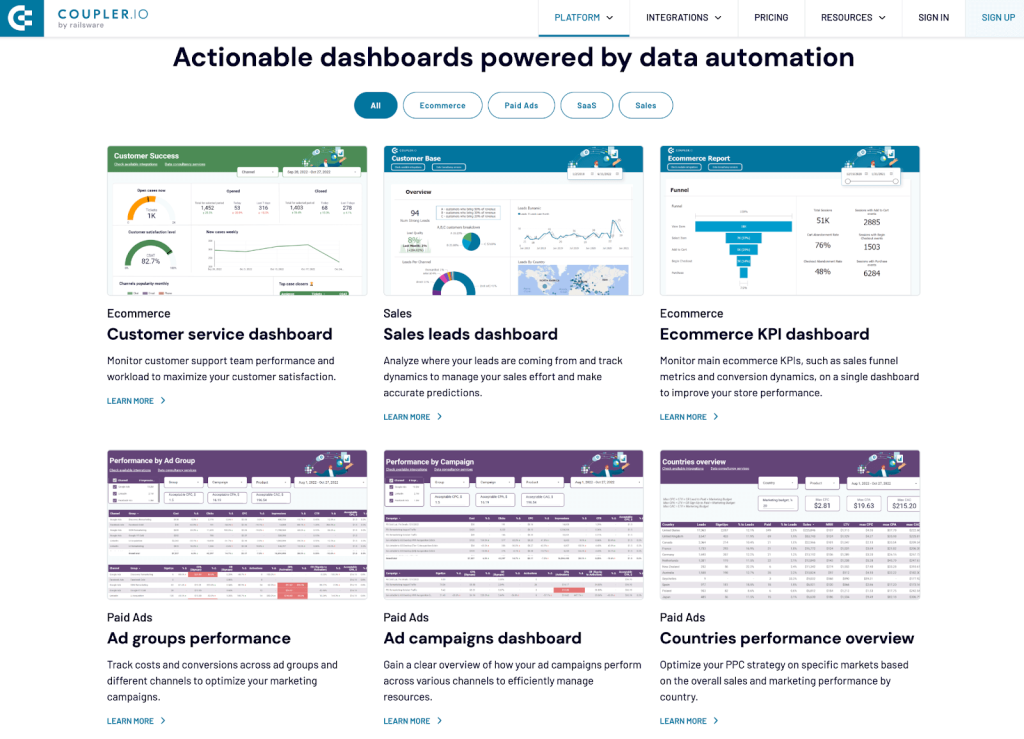
It’s the simplest, fastest, and most importantly, most accurate way to get actionable dashboards powered by data automation.
Coupler.io data experts can help you streamline the process of importing relevant data into a data warehouse and visualize it inside BI tools like Data Studio.
For customer service dashboards, sales or marketing dashboards, ad campaign metrics, or marketplace dashboards, Coupler.io can help configure custom reports based on different data sources.
Omnichannel reporting: main takeaways
Getting started with omnichannel reporting can seem difficult and time-consuming. Not to mention dealing with integration or data standardization challenges.
Fortunately, there are a few simple steps to get this right when you are just starting out, and there are plenty of tools to help, for every budget.
But if you want some piece of mind while leveraging data reports at scale, get in touch with Coupler.io’s team and outsource this time-consuming task to experts who do this every day.
Check our article on marketing reporting templates for omnichannel reporting and more.