60+ Google Data Studio (Looker Studio) Dashboard Examples and Templates

A solid dashboard has one major mission – turn raw data into insights. The raw data for the dashboard can come from different sources, be it GA4, Facebook Ads, Google Search Console, etc. However, on the dashboard, this data is transformed into charts and tables that facilitate informed decision-making.
I’ve collected over 60 best Google Data Studio (Looker Studio) dashboard examples designed by Coupler.io and other analytics solutions. Since this number is pretty big, I’ve grouped the dashboard into several areas:
- PPC & advertising
- Marketing analytics
- Email marketing
- Social media analytics
- SEO and web analytics
- CRM & sales
- Ecommerce
- Finance
- Project management
PPC and advertising examples of a Looker Studio dashboard
#1. PPC multi-channel report template by Coupler.io – for Facebook Ads, Google Ads, and other ad platforms
This Looker Studio dashboard template by Coupler.io is called the PPC multi-channel dashboard. Multi-channel means that you can monitor and evaluate the key performance indicators of paid media campaigns for different advertising platforms. Currently, it supports the following ad sources:
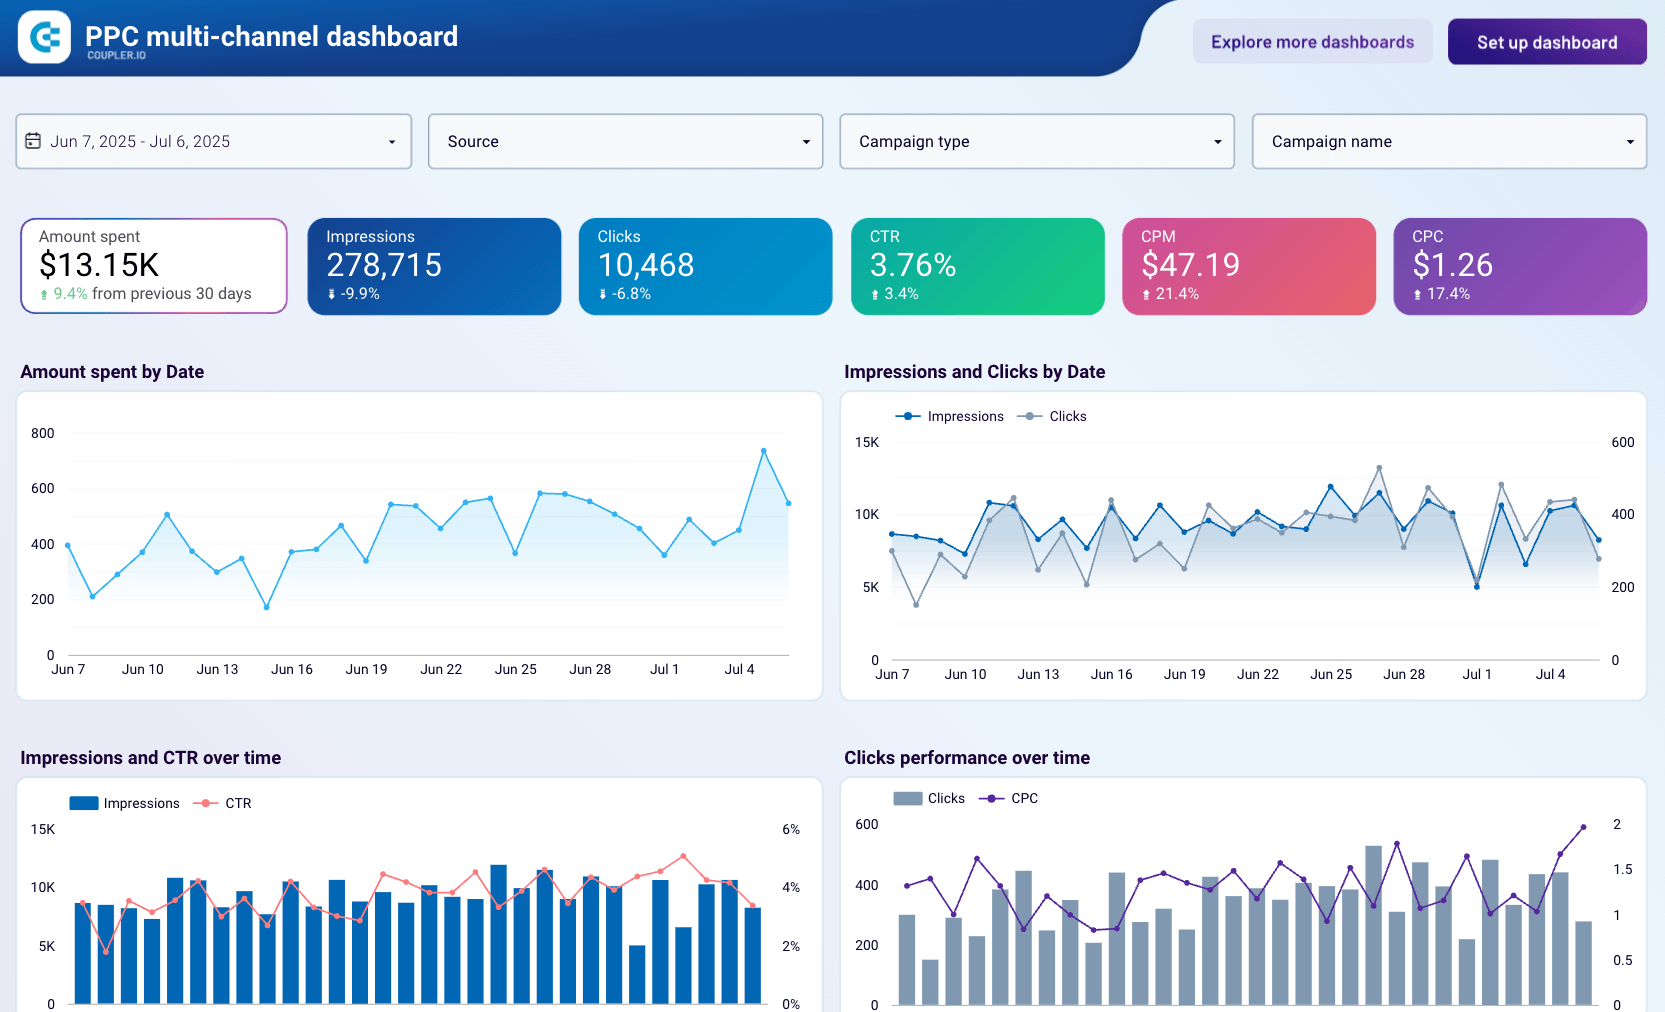
This dashboard is a perfect solution for marketers and PPC experts to monitor their ad campaign performance, compare channel metrics, and keep an eye on KPIs. You won’t have to jump from one ad campaign manager to another. The information from all your sources will be by hand in one place.
Dashboard metrics:
- Amount spent
- Impressions
- Clicks
- Click-through rate (CTR)
- Cost per click (CPC)
- Cost per thousand impressions (CPM), etc.
#2. Looker Studio template for a Google Ads dashboard by Coupler.io
This Google Ads dashboard within Looker Studio by Coupler.io provides a comprehensive and detailed analysis of your Google Ads advertising campaigns. You can gain a deeper understanding of your campaigns’ effectiveness, with access to a wealth of data and metrics, and align them with your marketing goals.
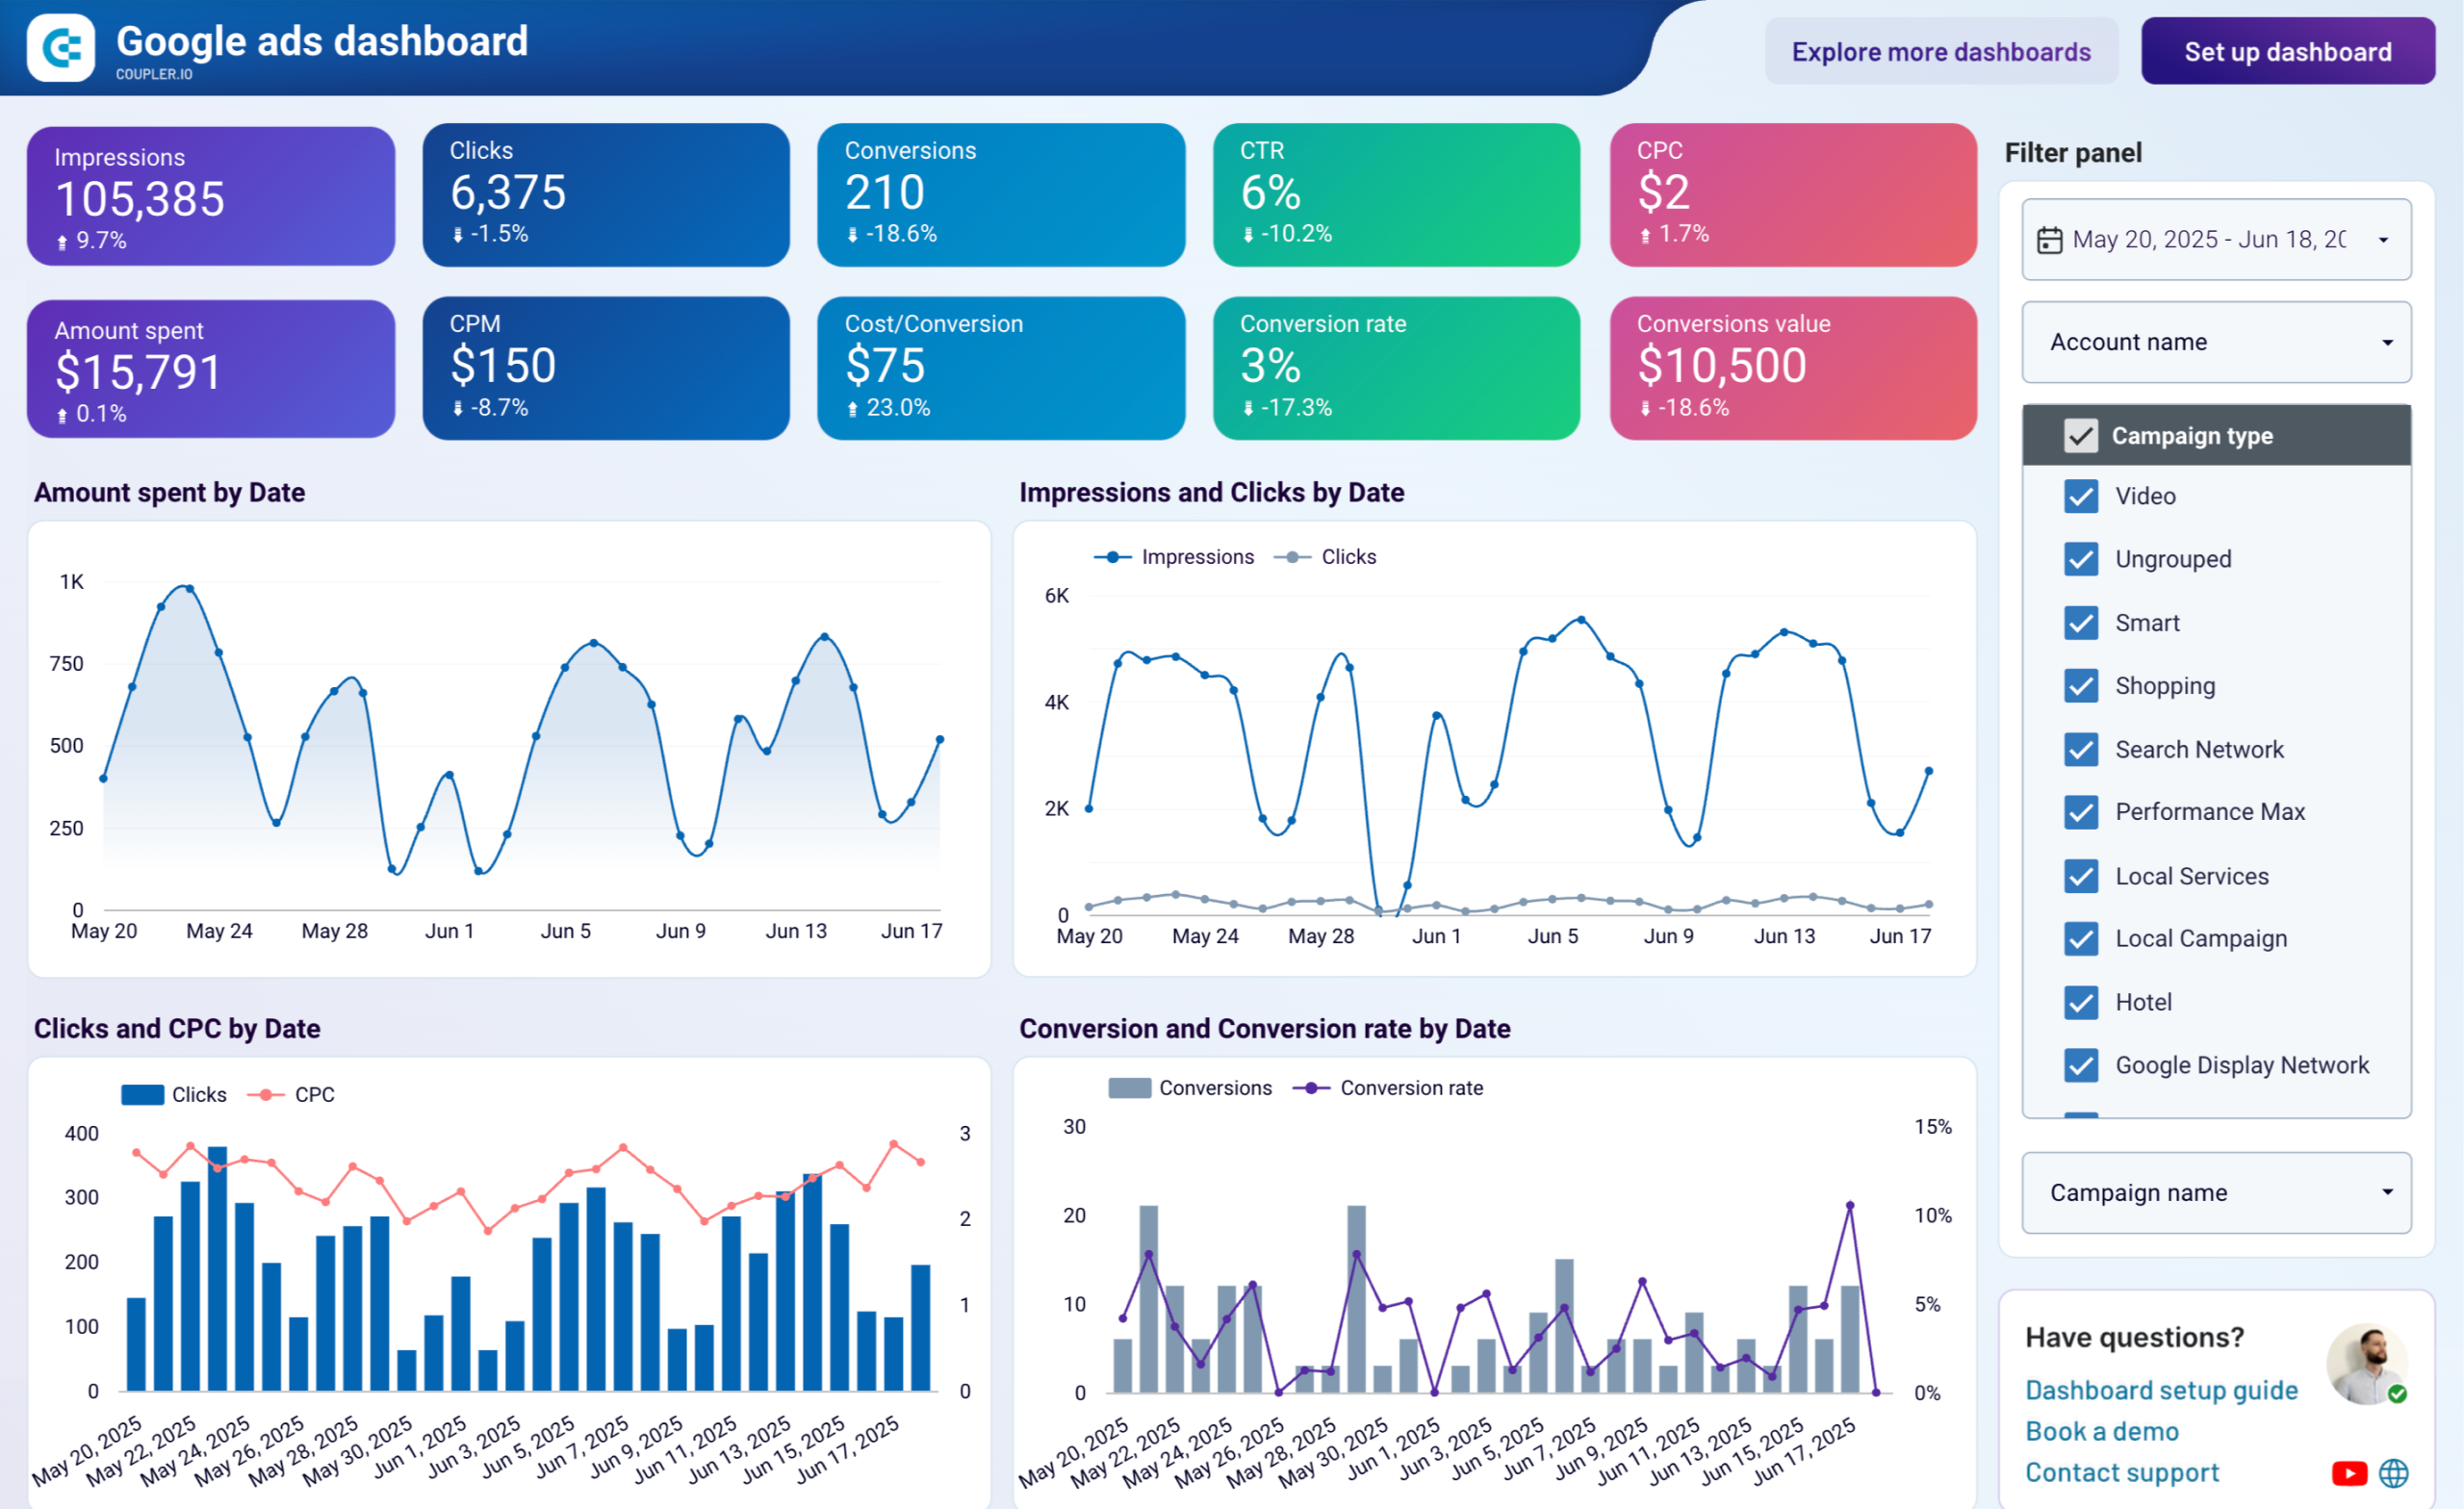
You should choose this dashboard out of other Google Ads Looker Studio templates to segment and analyze your campaigns based on various dimensions, ad groups, campaigns, and time. This level of granularity provides valuable insights into the performance of different elements within your campaigns, helping you identify areas for improvement.
Dashboard metrics:
- Impressions
- Clicks
- CTR
- Average Cost-per-Click
- Conversions
- Cost per conversion
- Cost per thousand impressions (CPM)
- And others
#3. Google Ads leads dashboard by Coupler.io
This dashboard centralizes lead generation performance data from Google Ads into a single Looker Studio report. It tracks essential metrics like cost per lead, lead value, and conversion rates across all your campaigns, helping you identify which campaigns deliver the highest-quality leads and best return on your advertising investment.
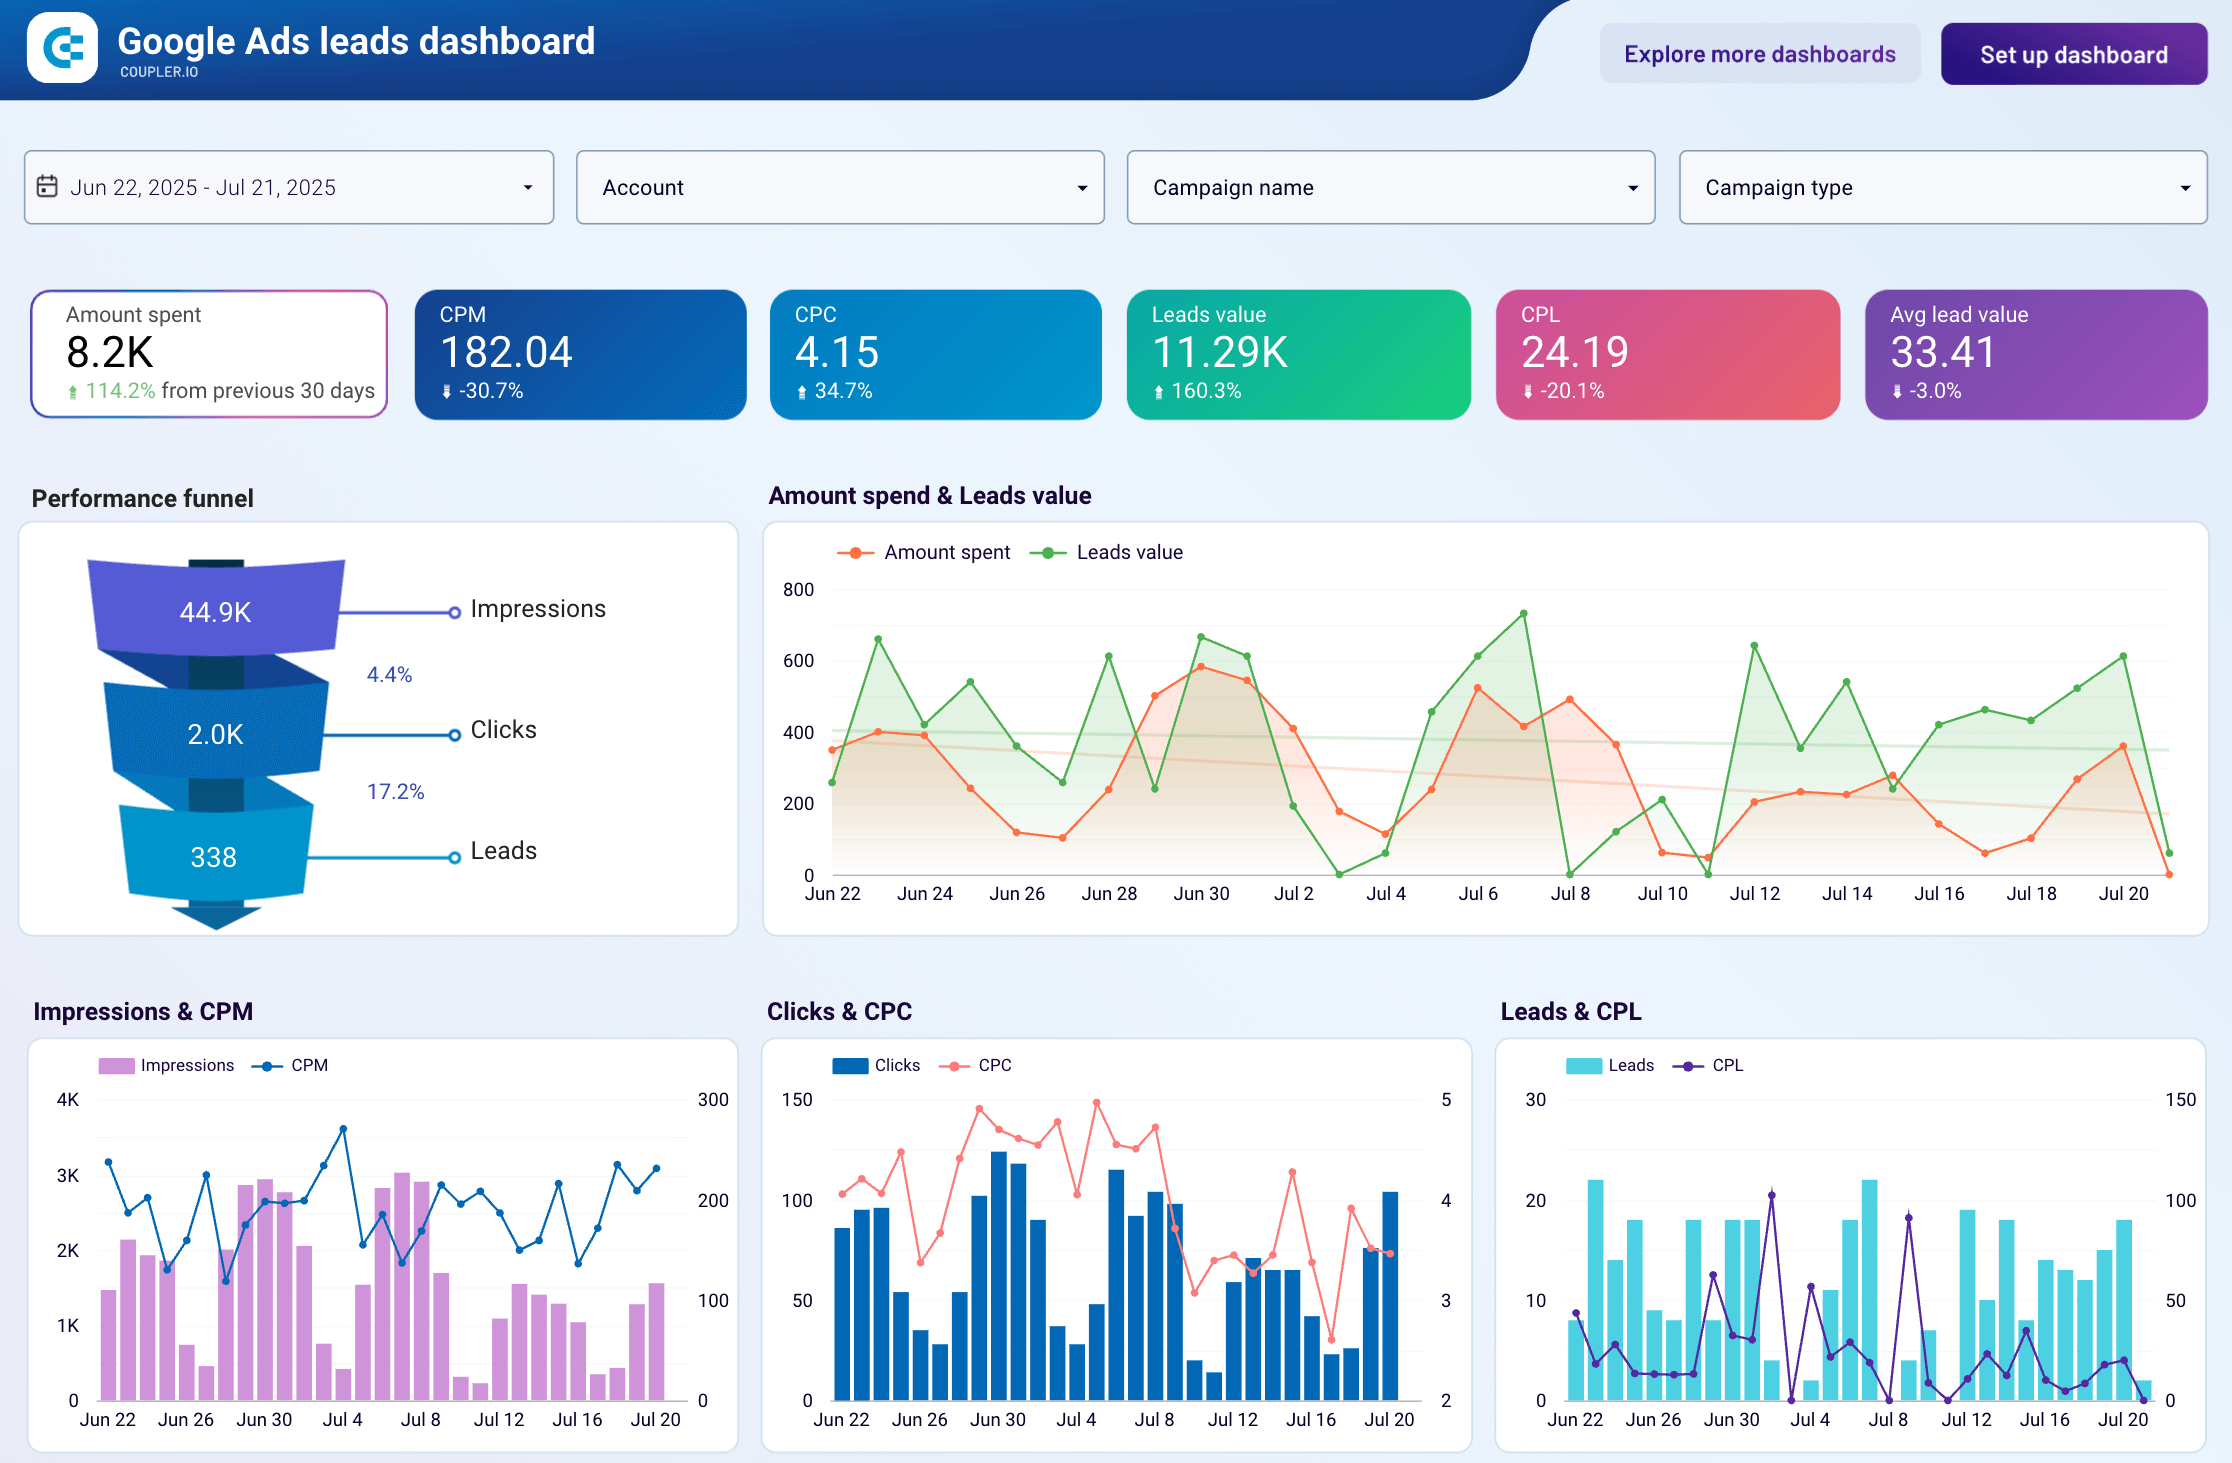
The template can be populated with your data in just a few clicks. Simply sign up for a free Coupler.io account, load your data with the built-in connector, and start using the dashboard right away.
Dashboard metrics:
- Amount spent
- Impressions
- Clicks
- CPM
- CPC
- Leads
- Leads value
- Avg. leads value
- Conversions
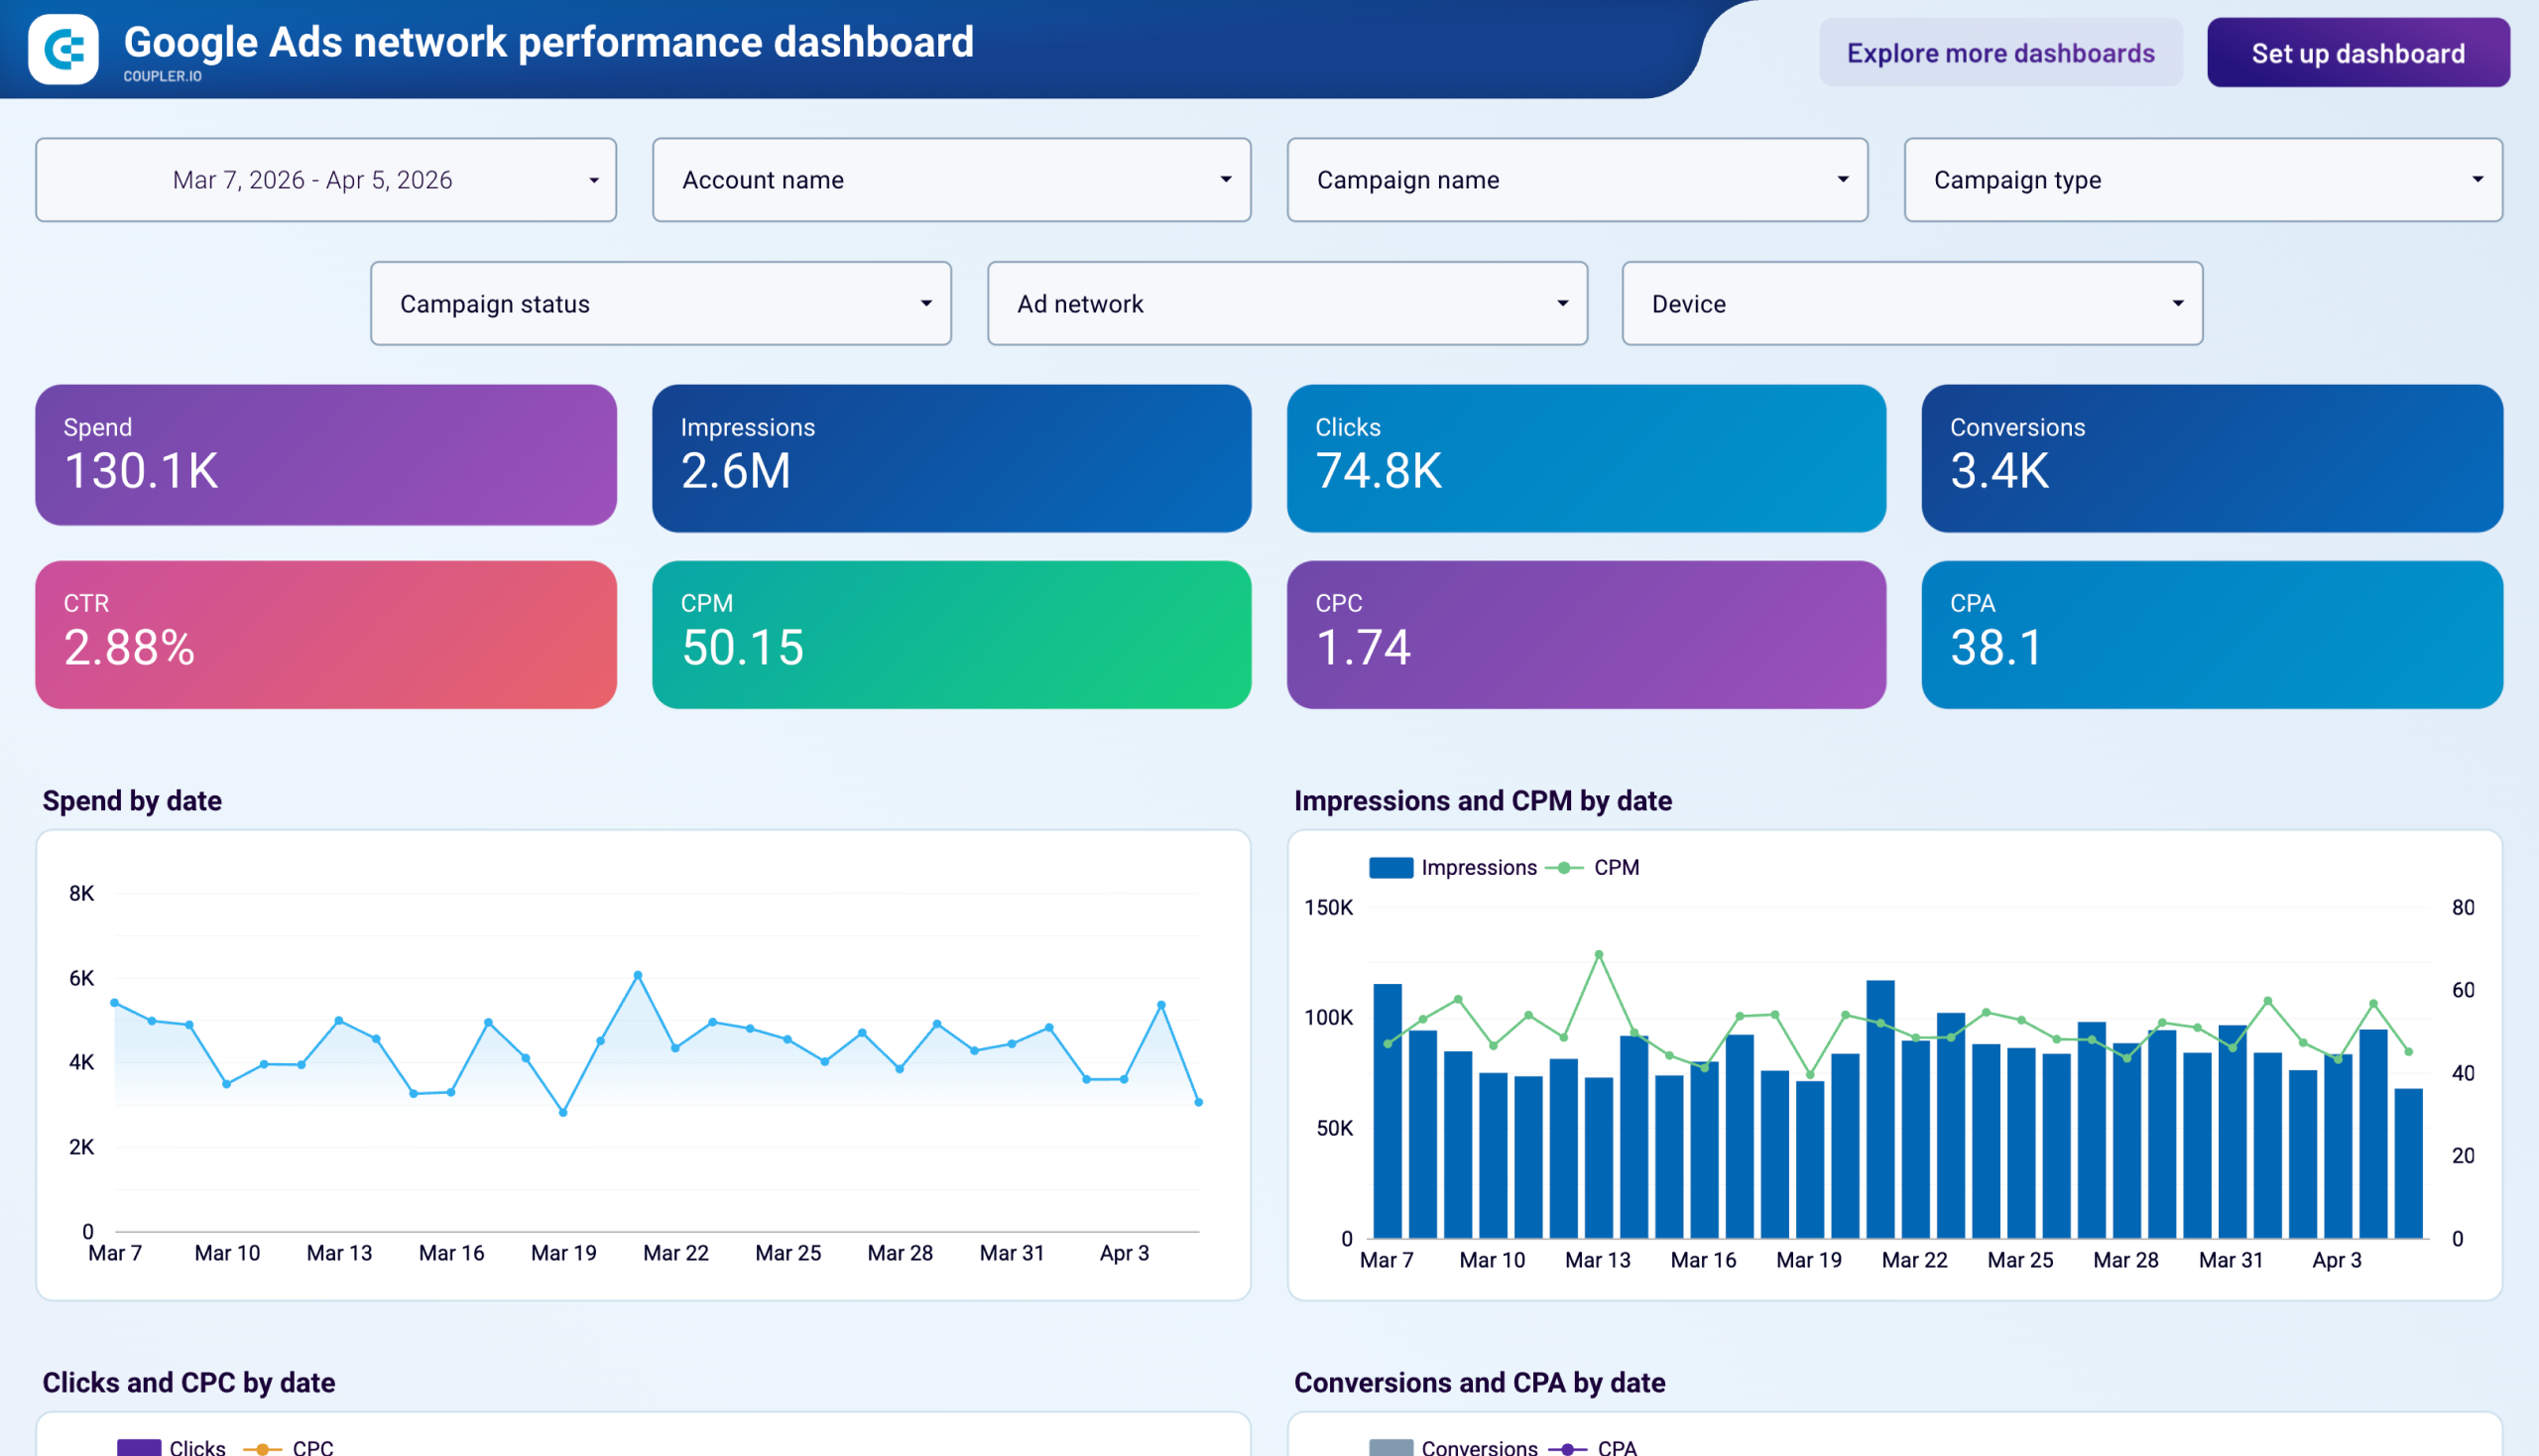
#4. Google Ads network performance dashboard by Coupler.io
The Google Ads dashboard above gives you a campaign-level view. This one goes a layer deeper and breaks down performance by ad network. As a result, you can see whether your Search CPA holds up on Display, YouTube, and Search Partners. Or whether certain networks are quietly consuming budget at two or three times the cost.
Google Ads network performance dashboard
 Preview dashboard
Google Ads network performance dashboard
Preview dashboardThe dashboard spans five pages.
- The overview tracks spend, impressions, clicks, and conversions over time with campaign and device breakdowns.
- The Impression share page tells you how often your ads appear and whether you’re losing visibility due to budget caps or rank.
- Conversions breakdown lets you filter by conversion action to isolate high-value goals from softer engagement events.
- Two additional pages cover video creative performance (with quartile completion rates) and Performance Max asset ratings, so you can retire underperforming assets before they drag down ad group quality.
Dashboard metrics:
- Spend
- Impressions
- Clicks
- Conversions
- CTR
- CPM
- CPC
- CPA
- Impression share (search top, absolute top)
- Search lost IS (budget) and Search lost IS (rank)
- Video views and quartile completion rates (25%, 50%, 75%, 100%)
- PMax asset performance ratings
#5. Facebook Ads dashboard by Coupler.io
Running advertising campaigns on Google is good, but it’s even better to cover another channel – Facebook. For analysis of your ad campaign performance, Coupler.io prepared a Facebook Ads dashboard. It should help you better understand the efficiency of your campaigns and track essential metrics.
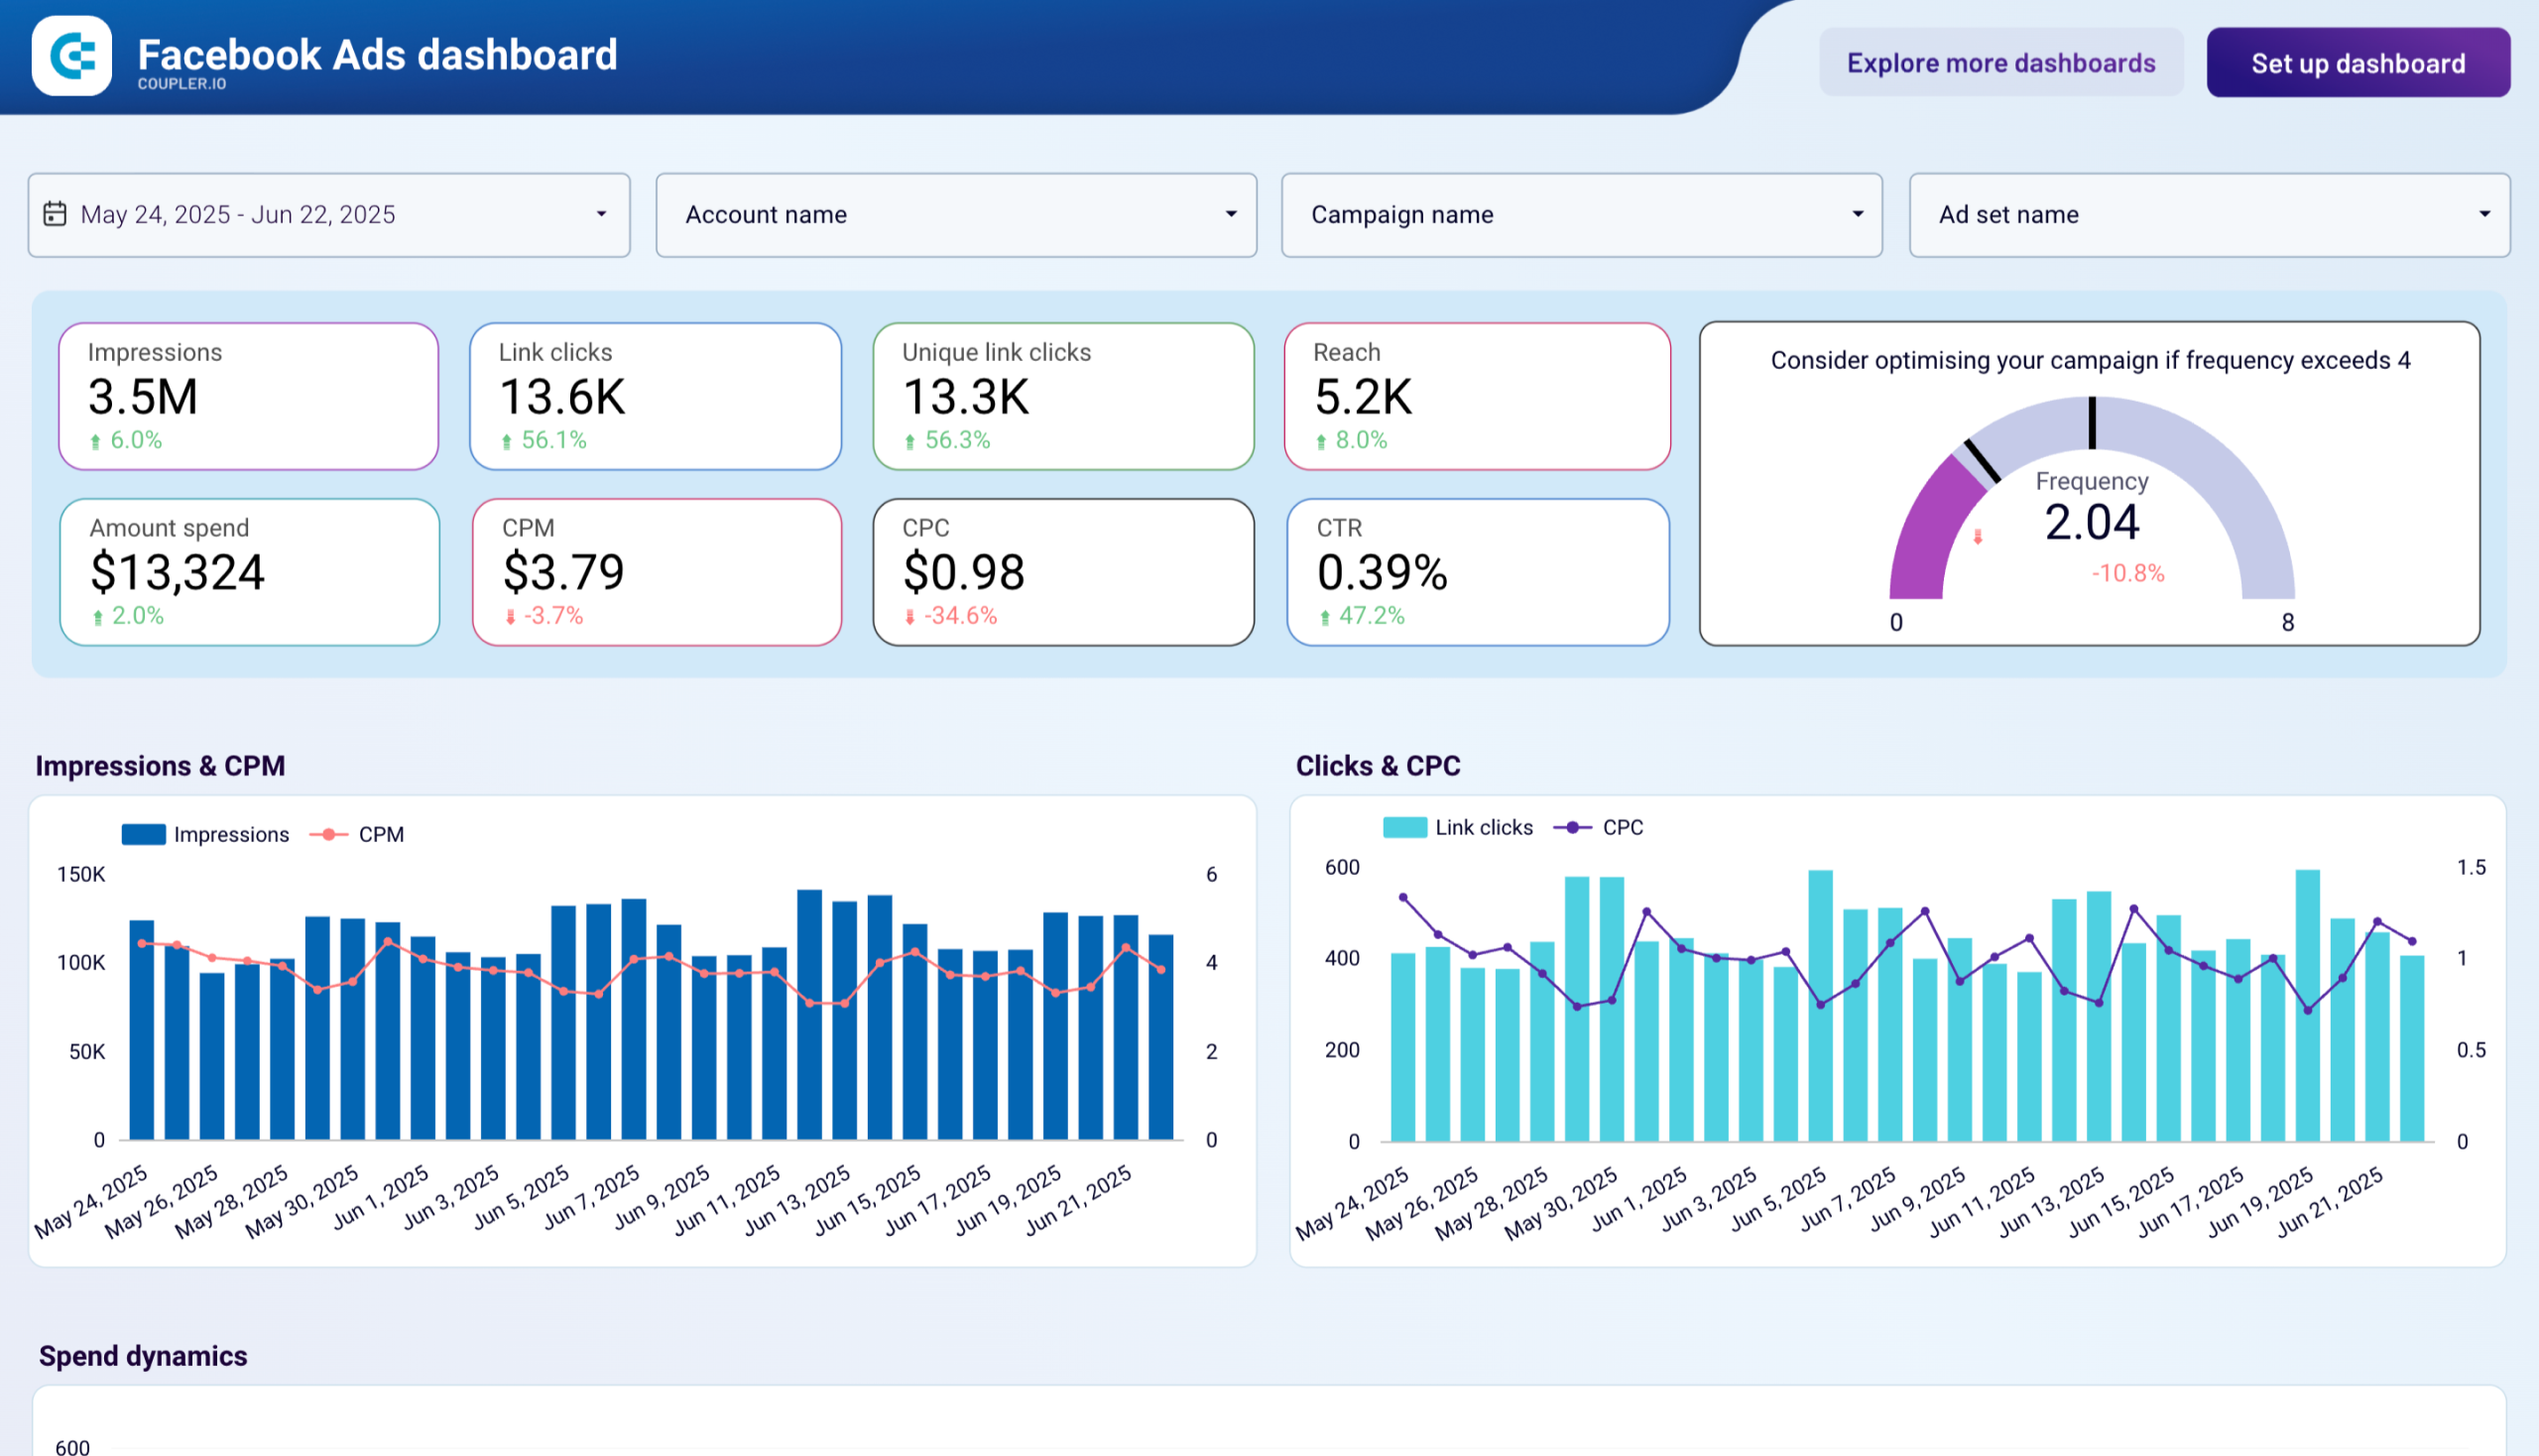
The dashboard is easily connected to your Facebook Ads account, so you won’t have to manually export and import the data. With a few clicks, the latest information is loaded to Looker Studio, and your report is populated with records.
Dashboard metrics:
- Impressions
- Link clicks
- CPM
- CPC
- CTR
- Frequency
- Reach
- Amount spend
- Unique link clicks
Check out other Looker Studio Facebook Ads templates and ready-to-go dashboards for other advertising platforms by Coupler.io.
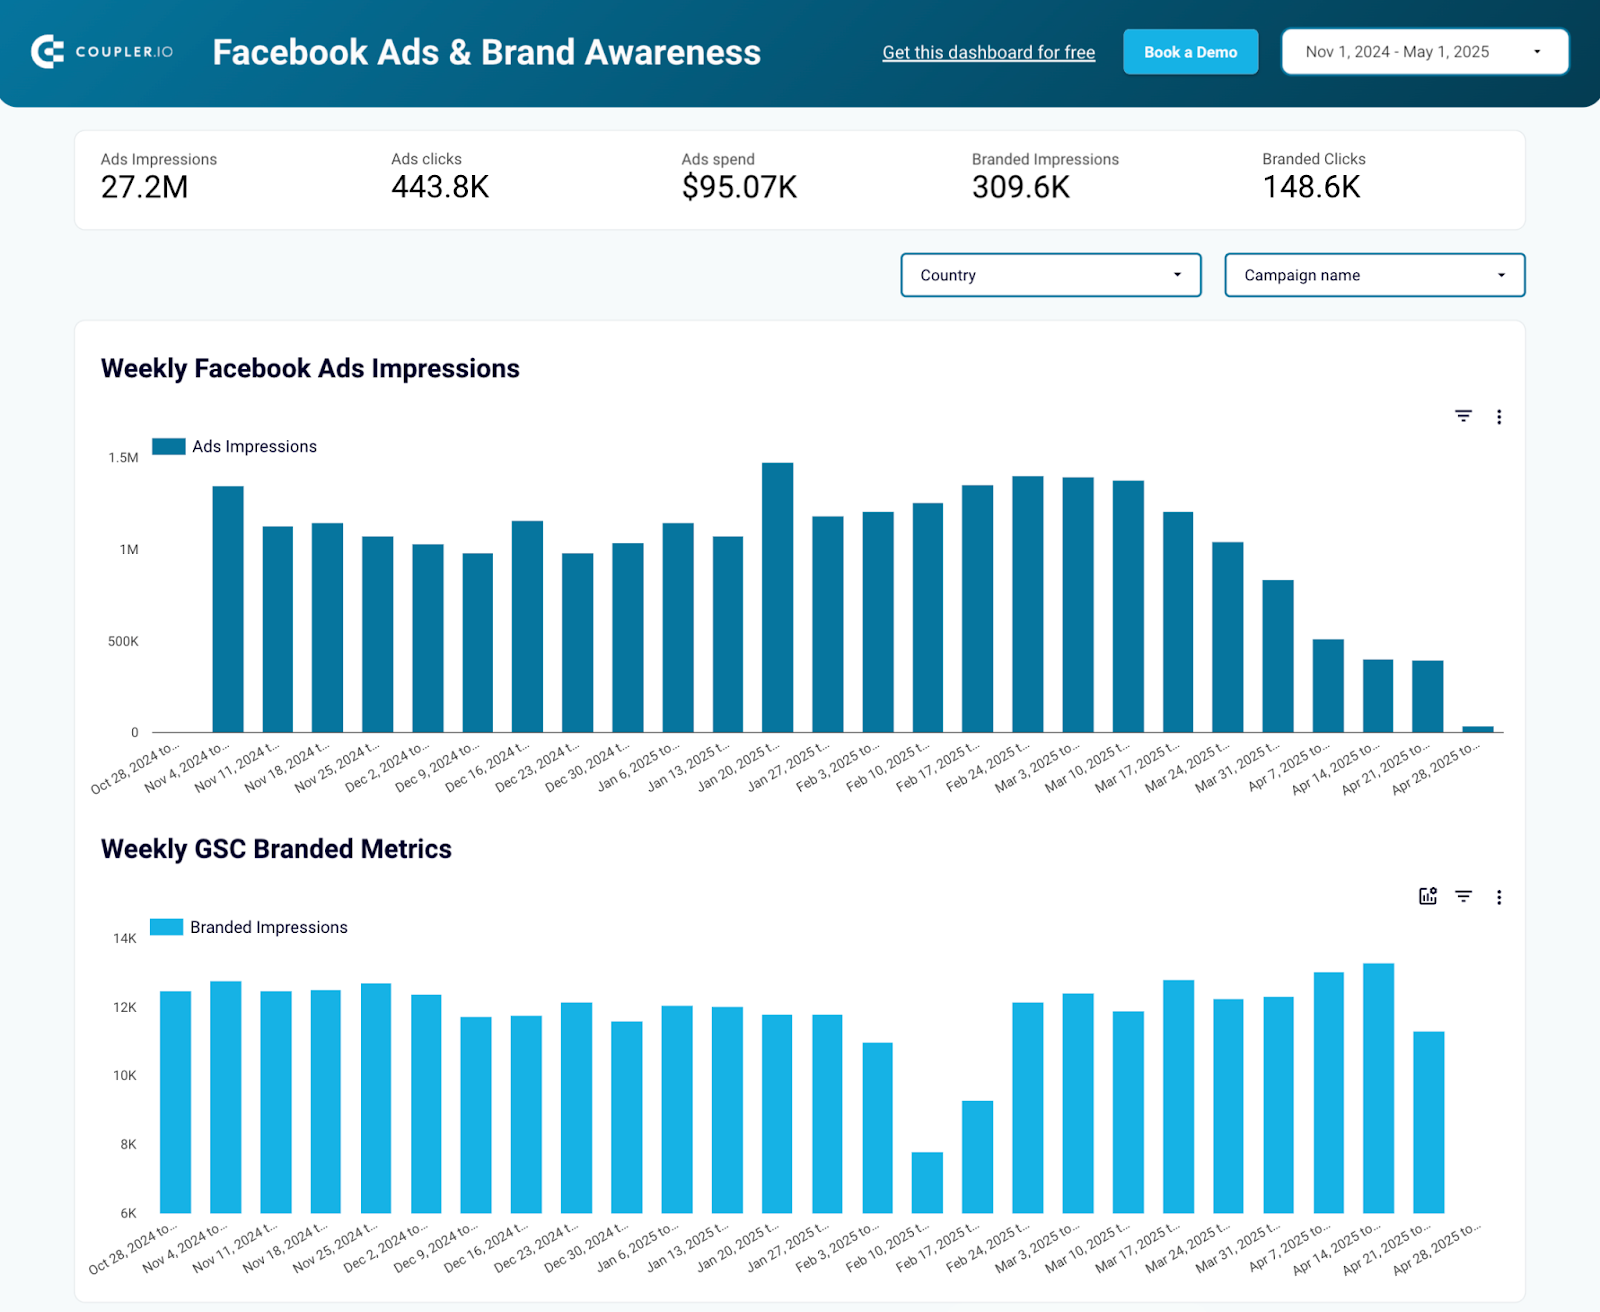
#6. Facebook Ads & Brand Awareness dashboard by Coupler.io
If you run Facebook Ads campaigns to increase brand awareness, this dashboard must be in your toolbox. It lets you monitor the relationship between your ad impressions and branded keyword searches.
Facebook Ads & Brand Awareness dashboard
 Preview dashboard
Facebook Ads & Brand Awareness dashboard
Preview dashboardThe dashboard collects data from Facebook Ads and Google Search Console using the built-in Looker Studio connector by Coupler.io. As a result, you can easily track the impact of all your campaigns or filter by specific ones.
This template provides a quick summary of important metrics, including impressions, ad clicks, branded clicks, and more.
Dashboard metrics:
- Impressions
- Ads clicks
- Ads spend
- Branded impressions
- Branded clicks
#7. LinkedIn Ads dashboard by Coupler.io
LinkedIn Ads dashboard will be a perfect match for your reports on Facebook and Google advertising campaigns. With all these templates at hand, you’ll be able to monitor your marketing activities throughout these PPC channels.
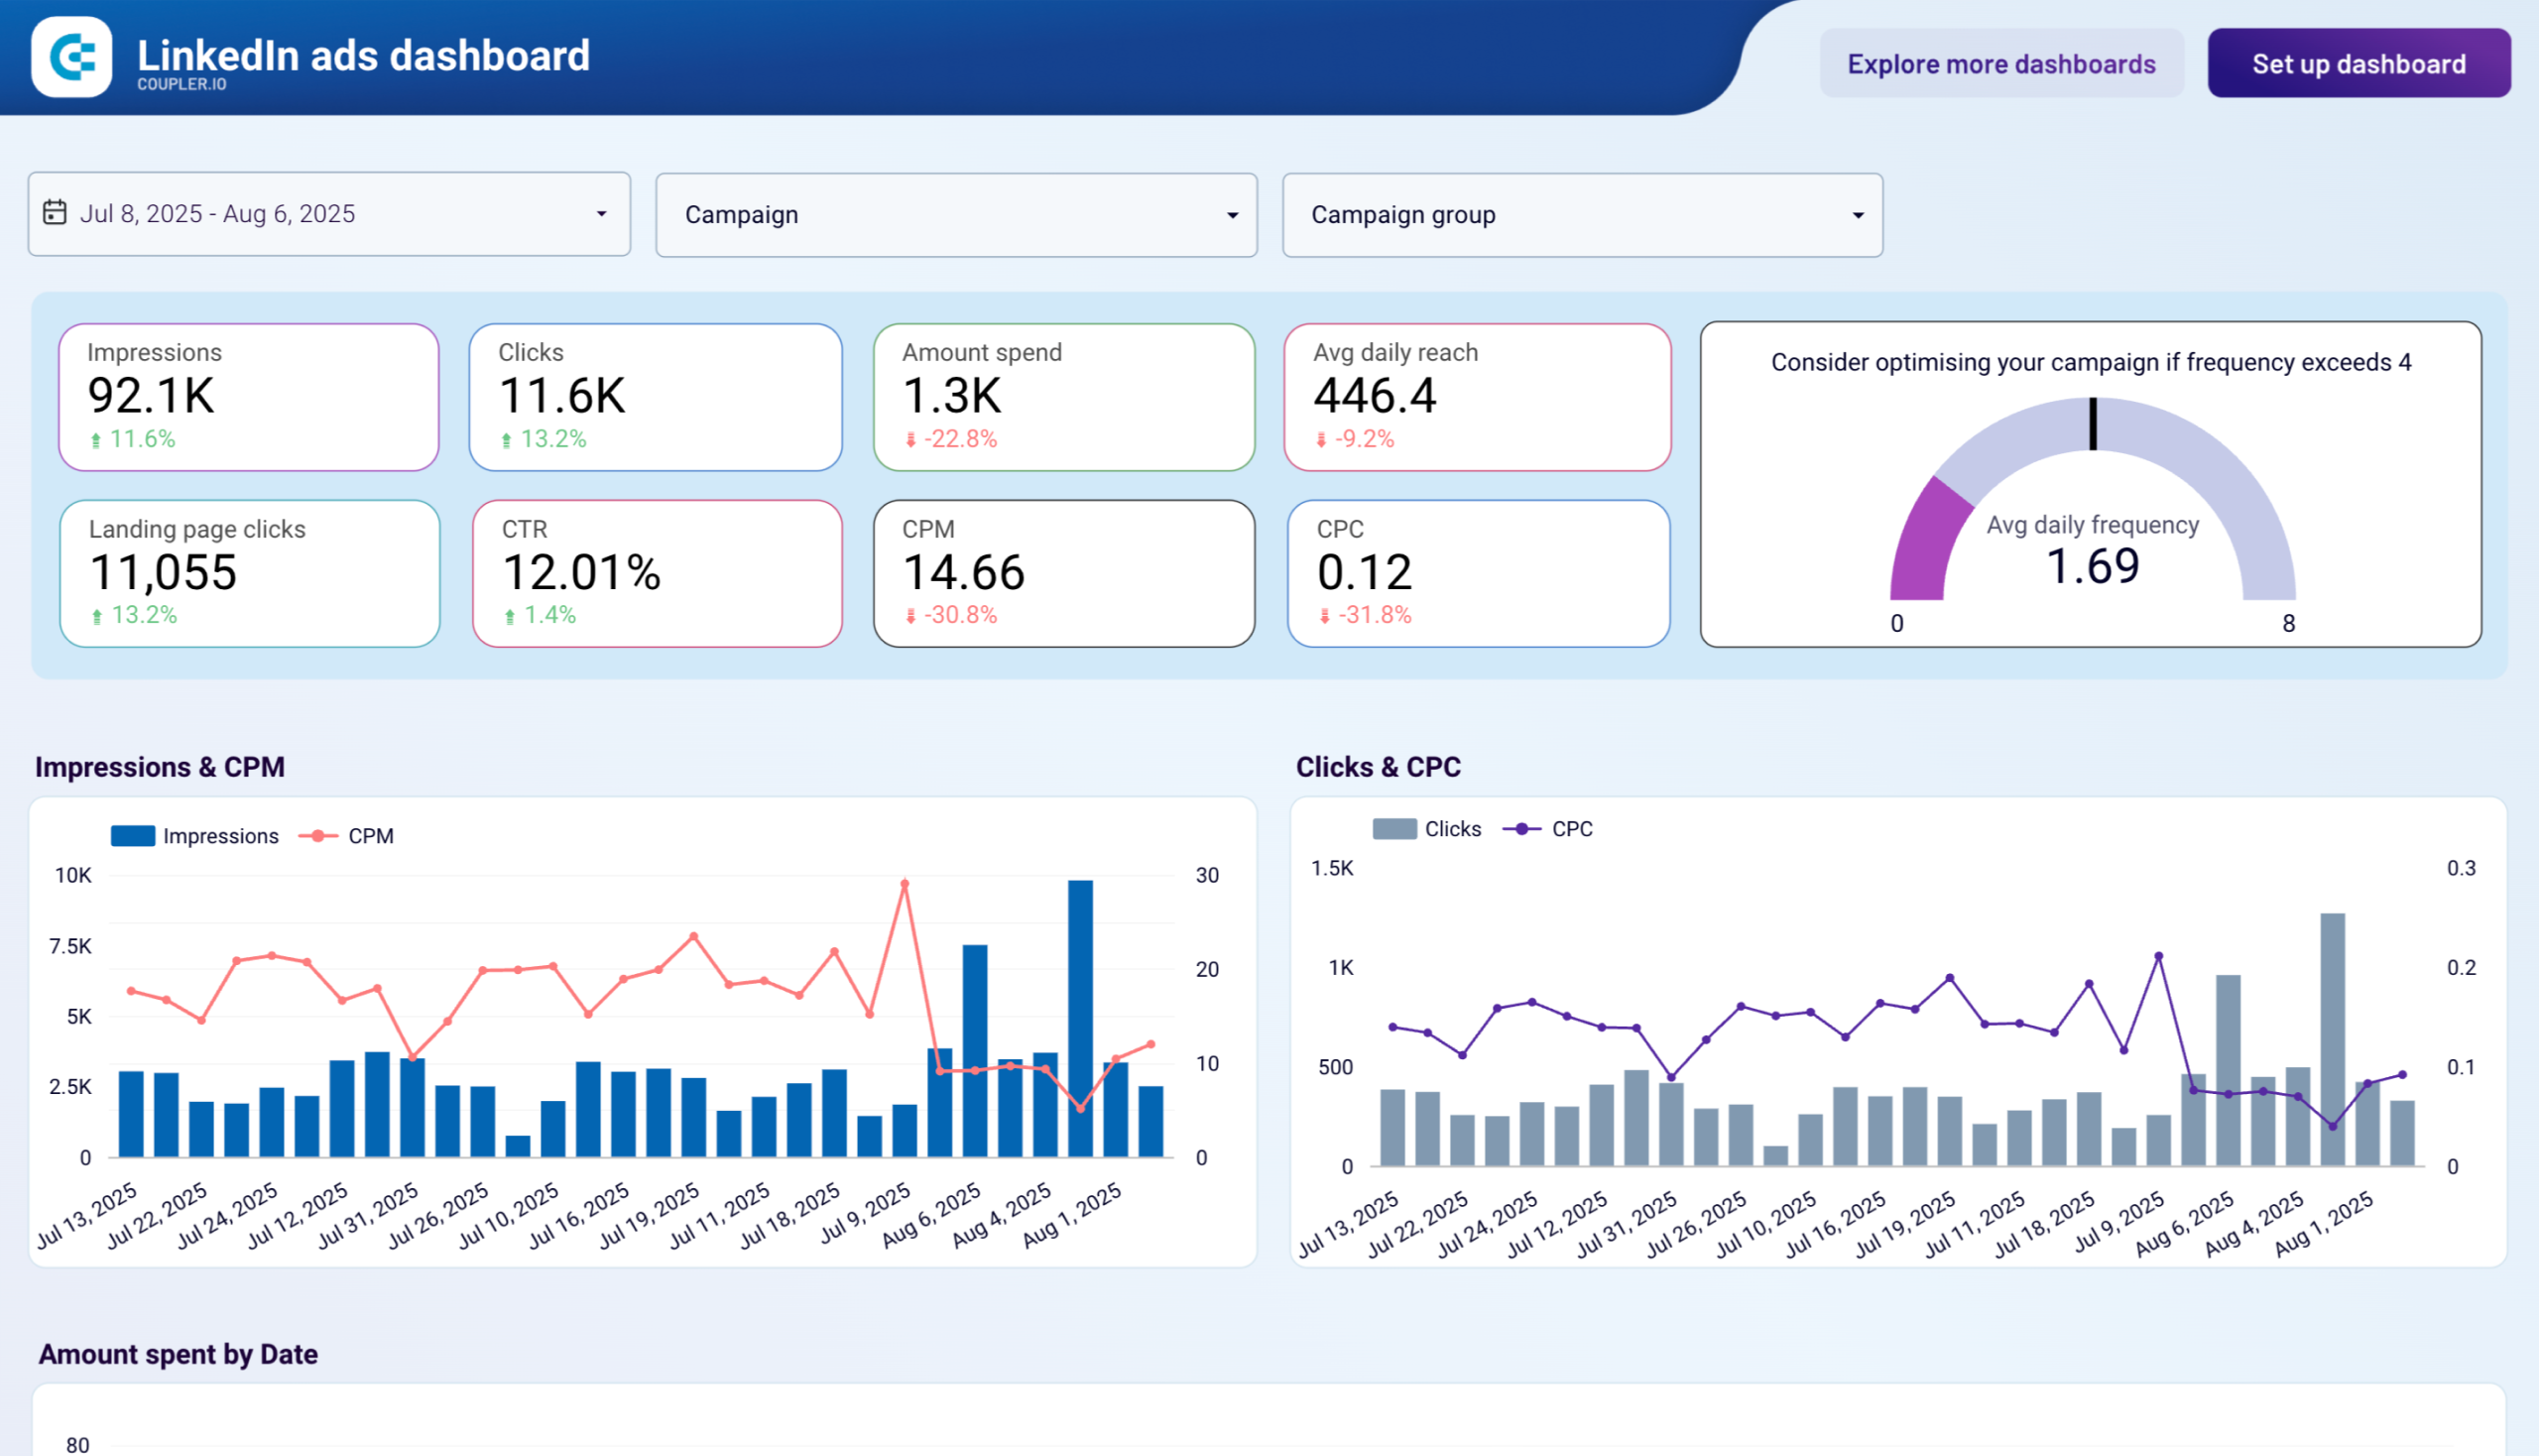
To connect this Looker Studio dashboard template to your LinkedIn Ads account, you only need to make a few clicks. No technical knowledge or any coding is required. The process is fast and guided by the wizard with detailed instructions. You will enjoy your LinkedIn Ads analytics on this interactive report.
Dashboard metrics:
- Impressions
- CPM
- Amount spend
- Clicks
- CPC
- CTR
- Conversions
- Conversion rate
- Lead form opens
- Leads
- And others
#8. LinkedIn Ads leads dashboard by Coupler.io
This dashboard displays advertising metrics (leads, cost per lead, CPC, etc.) and correlations to reveal how your B2B lead gen campaigns perform on LinkedIn. You can visualize the conversion path from impressions to leads, monitor daily spending patterns, and discover which LinkedIn targeting strategies produce the most cost-effective results for your sales pipeline.
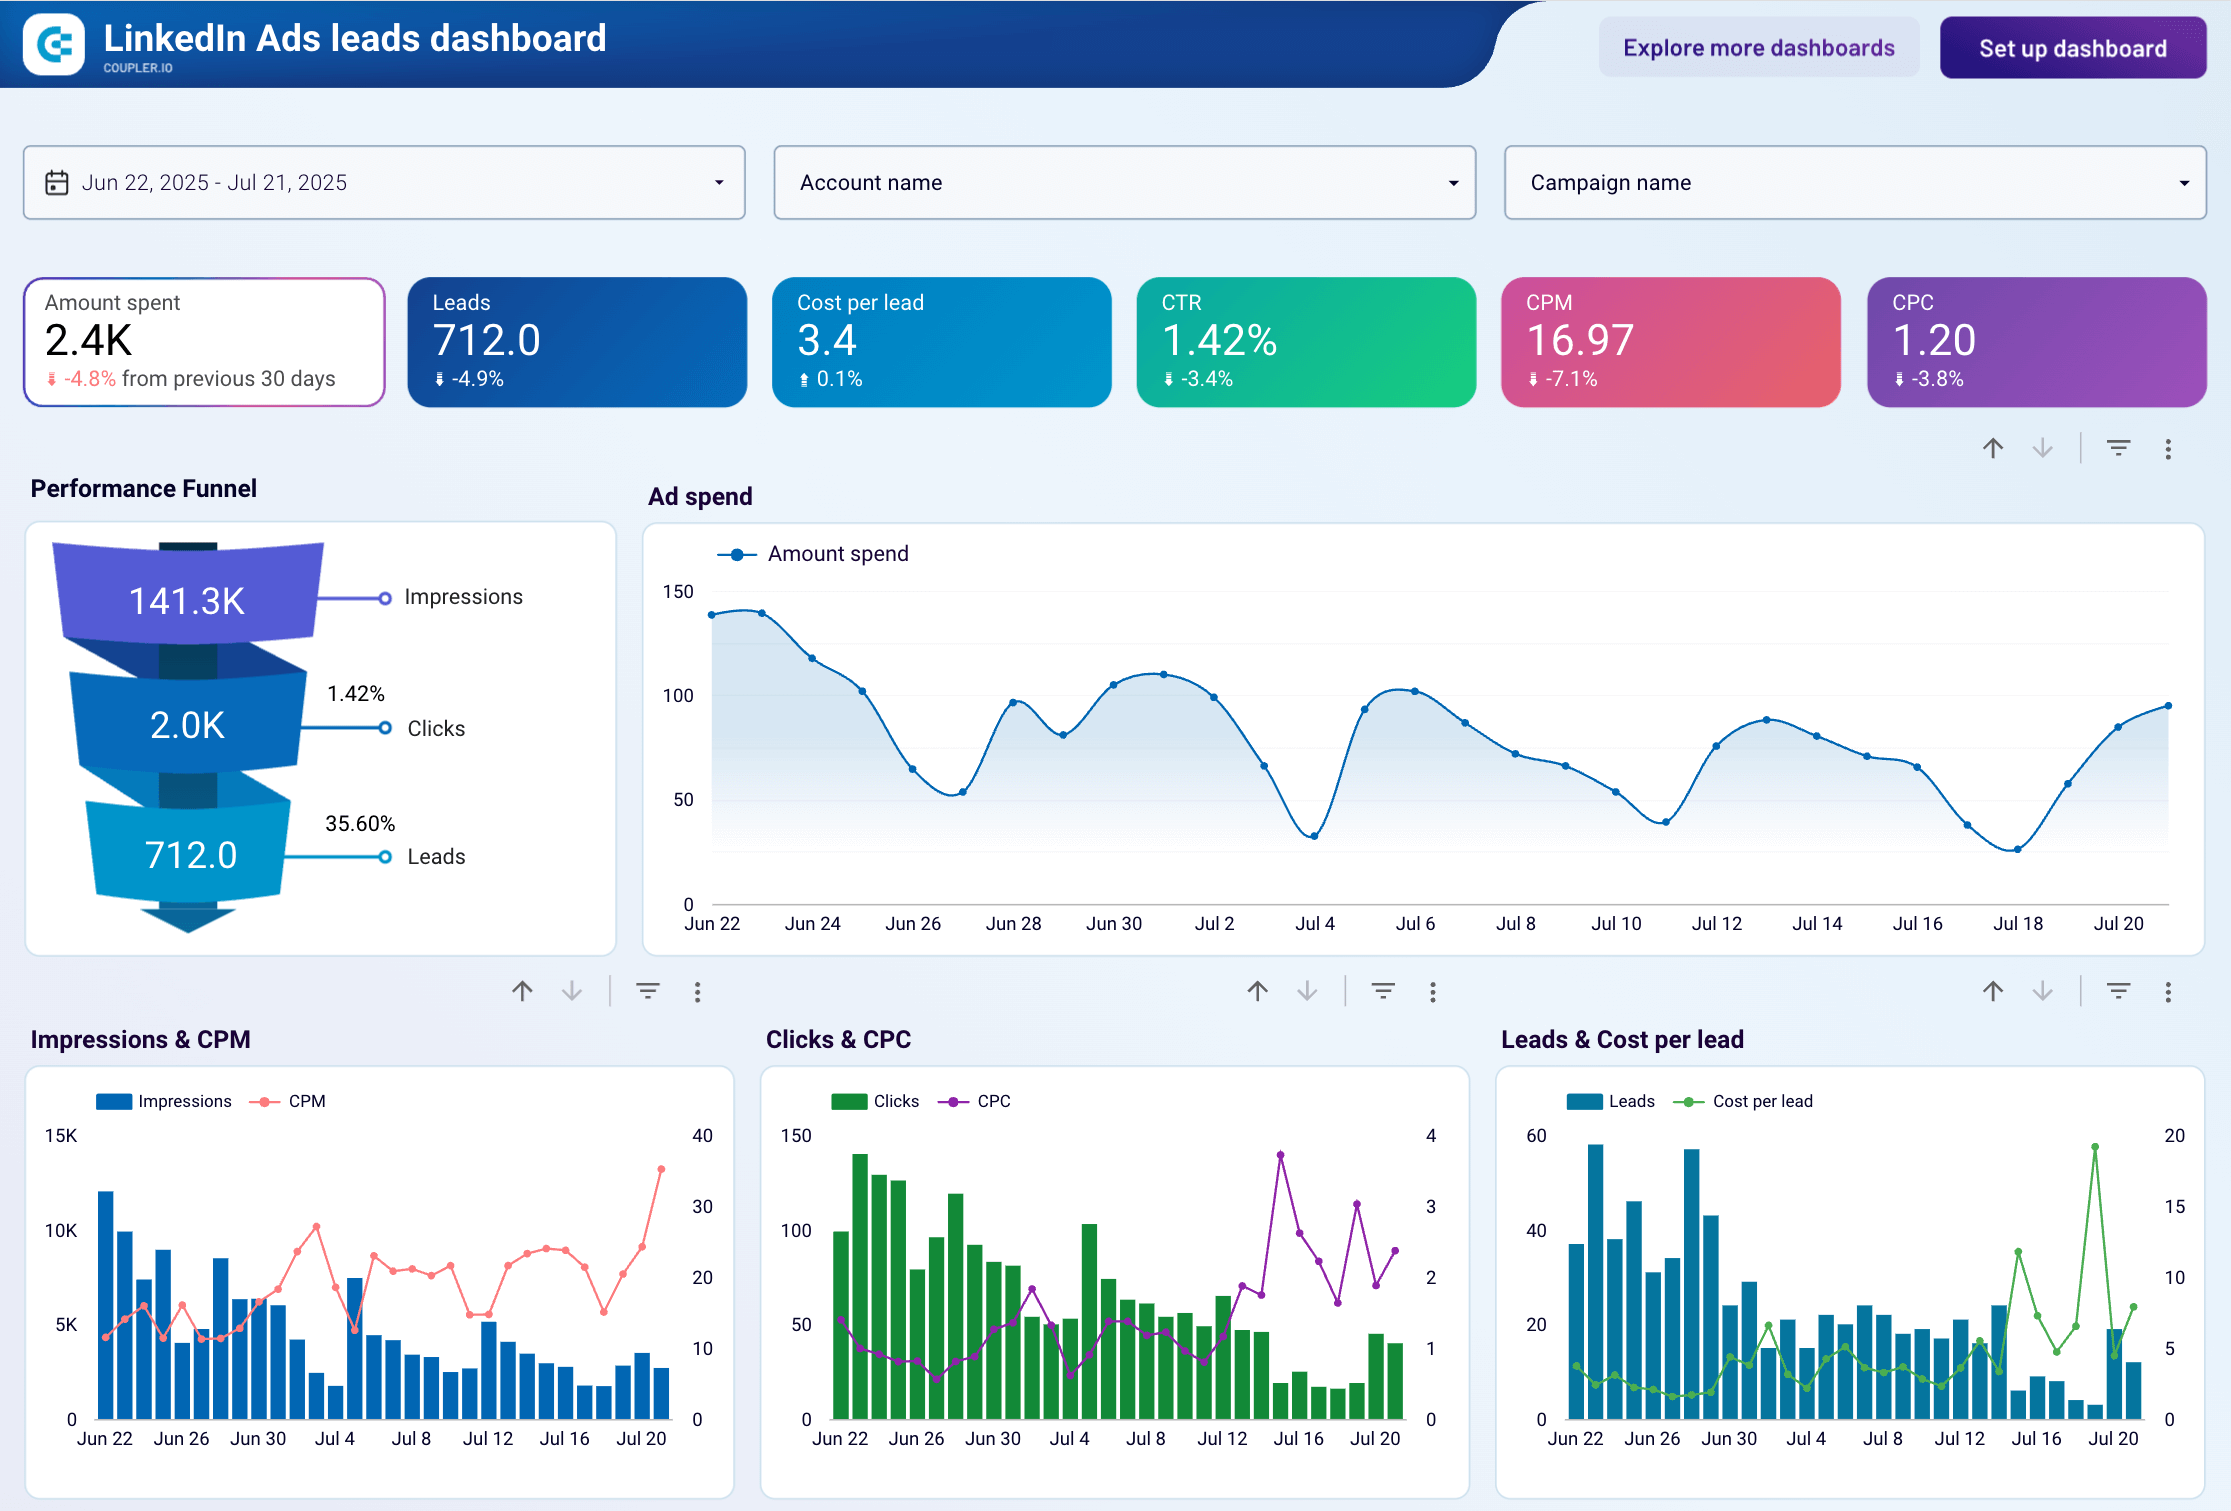
To get a free copy of this template and connect your LinkedIn data to Looker Studio, sign up for Coupler.io. It takes less than 5 minutes to complete the process and start using the dashboard.
Dashboard metrics:
- Amount spent
- Impressions
- Clicks
- CTR
- Leads
- Cost per lead
- CPM
- Clicks to leads
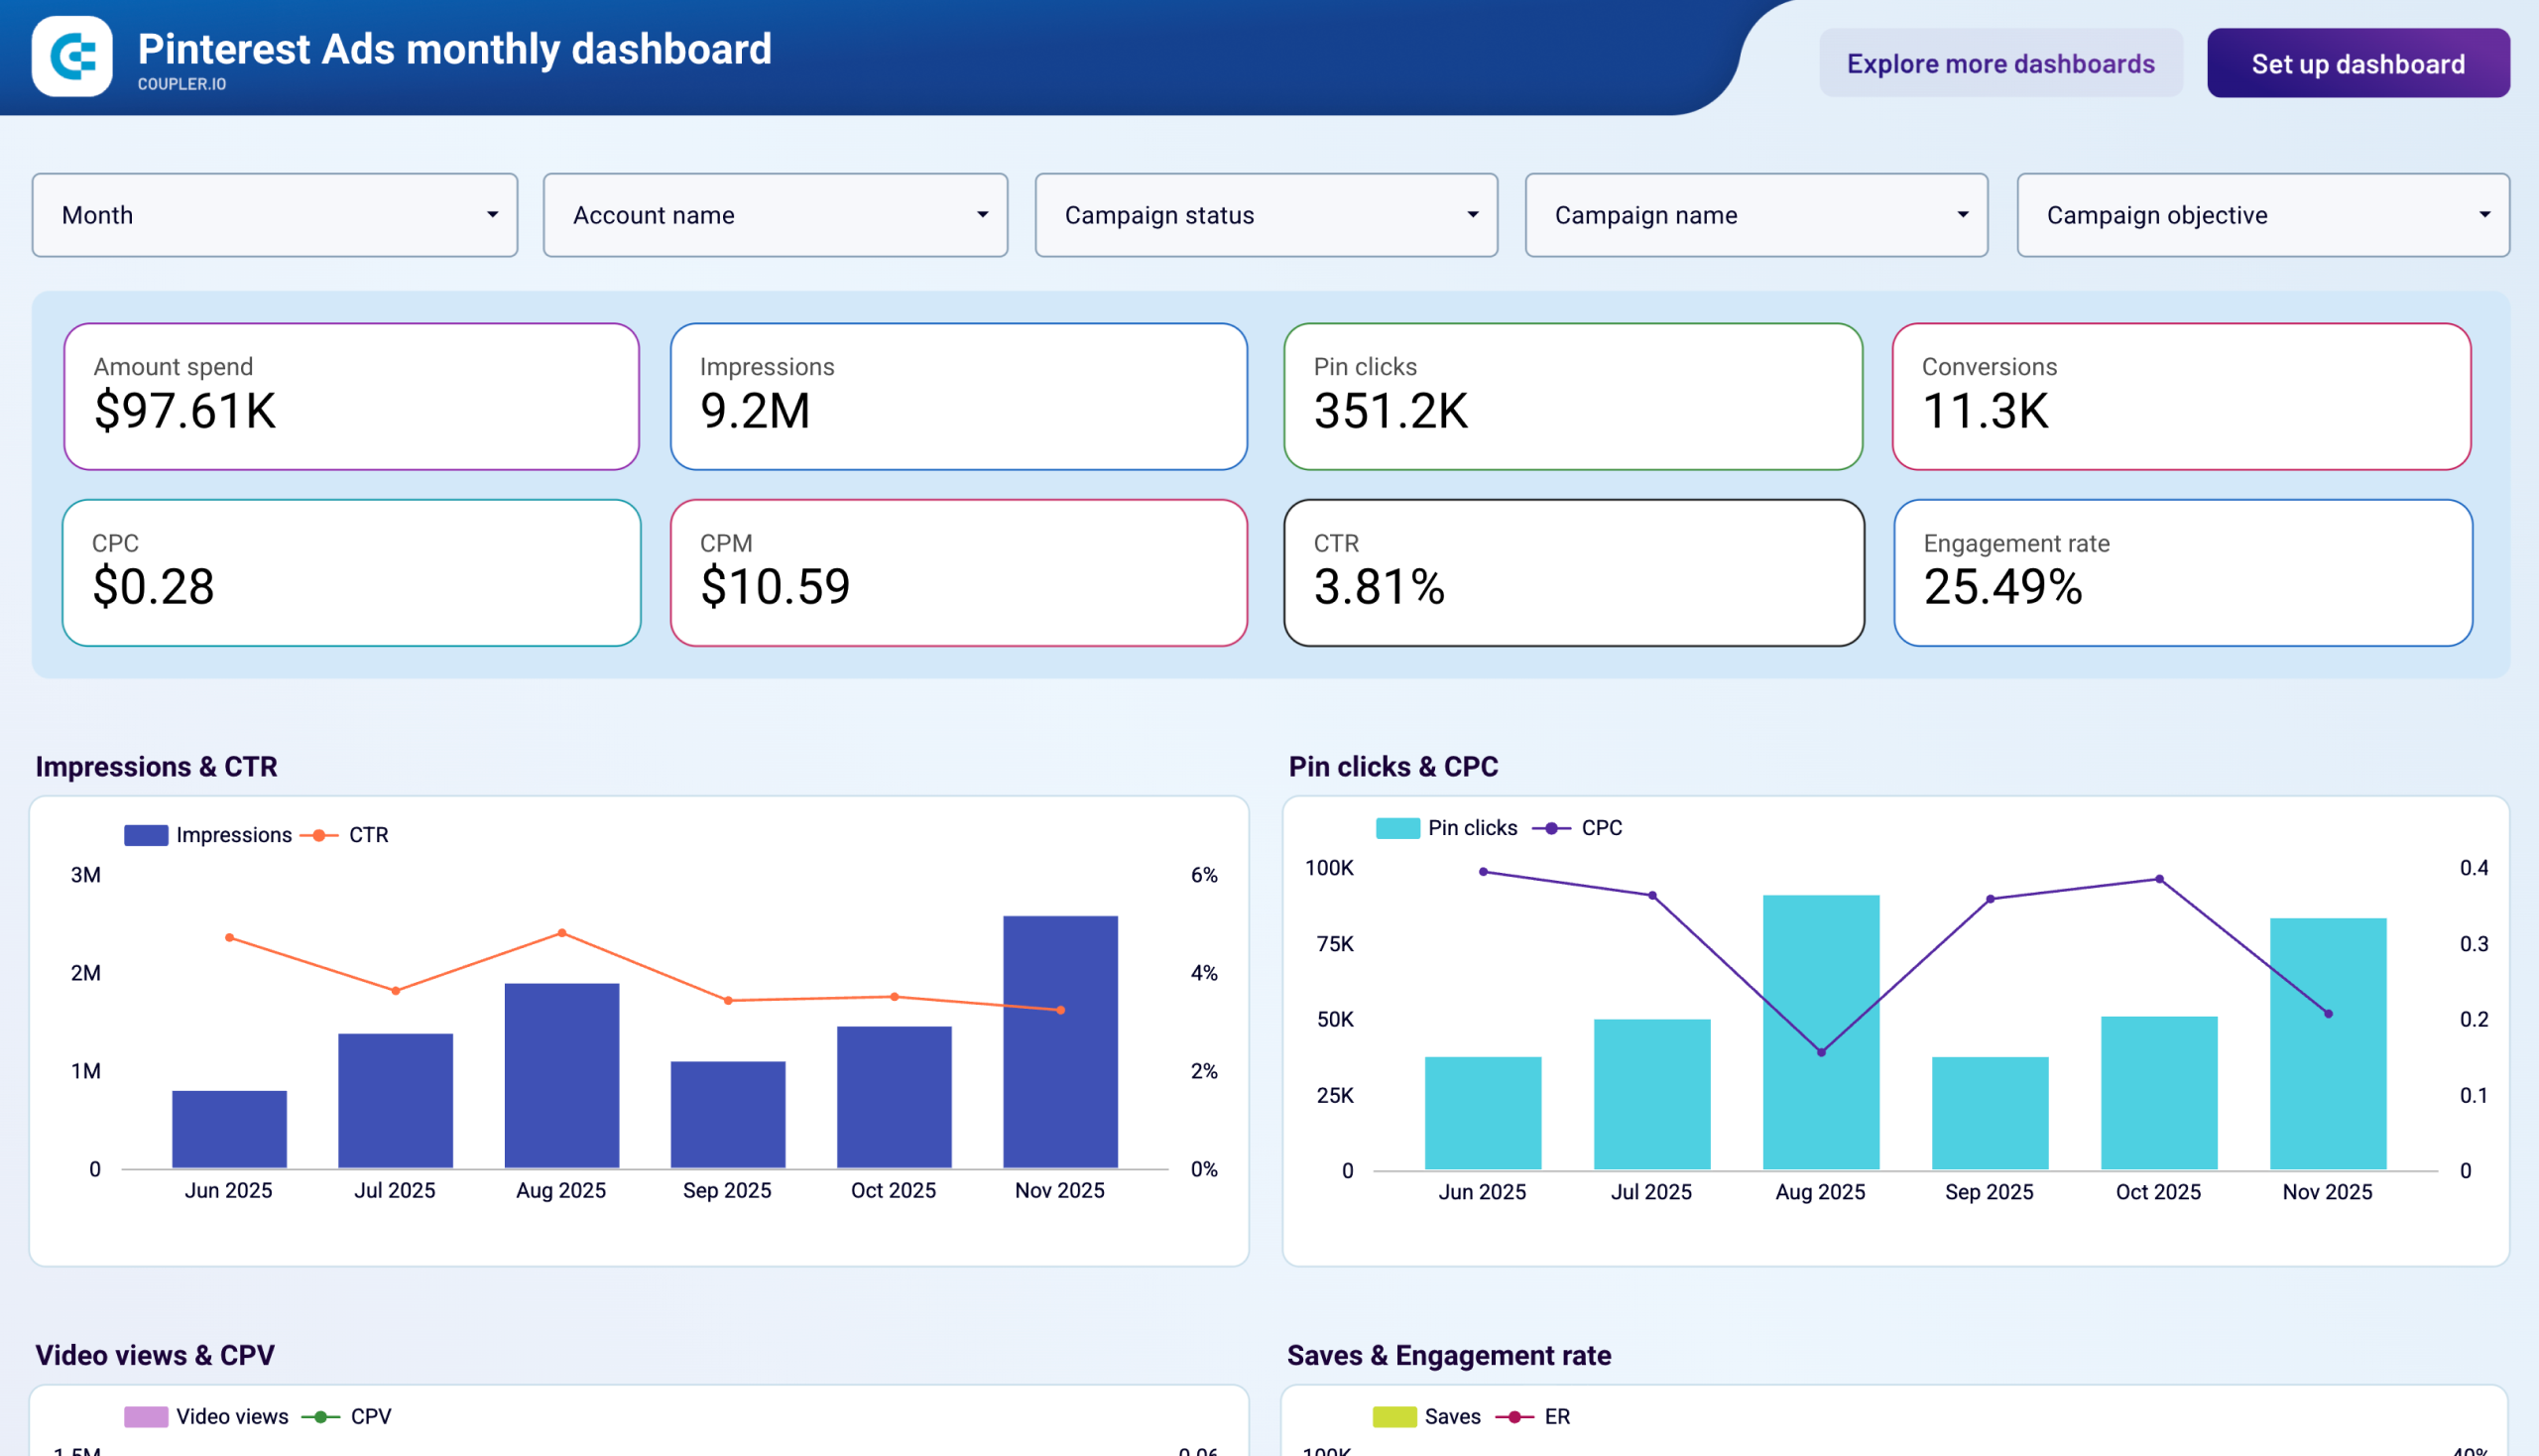
#9. Pinterest Ads dashboard + Pinterest Ads monthly dashboard by Coupler.io
This dashboard helps you identify which visual content and campaign strategies deliver the best return on your Pinterest advertising investment. It consolidates performance data from Pinterest’s visual discovery platform and reveals how your pins drive engagement, clicks, and conversions across different creative approaches.
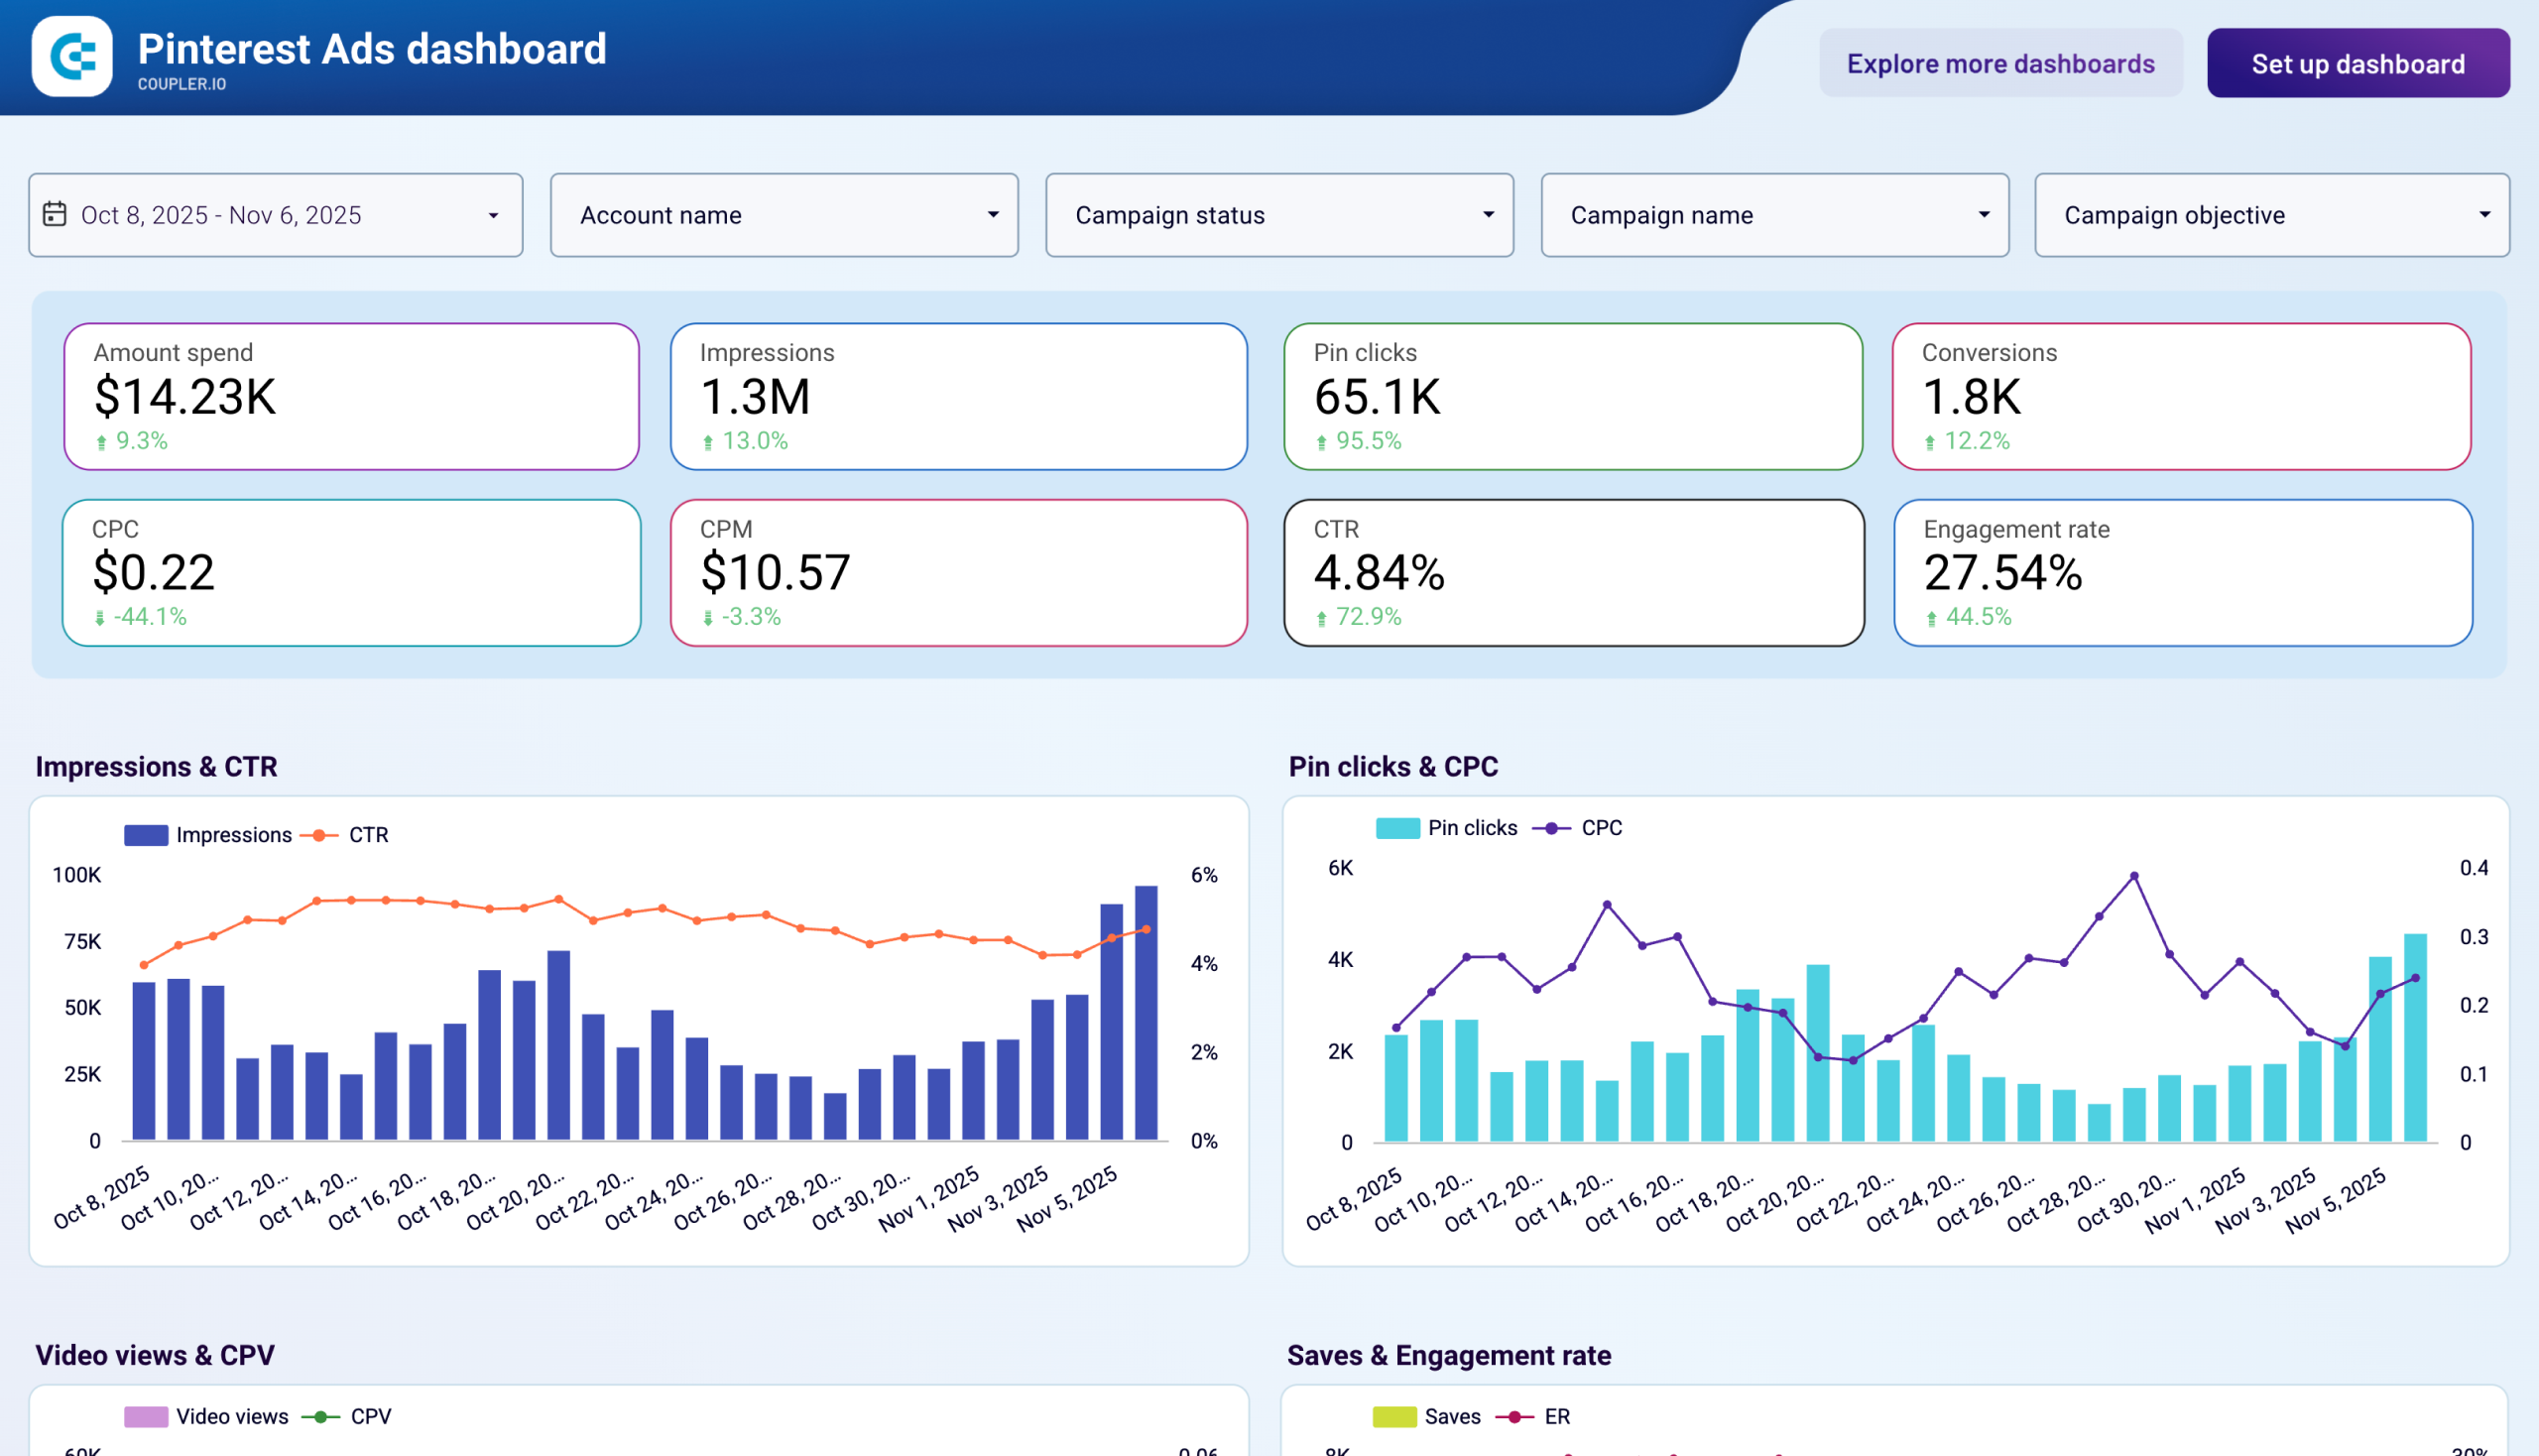
The dashboard connects directly to your Pinterest Ads account through the built-in Coupler.io connector, automatically refreshing your data without manual exports. You can monitor daily campaign performance, compare cost efficiency across different content formats, and identify which pins generate the most valuable user actions.
The detailed campaign performance table provides complete metrics for each campaign. You can see which campaigns generate the highest click volumes at the lowest costs, analyze save-to-conversion patterns, and determine which creative strategies deserve increased budget allocation.
Dashboard metrics:
- Amount spent
- Impressions, CPM
- Pin clicks, CPC, CTR
- Outbound clicks, CPOC (cost per outbound click)
- Video views, CPV
- Saves and engagement rate
- Conversions
- Campaign performance rankings
For long-term planning, the Pinterest Ads monthly dashboard by Coupler.io complements the daily view. It aggregates performance data across months to reveal seasonal patterns in user behavior. Use both dashboards together to handle tactical campaign adjustments (daily) and strategic budget allocation (monthly).


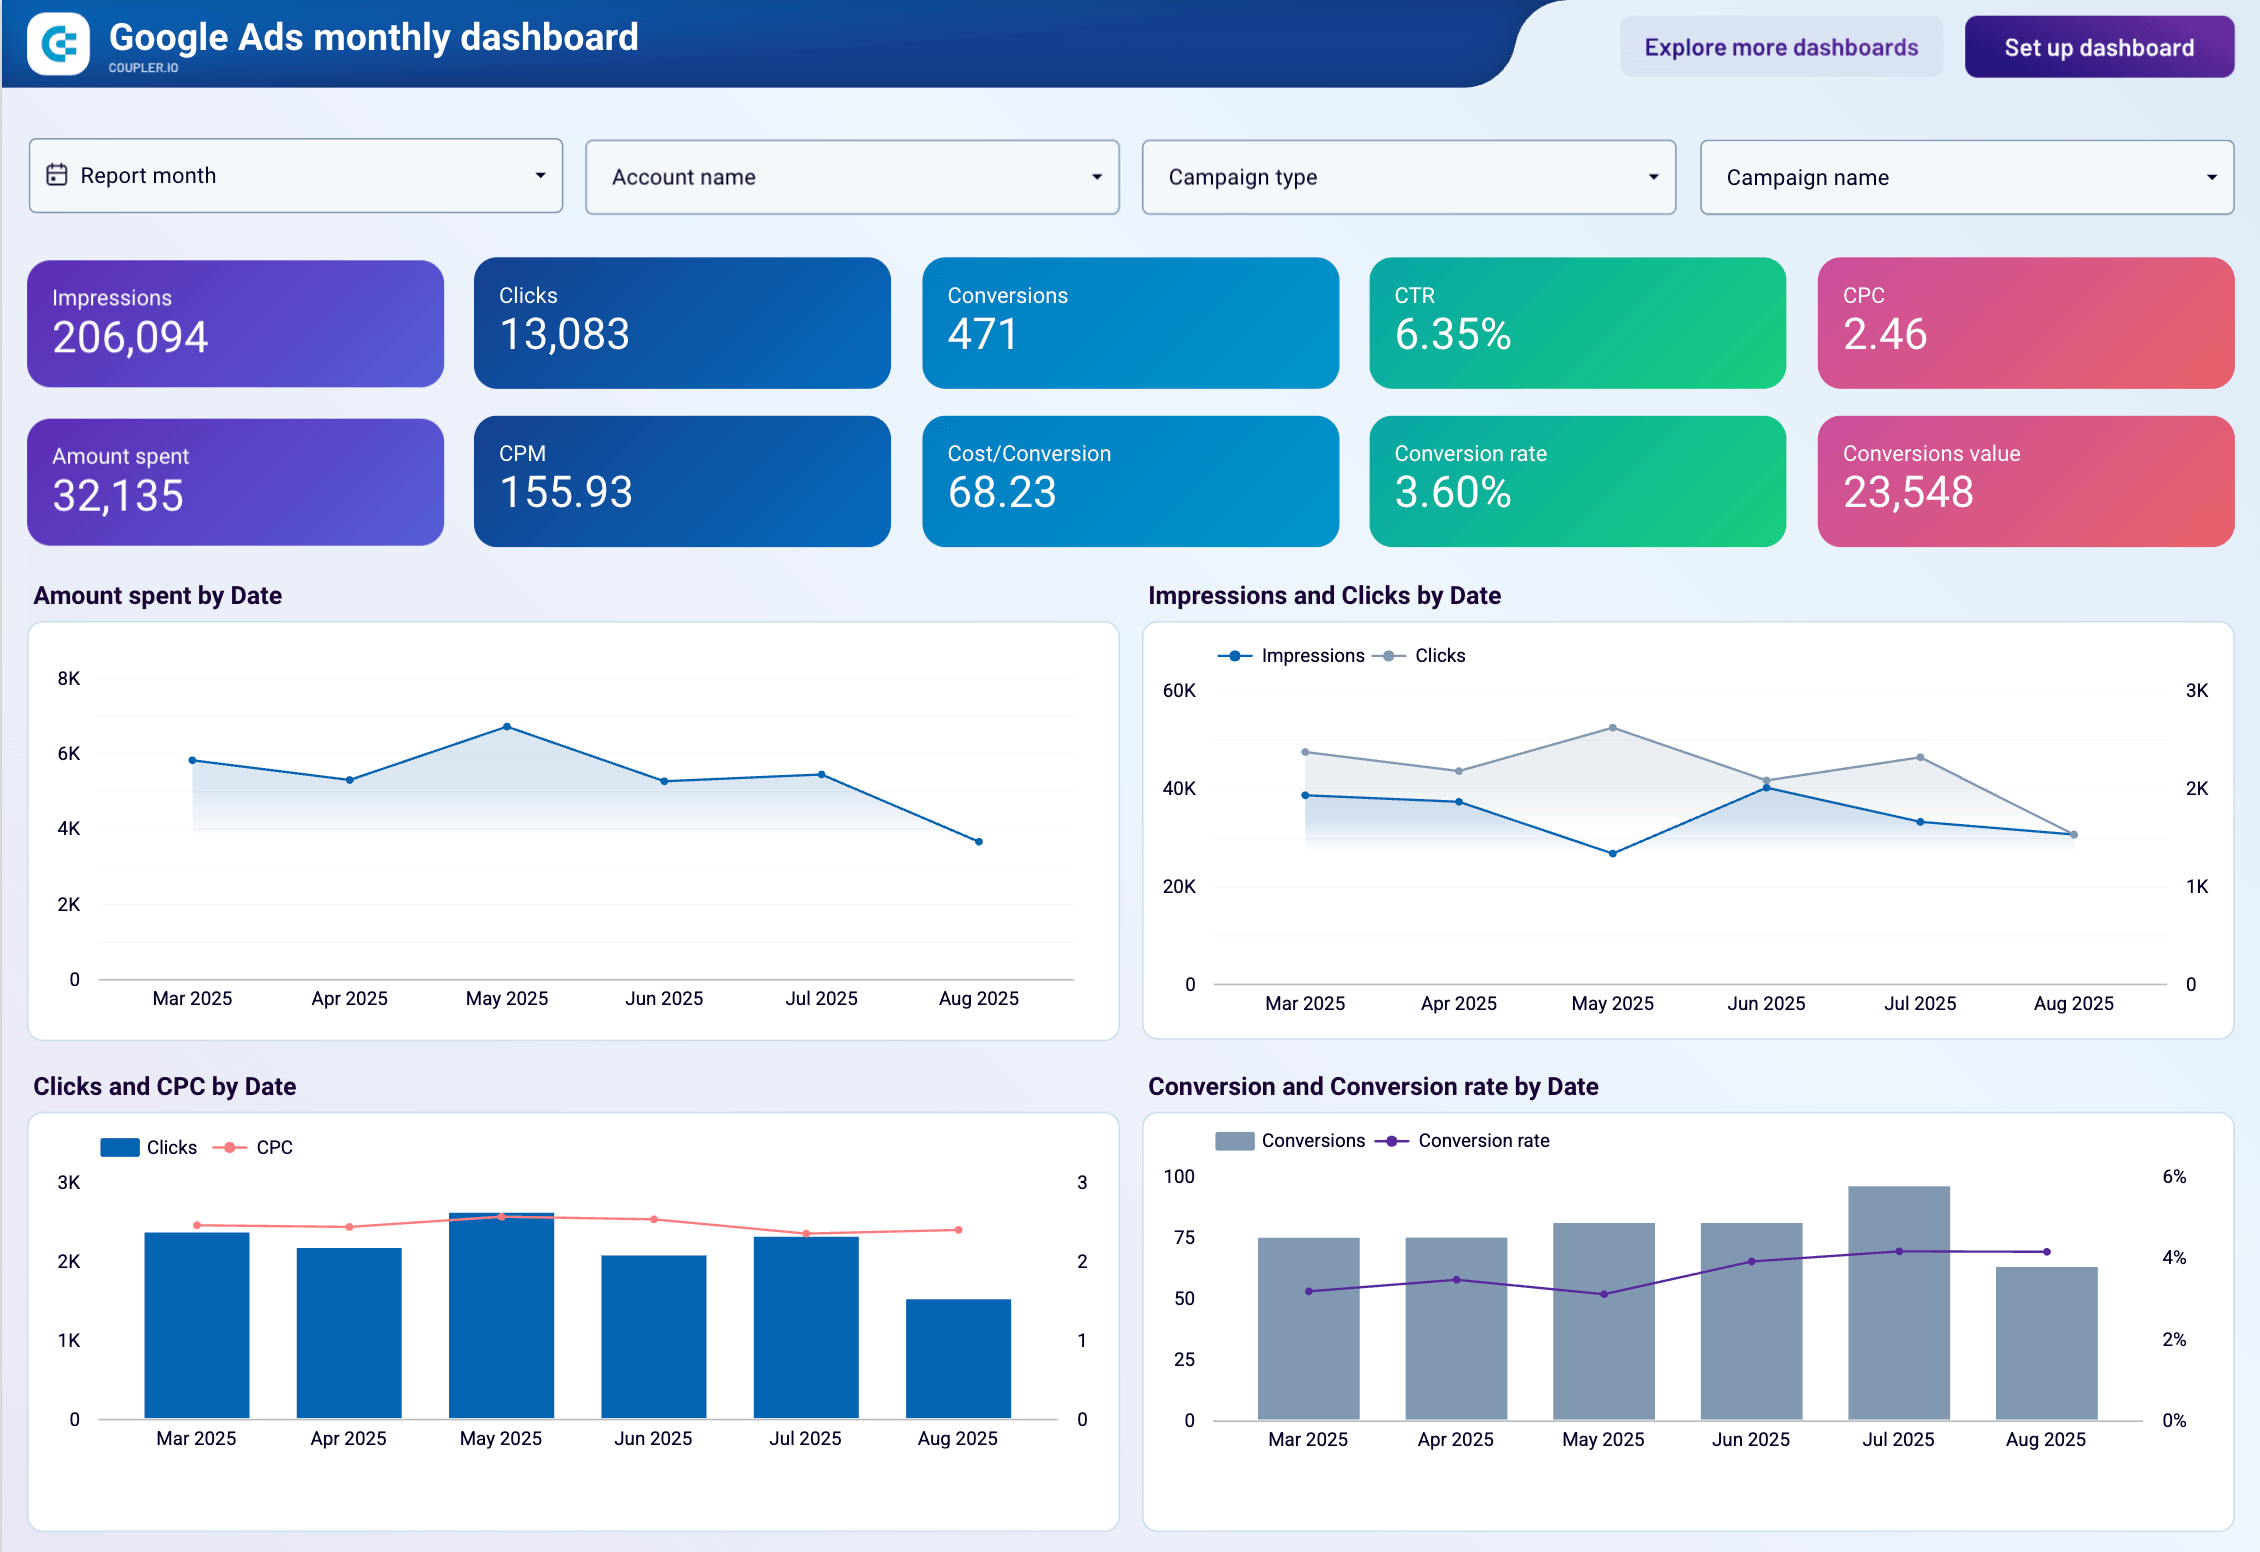
#10. Google Ads monthly performance dashboard by Coupler.io
This dashboard provides detailed insights into your Google Ads campaigns with analysis of spending, conversions, and audience performance. It consolidates Google Ads data to help you optimize budget allocation and track results across campaign types and geographic regions.
Google Ads monthly performance dashboard
 Preview dashboard
Google Ads monthly performance dashboard
Preview dashboardWith this dashboard, you can compare spend by campaign type against conversions to identify budget efficiency opportunities, and analyze demographic performance by age and gender to refine your targeting. Use the detailed campaign performance tables and charts to identify top-performing campaigns and understand which types (Search network, Shopping, etc.) drive the best results.
You can get a copy of this dashboard for free in Looker Studio with a Coupler.io account.
Dashboard metrics:
- Amount spend by date and campaign type
- Impressions, clicks, conversions
- CTR, CPC, CPM
- Cost/conversion, conversion rate, conversion value
- Conversion actions, conversion action rate
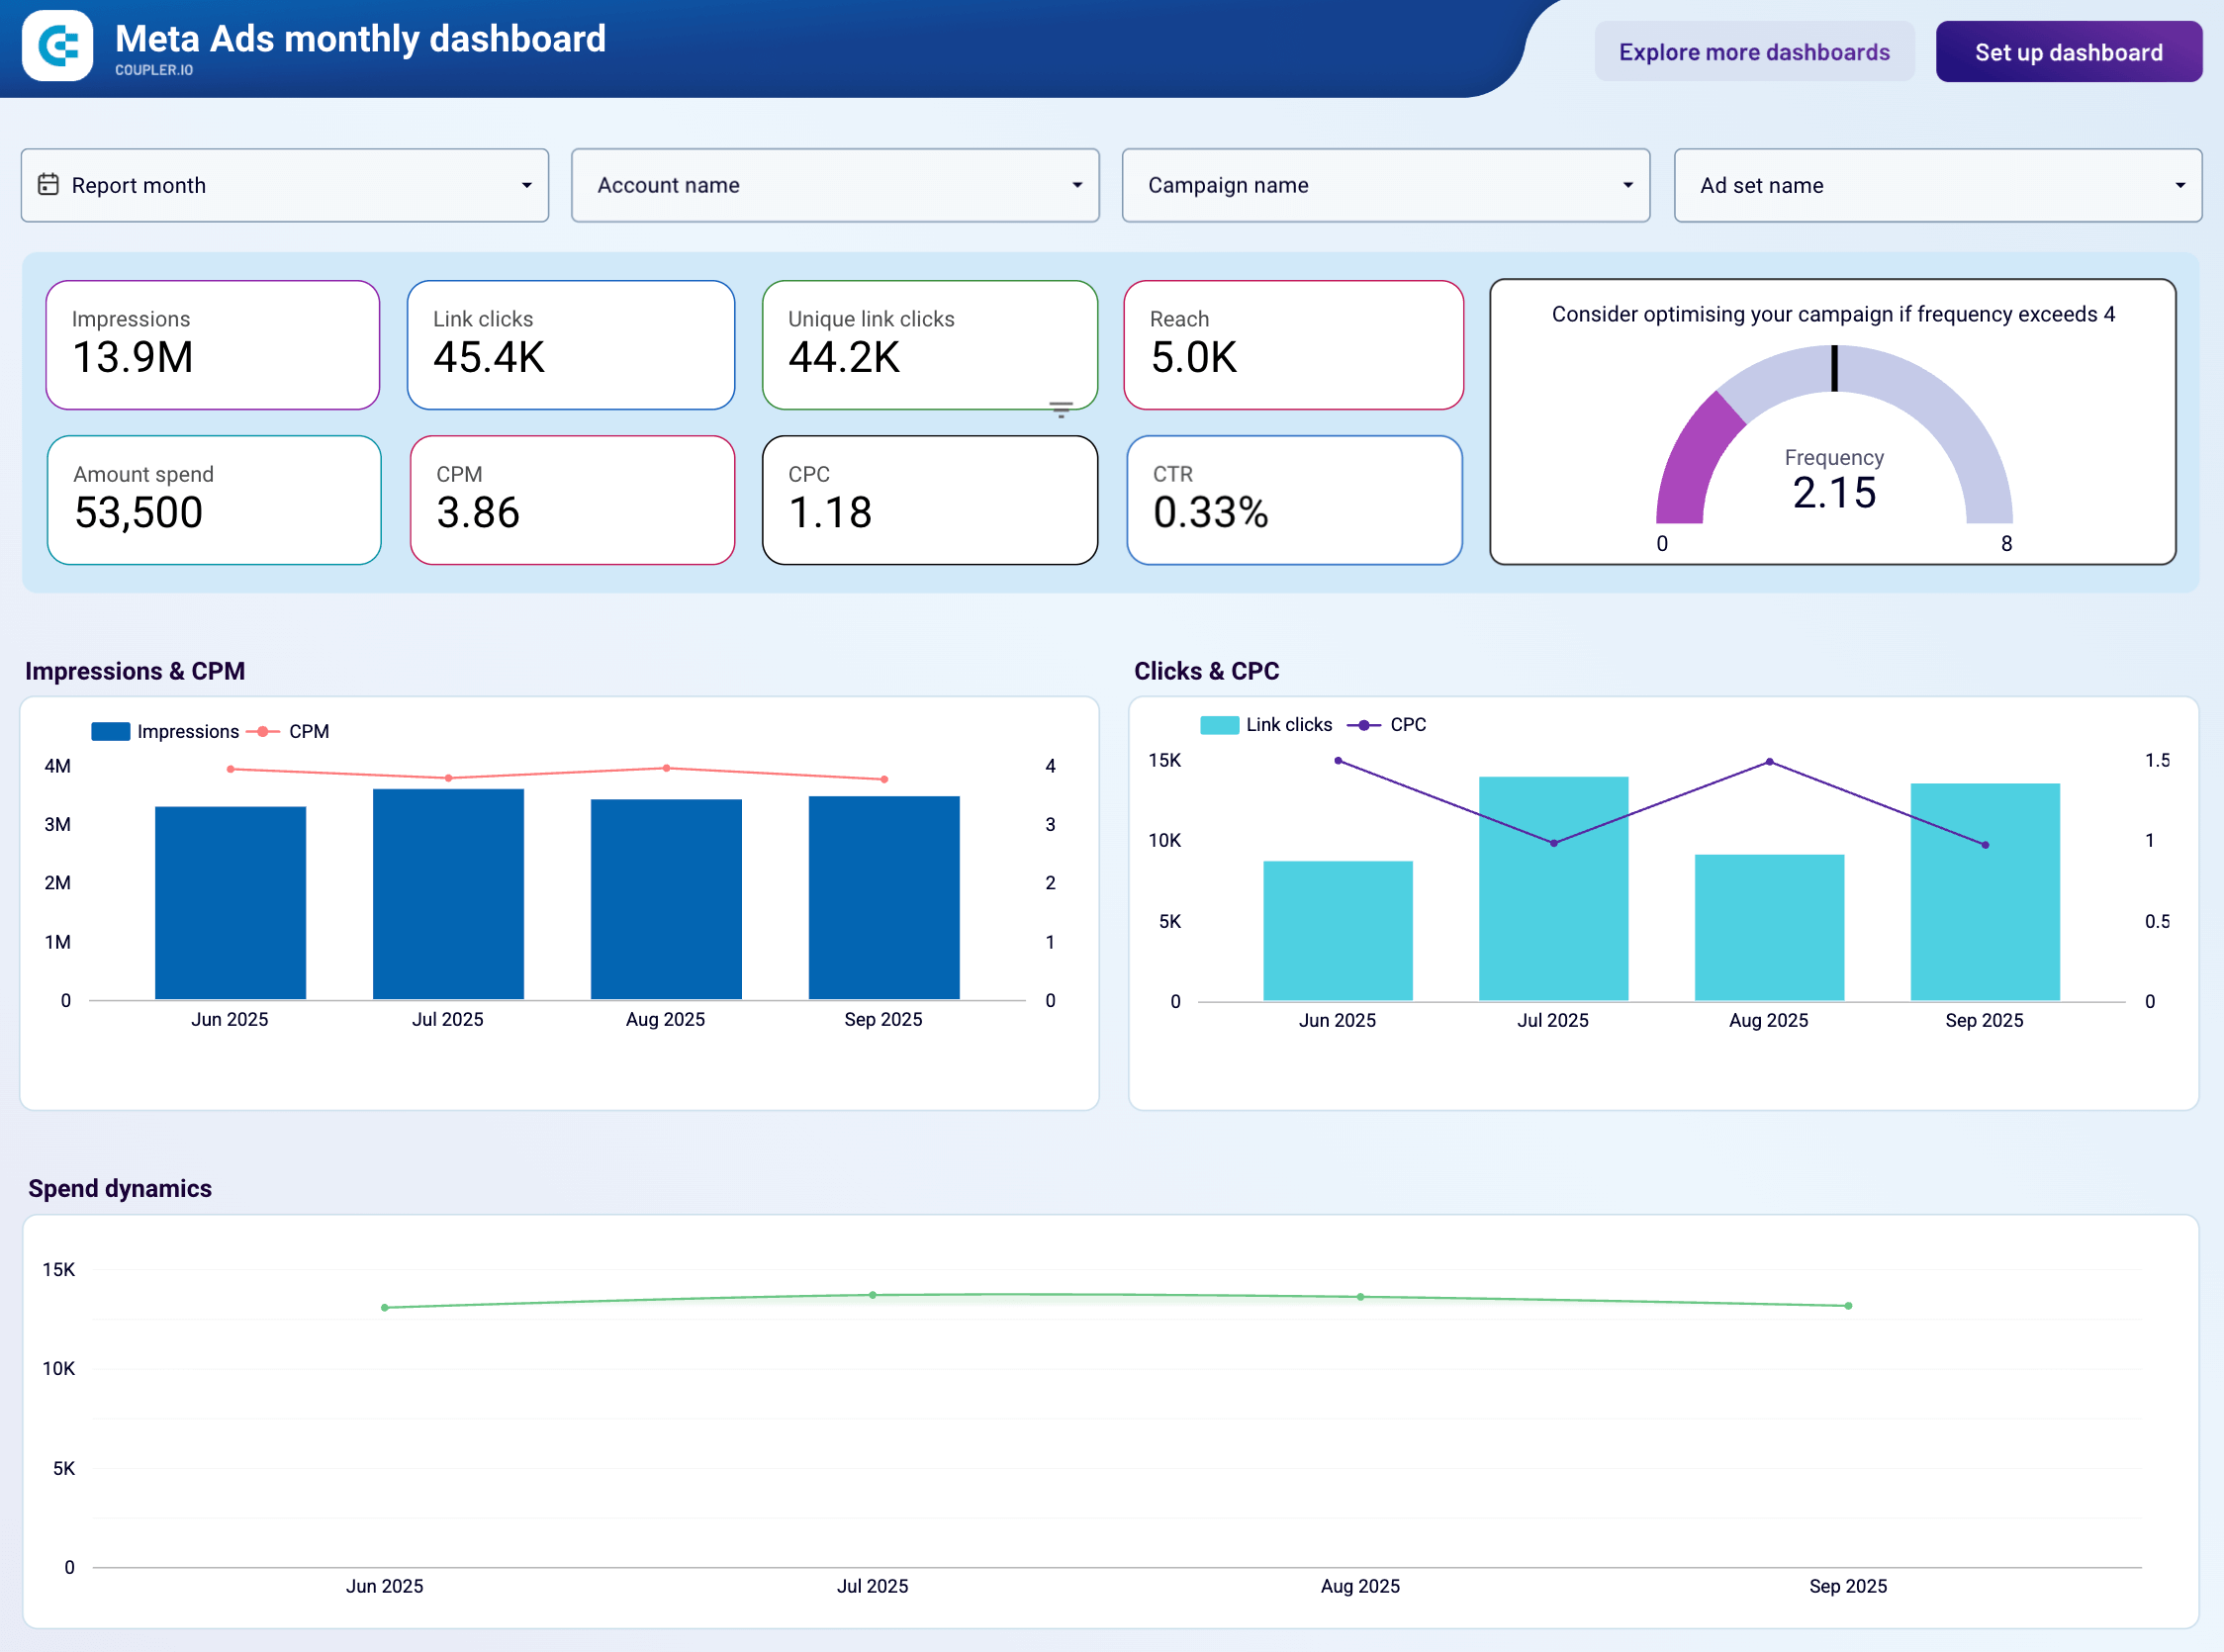
#11. Meta Ads monthly performance dashboard by Coupler.io
To run successful advertising campaigns on Facebook and Instagram, you need a clear understanding of who engages with your ads. This dashboard helps you analyze audience demographics, device preferences, and geographic performance across your Meta advertising campaigns.
Meta Ads monthly performance dashboard
 Preview dashboard
Meta Ads monthly performance dashboard
Preview dashboardThe dashboard collects data from Meta Ads using the built-in Coupler.io connector. You can identify which age groups and genders engage most with your ads, see device performance across tablets, desktops, Apple and Android smartphones, and discover high-potential international markets with a geographic heat map.
Dashboard metrics:
- Amount spend
- Impressions
- Link clicks and unique link clicks
- Clicks by demographic, device, & country
- CTR
- CPM
- CPC
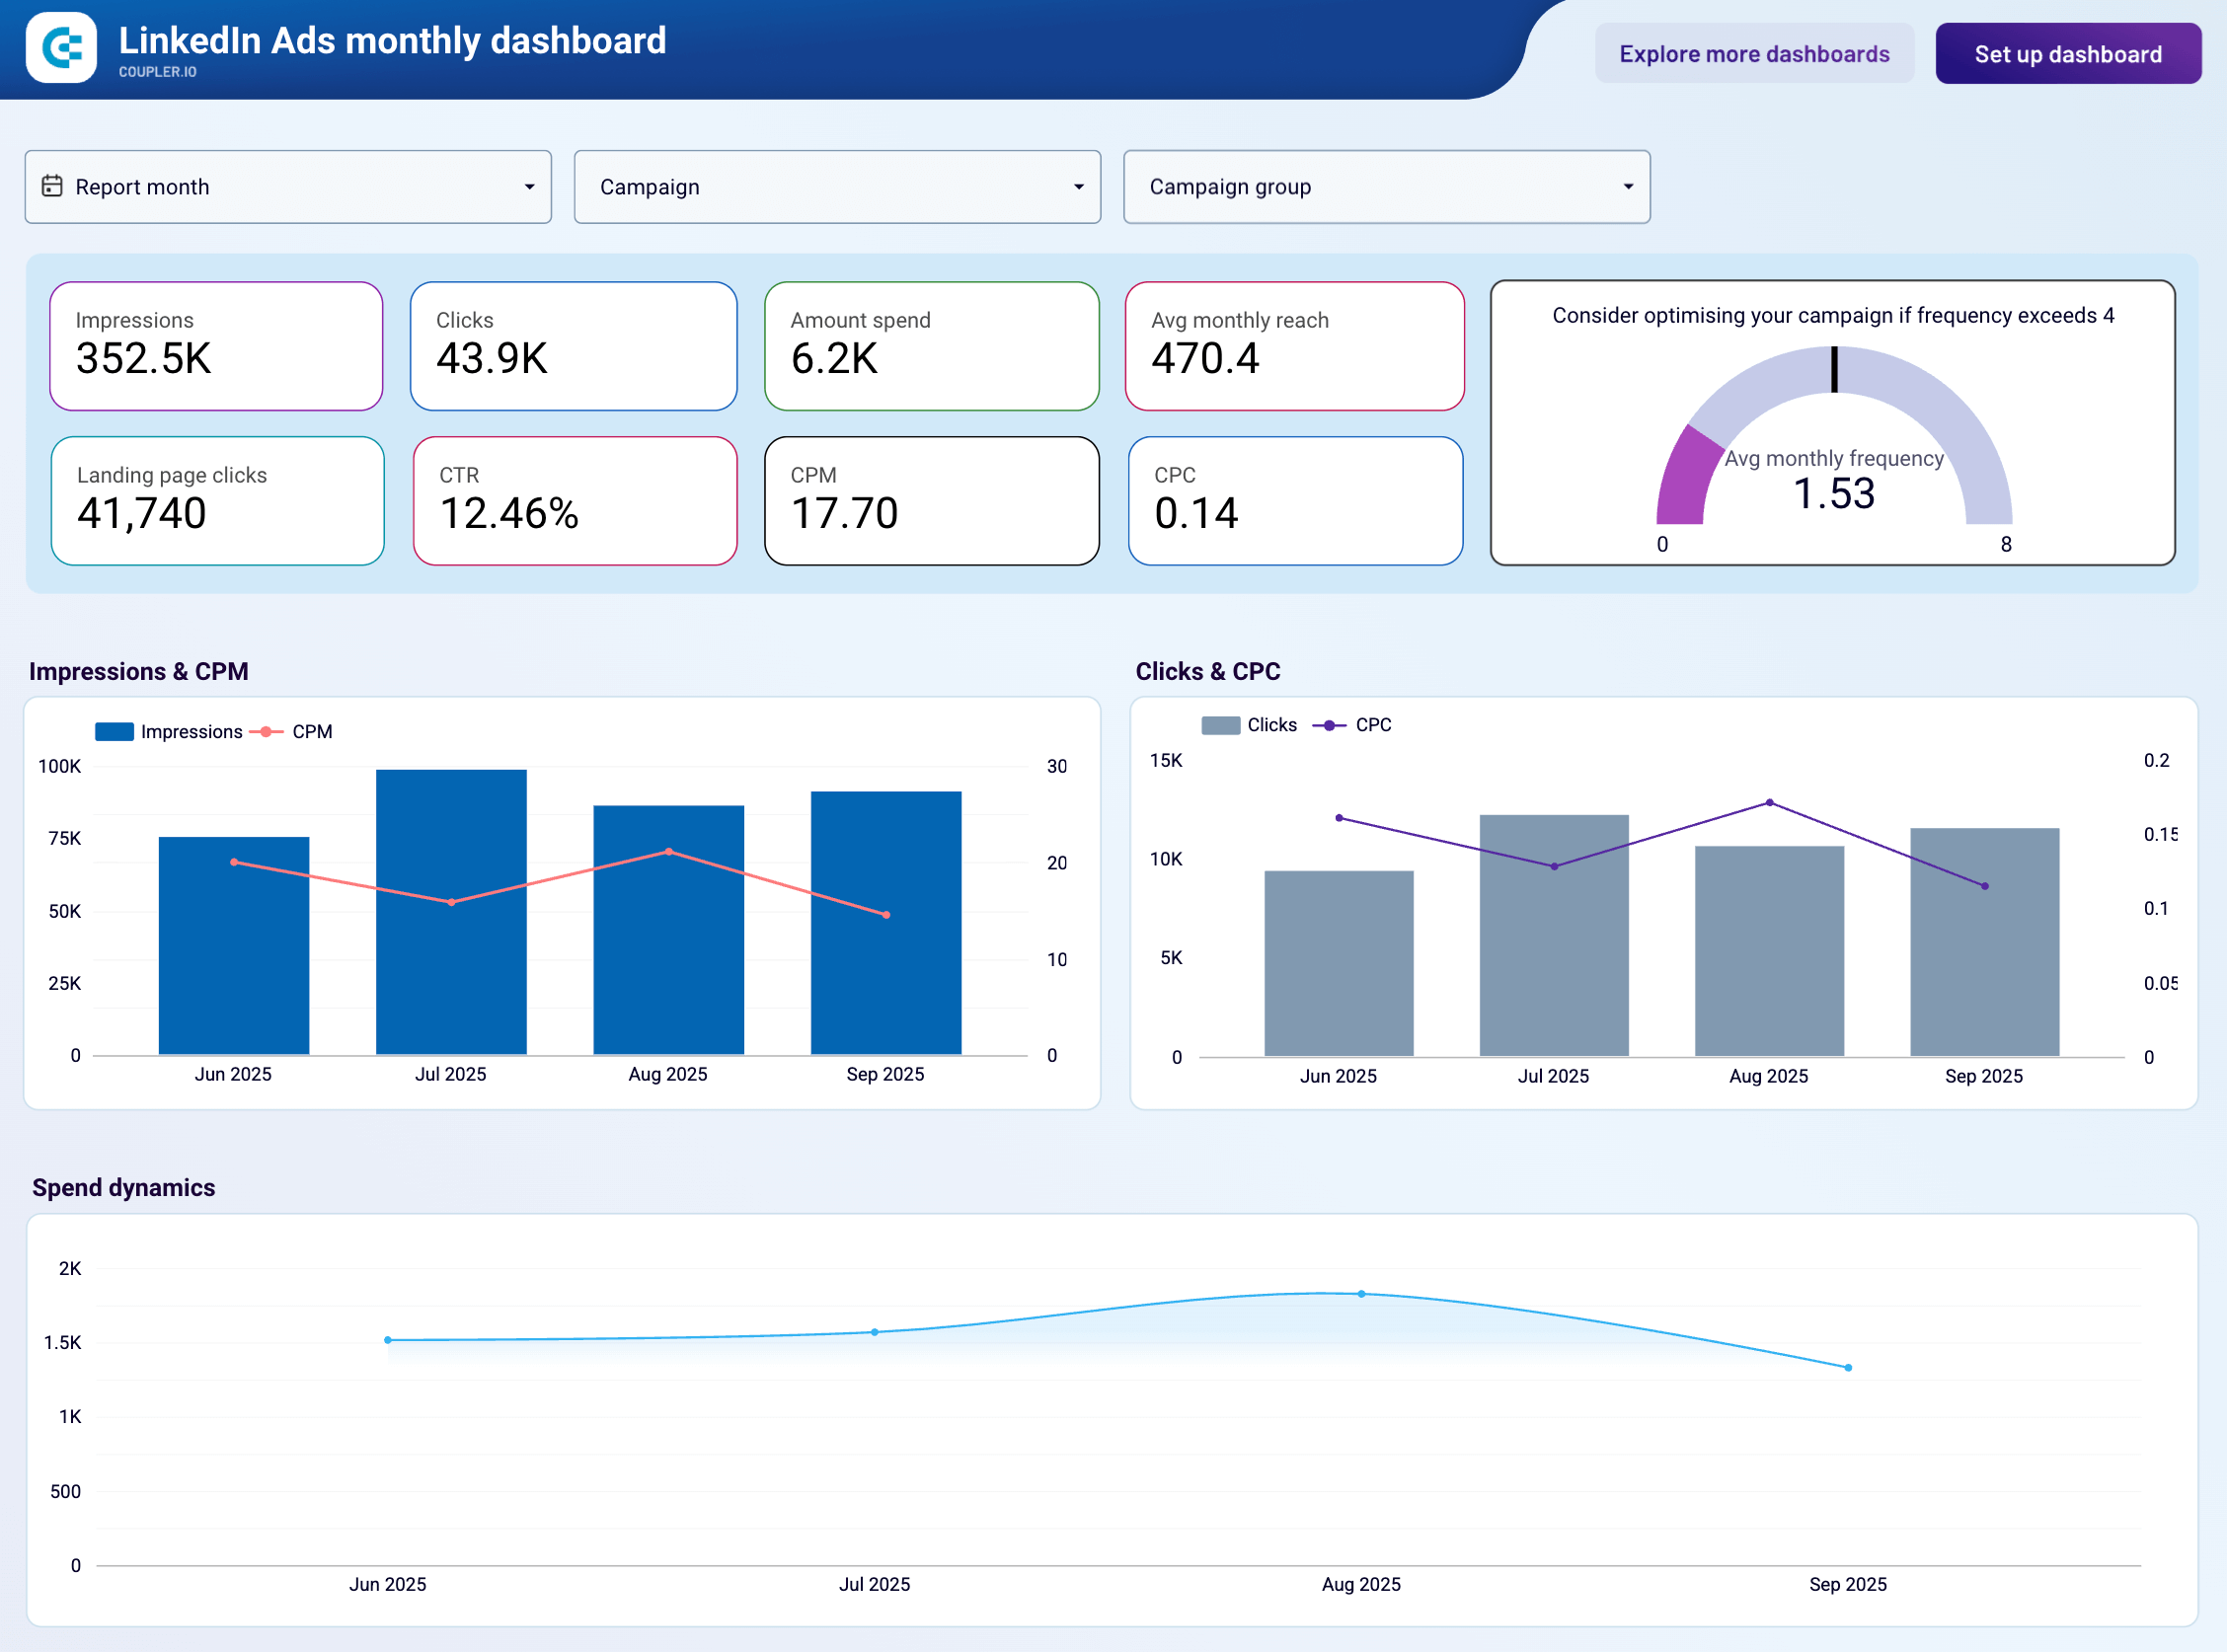
#12. LinkedIn Ads monthly performance dashboard by Coupler.io
Managing B2B campaigns on LinkedIn requires tracking advertising spend and lead generation results across multiple interfaces. This dashboard consolidates monthly views of campaign performance, conversion tracking, and lead form analytics in one place.
LinkedIn Ads monthly performance dashboard
 Preview dashboard
LinkedIn Ads monthly performance dashboard
Preview dashboardYou can monitor campaign spend, reach, engagement, and more through scorecards, and use the frequency meter to check if you’re showing ads to the same people too often. Monthly trend charts help you spot patterns like rising costs or declining engagement, while detailed tables let you compare which campaigns generate the highest-quality leads. There is also a funnel visualization (impressions to completed leads) showing which campaigns drive real engagement versus clicks.
To get a free copy of this Looker Studio dashboard, simply create a Coupler.io account – it takes less than 5 minutes!
Dashboard metrics:
- Impressions and average monthly reach
- Clicks and CTR
- Amount spent, CPM, and CPC
- Campaign engagement rates
- Total conversions, landing page clicks
- Cost per conversion
- Engagement rate
- Frequency
#13. Bing Ads conversion tracking dashboard by Coupler.io
This dashboard connects to Microsoft Advertising (Bing Ads) and gives paid search managers a single view of spend efficiency and conversion outcomes across all campaigns. It’s built for performance marketing teams who need to track where budget goes and what it actually produces.
Bing Ads conversion tracking dashboard
Bing Ads conversion tracking dashboard
Preview dashboardWith the Bing Ads dashboard, you can monitor daily trends in spend, impressions, clicks, and conversions side by side to spot cause-and-effect patterns. The campaign performance table ranks every campaign by cost per conversion. You can also break down conversion volume by goal type to separate high-value outcomes from softer engagement events.
Dashboard metrics:
- Impressions
- Clicks
- Spend
- CTR
- CPM
- CPC
- Conversions
- Cost per conversion
#14. Reddit Ads dashboard by Coupler.io
Reddit Ads dashboard is designed for paid social and performance marketers running campaigns on Reddit. It consolidates spend, reach, engagement, and conversion data from your Reddit Ads account into one Looker Studio report.
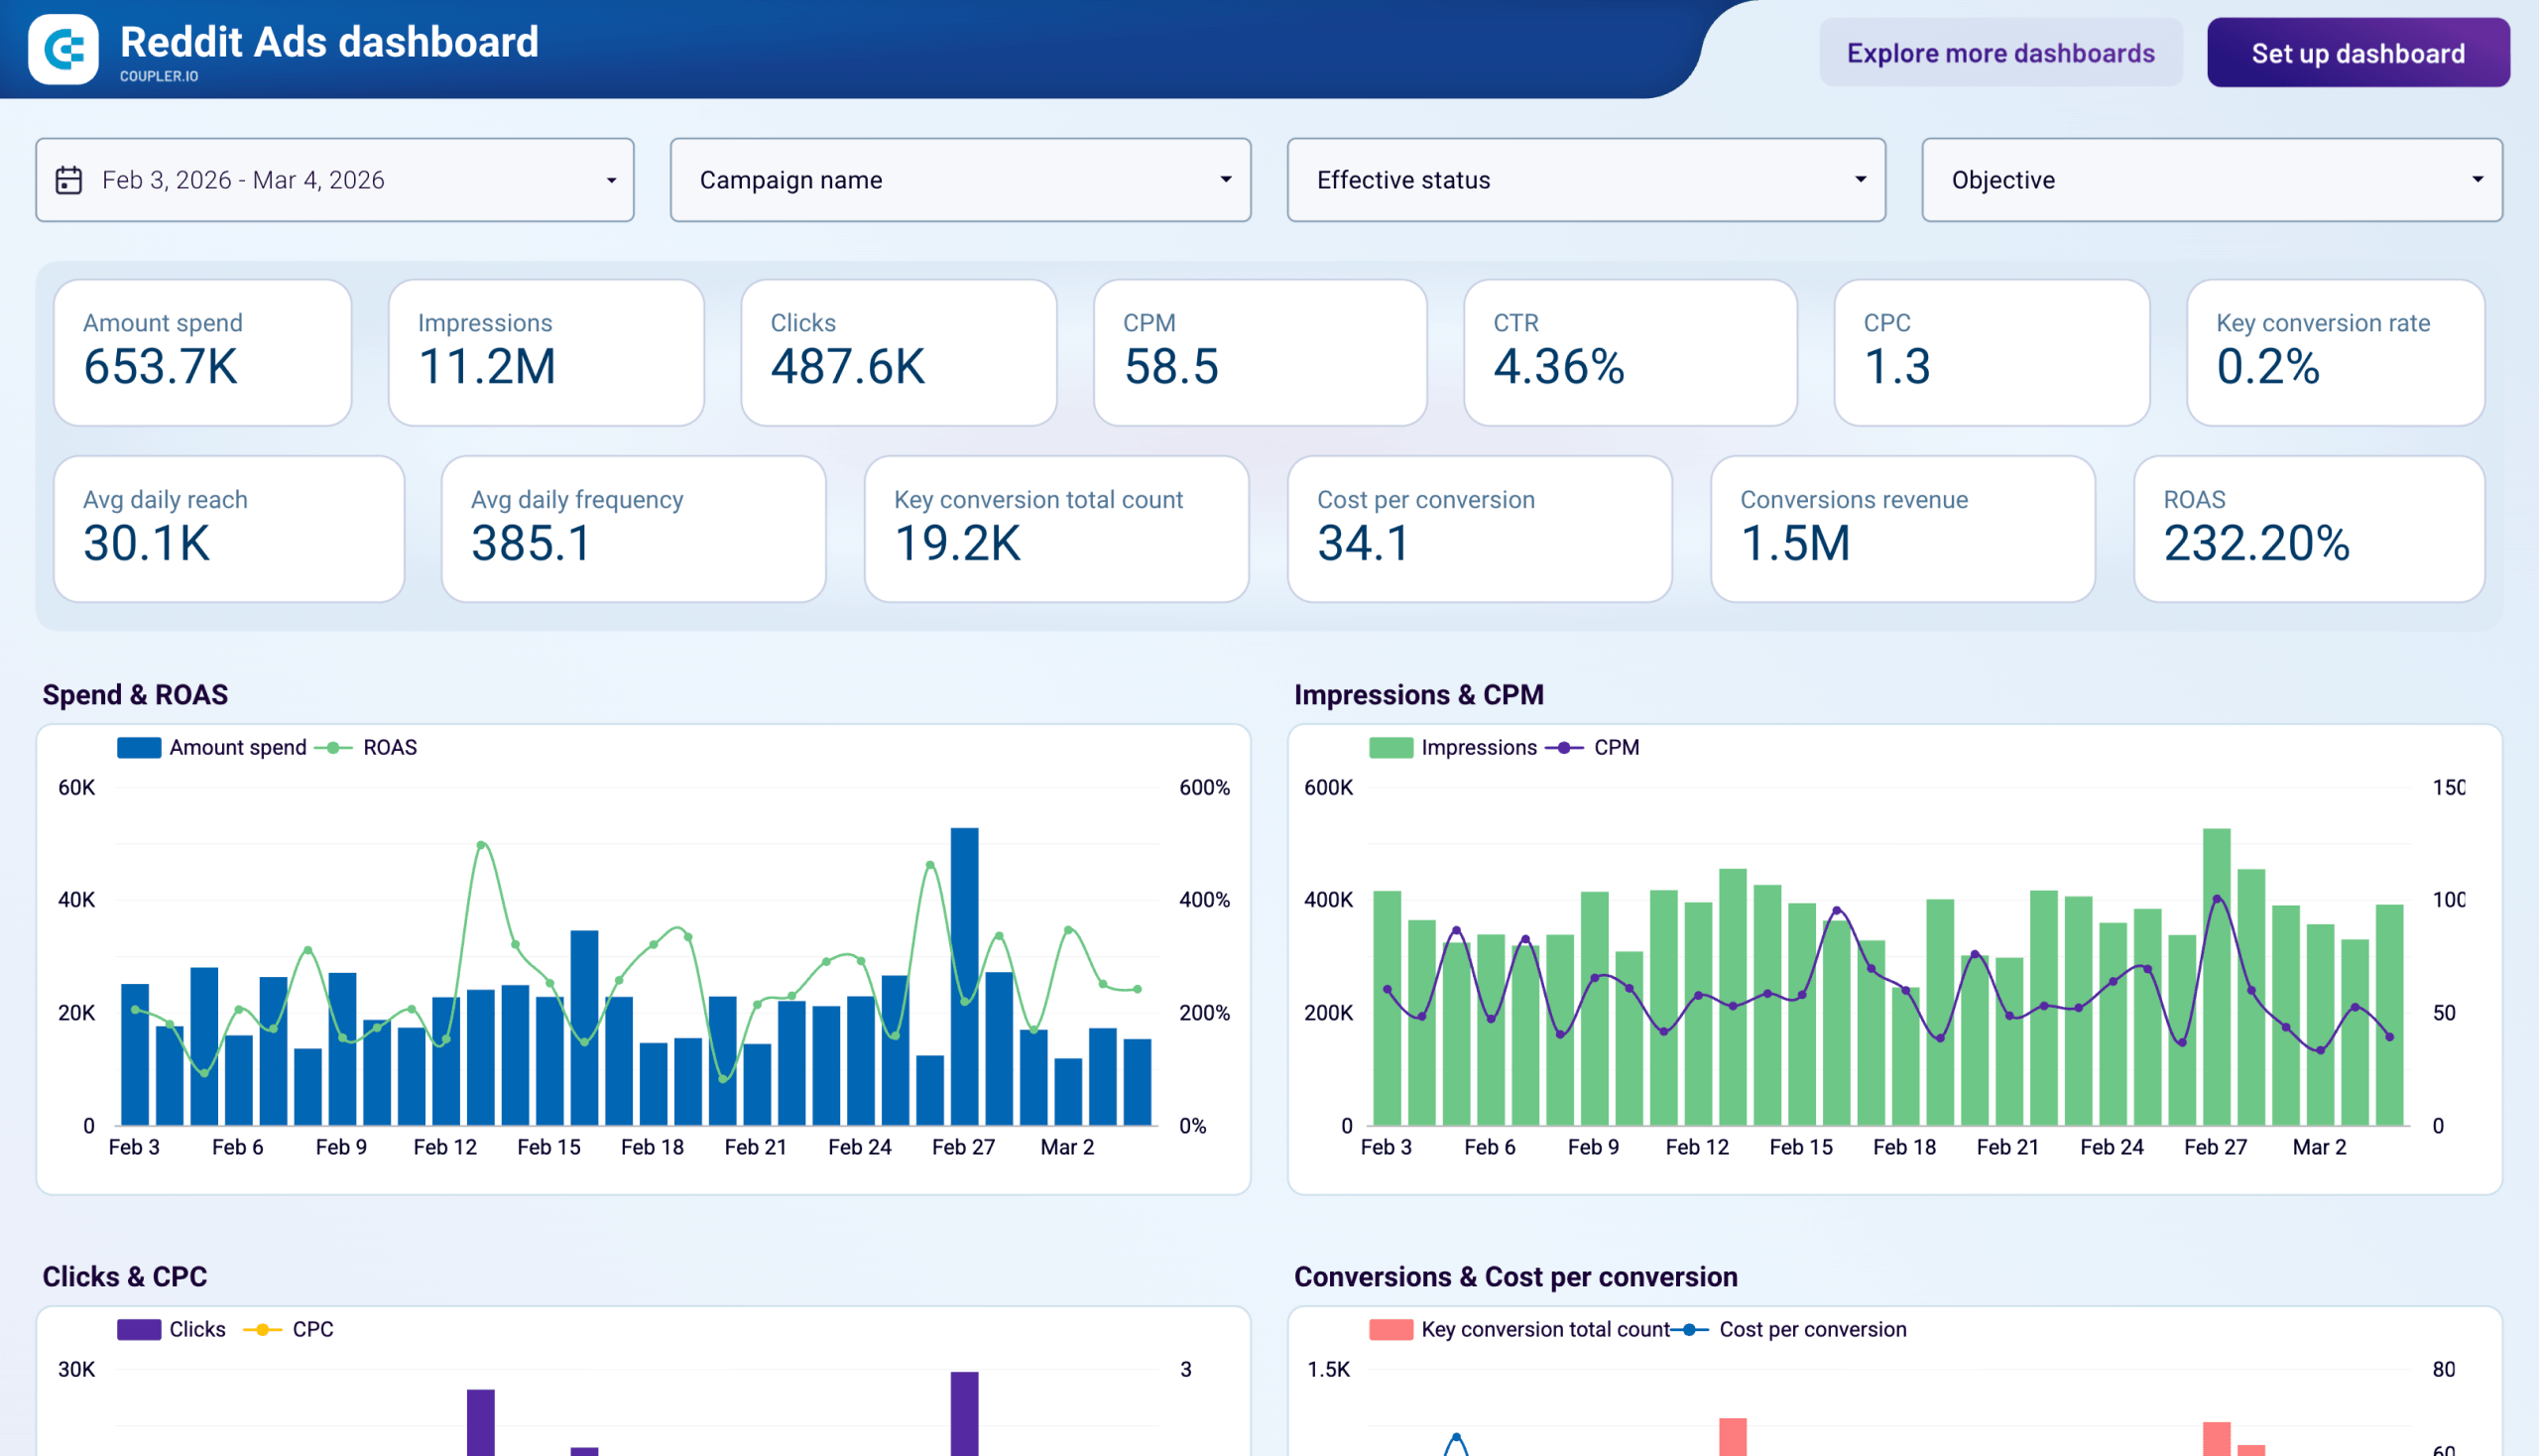
You can track daily performance across spend, impressions, clicks, and conversions to identify periods where costs rose without proportional returns. The performance-by-objective table lets you compare ROAS across campaign types such as Traffic, Conversions, and Awareness. Use the campaign performance table to rank individual campaigns by ROAS or cost per conversion and decide where to allocate budget.
Dashboard metrics:
- Amount spend
- Impressions
- Clicks
- CPM, CPC, CTR
- ROAS
- Key conversion total count
- Cost per conversion
- Conversions revenue
- Avg daily reach
- Avg daily frequency
Marketing analytics examples of Looker Studio dashboards
#15. All-in-one marketing dashboard by Coupler.io
This dashboard consolidates performance data from all your key marketing channels into a single interface. Instead of logging into multiple platforms to check your PPC, social media, email campaigns, and organic search performance, you can analyze everything in one place and understand how each channel contributes to your marketing success.
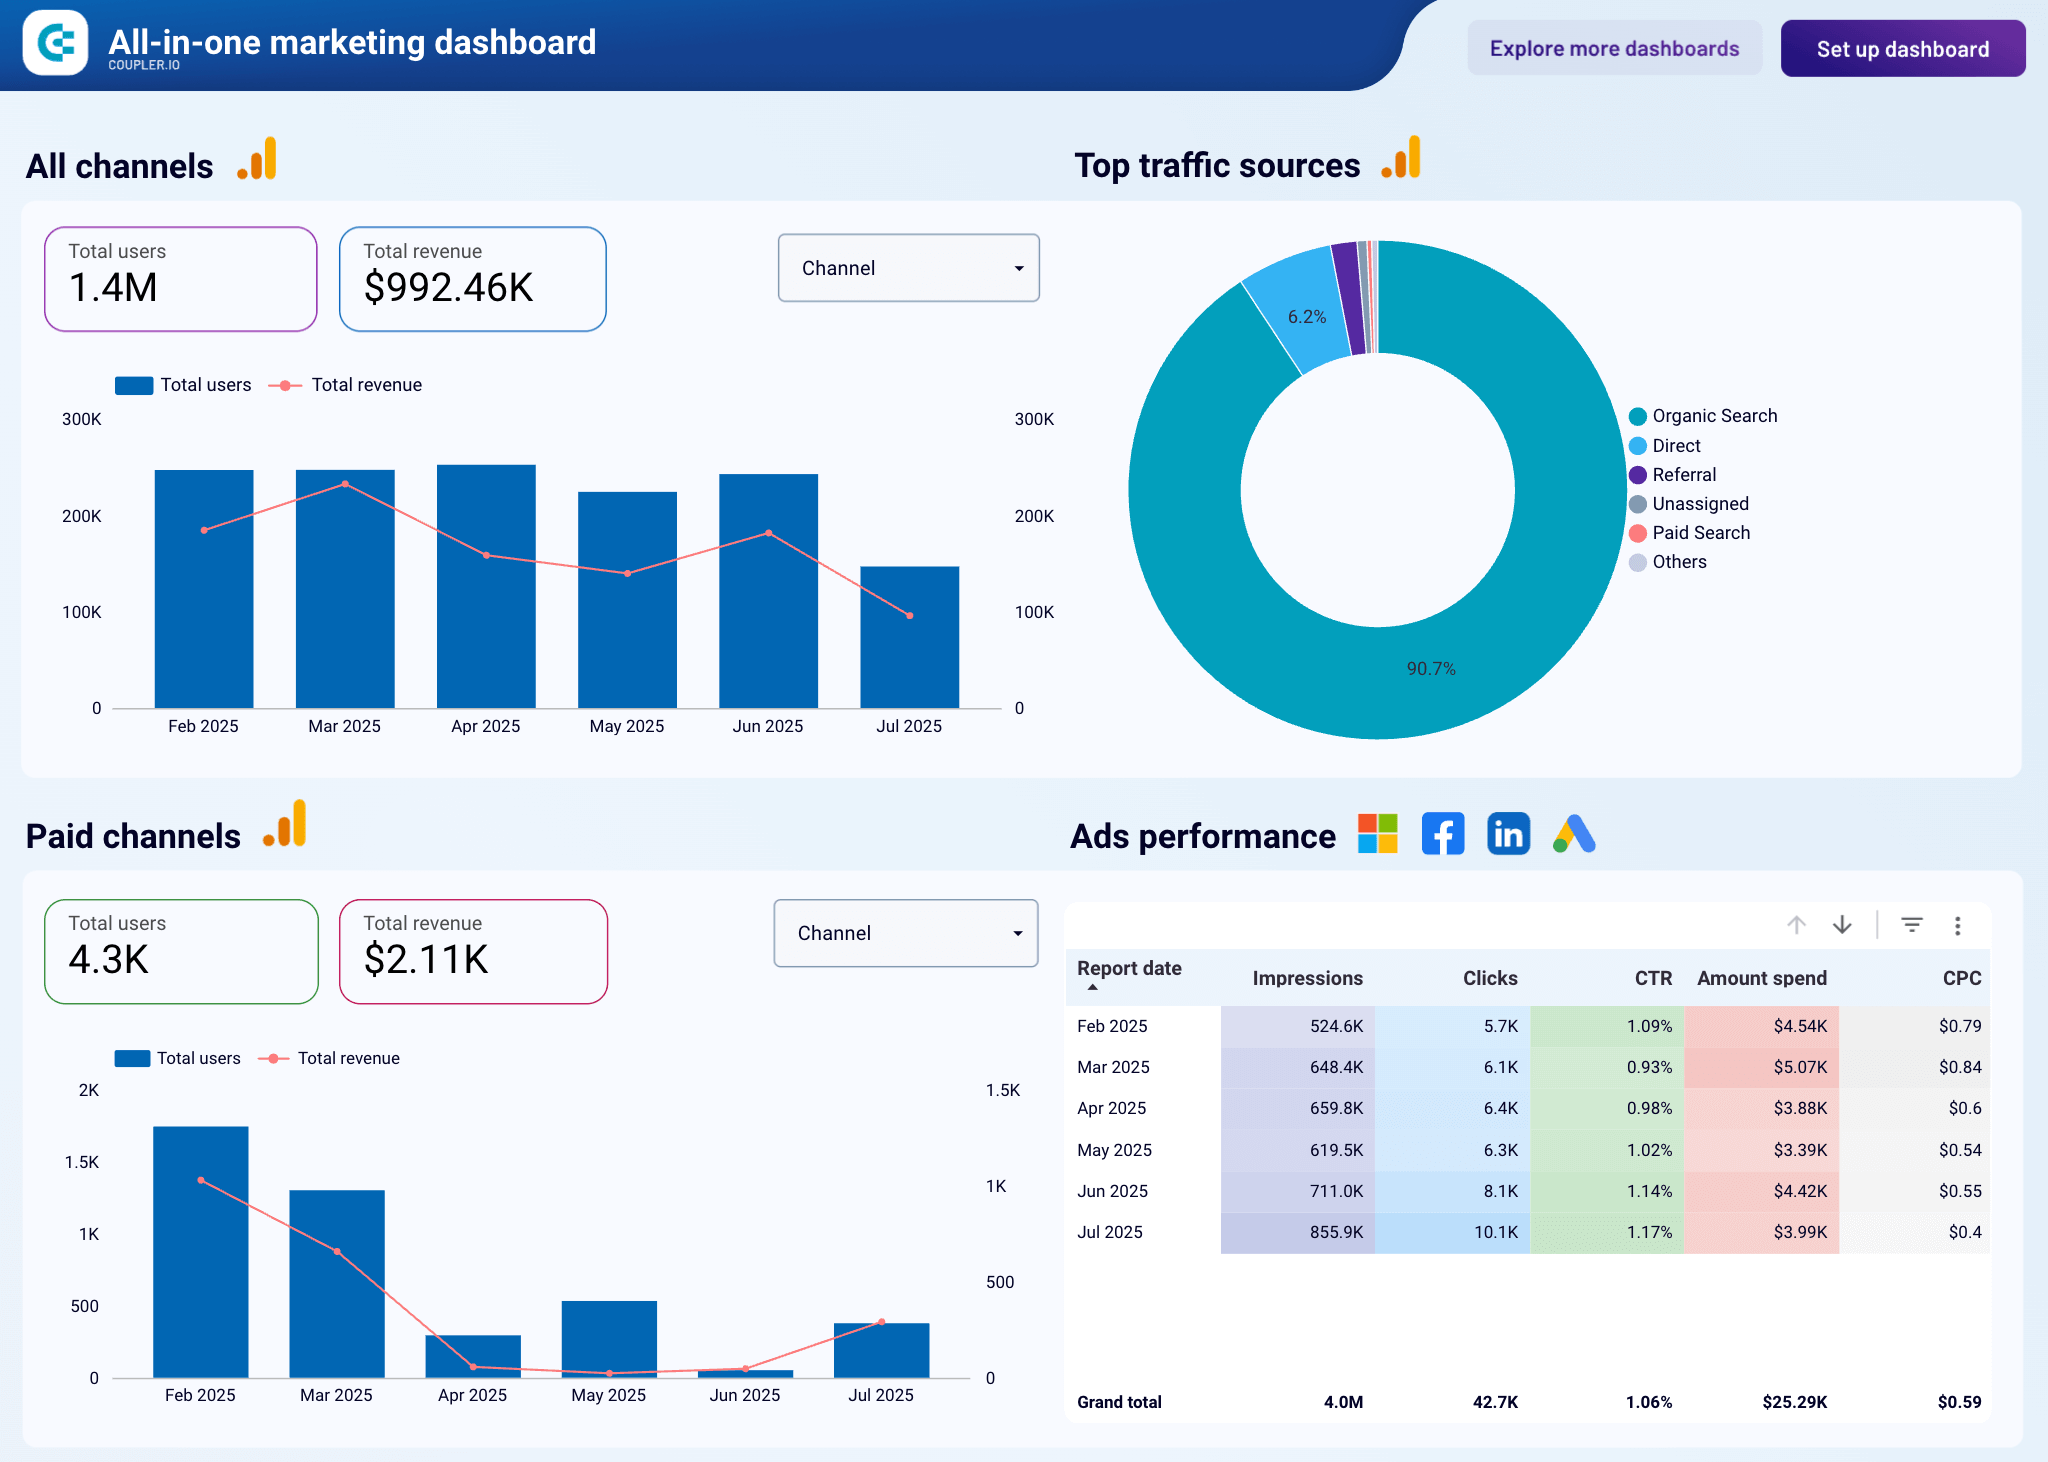
This dashboard is available as a free template in Looker Studio when you sign up for Coupler.io. Connect your marketing accounts, configure a schedule for automatic data refresh, and get actionable insights in minutes!
Dashboard metrics:
- Impressions, clicks, CTR, amount spent, CPC for each ad platform
- Google search performance: impressions, clicks, CTR, average position
- Social media performance: impressions, page views
- YouTube performance: views, minutes watched, engagements
- Email performance: emails delivered, open rate, bounces, unsubscribes, clicks
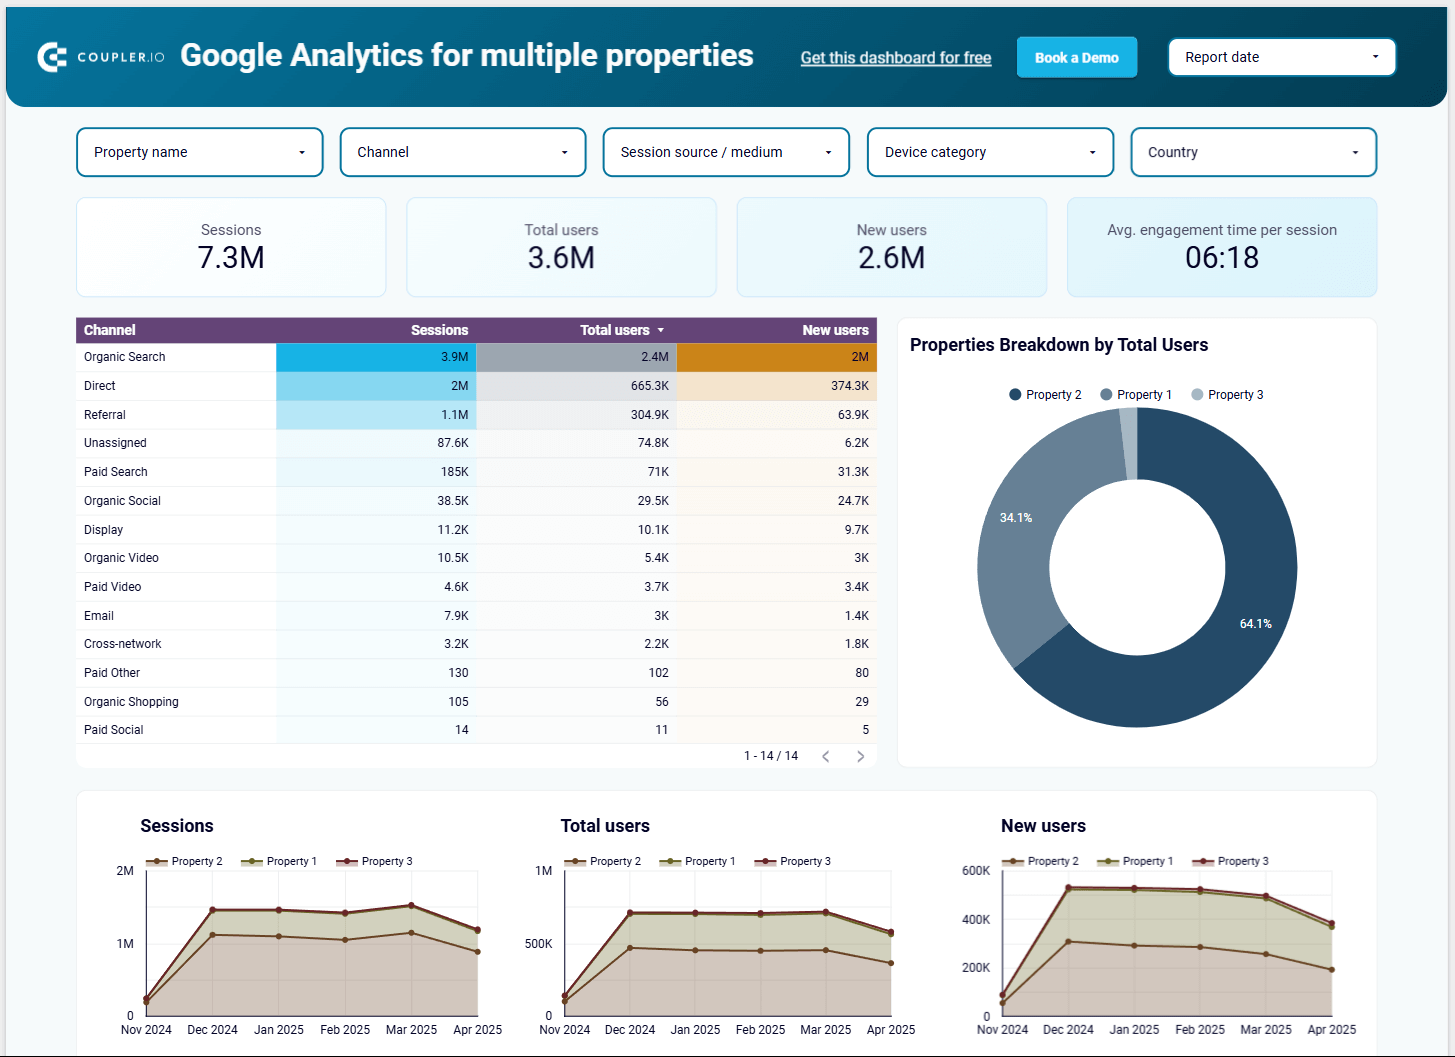
#16. GA4 dashboard for multiple properties by Coupler.io
This report is a must if you have several websites and want to analyze their performance together. Natively, Google Analytics 4 only shows you one website (property) at a time. But it’s pretty inconvenient if you have several products or projects and need to estimate total traffic or analyze channel performance across all your websites.
GA4 dashboard for multiple properties
 Preview dashboard
GA4 dashboard for multiple properties
Preview dashboardThe dashboard solves this problem as it shows you data from all your websites on one page. You can compare results for different properties, analyze engagement trends, estimate total awareness, and much more. It also allows you to explore results by country and use various filters to analyze your data. Try the interactive version to see how it works in practice.
Dashboard metrics:
- New users
- Total users
- Sessions
- Traffic by source
- Average engagement time
- Traffic by source
- Traffic by channel
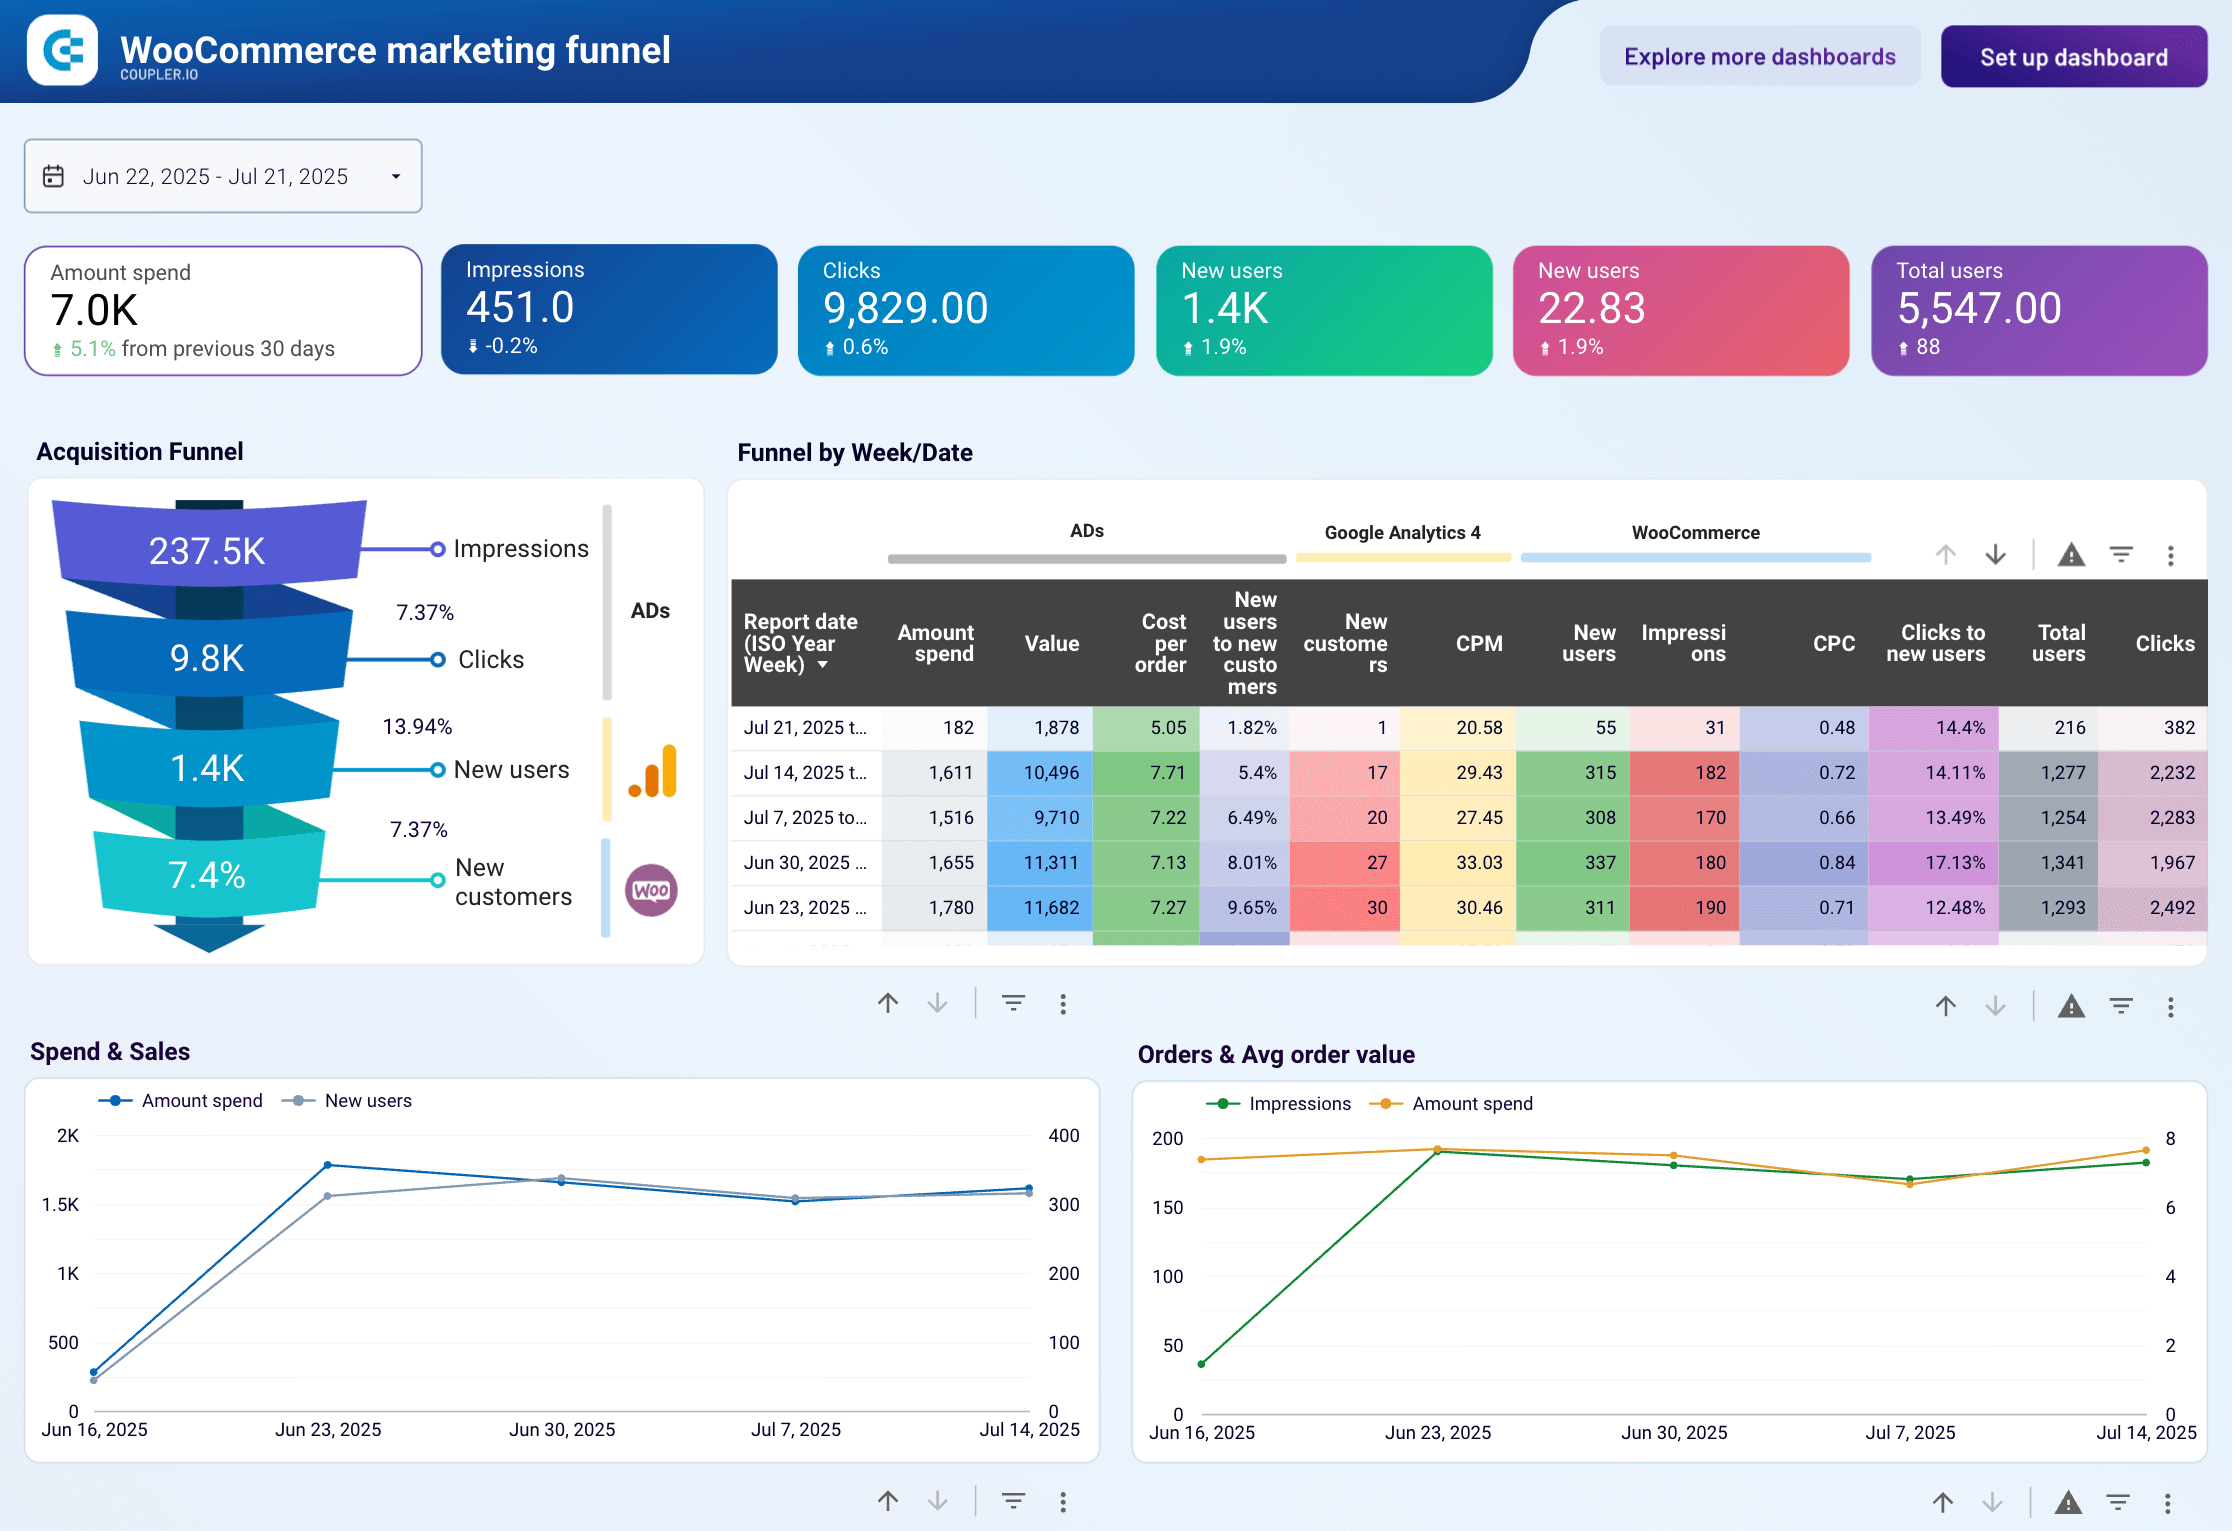
#17. Marketing funnel dashboard for WooCommerce by Coupler.io
This dashboard is specifically designed for WooCommerce store owners. It connects WooCommerce sales performance, Google Analytics 4, and advertising data from multiple platforms to show how your online store acquires new customers. You can see how marketing investments across Google, Facebook, TikTok, and other channels convert into actual orders and revenue for your business.
WooCommerce marketing funnel dashboard
 Preview dashboard
WooCommerce marketing funnel dashboard
Preview dashboardIt takes under 5 minutes to generate a free copy of this dashboard template in Looker Studio. All you have to do is sign up for Coupler.io, connect your store and marketing accounts, and automate data flows on a custom schedule.
Dashboard metrics:
- Amount spent
- Impressions
- Clicks
- New users
- New customers
- Total users
- Orders
- Sales
- & more
Email marketing Looker Studio dashboards
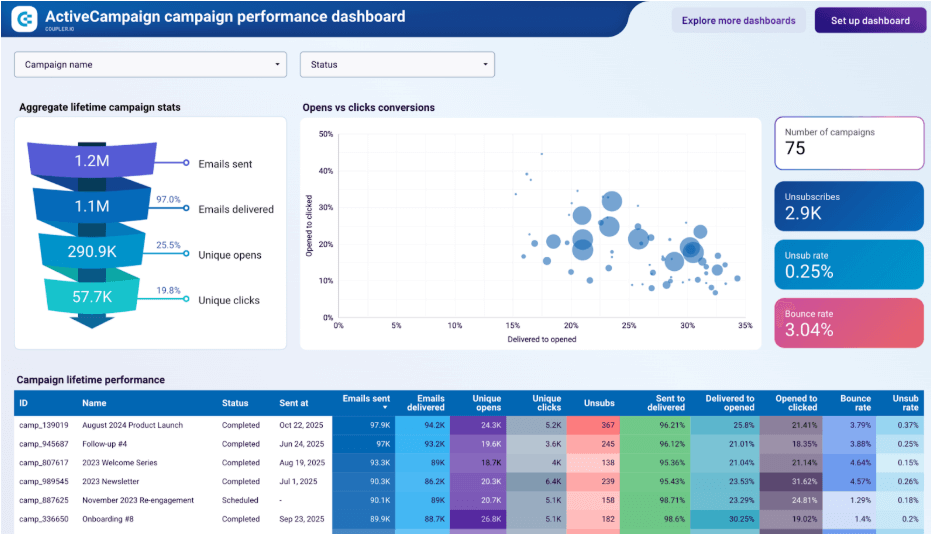
#18. ActiveCampaign campaign performance dashboard by Coupler.io
This dashboard connects to ActiveCampaign and gives email marketers a single view of how their campaigns perform across their full sending history. Instead of checking individual campaign reports inside ActiveCampaign, you can evaluate delivery, engagement, and unsubscribe patterns for all your campaigns in one place.
ActiveCampaign campaign performance dashboard
 preview dashboard
ActiveCampaign campaign performance dashboard
preview dashboardWith this dashboard, you can quickly identify where your email funnel loses the most recipients — whether it’s between delivery and opens or between opens and clicks. It also helps you separate subject line performance from content quality. So you know whether a campaign underperformed because people didn’t open it or because they opened it but didn’t find the content relevant enough to click. You can filter by campaign name or status to benchmark new sends against historical results.
To populate the dashboard with your data, create a free Coupler.io account and connect your ActiveCampaign account. The setup takes about 2 minutes.
Dashboard metrics:
- Emails sent
- Emails delivered
- Unique opens
- Unique clicks
- Sent to delivered rate
- Delivered to opened rate
- Opened to clicked rate
- Bounce rate
- Unsubscribes
- Unsub rate
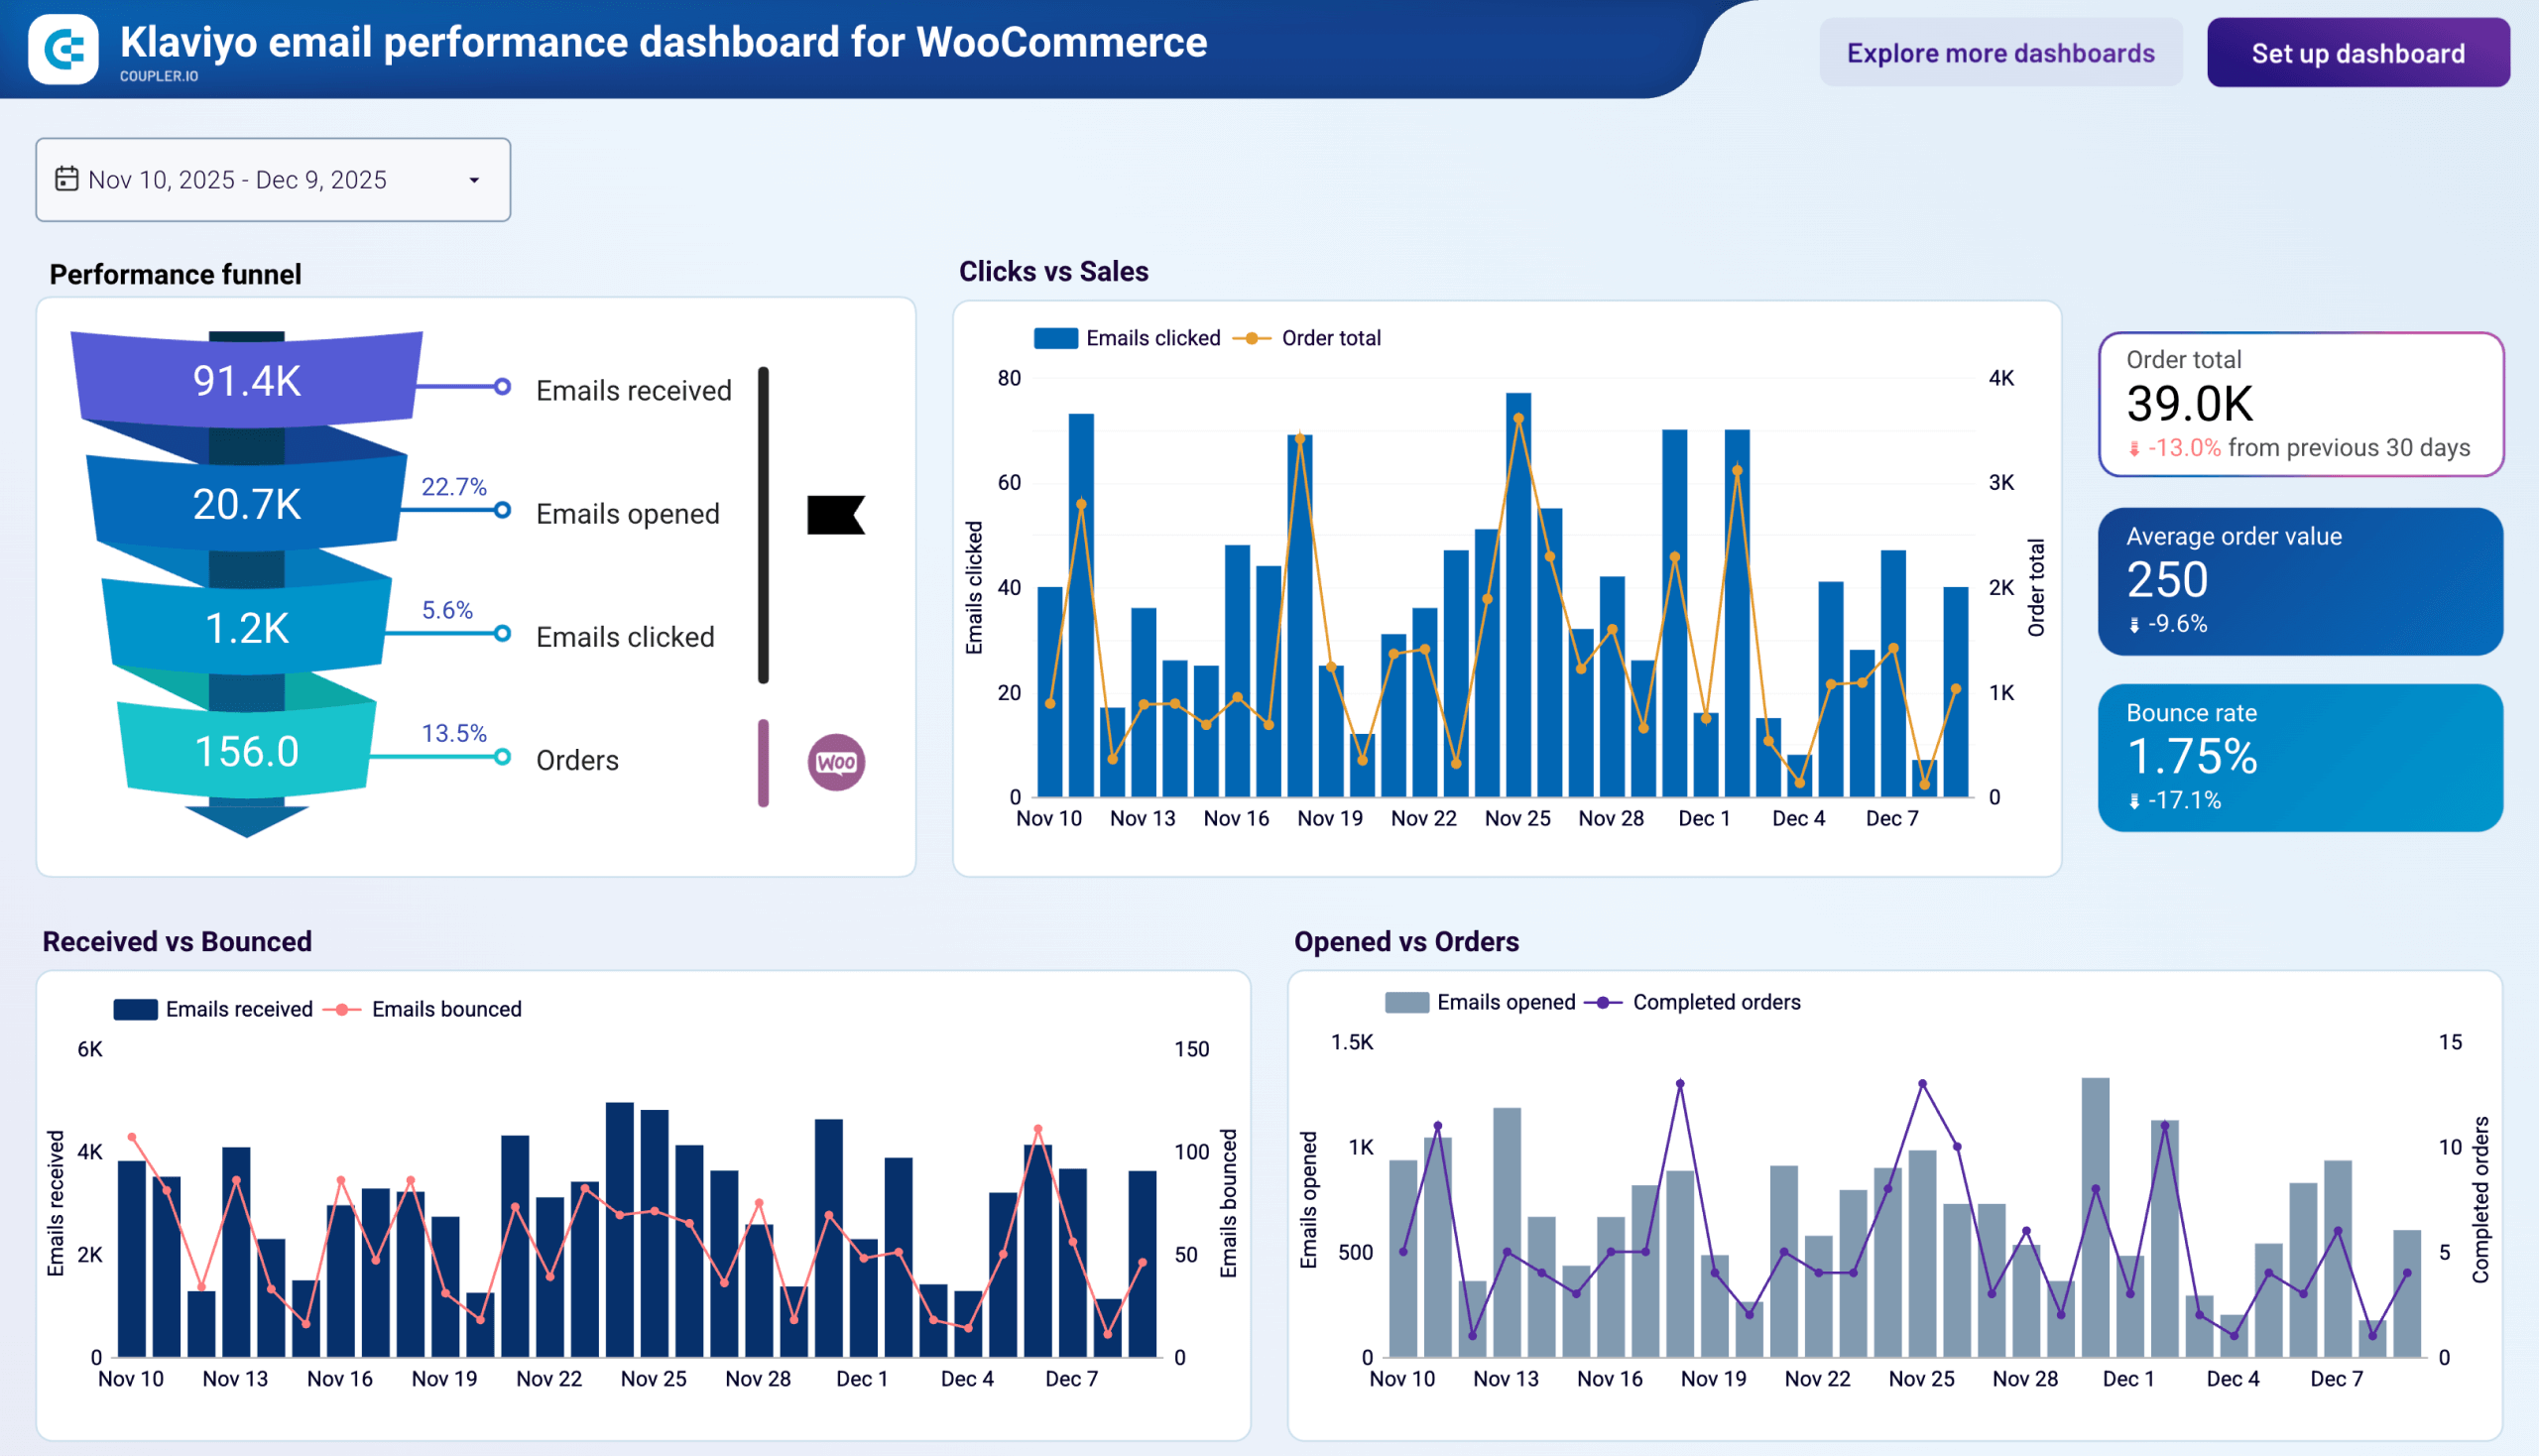
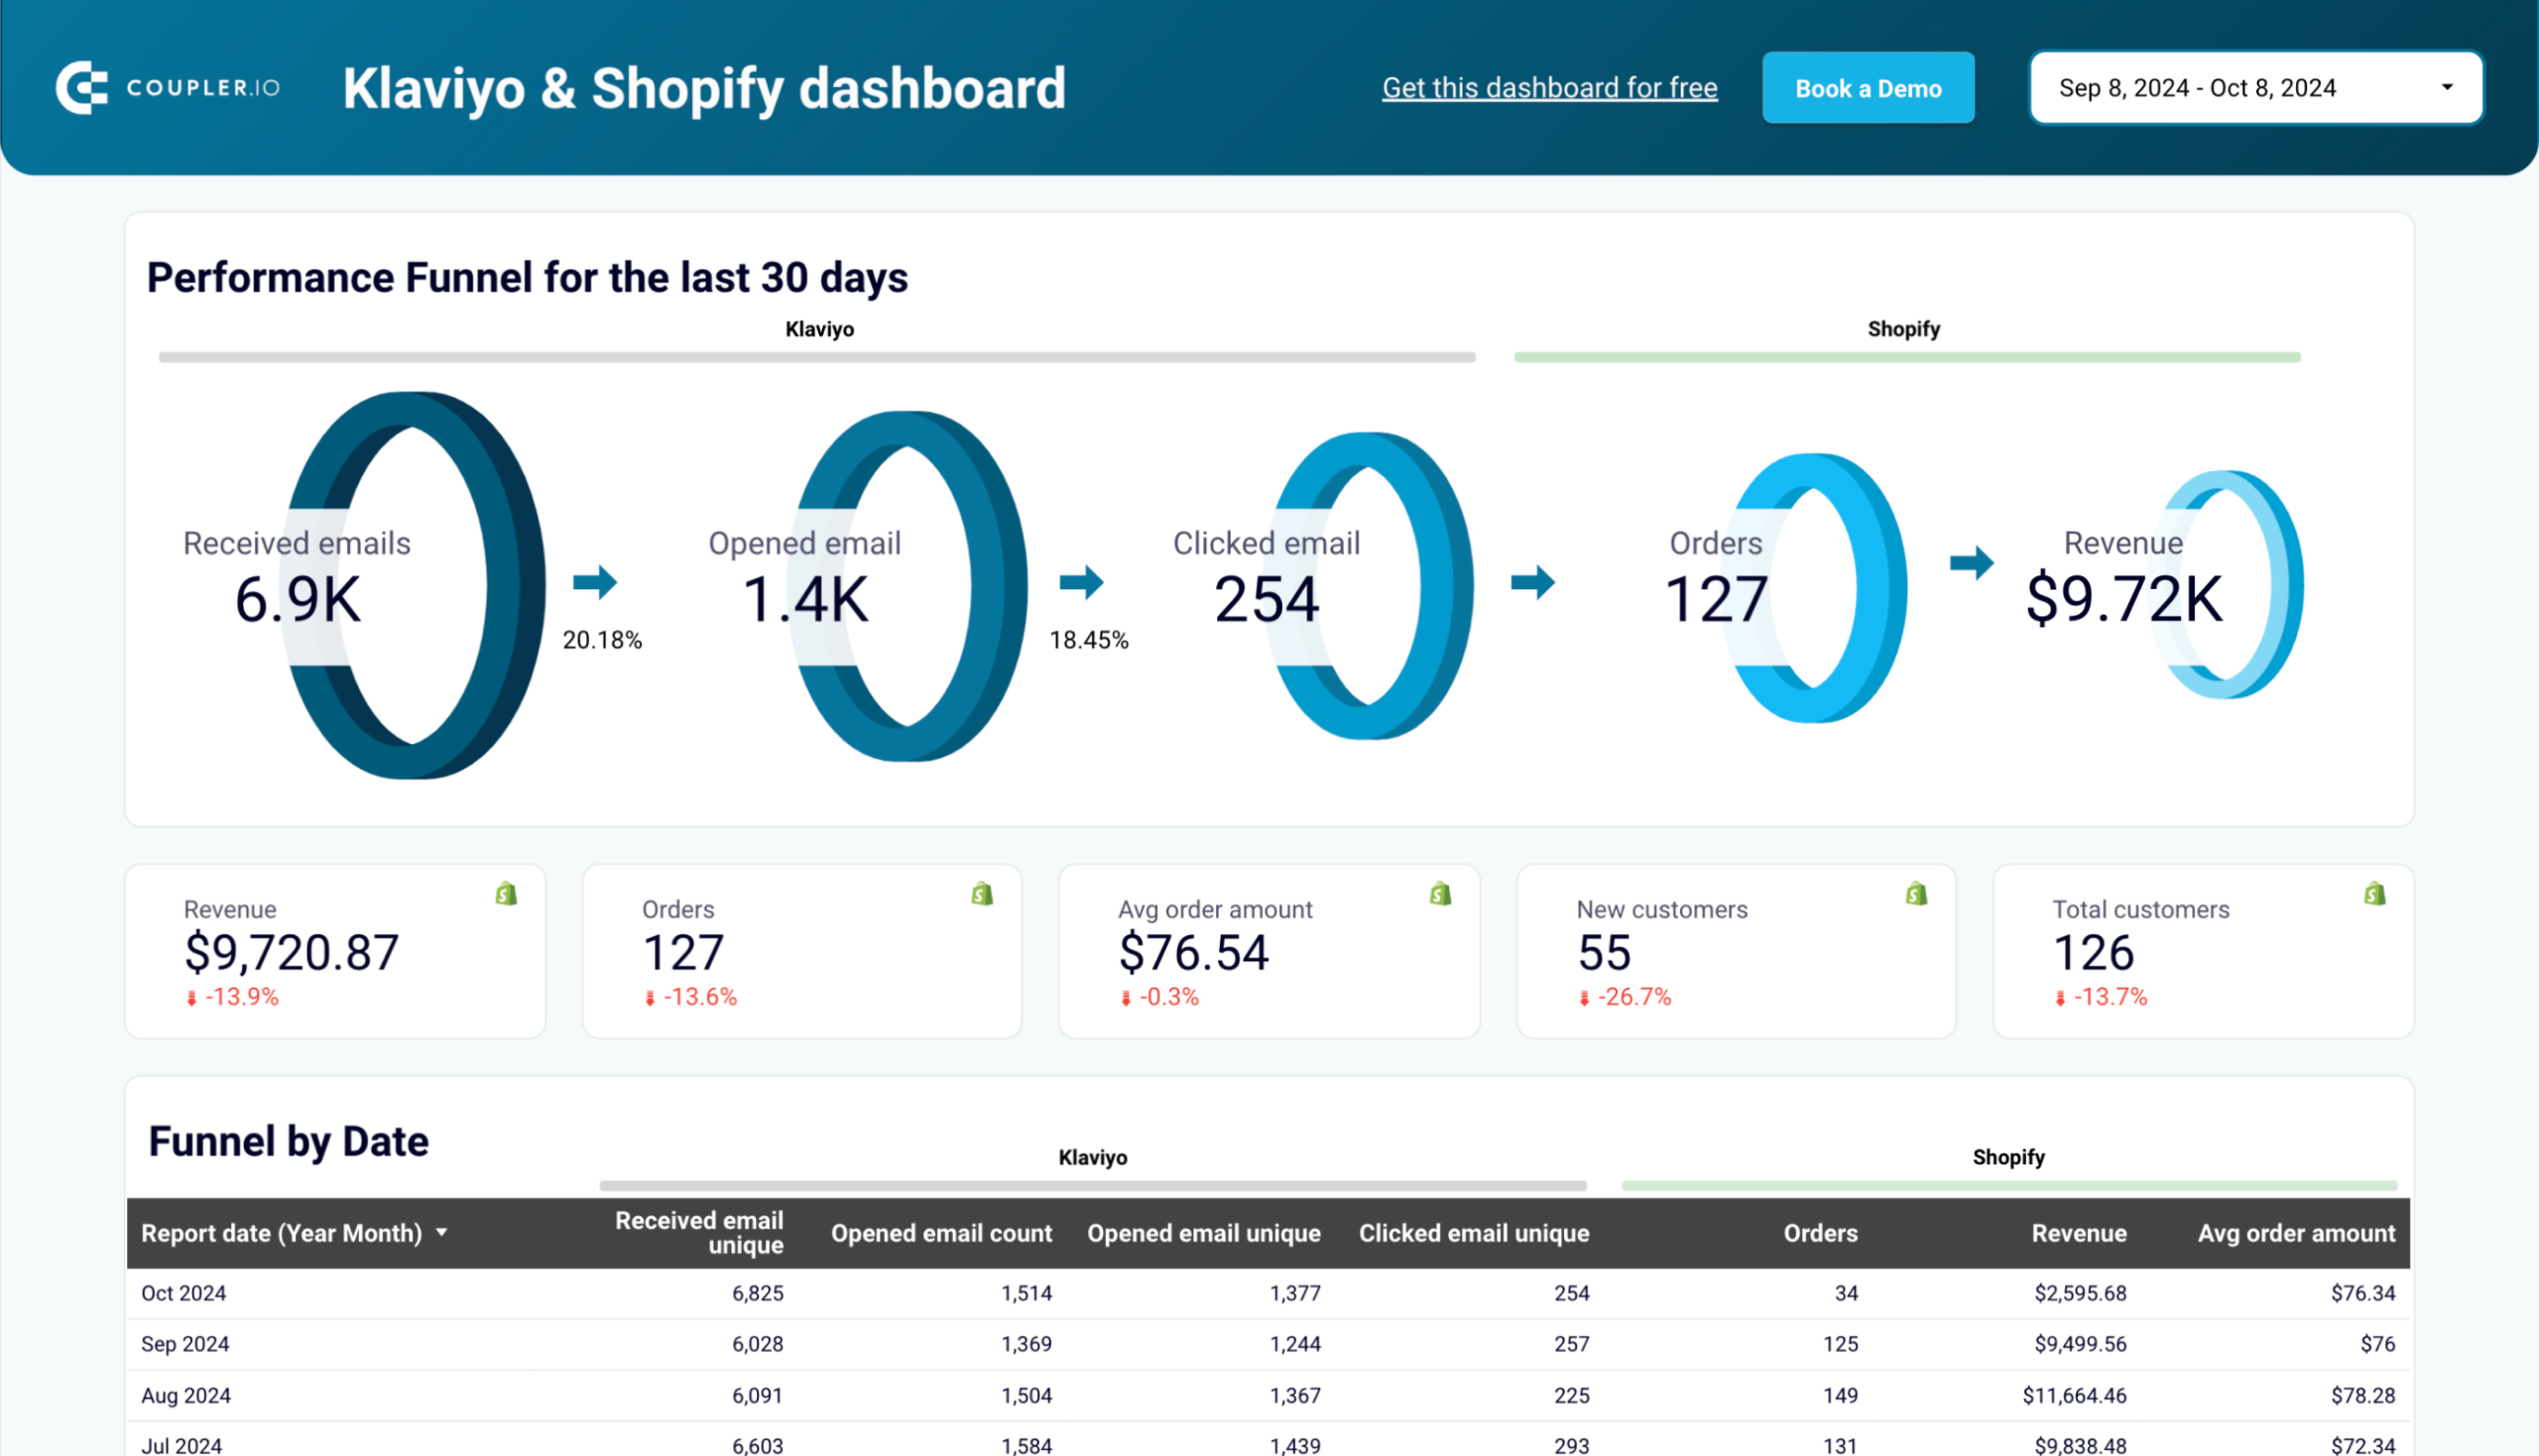
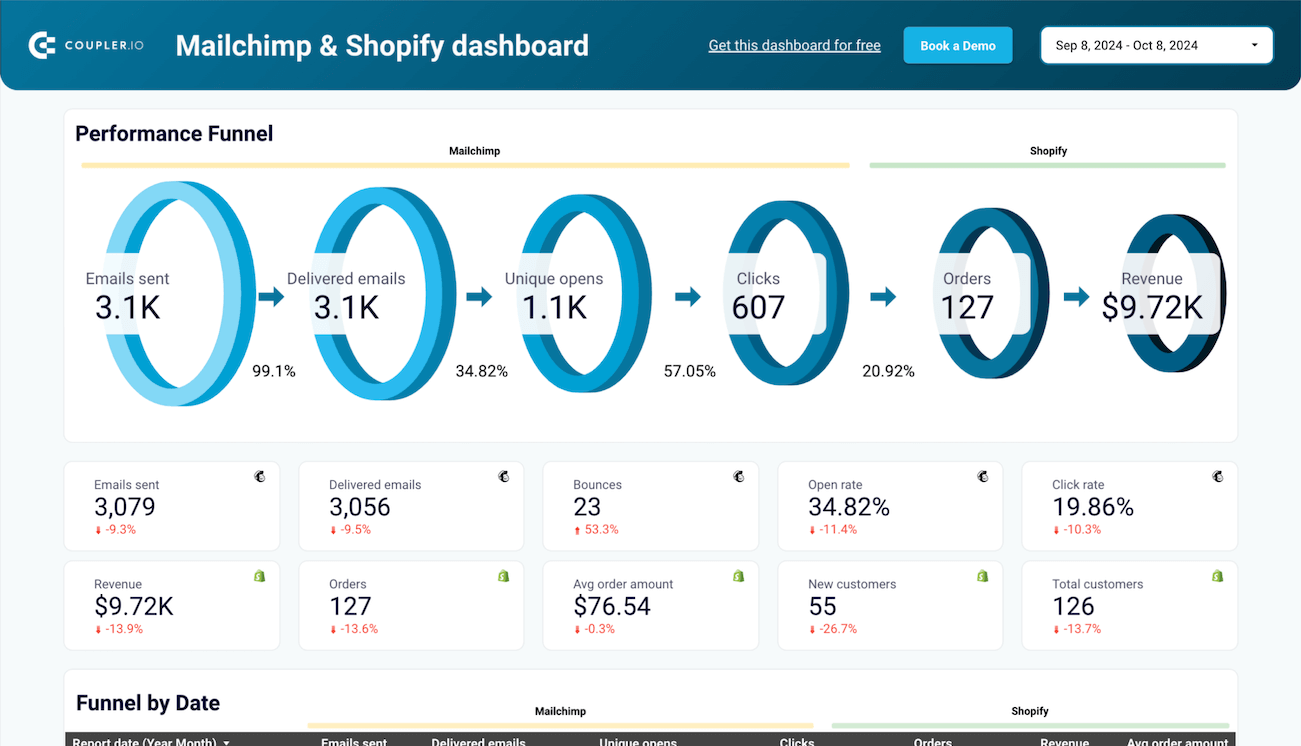
#19. Klaviyo email performance dashboard for WooCommerce/Shopify by Coupler.io
This dashboard is built for e-commerce teams who run Klaviyo campaigns for a WooCommerce or Shopify store and need to see how email activity connects to actual orders. It pulls data from both platforms to show the complete path from email delivery to completed purchases.
Klaviyo email performance dashboard for WooCommerce
 Preview dashboard
Klaviyo email performance dashboard for WooCommerce
Preview dashboardThe dashboard helps you answer questions that neither Klaviyo nor WooCommerce/Shopify can answer on their own: are high-click days actually producing revenue, or just traffic? Is there a delay between when people click and when they buy? Are bounces creeping up in a way that could hurt your sender reputation before the next big campaign? You can also use the day-of-week breakdown to schedule sends around the days your audience is most likely to open.
In addition to WooCommerce, Coupler.io also provides a Klaviyo dashboard for Shopify.


Dashboard metrics:
- Order total
- Average order value (AOV)
- Bounce rate
- Emails received
- Emails opened
- Emails clicked
- Orders
- Clicks to orders rate
- Open rate by day of week
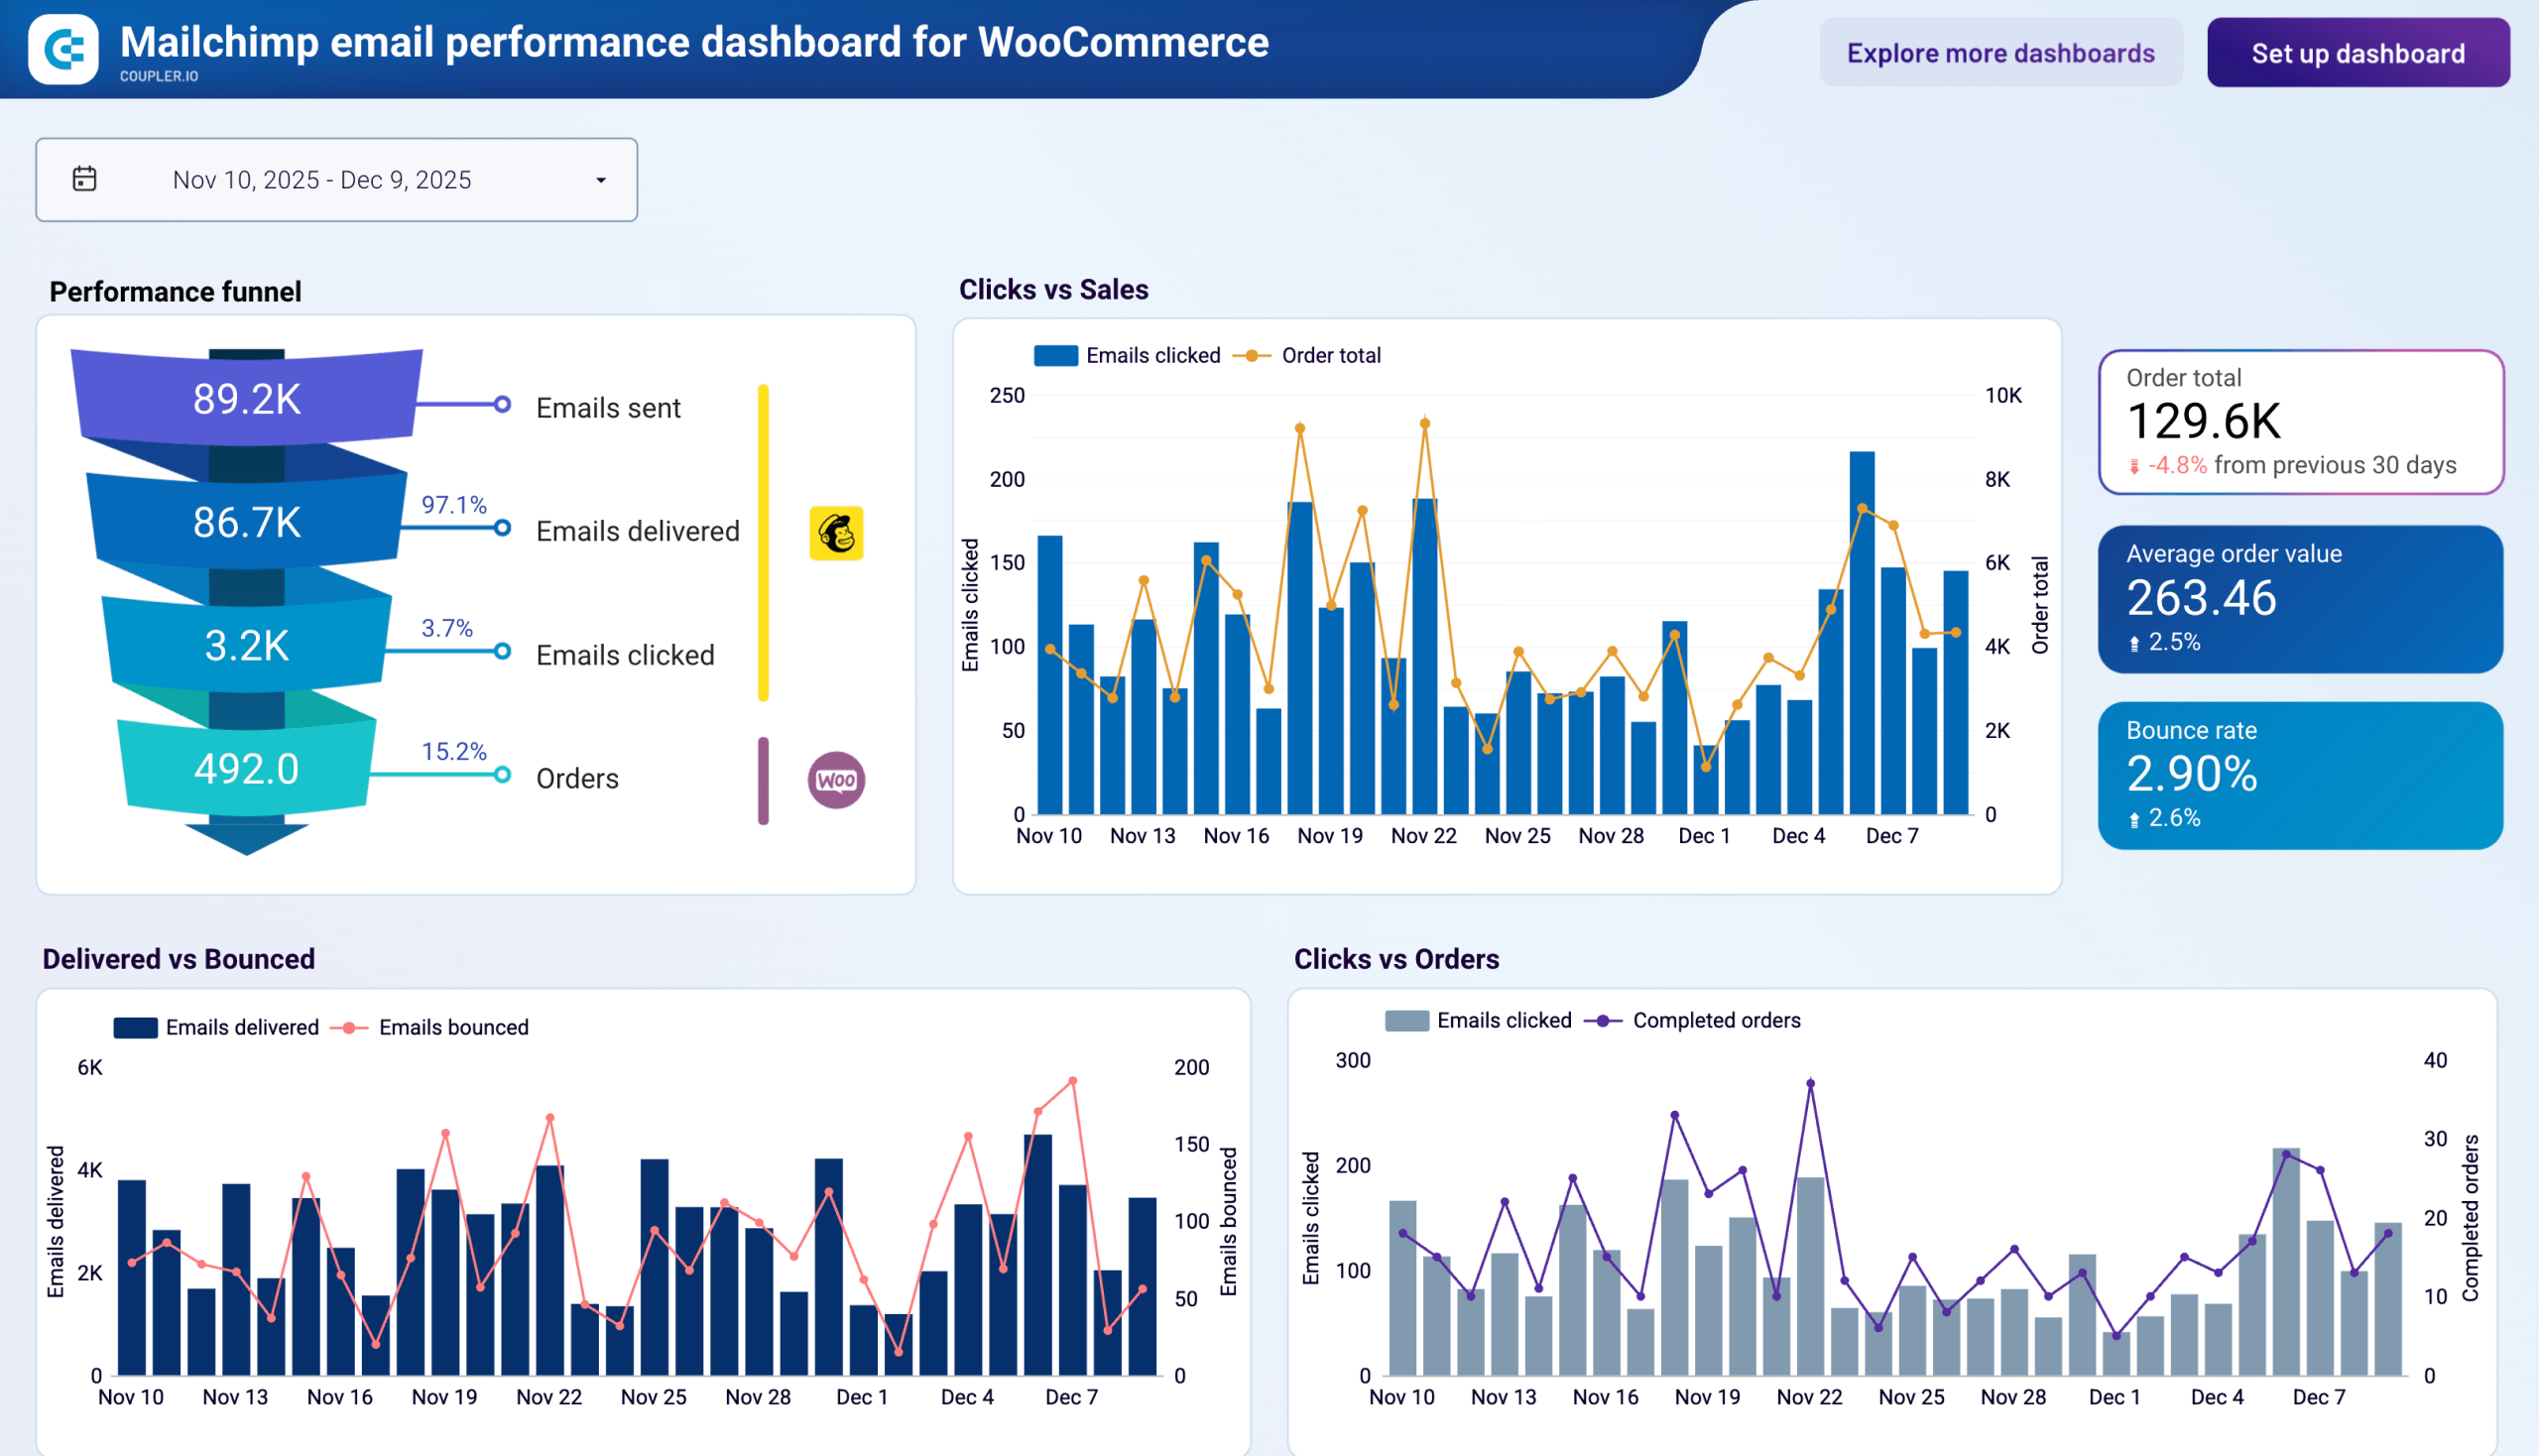
#20. Mailchimp email performance dashboard for WooCommerce/Shopify by Coupler.io
Similar to the Klaviyo template above, this dashboard connects Mailchimp with WooCommerce/Shopify to tie email engagement to store revenue. One key difference: because Mailchimp’s API handles open-rate data differently, this dashboard focuses on delivery health, click activity, and purchase outcomes — the metrics Mailchimp can attribute with confidence.
Mailchimp email performance dashboard for WooCommerce
 Preview dashboard
Mailchimp email performance dashboard for WooCommerce
Preview dashboardYou can use this template to find out whether your click-to-purchase conversion rate is steady or drifting, spot days of the week when clicked recipients are most likely to buy, and catch bounce rate increases before they trigger deliverability restrictions. It’s particularly useful for WooCommerce/Shopify store owners who want to move beyond Mailchimp’s native reporting and tie email performance directly to order data.
In addition to WooCommerce, Coupler.io also provides a Mailchimp dashboard for Shopify.

Dashboard metrics:
- Clicks to orders rate by day of week
- Order total
- Average order value (AOV)
- Bounce rate
- Emails sent
- Emails delivered
- Emails clicked
- Orders
- Clicks to orders rate
#21. MailerLite campaign performance dashboard by Coupler.io
MailerLite campaign performance dashboard gives email marketing managers a consolidated view of how their MailerLite campaigns perform across engagement, deliverability, and content. It connects to MailerLite and pulls campaign-level data covering everything from send to click.
MailerLite campaign performance dashboard
 Preview dashboard
MailerLite campaign performance dashboard
Preview dashboardYou can visualize the subscriber journey from send to click through a funnel chart and pinpoint where the largest drop-offs occur. The dashboard ranks your top campaigns by open rate and click rate, and compares performance across Regular, Resend, and A/B Split campaign types. A detailed campaign table flags deliverability issues like elevated bounce, spam, or unsubscribe rates that may harm sender reputation.
Dashboard metrics:
- CTOR
- Open rate
- Click rate
- Bounce rate
- Spam rate
- Unsubscribe rate
- Emails sent
- Emails delivered
- Emails opened
- Emails clicked
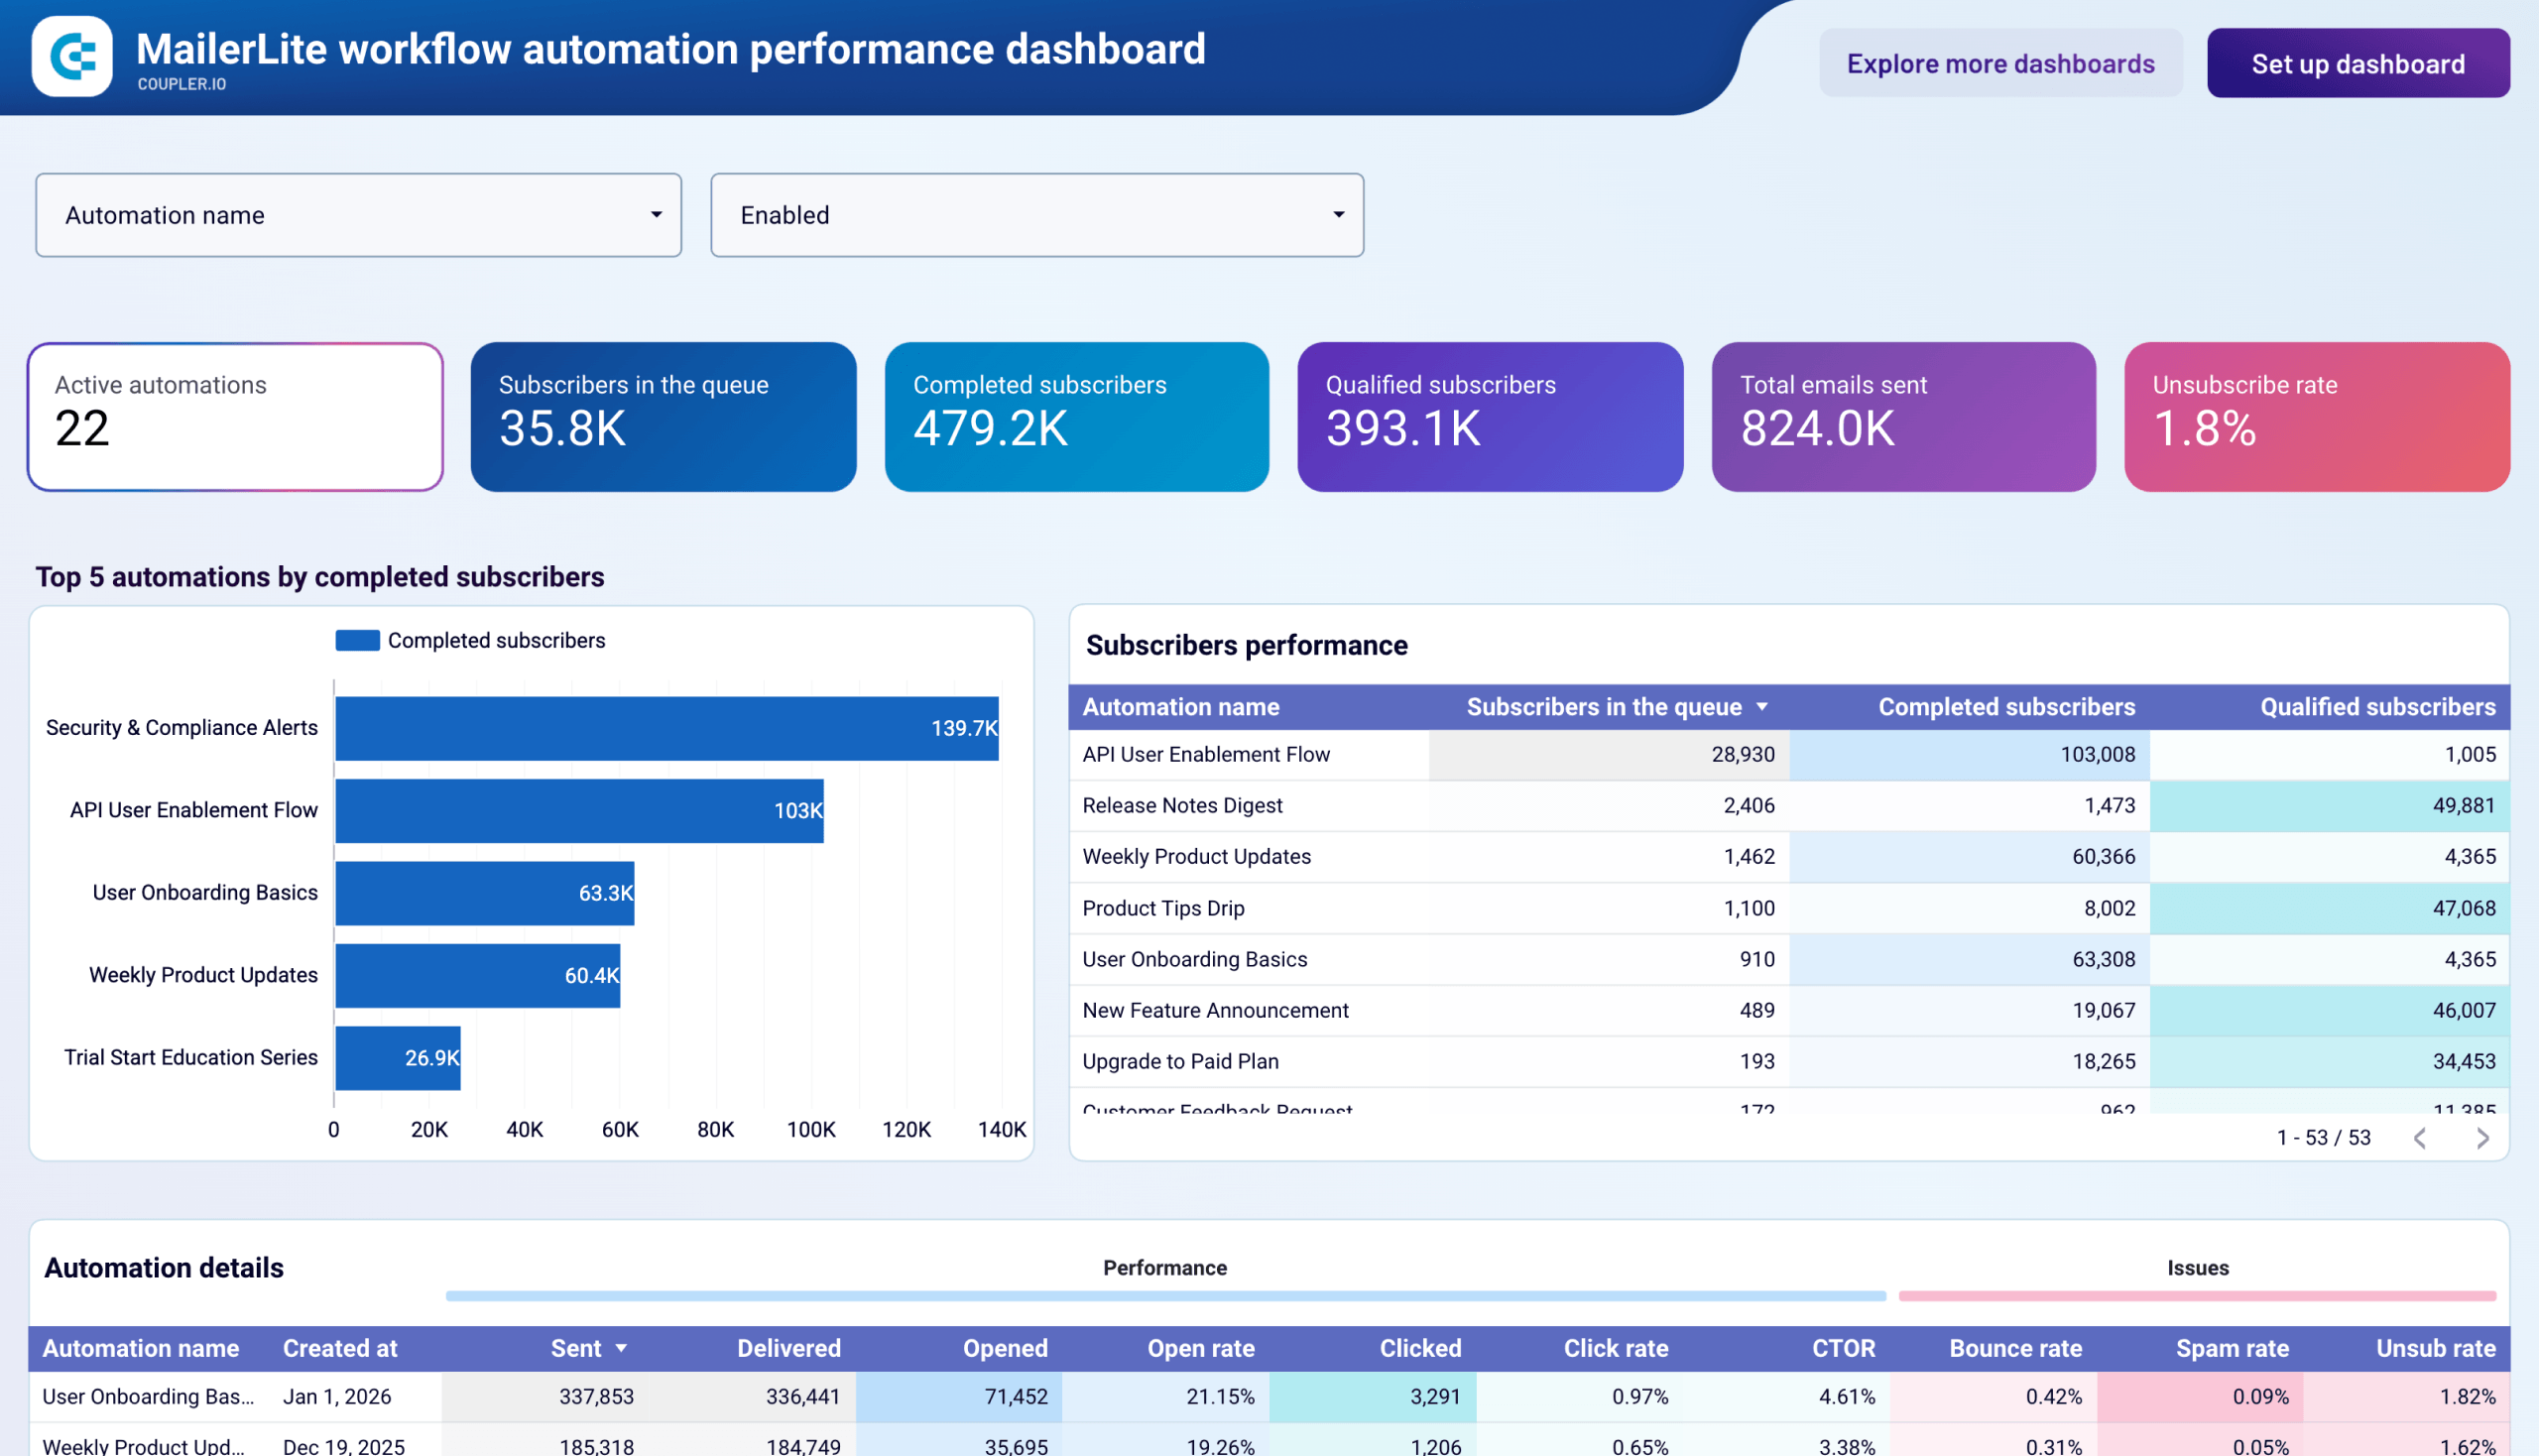
#22. MailerLite workflow automation performance dashboard by Coupler.io
This dashboard monitors the health and performance of all active MailerLite automation workflows in one place. It’s built for email marketing managers and marketing operations teams who manage multiple automated sequences.
MailerLite workflow automation performance dashboard
 Preview dashboard
MailerLite workflow automation performance dashboard
Preview dashboardYou can see how many subscribers are in queue, completed, or qualified across every automation, and identify workflows with high drop-off rates. The MailerLite workflow automation performance dashboard ranks your top automations by completed subscribers and flags sequences with delivery or engagement issues. Use the automation details table to audit open rate, click rate, CTOR, bounce rate, and spam rate for each workflow.
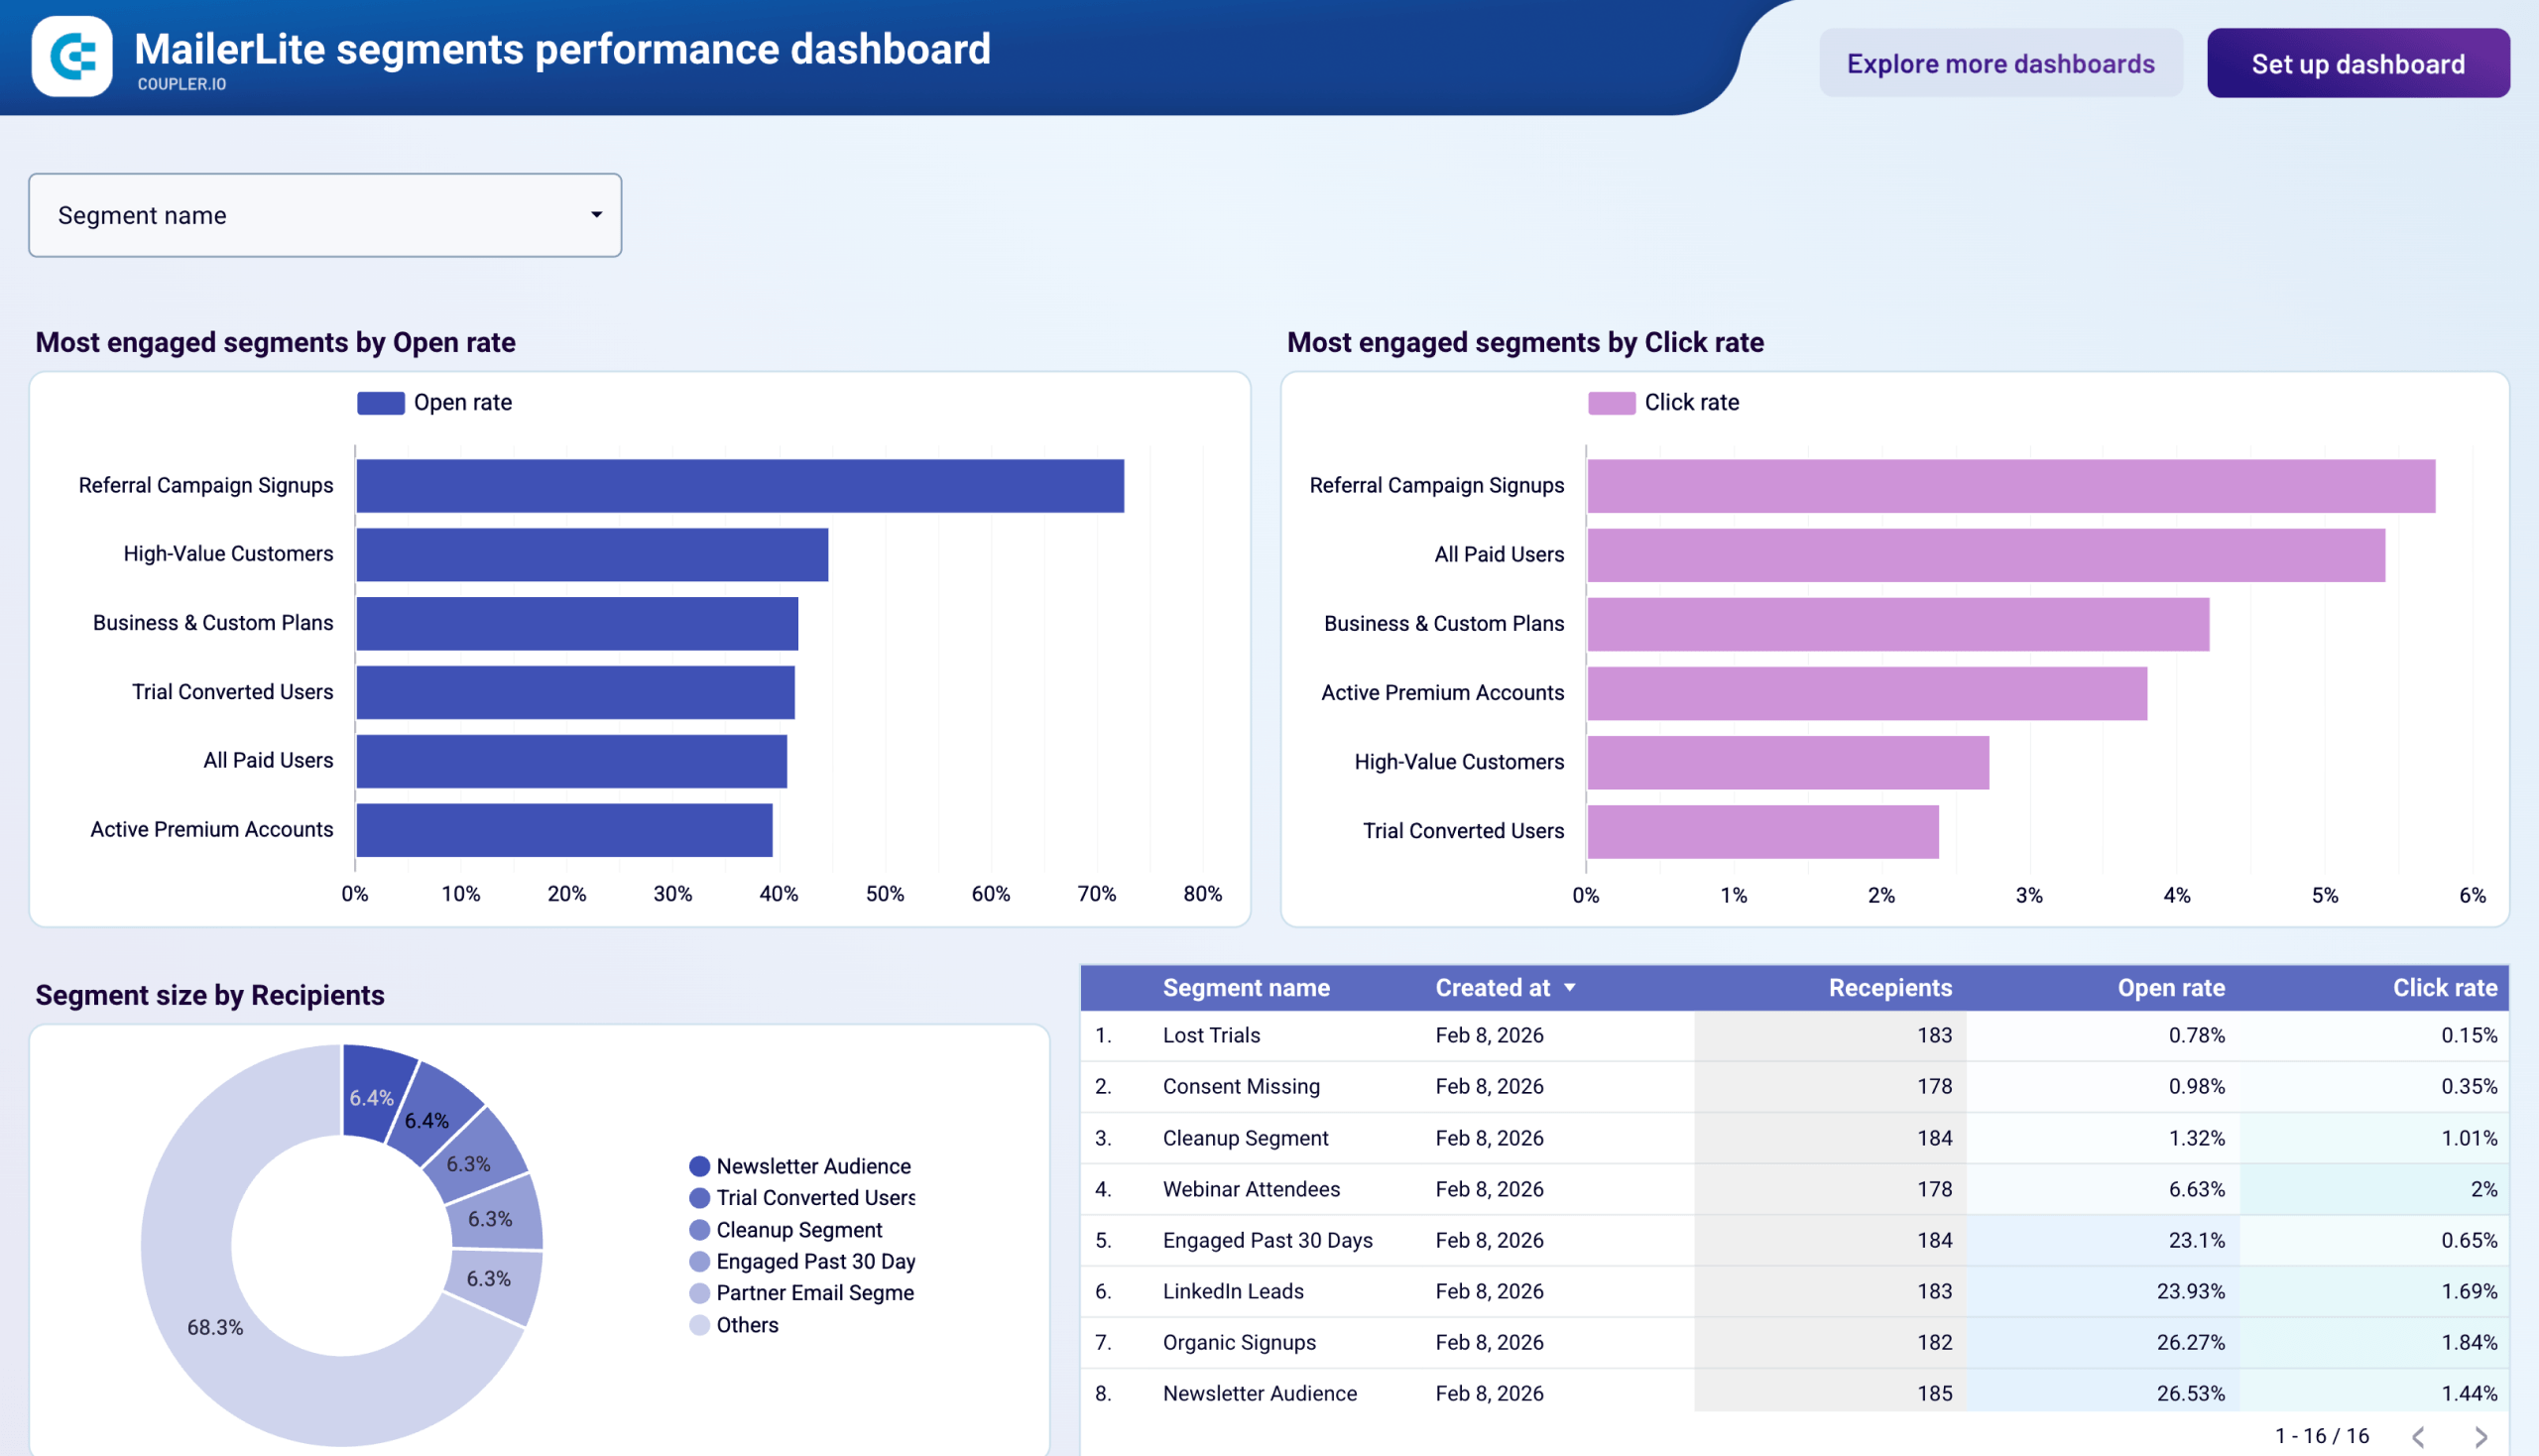
Coupler.io also offers a MailerLite segments performance dashboard that shows how different subscriber segments respond to your campaigns. It’s useful to identify which groups are most engaged and where list hygiene work is needed.
Dashboard metrics:
- Active automations
- Subscribers in queue
- Completed subscribers
- Qualified subscribers
- Total emails sent
- Unsubscribe rate
- Open rate
- Click rate
- CTOR
- Bounce rate
- Spam rate
Social media analytics Looker Studio dashboard examples
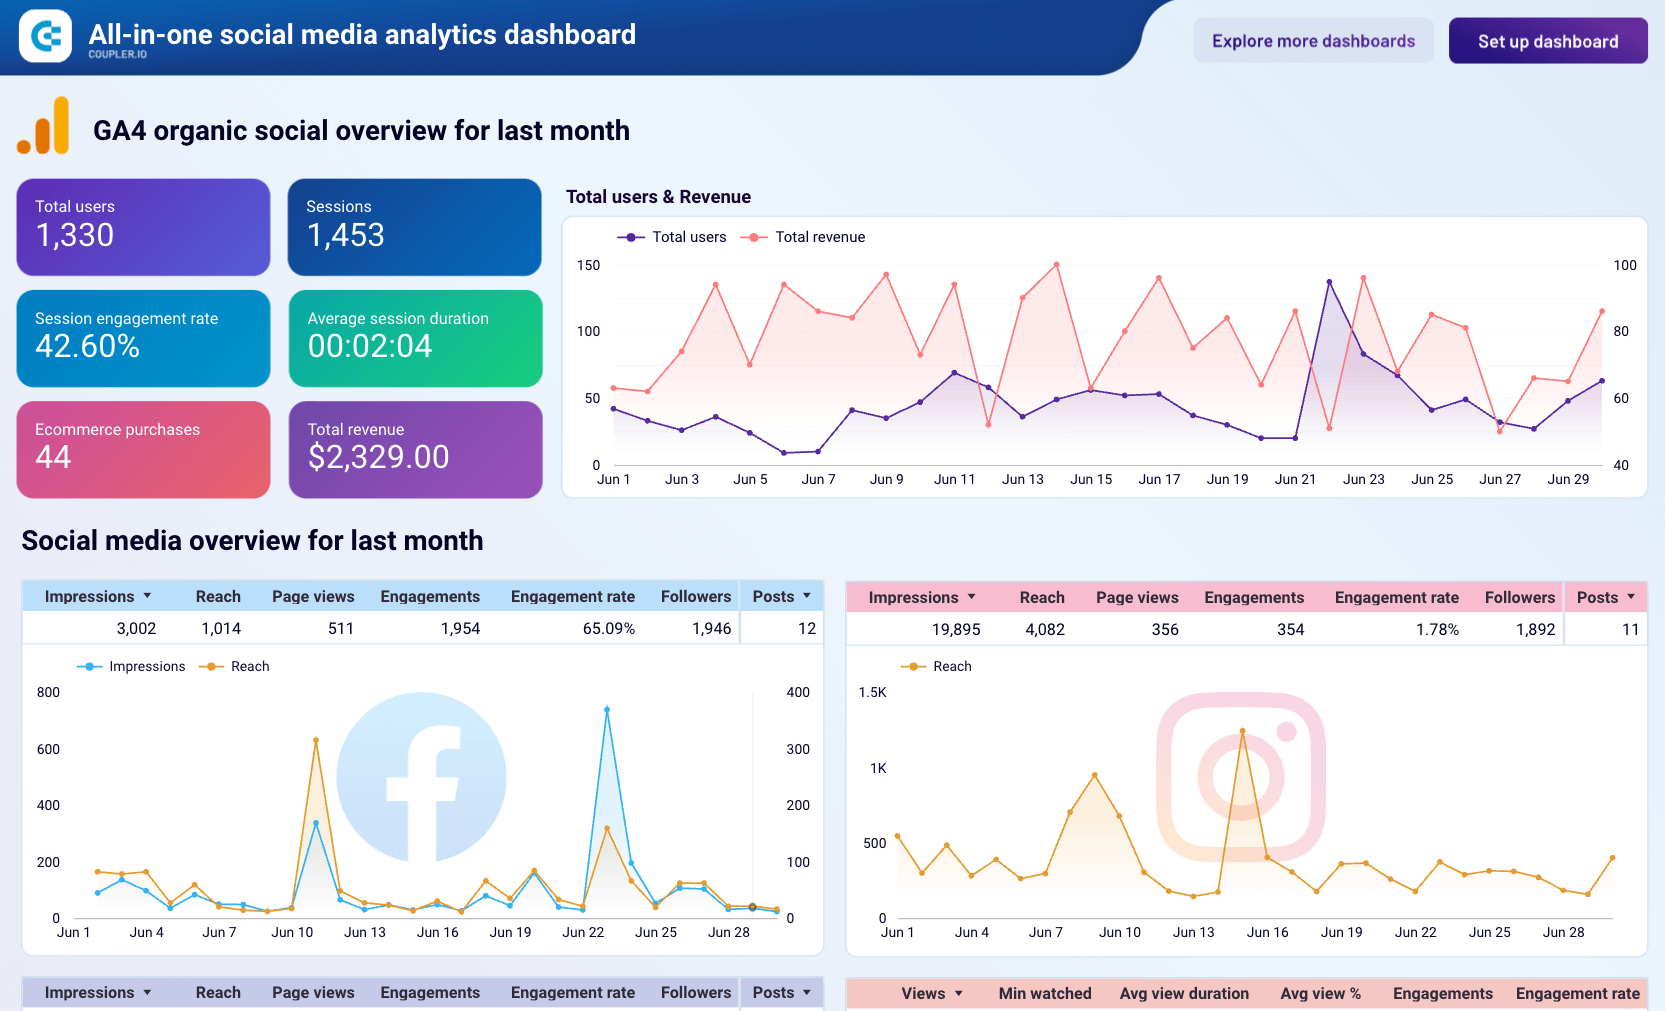
This all-in-one social media analytics dashboard centralizes your performance data from Facebook, Instagram, LinkedIn, and YouTube into a single Looker Studio report. It integrates with GA4 to show how your social media efforts translate into website traffic and business revenue. You can track the combined growth of your profiles, compare results, and identify the platforms (e.g., YouTube) that deliver the highest ROI for your team.
All-in-one social media analytics dashboard
 Preview dashboard
All-in-one social media analytics dashboard
Preview dashboardStart using this social media dashboard right away by connecting your accounts using the free Coupler.io partner connector. The dashboard will populate with your data and refresh on a customizable schedule, i.e., every 15 minutes, hour, day, etc.
Dashboard metrics:
- Total users
- Impressions, reach, engagements
- Page views, video views
- Engagement rate
- Followers
- Posts
- Total revenue, etc.
#24. Instagram business dashboard for SMM reporting by Coupler.io
Here is one of the solid social media dashboard examples by Coupler.io. This template is designed for the Instagram social media platform. It allows you to get an overview of your Instagram posts’ performance in one place. This Looker Studio dashboard works well for analytics and reporting since you can easily share insights with the stakeholders.
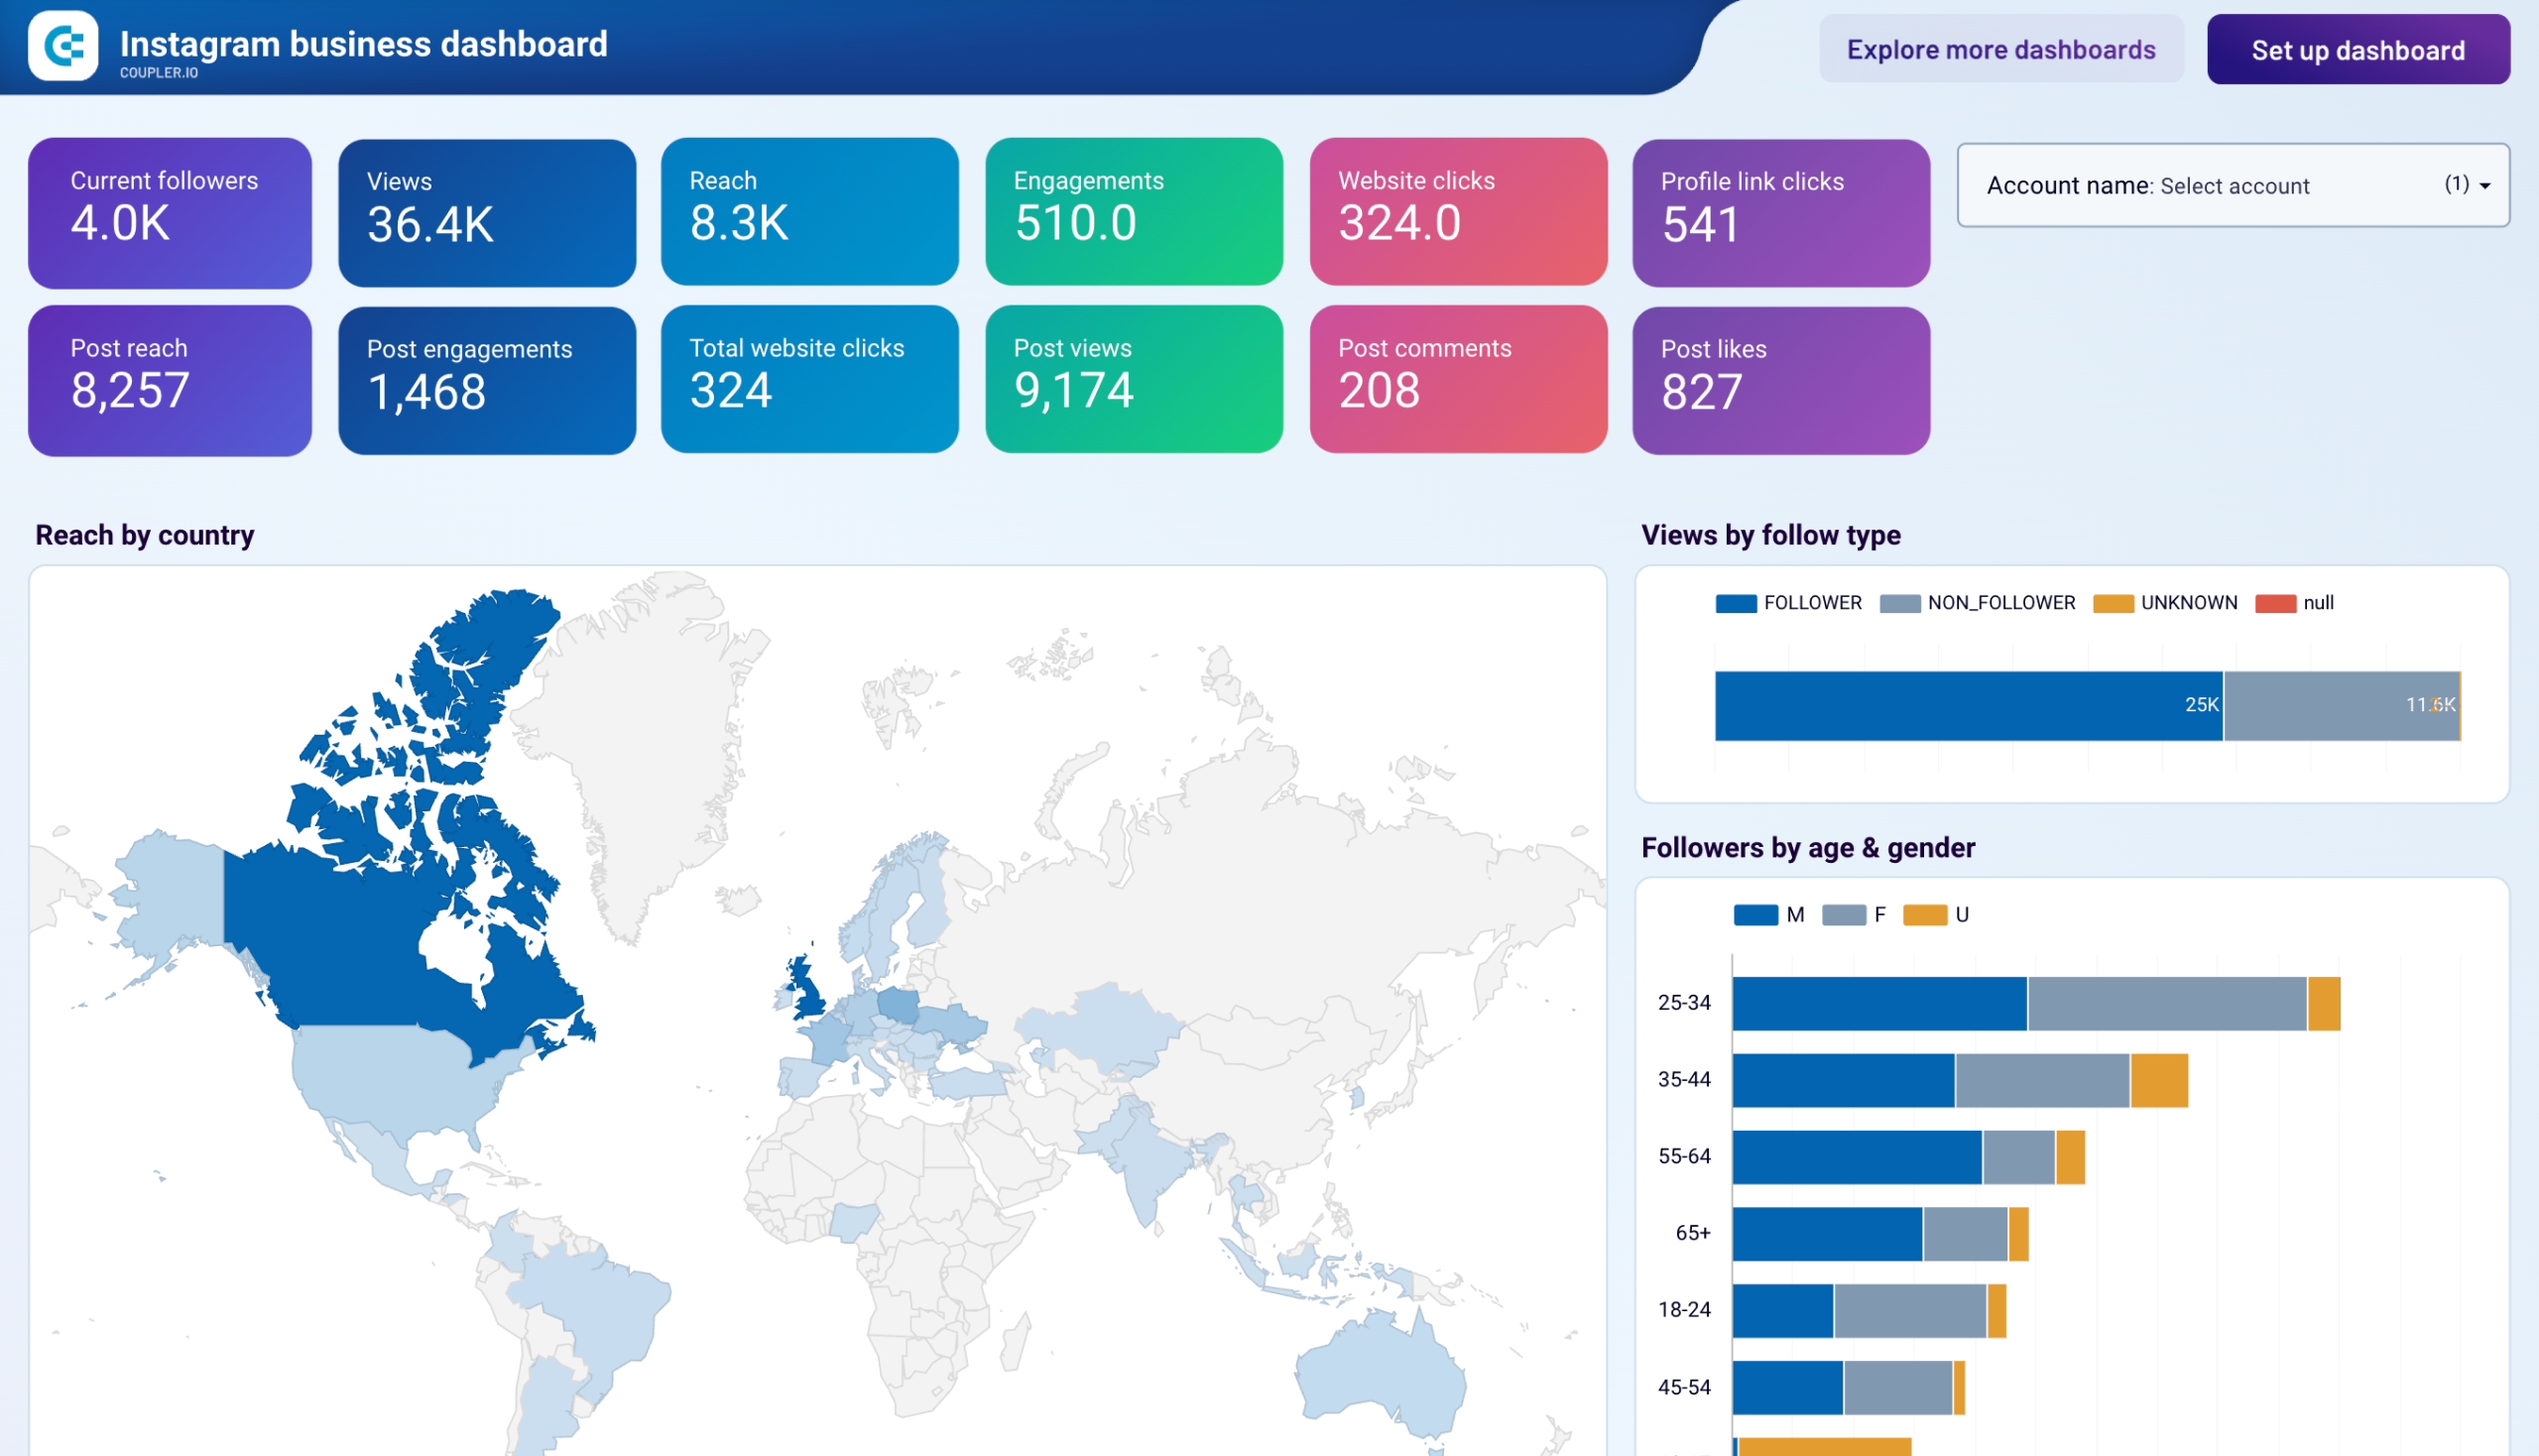
You can start using the Instagram dashboard right away by simply connecting your Instagram account using the Coupler.io partner connector. It will populate the dashboard with your data and will refresh it every day. If you want to choose another refresh interval, feel free to change the schedule in the settings.
Dashboard metrics:
- Followers
- Reach
- Views
- Post engagements
- Likes
- Comments
- Shares
- Saves
- Website clicks
- Profile link clicks
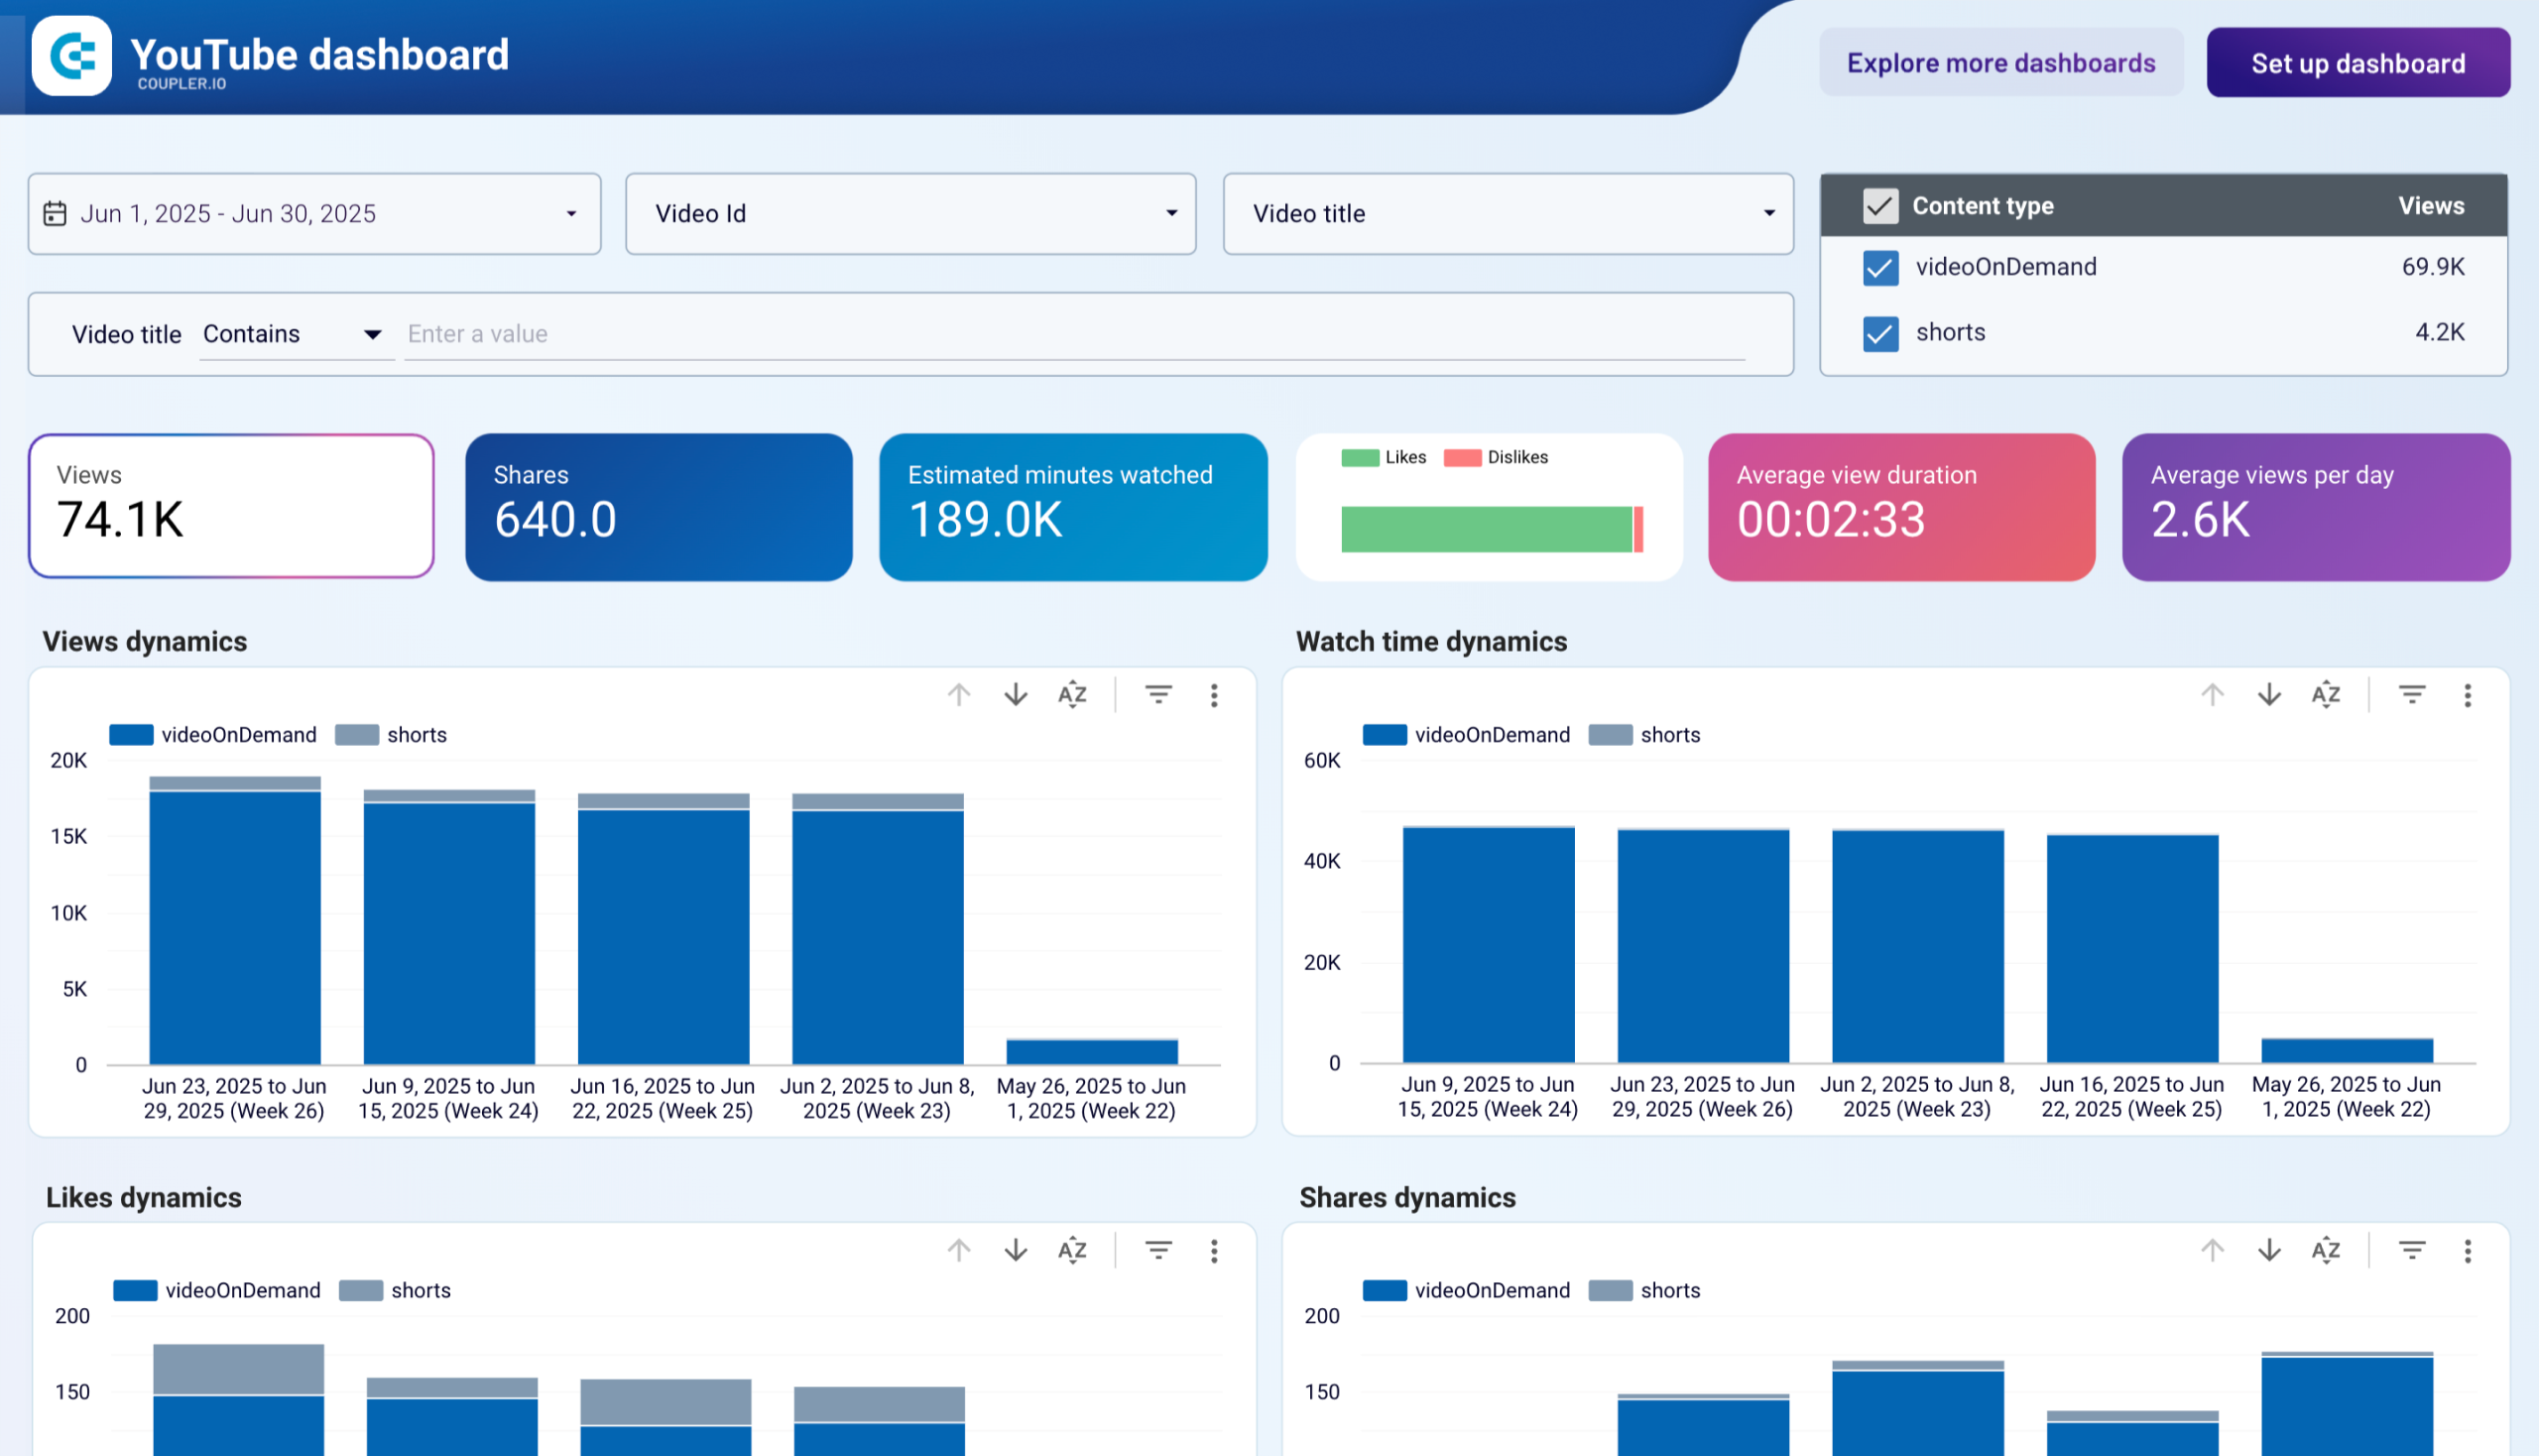
#25. YouTube channel overview dashboard by Coupler.io
The YouTube dashboard provides insightful information about video performance, viewer engagement, and content strategy. With an intuitive interface and user-friendly design, this Looker Studio YouTube template lets users track critical metrics and quickly understand how viewers discover and interact with their videos.
YouTube channel overview dashboard
 Preview dashboard
YouTube channel overview dashboard
Preview dashboardYouTube channel overview lets users look at essential aspects such as audience demographics, playback locations, channel performance, and subscriber growth in one go. YouTubers can identify trends, assess content performance, and refine their strategy by analyzing these metrics.
Dashboard metrics:
- Views
- Likes/dislikes
- Shares
- Average view duration
- Average views per day
- Subscribers gained/lost, etc.
#26. TikTok analytics dashboard by Coupler.io
This template is one of Coupler.io’s influencer dashboards that lets you monitor and analyze organic content performance on TikTok. It provides an overview of likes, new followers, views, and other essential metrics. The dashboard also shows your audience composition by gender and top countries by views.
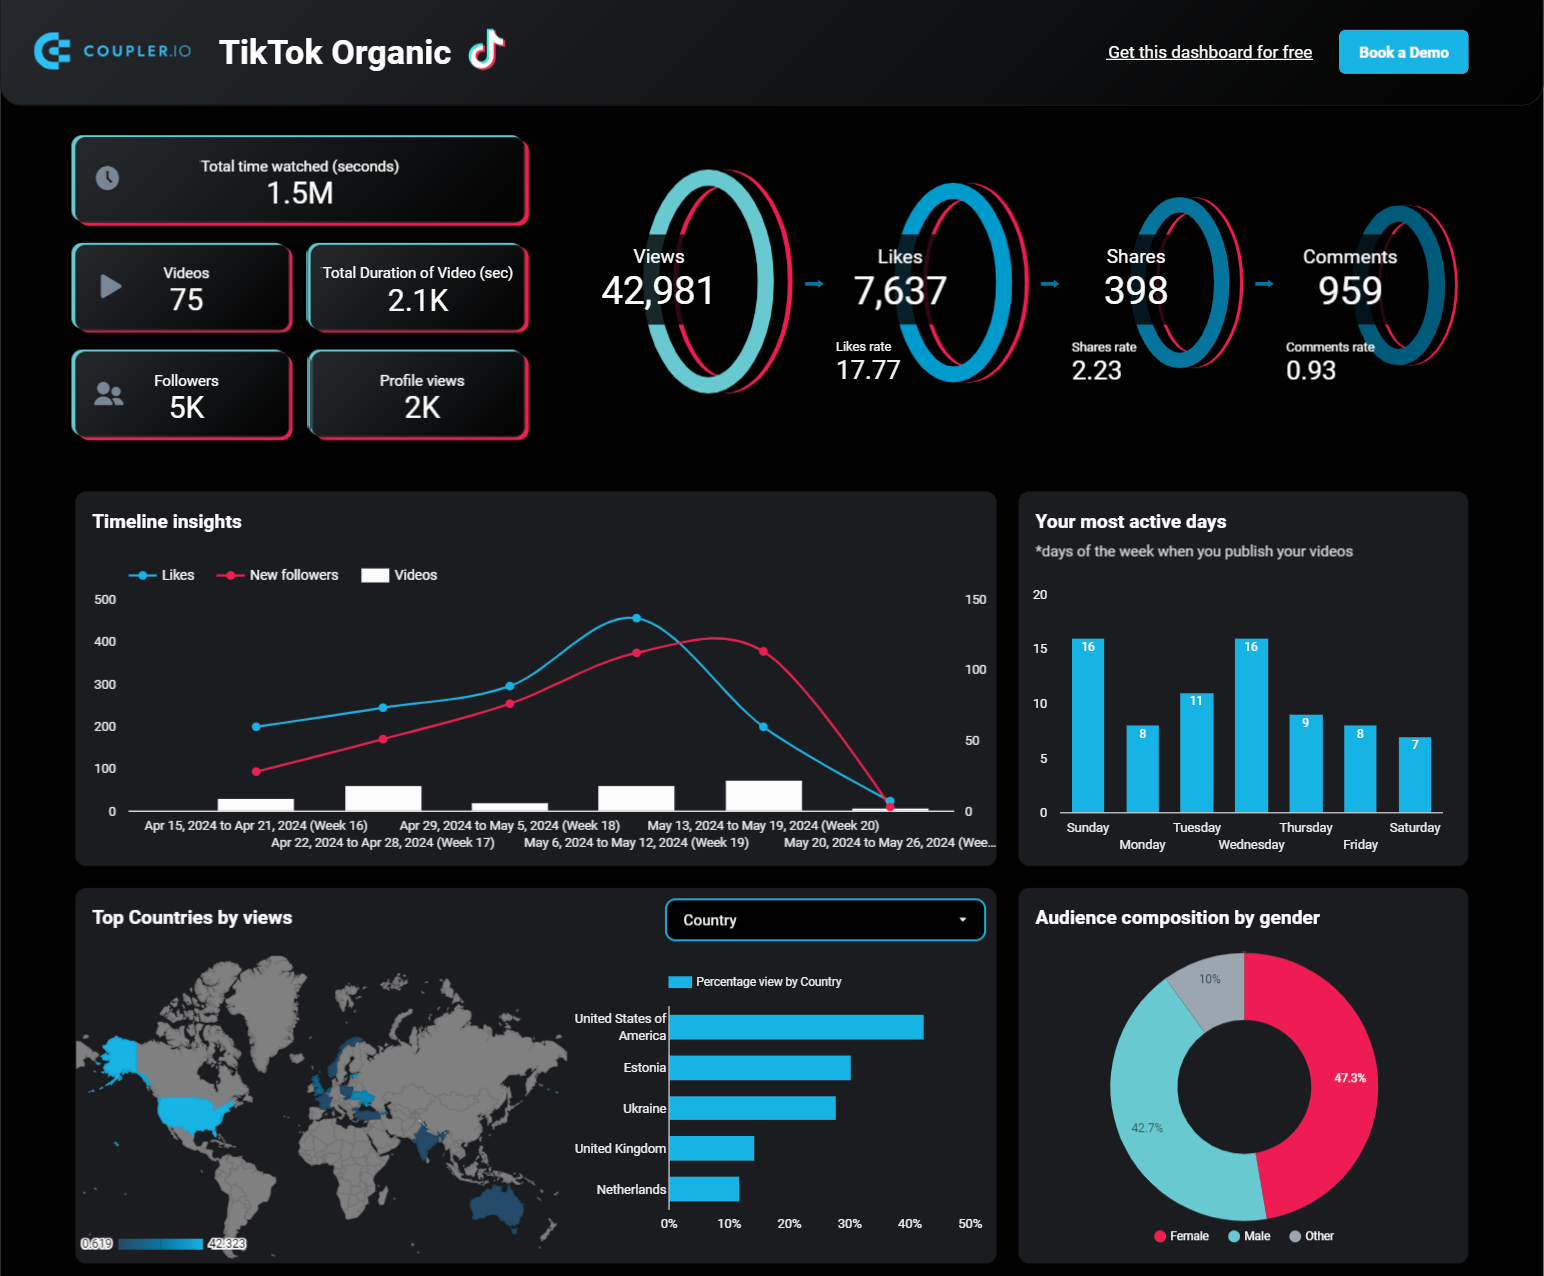
You will also get a breakdown of your video performance by views, likes, shares, and comments. To start using the dashboard template, you only need to connect it to your TikTok account using the built-in Coupler.io connector.
Dashboard metrics:
- Total time watched
- Videos
- Total duration of videos
- Followers
- Profile views
- Views
- Likes
- Shares
- Comments
SEO and web analytics dashboards
#27. Web analytics dashboard by Coupler.io
The web analytics dashboard provides insights into how users find your website and what they do when they get there.
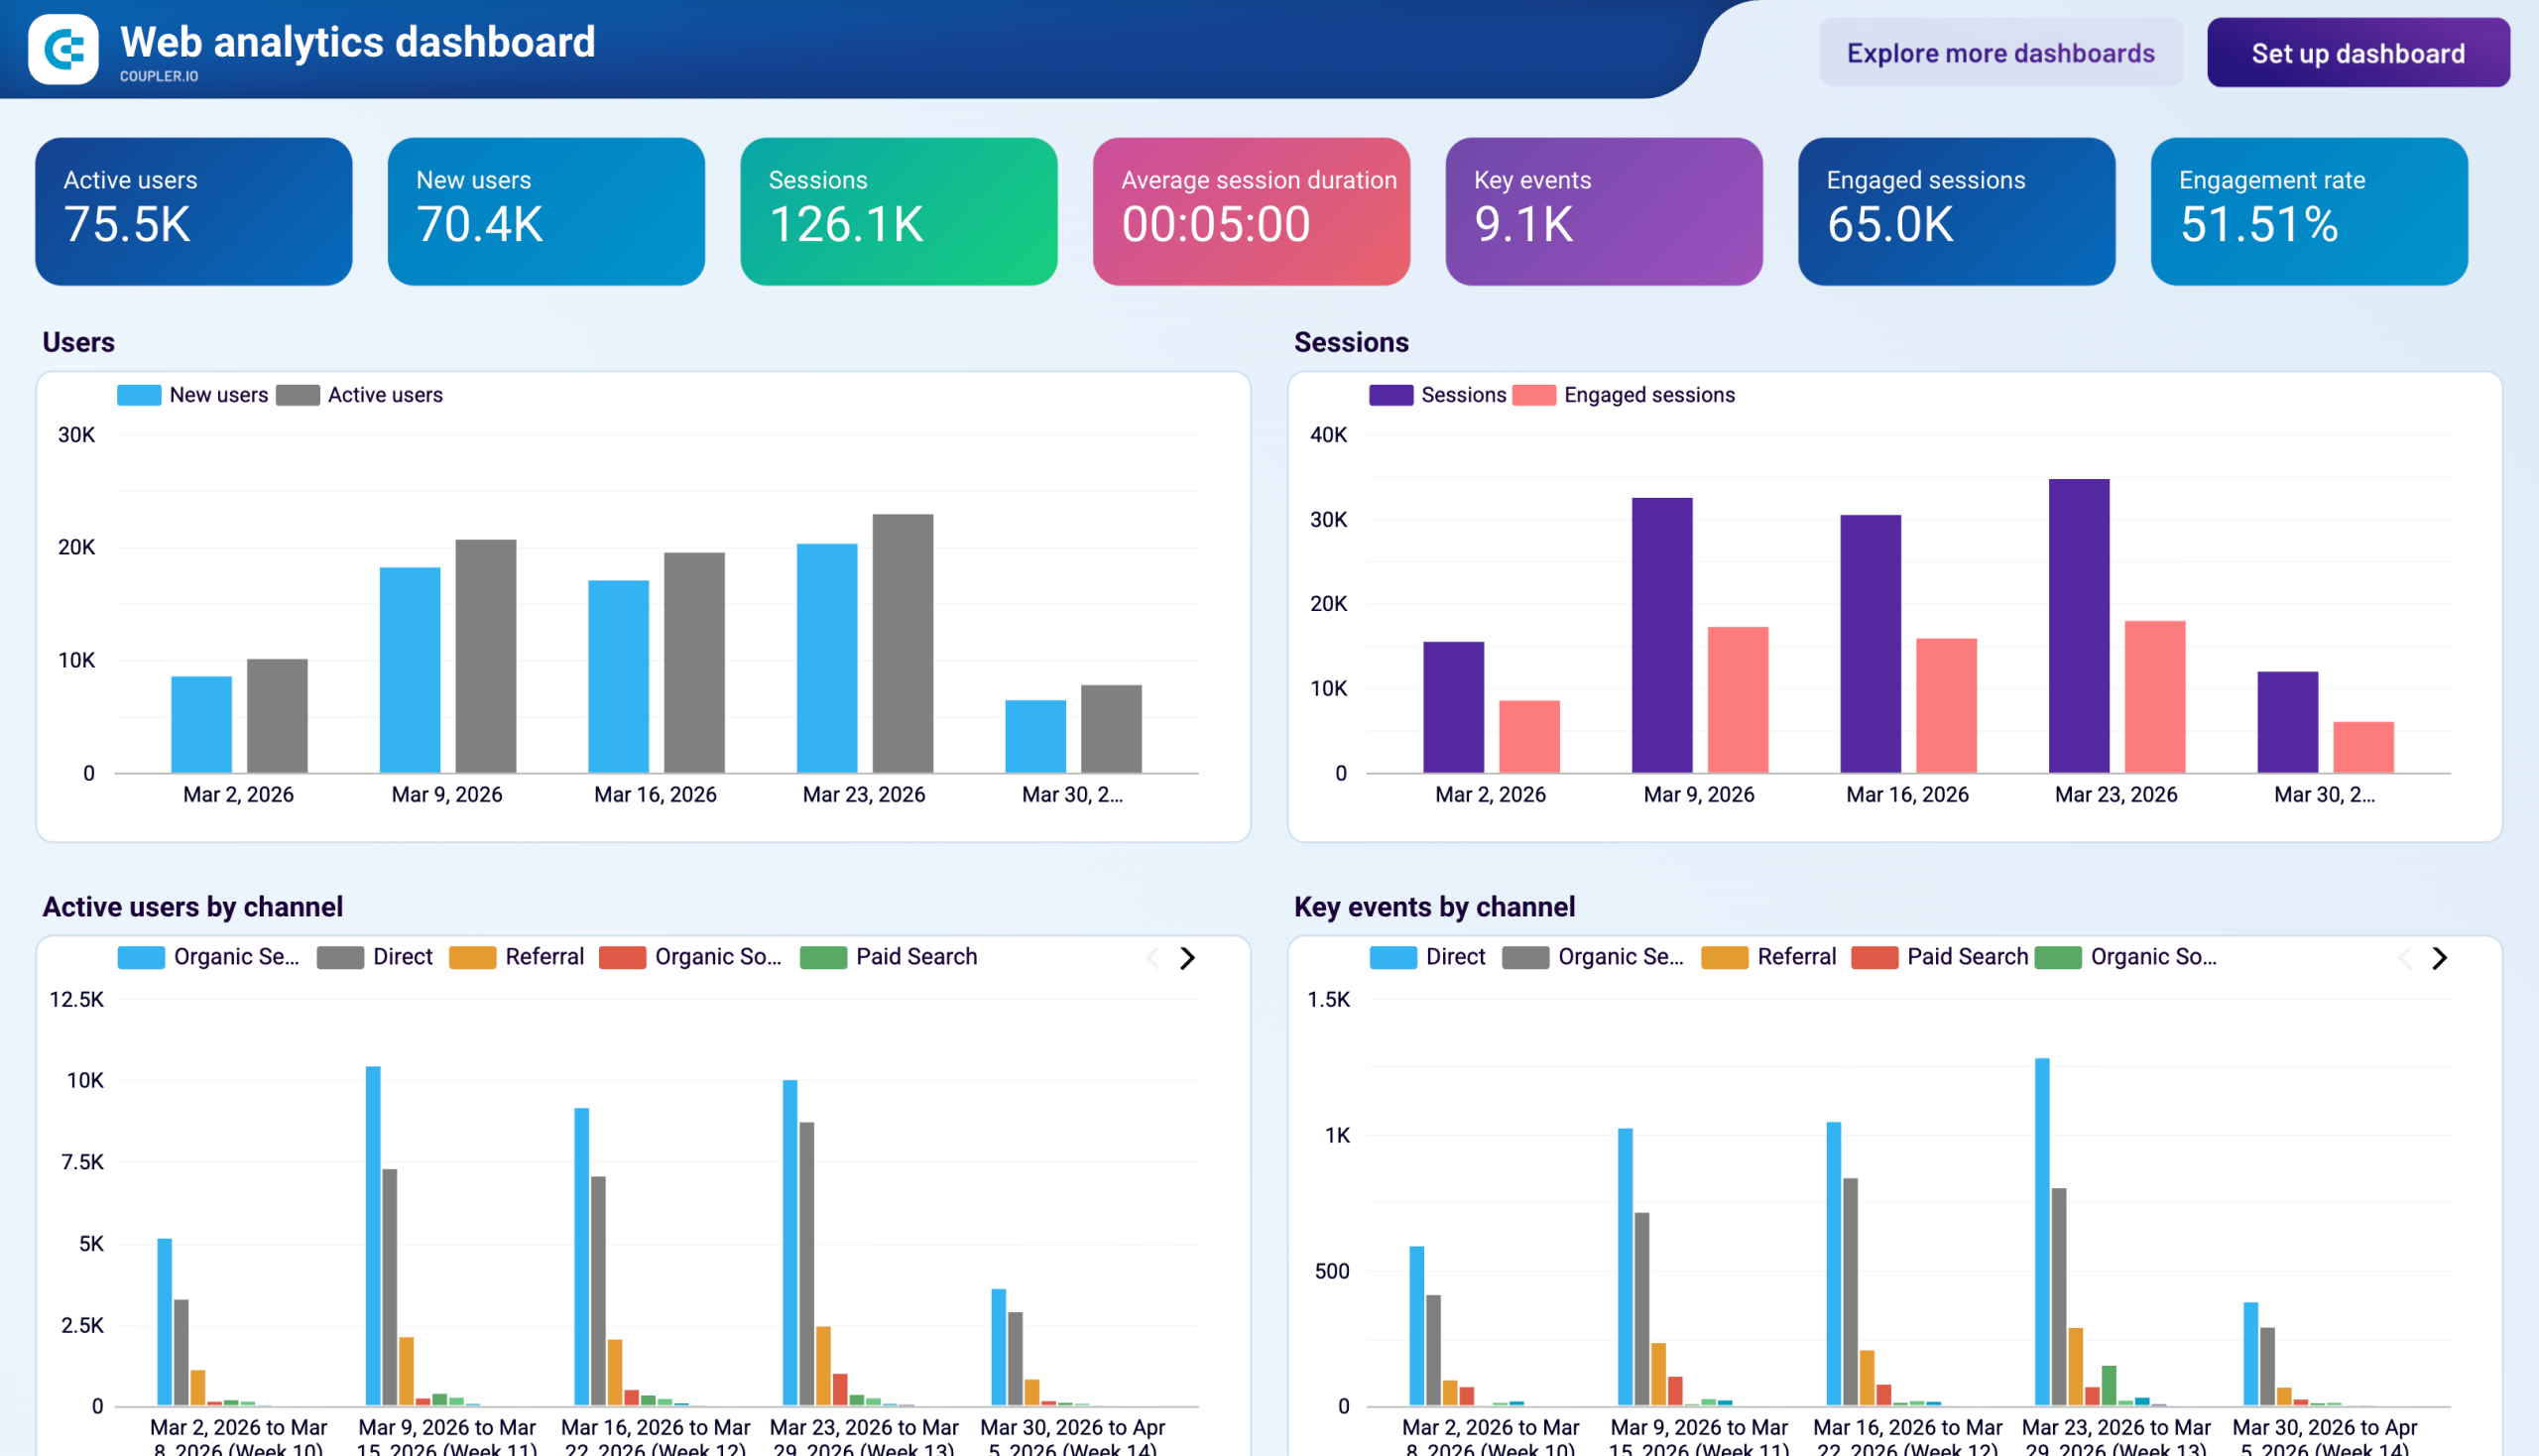
The source for these insights is Google Analytics. The dashboard collects data automatically thanks to the built-in connector by Coupler.io. As a result, you can better understand how people interact with your website and make changes to improve it.
With our web analytics dashboard, you no longer need to generate reports in GA4. You already have access to this data on your dashboard, which refreshes the information automatically.
Dashboard metrics:
- Active users
- New users
- Sessions
- Average session duration
- Key events
- Engaged sessions
- Engagement rate
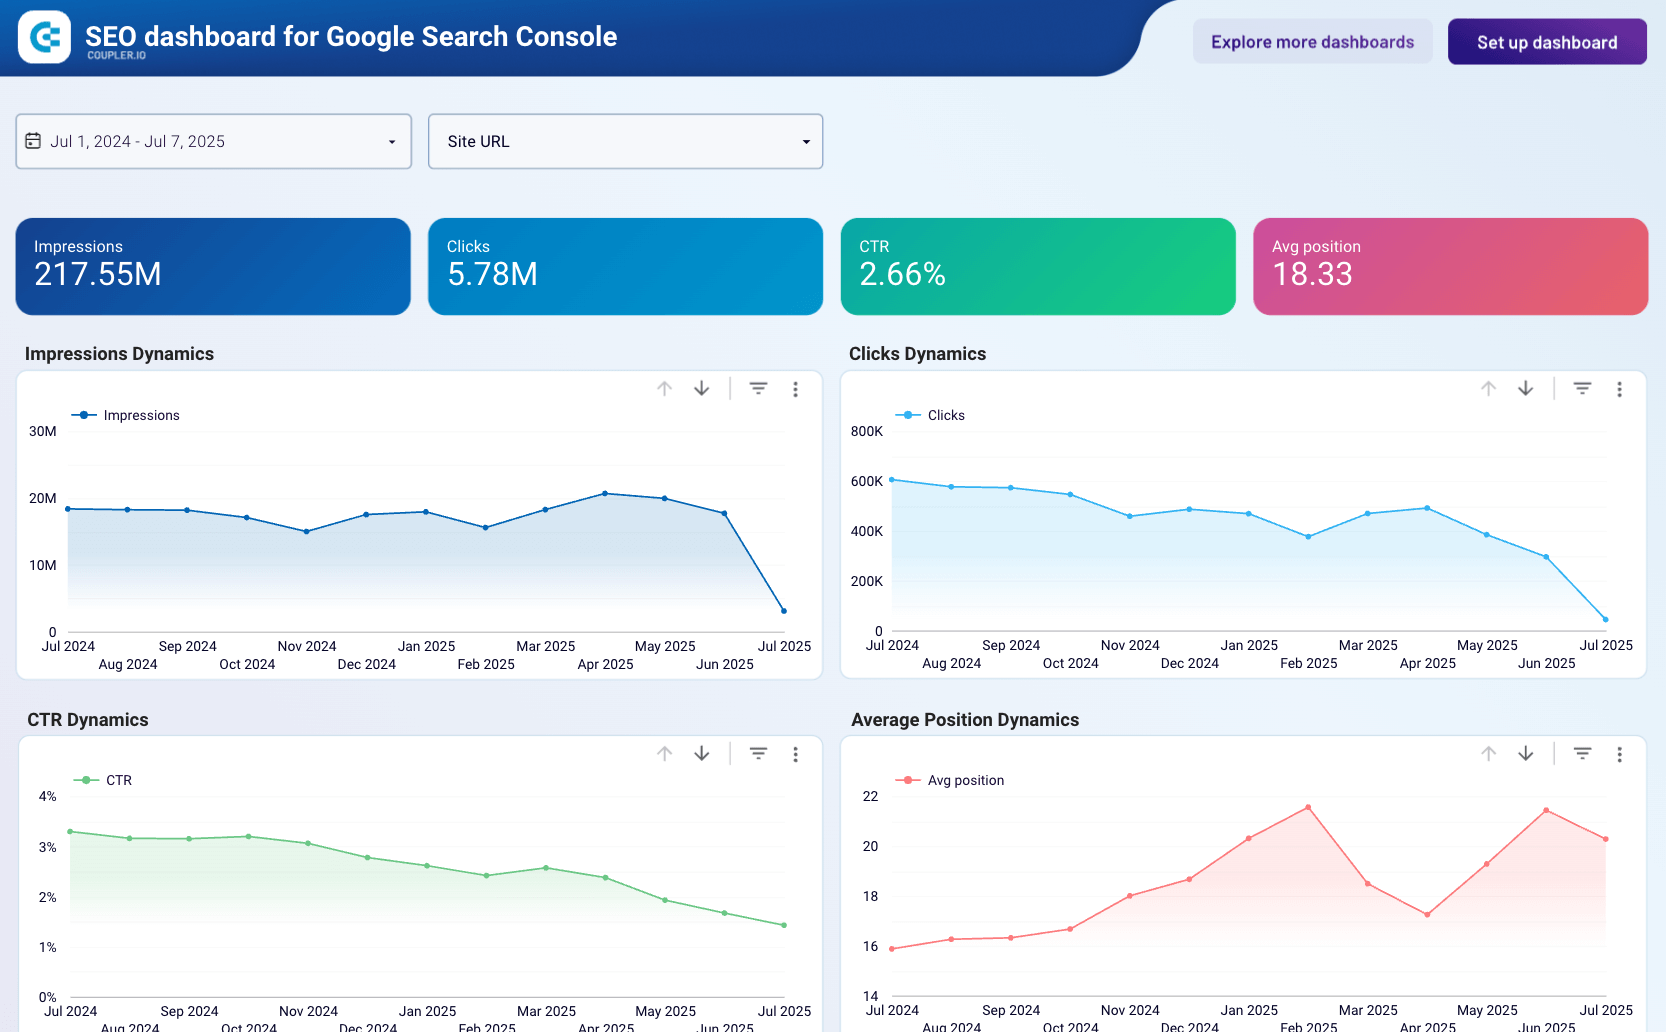
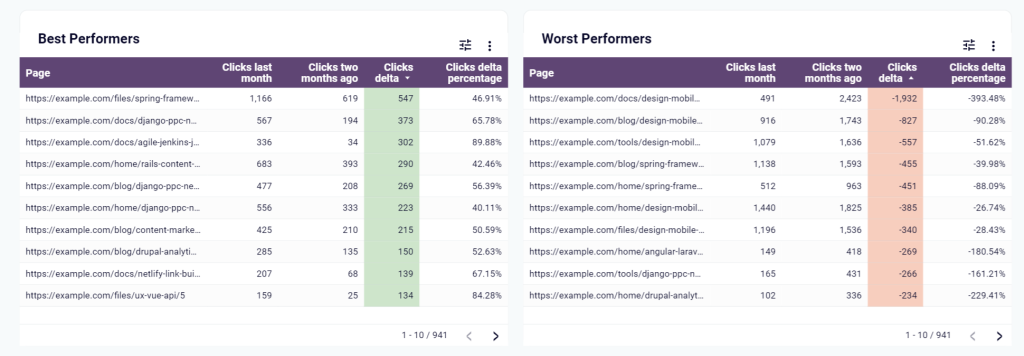
#28. SEO dashboard for Google Search Console by Coupler.io
Now, let’s move to the next dashboard in our collection of Looker Studio templates. If you use Google Search Console on a daily basis then this SEO dashboard by Coupler.io should be on your preference list. It’s equipped with a built-in GSC connector that will refresh data on your dashboard as frequently as you want (up to every 15 minutes).
SEO dashboard for Google Search Console
 Preview dashboard
SEO dashboard for Google Search Console
Preview dashboardThe SEO dashboard template allows you to track the number of indexed pages, pages with clicks, impressions, and other valuable metrics. It also displays the best and worst performing URLs – this is the information that you won’t find in the Google Search Console as is. Check out the dashboard and explore other actionable charts and graphs on it.
Dashboard metrics:
- Indexed pages
- Pages with clicks
- Impressions
- Clicks, CTR
- Average position
- Click dynamics
- Best and worst performing URLs, etc.
#29. Technical SEO dashboard by Coupler.io
This SEO dashboard allows you to assess your website’s health from a technical perspective. It automatically pulls data from Google Search Console and visualizes it in easy-to-read pie charts. Green sections indicate that everything is okay and there are no issues. Red wedges let you know there may be a problem that requires your attention.
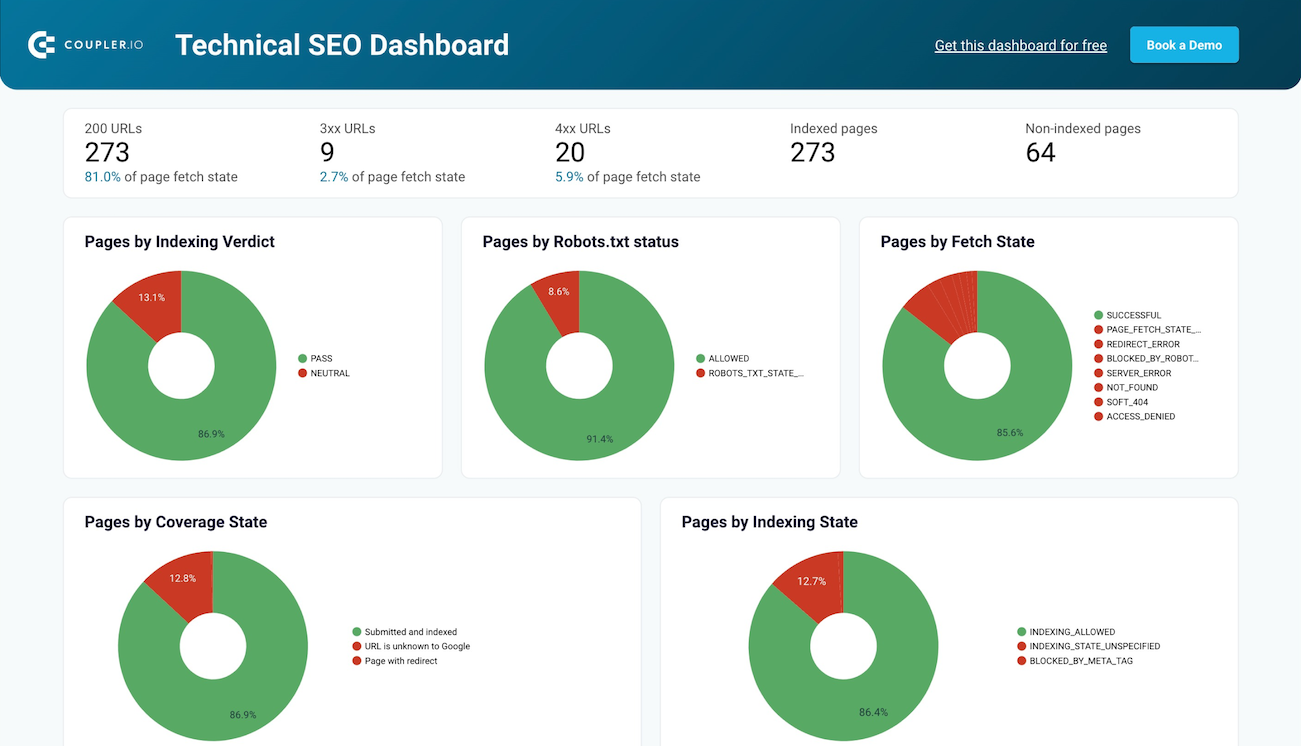
With this dashboard, it’s easy to identify pages blocked by Robots.txt or robot tags. You can also monitor page rendering status, track the list of submitted and un-indexed pages, check the AMP status, and more. Use this dashboard template to instantly audit your website, and then check this report on a weekly basis to stay in control of your website’s tech health.
Dashboard metrics
- Indexed pages
- Non-indexed pages
- Pages by fetch state
- Pages by Robots txt status
- Pages by indexing verdict
- AMP verdict
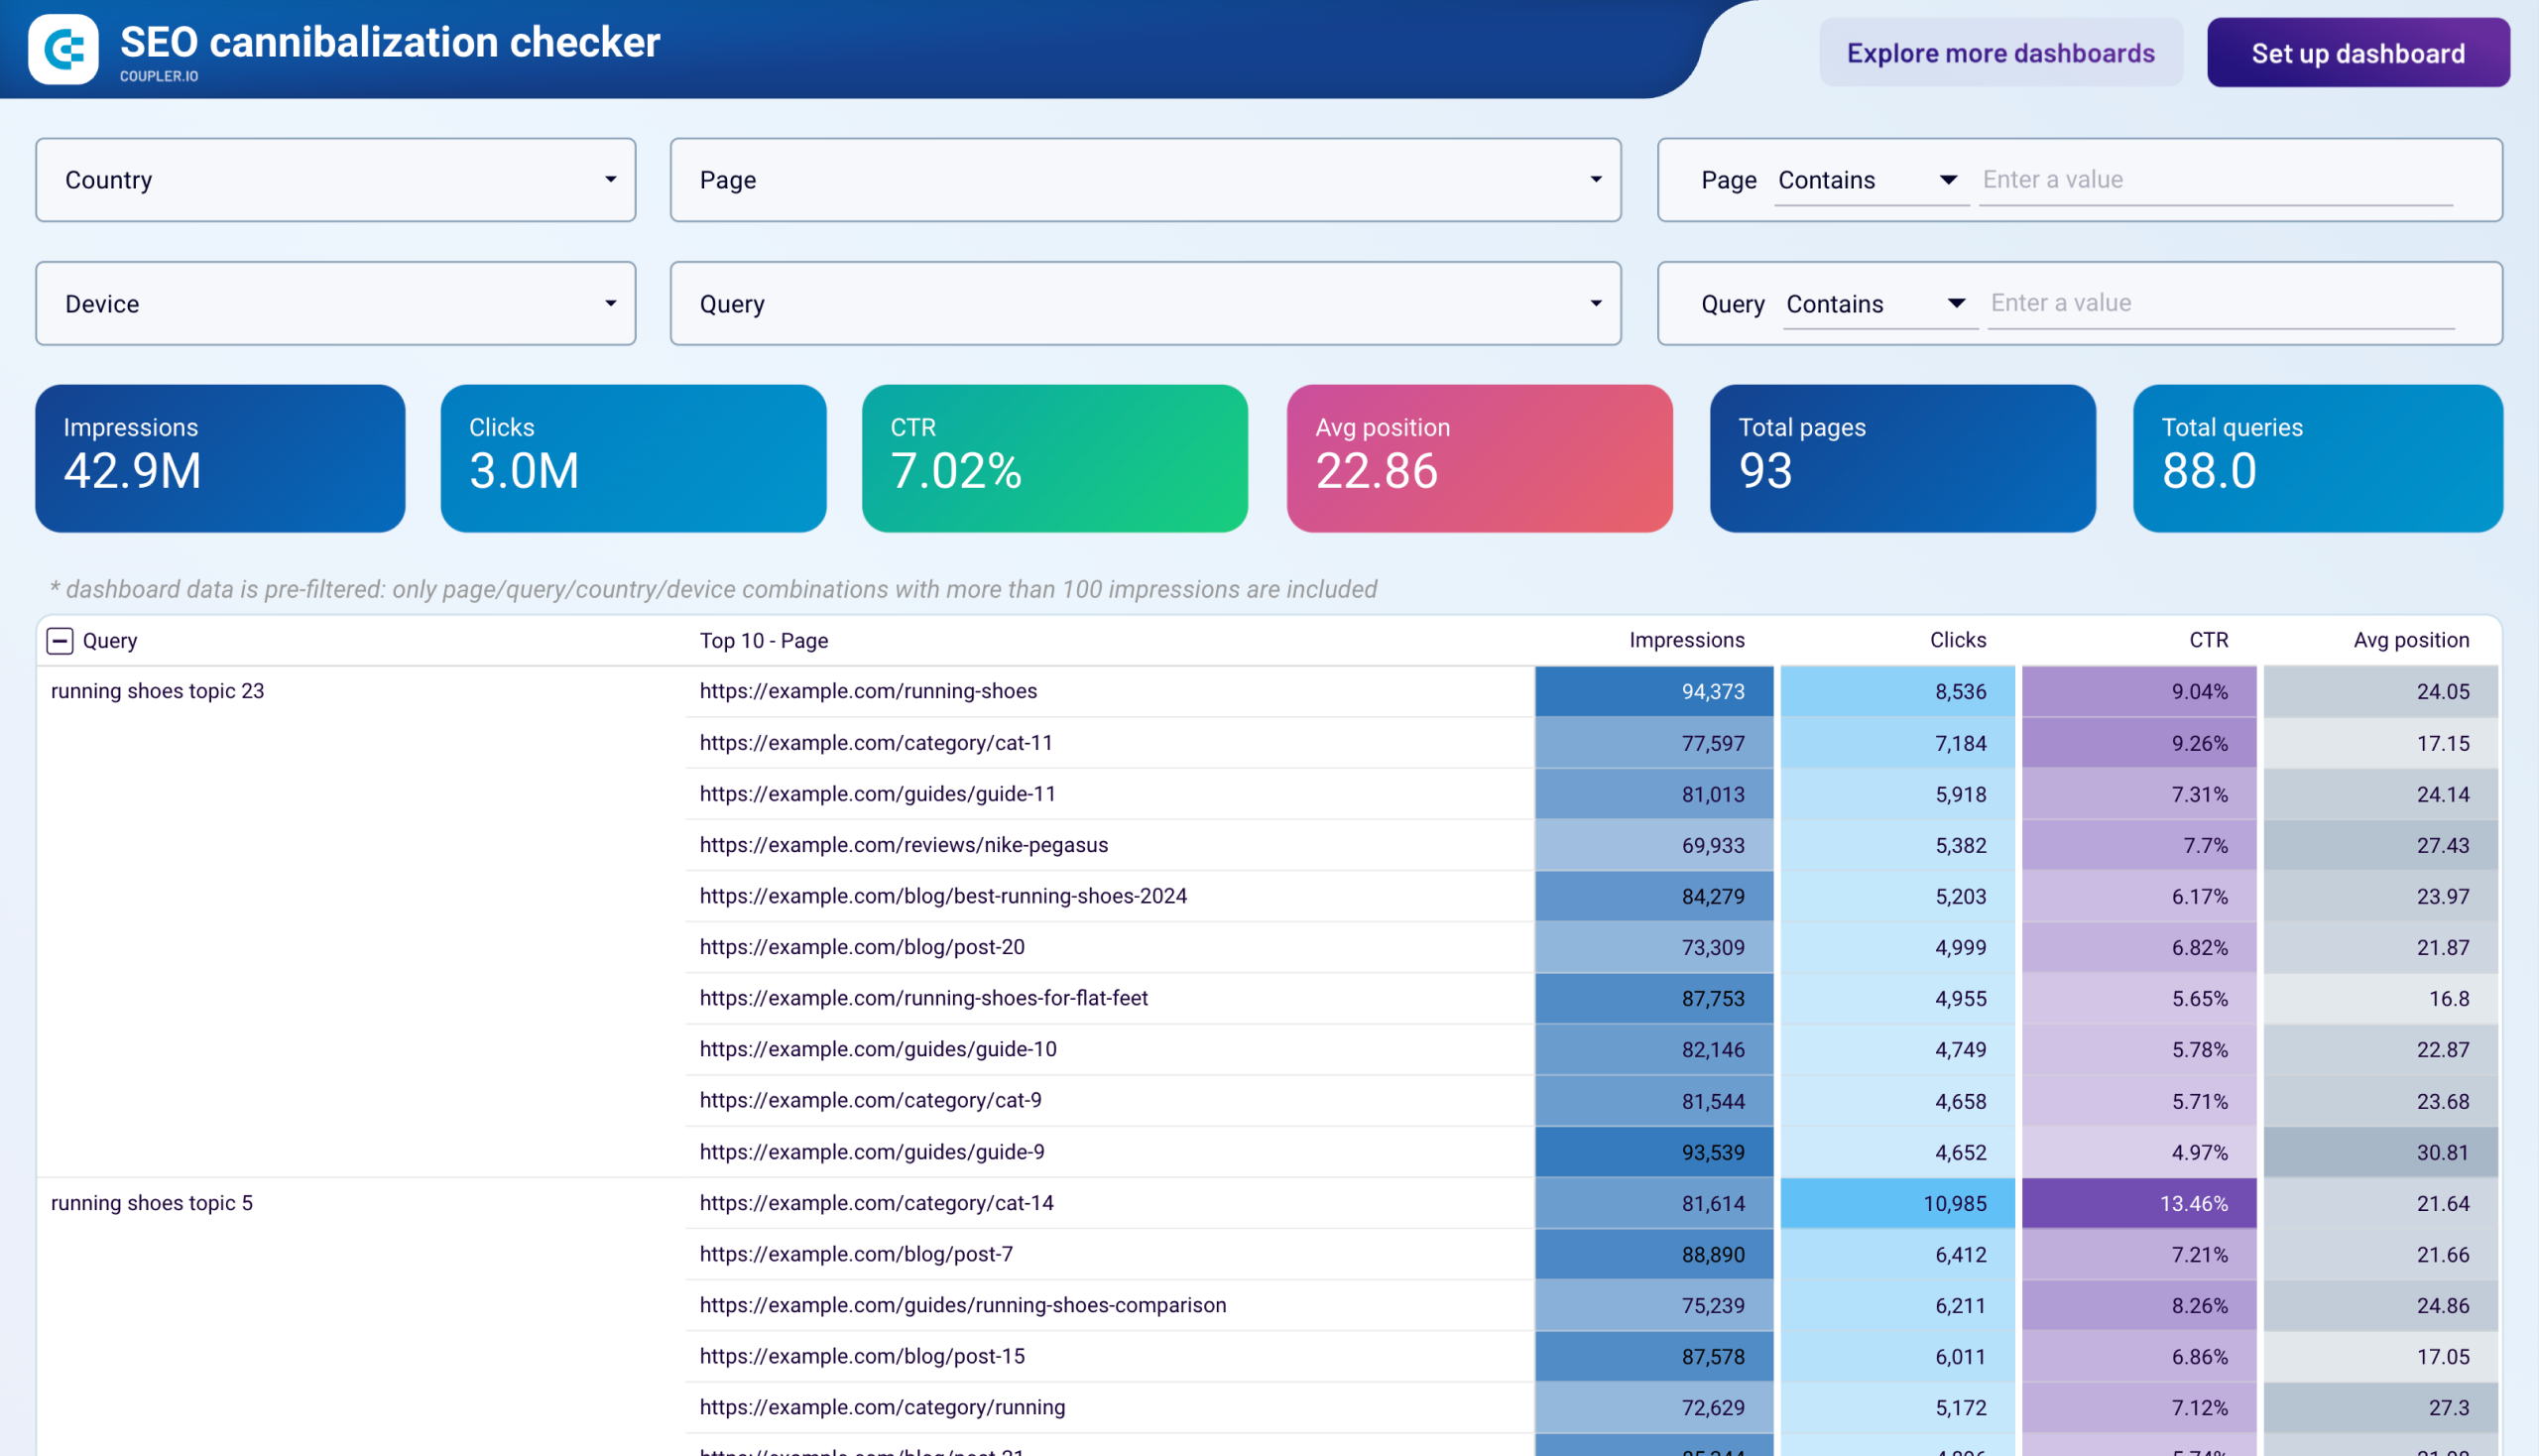
#30. SEO cannibalization checker dashboard by Coupler.io
When multiple pages on your site compete for the same search query, Google cycles through them instead of consistently ranking one. The result is suppressed rankings for all of them. Coupler.io’s SEO cannibalization checker connects to Google Search Console and groups your URLs by query. This way, you can spot where 5, 10, or more pages split impressions and clicks for overlapping keywords.
SEO cannibalization checker dashboard
 Preview dashboard
SEO cannibalization checker dashboard
Preview dashboardFor each query group, the dashboard shows impressions, clicks, CTR, and average position side by side per URL. You can identify which page actually earns the most clicks versus which one Google shows most often. Dropdown filters let you narrow the analysis by country, device, or URL pattern (like /blog/ vs. /category/), so you can audit one section of the site at a time. KPI cards at the top summarize total impressions, clicks, CTR, average position, total pages, and total queries in the filtered dataset, giving you a quick read on how widespread the problem is.
Dashboard metrics:
- Impressions
- Clicks
- CTR
- Average position
- Total pages
- Total queries
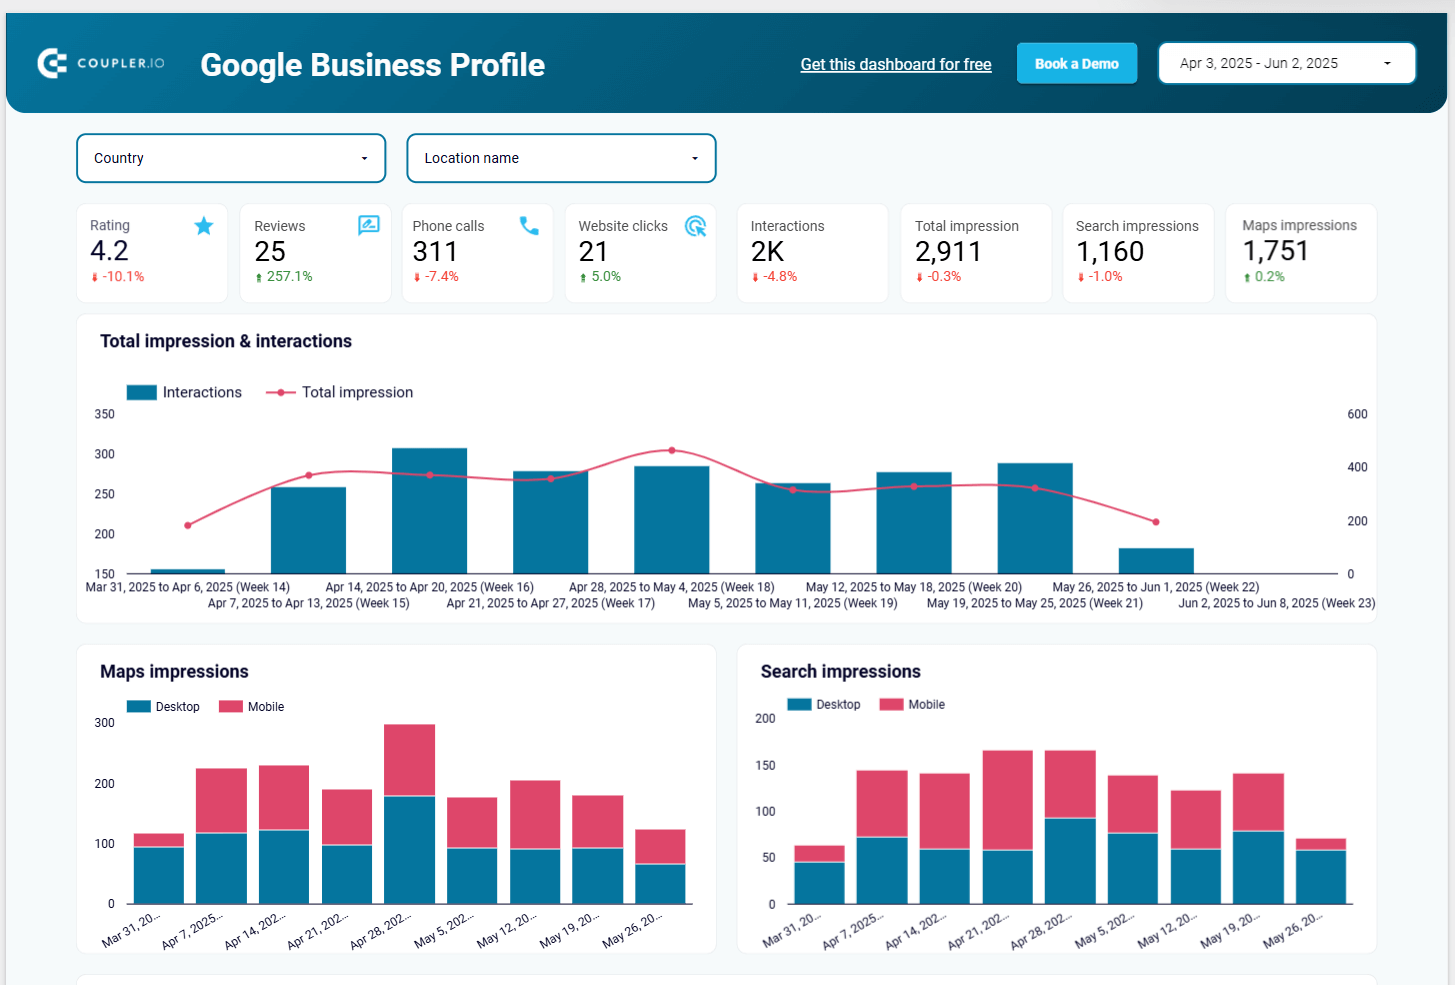
#31. Google Business Profile dashboard by Coupler.io
This dashboard simplifies Google Business Profile analytics by bringing all your location data into one central view in Looker Studio. It connects directly to your Google Business account to track how customers find and interact with your business on Google.
Google Business Profile dashboard
 Preview dashboard
Google Business Profile dashboard
Preview dashboardWith this dashboard, you can monitor search queries, customer actions, and review performance across all your business locations. The built-in connector automatically refreshes your data, providing always up-to-date insights to optimize your local SEO strategy and improve customer engagement.
Dashboard metrics:
- Search impressions
- Total views (Search vs. Maps)
- Customer actions (calls, website visits, directions)
- Average rating
- New reviews
- Review response rate
- Popular times of visits
- Photo views
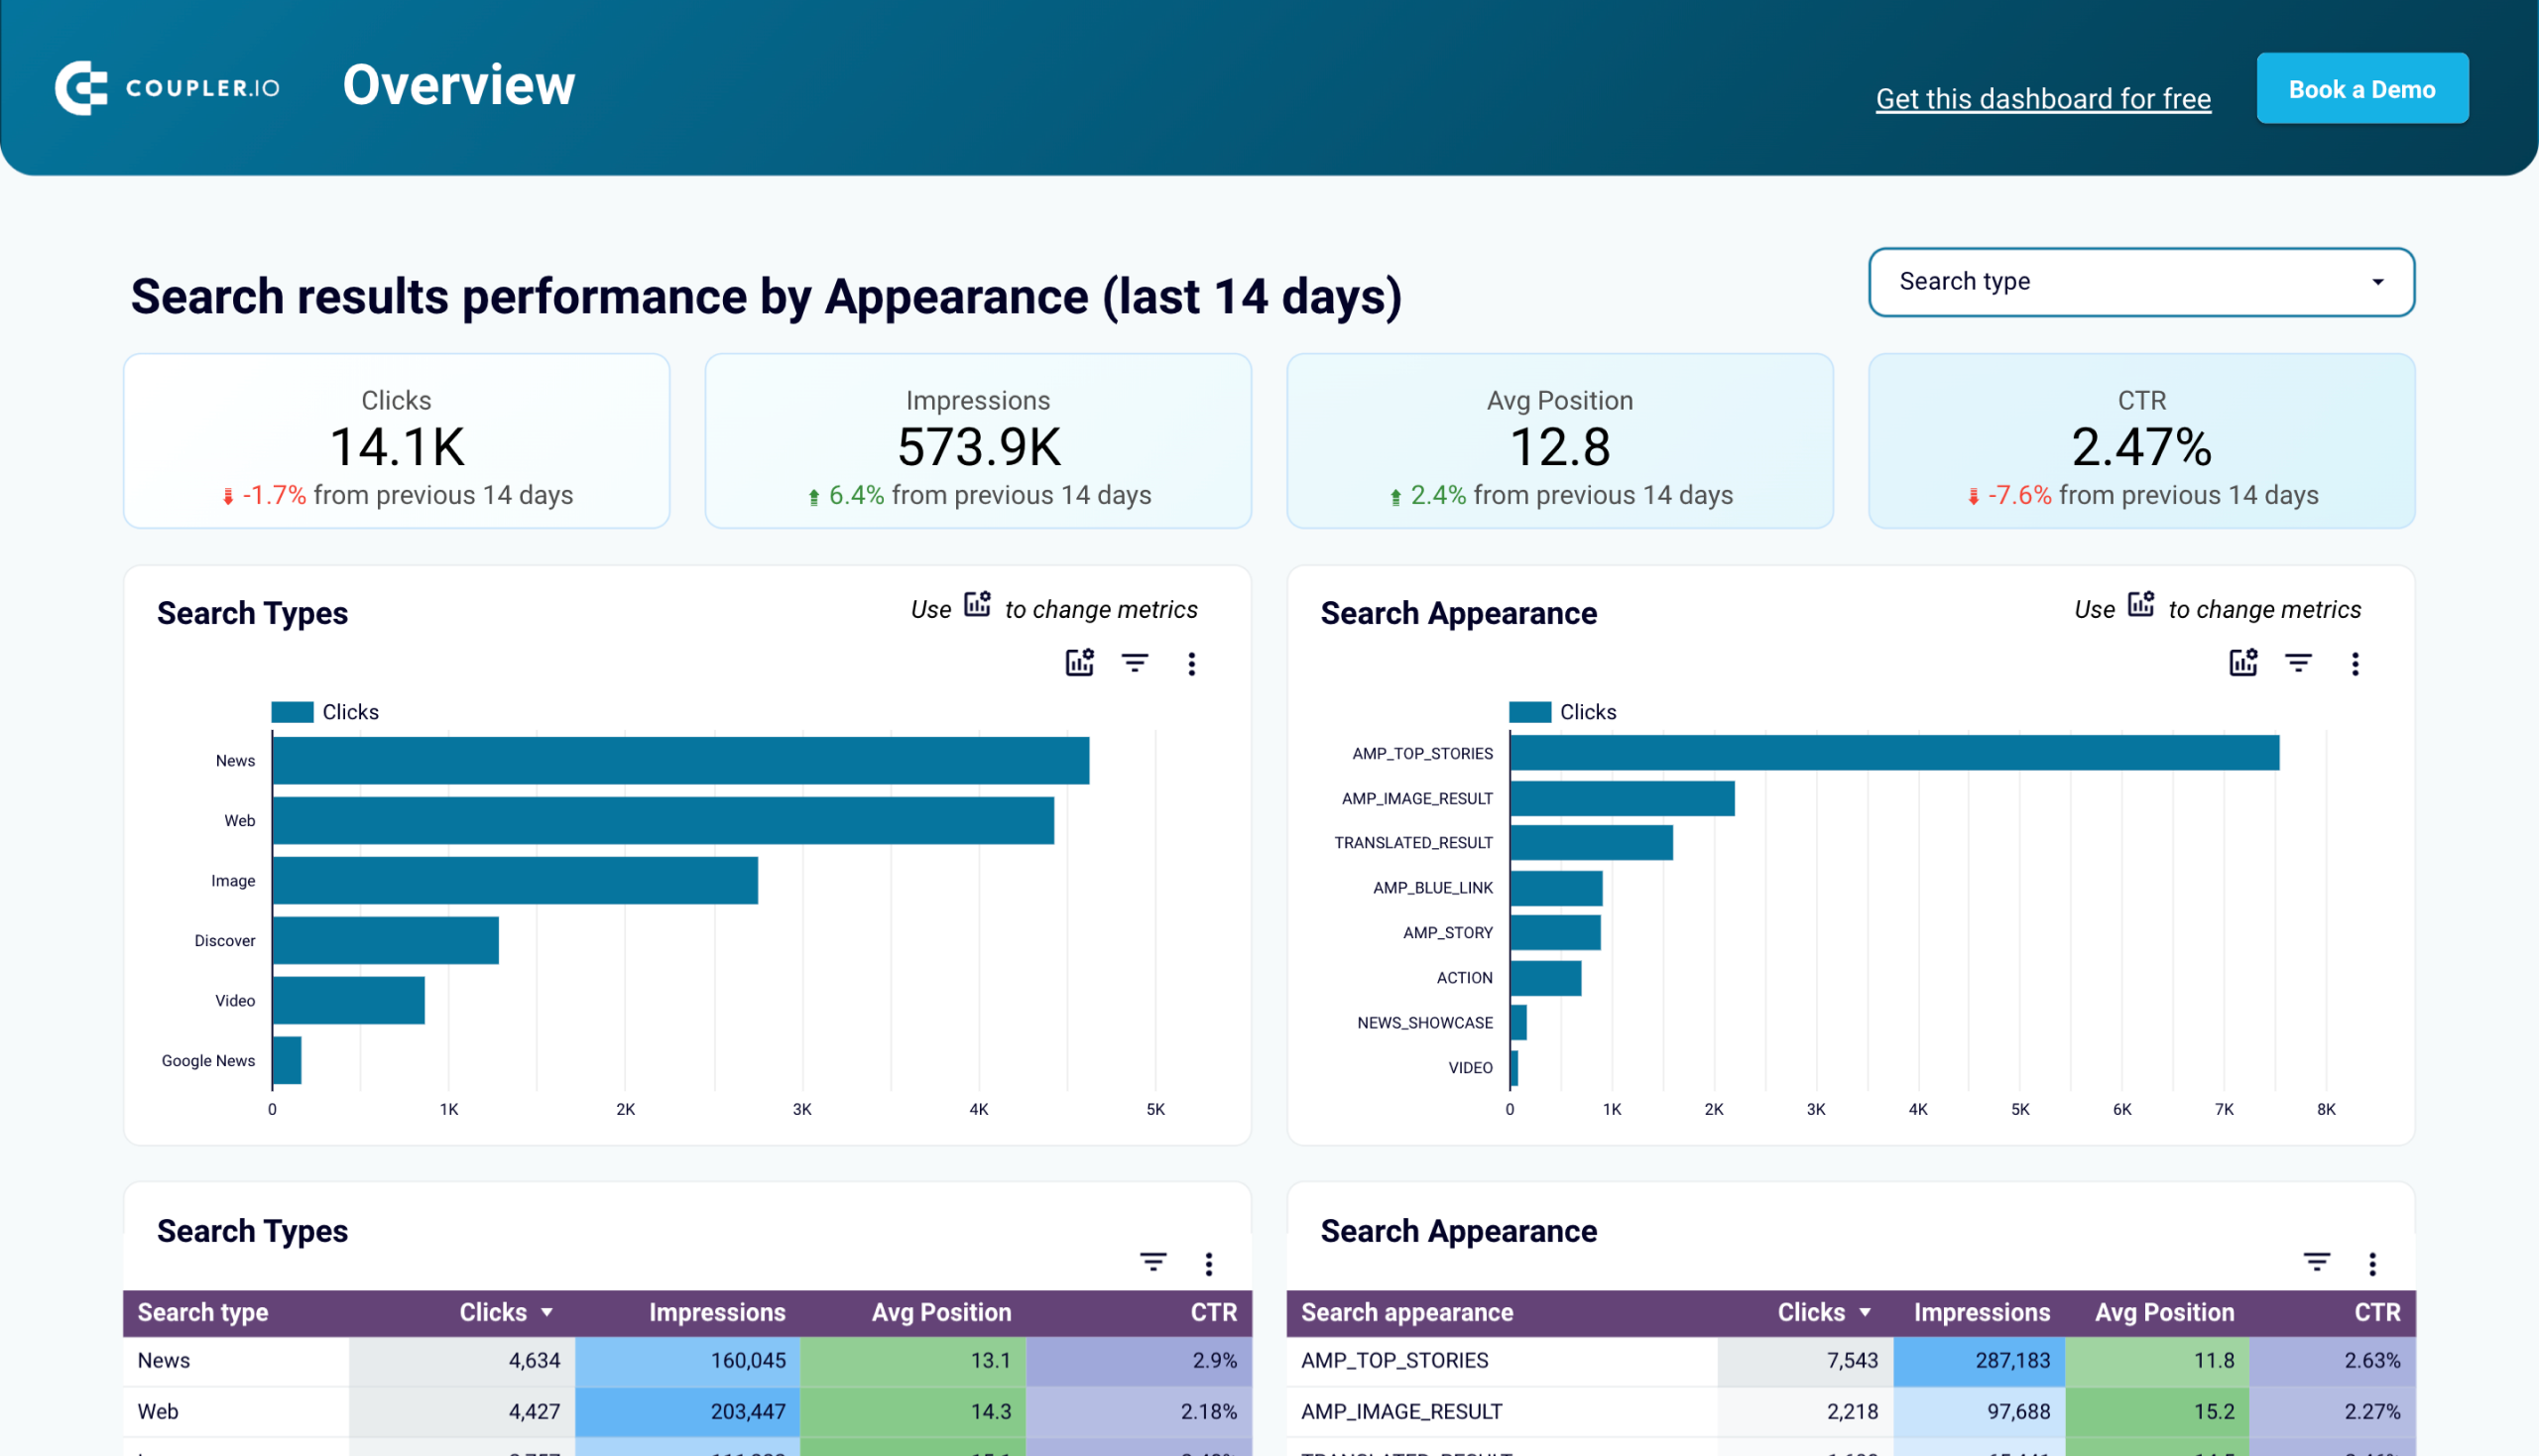
#32. Search types and appearance dashboard from GSC by Coupler.io
This SEO dashboard gives you deeper insights into your Google Search Console data by focusing on how your content performs across different search types and appearance features. With this Looker Studio template, SEO specialists can understand and optimize for specialized search results.
Search types and appearance from GSC dashboard
 Preview dashboard
Search types and appearance from GSC dashboard
Preview dashboardThis dashboard collects data from Google Search Console using the built-in Coupler.io connector. It allows you to see performance differences between Web, Image, Video, and News search results, along with statistics for featured snippets, AMP pages, and other rich results.
Dashboard metrics:
- Impressions by search type
- Clicks by search type
- CTR comparison across types
- Position changes by type
- Featured snippet performance
- AMP metrics
- Rich results statistics
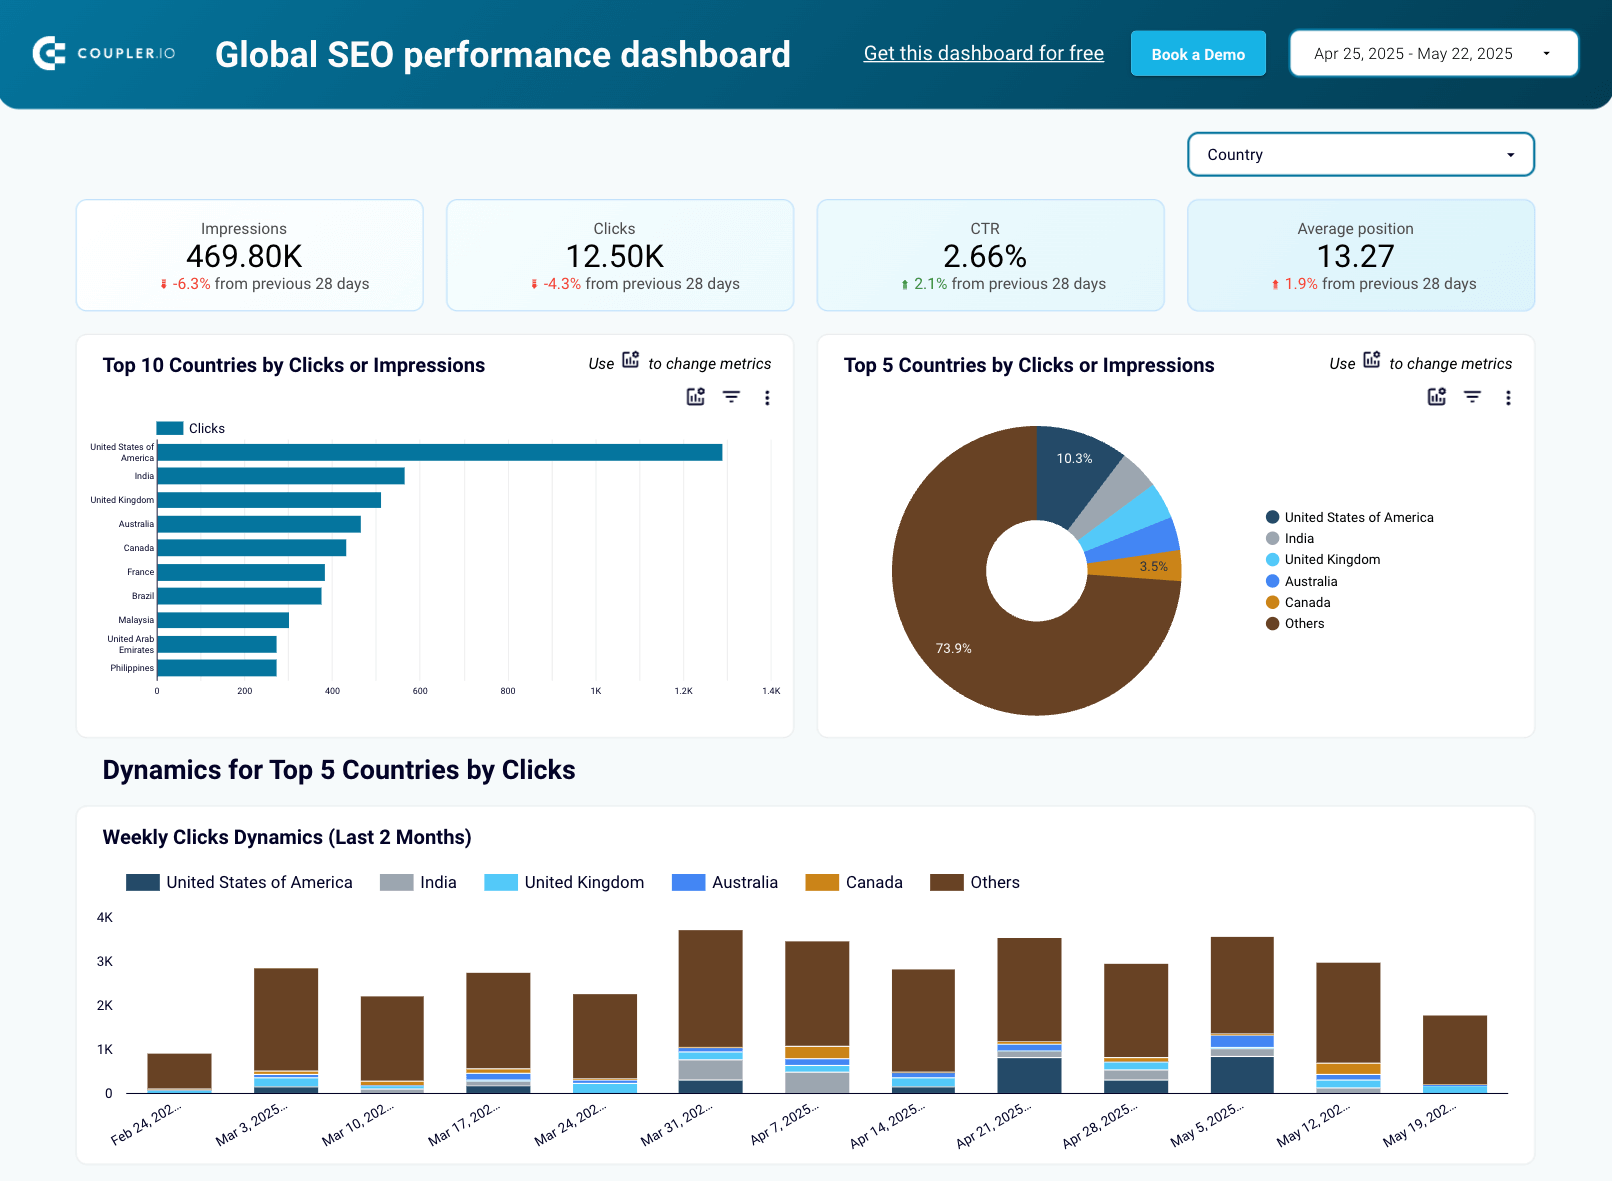
#33. Global SEO performance dashboard by Coupler.io
For businesses operating in multiple countries, this dashboard provides a clear picture of SEO performance across different geographic markets. It pulls data from Google Search Console to help you analyze and compare organic search metrics by country and language.
Global SEO performance dashboard
 Preview dashboard
Global SEO performance dashboard
Preview dashboardThe dashboard presents country-specific data for clicks, impressions, CTR, and position, allowing you to identify your strongest markets and opportunities for growth. You can compare performance across regions and identify content that needs localization improvements.
Dashboard metrics:
- Performance by country
- Language-specific metrics
- Regional CTR comparison
- Position tracking by market
- Country-specific growth trends
- Top-performing pages by region
- International traffic sources
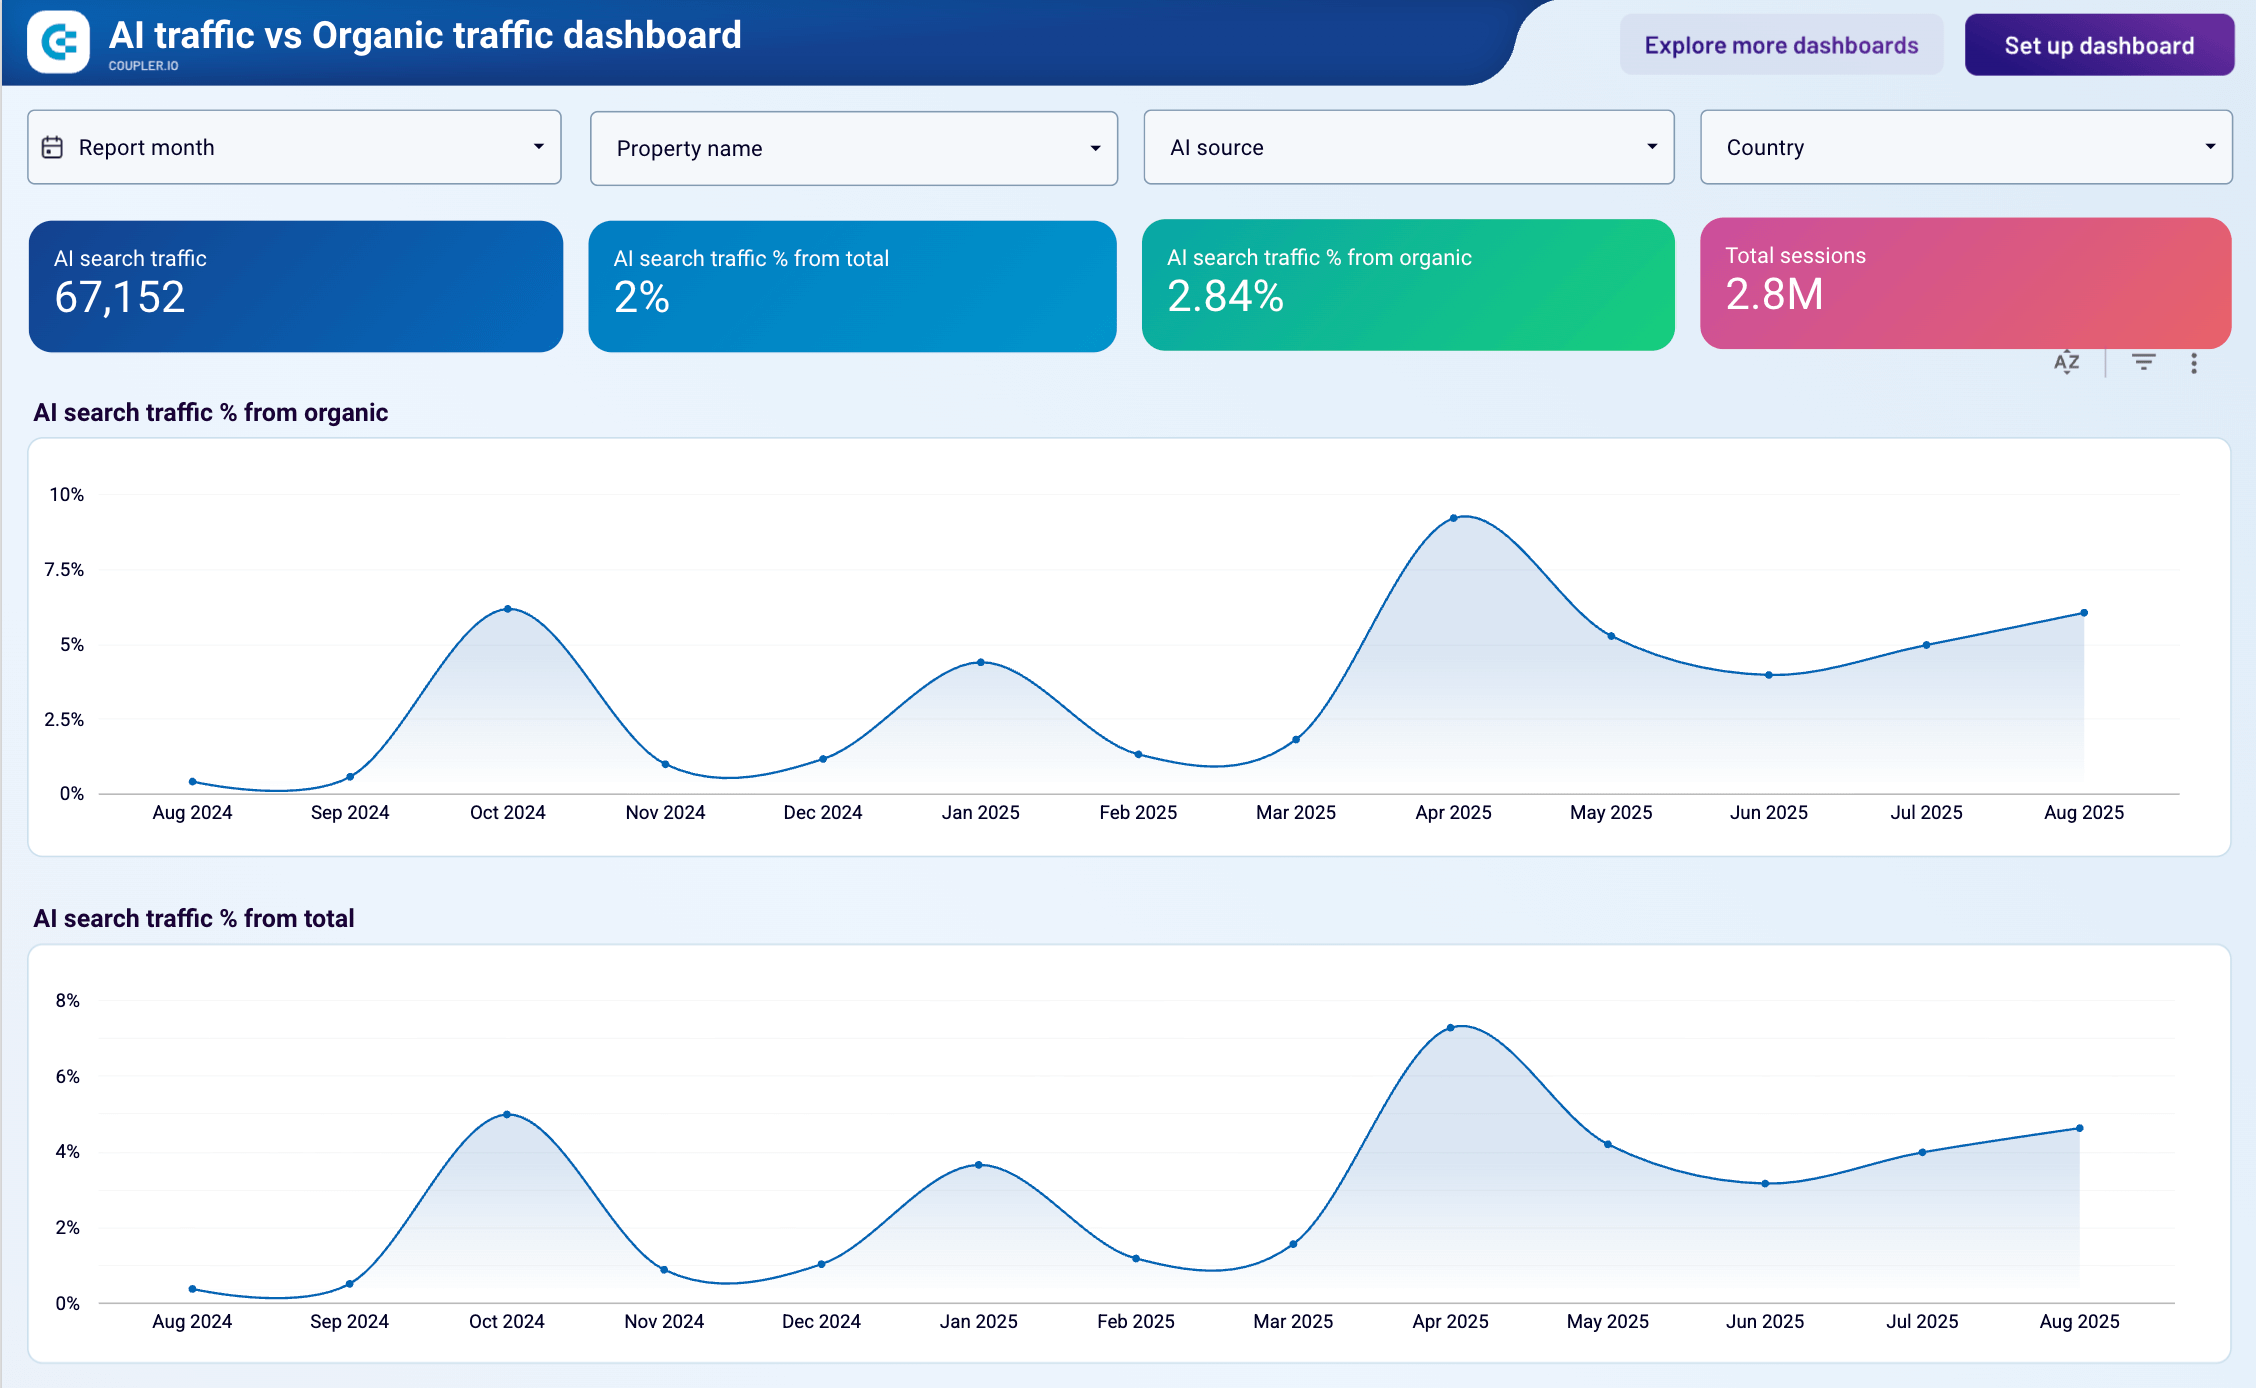
#34. AI traffic vs organic traffic dashboard by Coupler.io
AI tools like ChatGPT, Claude, and Perplexity are becoming popular ways for people to discover content. This dashboard compares how AI tools drive traffic to your website versus traditional organic search, helping you understand user engagement, conversions, and content discovery patterns.
AI traffic vs organic traffic dashboard
 Preview dashboard
AI traffic vs organic traffic dashboard
Preview dashboardYou can track which AI platforms send the most visitors, monitor monthly trends in AI versus organic traffic, and compare conversion rates between different traffic sources. This helps you optimize content for AI discovery while maintaining your organic search performance. To get a copy of the template in Looker Studio, create a free Coupler.io in under 5 minutes.
Dashboard metrics:
- Total traffic
- Total sessions
- Direct traffic
- Organic search traffic
- Organic search traffic % of total
- AI search traffic
- AI search traffic % of total
- AI search traffic % of organic
CRM & sales Looker Studio dashboards
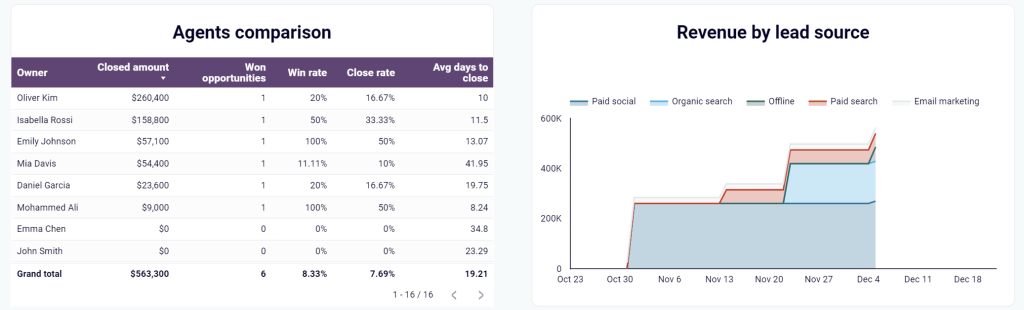
#35. CRM dashboard for Pipedrive/HubSpot/Salesforce by Coupler.io
A CRM dashboard template allows you to analyze the key metrics of your sales team and gives an overview of your opportunities.
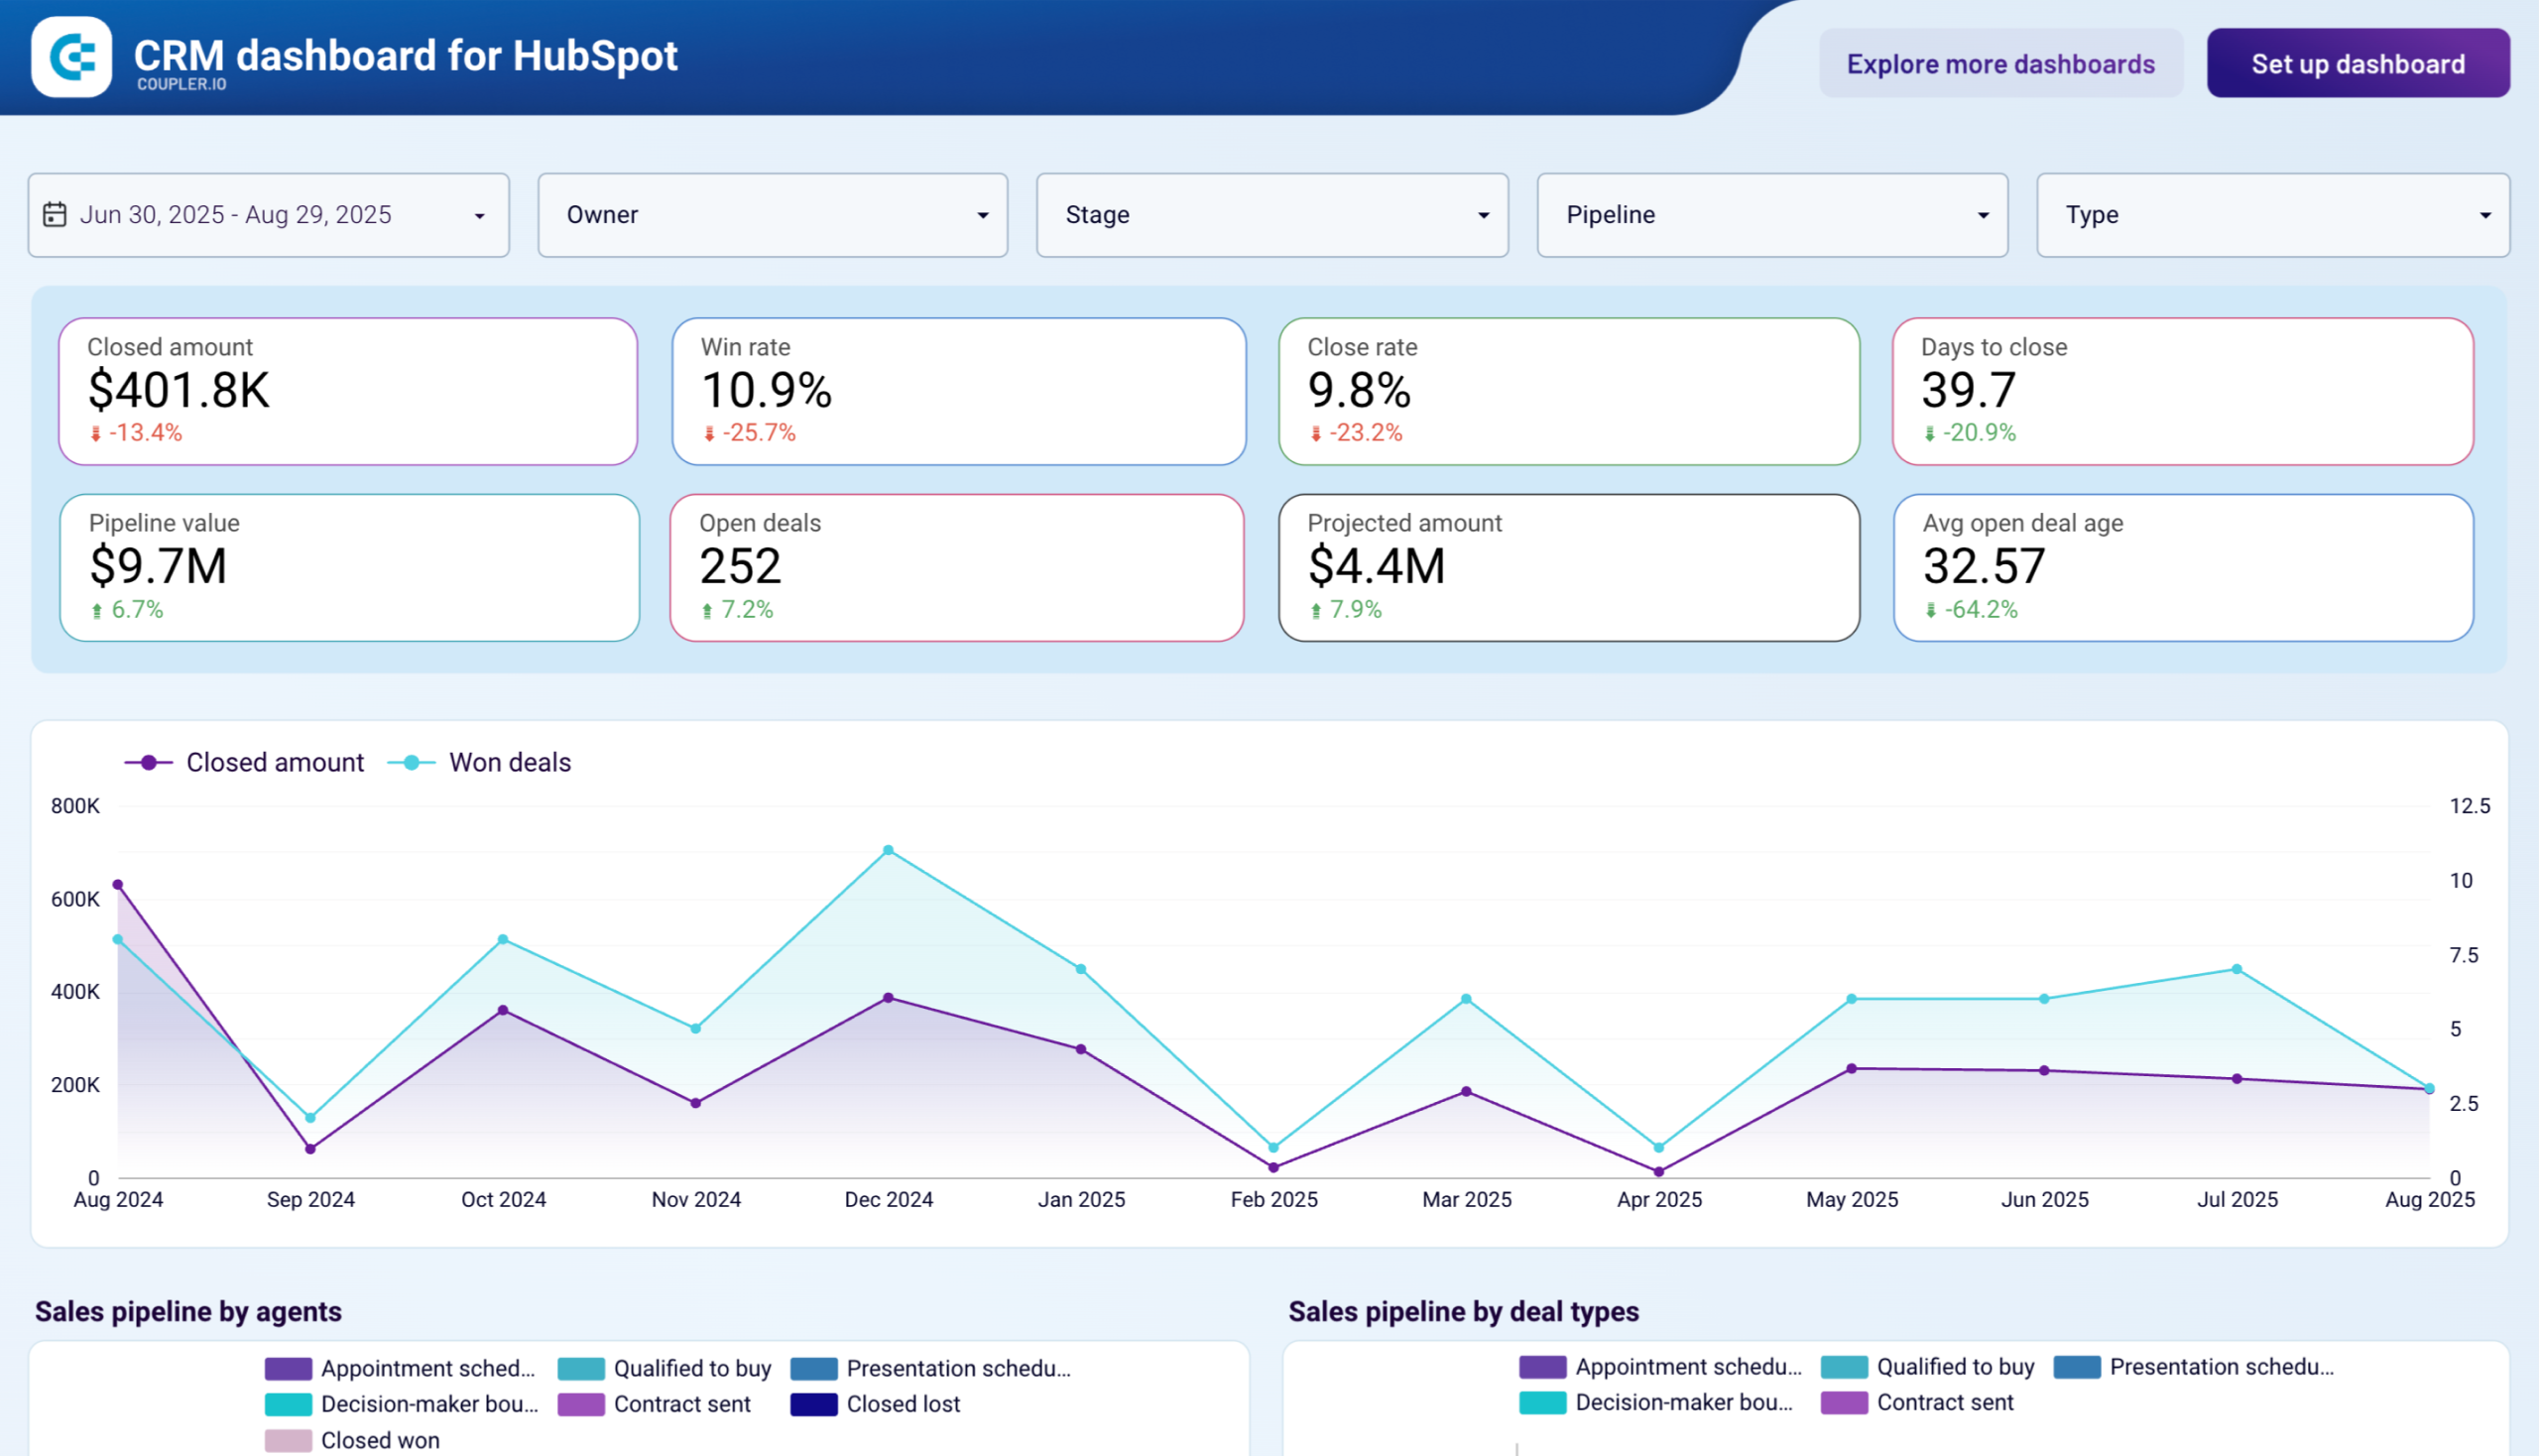
This interactive CRM dashboard template is designed for different platforms, including Pipedrive, HubSpot, and Salesforce. With the help of the CRM dashboard template, you can drill down into particular deals, identify top performers, and understand what drives your revenues. Like all Looker Studio templates by Coupler.io, this template is available for free.
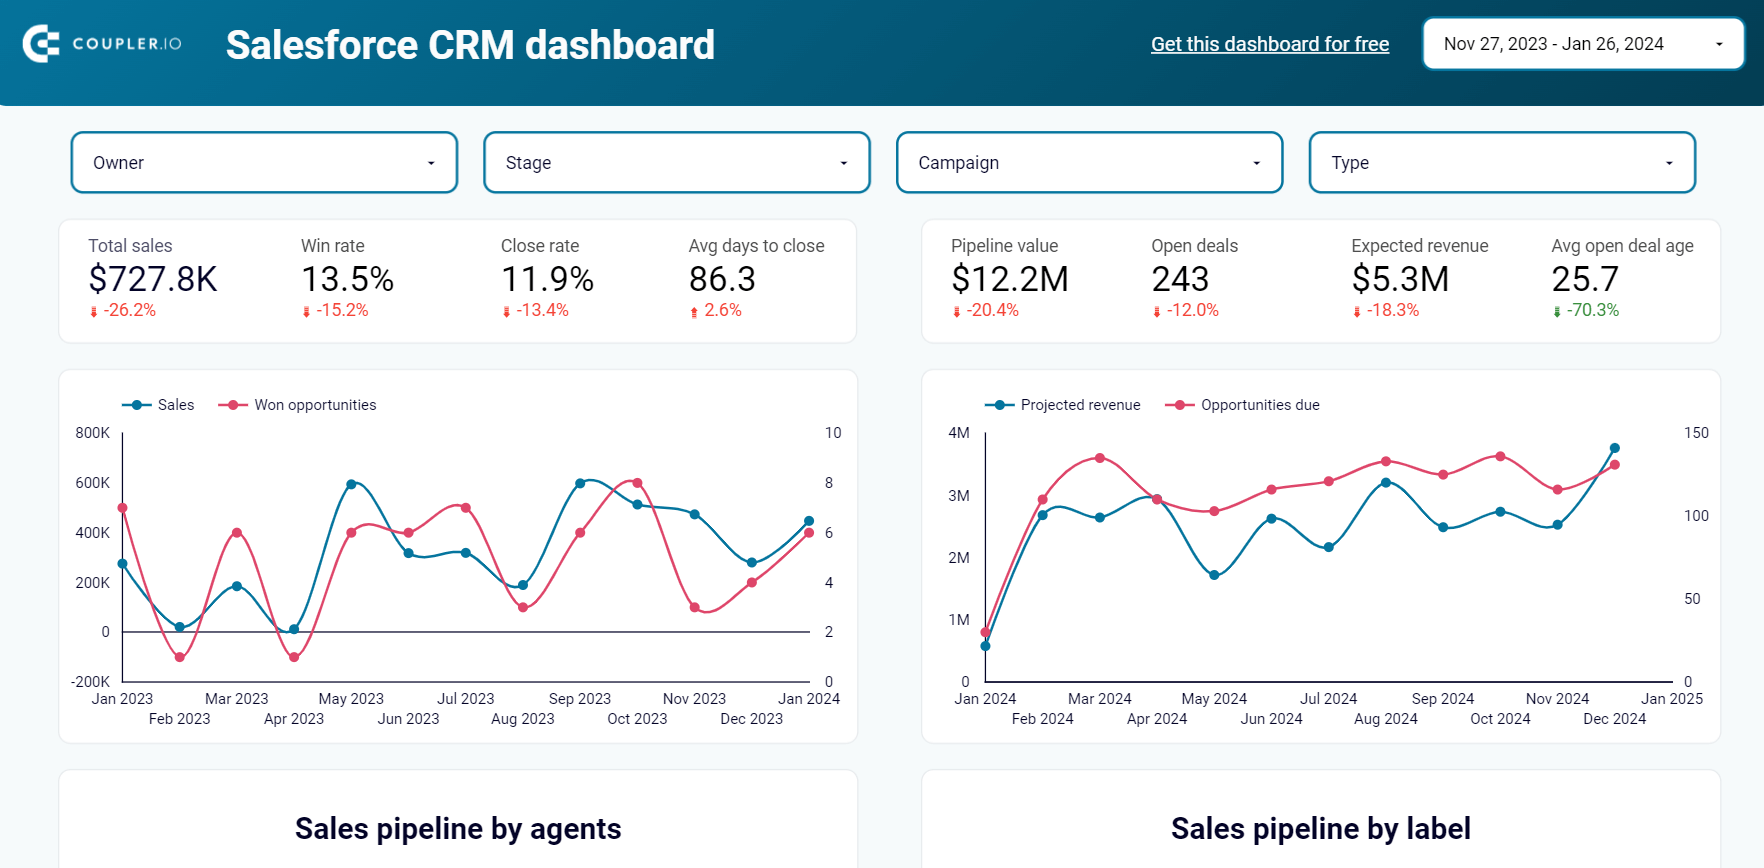


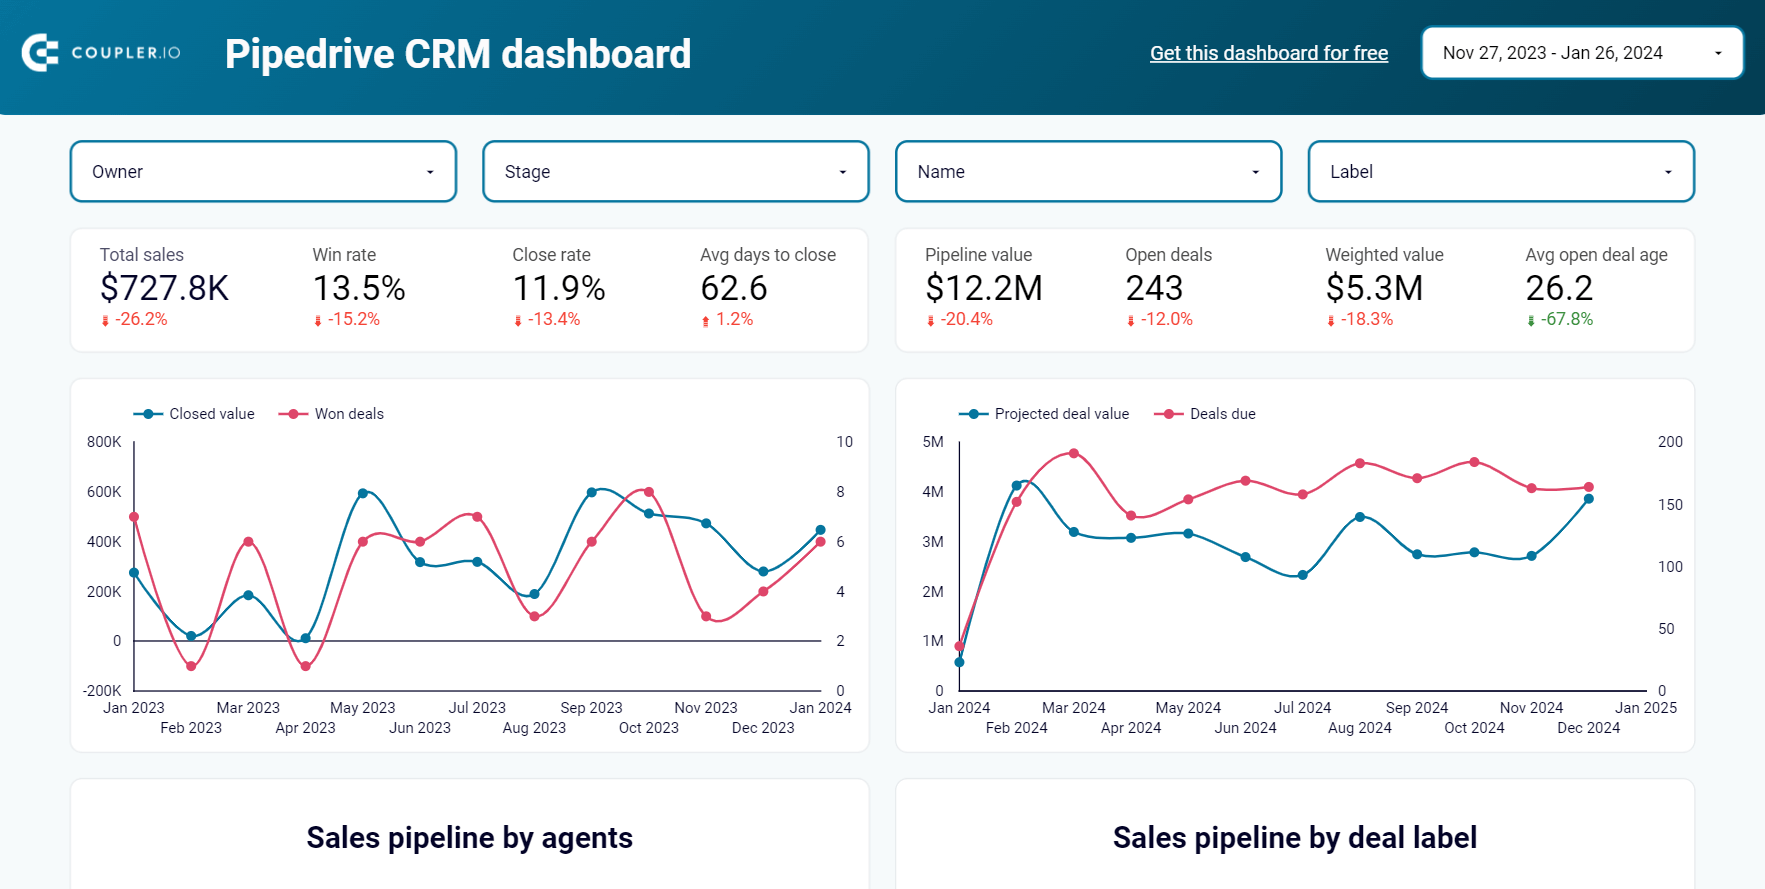

Dashboard metrics:
- Total sales
- Win rate
- Close rate
- Average days to close
- Pipeline value
- Open deals
- Weighted value, etc.
#36. Sales KPI dashboard for Pipedrive/HubSpot/GoHighLevel by Coupler.io
Coupler.io dashboard provides a comprehensive and user-friendly solution for analyzing critical sales metrics and key performance indicators from CRM apps. By leveraging the data visualization, you can make strategic decisions based on deal details, revenue, and sales pipeline, all in one centralized platform.
Sales KPI dashboard for Pipedrive
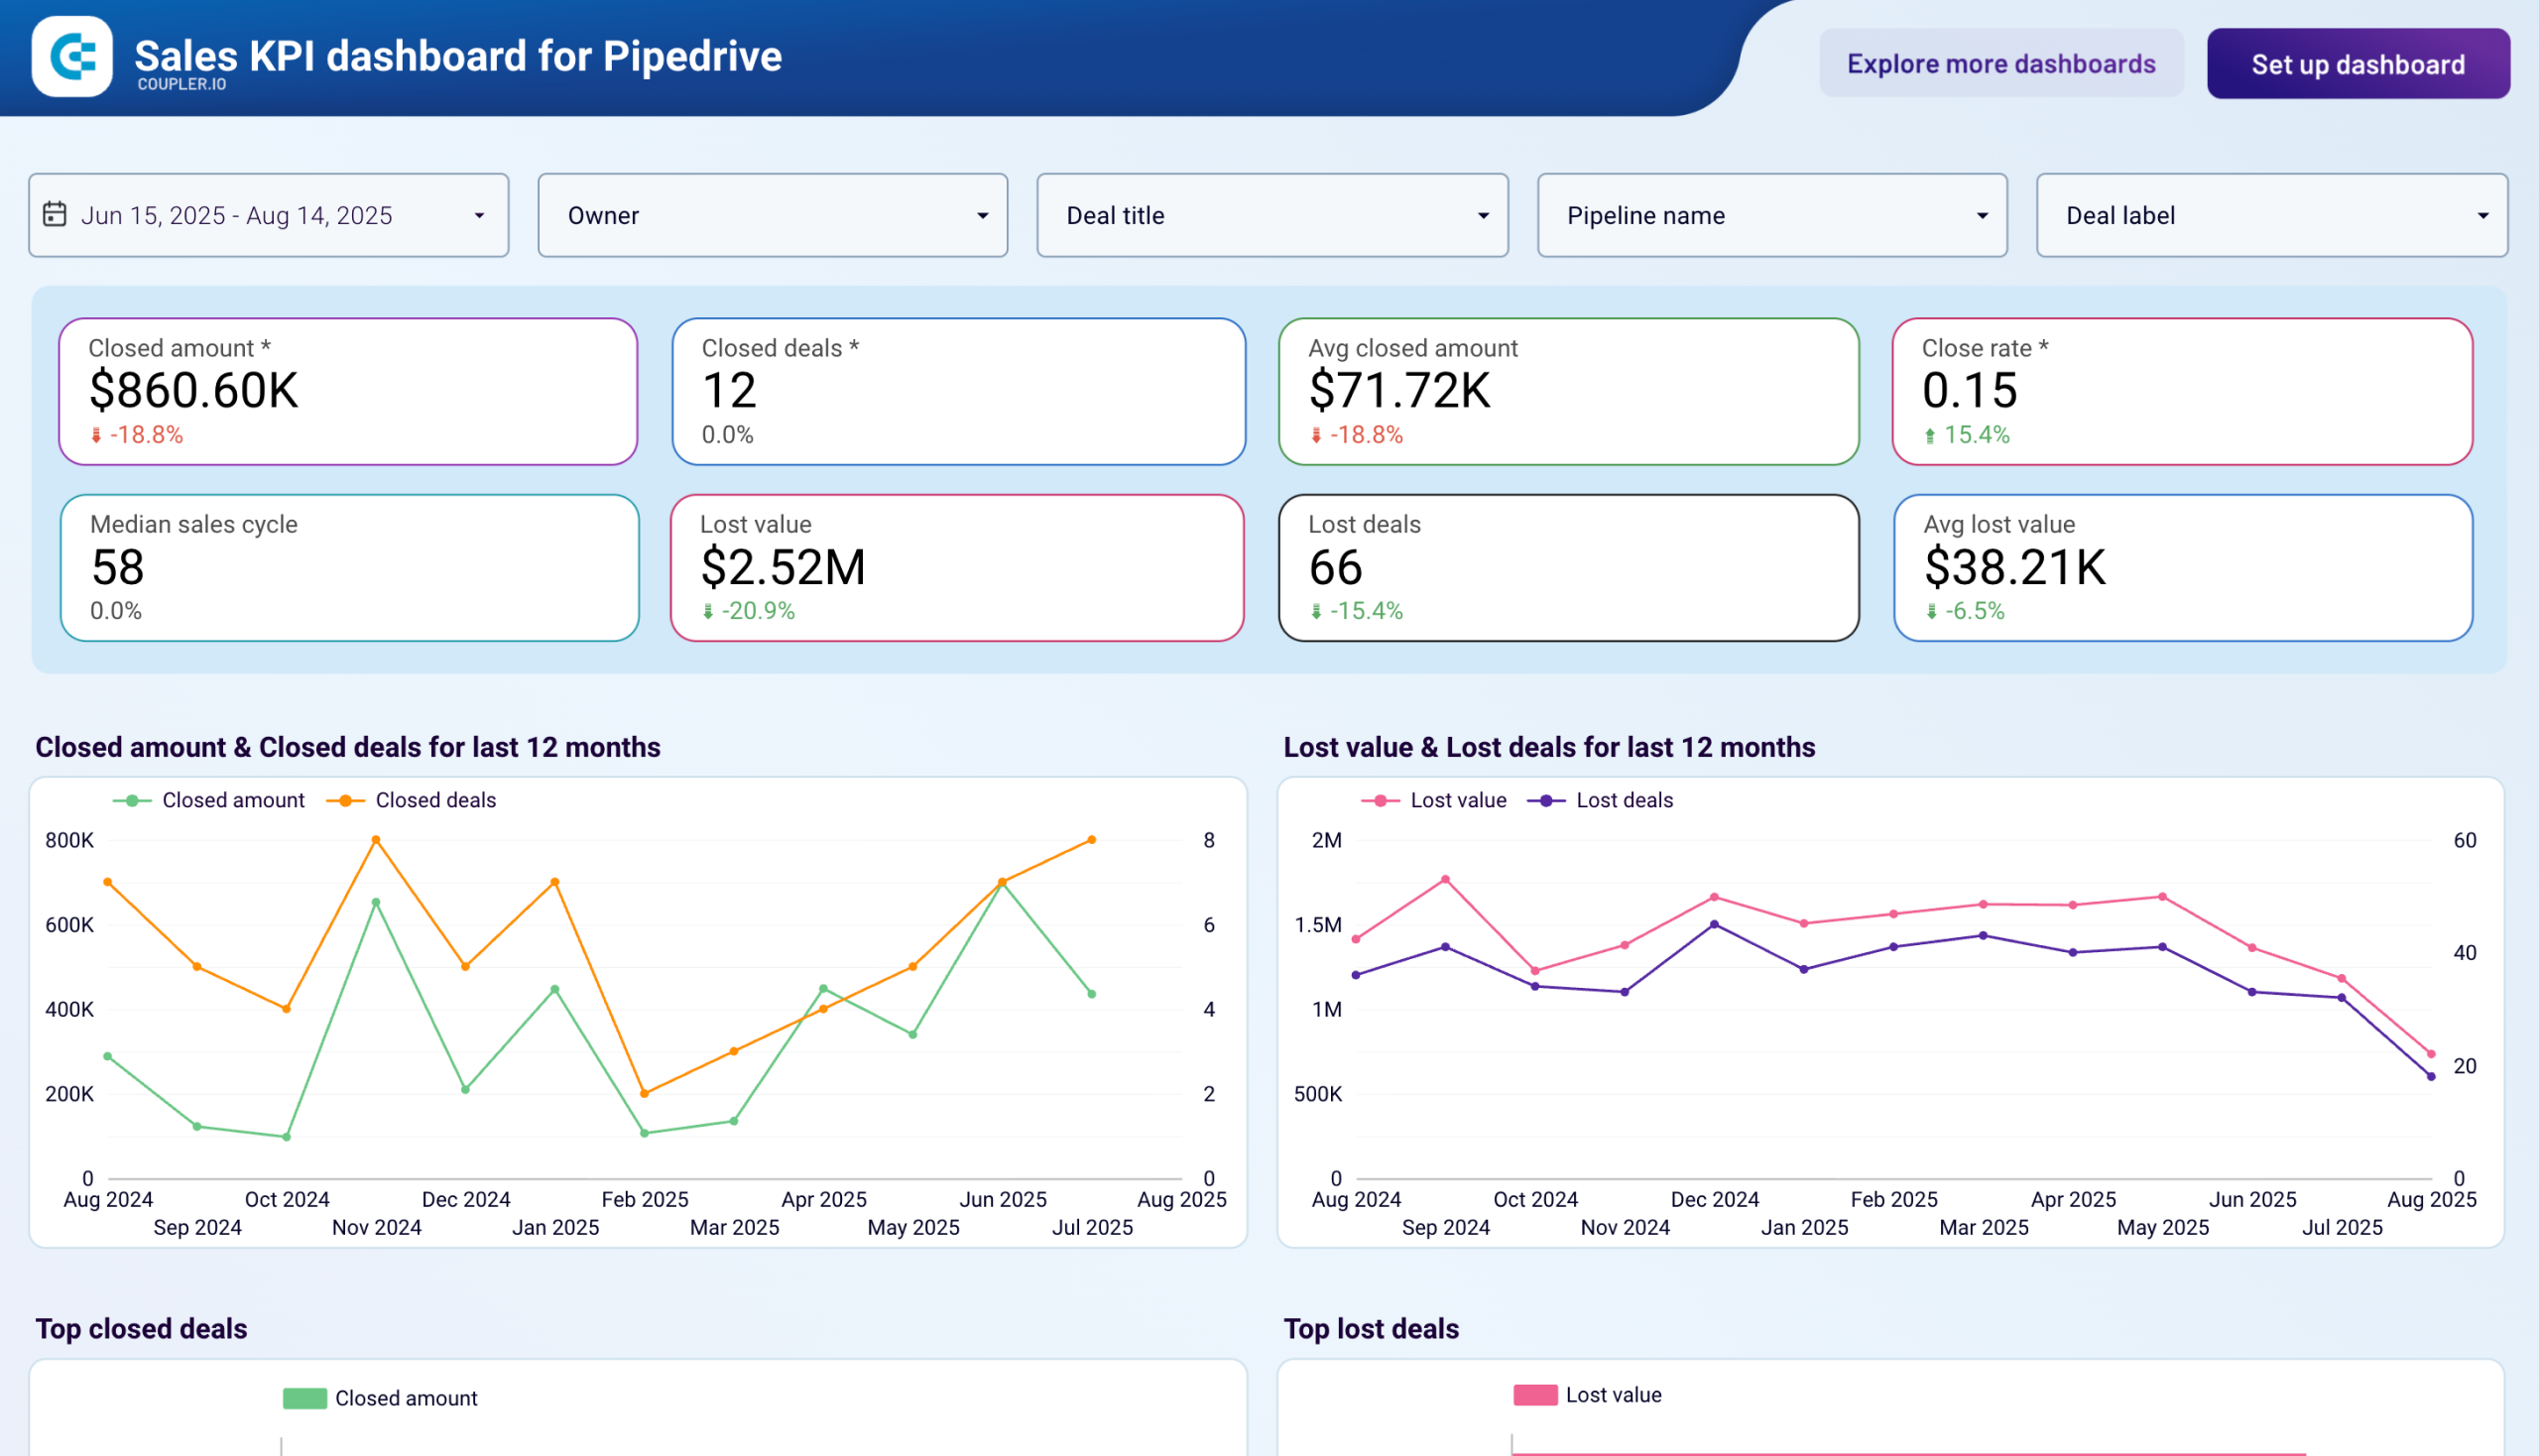 Preview dashboard
Sales KPI dashboard for Pipedrive
Preview dashboardThis interactive dashboard example is designed for Pipedrive and HubSpot. It’s a plug-and-play report that allows you to dive straight into data analysis and gain actionable insights. Additionally, all Coupler.io dashboards ensure consistency in data representation across different channels. Regardless of your stakeholders’ technical expertise, the user-friendly interface makes it easy for them to navigate and interpret the data.
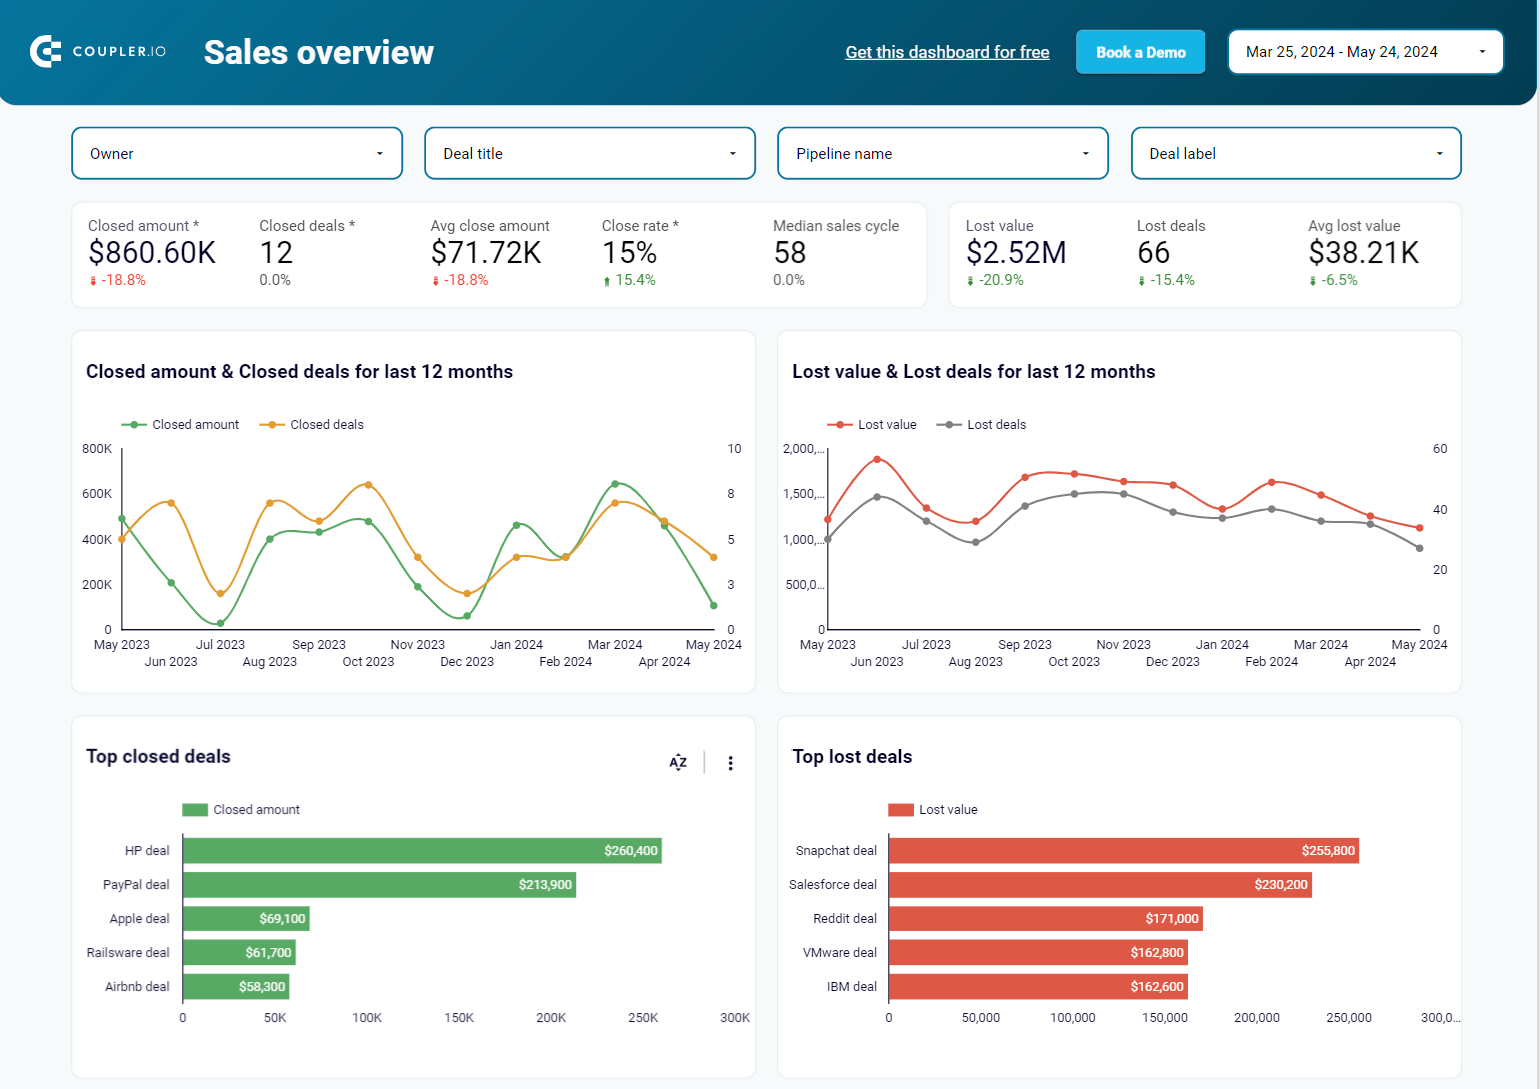
Dashboard metrics:
- Revenue
- Won deals
- Revenue per deal
- Won/Lost ratio
- Open deals
- Avg days to close
- Lost reasons
- Won deals per pipeline stage, etc.
#37. Salesforce sales dashboard by Coupler.io
This sales analysis report simplifies tracking and analyzing Salesforce metrics. The dashboard template includes 4 pages to see information about open, won, and lost opportunities. The sales overview page displays stats of all opportunities by stage.
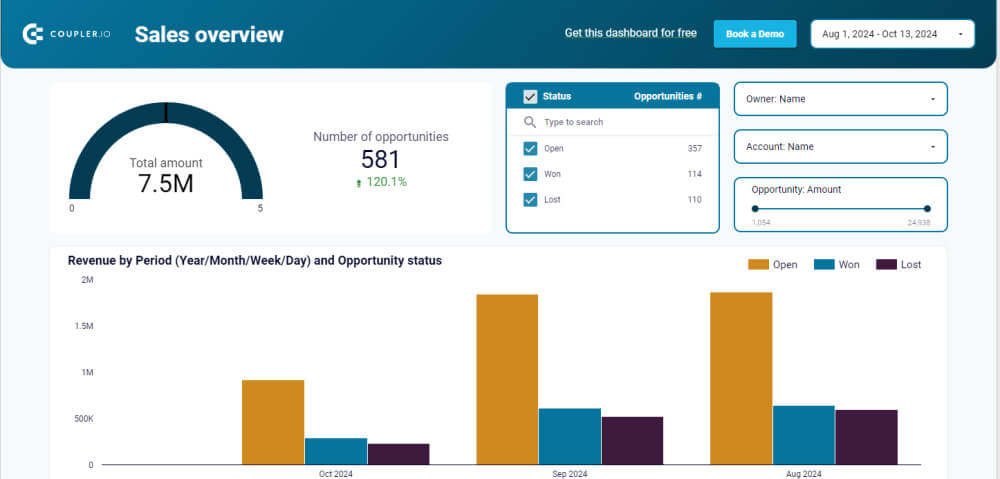
This Looker Studio dashboard template can become your main marketing dashboard, conveniently monitoring and assessing digital marketing efforts, covering many essential areas (website analysis, e-commerce reporting, organic search, and paid activities). Users will have a holistic view of their performance across various channels to make informed decisions and optimize their digital marketing strategies for maximum impact.
Dashboard metrics:
- Total amount of sales
- Number of opportunities
- Revenue by period
- Probability of winning
- Average push count
- Average days from opening to today, etc.
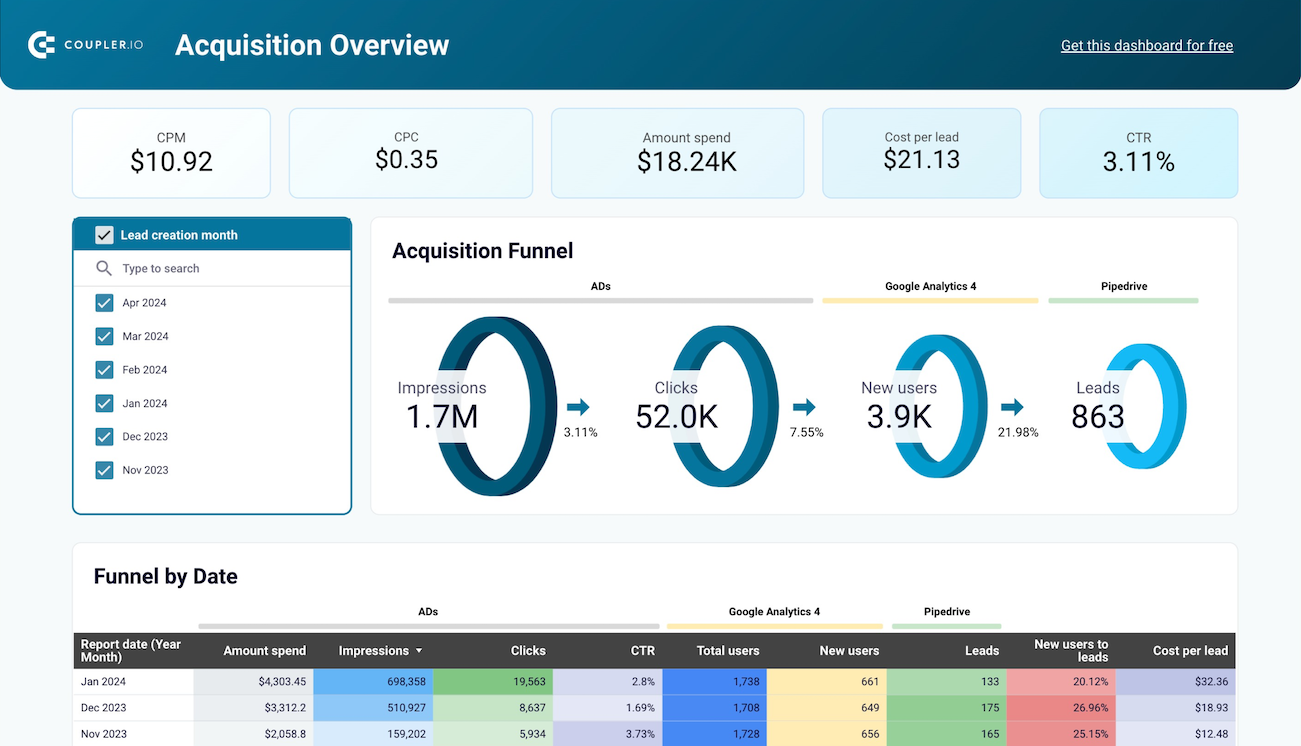
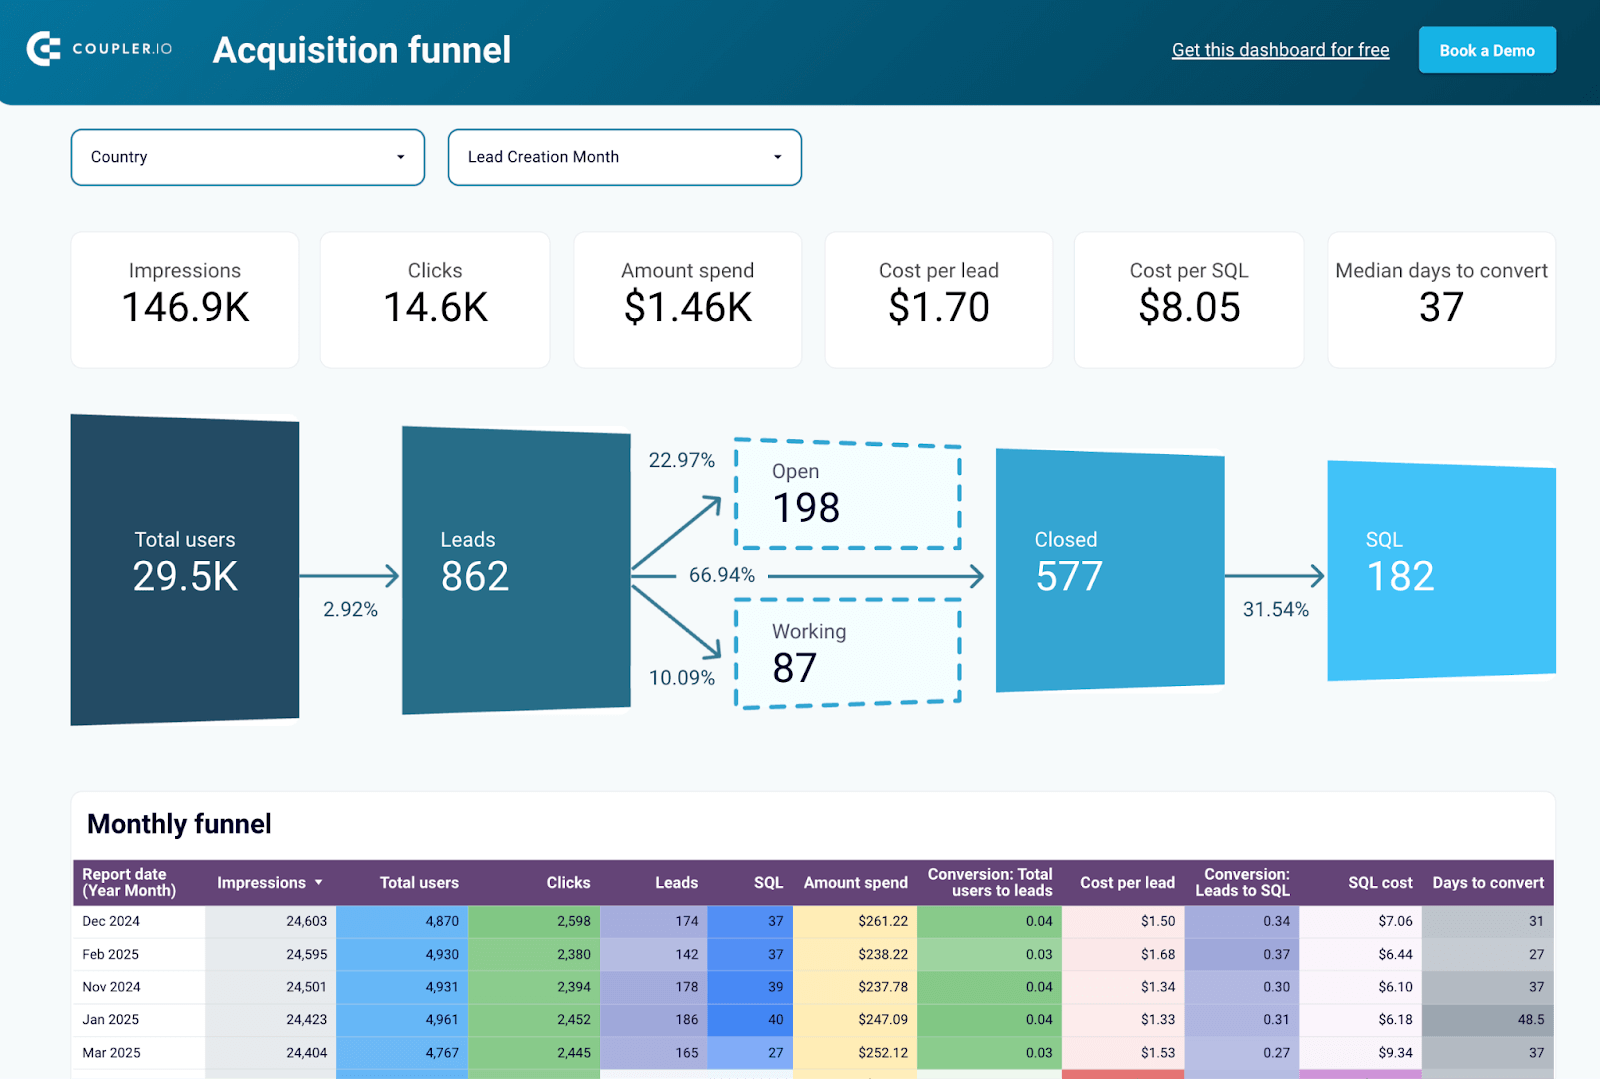
#38. Customer acquisition dashboard for Pipedrive by Coupler.io
This customer acquisition dashboard provides insights into the performance of your paid ads and organic traffic for lead generation in Pipedrive.
Customer acquisition dashboard for Pipedrive
 Preview dashboard
Customer acquisition dashboard for Pipedrive
Preview dashboardThe dashboard displays impressions, clicks, new users, and costs of acquiring customers. The source for these insights is not only Pipedrive, but also GA4 and the advertising platforms you use like Google Ads, Facebook Ads, etc. With this in mind, you can see how many clicks your ad campaigns brought and how much you spent on them.
Dashboard metrics:
- CPM
- CPC
- Amount spend
- Cost per lead
- CTR
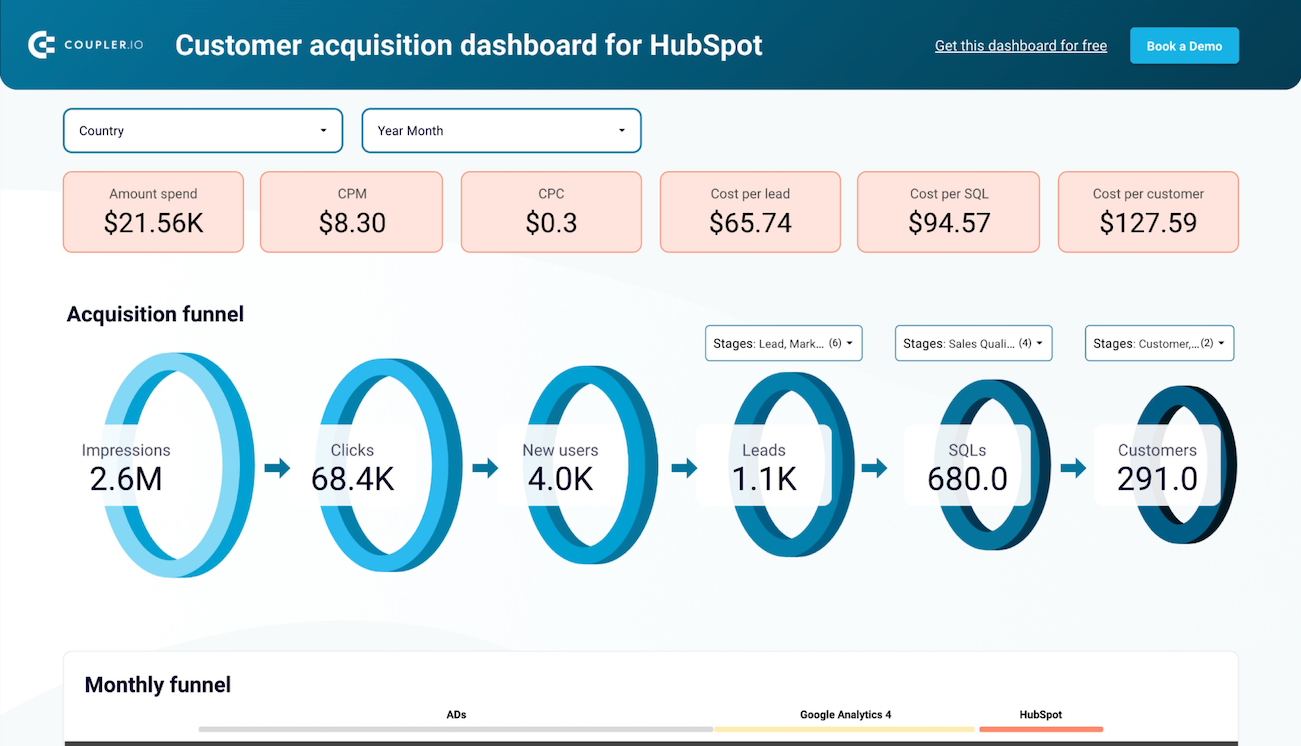
#39. Customer acquisition dashboard for HubSpot by Coupler.io
This dashboard is similar to the previous one, but it’s tailored for HubSpot. It automatically collects data from Google Analytics 4, HubSpot, and various PPC platforms – Facebook Ads, LinkedIn Ads, Google Ads, Snapchat Ads, and X (Twitter) Ads. This data is then used to visualize your acquisition funnel in an analysis-ready way.
Customer acquisition dashboard for HubSpot
 Preview dashboard
Customer acquisition dashboard for HubSpot
Preview dashboardThis Looker Studio report shows you how your customers go through different stages of the funnel. It visualizes the user journey from clicking your ad to visiting the website and, eventually, becoming a client. This lets you analyze how your ads contribute to acquisition, what stages might need improvement, and how the key metrics change over time. You can also use filters to select different stages for your funnel.
Dashboard metrics:
- CPM
- CPC
- Amount spend
- Cost per lead
- CTR
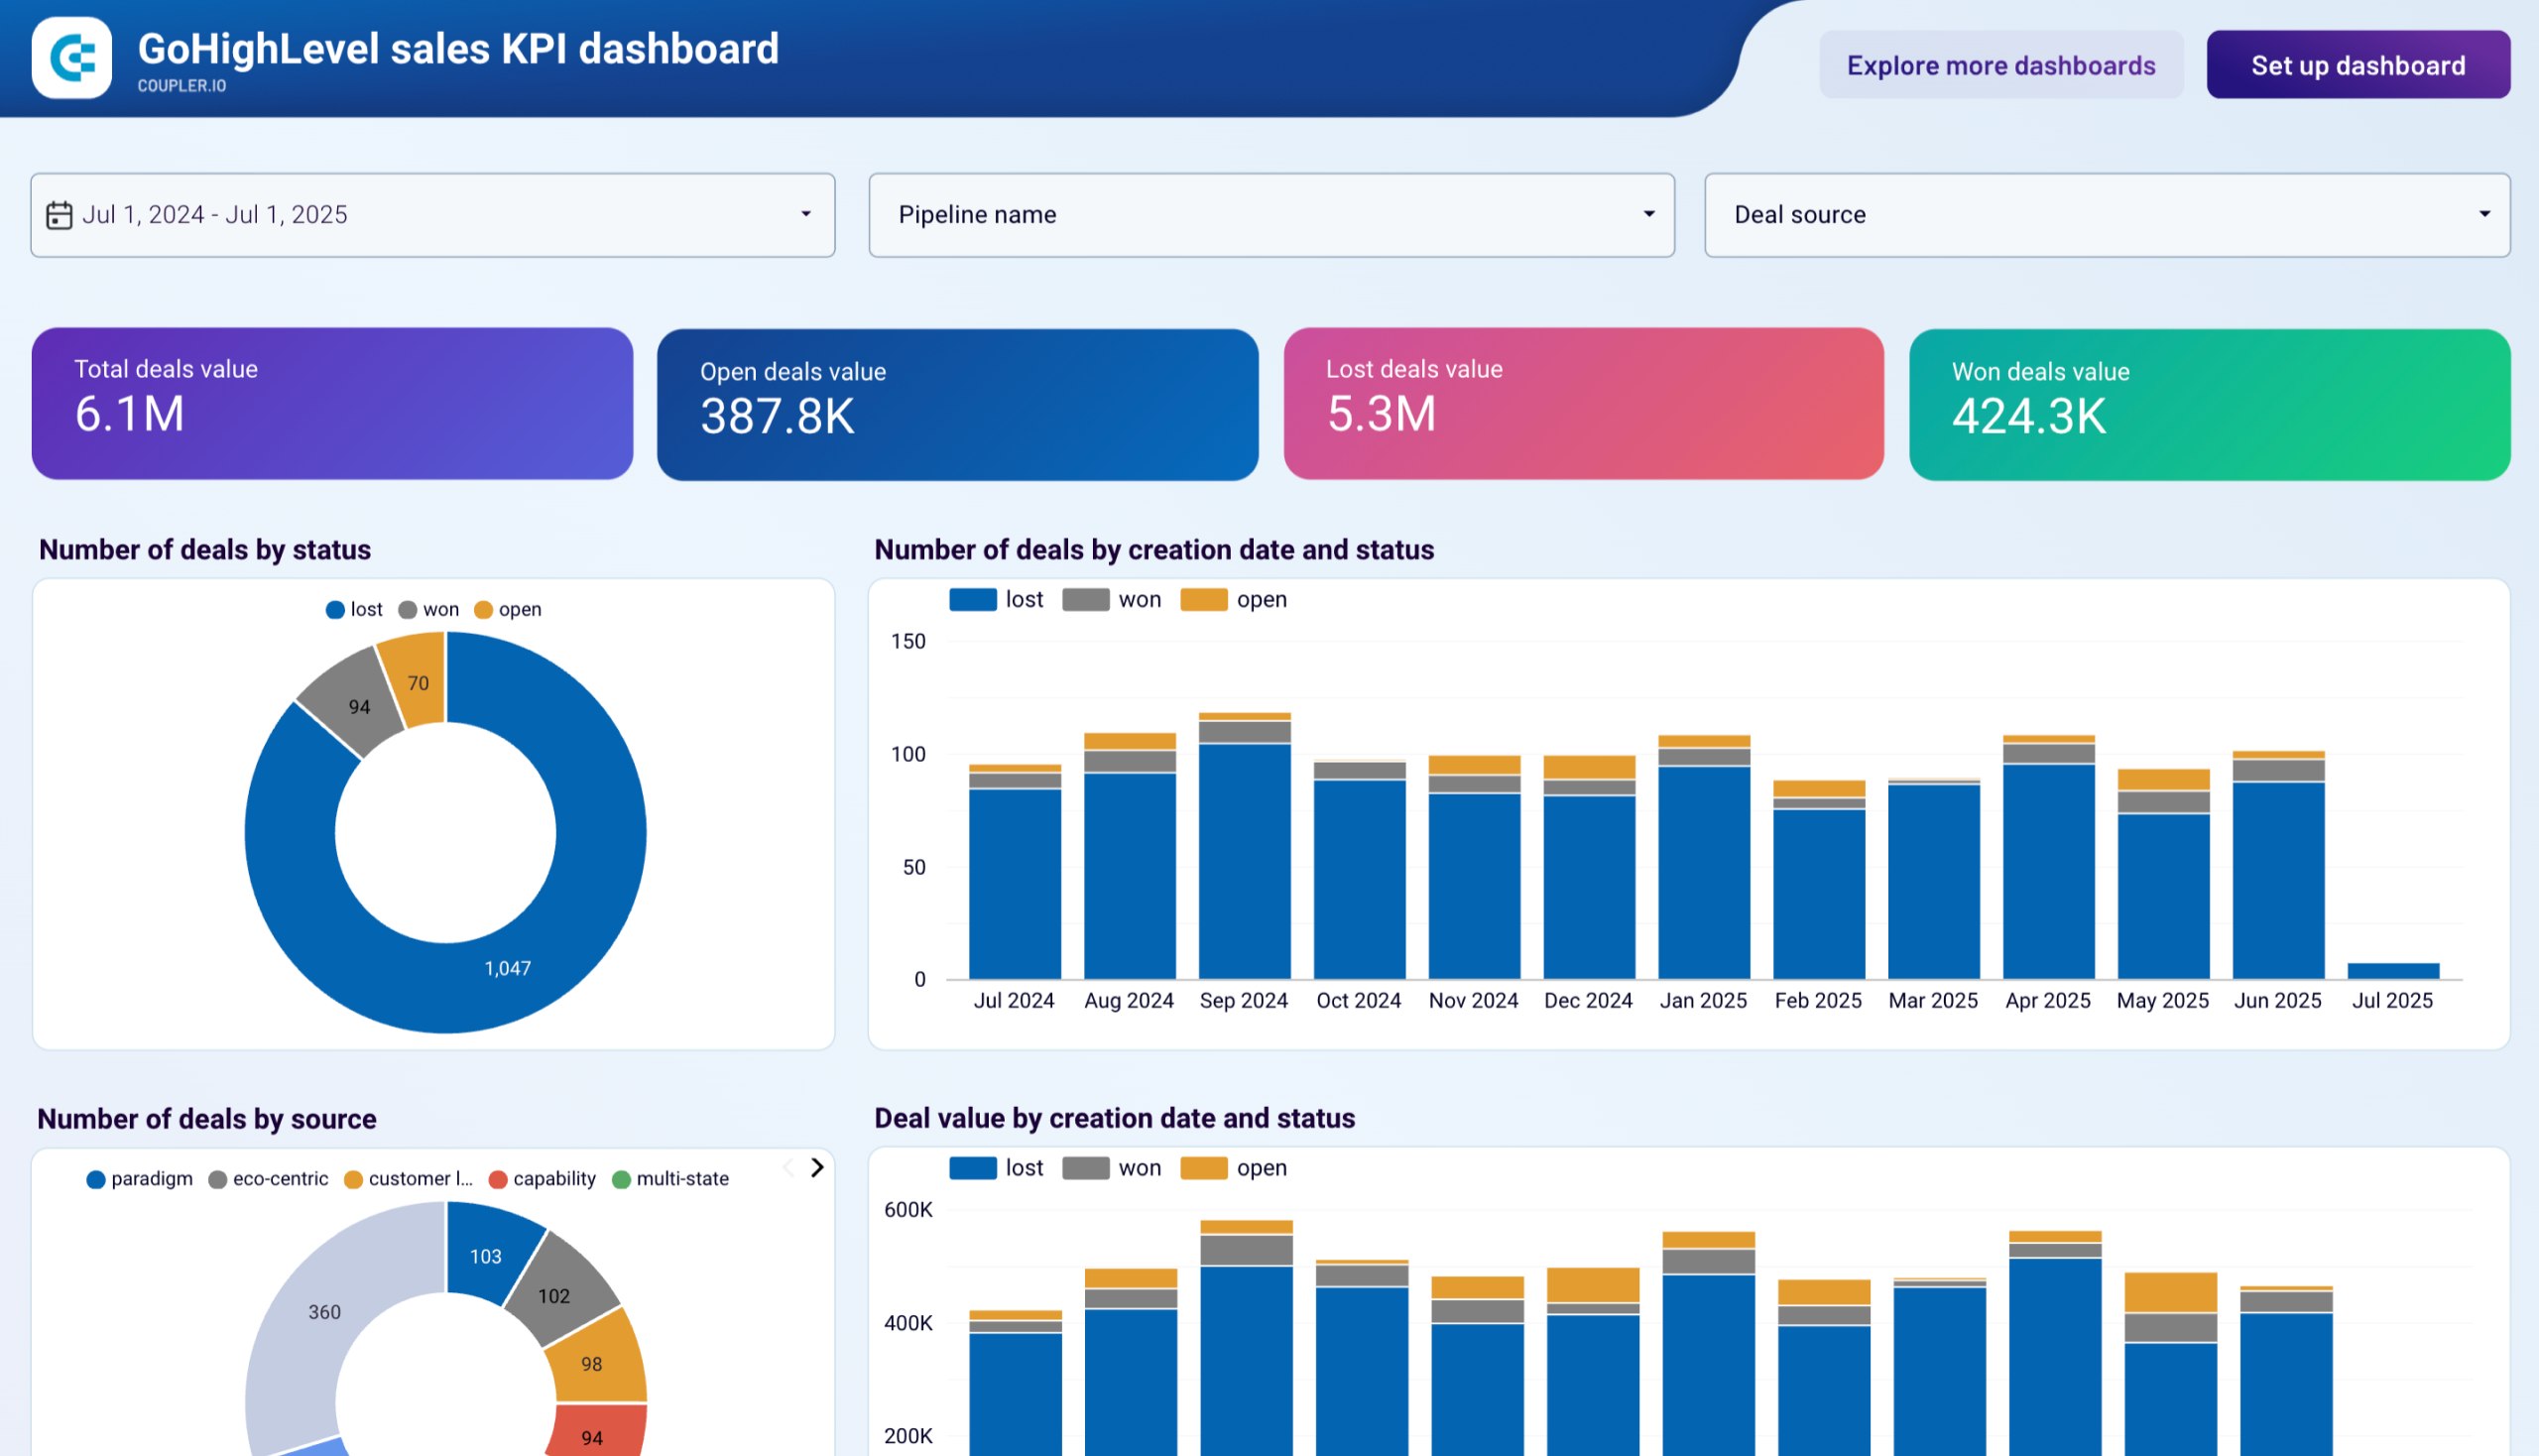
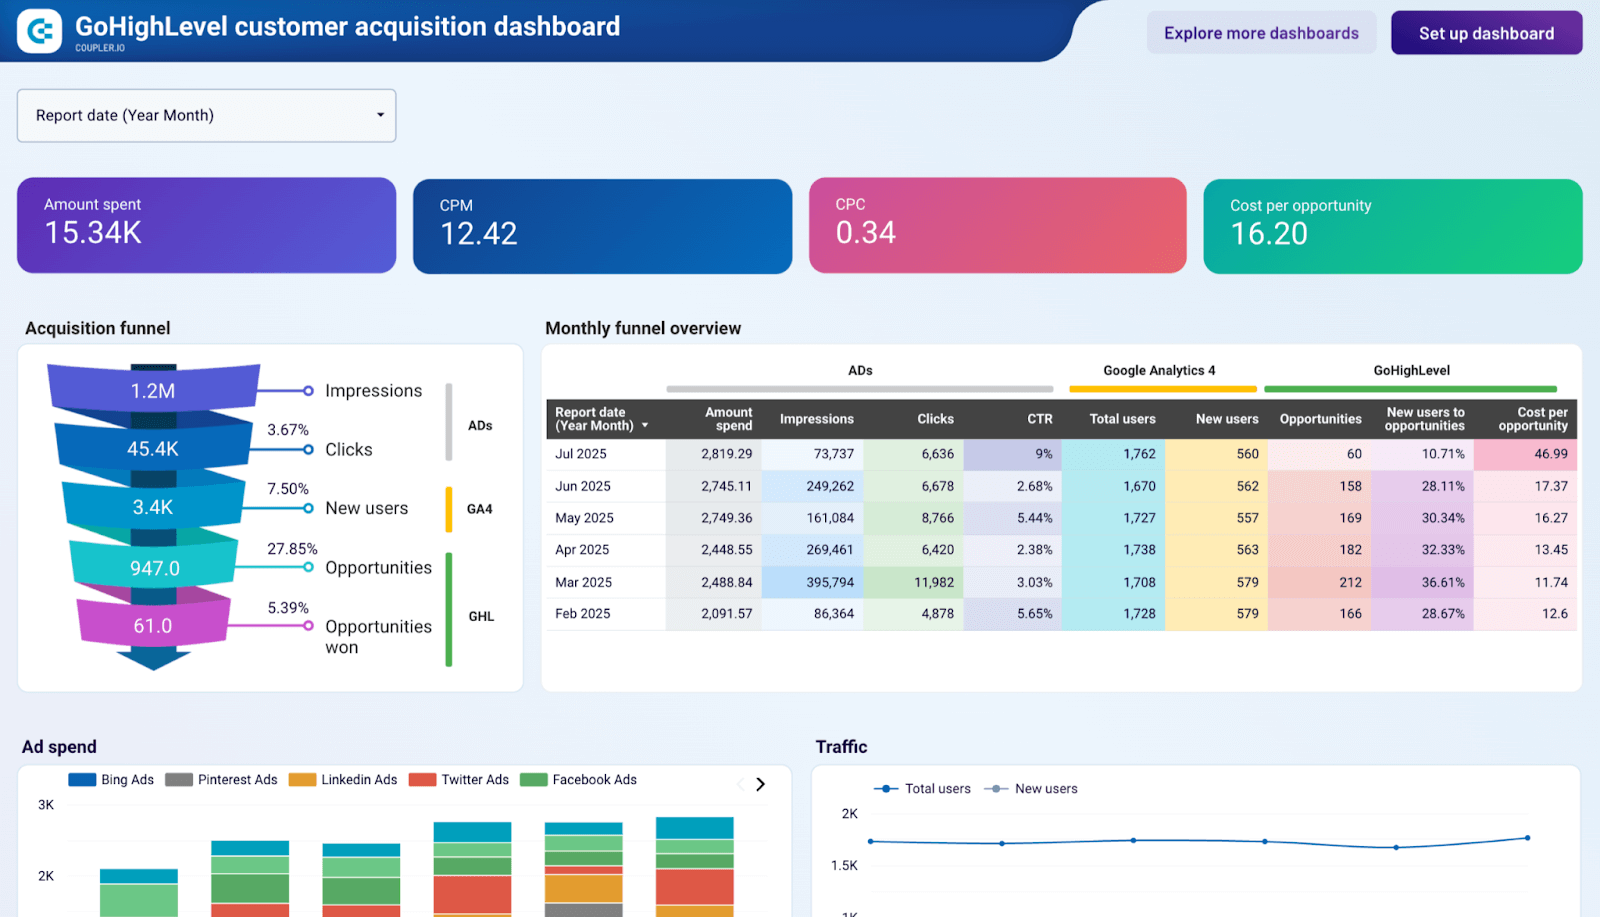
#40. Customer acquisition dashboard for GoHighLevel by Coupler.io
This comprehensive CRM dashboard combines GoHighLevel pipeline data with GA4 and advertising performance across multiple platforms (Bing Ads, Facebook Ads, LinkedIn Ads, etc.) to reveal your complete customer acquisition funnel. You can track how marketing investments translate into actual opportunities and wins, monitor monthly conversion trends, and analyze which advertising channels deliver the best cost per opportunity for your business.
GoHighLevel customer acquisition dashboard
 Preview dashboard
GoHighLevel customer acquisition dashboard
Preview dashboardTry this free dashboard for yourself by signing up for Coupler.io. A template is available in Looker Studio, and you can easily load data from your advertising and GoHighLevel accounts with the built-in connector.
Dashboard metrics:
- Amount spent
- CPM
- CPC
- Cost per opportunity
- Impressions
- Clicks
- New Users
- Opportunities
- Opportunites won
#41. Salesforce sales analytics dashboard by Coupler.io
Another customer acquisition dashboard but this time for Salesforce. Like the one above, it provides insights into the performance of your advertising campaigns and organic traffic to bring customers.
The dashboard displays impressions, clicks, new users, and costs of acquiring customers. The source for these insights is not only Pipedrive but also GA4 and the advertising platforms you use like Google Ads, Facebook Ads, etc. With this in mind, you can see how many clicks your ad campaigns brought and how much you spent on them.
Salesforce sales analytics dashboard
 Preview dashboard
Salesforce sales analytics dashboard
Preview dashboardThe built-in connector by Coupler.io collects data from GA4, advertising platforms and Salesforce to present it in the form of actionable insights.
Dashboard metrics:
- Impressions
- Clicks
- Amount spend
- Cost per lead
- Cost per sales qualified lead
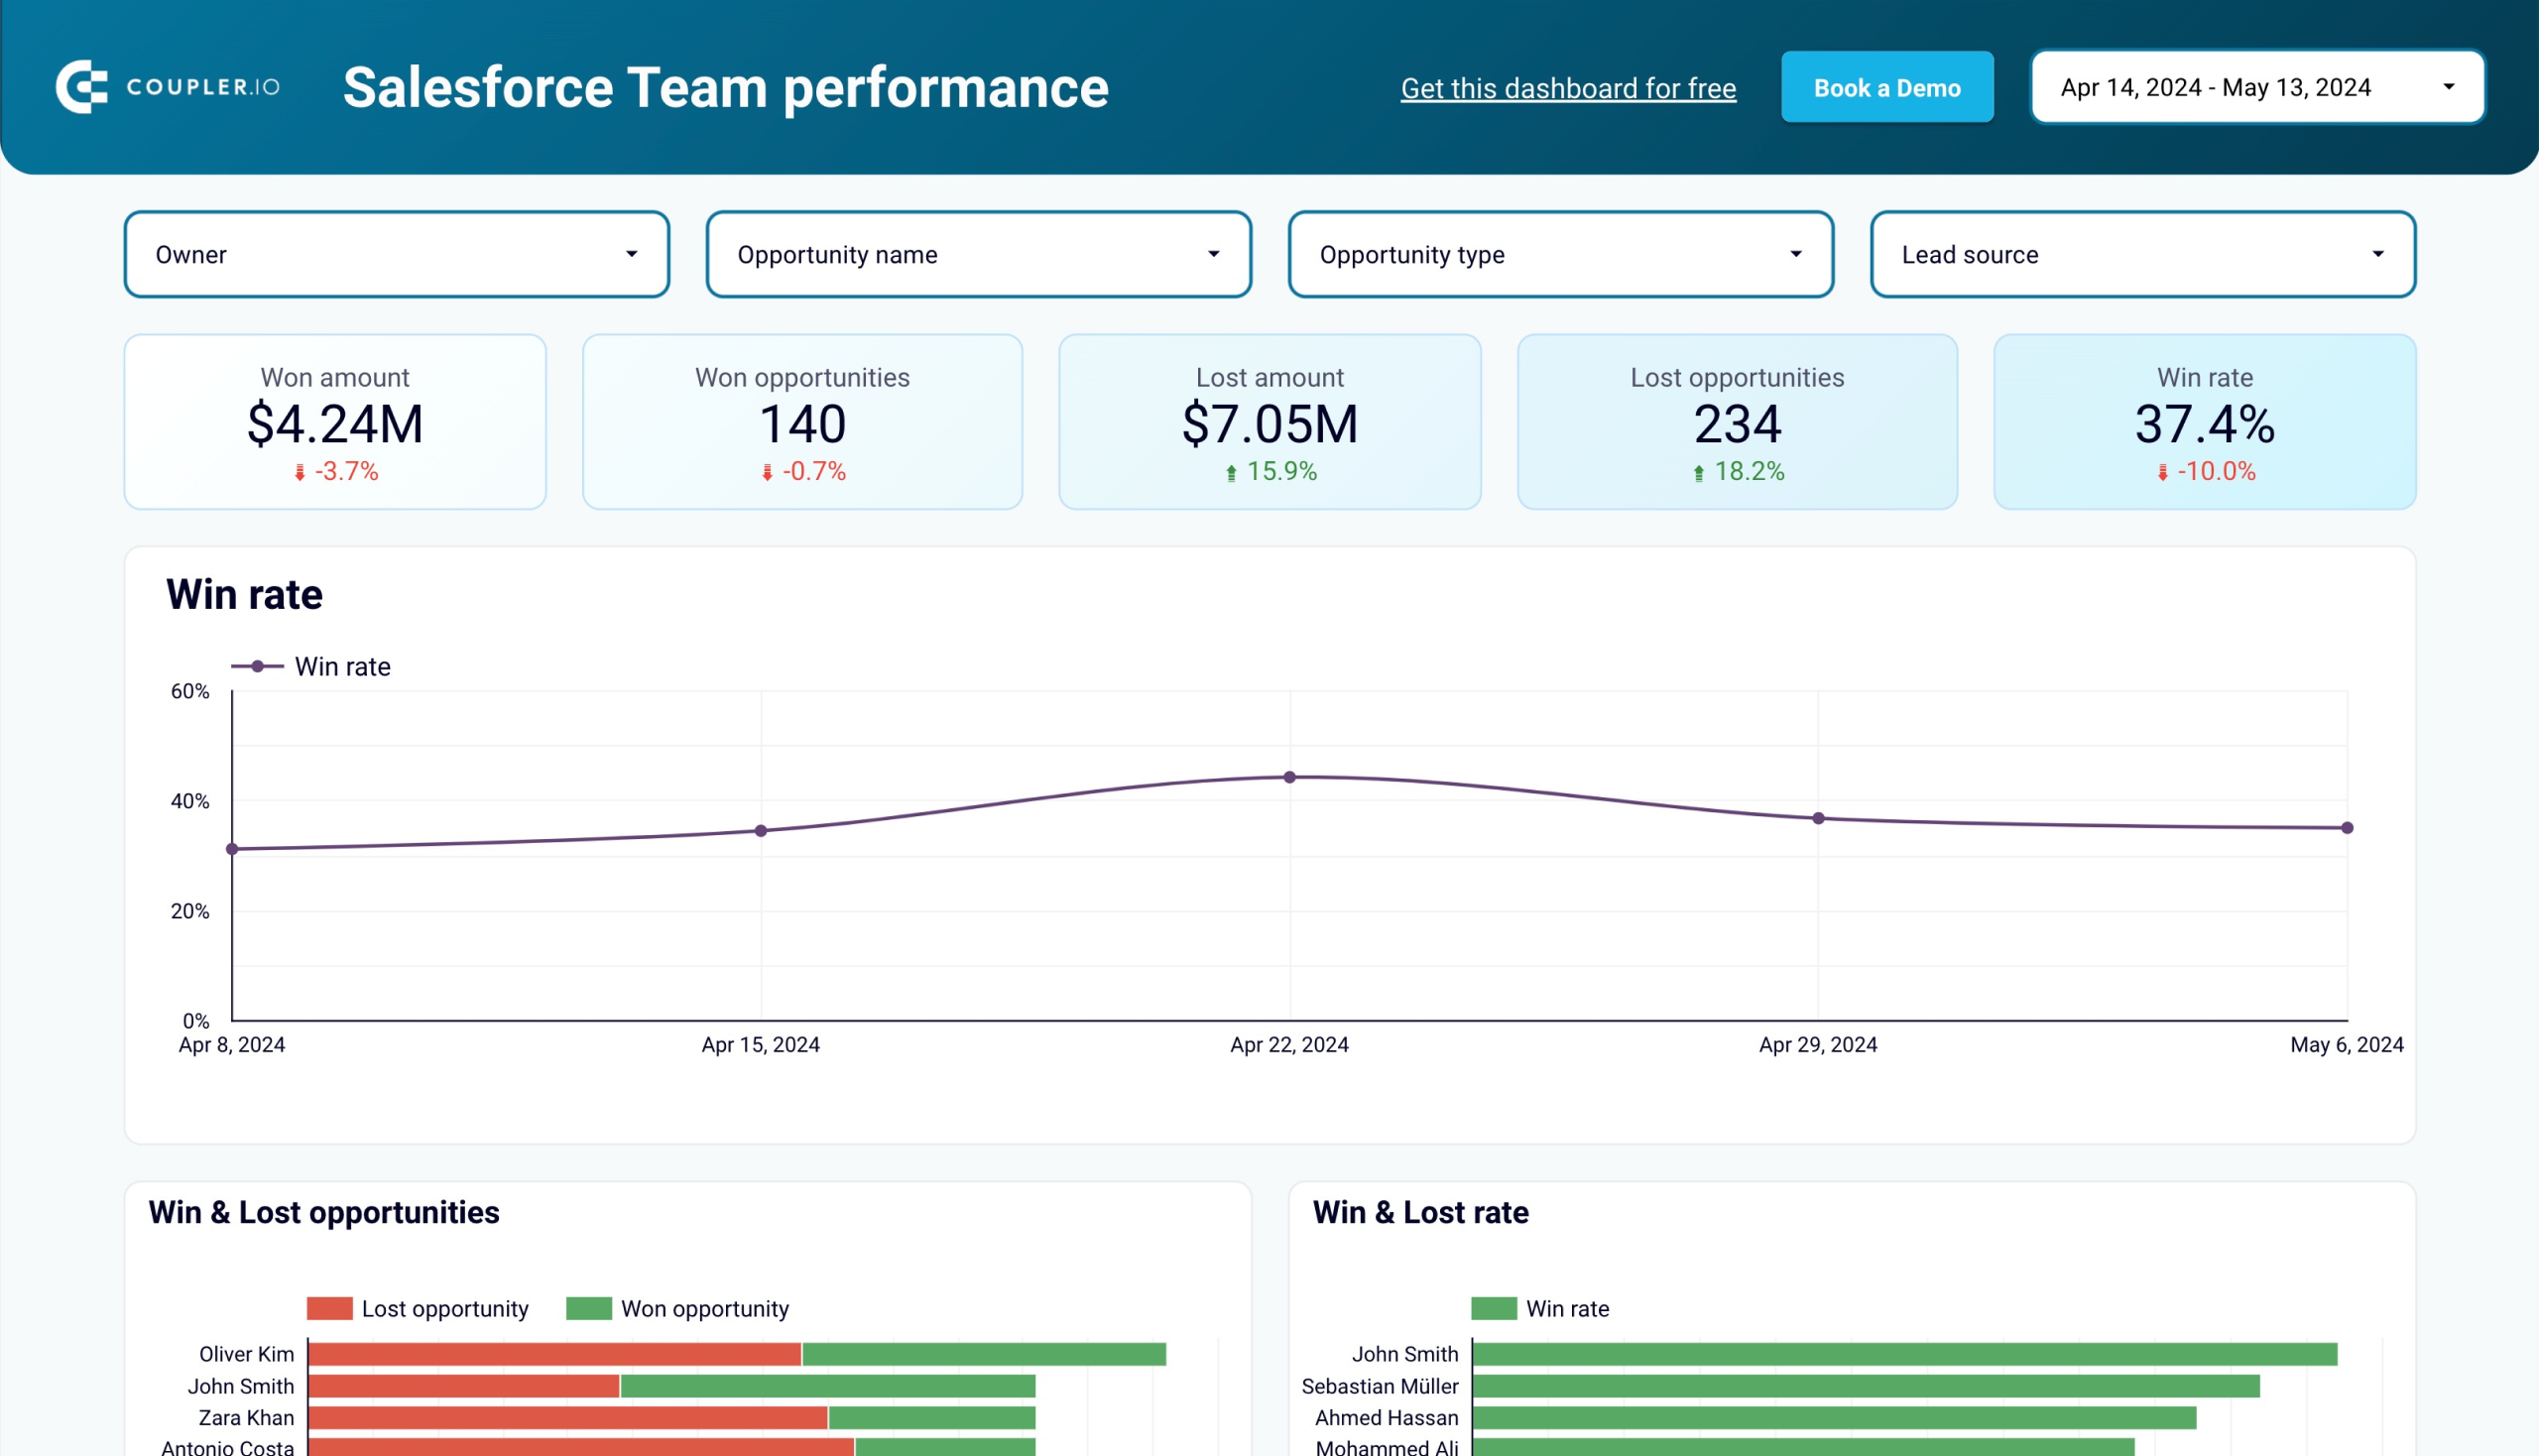
#42. Sales team performance dashboard for Salesforce by Coupler.io
Those who need to analyze their sales team performance can make use of this dashboard template. It provides a sales overview with key metrics such as won and lost amount. The insights are broken down by each member of your sales team.
Salesforce sales team performance dashboard
 Preview dashboard
Salesforce sales team performance dashboard
Preview dashboardThe dashboard is designed for Salesforce data. You only need to connect your Salesforce account to load your data to the dashboard. Try it yourself right away for free.
Dashboard metrics:
- Won amount
- Won opportunities
- Lost amount
- Lost opportunities
- Win rate
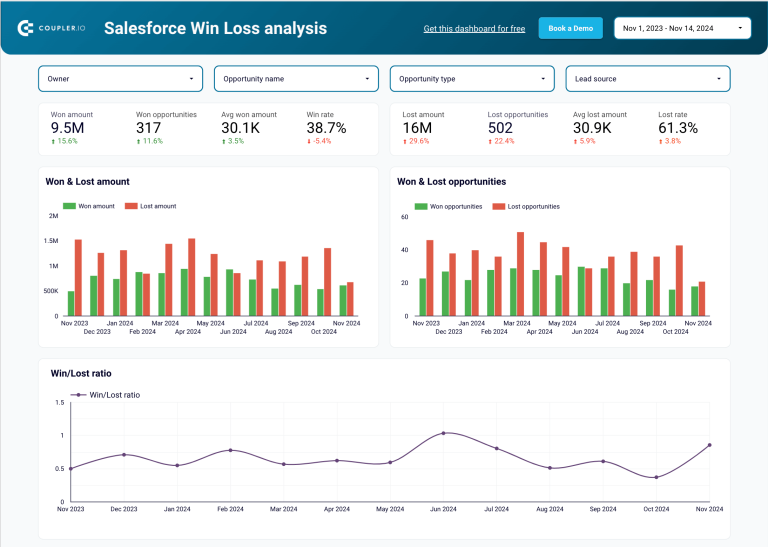
#43. Salesforce Win Loss analysis dashboard by Coupler.io
The Salesforce win loss dashboard provides insights into the intricacies of closing deals. You can track your lost and won opportunities and get an overview of the key sales metrics.
Salesforce Win Loss analysis dashboard
 Preview dashboard
Salesforce Win Loss analysis dashboard
Preview dashboardThese insights play a role in improving sales techniques, understanding customer behavior, and refining strategies. The win loss dashboard template is equipped with the Salesforce connector. Just connect your account and start using the dashboard right away.
Dashboard metrics:
- Won amount
- Won opportunities
- Lost amount
- Lost opportunities
- Win rate
#44. Calendly event dashboard by Coupler.io
If you want to analyze events booked in Calendly, then this event dashboard template by Coupler.io is your pick. The report has a built-in Calendly connector, so you’ll get your data in a couple of minutes.
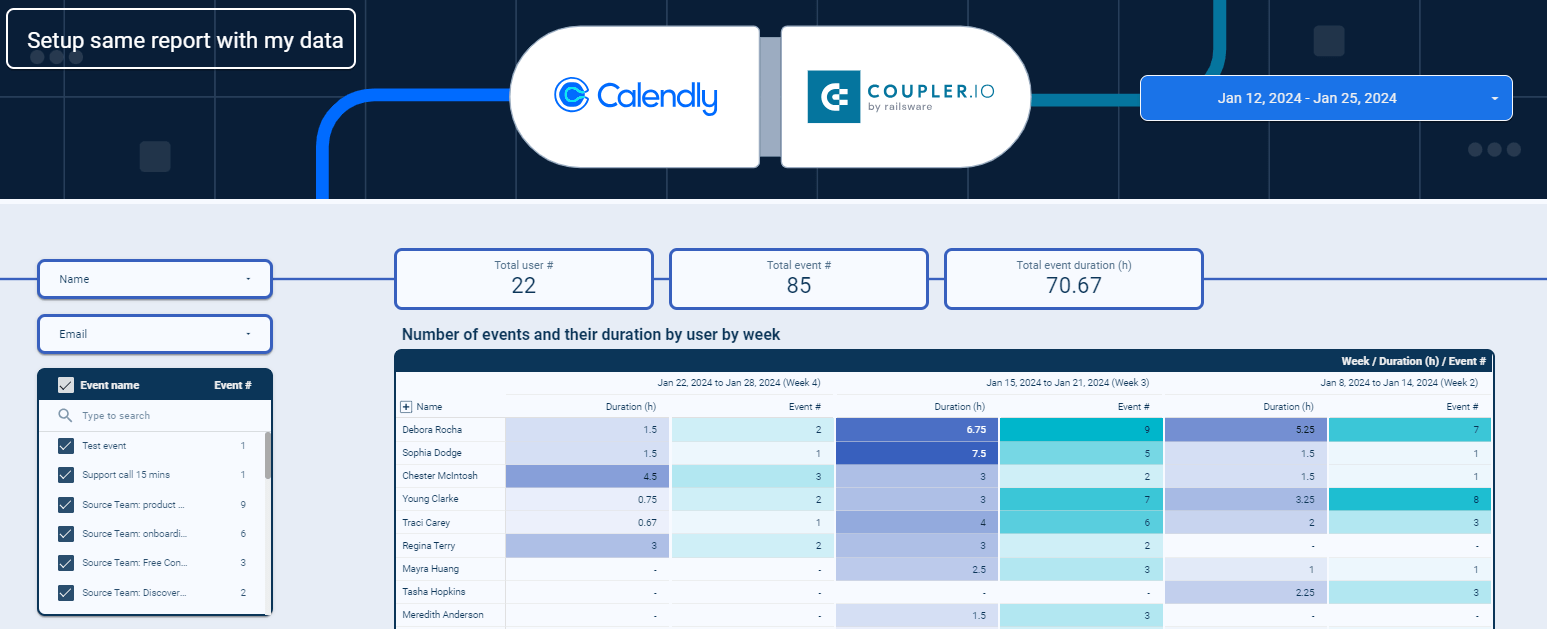
The dashboard allows you to identify the most popular time slots and optimize your scheduling process. In addition to that, you can benefit from other parts of the dashboard, such as event breakdown by teams, detailed information about events, and so on.
Dashboard metrics:
- Total users
- Total events
- Event duration
- Most popular time of day
- Most popular day of the week
- Most popular day of the month
- Most popular month of the year
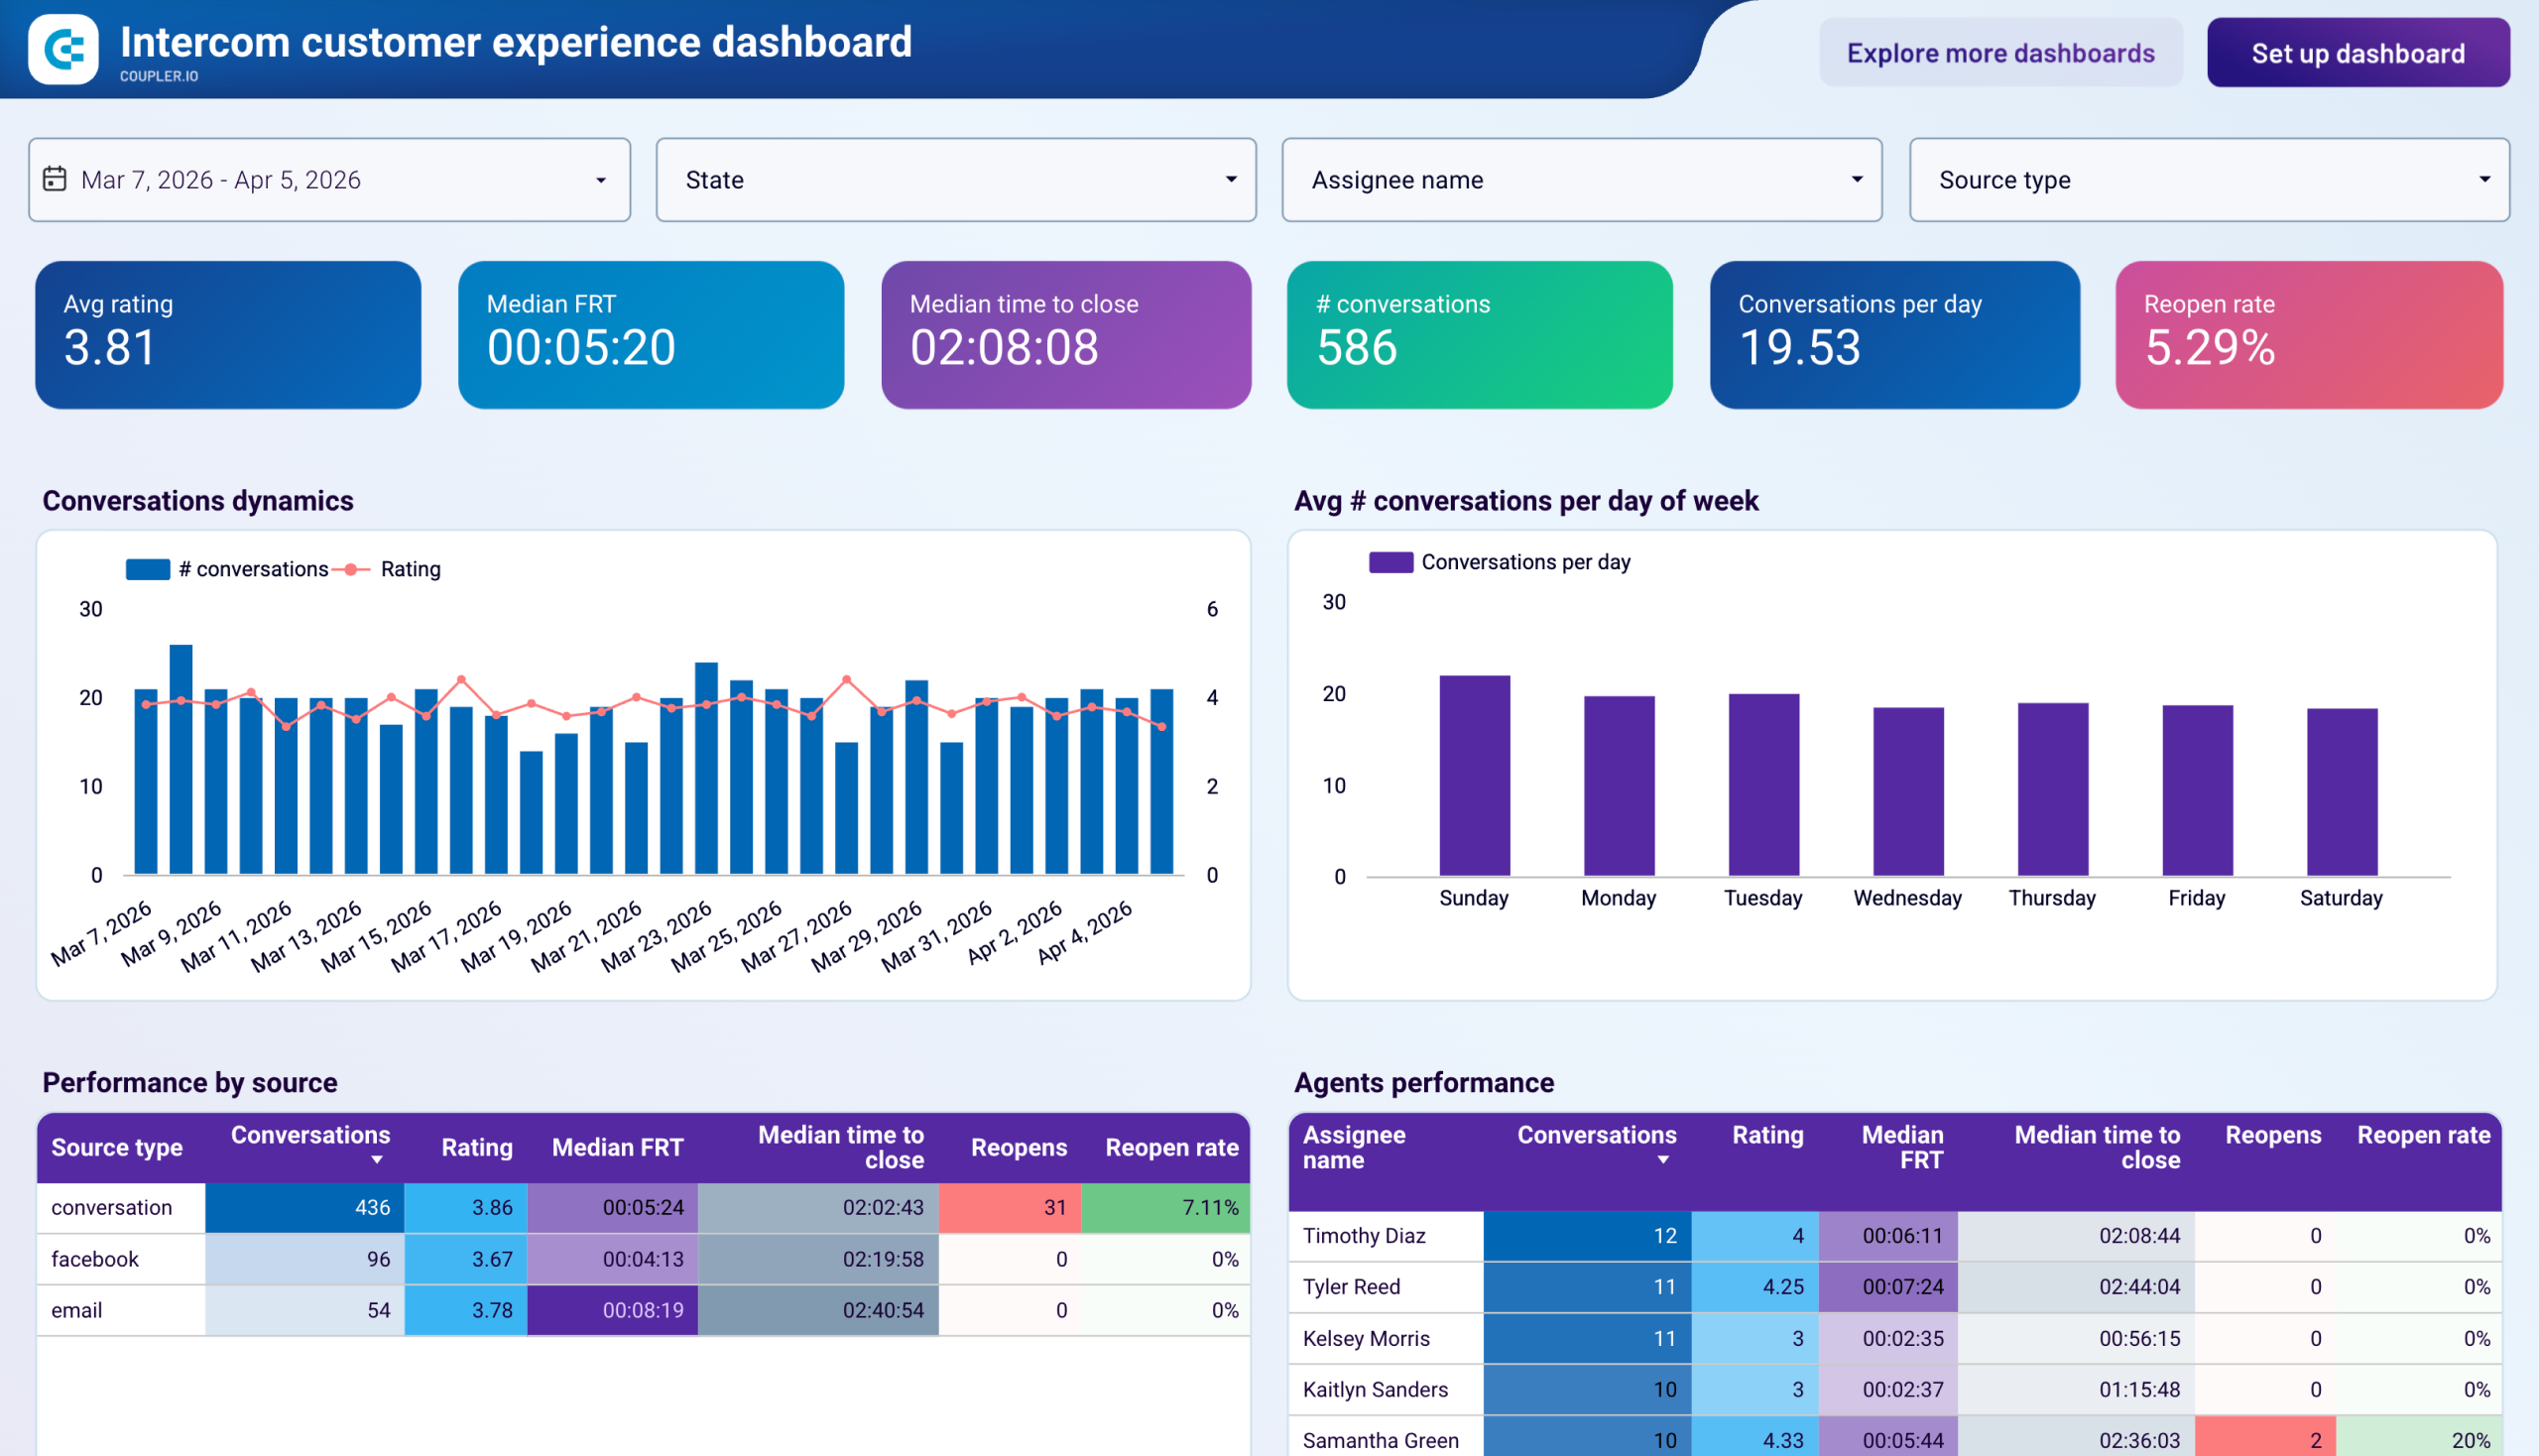
#45. Intercom customer experience dashboard by Coupler.io
CRM dashboards track what happens before the sale. This one picks up after it. Coupler.io’s Intercom customer experience dashboard shows essential metrics from your Intercom account in one Data Studio report.
Intercom customer experience dashboard
 Preview dashboard
Intercom customer experience dashboard
Preview dashboardA timeline chart plots daily conversation counts alongside customer ratings, so you can catch periods where volume spikes and satisfaction drops at the same time. The day-of-week breakdown shows which days consistently run heavier, helping you schedule staff coverage to match actual demand. A source performance table splits metrics by channel (in-app chat, Facebook, email), so you can spot channels with slower response times or lower ratings. The agents table ranks every team member by conversation count, rating, median first response time, time to close, and reopen rate, giving managers a factual basis for coaching conversations.
Dashboard metrics:
- Average rating
- Median first response time (FRT)
- Median time to close
- Number of conversations
- Conversations per day
- Reopen rate
Ecommerce dashboards in Looker Studio
#46. Shopify orders dashboard by Coupler.io
Coupler.io offers a dashboard template to access the performance of your Shopify ecommerce shop. Basically, it’s a sales Shopify dashboard since it allows you to track total sales, discounts, outstanding amount, order processing time, etc.
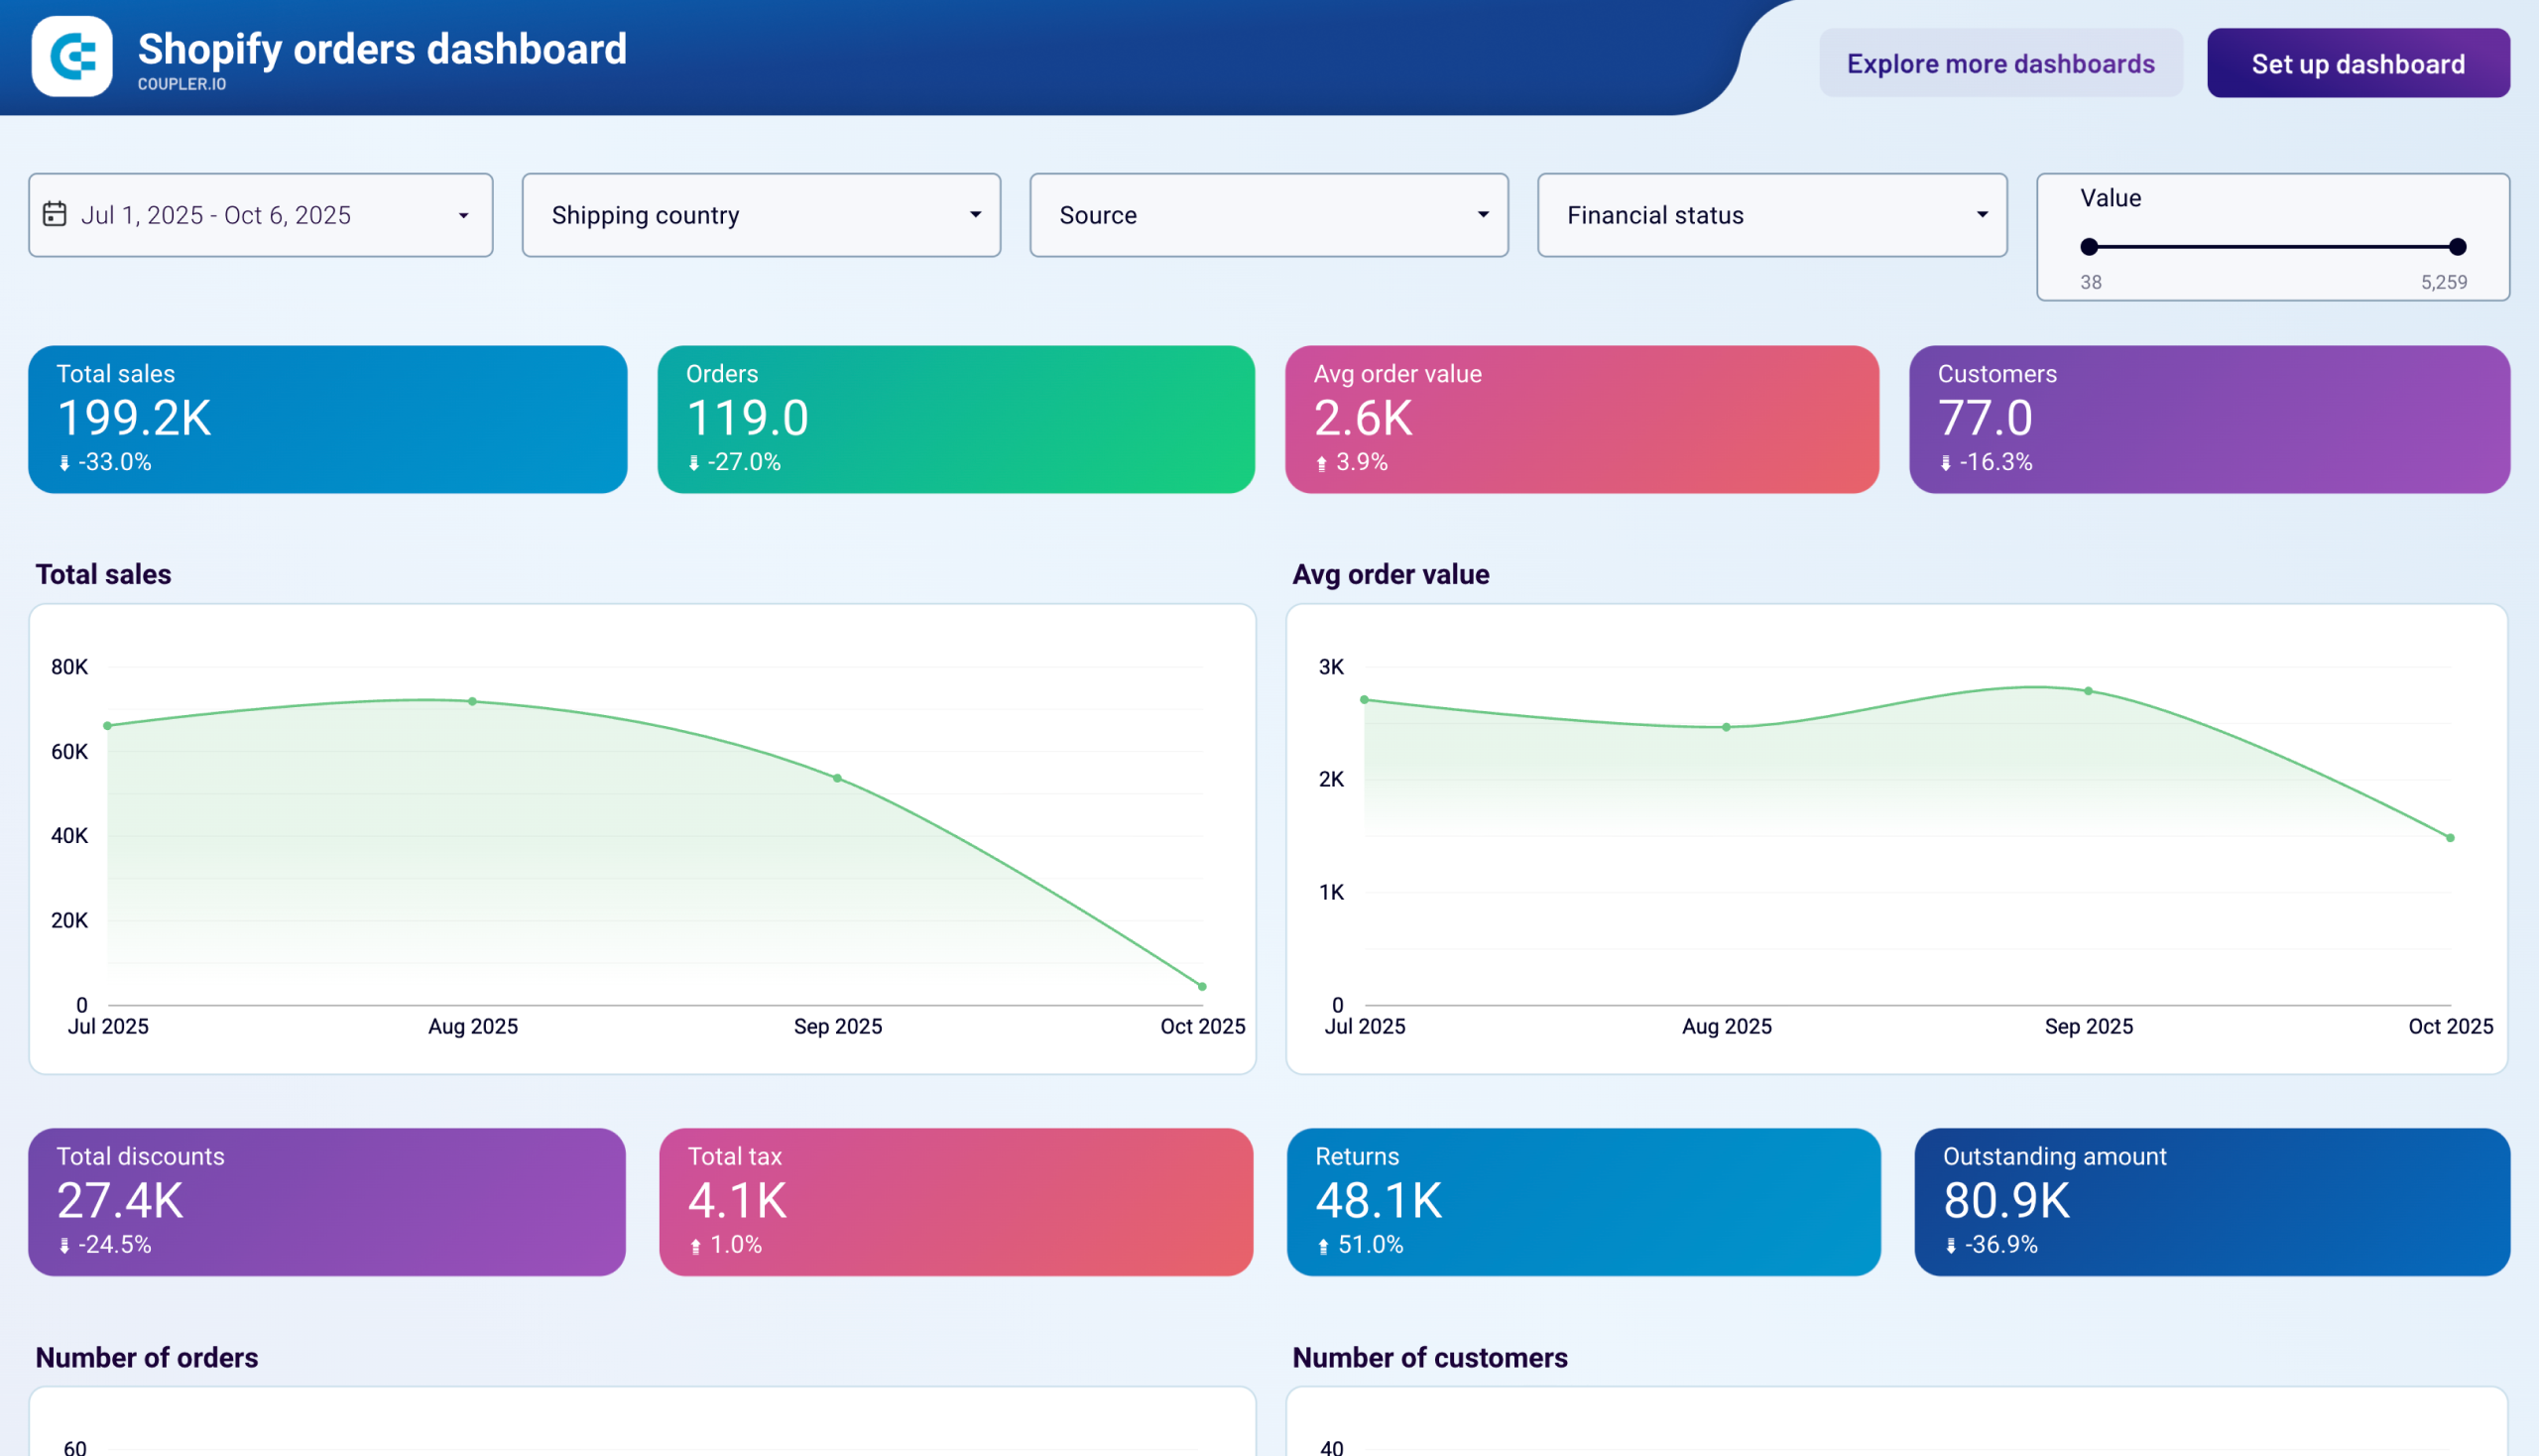
This dashboard template has several filters to filter your orders by shipping country, source, and financial status. Order performance breakdown is also available in the form of a table at the bottom. This is one of the most useful Looker Studio dashboard templates for ecommerce businesses.
Dashboard metrics:
- Total orders
- Total discounts
- Total price
- Total tax
- Outstanding amount
- Average order value
- Average order processing time, etc.
#47. Shopify store traffic overview dashboard by Coupler.io
This dashboard integrates Google Analytics 4 and Shopify data to give ecommerce store owners a unified view of visitor activity and purchasing behavior. It’s designed for teams who want to understand where traffic comes from and how it converts into sales.
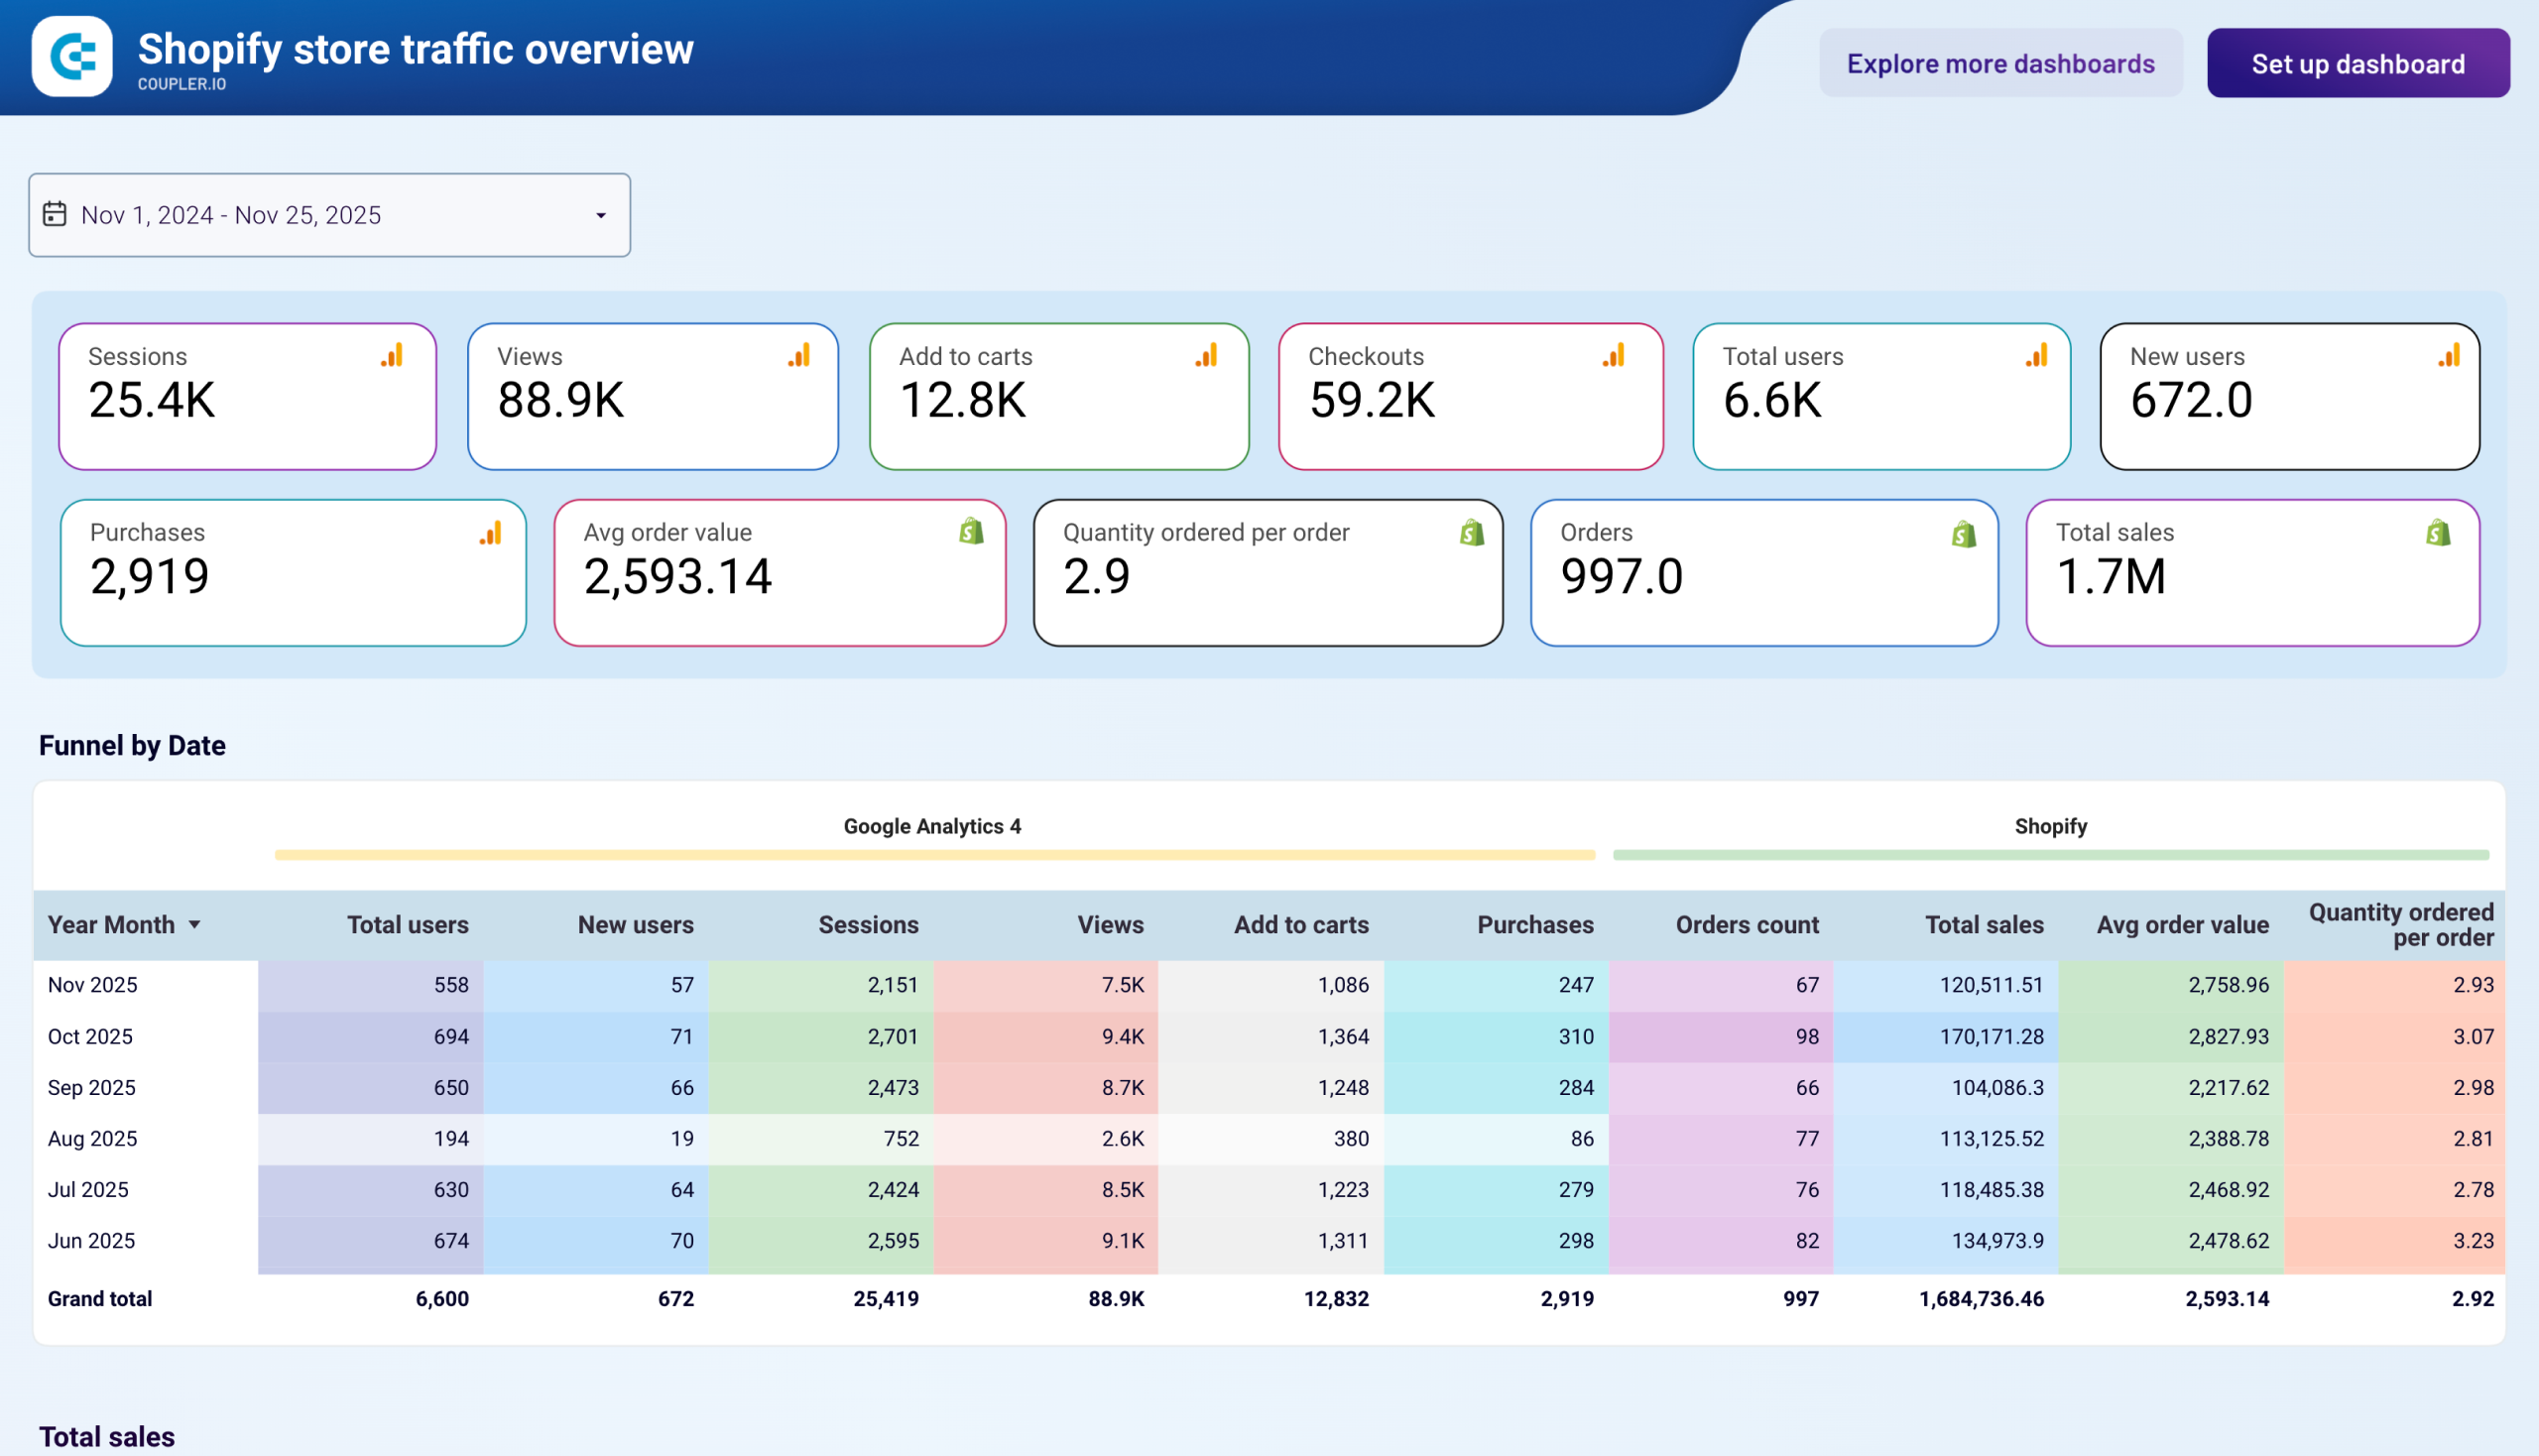
You can monitor key GA4 and Shopify KPIs together, including sessions, add-to-carts, checkouts, revenue, and average order value. A funnel table shows how visitors progress from arriving at your store to completing a purchase, helping you identify drop-off points. The Shopify store traffic dashboard also breaks down traffic by source and highlights your top-selling products and vendors by order volume.
Dashboard metrics:
- Sessions
- Views
- Add-to-carts
- Checkouts
- Total users
- New users
- Total purchases
- Revenue
- Average order value
#48. Shopify sales funnel dashboard
This Shopify sales funnel dashboard lets you analyze the traffic coming to your store. However, to use the dashboard, your Shopify store must be linked to Google Analytics. If so, then you’ll get insights into each traffic source performance such as views, users, checkouts, etc.
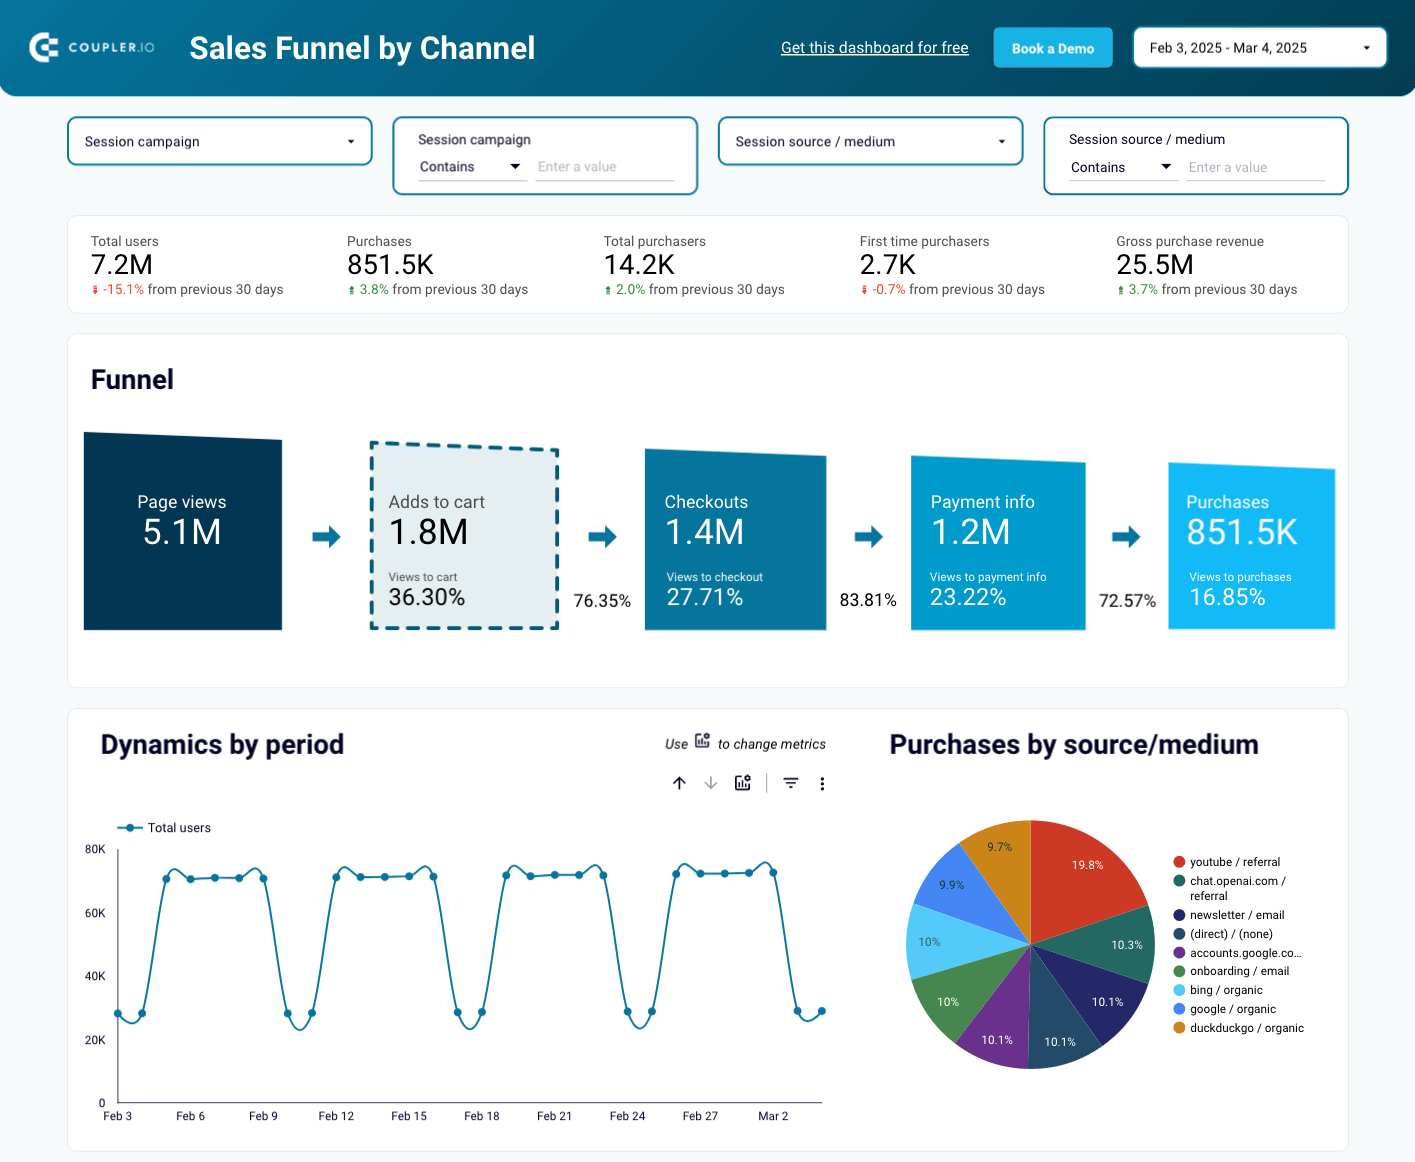
The Shopify sales funnel dashboard is ready-to-use – just connect your GA4 account to load data and enjoy your report.
Dashboard metrics:
- Users
- Purchases
- Adds to cart
- Checkouts
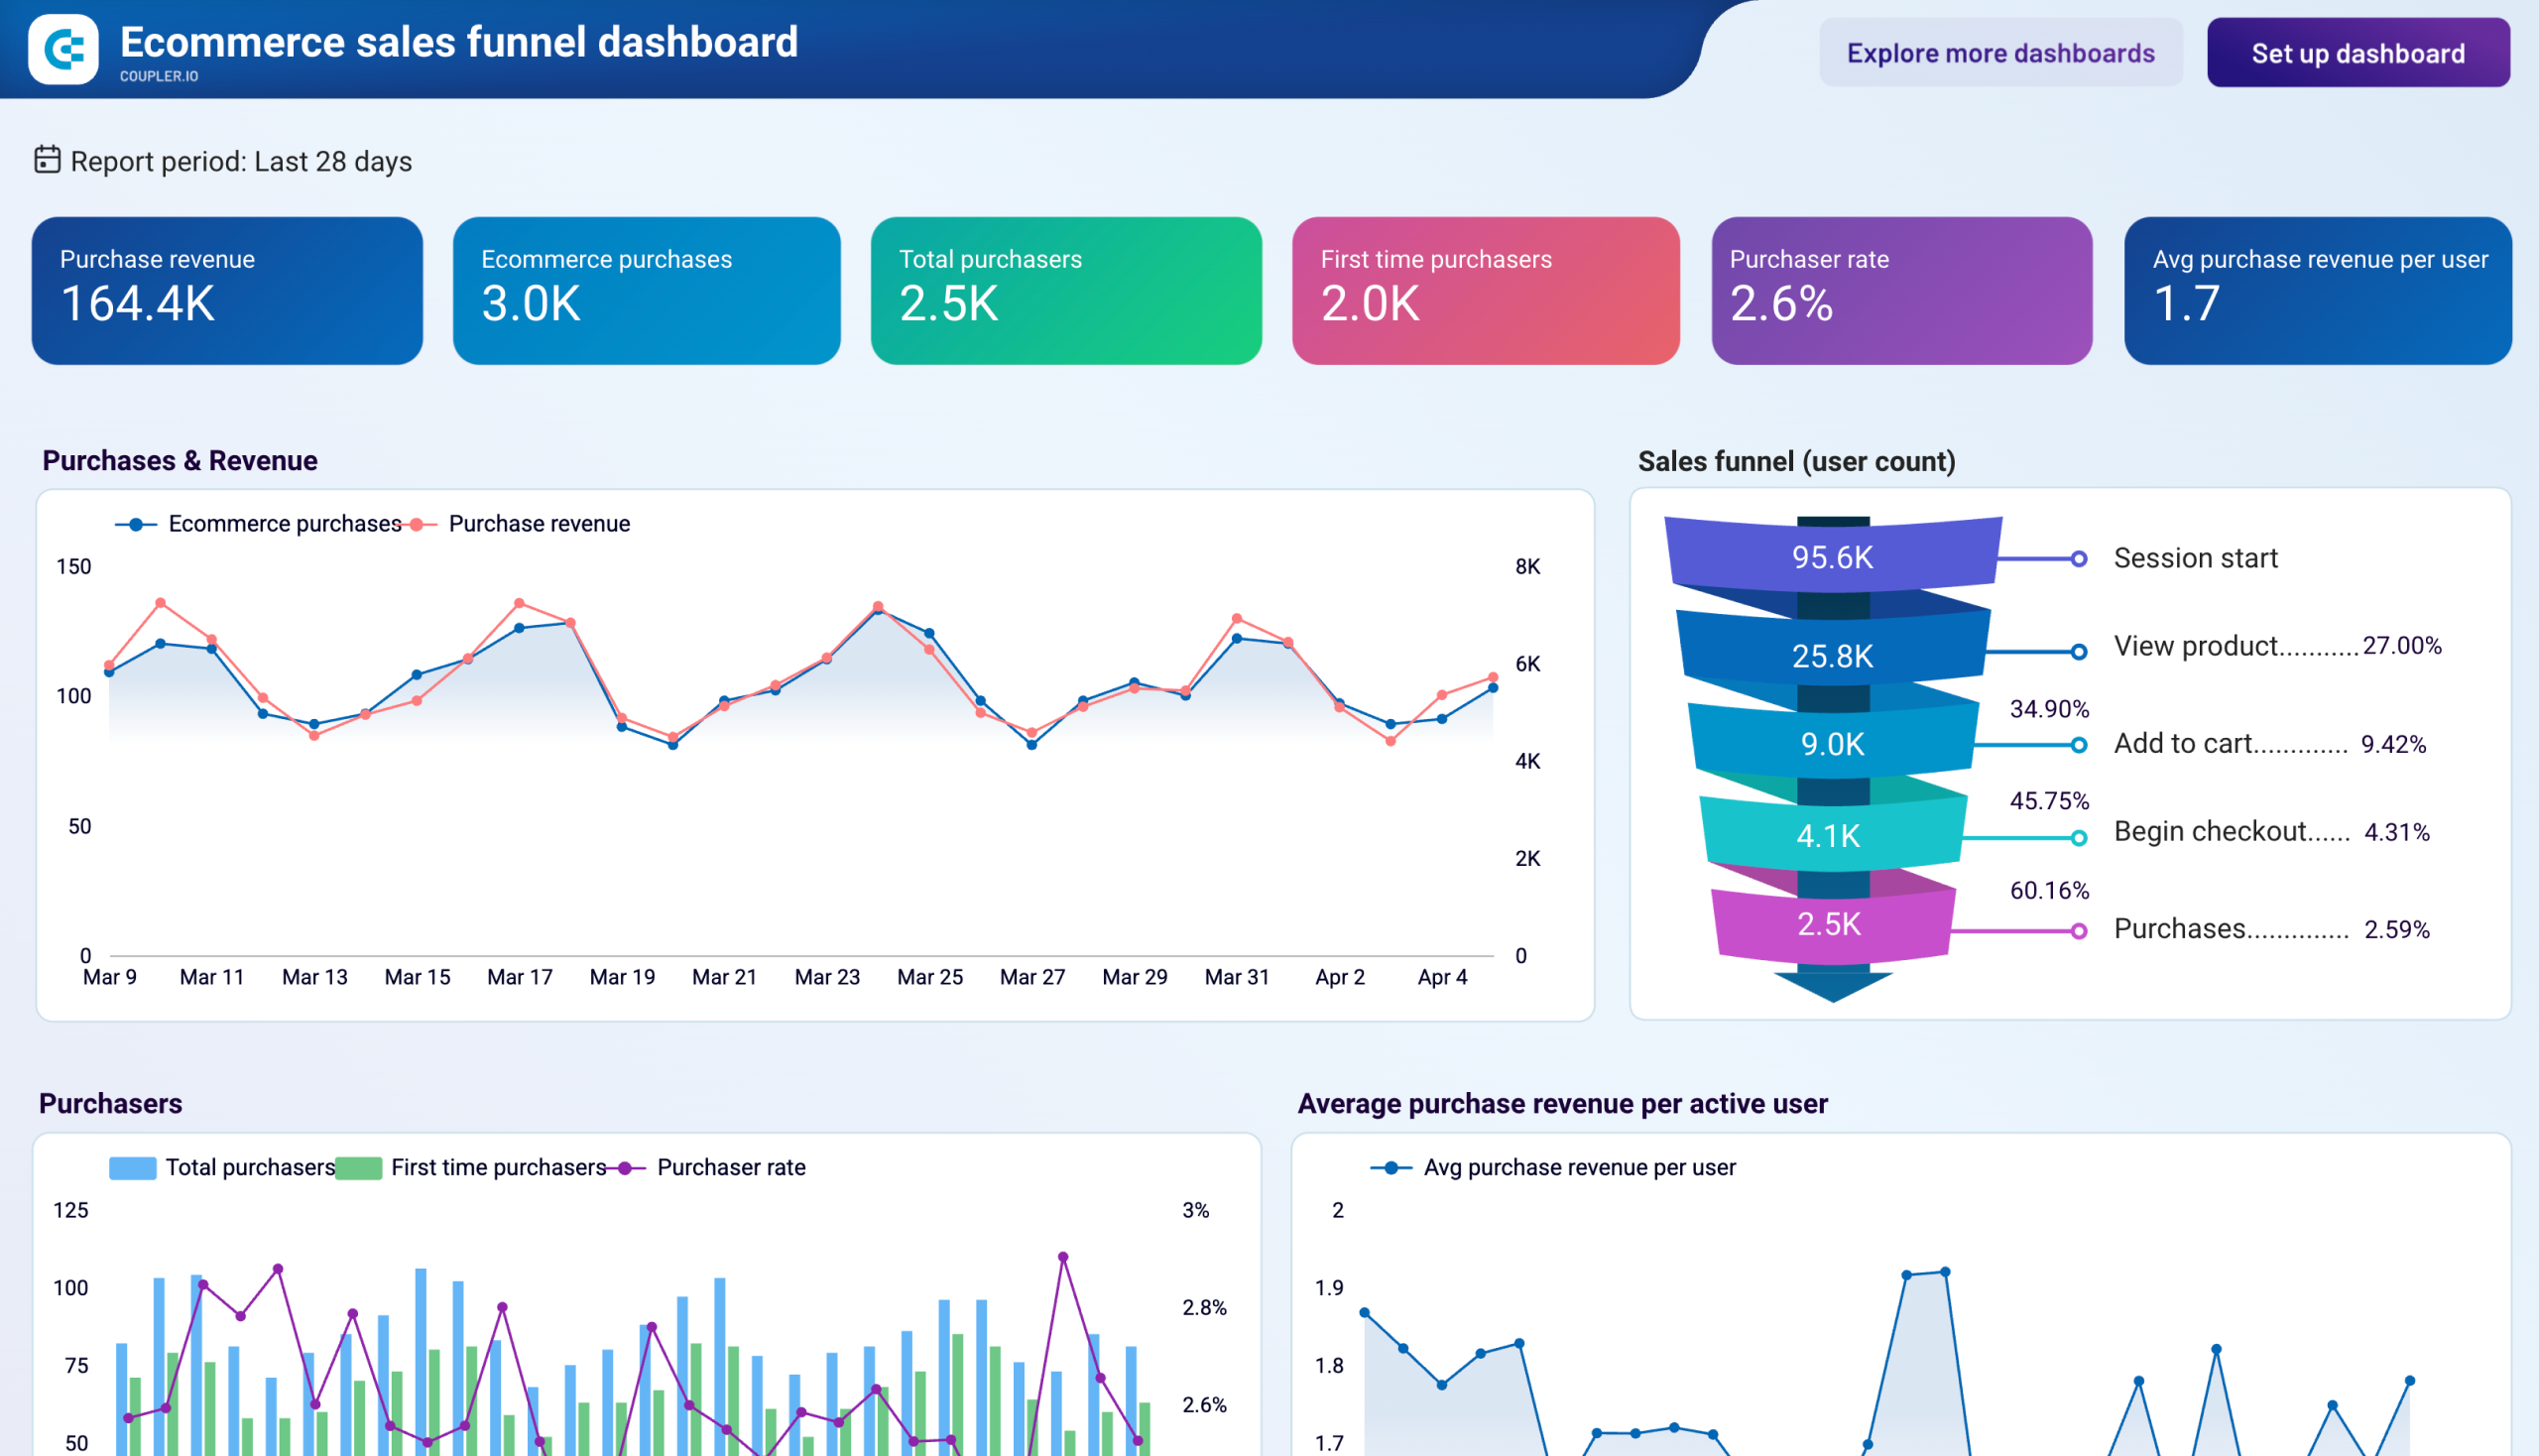
#49. Ecommerce sales funnel dashboard for GA4 by Coupler.io
If your store runs on a different platform than Shopify, or if you prefer GA4 as your single source of funnel data, this template covers the same ground without a platform dependency. It connects to Google Analytics 4 and maps user counts at each funnel step: session start, view product, add to cart, begin checkout, and purchase.
Ecommerce sales funnel dashboard
 Preview dashboard
Ecommerce sales funnel dashboard
Preview dashboardThe dashboard has four pages. The overview shows the full funnel with step-to-step conversion rates, a purchases-and-revenue time series, and a purchaser acquisition chart that separates first-time buyers from repeat customers. Sales by country ranks markets by revenue, purchaser rate, and ARPU. Sales by device compares conversion across desktop, mobile, tablet, and smart TV. Sales by item lists each product’s views, add-to-cart count, checkout count, purchases, and revenue, so you can find products with high views but low conversion or hidden performers generating outsized revenue.
Dashboard metrics:
- Purchase revenue
- Ecommerce purchases
- Total purchasers
- First-time purchasers
- Purchaser rate
- Average purchase revenue per user (ARPU)
- Funnel step counts (session start, view product, add to cart, begin checkout, purchase)
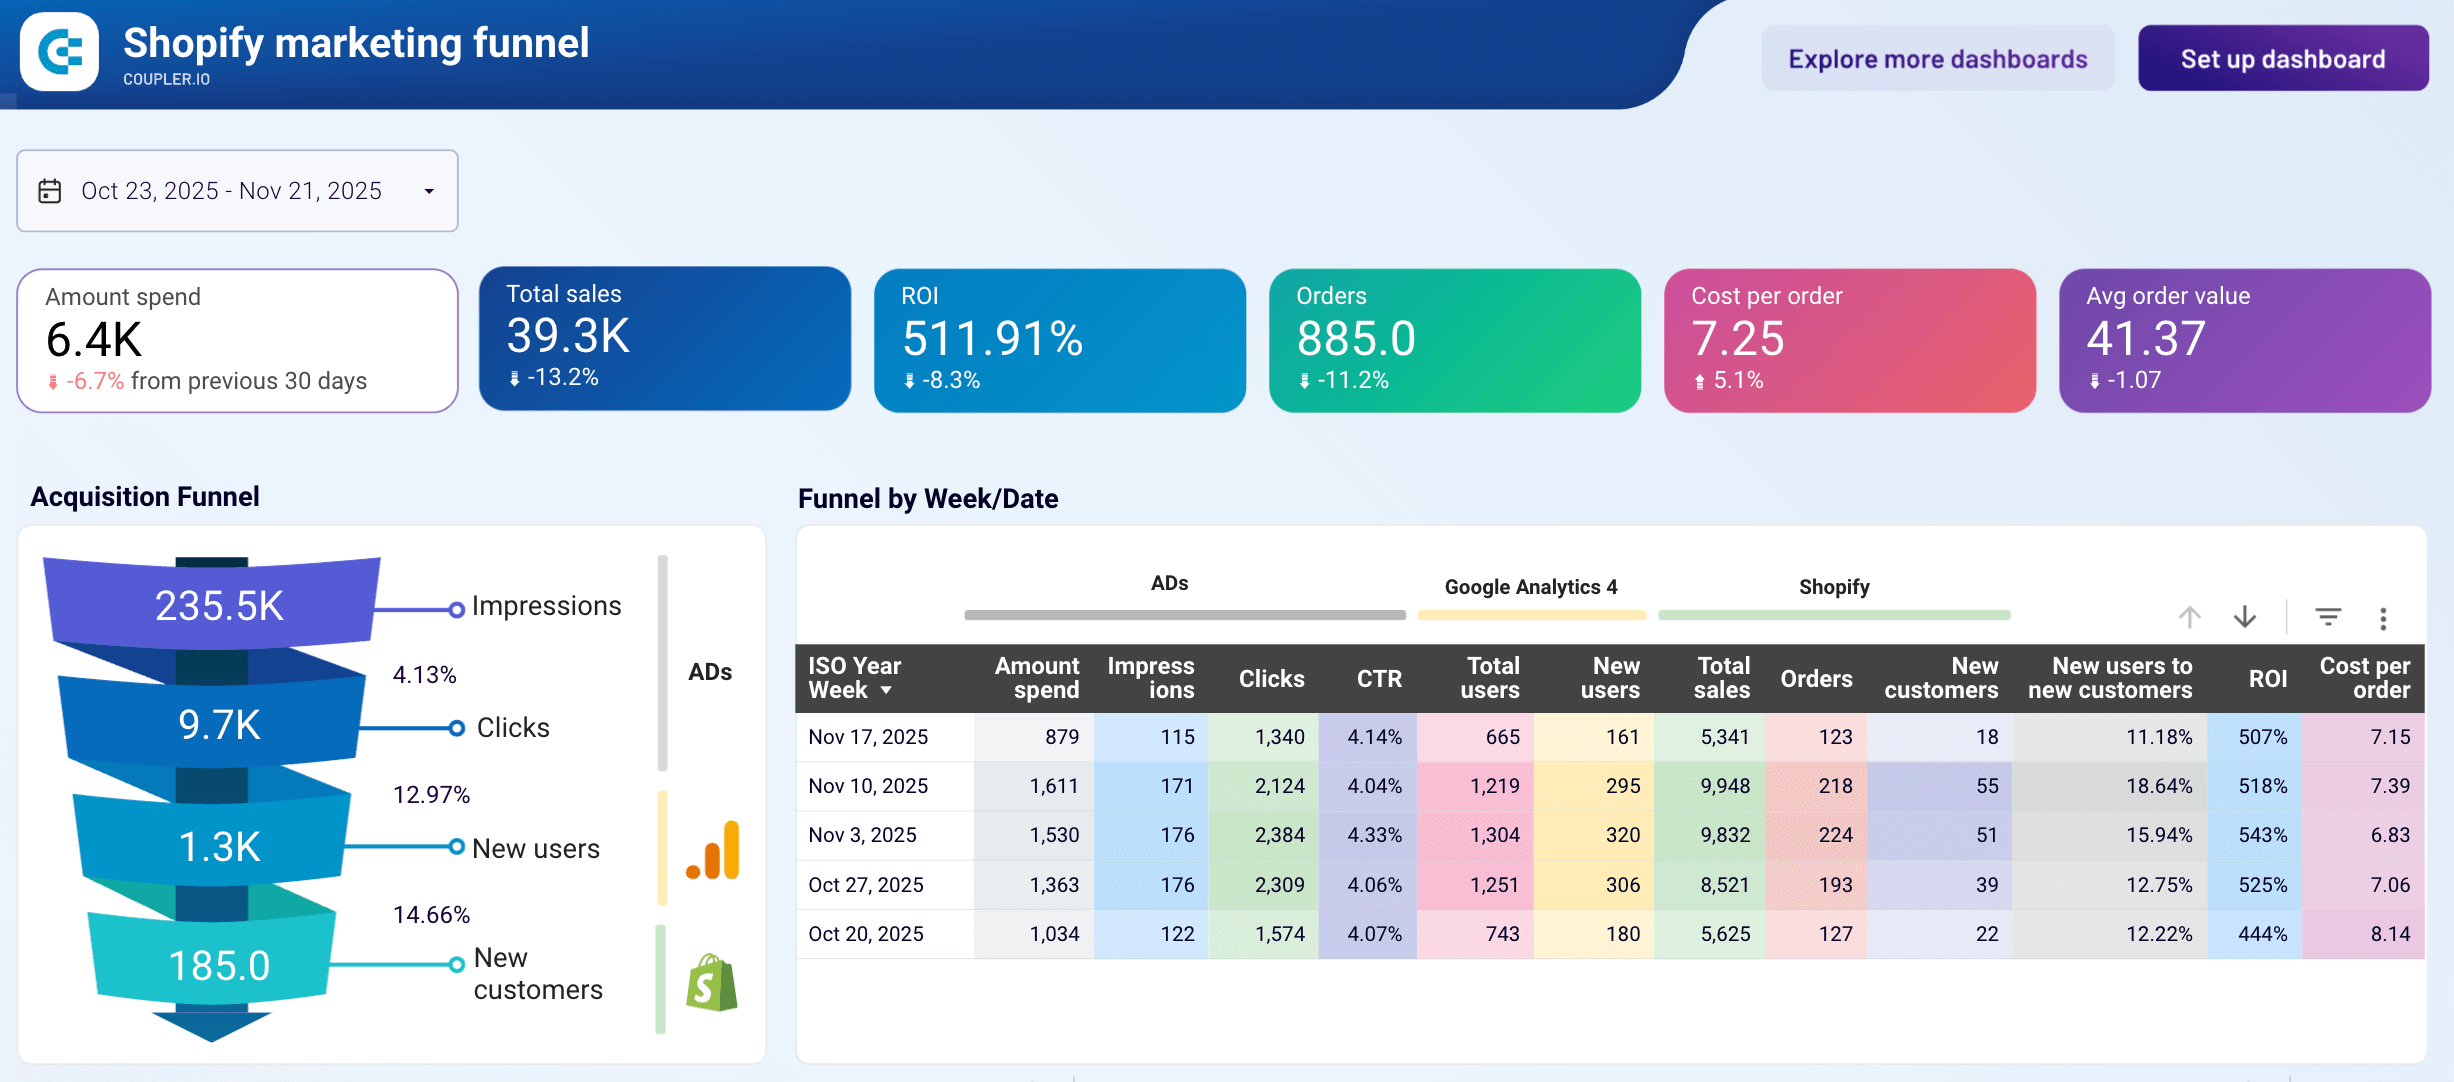
#50. Shopify marketing funnel dashboard
If you want to know the performance of not only your organic traffic but also the PPC campaigns, then opt for this Shopify dashboard template. It collects data from GA4, Facebook Ads, LinkedIn Ads, and other advertising platforms you use. The dashboard offers insights into ad amount spend, return on investment, and other crucial metrics.
Shopify marketing funnel dashboard
 Preview dashboard
Shopify marketing funnel dashboard
Preview dashboardTo start using the dashboard template, connect your accounts in GA4, Shopify, and ad platforms and, in a moment, your report will be populated with your data.
Dashboard metrics:
- Orders
- Amount spend
- Revenue
- Cost per order
- ROI
#51. Inventory dashboard for Shopify by Coupler.io
Coupler.io offers a comprehensive inventory management solution for Shopify store owners. This Looker Studio dashboard provides visibility into your product stock levels, turnover rates, and sales correlations to help prevent stockouts and optimize inventory investments.
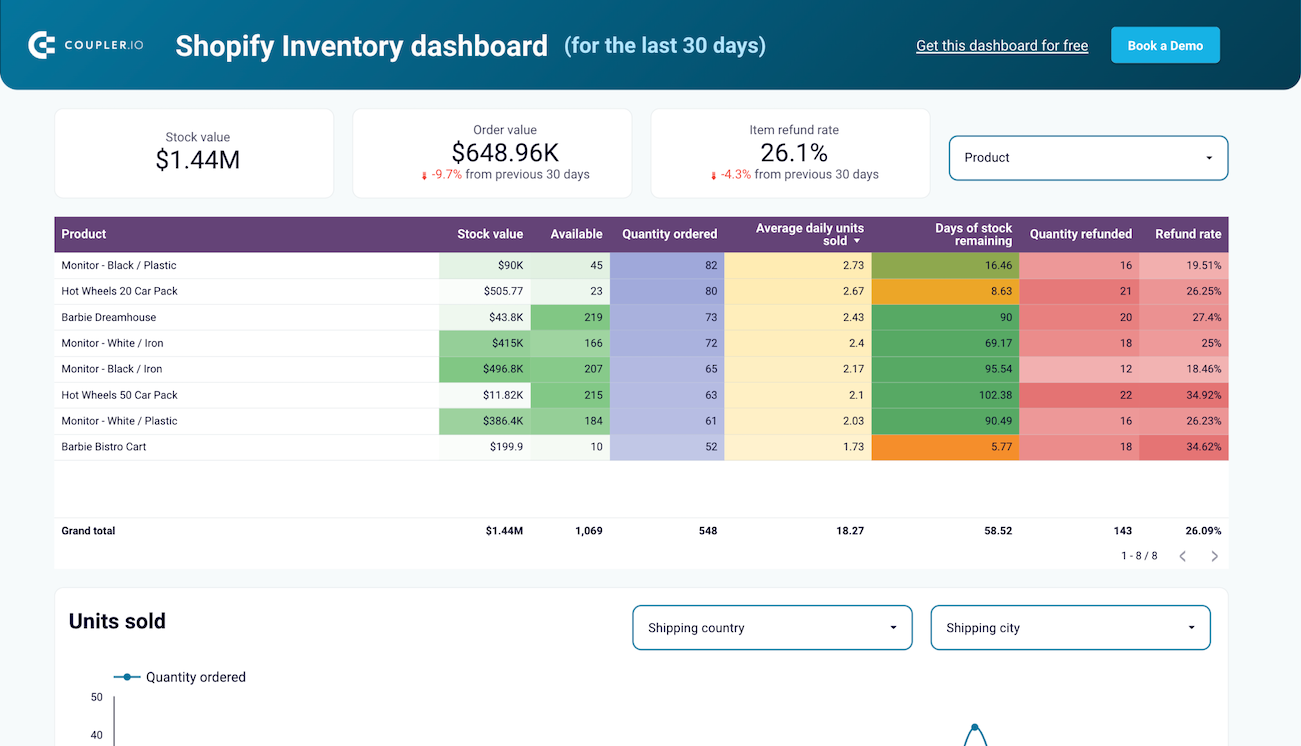
The dashboard automatically pulls data from your Shopify store and presents it in intuitive visualizations. You get a complete overview of inventory status, including low-stock alerts, bestselling products, and inventory aging metrics. This helps you make informed purchasing decisions and improve cash flow by reducing excess inventory.
Dashboard metrics:
- Current stock levels
- Inventory turnover rate
- Days of inventory on hand
- Low-stock alerts
- Inventory value
- Out-of-stock frequency
- Product performance correlation
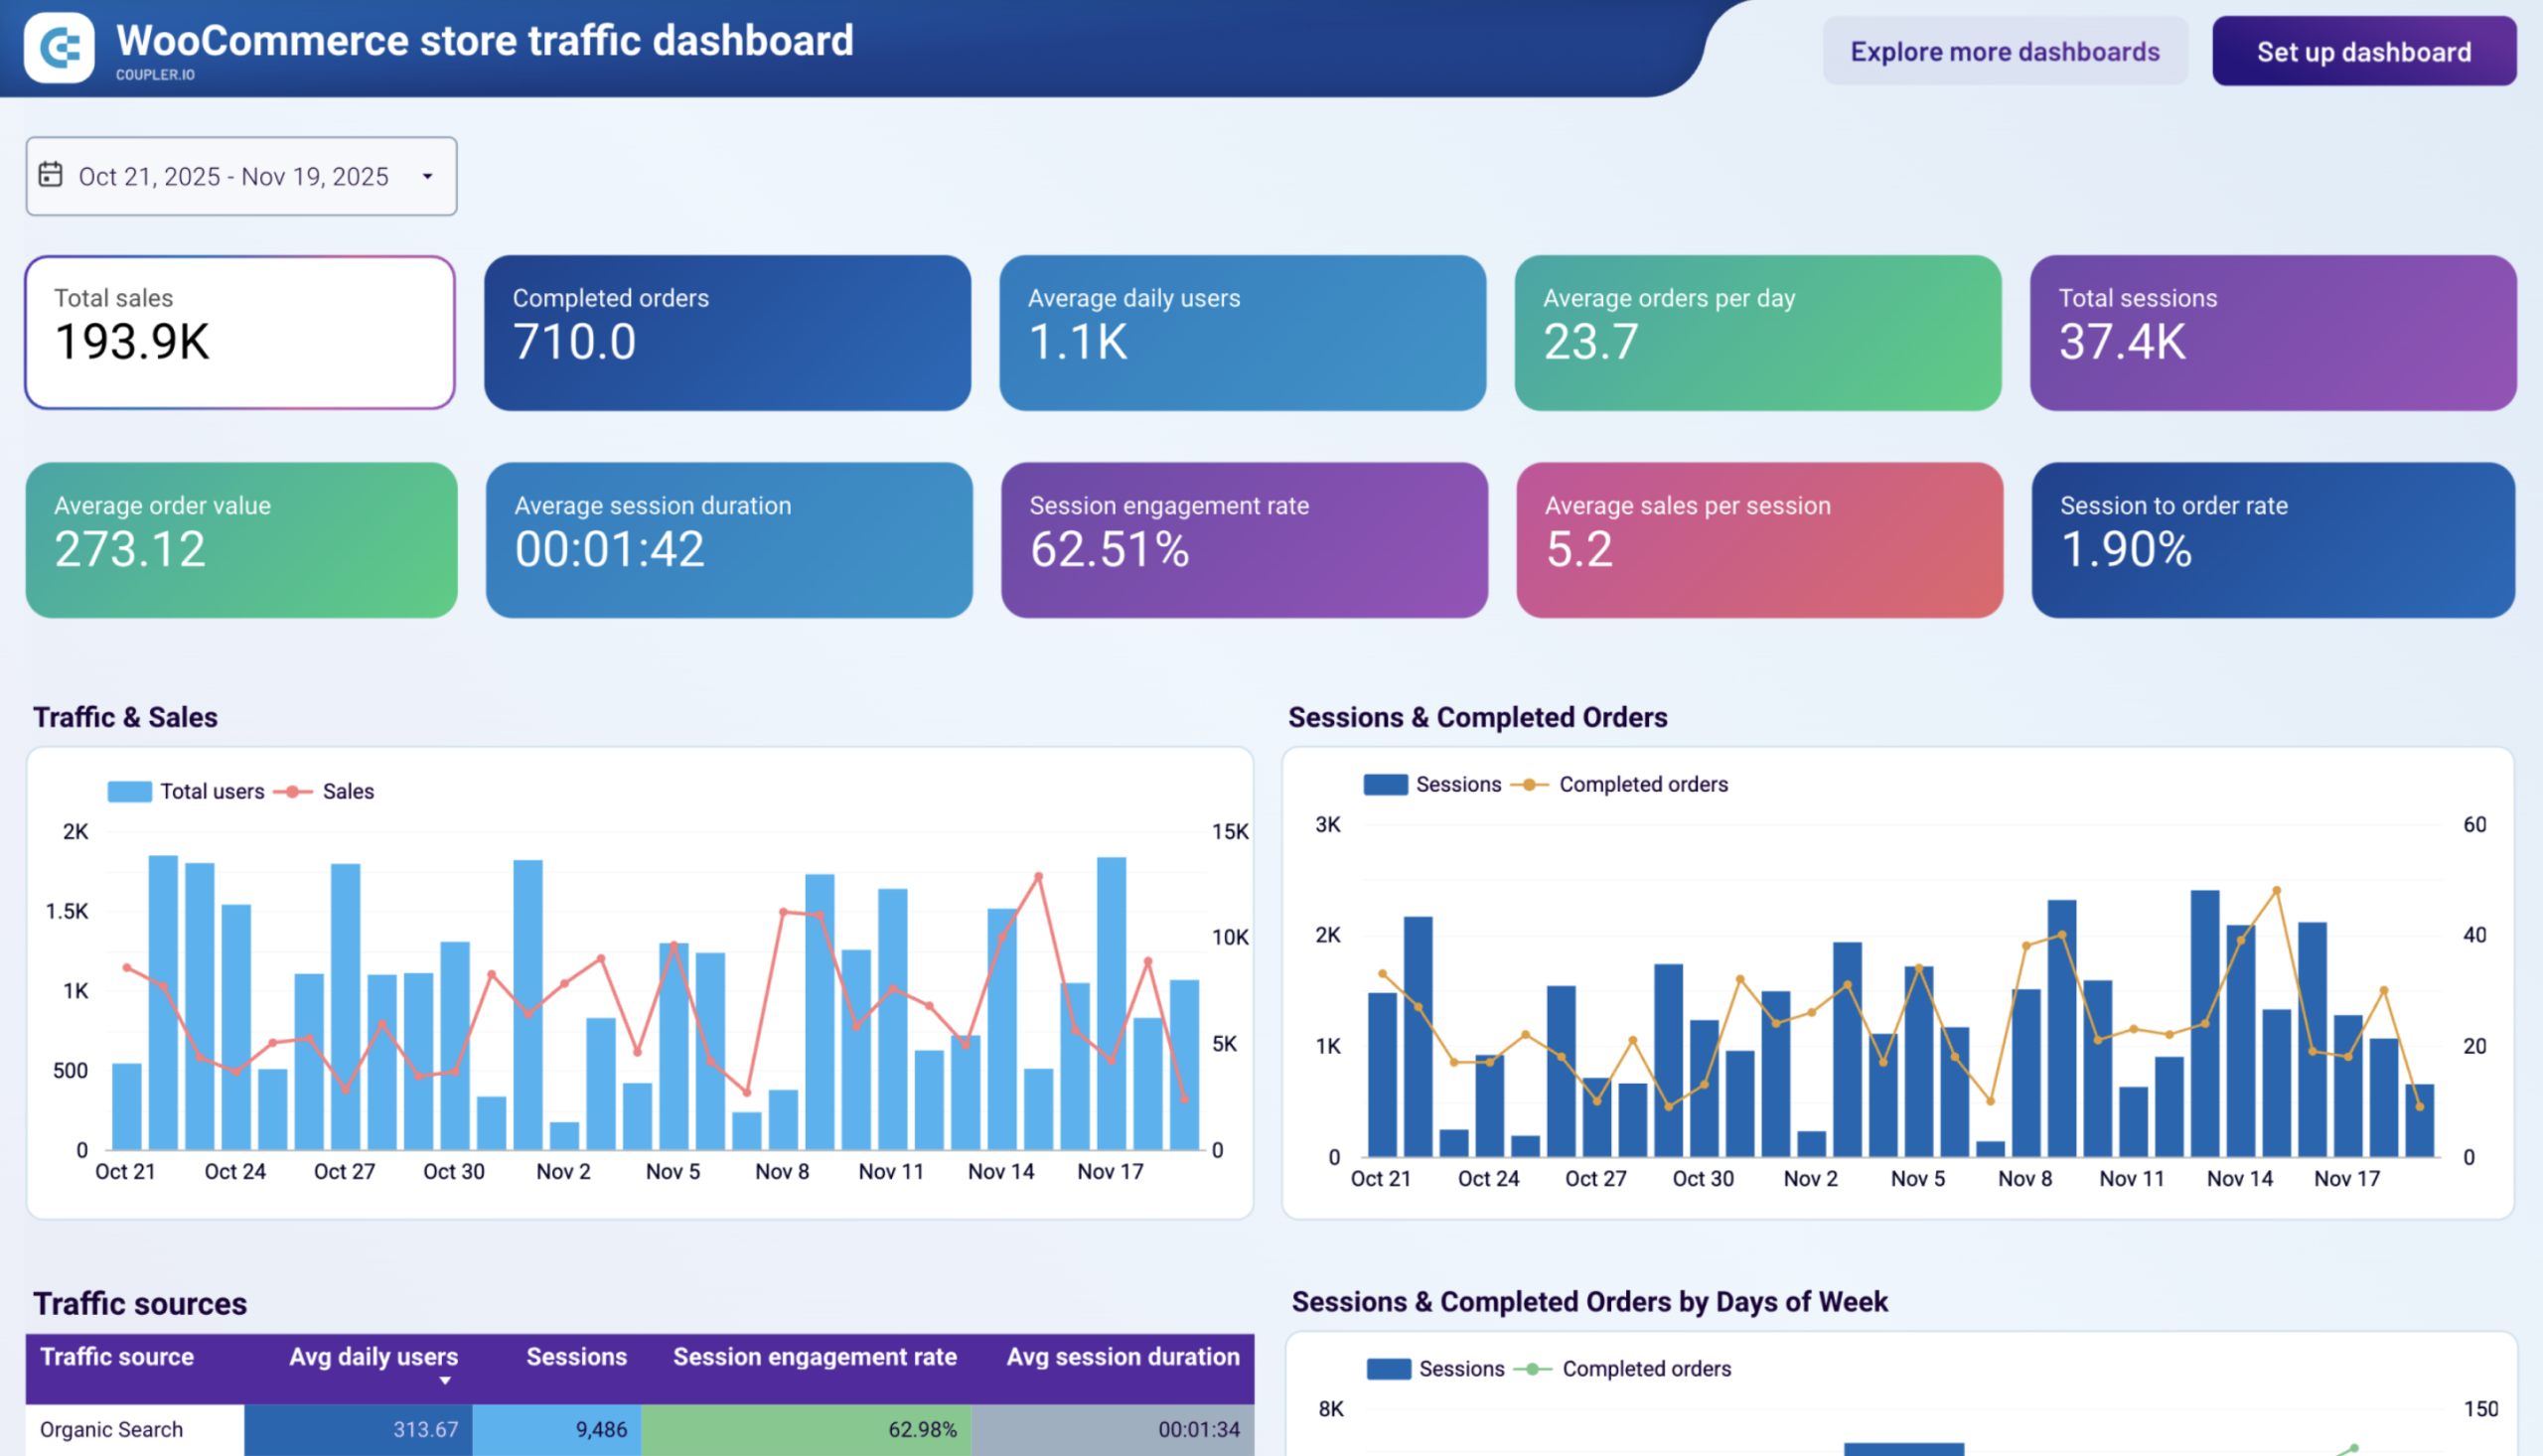
#52. WooCommerce store traffic dashboard by Coupler.io
Not all traffic is equal. This WooCommerce store traffic dashboard crosses Google Analytics 4 session data with WooCommerce sales metrics to show you which visitor sources actually convert. You can see daily traffic and completed order trends on the same timeline, spot which days of the week drive the most purchases, and compare channel performance by engagement rate, average session duration, and session-to-order rate.
WooCommerce store traffic dashboard
 Preview dashboard
WooCommerce store traffic dashboard
Preview dashboardThe dashboard is automated via Coupler.io, which consolidates data from both GA4 and WooCommerce and keeps it updated on a schedule.
Dashboard metrics:
- Total sales
- Completed orders
- Average daily users
- Total sessions
- Session engagement rate
- Average session duration
- Session-to-order rate
- Average sales per session
- Average order value
- Average orders per day.
#53. WooCommerce orders dashboard by Coupler.io
The dashboard gives operations teams and store owners a full picture of order fulfillment, customer purchase patterns, and revenue by geography, all from a single WooCommerce data source.
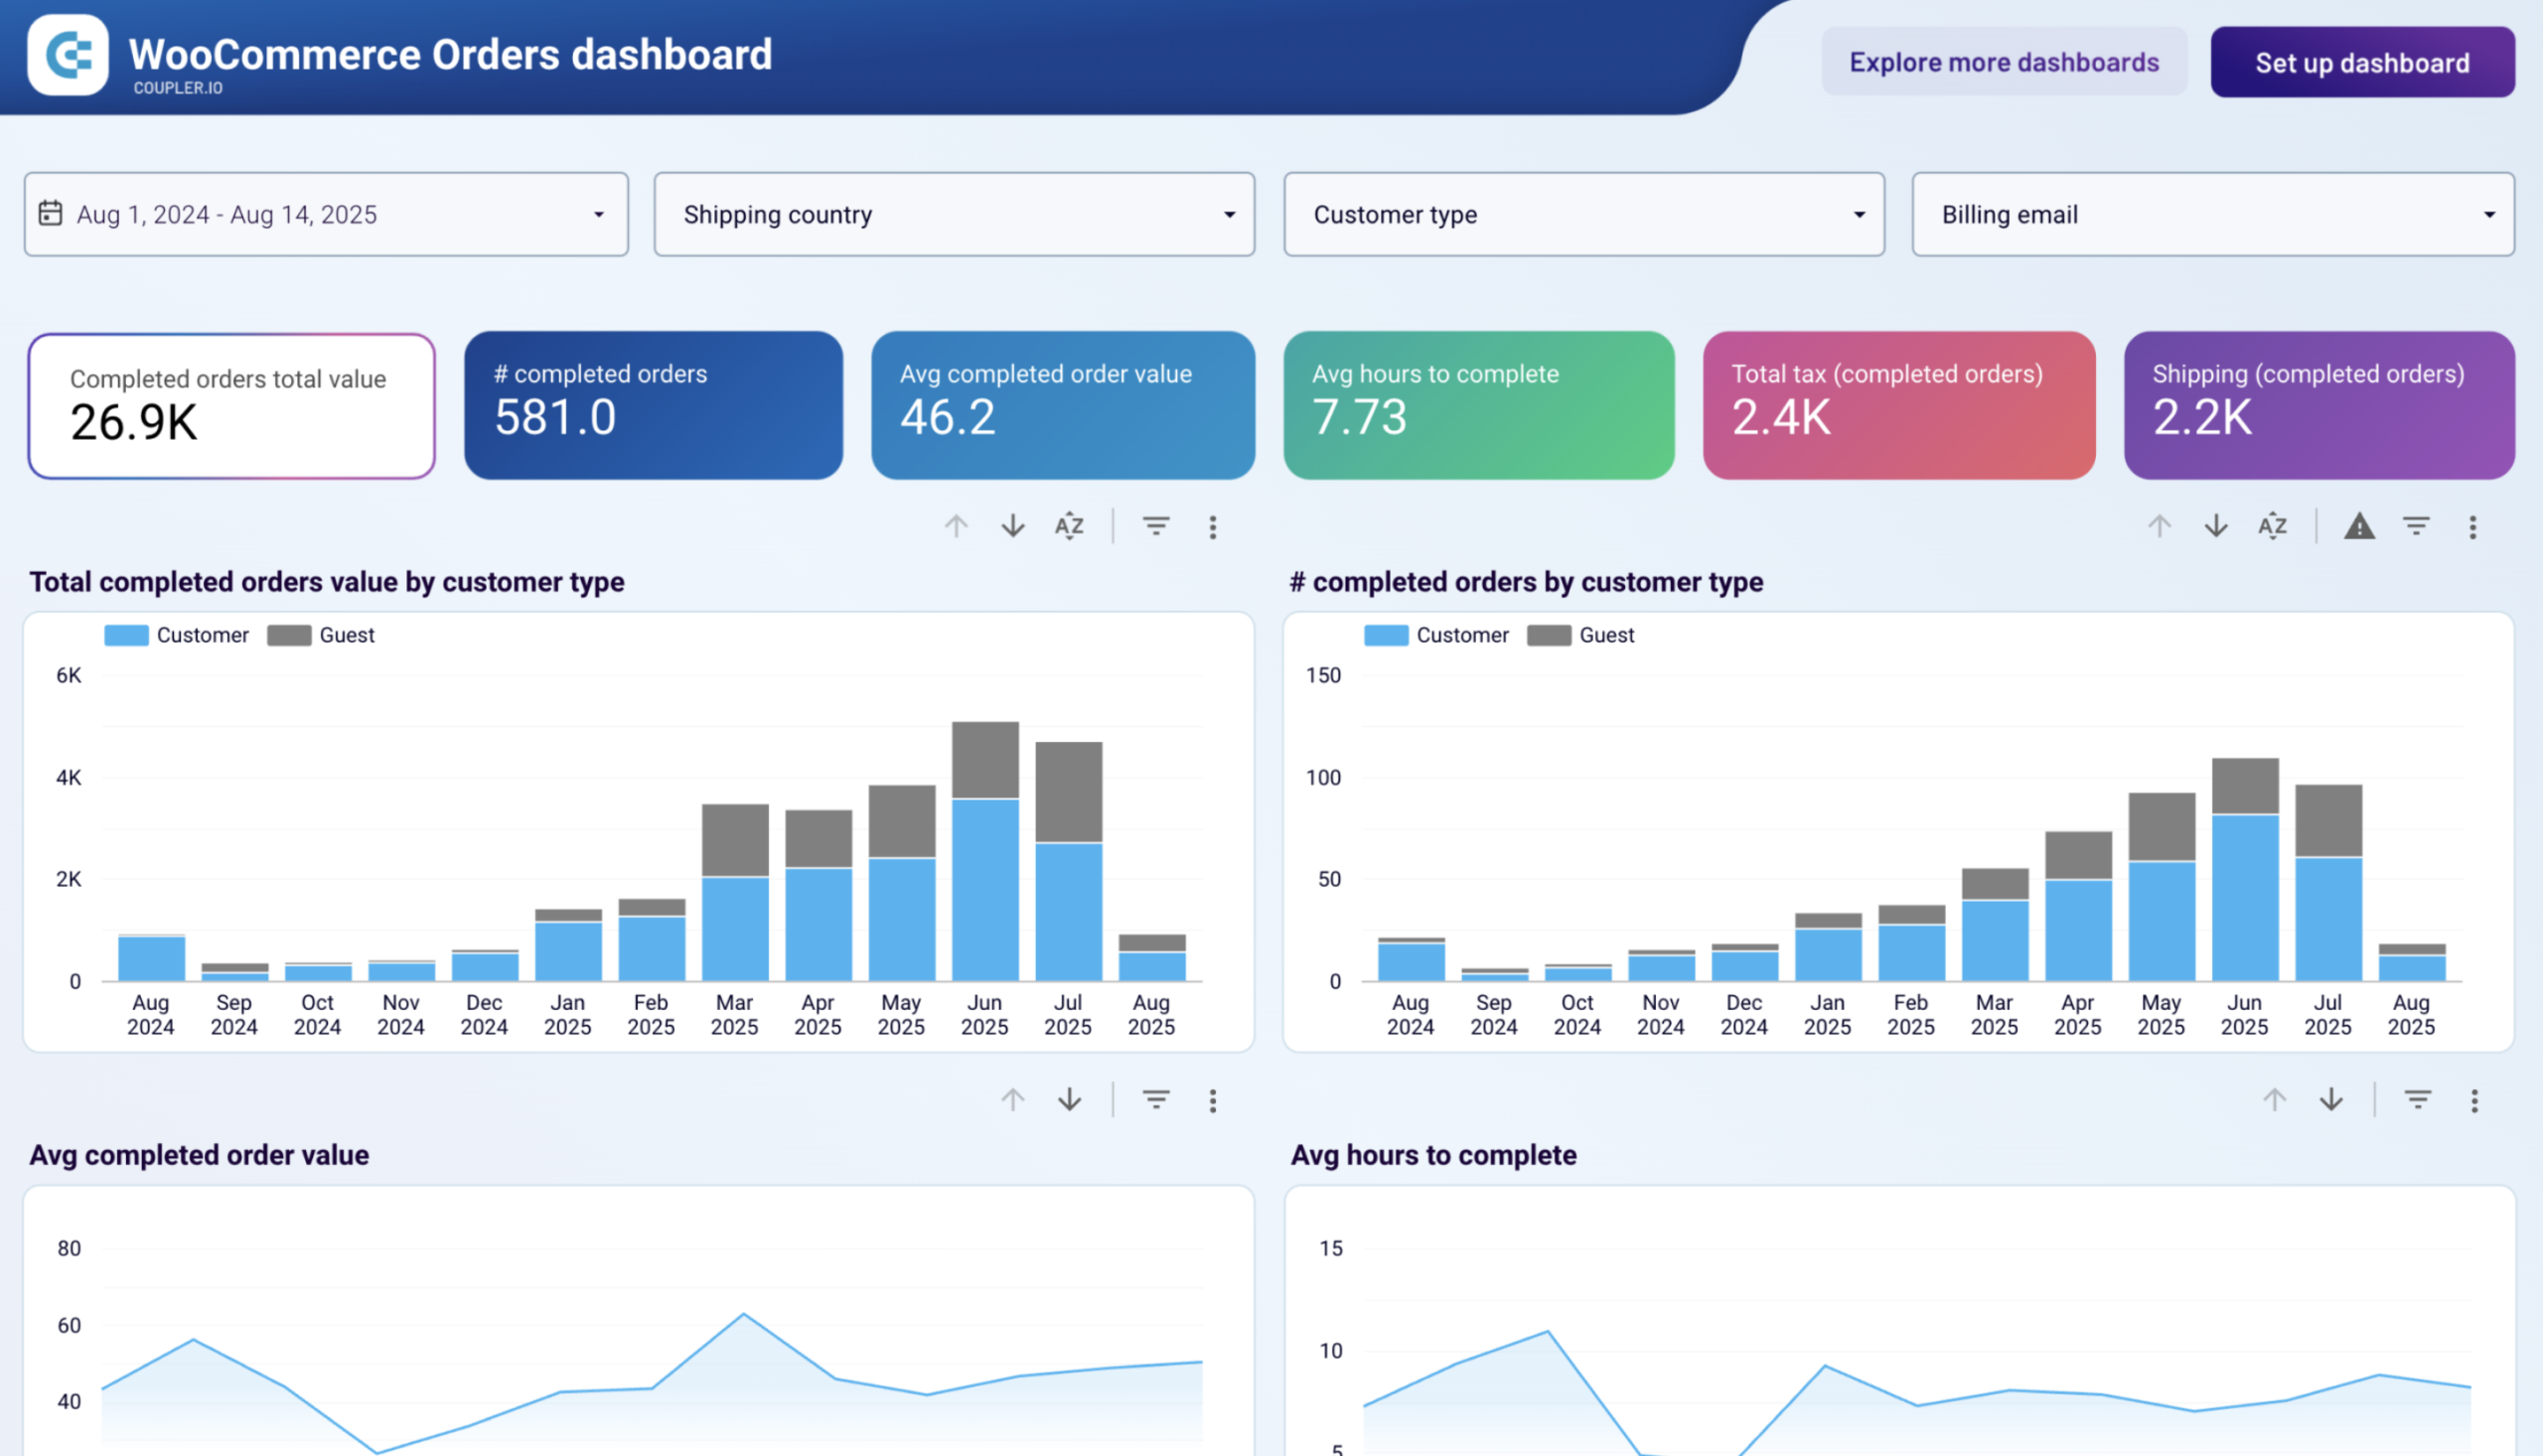
Two charts break down order value and transaction volume by customer type (registered vs. guest) over time, so you can see whether account holders genuinely spend more and buy more often. A separate trend chart tracks average hours to complete, which makes it straightforward to spot when fulfillment slows down and whether that correlates with order volume spikes or operational gaps.
Dashboard metrics:
- Completed orders
- Total value
- Order count
- Average completed order value
- Average hours to complete
- Order status distribution
- Geographic revenue by country
- Total shipping
- Total tax.
Financial dashboards for Looker Studio
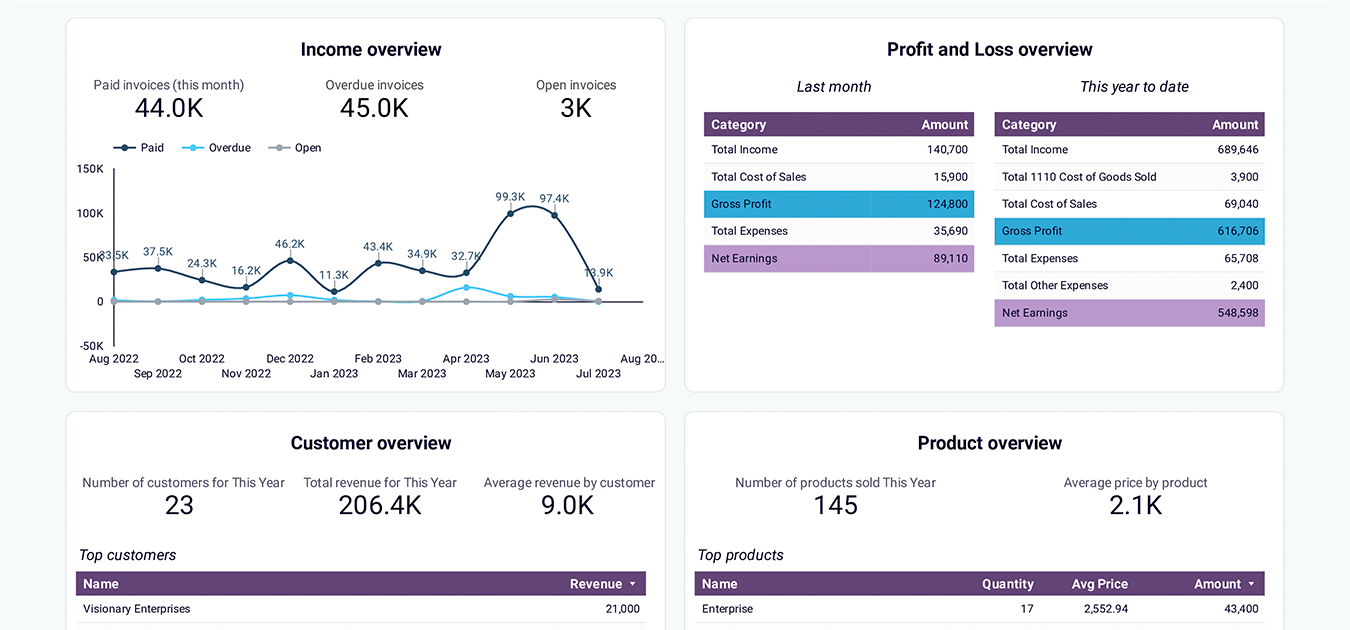
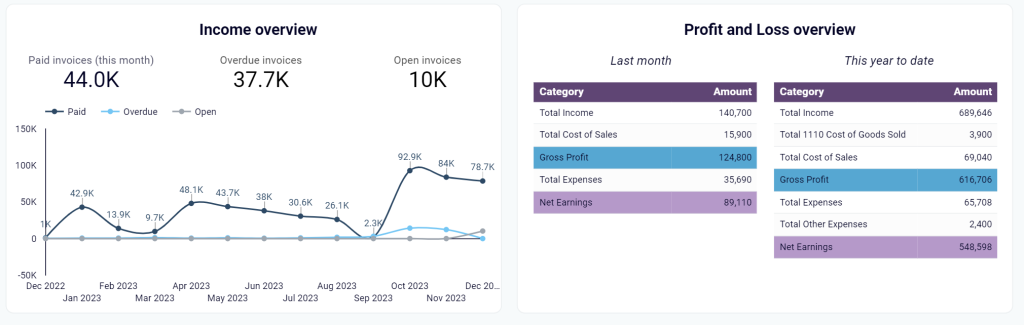
#54. Revenue dashboard for QuickBooks by Coupler.io
This is a dashboard template designed specifically for QuickBooks. It allows you to get an overview of your revenue based on the data loaded from QuickBooks Online. The report is quite simple to use and is a great solution if you need to share your results with stakeholders.
Revenue dashboard for QuickBooks
 Preview dashboard
Revenue dashboard for QuickBooks
Preview dashboardThe main value of the revenue dashboard for QuickBooks is a quick overview of the main KPIs. It takes around 2 minutes to connect the report to your QuickBooks account and populate it with your up-to-date data. With this Looker Studio template, you can identify the best-performing products and customers, track invoices, and more.
Dashboard metrics:
- Paid invoices
- Overdue invoices
- Open invoices
- Total income
- Gross profit
- Total revenue
- Average price by product, etc.
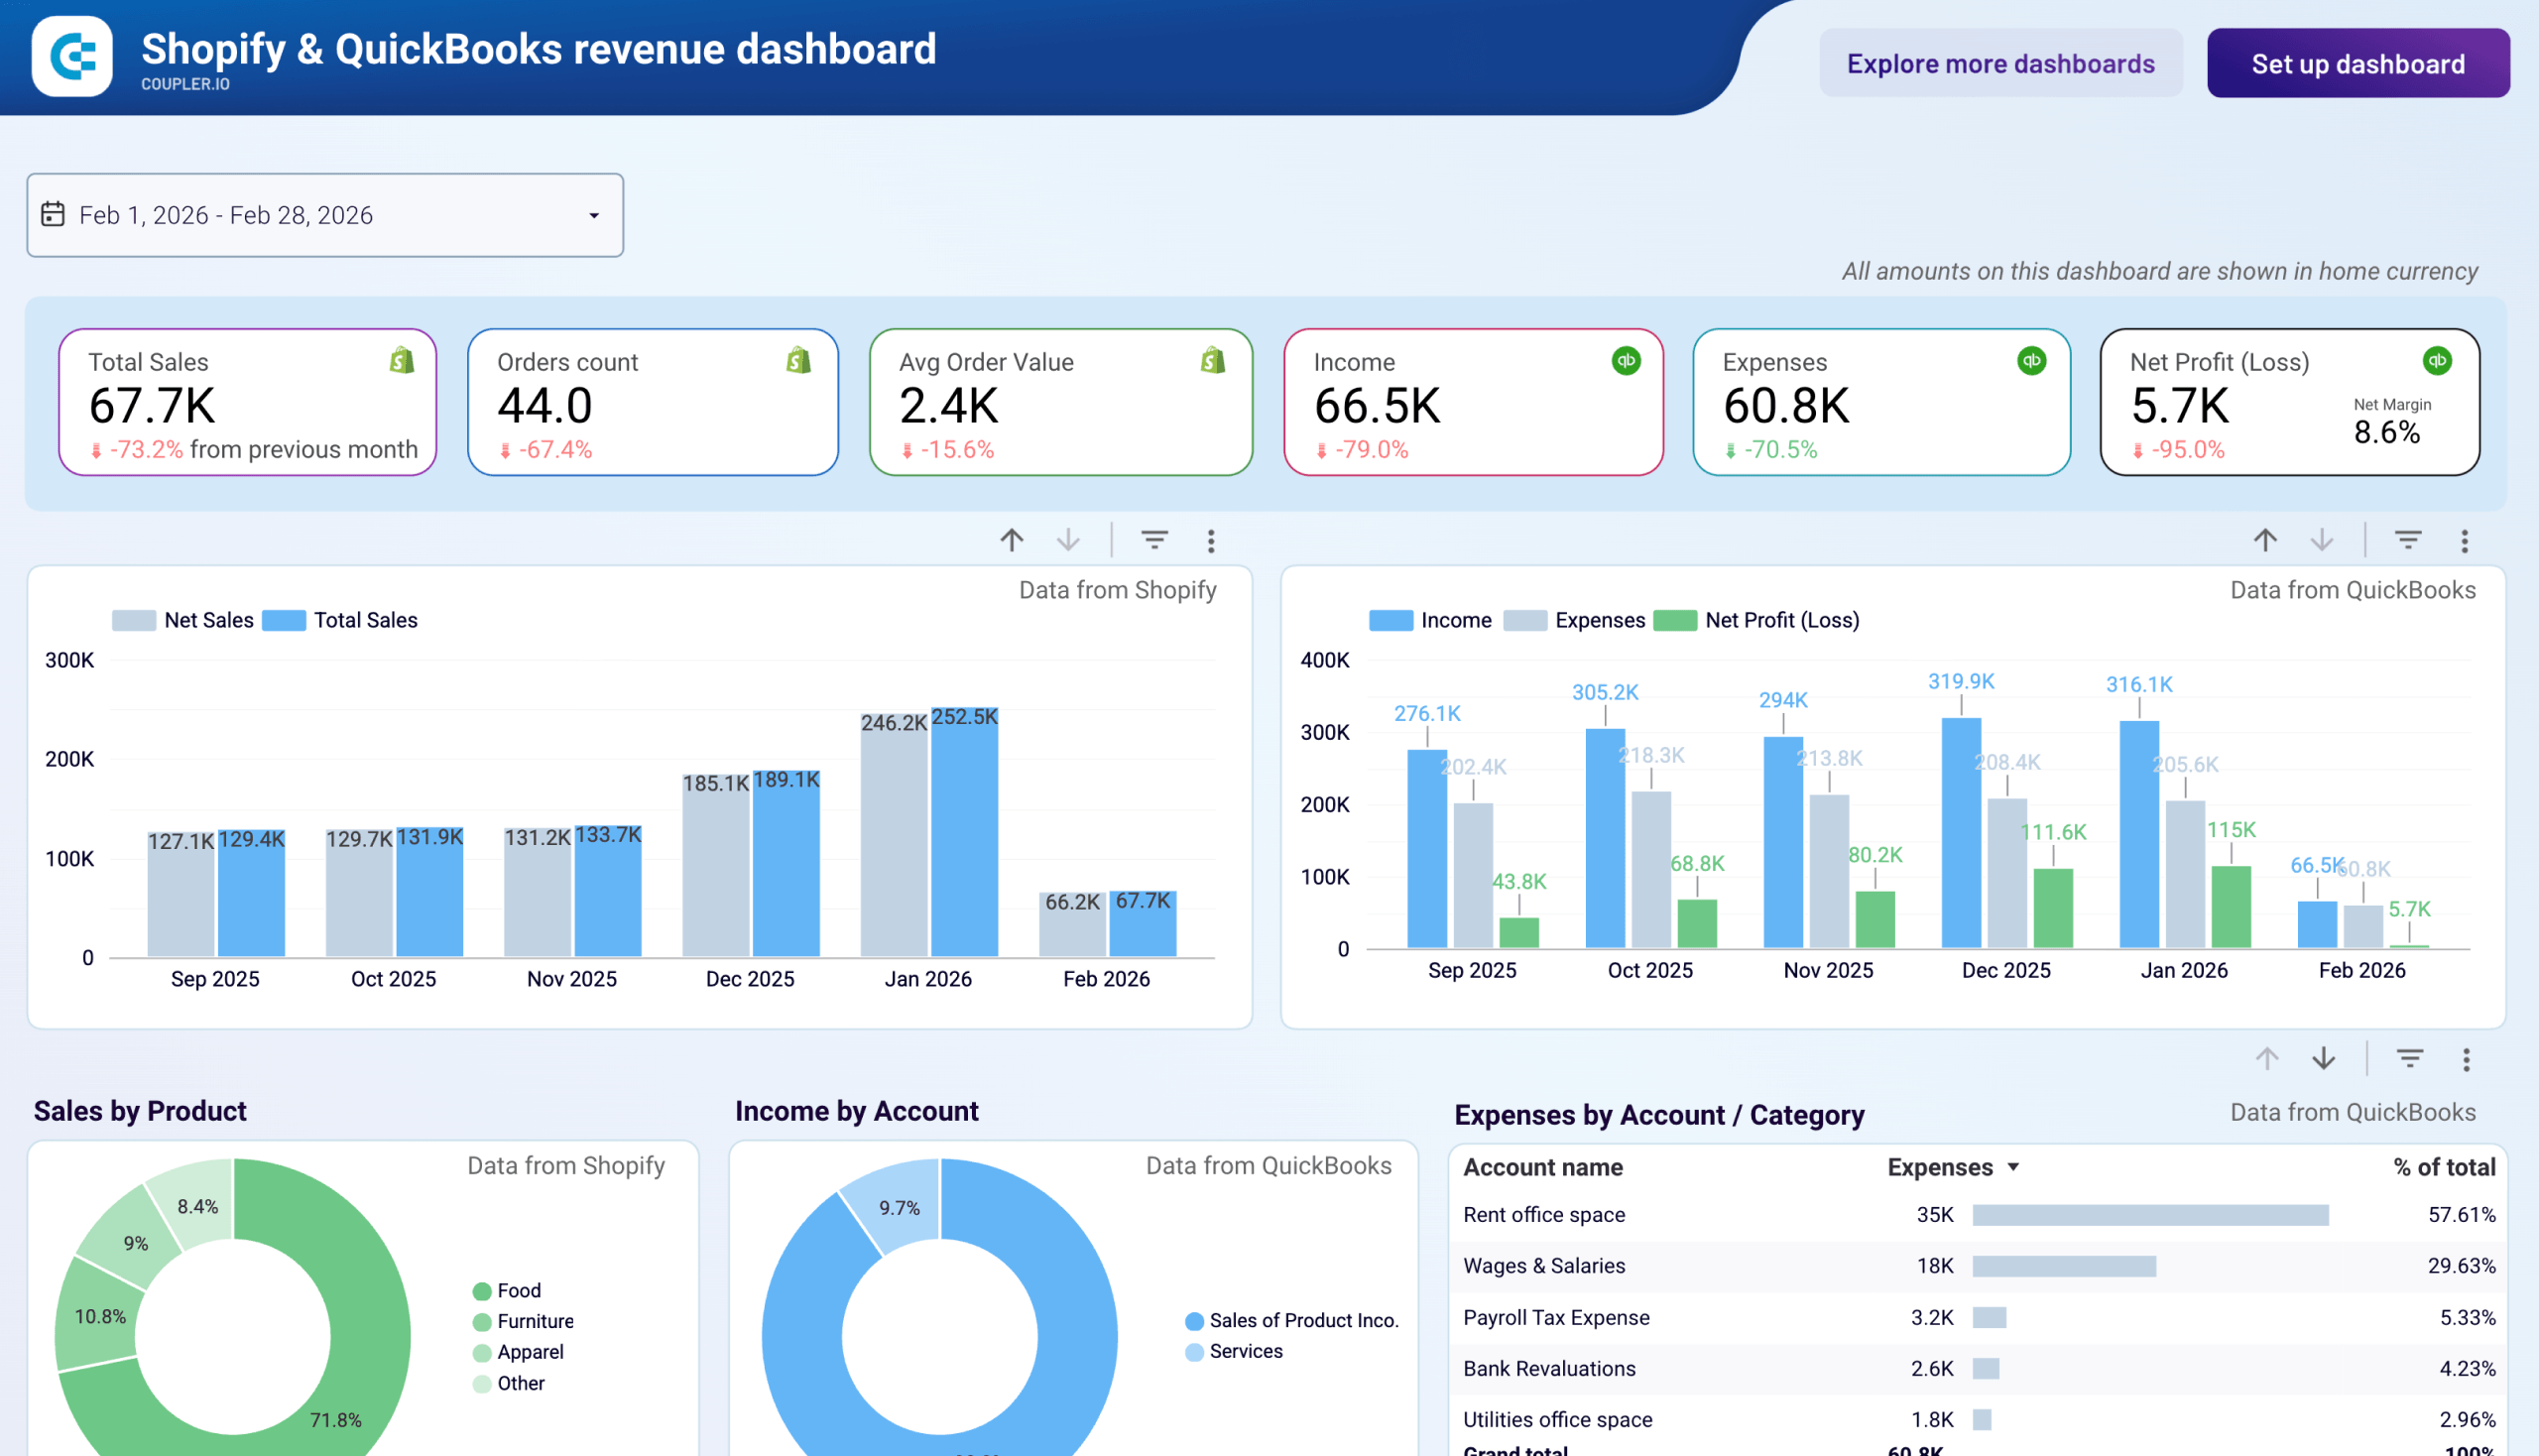
#55. Shopify & QuickBooks revenue dashboard by Coupler.io
This dashboard connects Shopify and QuickBooks to bring sales performance and financial results into a single view. It’s built for finance managers and ecommerce operators who need to reconcile what they sold with what they actually kept after costs.
Shopify & QuickBooks revenue dashboard
 Preview dashboard
Shopify & QuickBooks revenue dashboard
Preview dashboardYou can track total sales, order count, and average order value from Shopify alongside income, expenses, and net profit from QuickBooks with month-over-month comparisons. Side-by-side trend charts let you correlate sales volume shifts with their impact on profitability. The combined monthly table reconciles Shopify metrics (gross sales, discounts, returns, net sales) with QuickBooks financials (income, COGS, gross profit, net margin) for period-end reporting.
Dashboard metrics:
- Total sales
- Orders count
- Average order value
- Income
- Expenses
- Net profit (loss)
- Net margin
- Cash balance
- Cash ratio
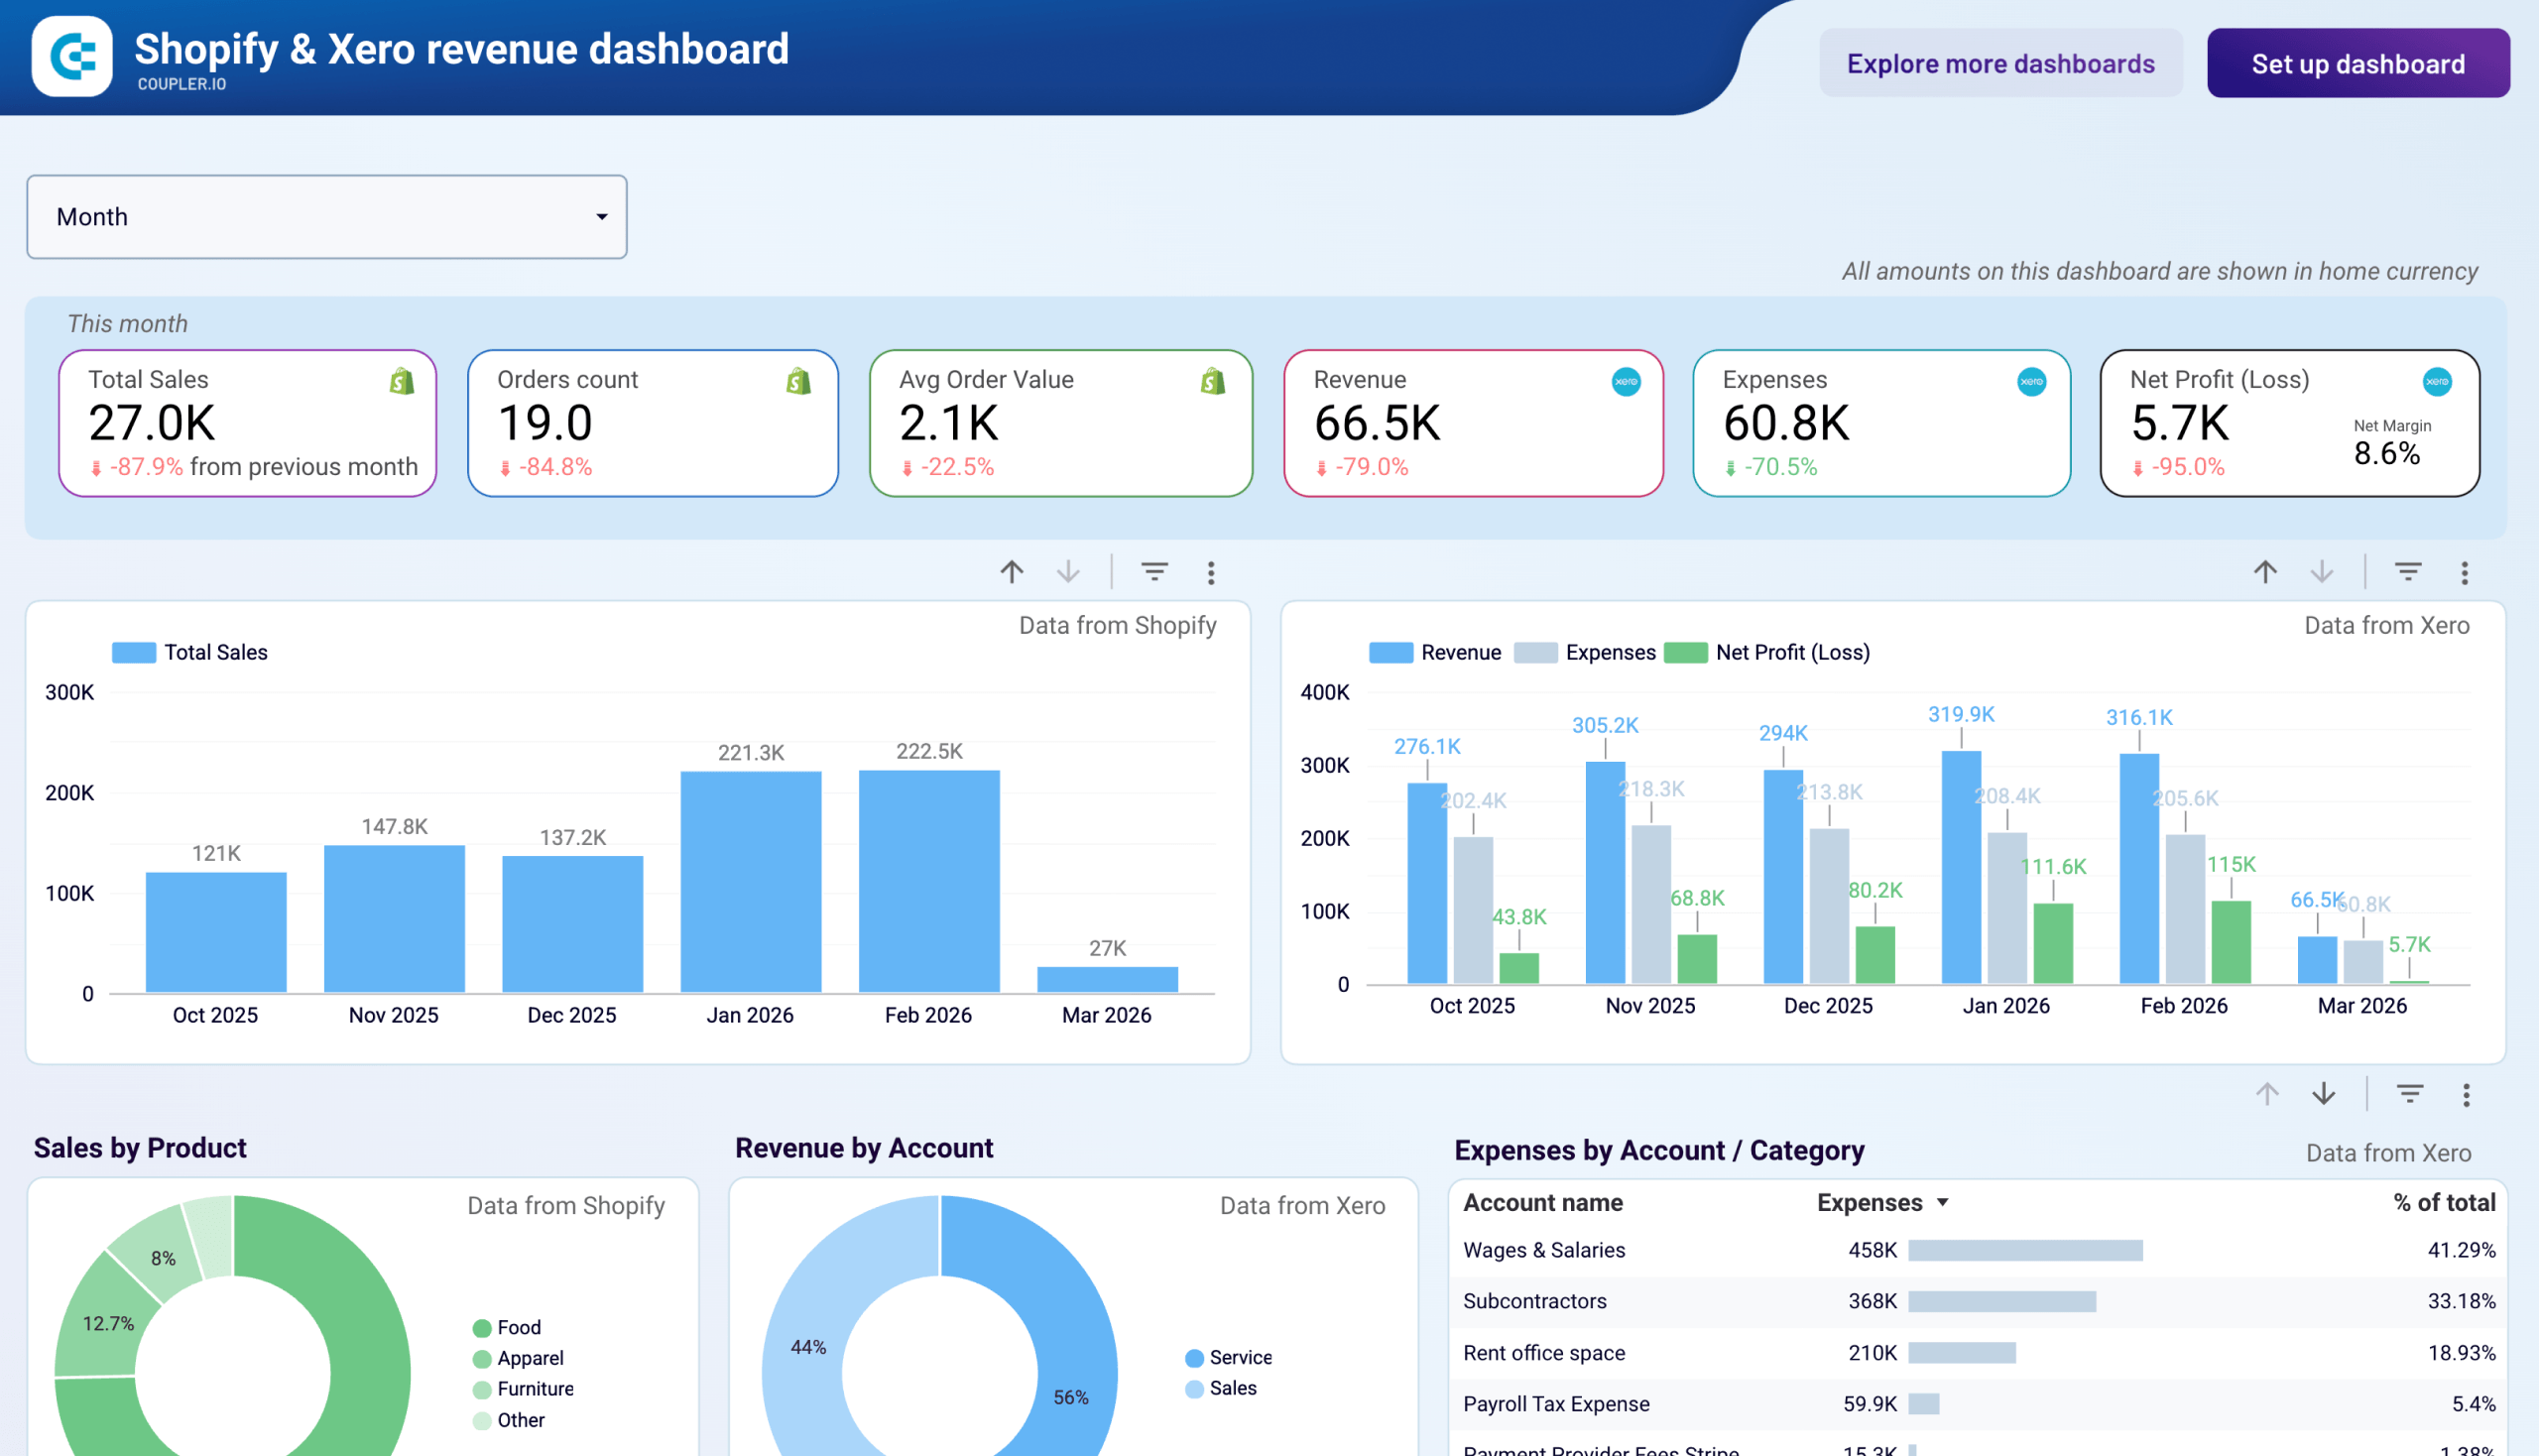
#56. Shopify & Xero revenue dashboard by Coupler.io
Similar to the Shopify & QuickBooks template above, this dashboard connects Shopify with Xero for teams that use Xero as their accounting platform. It shows how storefront revenue translates into the financial results recorded in Xero.
Shopify & Xero revenue dashboard
 Preview dashboard
Shopify & Xero revenue dashboard
Preview dashboardShow Image Preview dashboard
You can monitor Shopify sales volume and Xero revenue, expenses, and net profit on the same timeline to spot months where costs outpaced growth. Product and account-level breakdowns reveal where revenue is concentrated and which expense categories consume the most resources. The cash balance and cash ratio chart tracks liquidity, flagging when short-term debt coverage drops below safe levels.
Dashboard metrics:
- Total sales
- Orders count
- Avg order value
- Revenue (Xero)
- Expenses (Xero)
- Net profit (loss)
- Net margin
- Cash balance
- Cash ratio
#57. Financial dashboard for Xero by Coupler.io
This dashboard template provides an overview of your business’s financial performance by connecting directly to your Xero accounting software. It transforms raw financial data into clear visualizations that help you monitor business health and make informed decisions.
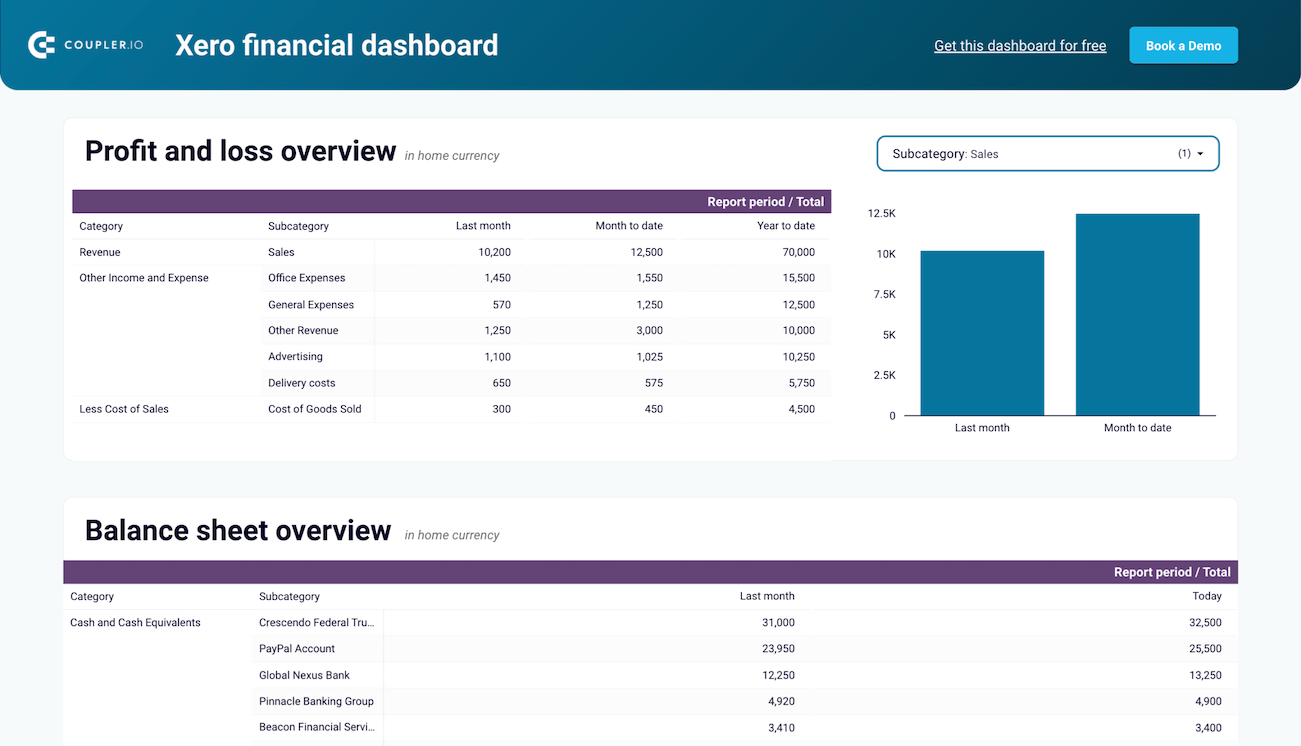
The dashboard displays key financial statements and metrics in a user-friendly format. As a result, entrepreneurs and financial officers have quick access to understanding financial trends without diving into complex accounting reports. It refreshes automatically through the Coupler.io connector to ensure you’re always working with the latest data.
Dashboard metrics:
- Revenue trends
- Expense breakdown
- Profit margins
- Cash flow patterns
- Balance sheet overview
- Key financial ratios
- Monthly comparison data
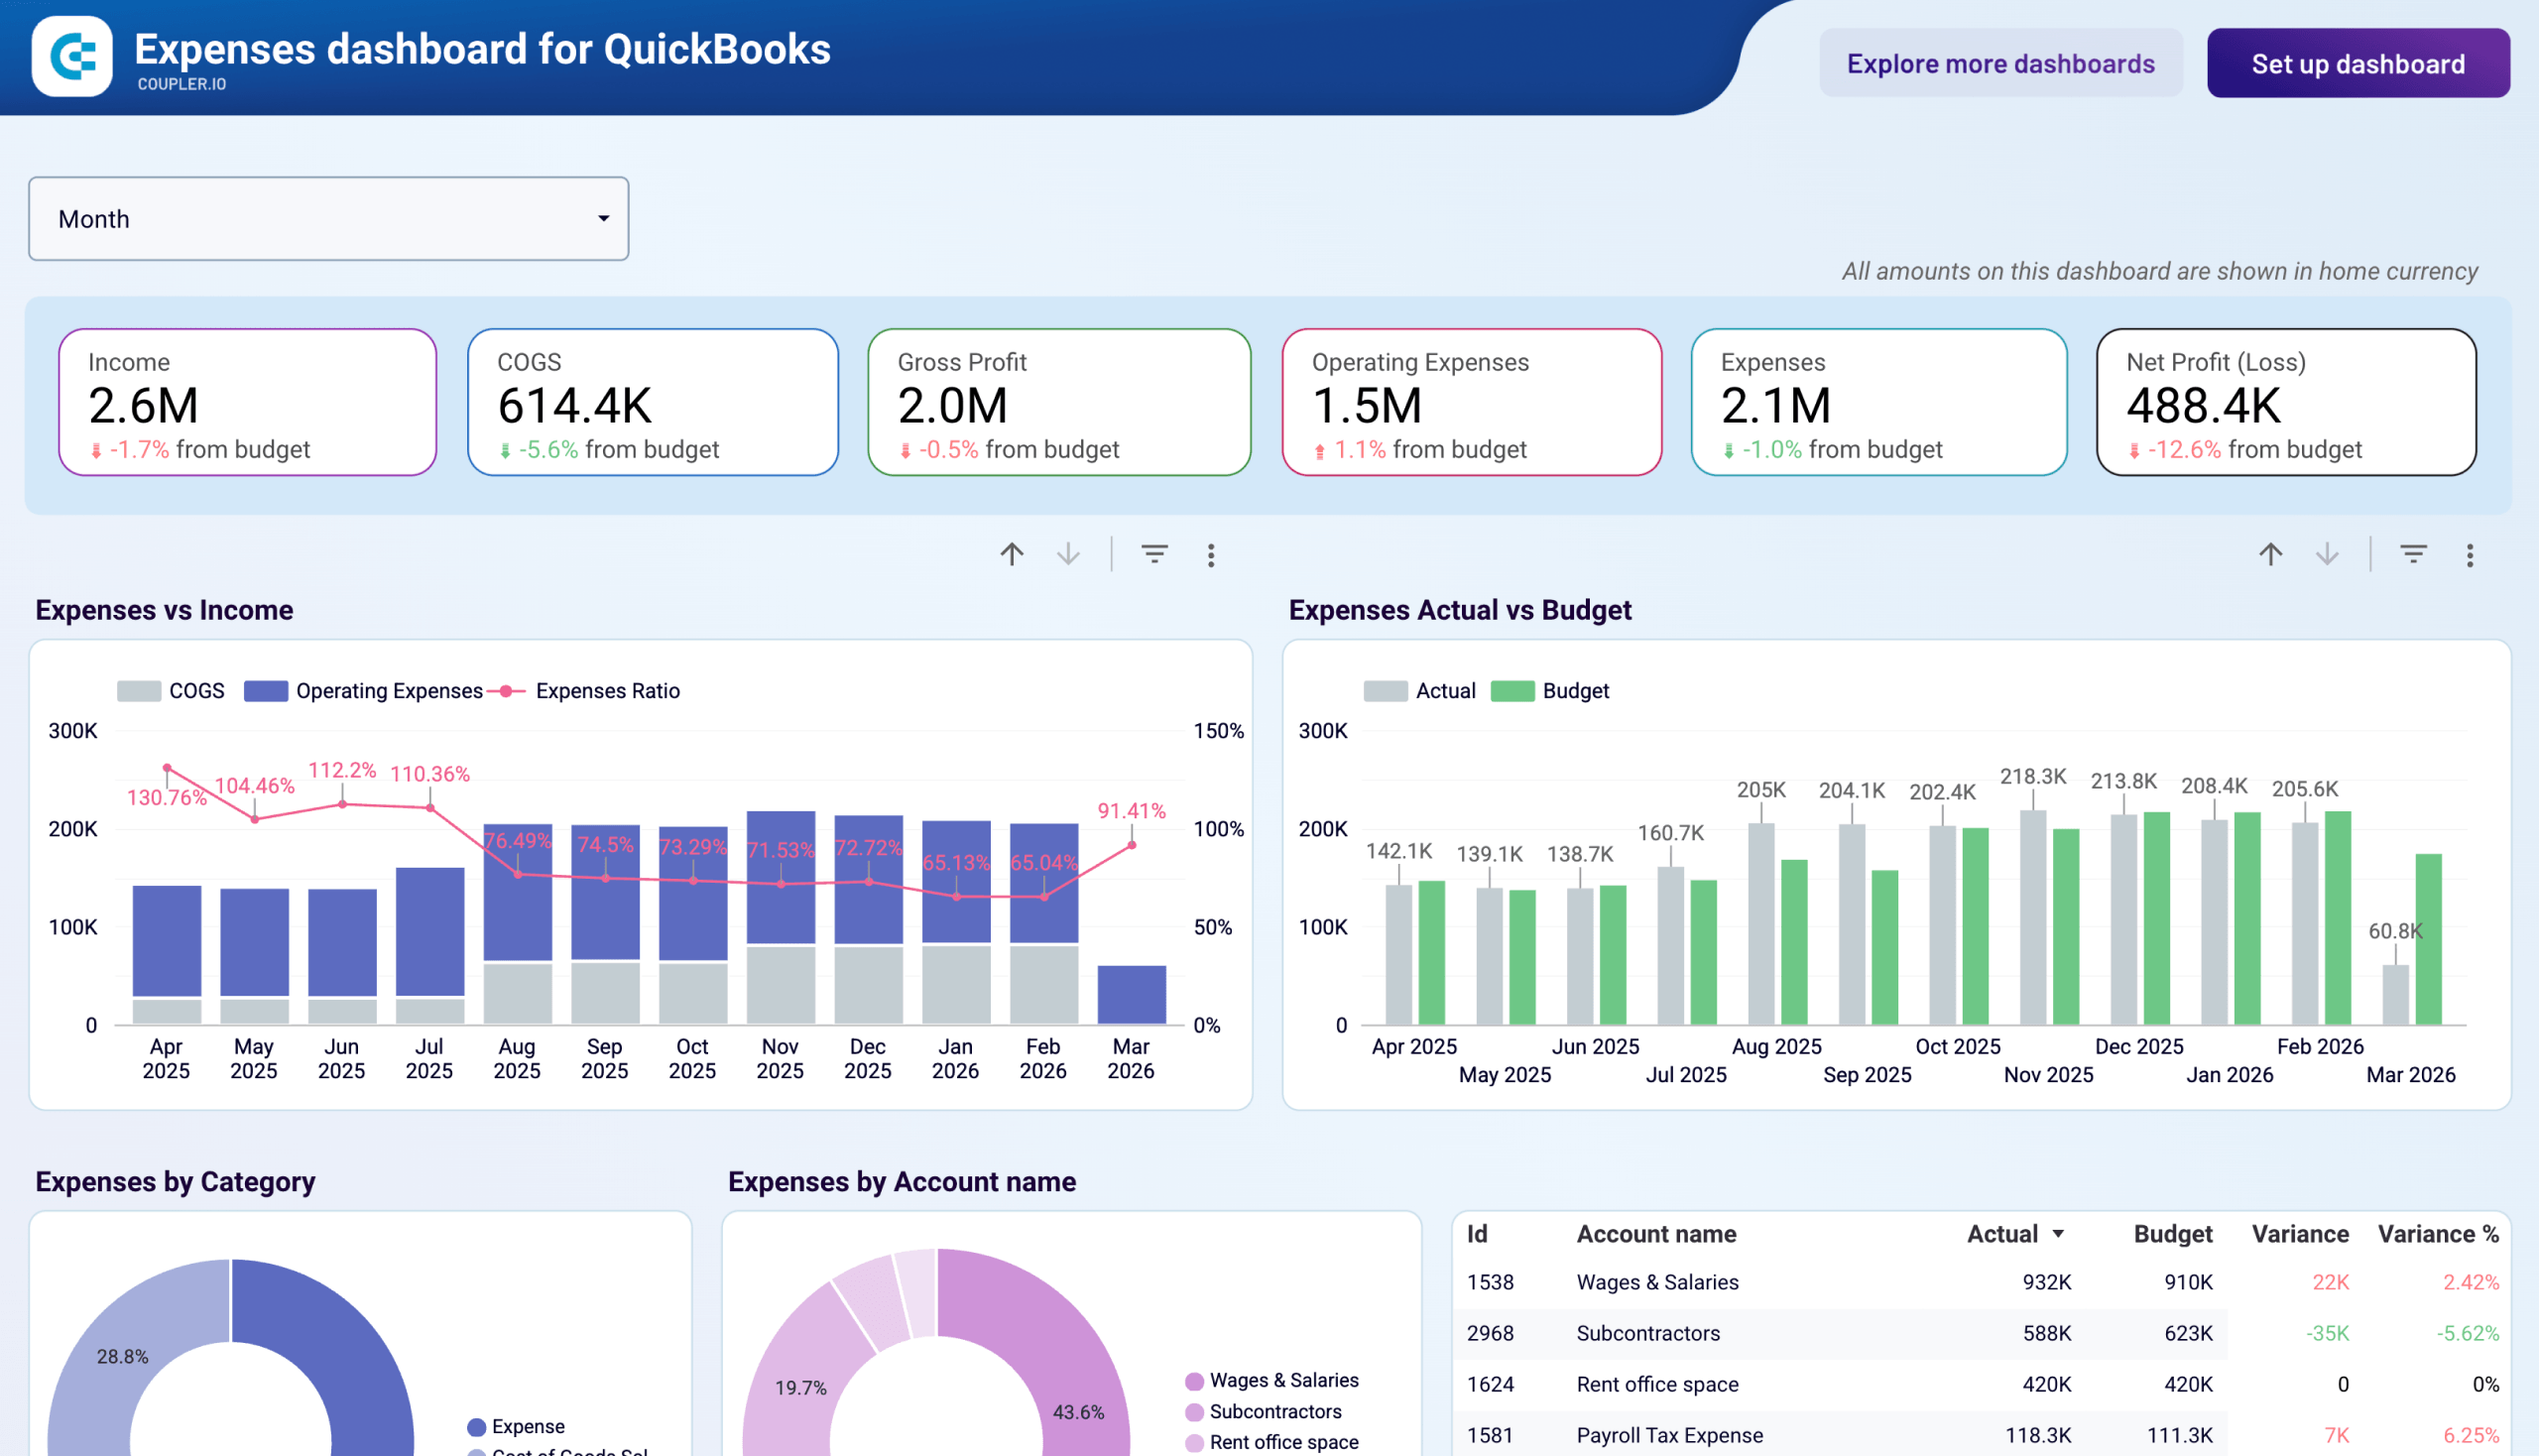
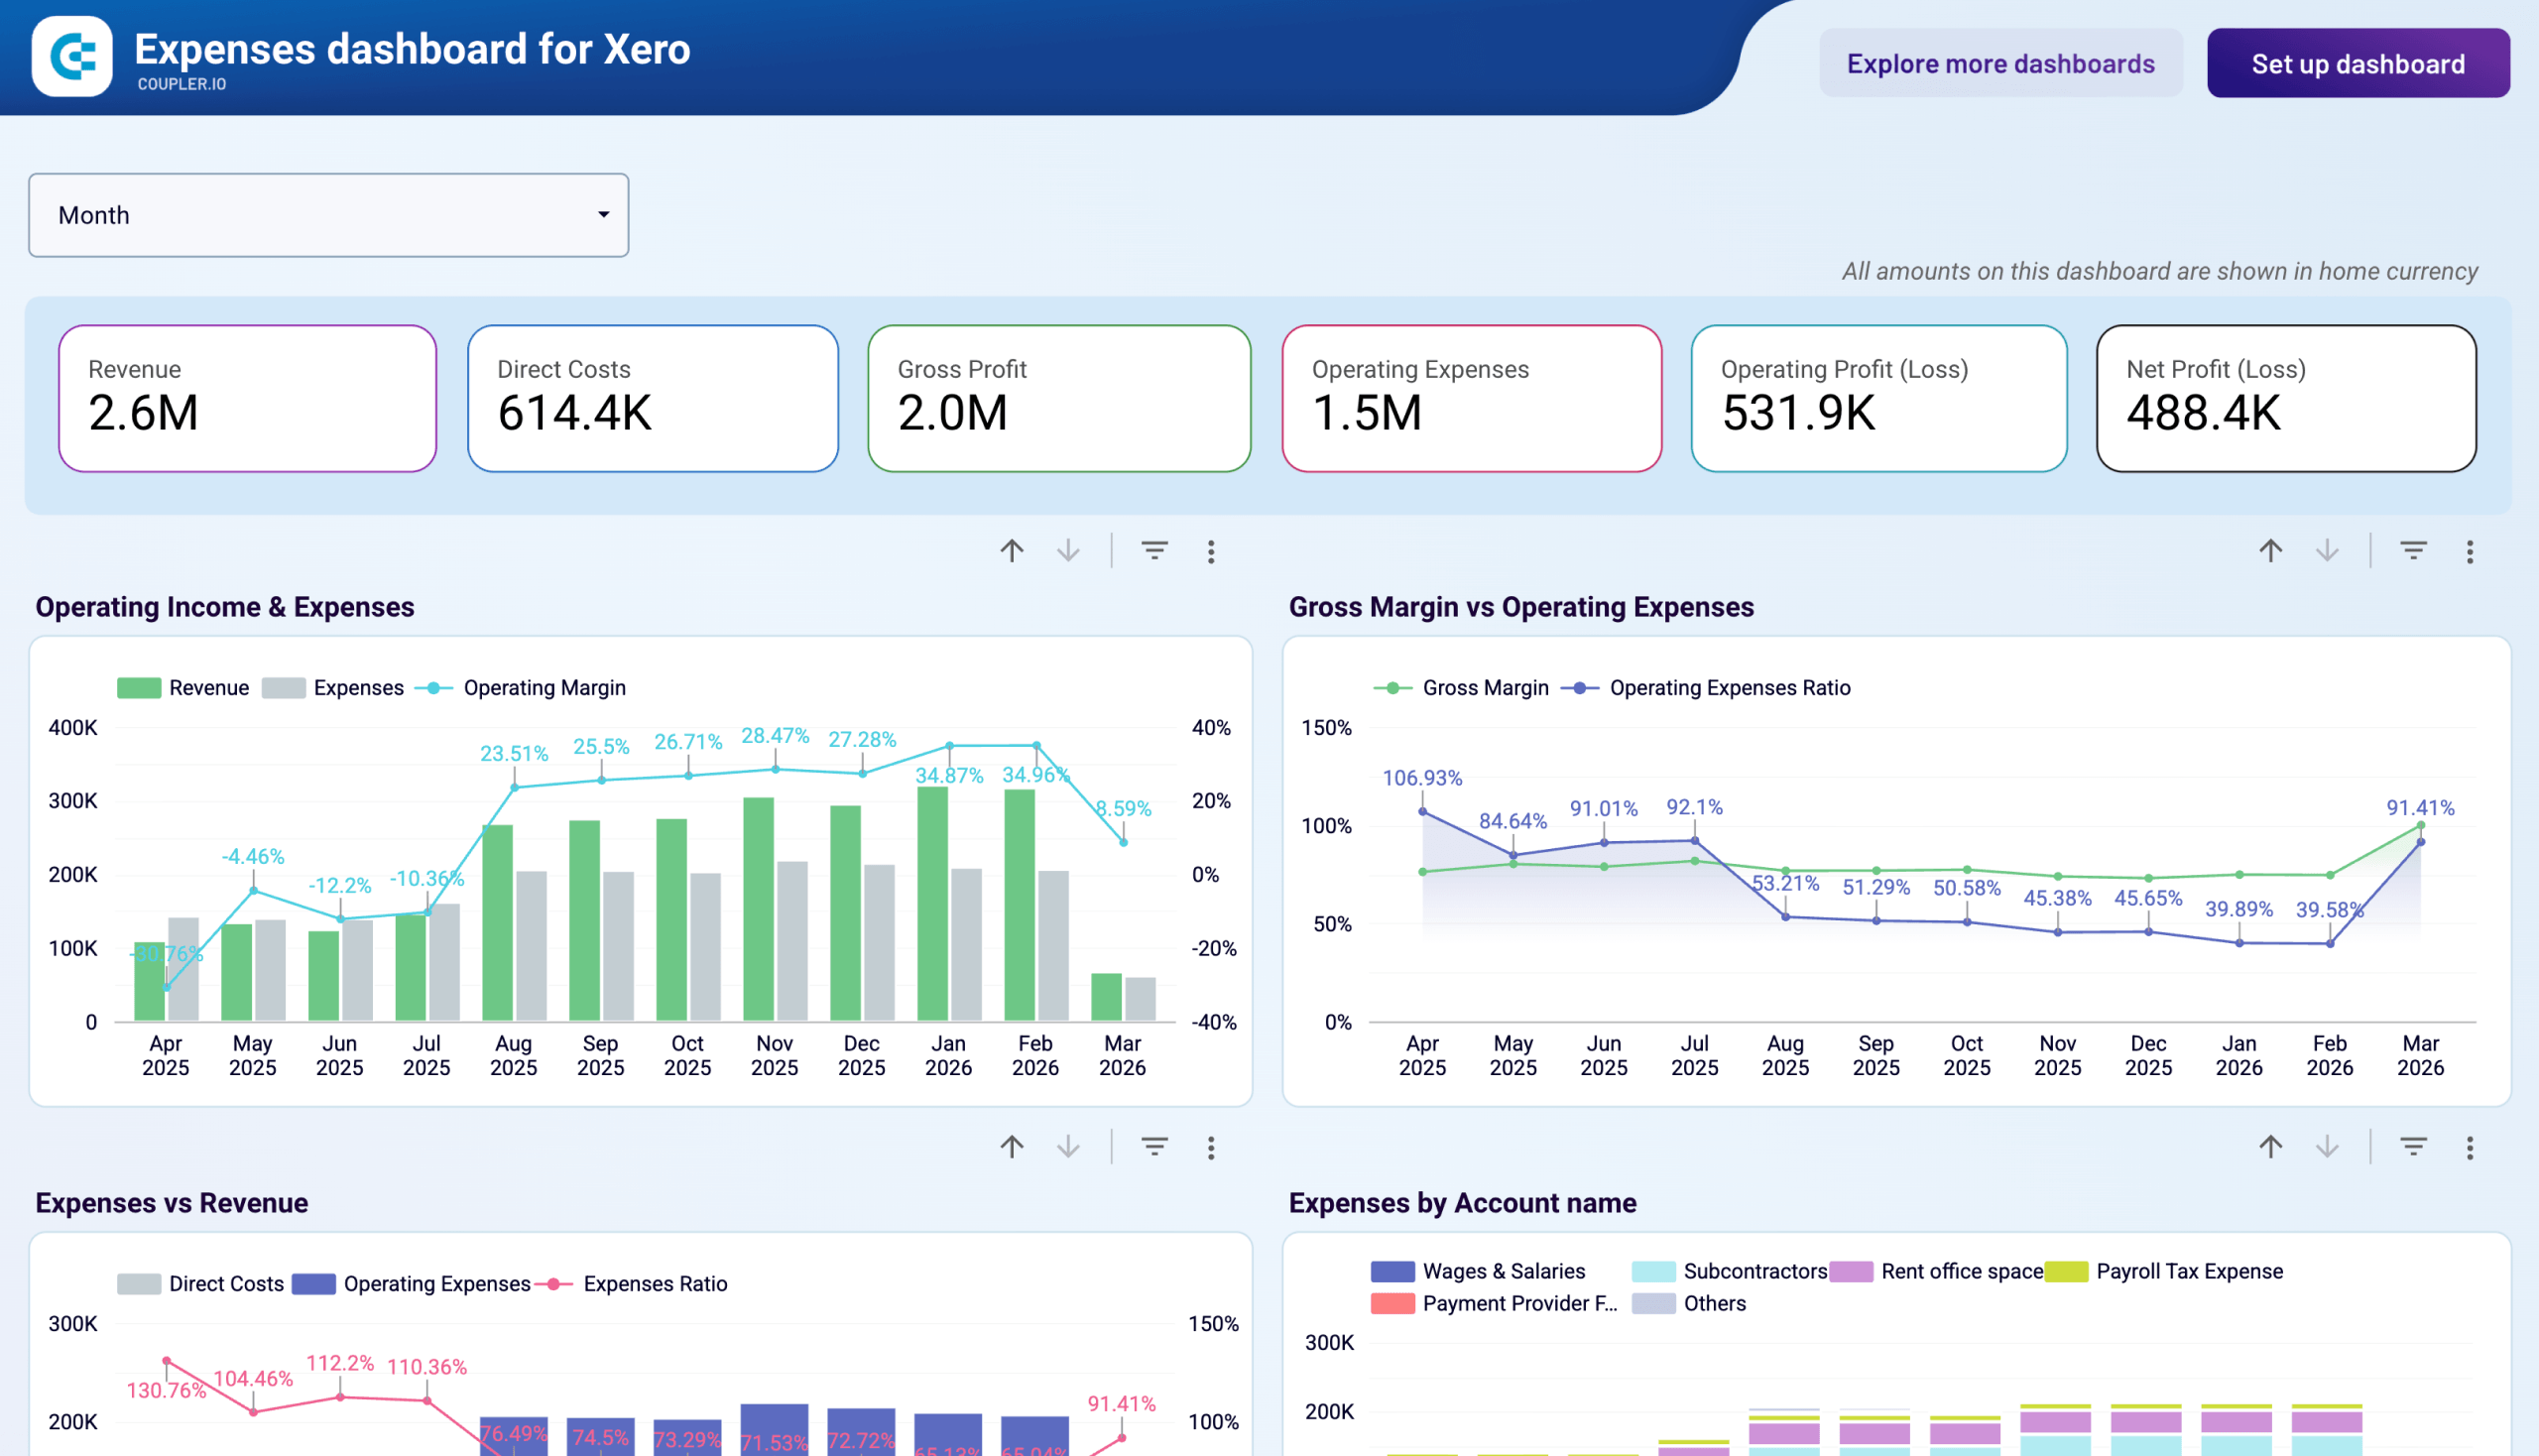
#58. Expenses dashboard for QuickBooks/Xero by Coupler.io
This dashboard is designed for finance managers and business owners who need to track where money is going and how actual spend compares to plan. It connects to your accounting platform and surfaces expense data across categories, vendors, and time.
Expenses dashboard for QuickBooks
 Preview dashboard
Expenses dashboard for QuickBooks
Preview dashboardThe expenses dashboard compares actual expenses to the budget month by month and drills into individual accounts to pinpoint where variances originated. The top vendors table ranks suppliers by spend across the current month, last month, and last 12 months for contract renewal preparation. Cash balance, burn rate, and months of runway KPIs give you an early warning system for liquidity pressure.
Dashboard metrics:
- Revenue / Income
- COGS / Direct costs
- Gross profit
- Operating expenses
- Net profit (loss)
- Cash balance
- Burn rate
- Cash runway (months)
The dashboard is available for both QuickBooks and Xero users, with each version connecting to your accounting platform through the built-in Coupler.io connector.


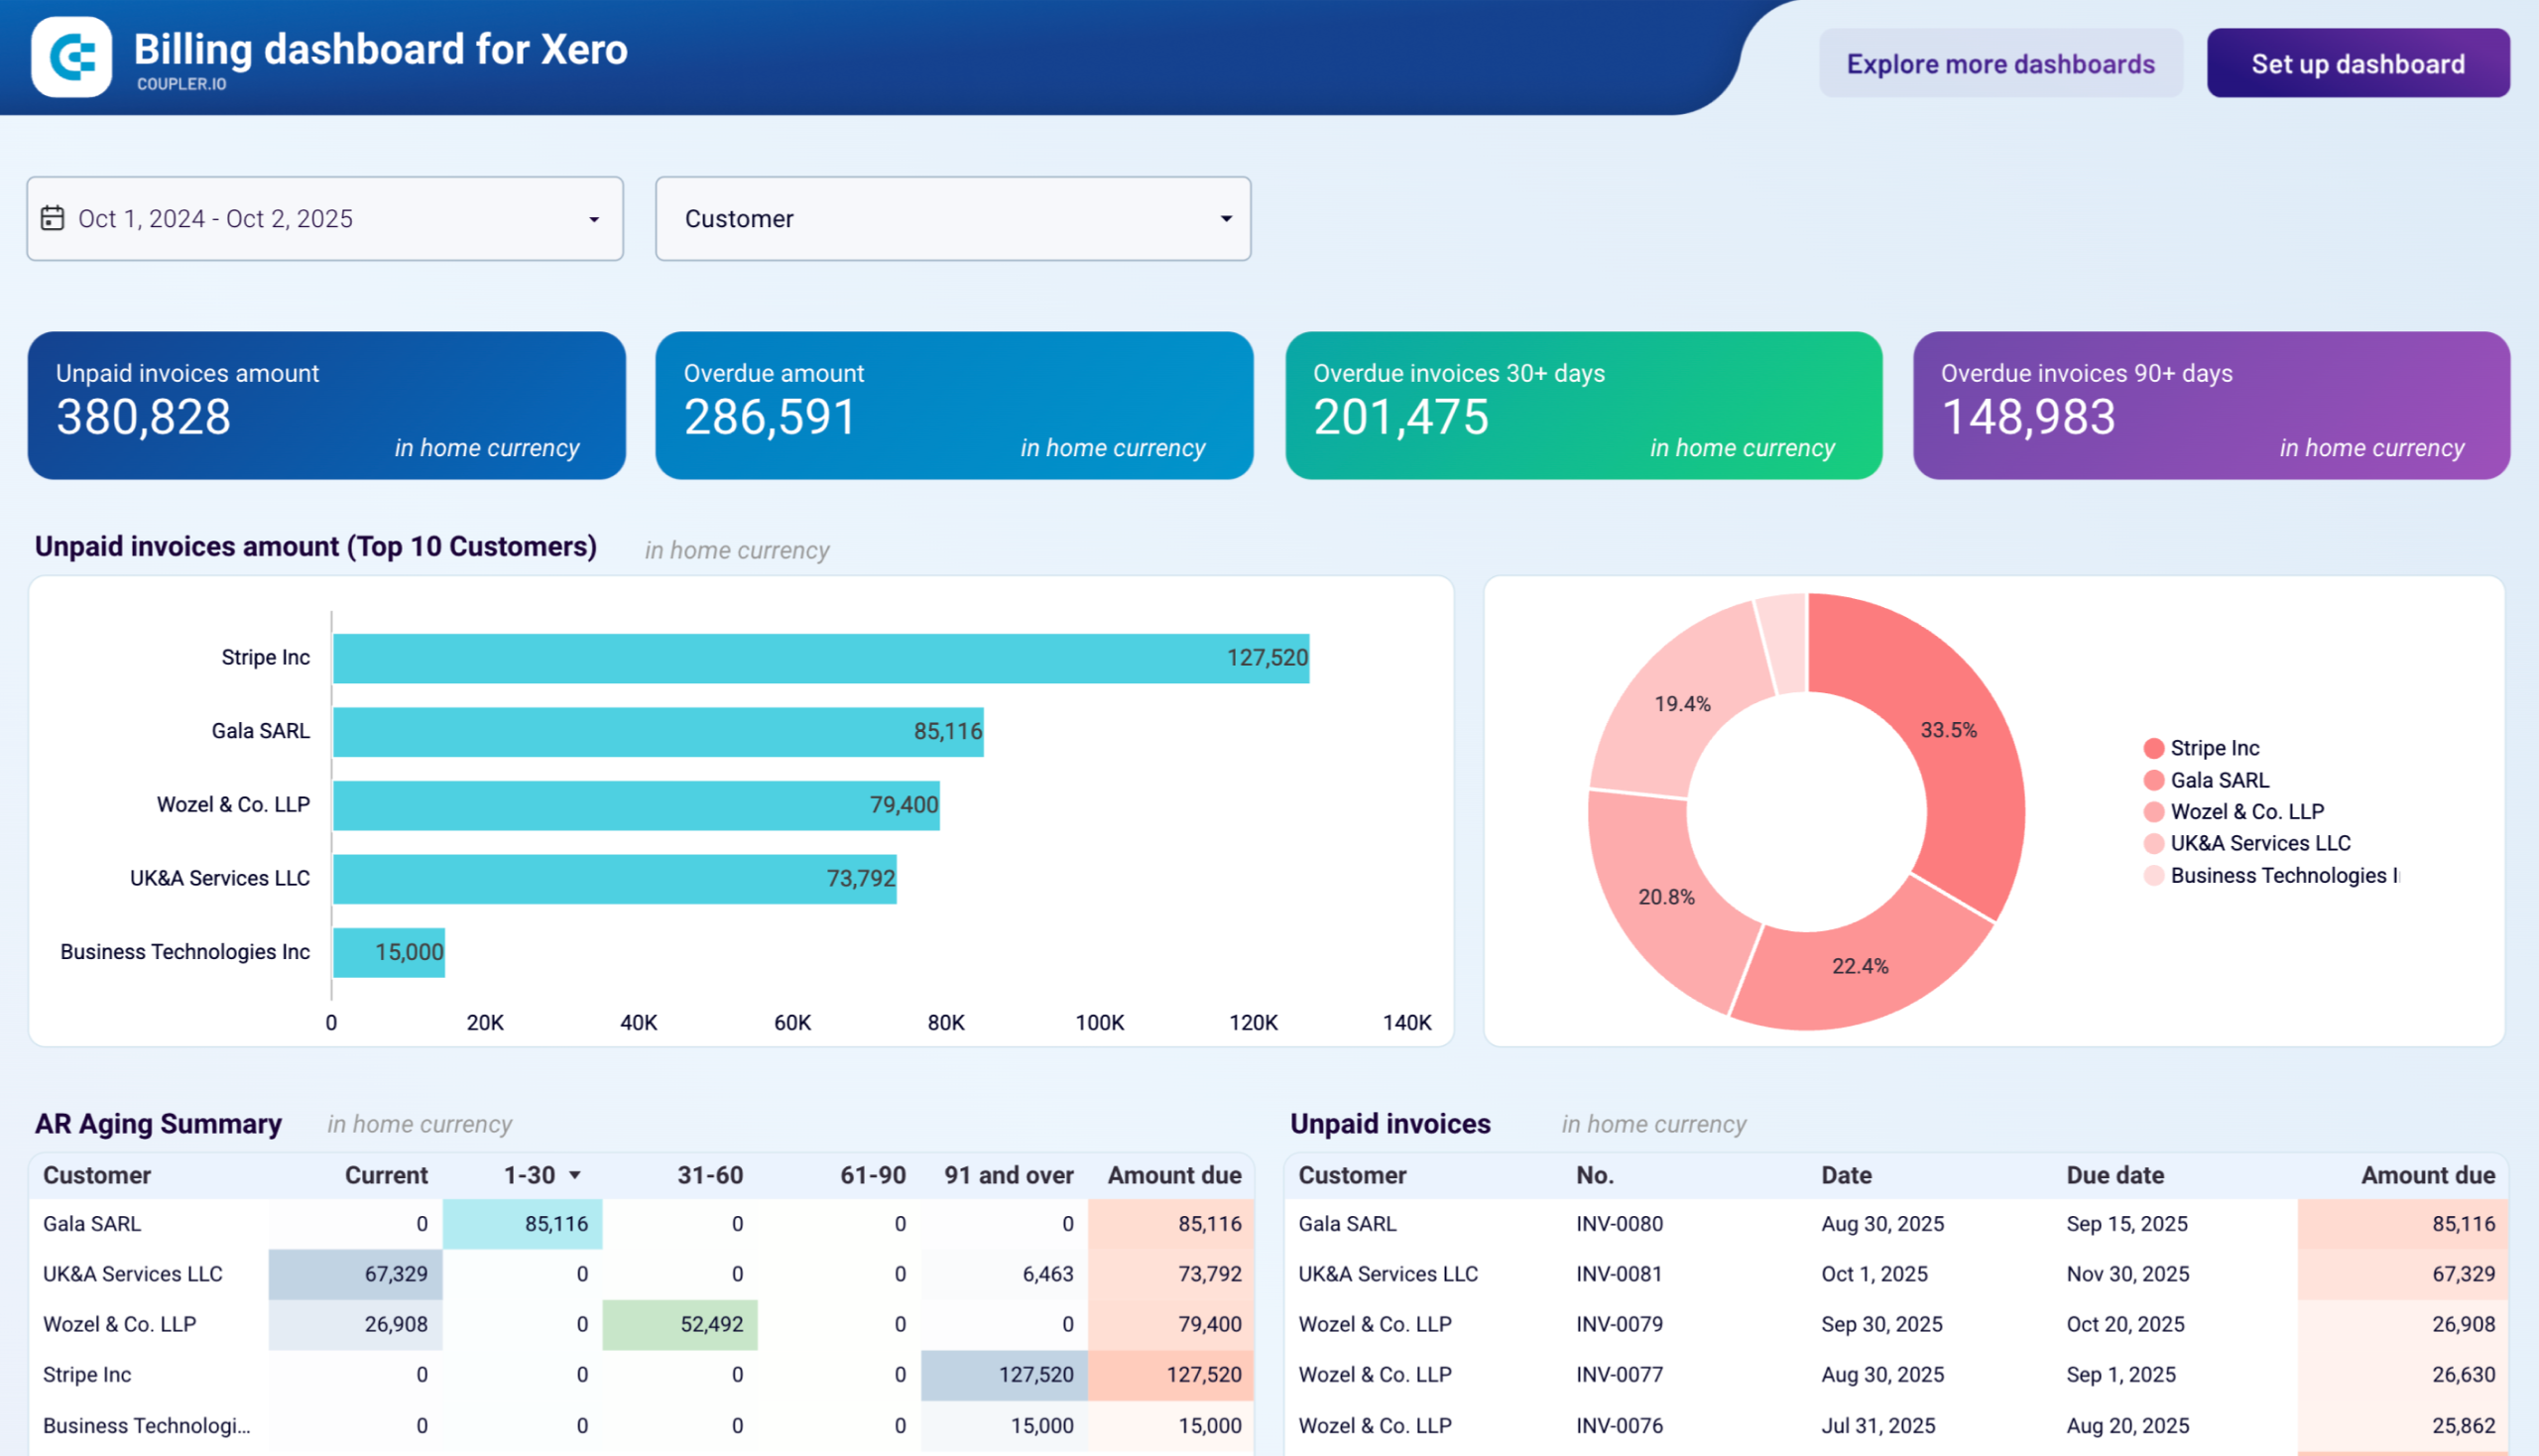
#59. Billing dashboard for QuickBooks/Xero by Coupler.io
This billing dashboard gives small business owners and finance teams a complete view of their cash flow position. It shows both money owed by customers and money owed to vendors in one interface. Instead of navigating through separate accounts receivable and accounts payable reports in your accounting software, you can see the full picture of your billing obligations for informed decisions.
Billing dashboard for QuickBooks
Billing dashboard for QuickBooks
Preview dashboardThe dashboard tracks outstanding customer invoices alongside unpaid vendor bills, showing aging periods for both receivables and payables. You can identify your top debtors and largest vendor obligations, compare overdue amounts by aging bucket, and spot timing mismatches between when cash comes in versus when bills are due.
The bank balance section shows your current cash position across all accounts, so you can determine whether you have sufficient funds to cover upcoming payments or need to accelerate collections.
The dashboard is available for both QuickBooks Online and Xero users, with each template connecting to your accounting platform through the built-in Coupler.io connector. Data refreshes automatically to keep your billing overview up to date without manual exports.
Dashboard metrics:
- Complete invoice and bill records
- Unpaid invoices and overdue amounts
- Top customers by outstanding balance
- AR aging summary by customer
- Unpaid bills and overdue payables
- Top vendors by amount owed
- AP aging summary by vendor
- Bank balances by account and currency
- Paid invoices and bills trends
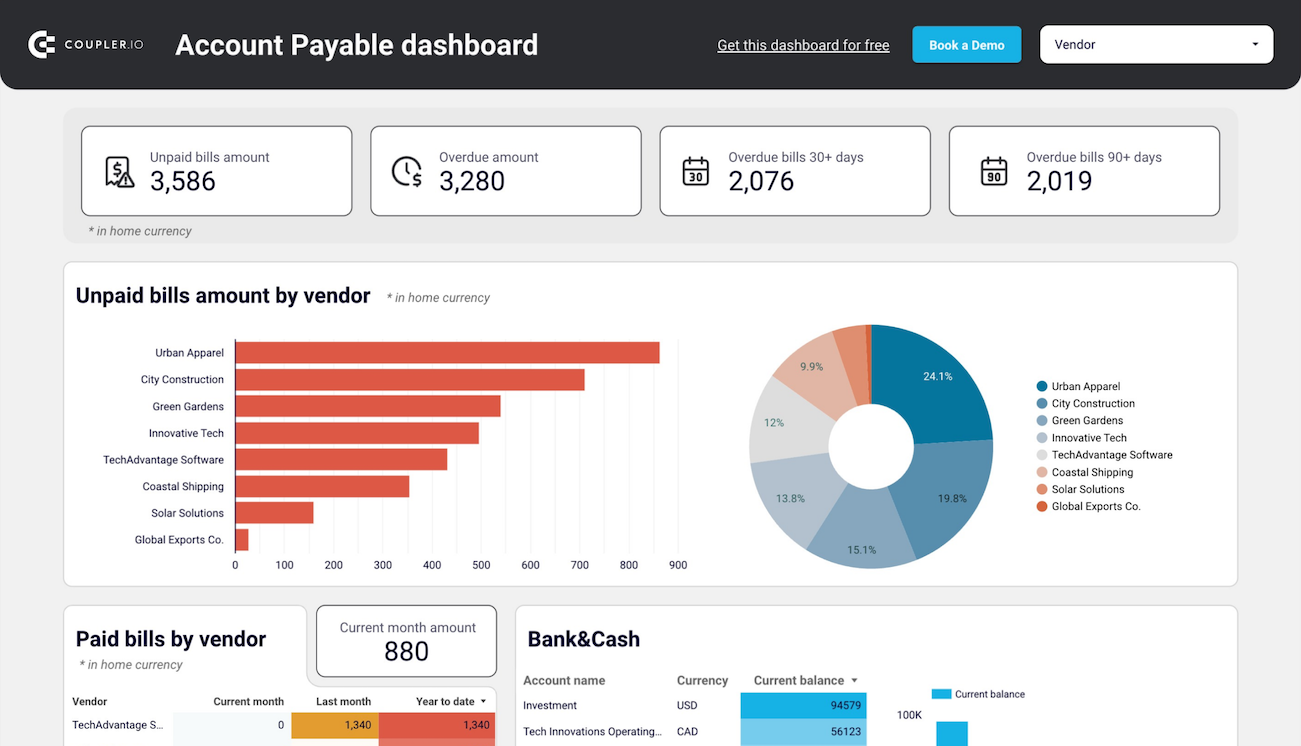
#60. Accounts payable dashboard for QuickBooks by Coupler.io
While the previous template is focused on the main KPIs and revenue in general, this one zooms into Accounts Payable. This free dashboard also connects to Looker Studio and refreshes your financial data on a schedule. It gives you a concise overview of unpaid, overdue, and paid bills grouped by vendor. This allows you to monitor outgoing invoices and prioritize payments.
Accounts payable dashboard for QuickBooks
 Preview dashboard
Accounts payable dashboard for QuickBooks
Preview dashboardIn addition, the dashboard provides you with analysis-ready information on AP aging. It also contains a detailed data table with the vendor bills overview. You can use interactive filters to sort bills by date, vendor, and total amount. All this gives you more transparency and helps improve cash flow management.
Dashboard metrics:
- Upaid bills amount
- Overdue amount
- Paid bills by vendor
- Upaid bills amount
- Bank&Cash
- AP Aging
- Vendor bills
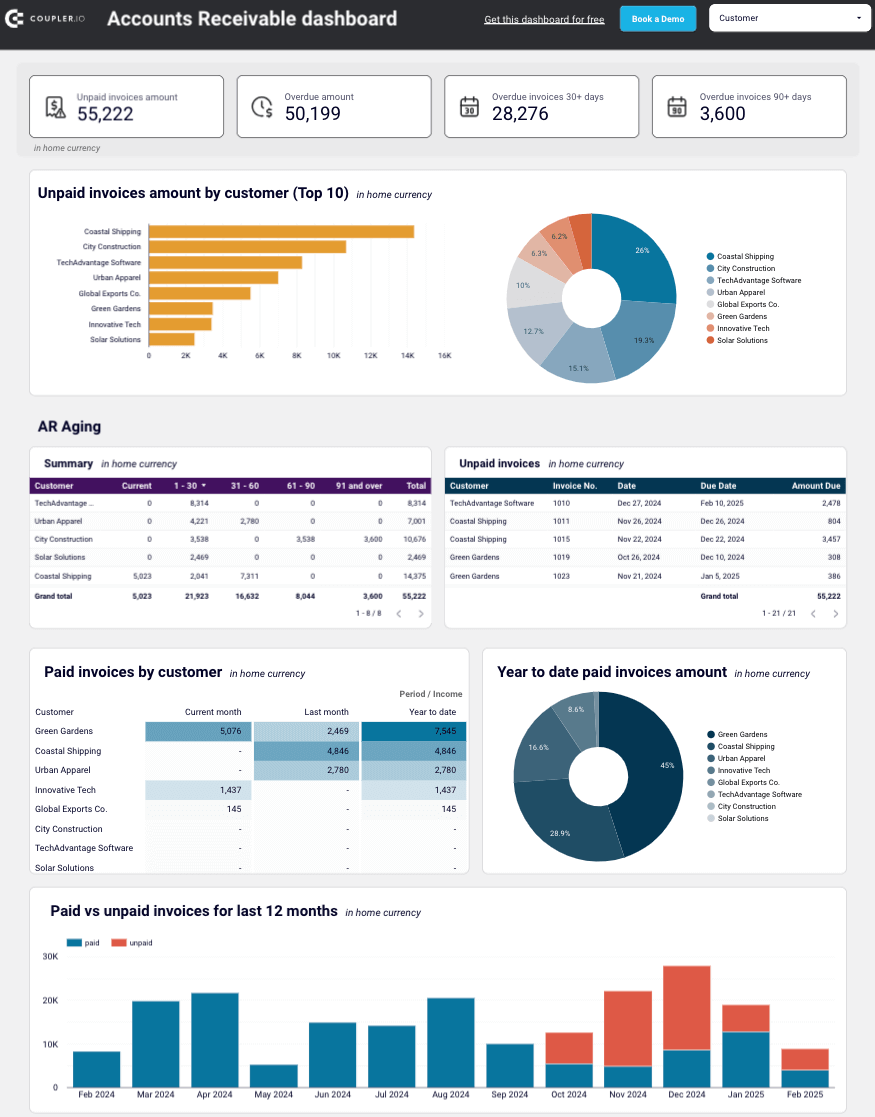
#61. Accounts receivable dashboard for QuickBooks by Coupler.io
Here’s another useful dashboard that collects financial data from QuickBooks. It focuses on the Accounts Receivable data, allowing you to identify the customers with the biggest unpaid invoices amount, as well as keep track of the paid invoices.
Accounts receivable dashboard for QuickBooks
 Preview dashboard
Accounts receivable dashboard for QuickBooks
Preview dashboardIn particular, you can analyze payment dynamics over time with a yearly bar chart. For a more detailed analysis, there is a comparison table showing paid invoices by customer for the current and previous months. Apart from that, the dashboard gives you granular details on customer invoices and AP aging.
QuickBooks doesn’t offer a representation of the Accounts Payable information in such a format, which makes this dashboard especially useful.
It’s very convenient for analysis, monitoring purposes, and sharing data with the stakeholders. You can present the key trends and metrics without providing access to the QuickBooks account.
Dashboard metrics:
- Unpaid invoices amount
- Overdue amount
- Overdue invoices 30+ days
- Paid invoices by customer
- Year-to-date paid invoices amount
- AP aging summary
- Customer invoices
#62. Payroll dashboard for Harvest
This dashboard pulls time-tracking data from Harvest to calculate labor costs across your team. Finance teams and project managers can verify payroll totals, review cost per user, and analyze how hours translate to expenses without manually processing time entries.
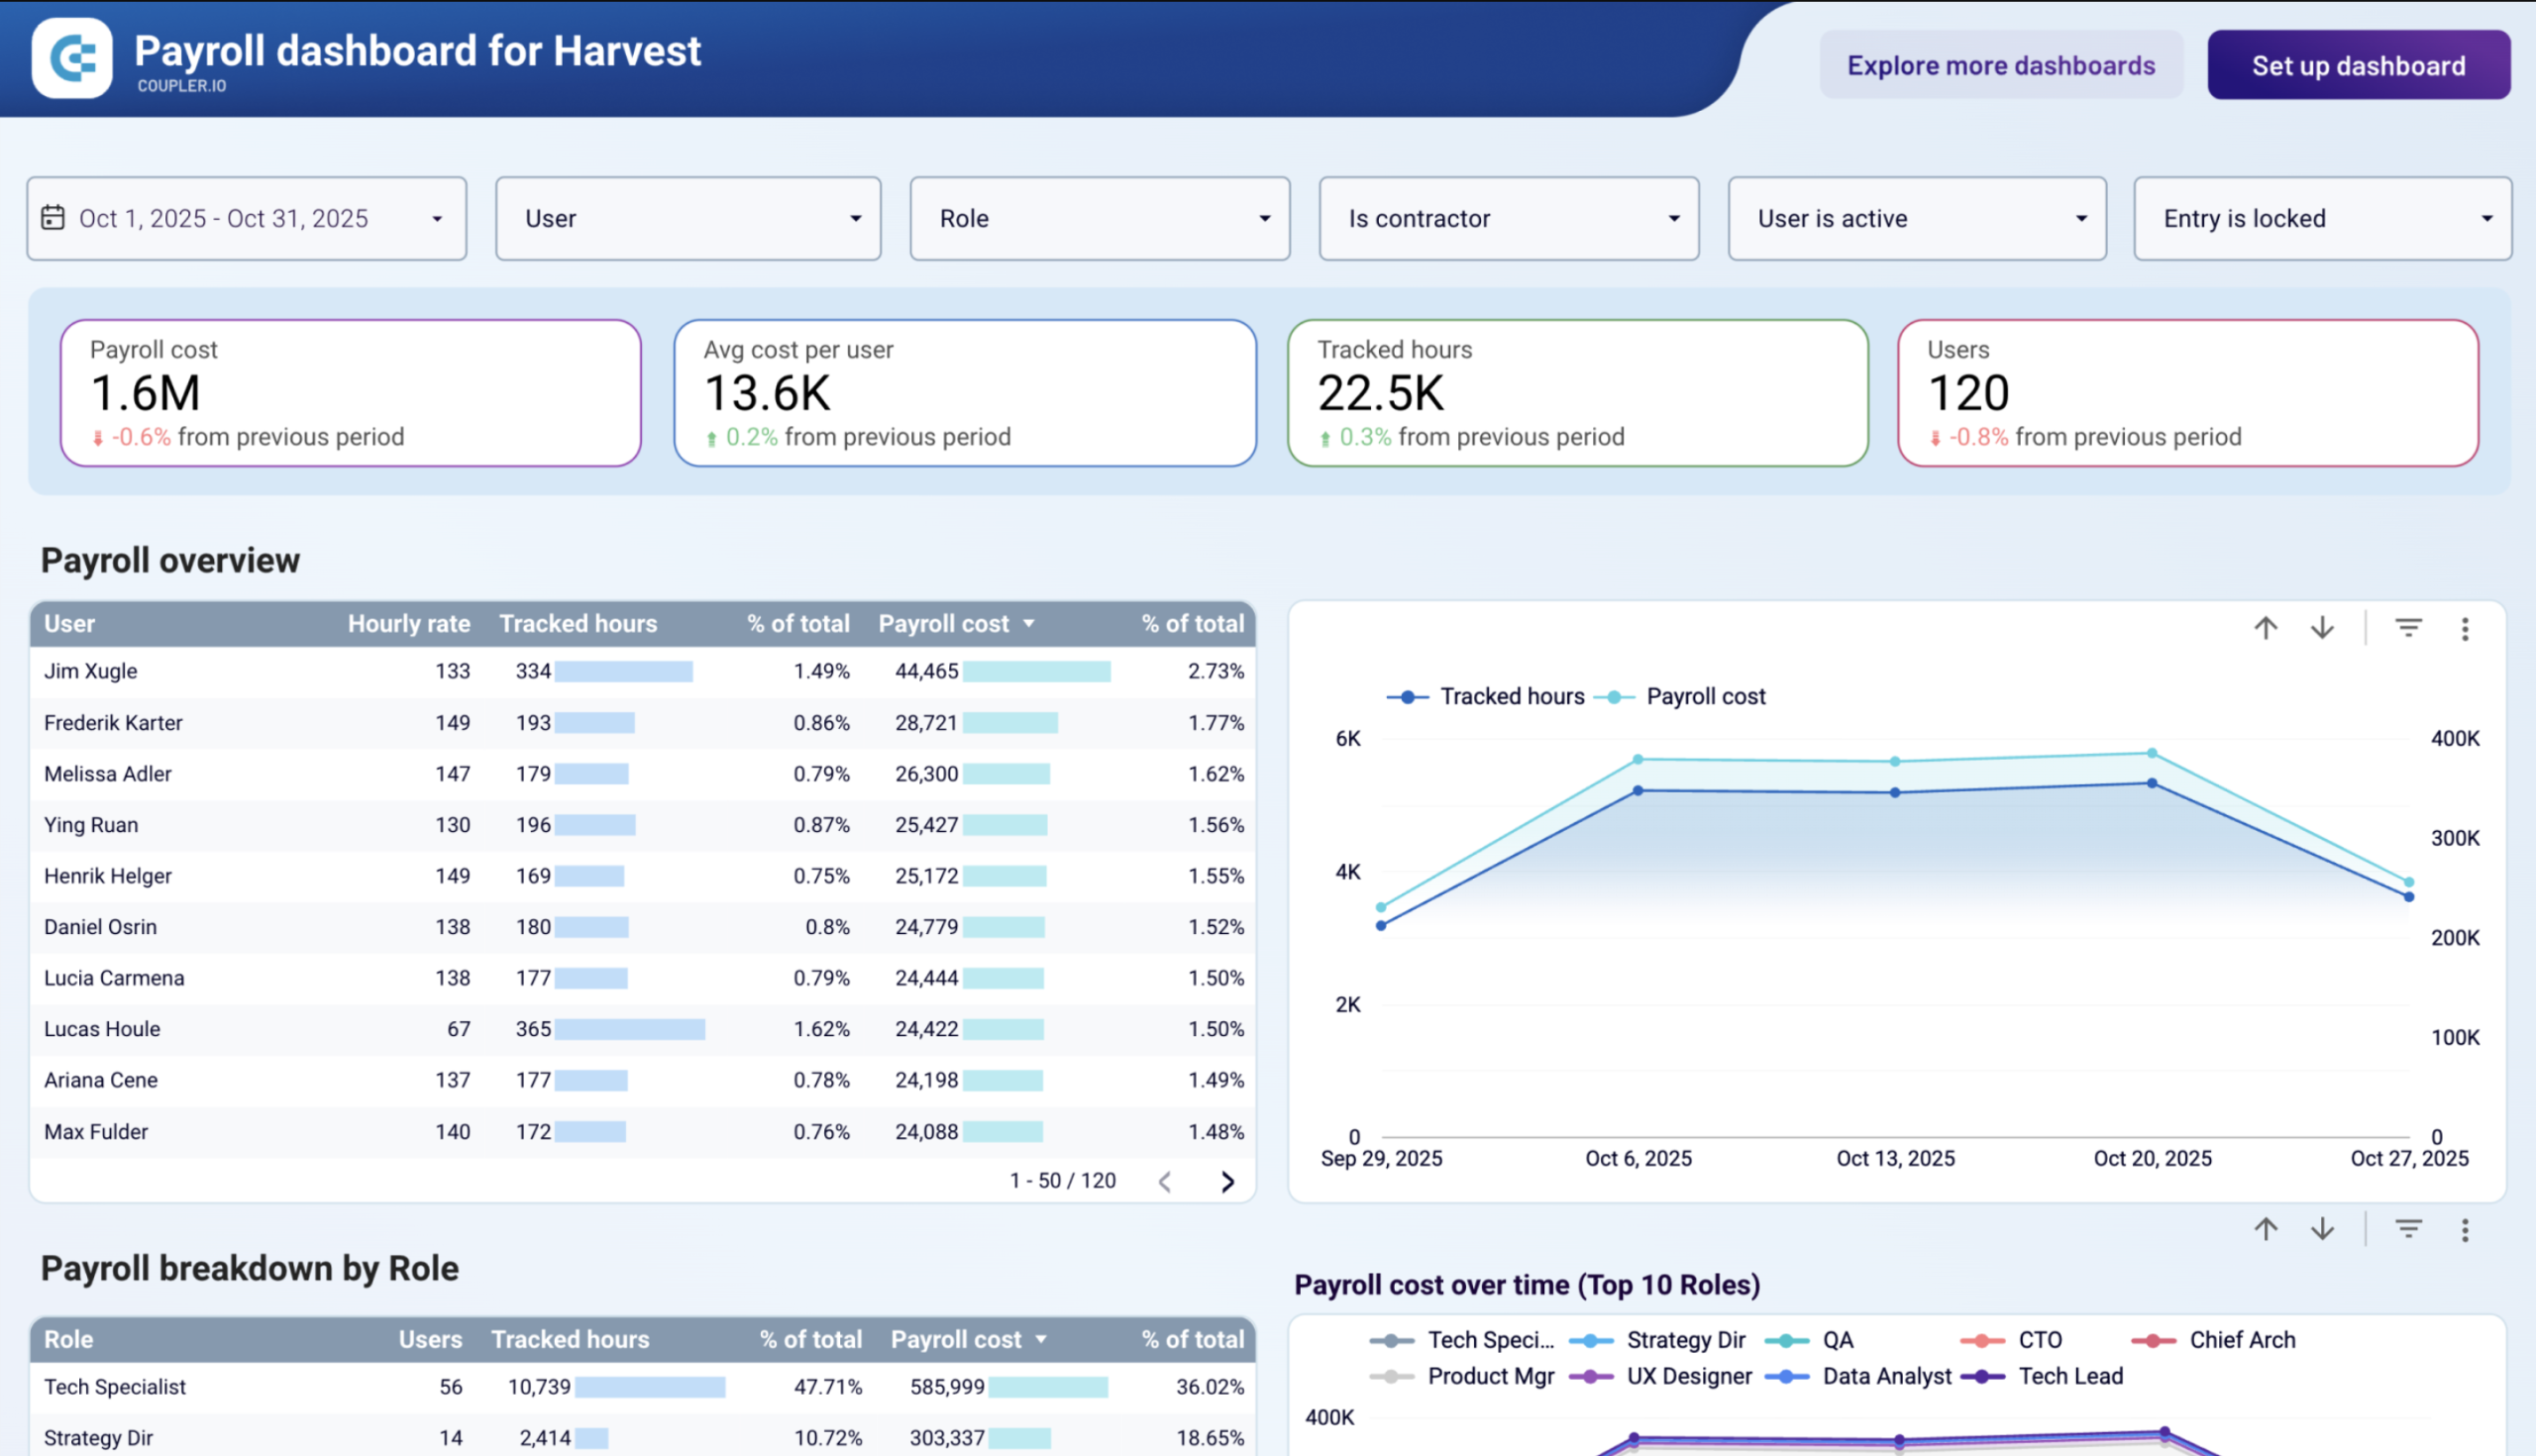
The role-level breakdown shows which job functions consume the largest share of your payroll budget and how that shifts over time. A dual-axis trend chart overlays tracked hours against payroll cost, which makes it easy to see whether spending increases come from more hours worked or from higher-rate contributors.
Meanwhile, a calendar heatmap highlights time entry anomalies before payroll runs: batched entries, missing days, or suspiciously high daily totals stand out at a glance. Additionally, the Details table provides transaction-level records per user, project, client, and task for payroll verification and project cost audits.
Dashboard metrics:
- Payroll (total)
- Tracked hours
- Average cost per user
- Payroll cost by role
- Payroll cost over time
- Team size (active users)
Project management dashboards in Looker Studio
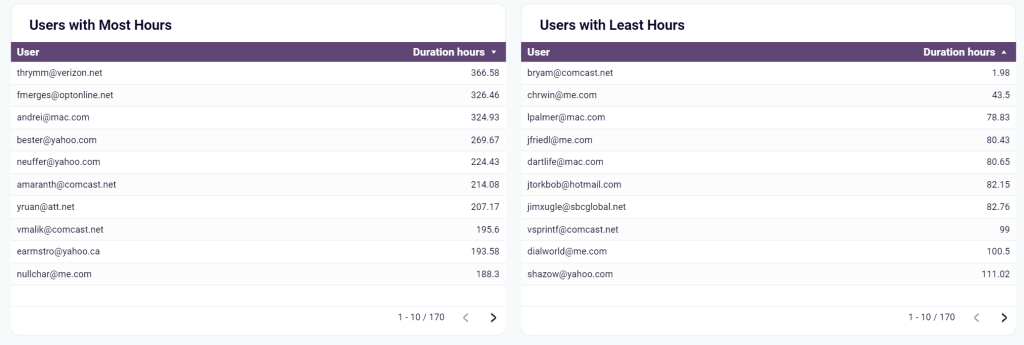
#63. Time tracking dashboard for Harvest/Clockify by Coupler.io
If you use Clockify or Harvest as a time tracking tool for your company, you can derive insights into the time efficiency of your team. Coupler.io offers a time-tracking dashboard template designed for both Clockfy and Harvest in Looker Studio. Traditionally, the template is equipped with connectors that will facilitate your data automation experience.
Time tracking dashboard for Harvest
Time tracking dashboard for Harvest
Preview dashboardThe main value of this dashboard is to let you understand how efficiently time is spent in your company. You have several charts at your fingertips, including hours breakdown, billable amount by client, calendar view, and others.


Dashboard metrics:
- Posted hours
- Active users
- Billable hours
- Billable amount
- Hours breakdown
- Duration hours, etc.
#64. Google Calendar dashboard by Coupler.io
The Google Calendar dashboard template provides insights into meeting hours, meeting breakdowns, out-of-office hours, and more. With it, you can analyze your meeting times, as well as time of your employees. This will give you an understanding on what you can do to optimize time expenses.
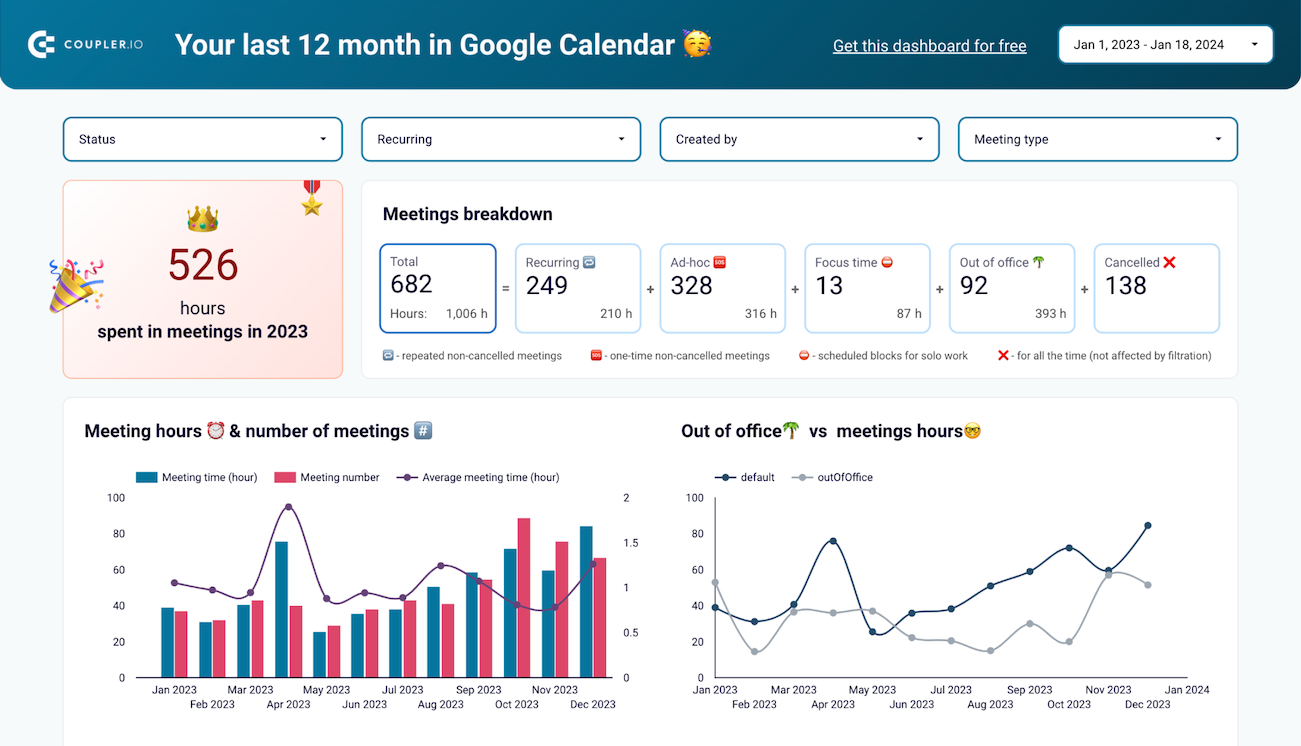
Google Calendar dashboard is an advanced alternative to Time Insights per se. To start using it, just connect your Google account and the built-in connector by Coupler.io will populate the dashboard with your data.
Dashboard metrics:
- Meeting hours
- Number of meetings
- Ad-hoc meetings
- Focus time
- Out-of-office hours
Practical applications of Looker Studio dashboard examples
Let’s explore how else the Looker Studio dashboard templates can be useful.
- Sales and revenue analysis. Looker’s dashboards can track sales performance from CRM and show revenue trends, identifying sales opportunities. Visualizations can provide insights into product performance, sales territories, customer segments, and sales team effectiveness.
- Marketing campaign performance. Examples of a Looker Studio dashboard in marketing reporting can help monitor the effectiveness using metrics such as click-through rates, conversion rates, and campaign ROI. Visualizations can highlight the best-performing channels, campaign engagement levels, and customer acquisition patterns.
- Customer analytics and segmentation. Looker Studio dashboard examples can assist in analyzing customer behavior, segmenting customers based on various attributes, and understanding customer lifetime value. Using this information will allow you to target marketing, offer personalized recommendations, and target customer retention strategies.
- Supply chain and inventory management. Looker Studio reports can provide insights into inventory levels, supply chain performance, and order fulfillment metrics. Visualizations can help identify bottlenecks, optimize inventory levels, and monitor supplier performance to improve operational efficiency.
- Financial analysis and forecasting. Various examples of a Looker Studio dashboard enable financial data analysis, metric tracking, and forecasting. This allows businesses to monitor cash flow, profitability, and financial health.
- HR and workforce analytics. Looker Studio dashboard examples can help analyze HR data, such as employee performance, retention rates, and workforce diversity. These insights can aid in identifying skill gaps and improving employee engagement and productivity.
- Product analytics and user behavior. Looker Studio reporting dashboards can provide an in-depth analysis of product usage, user behavior, and feature adoption. As a result, you can improve product development, identify improvement areas, and optimize user experience with this information.
- Operational analytics. Using Looker’s dashboards, you can monitor operational metrics, track efficiency, and identify process improvements. Visualizations can help identify operational bottlenecks, monitor service-level agreements, and optimize resource allocation.
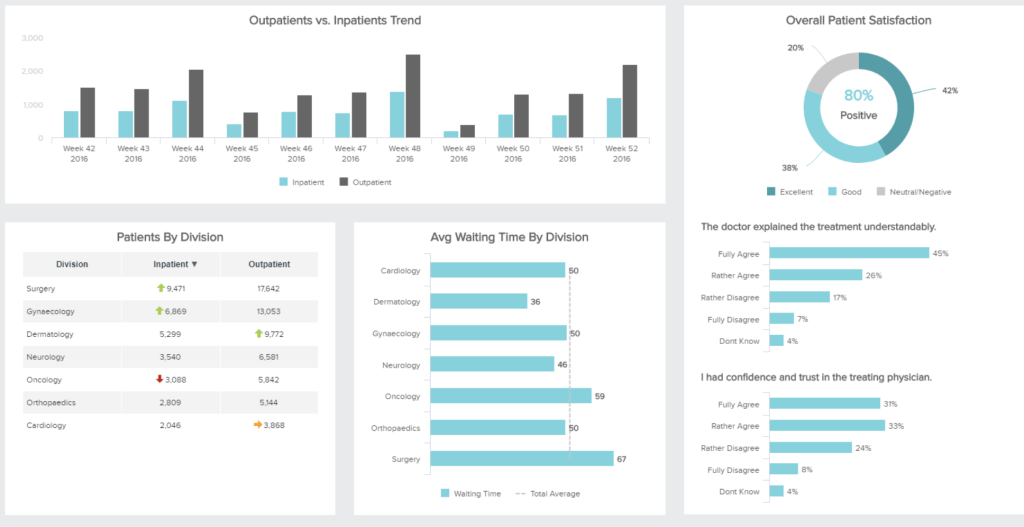
- Healthcare analytics. Looker Studio dashboard examples can assist in analyzing healthcare data, such as patient outcomes, and operational efficiency. These insights can aid in optimizing healthcare delivery, identifying patterns, and improving patient care.
- E-commerce analytics. You can use examples of a Looker Studio dashboard to analyze customer retention, conversion rates, and average order value for e-commerce. Visualizations can help optimize pricing strategies, identify popular products, and enhance customer experience.
These examples highlight the versatility and value of Looker Studio dashboards in different scenarios. Businesses and organizations can leverage them to enhance overall performance.
FAQs on Looker Studio dashboard templates and examples
What are the benefits of using ready Looker Studio dashboard examples?
Let’s start thoroughly exploring the benefits for all business line representatives:
- Ease of use. The intuitive interface allows users to create and customize an informational panel without requiring extensive technical expertise.
- A high degree of customization. You can tailor the appearance of your Looker Studio dashboard examples to align with your brand’s visual identity. A lot of them offer the white label option.
- Flexibility. The tool lets you include or remove visualizations as needed, ensuring that your dashboards present the most relevant and impactful information.
- Interactivity. With just a few clicks, users can drill down into their data. The seamless integration of data connectors (BigQuery, Tableau, Power BI, Shopify, HubSpot, Google Sheets, etc.), which act as bridges connecting Looker Studio reports to underlying data sources ensures easy access.
- Scalability. Provided examples of Looker Studio dashboards excel in handling large datasets, making them scalable for organizations dealing with vast amounts of information, whether you’re analyzing terabytes of customer data or tracking real-time metrics from multiple sources.
- Data security. Looker Studio prioritizes the protection of your data through robust stringent security protocols.
- Time-saving automation. You can save time by automating data cleaning and visualization tasks and sharing findings with colleagues and stakeholders for collaboration. Additionally, the Looker Studio API provides a powerful tool for Google Workspace or Cloud Identity organizations, allowing them to automate the management and migration of Looker Studio assets.
Moreover, Looker Studio offers the capability of report embedding, enabling businesses to seamlessly include their dashboards within any web page or intranet.
How to choose the right one among the Looker Studio templates?
We recommend using pre-built Looker Studio marketing dashboards from various providers, including the Looker Studio Team by itself, for efficient and time-saving data analysis. Start by connecting your operational data sources using the built-in and partner connectors. Selecting the appropriate visualization format will enhance your data analysis.
What else to look for while choosing the dashboard?
- First, ensure the template is relevant to your industry or specific use case.
- Look for a dashboard highlighting the key metrics important for your analysis.
- Additionally, check if the template is compatible with your data sources and can seamlessly integrate with your existing infrastructure.
- Assess the design and user-friendliness of the template for a straightforward interpretation of data and consider the availability of documentation and support resources provided with the dashboard.
- Finally, read user feedback and recommendations to gain insights into the template’s effectiveness and usability.
Who can use Looker Studio templates?
With Looker Studio (Google Data Studio) dashboards, even those without a data science or business intelligence background can effortlessly leverage the data analysis.
Professionals from different industries and with various backgrounds use Looker Studio templates to organize, track, and analyze their data. Here are just some of them:
- Sales professionals. Even though most CRM platforms offer some simple reports, it’s often more useful to combine data from various sales-related apps on one page. Building a dashboard with a Looker Studio template is a simple way to do so.
- PPC experts. Running ads on various PPC platforms generates a lot of valuable data. With a dashboard, it’s easy to keep track of everything in one place and make adjustments on the go.
- SEO analysts. Monitoring key metrics in a comprehensive dashboard allows you to understand how the website is performing and what can be improved.
- Marketing professionals. Marketing campaigns often involve a number of various channels, platforms, and marketing apps. Aggregating this data for cross-channel and closed-loop analytics in a dashboard can be very helpful to stay in control of the KPIs.
- Finance and accounting professionals. They can use Looker Studio dashboard templates to monitor revenue, create analytical reports, and to get insights for improving financial strategy.
- Ecommerce businesses. For an ecommerce store to run smoothly, it’s essential to closely monitor and analyze where most orders come from, how shipping time correlates with the repurchase rate, and so on. So many business owners use Looker Studio dashboards to analyze their data.
In general, using readily-made Looker Studio dashboard templates is a good option that allows you to simplify working with data and save significant time.
Leverage Looker Studio templates to maximize efficiency
By harnessing the full capabilities of Looker Studio dashboard examples, including data connectors, the Looker Studio API, and report embedding, businesses can optimize their processes, drive informed decision-making, and effectively communicate data insights.
We have explored a collection of highly recommended Looker Studio dashboard templates. With an emphasis on integrability, visualizations, and customizability, these templates provide powerful tools to streamline your data analysis process and communicate data-driven narratives to teams.
So, take the next step in your data analytics journey and explore these dashboards to find the ideal Looker Studio templates that align with your needs. We wish you success in discovering insightful information and maximizing your data’s potential with ease!
For more information on the data visualization topic, check our article on Google Sheets dashboard examples and CRM dashboards.