17 Best Google Ads Looker Studio Templates

Creating reports and dashboards in Looker Studio from scratch takes up a lot of precious time. The preferred option is to analyze Google Ads data with the help of templates. They allow you to automate report creation by simply connecting to Google Ads data and continuing with the analytics in Looker Studio. As a result, you can focus on measuring campaign performance and quickly gain valuable insights for your business. In this article, we’ll discuss the top 17 Google Ads Looker Studio templates, their metric descriptions, and how you can use them for reporting.
Top Google Ads report templates in Looker Studio
There are numerous Google Ads Looker Studio templates out there. But only a few contain all that’s needed to analyze and report on ads and campaign performance for different periods. So we’ve carefully chosen the 17 best templates worth your time (and money). We’ll explore each template, the KPIs and metrics covered, and how to get them for your use.
#1. Google Ads Looker Studio template by Coupler.io
This Google Ads dashboard template is offered by Coupler.io – a reporting automation platform. The dashboard can be easily connected to your Google Ads account thanks to the built-in connector. As a result, you’ll get the main ad campaign performance metrics in one report.
Template metrics description
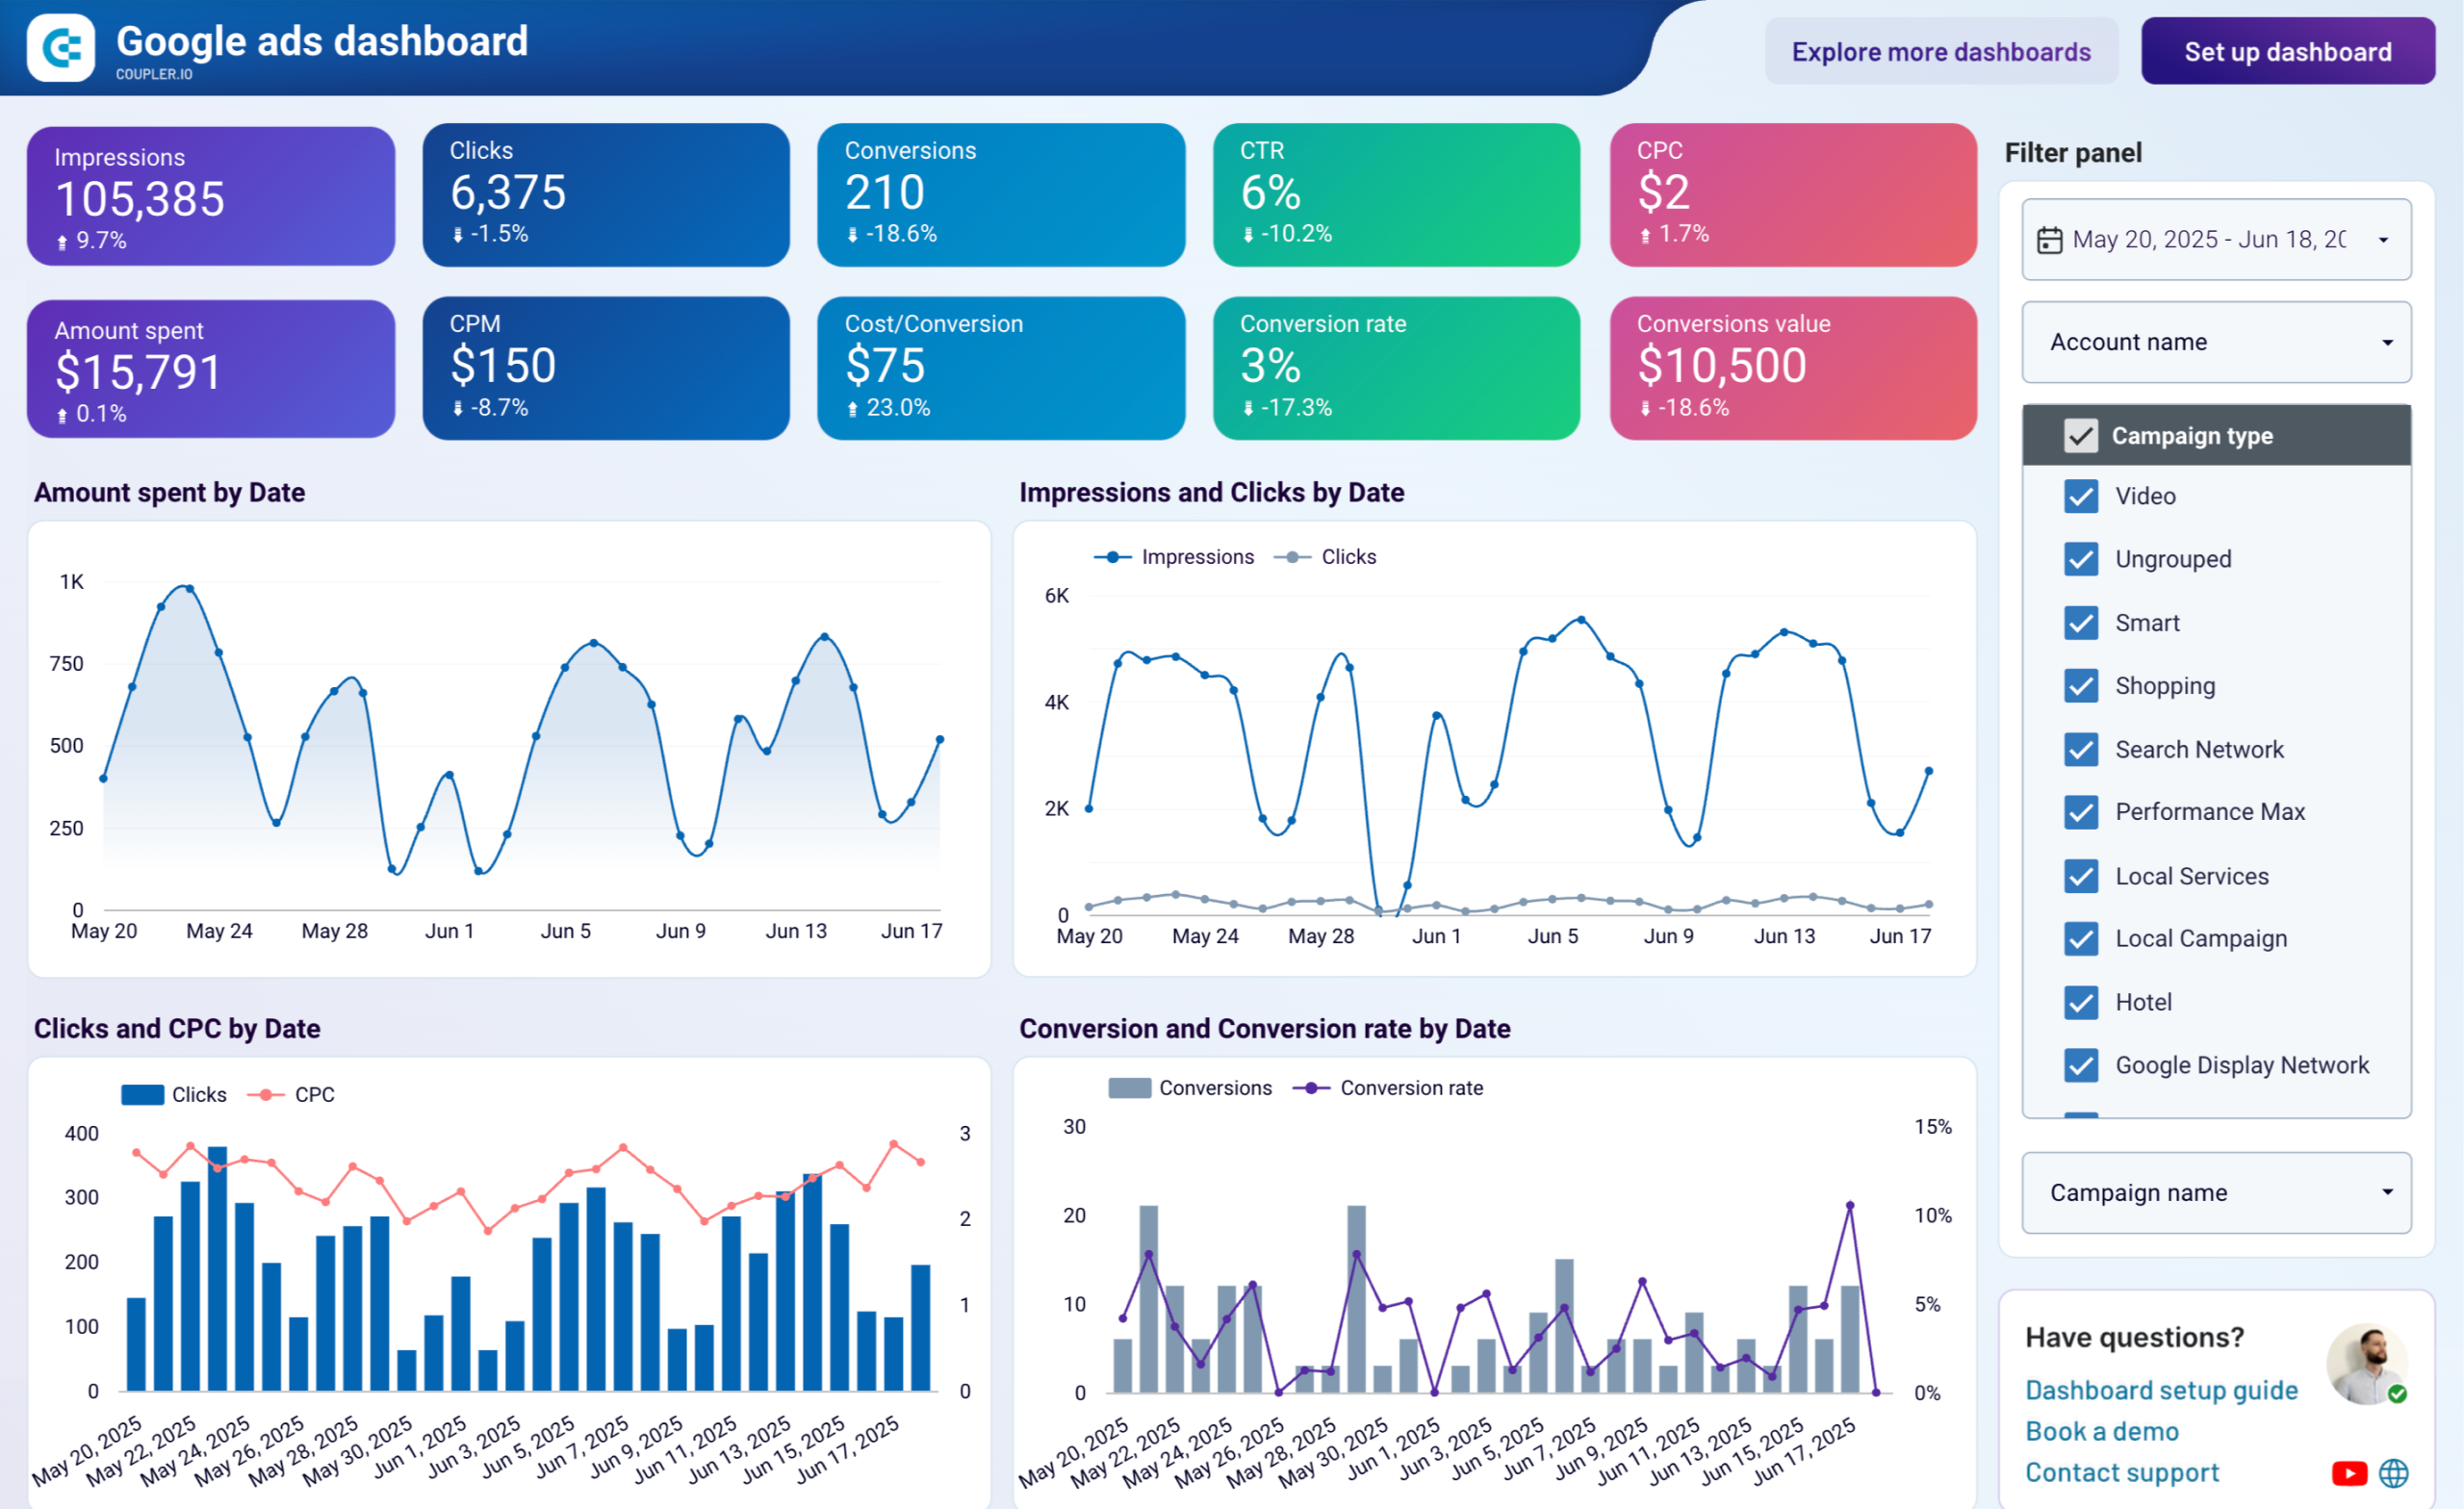
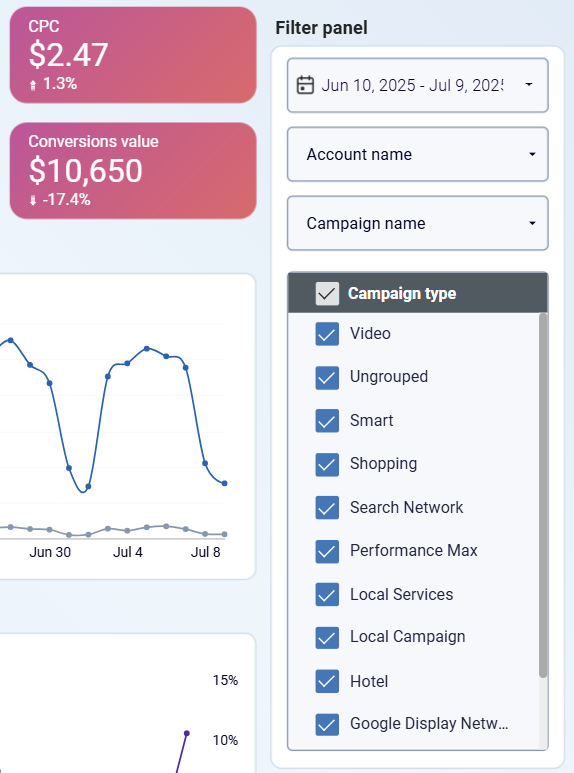
There are two main pages in this Google Ads Looker Studio template. First, we have the Google Ads Overview page, where you can see all the key metrics such as impressions, clicks, conversions, and others. Below each metric scorecard, you have a percentage value that shows the comparison to the previous period.
You can also filter data by Campaign type or name to get insights into campaign performance without the need to jump further from one page to another.
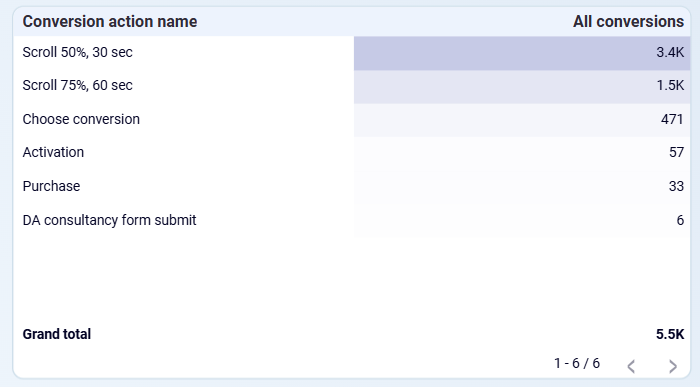
The dashboard is also stuffed with pie charts, line charts, and tables with selected dimensions and metrics. For instance, the Conversion action name table allows you to see the funnel formed based on all your Google Ads conversions.
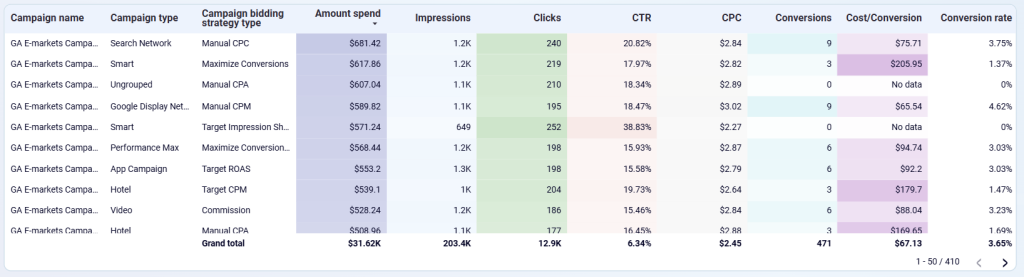
And below you’ll see a table that answers the question about your top-performing campaigns.
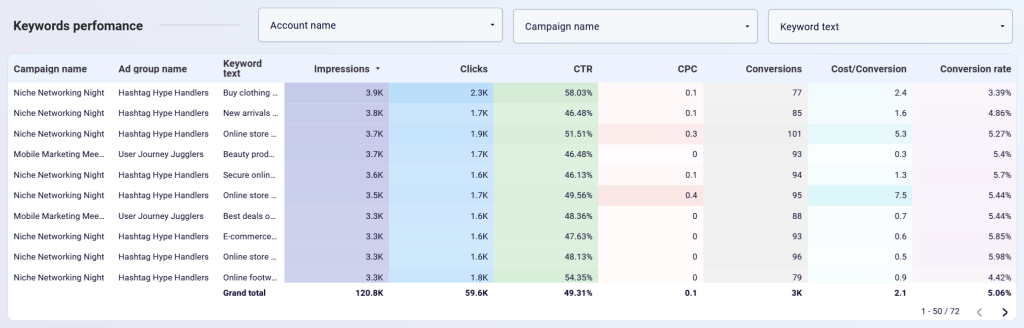
There is also a separate table for keyword performance.
You can also access a quick analysis of your conversions based on demographics on a separate page. All this is visualized with easy-to-read charts, instead of clunky tables.
How to use this dashboard?
The Readme page explains how to start using the dashboard and connect your data. If you don’t already have a Coupler.io account, sign up for a free trial – no credit card required. From the brief Readme tutorial, you’ll follow a link to set up a preconfigured Coupler.io importer that refreshes data automatically (by default at 8am) but you can configure the schedule to suit your needs. Once you head back to Looker Studio, your imported data and calculated metrics will be ready to use in the dashboard. Coupler.io offers an out-of-the-box solution, so you won’t have to bother about a Google Ads data connector or automation tool.
Pricing
This Google Ads Looker Studio template is available for free. If it suits your needs, make sure you grab it right now.
#2. Google Ads monthly performance template by Coupler.io
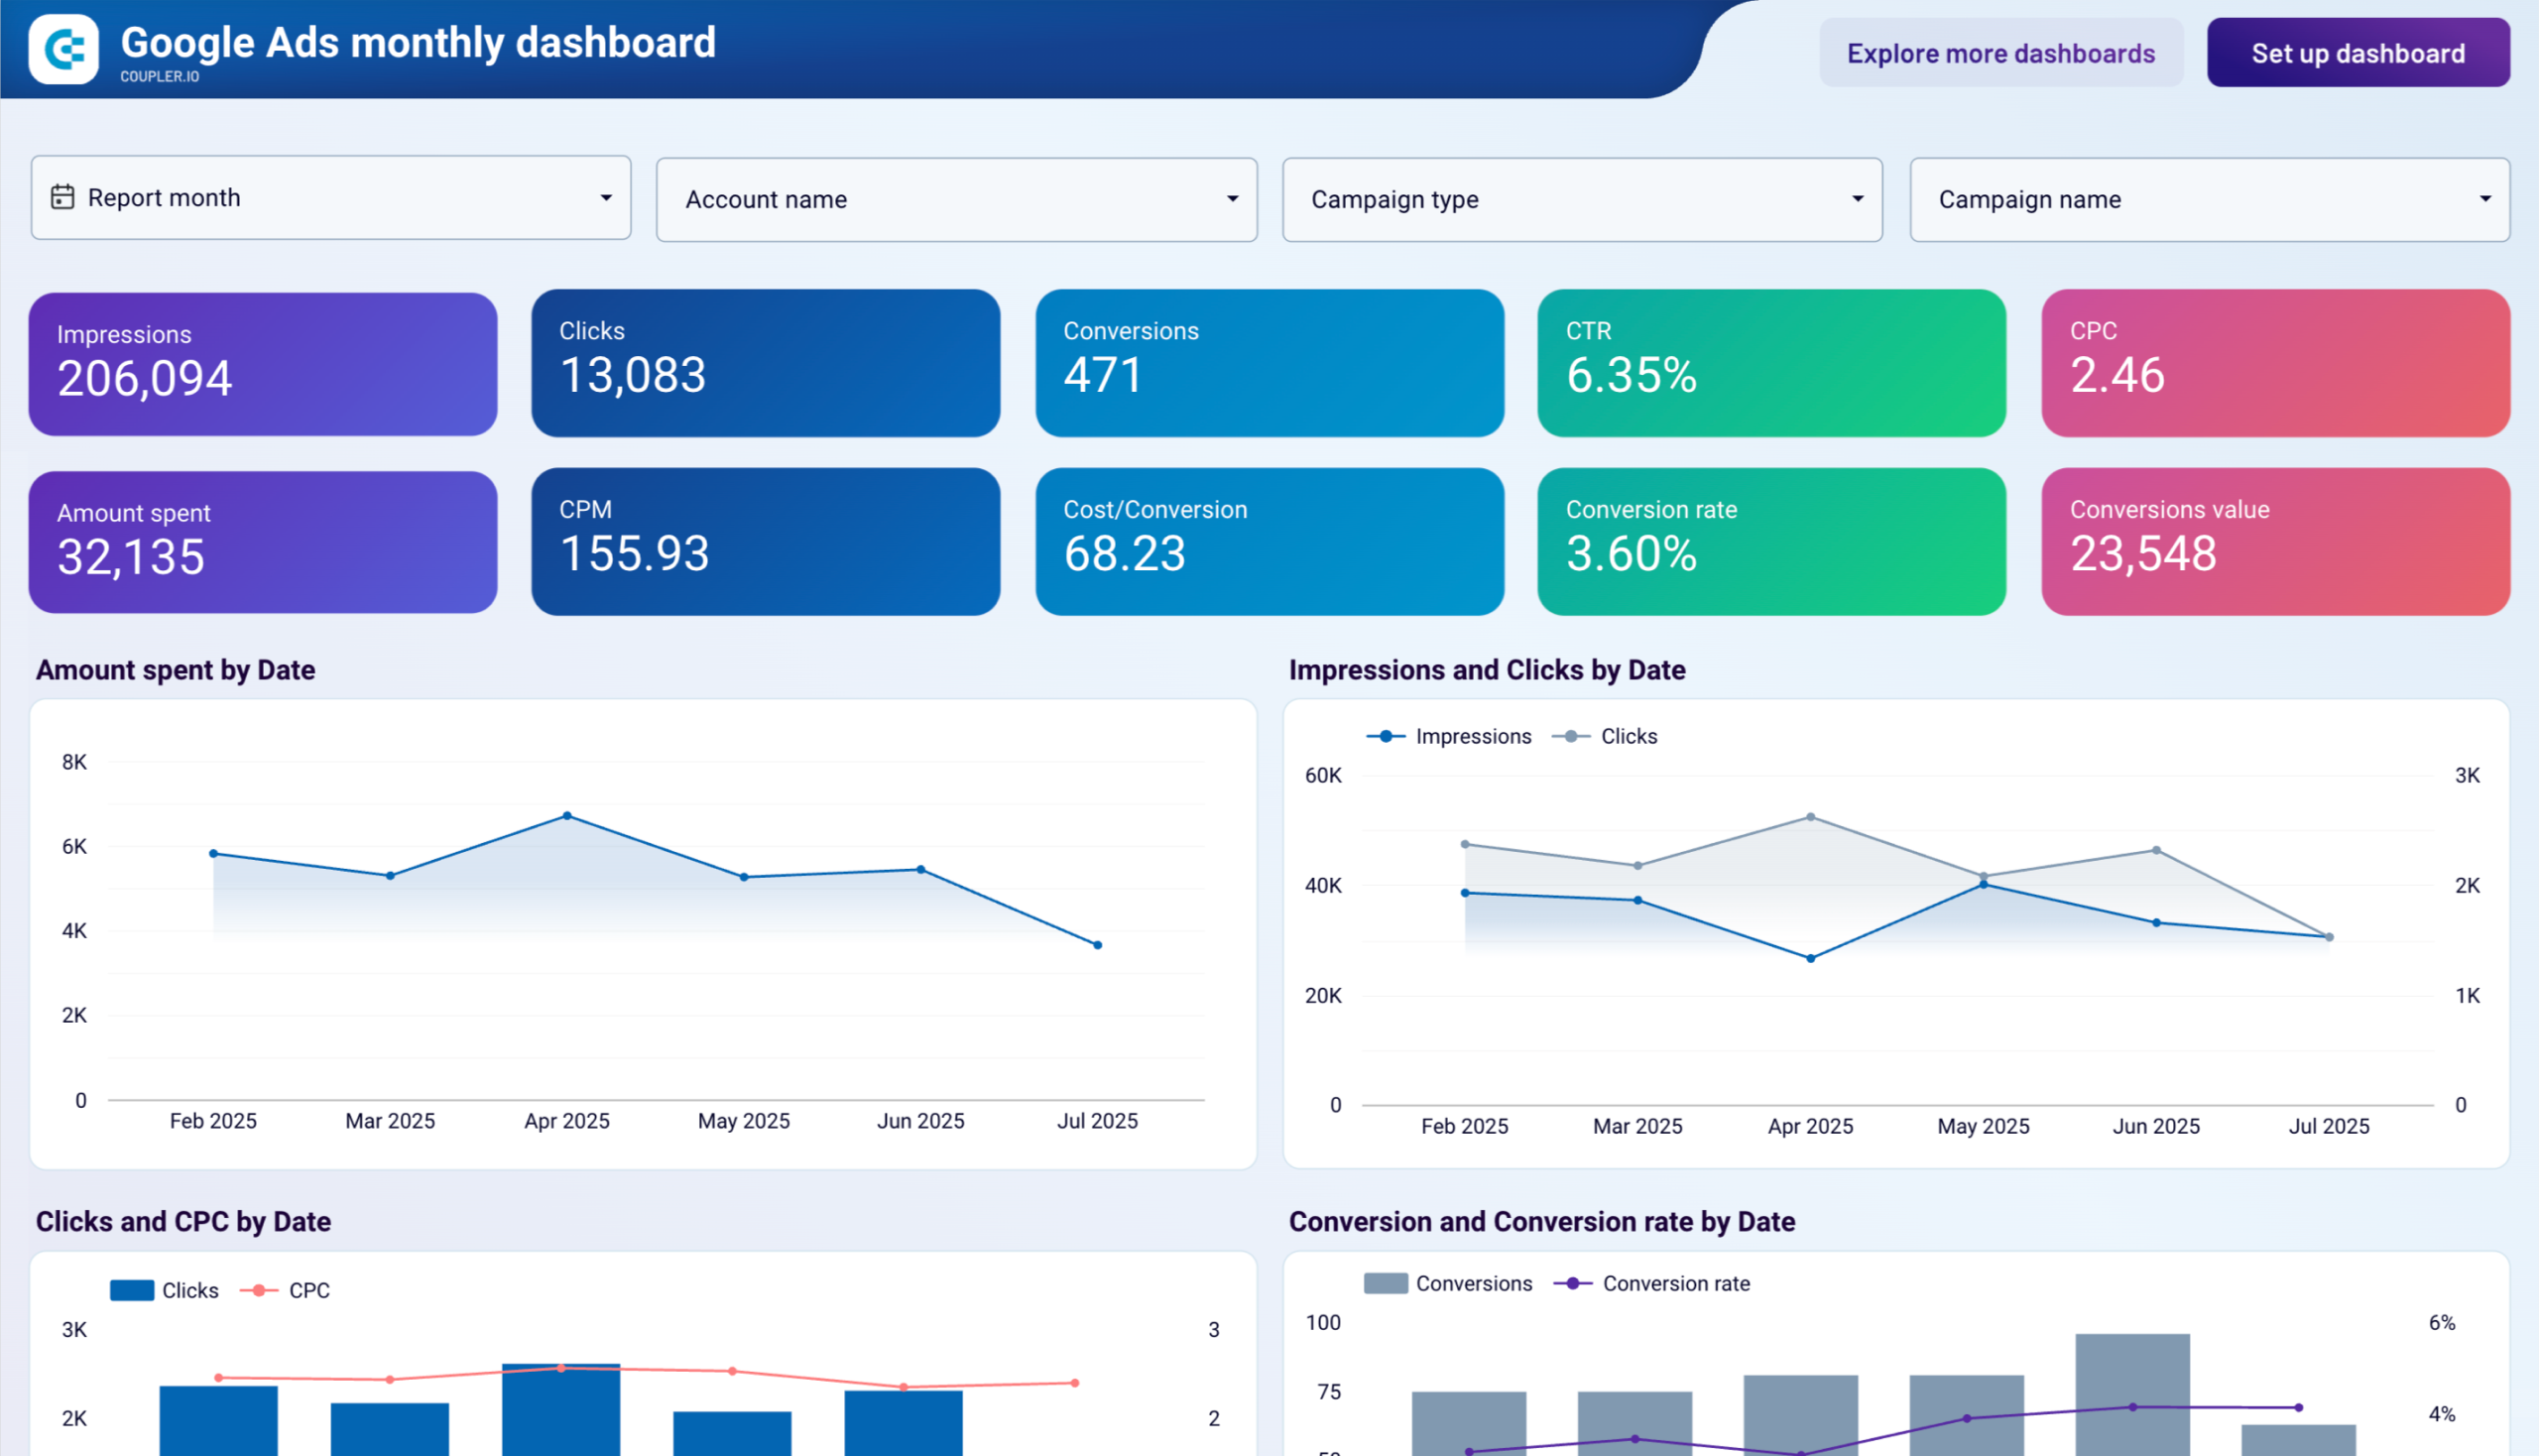
For marketers who need to track Google Ads performance trends over time, this monthly performance dashboard provides detailed insights into campaign effectiveness across different time periods. The template focuses specifically on monthly analysis, making it ideal for executive reporting and long-term strategic planning.
Template metrics description
The dashboard offers comprehensive monthly tracking across multiple analytical dimensions:
Campaign Performance Analysis: The dashboard features dual pie charts comparing spend allocation against conversion performance, instantly revealing budget efficiency across different campaign types. This side-by-side comparison helps identify which campaign categories deliver disproportionate value and highlights budget reallocation opportunities.
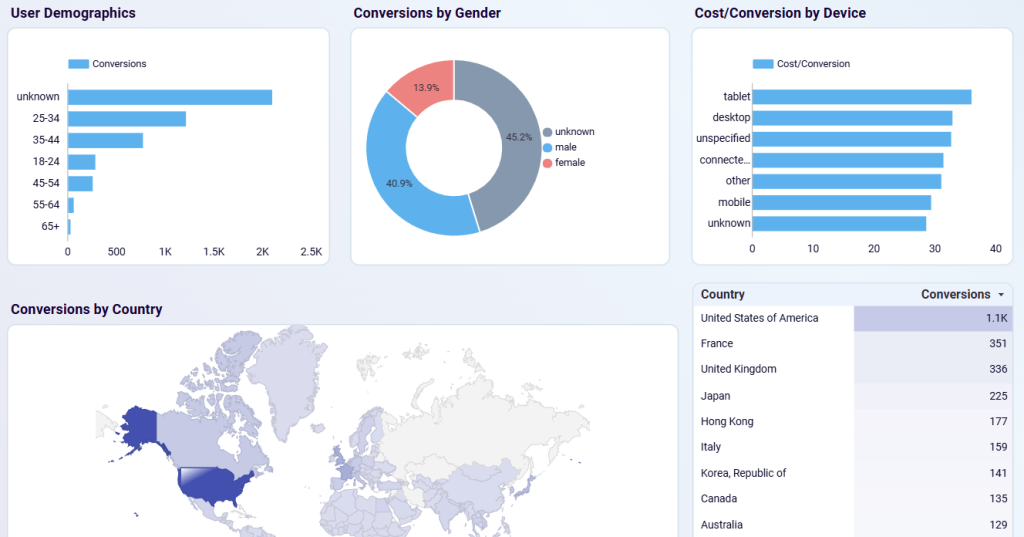
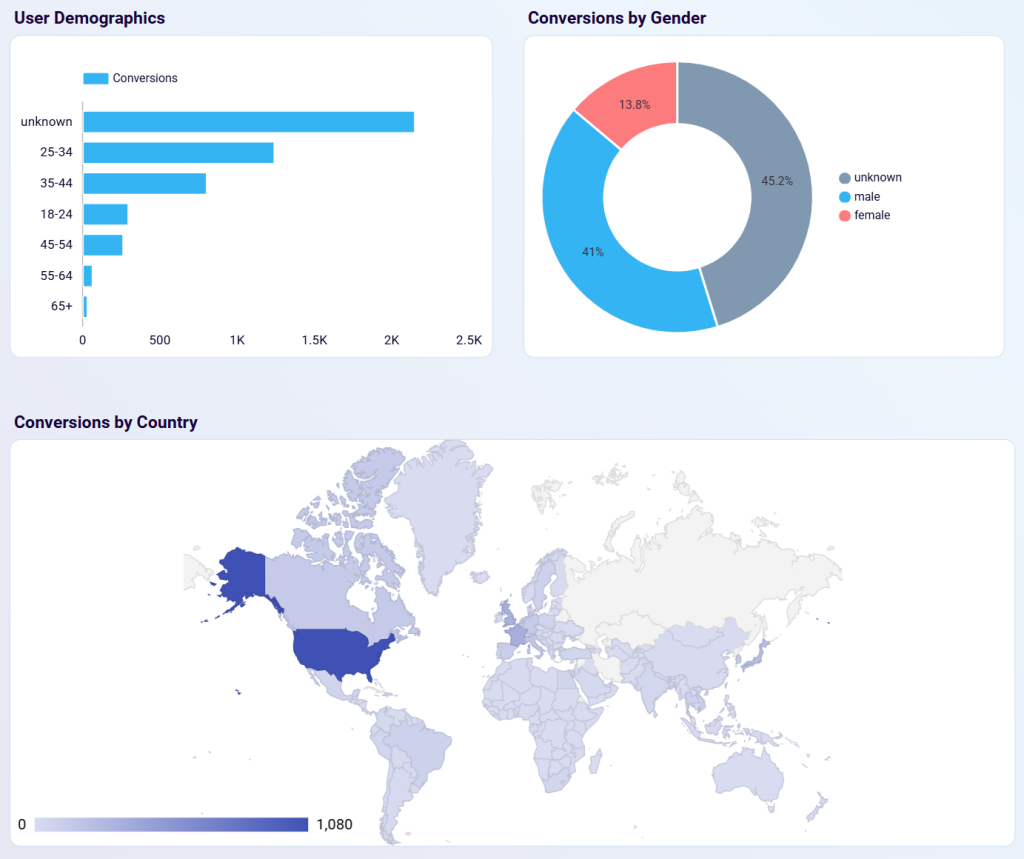
Demographic & Geographic Insights: Detailed breakdowns show performance across age groups, gender segments, and international markets. The dashboard includes device-specific cost per conversion analysis and geographic heat mapping, providing insights into your global audience and identifying key regions for engagement optimization.
Conversion Action Tracking: Monitor specific business outcomes like purchases, form submissions, and activations with comprehensive monthly trend analysis. The conversion tracking includes detailed campaign breakdowns with monthly performance data, helping you focus optimization efforts on the most valuable business outcomes.
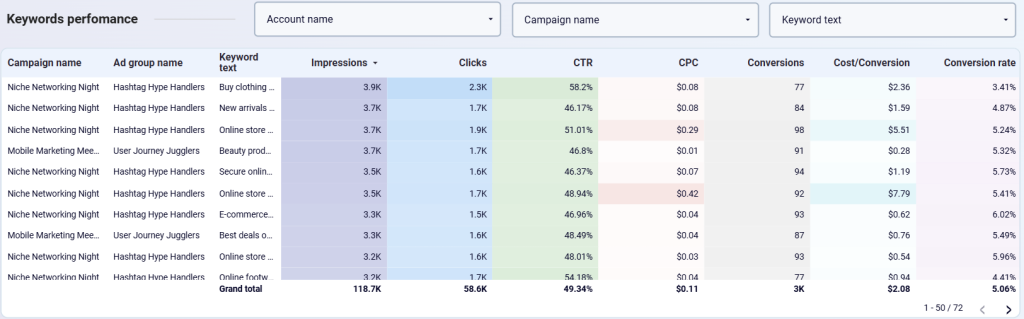
Keyword Performance Deep-Dive: Granular keyword analysis includes performance metrics, search impression data, and optimization recommendations. The keywords performance table provides insights into specific search terms, ad group performance, and keyword-level conversion data for comprehensive campaign optimization.
Monthly Trend Visualization: Track KPIs like spend, impressions, clicks, and conversions over time to identify seasonal patterns, performance fluctuations, and growth opportunities. The trend charts reveal spending patterns and their correlation with reach and engagement metrics across different time periods.
The dashboard also includes detailed campaign comparison tables and conversion tracking across different demographics, devices, and geographic regions, making it particularly valuable for agencies managing multiple client accounts or businesses running complex campaign portfolios.
How to use this dashboard?
Setup follows the same streamlined process as other Coupler.io templates. Connect your Google Ads account through the built-in connector, and the dashboard automatically populates with your monthly performance data. The Readme tab provides step-by-step instructions for configuration, customization options, and guidance on setting up automatic data refreshes to keep your monthly metrics current.
Pricing
This Google Ads monthly performance dashboard is available for free.
#3. Paid Ads multi-channel template by Coupler.io
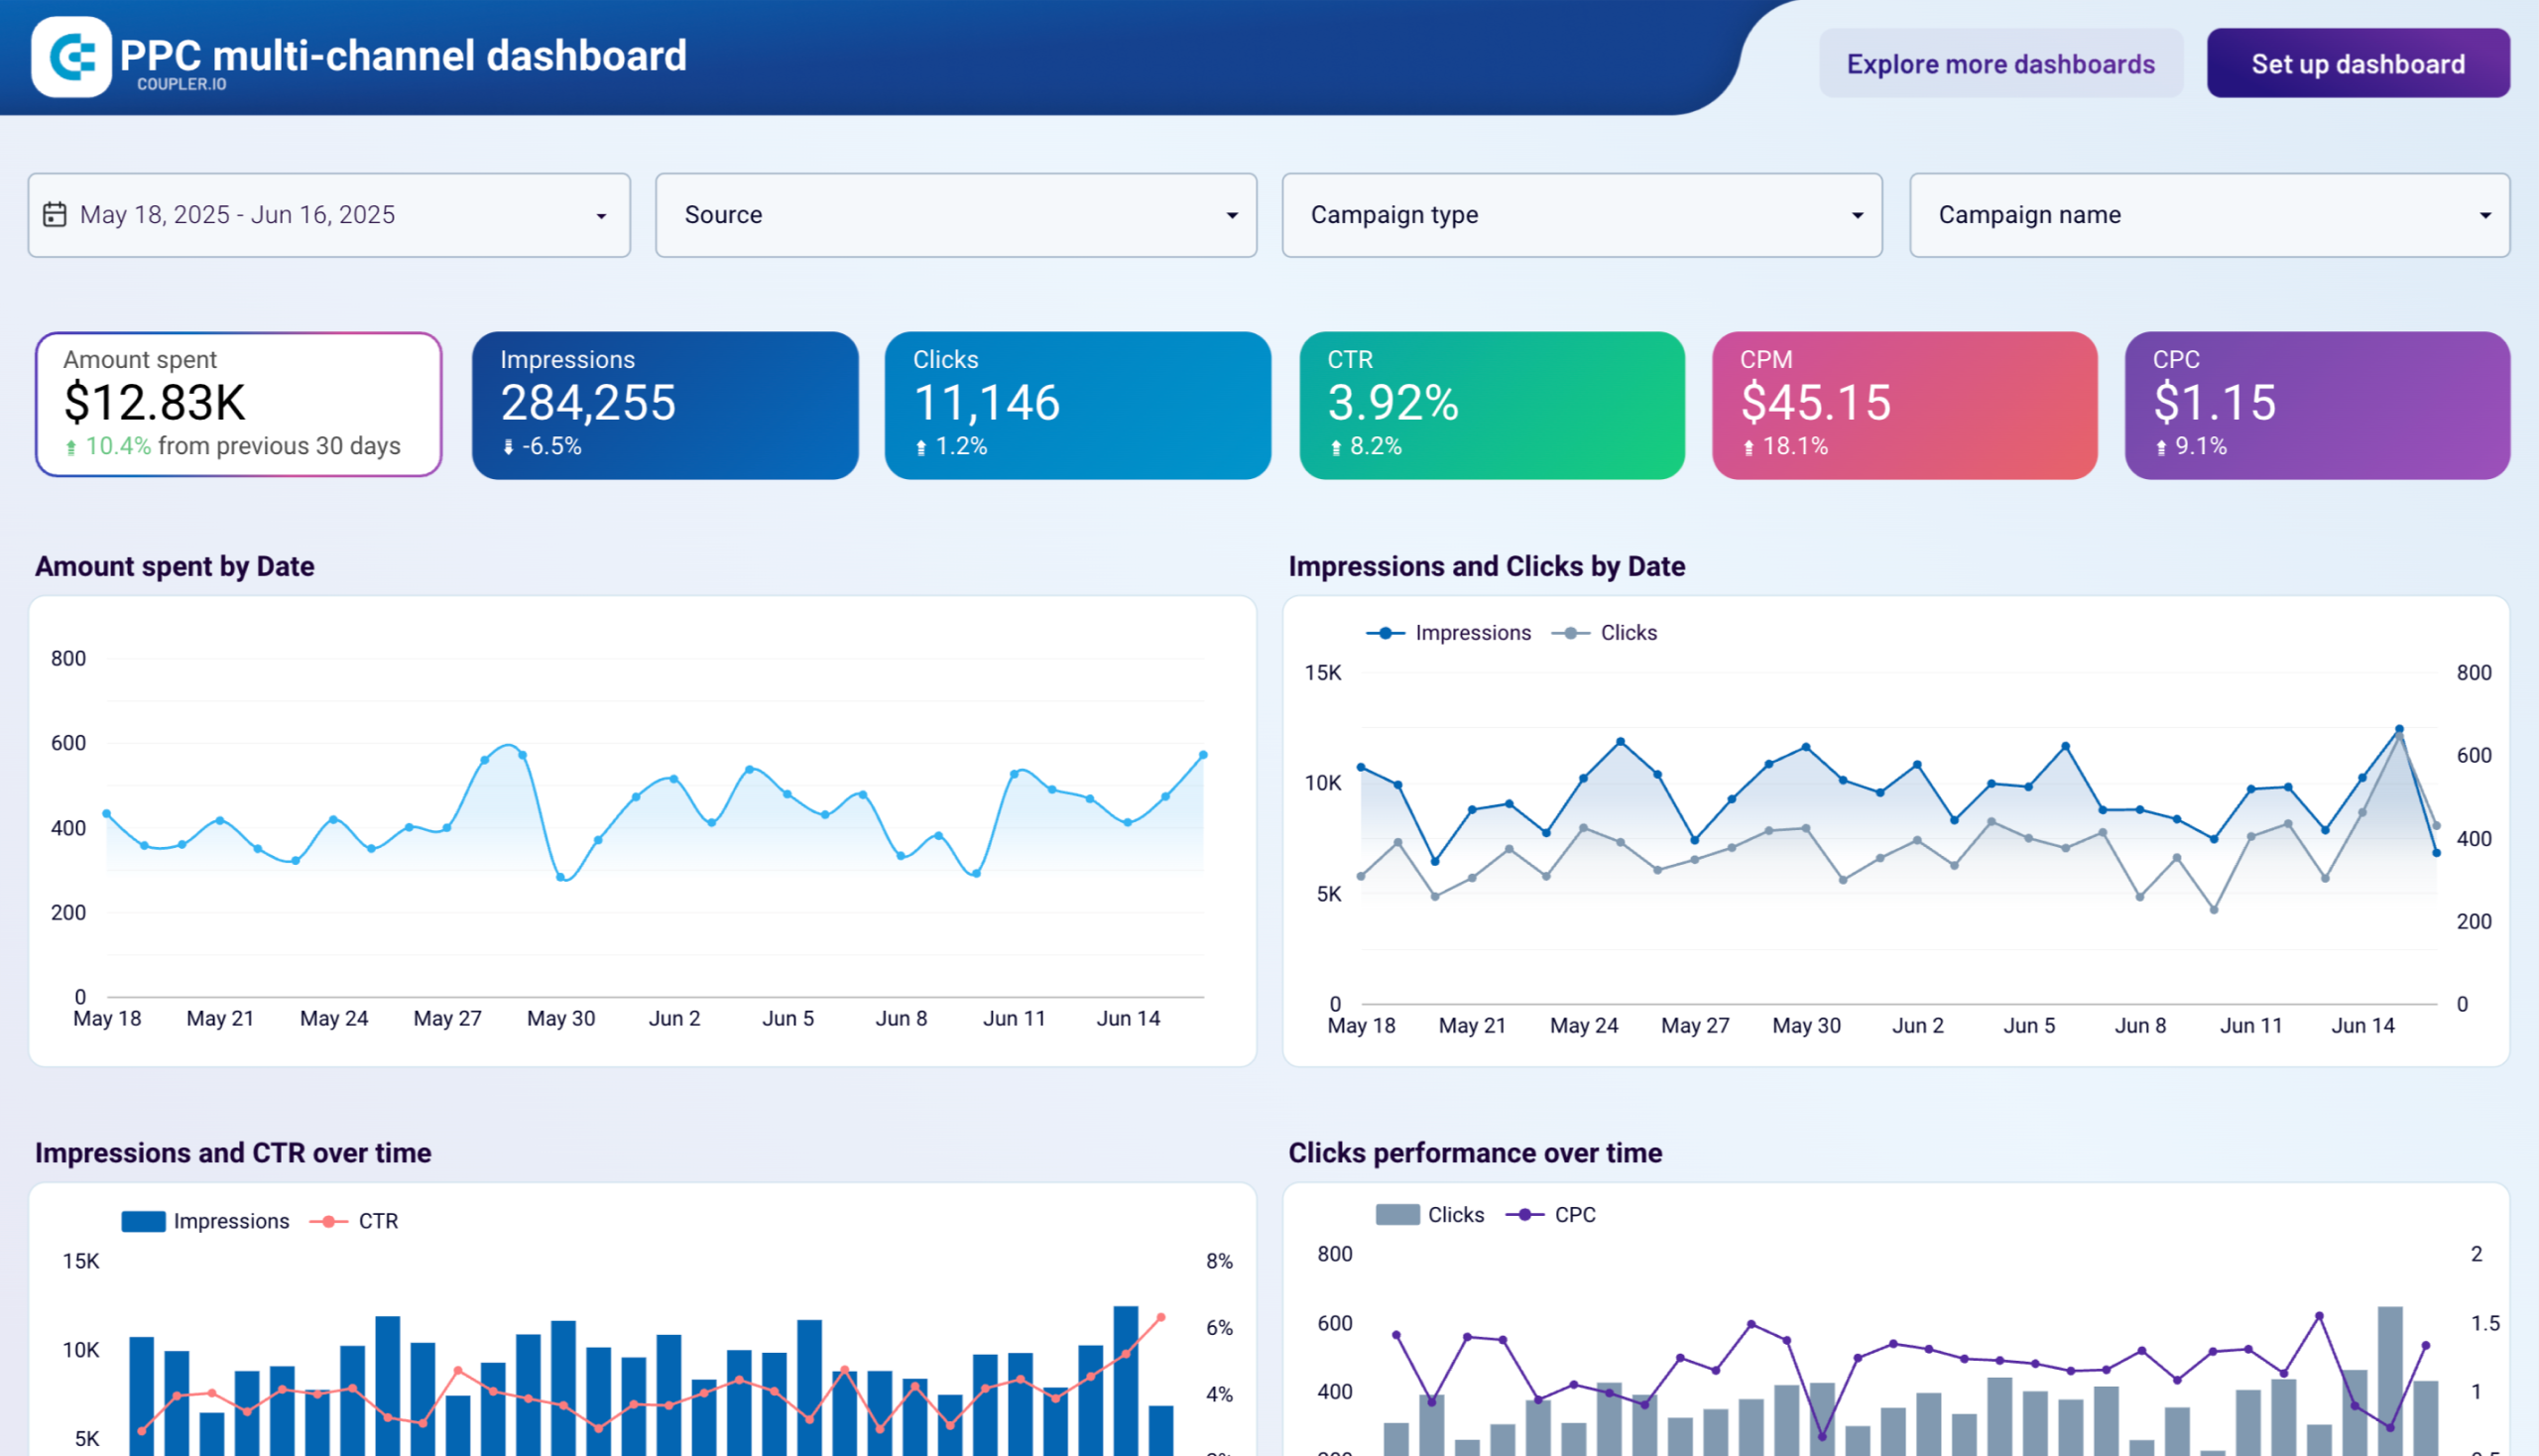
Most PPC experts run ad campaigns not only on Google Ads but also on other ad platforms such as Facebook Ads, LinkedIn Ads, etc. With this in mind, Coupler.io offers another PPC report template that is meant for analyzing the performance of multiple PPC platforms. Currently, it supports Google Ads, Facebook Ads, LinkedIn Ads, Instagram Ads, and TikTok Ads. You can use it to visualize your advertising data by connecting only your Google Ads account and populating the dashboard.
Template metrics description
The template displays all the key metrics including clicks, impressions, CTR, CPM, CPC, and amount spent. However, the main value here is that you can filter this data by ad platform. For example, you can only see the performance of ad campaigns run in Google Ads or Google Ads + LinkedIn Ads, and so on. This dashboard allows you to understand the efficiency of each channel by different metrics and optimize advertising efforts, and budget.
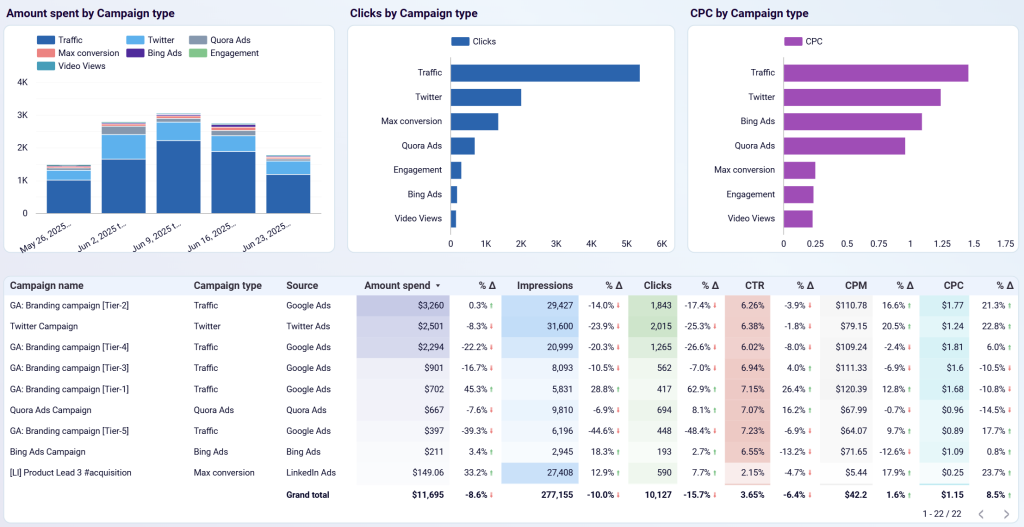
The PPC dashboard template has several charts to show a split of different metrics by campaign type, channel, and date. At the bottom of the report, you have a table with a drill down into every campaign.
How to use this dashboard?
The template has a page called Setup Guide containing instructions on how to start using this dashboard and load data to it. Since the report has built-in connectors by Coupler.io, you won’t have any trouble connecting to your ad platforms. It only takes up to 5 minutes to connect to all the available sources and get your data loaded to the dashboard. If you only need to use the template for Google Ads and, let’s say, Facebook Ads, the setup will be completed even faster.
Pricing
This paid ads dashboard is a free template.
#4. Google Ads keywords performance template by Coupler.io
If you’re running Google Ads campaigns, understanding which keywords are driving the most clicks and conversions is crucial for optimizing your strategy. This template dives deep into your keyword performance, helping you identify top performers, reduce wasted spend, and make data-driven decisions to boost your ROI.
Google Ads keywords performance dashboard
 Preview dashboard
Google Ads keywords performance dashboard
Preview dashboardTemplate metrics description
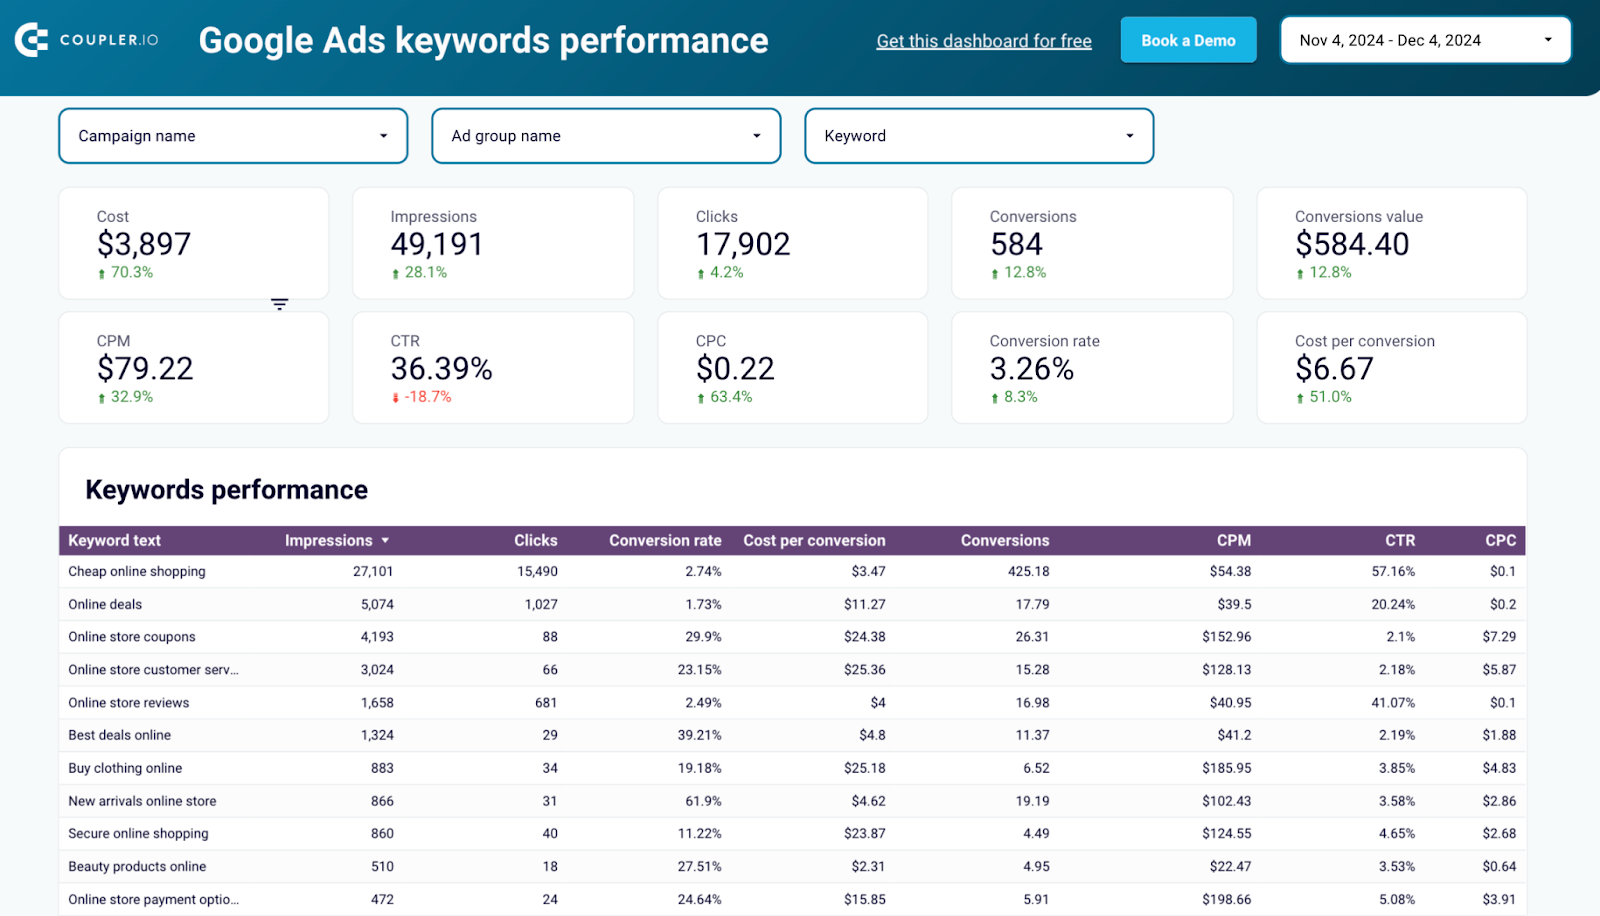
The template gives you a comprehensive view of essential metrics, including:
- Cost, Impressions, Clicks, and Conversions: Understand the overall performance of your campaigns.
- Conversion Rate & Cost per Conversion: Analyze efficiency and cost-effectiveness.
- CTR, CPC, and CPM: Gain insights about ad engagement and spend distribution.
One standout feature is the keywords performance table, where you can see metrics broken down by each keyword, including conversion rate, cost per conversion, CTR, and CPM. Additionally, charts such as Top 5 Keywords by Clicks and Search Impression Share visualize which keywords are contributing the most to your campaign success.
With performance trends for impressions, clicks, conversions, and CPC over time, you can pinpoint what works and adjust your bidding strategy accordingly.
How to use this dashboard?
Setting up this dashboard is quick and straightforward. Simply connect your Google Ads account using Coupler.io’s built-in connector. Within minutes, you’ll have a complete visualization of your keyword performance. Plus, you can set up an automatic refresh schedule to keep your data up-to-date, with updates as frequent as every 15 minutes.
Pricing
This Google Ads Keywords Performance template is available for free.
#5. Google Ads vs Meta Ads template by Coupler.io
If Google Ads and Meta Ads take the most share in your PPC marketing efforts, this dashboard template will help you delve into more details. It compares the performance of ad campaigns across these two major platforms and allows you to identify which is driving better results. Whether you’re optimizing for cost efficiency or looking to maximize clicks and impressions, this dashboard simplifies decision-making with side-by-side data analysis.
Google Ads vs Meta Ads dashboard
 Preview dashboard
Google Ads vs Meta Ads dashboard
Preview dashboardTemplate metrics description
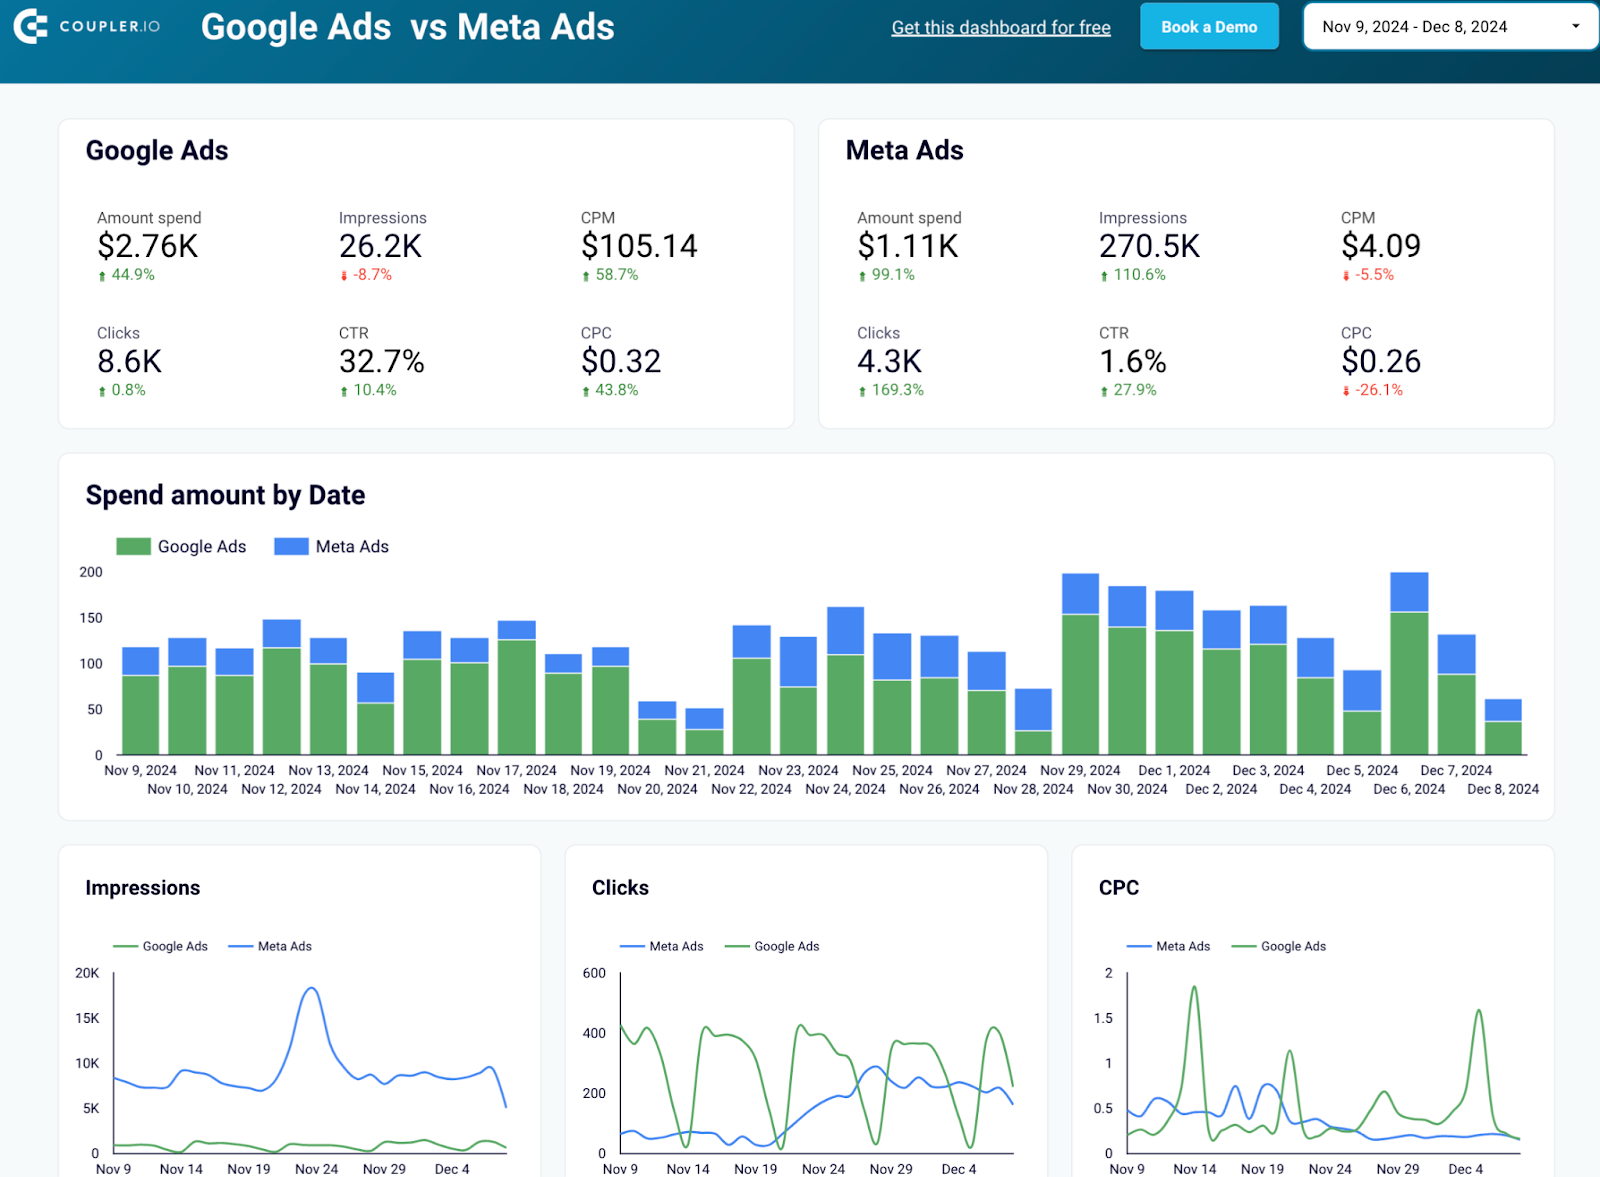
The template provides a quick snapshot of essential metrics, including:
- Google Ads: Amount spent, impressions, clicks, CPM, CTR, CPC.
- Meta Ads: Amount spent, impressions, clicks, CPM, CTR, CPC.
What sets this dashboard apart is its ability to filter metrics by campaign names, allowing you to zoom in on specific campaigns and understand their performance. With clear charts showcasing impressions, clicks, and CPC trends over time, you’ll easily identify which platform delivers better ROI for each campaign type.
At the bottom, you’ll find a detailed breakdown of individual campaign performance for both Google Ads and Meta Ads. This section includes key metrics like amount spent, impressions, CPM, CTR, and CPC, giving you a granular view of your advertising efforts.
How to use this dashboard?
To set up this template, connect your Google Ads and Meta Ads accounts with the Coupler.io in-built Looker Studio connector in less than 5 minutes. After connecting your data sources, you’ll instantly see your ad performance data across both platforms visualized on the dashboard.
Pricing
Google Ads vs Meta Ads dashboard is a free template.
#6. Quality score analytics template by Coupler.io
In Google Ads, quality score is key for running efficient and cost-effective campaigns. It is used to measure the relevance and performance of your keywords, ads, and landing pages. A higher quality score lowers your cost-per-click (CPC), improves ad placement, and enhances engagement, making your campaigns more impactful. This template provides a detailed breakdown of your quality score and its components, such as ad relevance, landing page experience, and expected CTR, helping you identify areas to optimize for maximum ROI.
Quality score analytics dashboard for Google Ads
 Preview dashboard
Quality score analytics dashboard for Google Ads
Preview dashboardTemplate metrics description
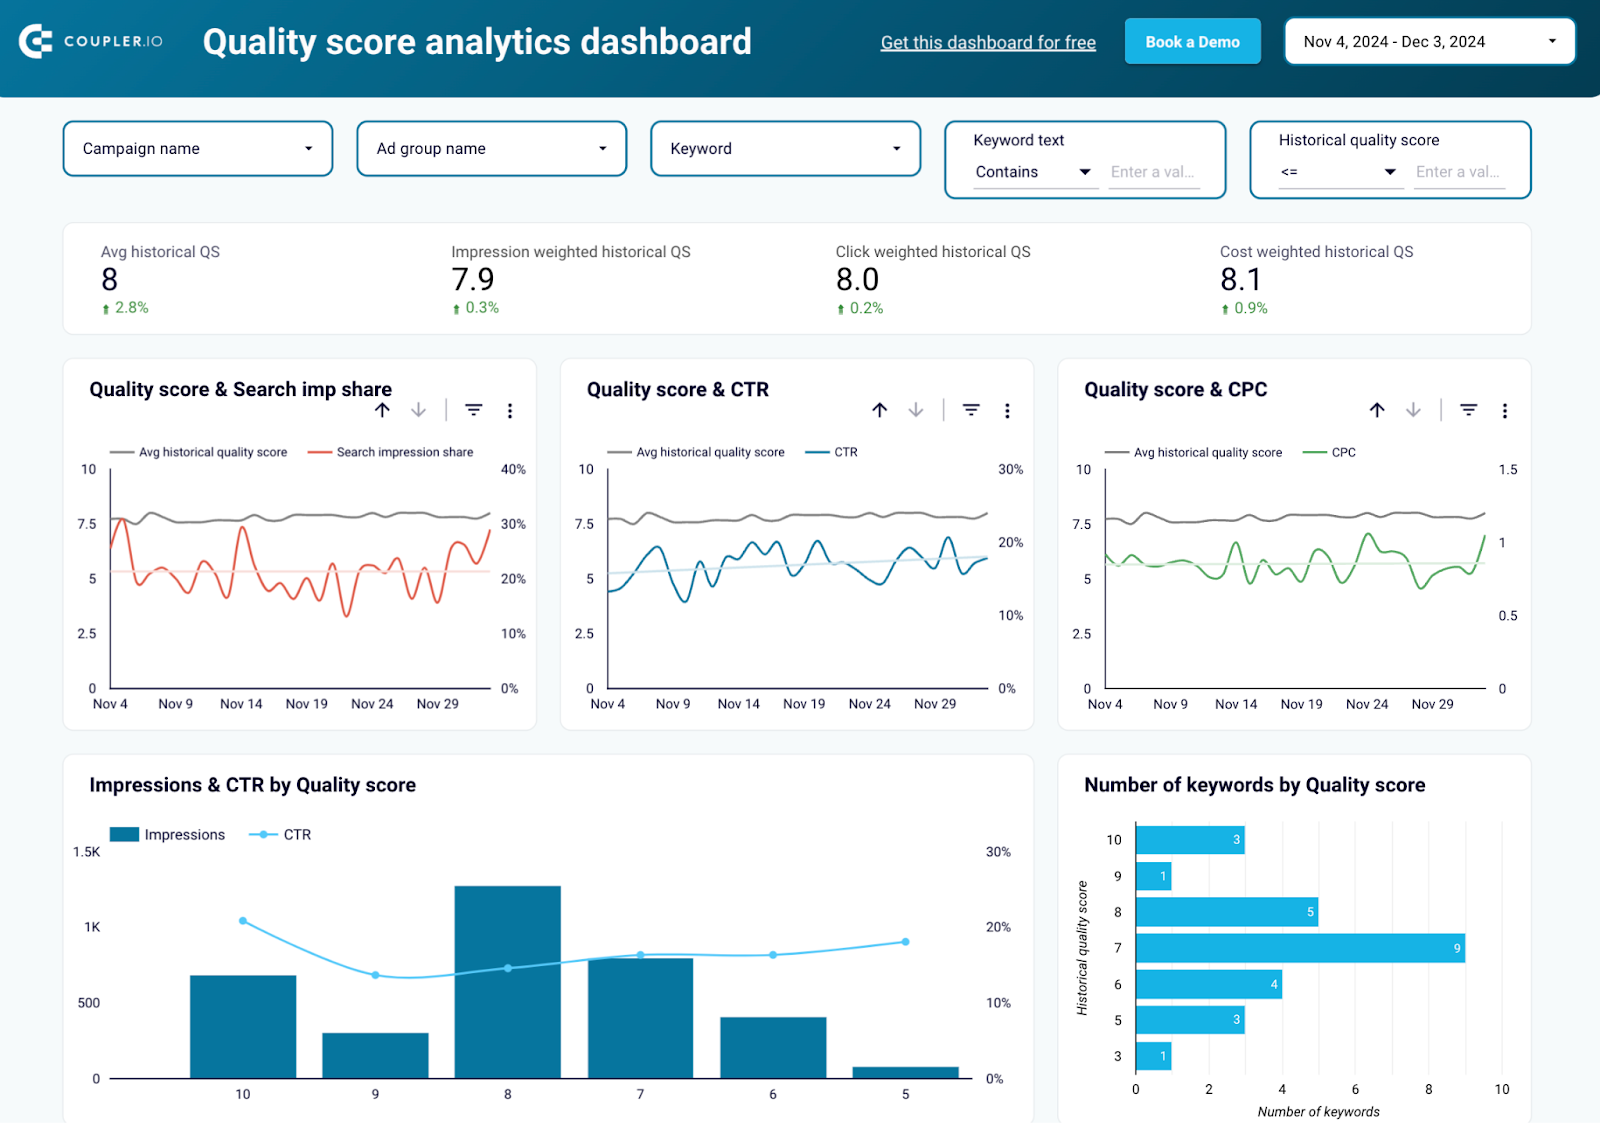
The template provides a detailed breakdown of metrics, including:
- Quality Score Metrics: Impression-weighted, click-weighted, and cost-weighted quality scores for a comprehensive evaluation of your account performance.
- Historical Quality Score Components: Ad relevance, landing page experience, and predicted CTR, categorized as above average, average, or below average.
- Performance Trends: Charts linking quality scores to impressions, CTR, CPC, and search impression share, helping you uncover how scores affect costs and engagement.
This dashboard also features a campaign and ad group performance table, giving you granular insights into each keyword’s quality score, conversion rate, and cost per conversion. It allows you to prioritize keywords for optimization and identify those delivering maximum value.
How to use this dashboard?
Set up the dashboard by connecting your Google Ads account via Coupler.io’s built-in connector. The setup process takes only a few minutes, and you can enable automatic data refreshes as frequently as every 15 minutes to keep your quality score metrics updated.
Pricing
This Quality Score Analytics template is completely free to use.
#7. Google Ads creatives template by Coupler.io
Creative assets play a vital role in the success of your Google Ads campaigns. This template provides detailed insights into each creative’s performance, helping you identify which ad formats, types, and assets drive the best results. With this dashboard, you can easily analyze impressions, clicks, conversions, and costs to optimize your creative strategy and maximize ROI.
Template metrics description
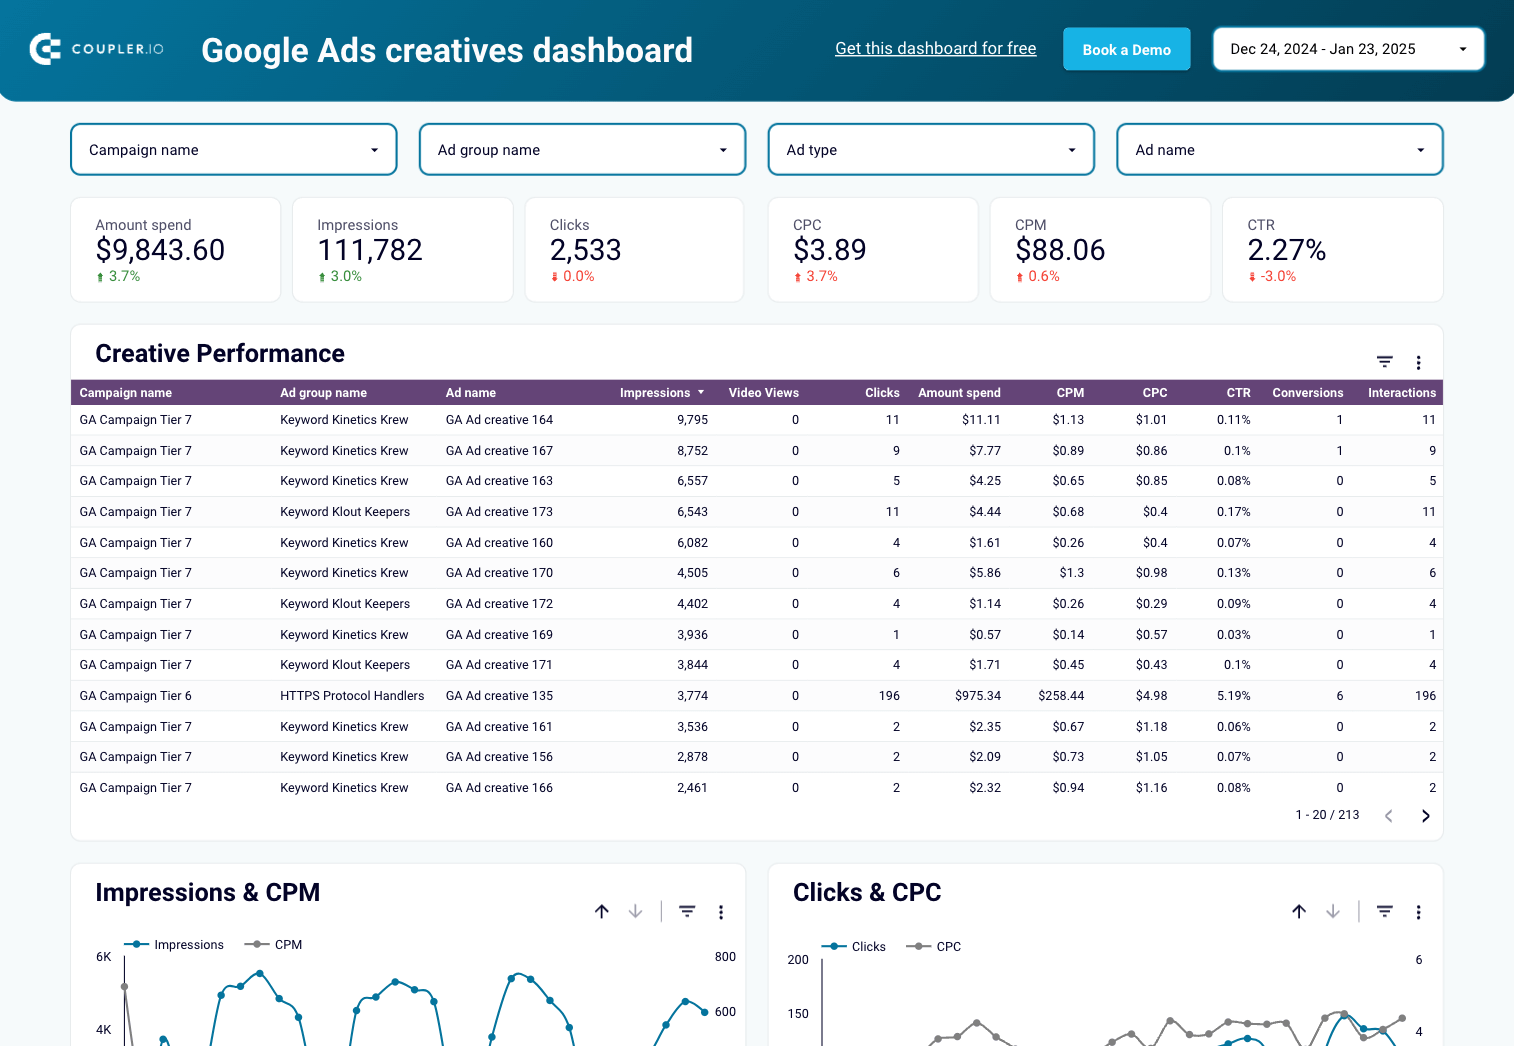
The dashboard offers a comprehensive analysis of creative performance, including:
- Creative Metrics: Impressions, clicks, CPC, CPM, CTR, video views, conversions, and interactions, broken down by campaign, ad group, and ad name.
- Spend Dynamics: Visualize your daily spending trends to track efficiency.
- Creative Comparisons: Identify the top-performing creatives based on conversions, ensuring you allocate your budget wisely.
- Ad Type Analysis: Understand how different ad types, such as responsive display, image ads, and video ads, contribute to impressions and engagement.
Key charts like Impressions & CPM, Clicks & CPC, and Top Creatives by Conversions provide actionable insights into the areas where the creative assets show the highest impact.
How to use this dashboard?
Simply connect your Google Ads account using Coupler.io’s built-in connector, and your dashboard will be ready in just minutes. Set up automatic refreshes to update your creative performance data every 15 minutes, ensuring you’re always working with the latest insights.
Pricing
The Google Ads Creatives Dashboard is free to use.
#8. Google Ads leads dashboard template by Coupler.io
Do you run lead generation campaigns on Google Ads? This dashboard helps you analyze the success of those campaigns and identify strategies attracting valuable prospects. It visualizes the funnel, provides filters and scorecards for quick analysis, and breaks down lead performance so you can see which campaigns deliver quality leads at the right cost.
Template metrics description
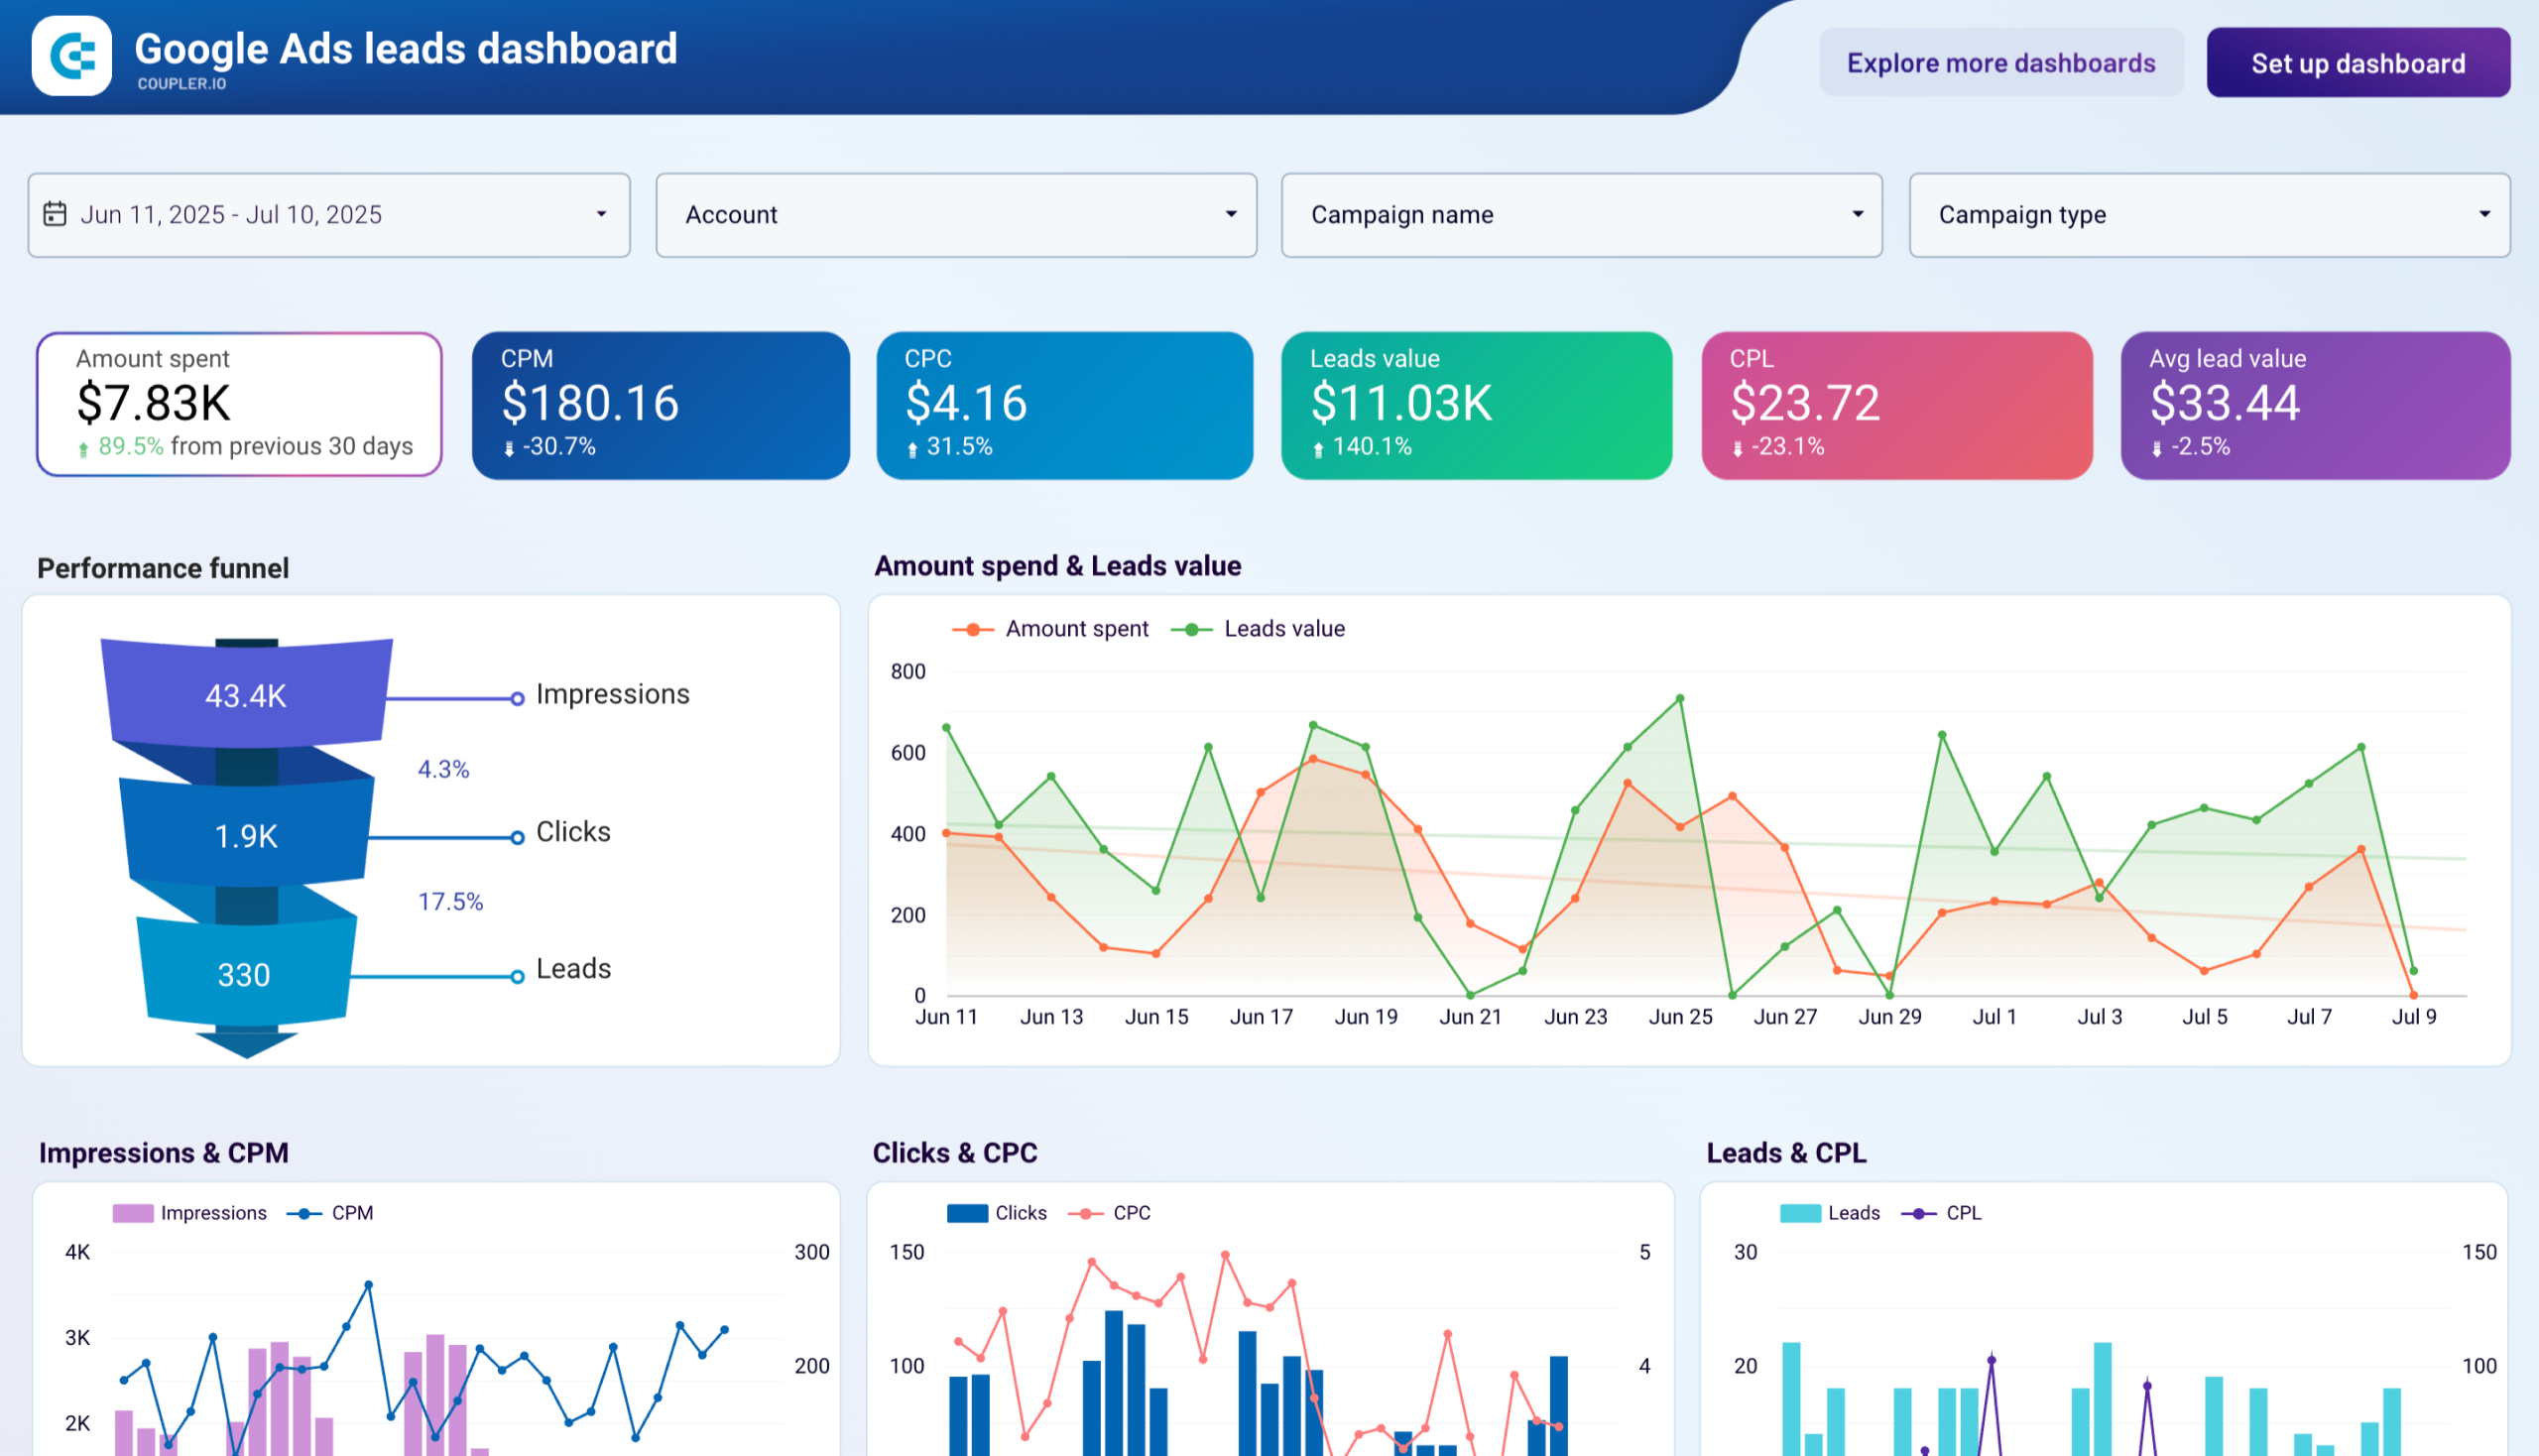
The dashboard offers a comprehensive analysis of lead generation performance, including:
- Lead Generation KPIs: Cost per lead, lead value, average lead worth, and total leads generated for a complete overview of your campaign efficiency.
- Conversion Funnel Analysis: Track the complete journey from impressions to leads, showing conversion rates at each stage to identify optimization opportunities.
- Performance Correlation: Charts linking ad spend to lead value over time, helping you understand which investment patterns generate the highest quality leads.
This dashboard also features a campaign performance breakdown table, giving you detailed insights into each campaign’s lead gen metrics, including CPL, lead value, and conversion rates. It helps you prioritize budget allocation and identify campaigns with high lead value.
How to use this dashboard?
Sync data from your Google Ads account with Coupler.io’s dedicated connector. Once the data flow is set up, your lead generation data will automatically populate the dashboard. You can establish automatic updates to refresh your data daily, weekly, monthly, or as often as every 15 minutes – ensuring you always have the latest information at your fingertips.
Pricing
The Google Ads leads dashboard is free to use.
#9. Google Ads network performance template by Coupler.io
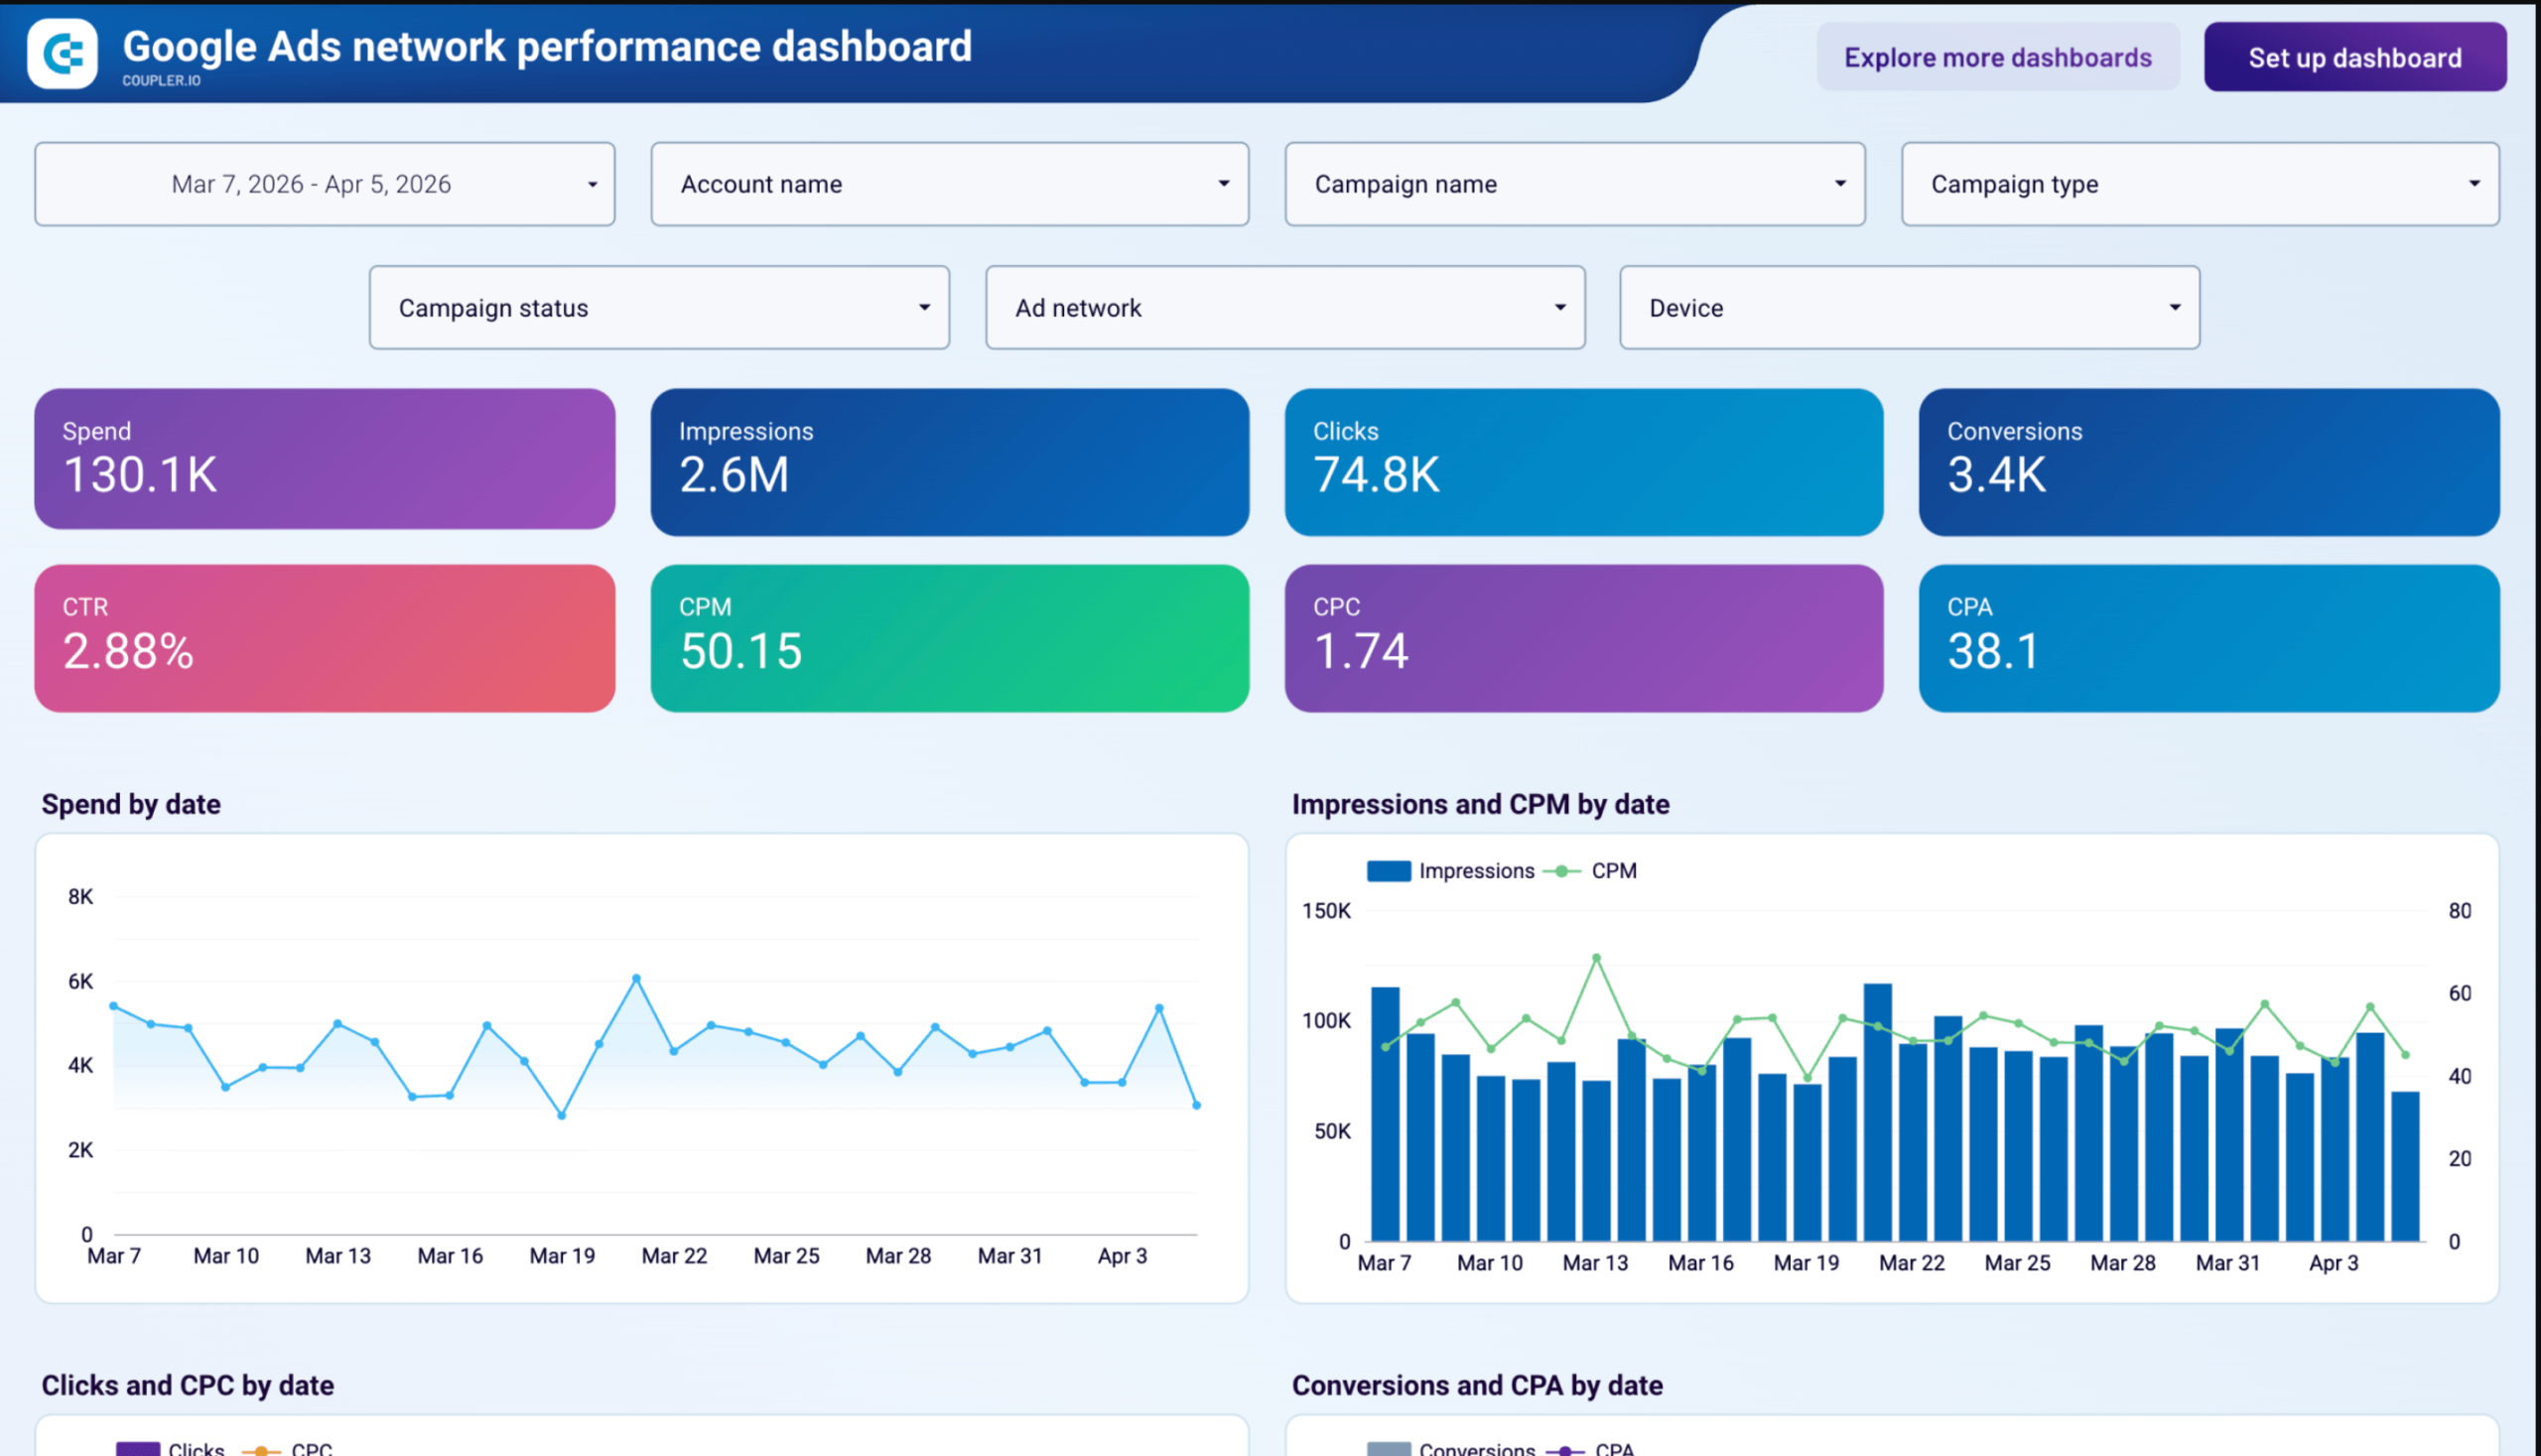
Most Google Ads templates in Data Studio focus on campaign-level totals. The Google Ads network performance dashboard goes further: it splits results across ad networks, devices, and geographies (five pages in total).
Google Ads network performance dashboard
 Preview dashboard
Google Ads network performance dashboard
Preview dashboardTemplate metrics description
The Overview page shows daily spend, impressions, and CPM, clicks and CPC, and conversions and CPA on separate trend charts. Below that, a campaign performance table lists every campaign with all costs and conversion metrics in one view. Next go:
- Dedicated pages performance breakdown by device (desktop, mobile, tablet) and ad network (Search, Content, YouTube Watch, YouTube Search, Search Partners).
- An Impression share page shows each campaign’s impression share, search top impression share, and where you’re losing visibility (budget or rank).
- The Conversions breakdown lets you filter by conversion name to isolate purchases, form submissions, or phone calls at the campaign level.
- The Video performance page reports spend, views, and quartile completion rates (25%, 50%, 75%, 100%) for each video asset.
- The PMax asset breakdown lists every headline, image, logo, video, and call to action in your Performance Max campaigns along with Google’s performance rating.
How to use this dashboard?
Connect your Google Ads account through the Coupler.io connector built into the template. Follow the instructions in the Setup guide to set up automatic data refreshes on your preferred schedule.
Pricing
This Google Ads network performance template is available for free.
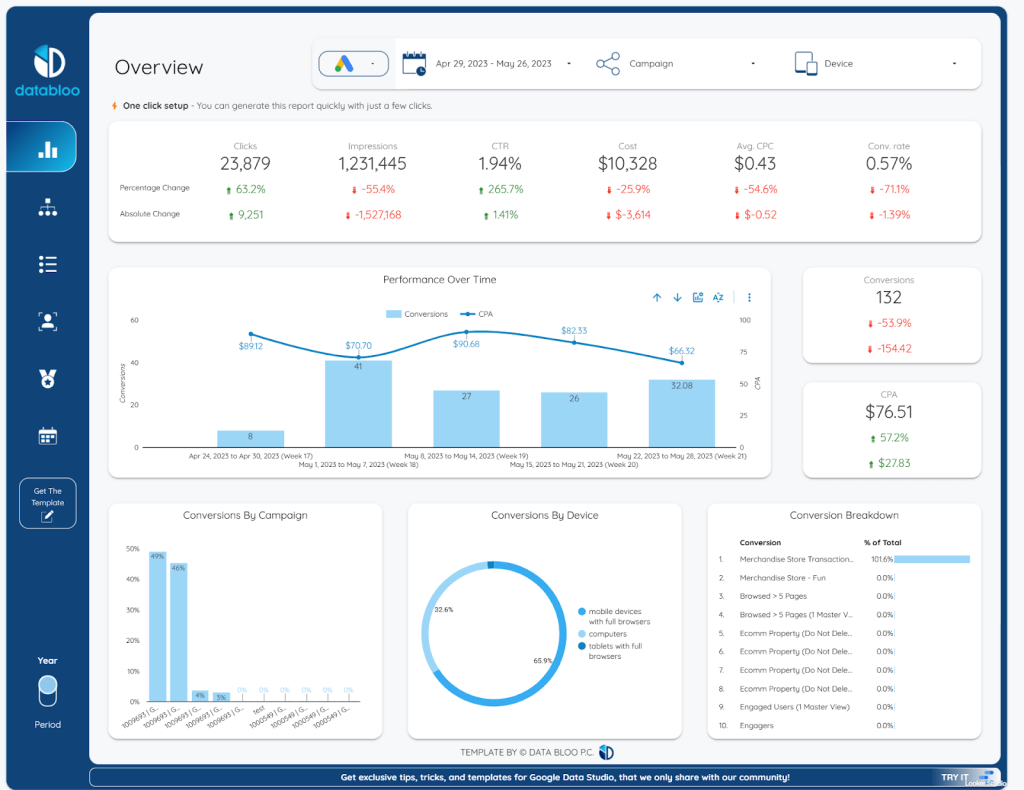
#10. Essential Google Ads template by Data Bloo
This Google Ads template is from Data Bloo – a company that specializes in Looker Studio (Google Data Studio) templates. They offer ready-to-use dashboards for Google Ads, Facebook Ads, Instagram, etc. You can use this comprehensive dashboard template to measure your overall Google Ads activity. It helps to explore campaign data and discover what to optimize in your advertising efforts.
Template metrics description
There are six pages on this Data Studio template. First, we have the Overview page that sums up the metrics of your campaigns. It shows the total clicks, impressions, CTR, CPA, conversions, cost, average CPC, and conversion rate. You can also check performance over time, conversion breakdown, and overall conversions by campaign and device.
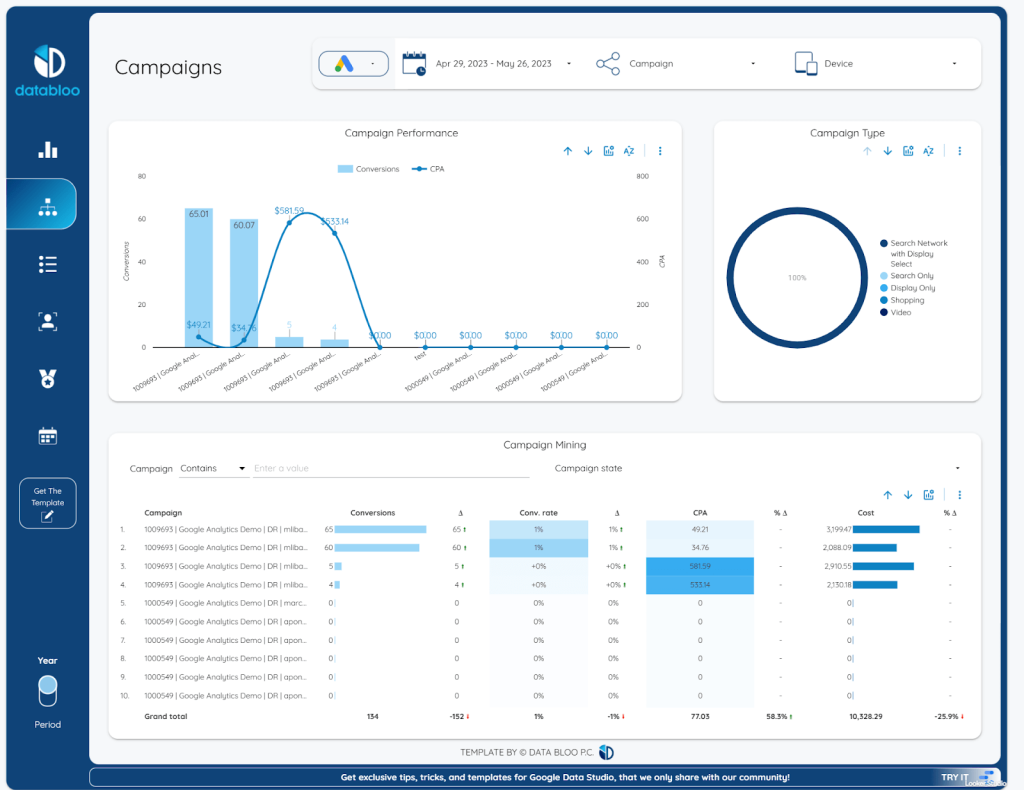
Next, the Campaigns page allows you to take a closer look at your Google Ads campaigns. You can use the charts to detect trends in campaign performance. The campaign mining table also shows the name, conversions, CPA, cost, and conversion rate of every campaign.
On other pages of this dashboard, you’ll find:
- The Keywords page allows you to explore the keyword match type, and keyword quality score, and also use the keyword mining section to measure the performance of each search keyword.
- The Audience page allows you to evaluate campaign performance by geolocation and audience type. You can also access the conversions, CPA, cost, and conv. rate by country or territory.
- The Competition page provides insights into competitor performance. You can analyze the competition trends and their specific metrics. The section for competition over time also shows how most of your competitors’ campaigns have performed overall over time.
- The Time page makes it convenient for you to measure performance over time. You can view the metrics, such as clicks, impressions, CTR, impression share, conversions, CPA, cost, average CPM, and CPC that have been aggregated for each month.
How to use this dashboard?
Data Bloo offers a one-click setup for generating Data Studio reports with their templates. After purchasing this template, you’ll copy your Google Ads ID and paste it to connect your account to the report. Next, you’ll click the edit button at the top-right corner of the page to enable access. Then, you’ll be able to apply a start and end date so you can begin your Google Ads data analytics and reporting.
Pricing
This Google Ads Looker Studio template from Data Bloo costs €109.
#11. Google Ads overview template by Data Bloo
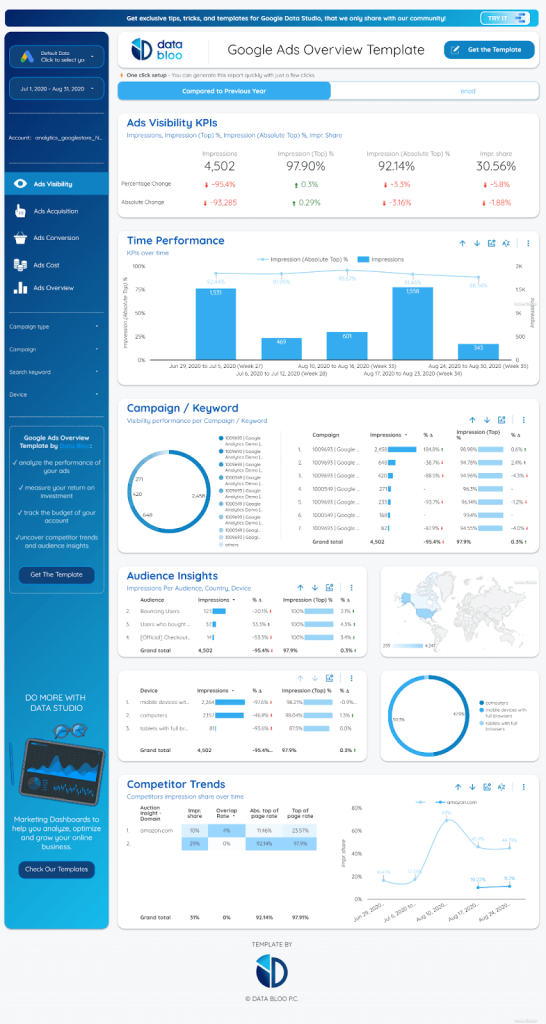
This is another Google Ads Looker Studio template from Data Bloo that showcases a complete overview of your ads and campaigns. You can use it to take a closer look at your ads and gain deeper insights on their visibility, conversion, acquisition, cost, as well as a general overview.
Template metrics description
This dashboard has five pages that are divided into a few sections. The Ads Visibility page helps to explore ads visibility KPIs, performance over time, campaign or keyword ads visibility, audience insights, and competitor trends using a variety of visualizations and metrics.
On other pages, you’ll find plenty of other metrics:
- The Ads Acquisition page displays ads acquisition KPIs, campaign or keyword performance, performance over time, as well as conversions per audience, age/gender, country, and device
- The Ads Conversion page allows you to explore ad conversion KPIs. You can also measure conversions over time, based on keywords, campaigns, or audiences.
- The Ads Cost page shows graphs about ads costs KPIs as well as performance over time, audience insights, and cost per campaign or keyword.
- The Ads Overview page can help you analyze Google ads performance over time, by campaign type or keyword, and also based on audience KPI data.
How to use this dashboard?
Once you purchase the dashboard, you’ll be asked to input your Google Ads ID to connect your account. This will enable you to access the template and get started with your analytics.
Pricing
This dashboard from Data Bloo costs €79.
#12. Google Ads single page template by Data Bloo
This Google Ads template combines otherwise separate sections or pages into one. It’s a single-page template that has been able to feature the most important digital marketing metrics so you can analyze and get quick insights from your Google Ads data without any hassle.
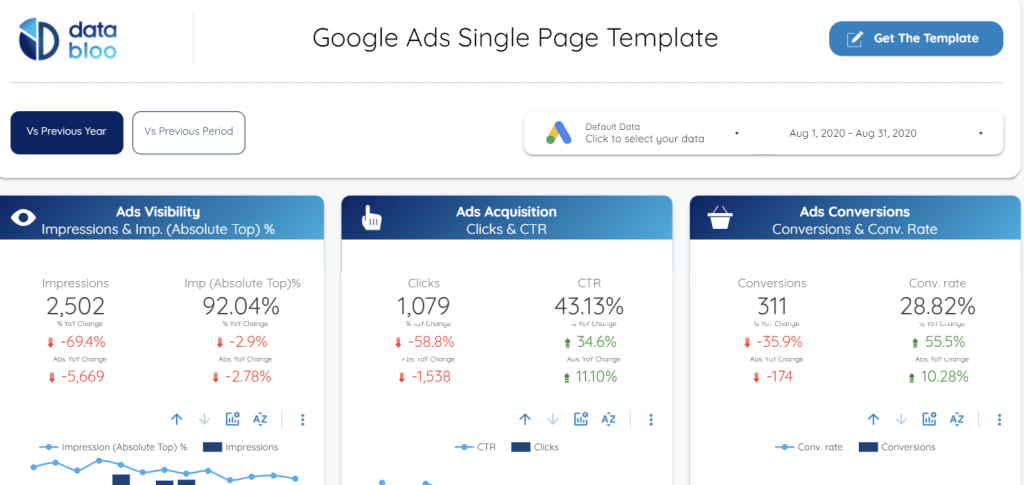
Template metrics description
With this dashboard, you can measure ads visibility, ads acquisition, ads conversions, and ads cost in one place. It also displays top campaigns as well as specific metrics for each campaign. You can also explore the conversions and CPA for each audience, device, and geography.
How to use this dashboard?
The setup for this dashboard is exactly like the other dashboards from Data Bloo. You’ll purchase the template, connect your Google Ads ID, and continue to map your data to specific fields.
Pricing
You can get this Google Ads dashboard from Data Bloo for €39.
#13. Google Ads overview report by Avian.io
This Google Ads Report was created by Avian.io – a data automation platform that offers a few Google Looker Studio dashboards. It’s mainly focused on helping you analyze conversions and cost per conversions in your Google Ads data but you can use it to measure campaign performance.
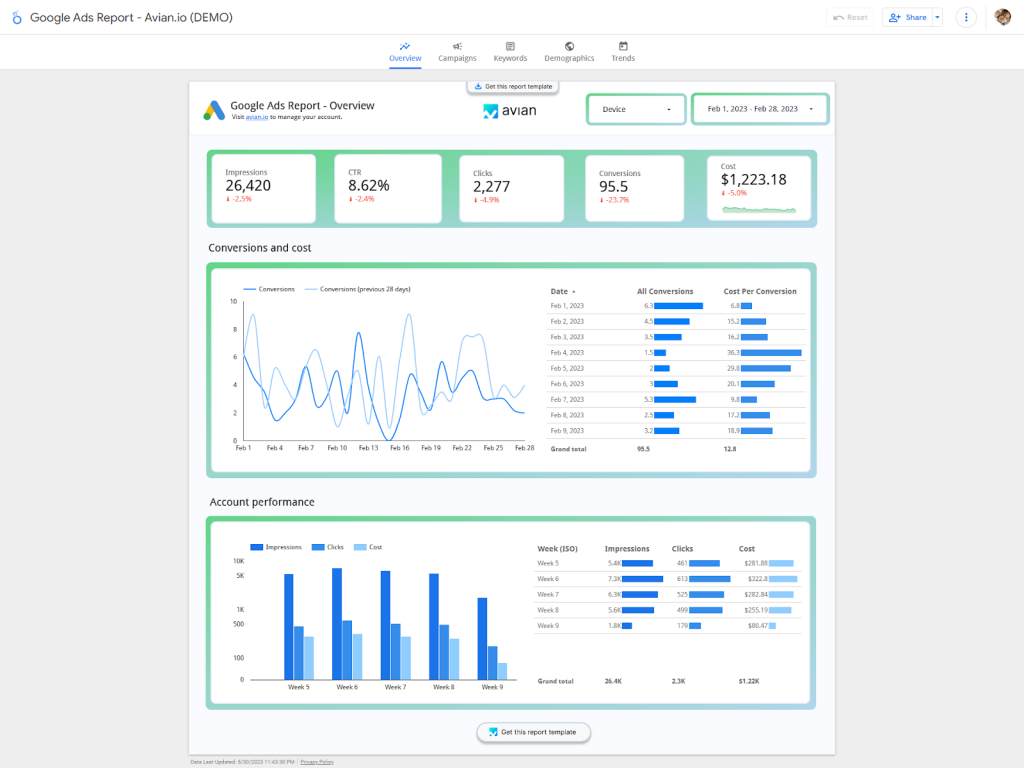
Template metrics description
There are five pages on this report template. The Overview page displays key metrics such as impressions, CTR, clicks, cost, and conversions. It also uses charts to show all conversions and cost per conversions for each day of the month. You can view account performance for each week.
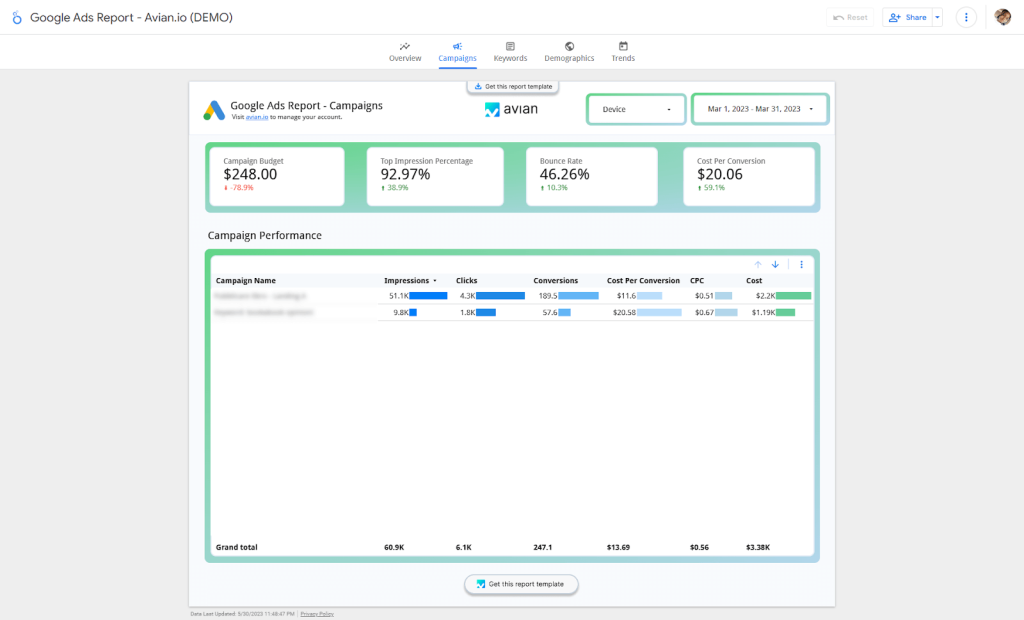
The Campaigns page allows you to analyze campaign performance using metrics like campaign budget, impressions, bounce rate, cost per conversion, conversions, cost etc.
On other pages of this dashboard you’ll find:
- The keywords page is great for understanding keyword performance. The metrics include: impressions, clicks, conversions, CPC, cost, and cost per conversion.
- The Demographics page is meant to help measure performance for each age group, gender and country using a few metrics like cost, conversions, clicks, and impressions.
- The Trends page shows performance trends over time and also gives the total number of clicks, cost per conversion, impressions, and conversions for each month.
How to use this dashboard?
When you click on the Get this report template button on the dashboard, you’ll be redirected to the Avian connector page for Google Ads in Looker Studio. After setting up your source, you should be able to connect your data to the dashboard.
Pricing
This Google Ads Report Template is free to access, but you need a subscription to connect data.
#14. Google Ads campaign performance dashboard by Looker Studio
This is a Google Ads dashboard offered by the Looker Studio team. You can use it to track campaign performance and also use drill-downs to display specific advertising data.
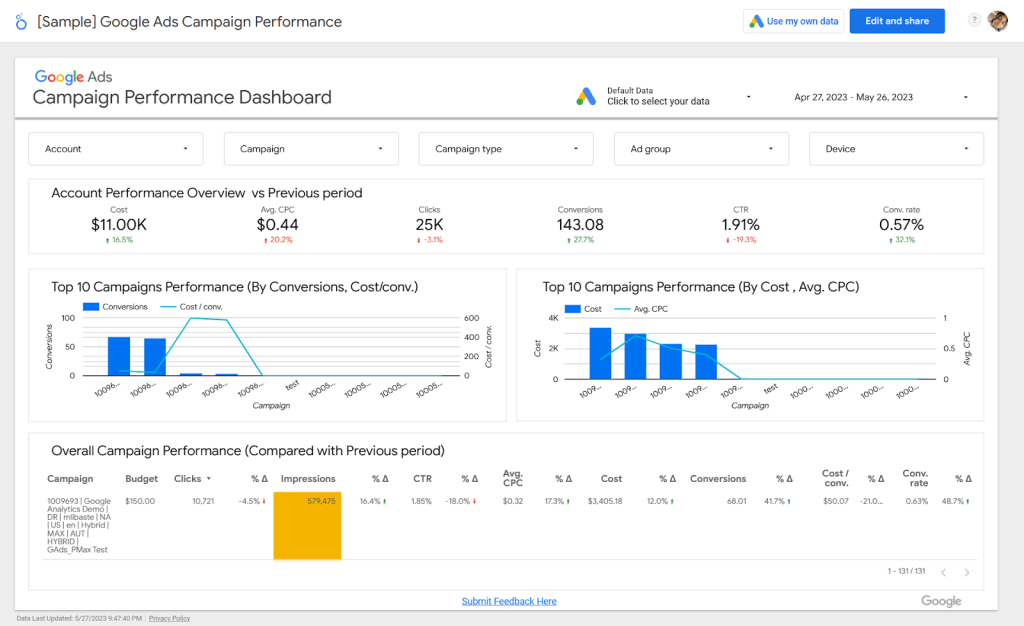
Template metrics description
This Google Data Studio template uses scorecards, column charts, and tables to help you compare the account performance overview with the previous period using metrics like cost, average CPC, clicks, CTR, conversions, and conversion rate. You can also analyze top 10 campaign performance, as well as overall campaign performance.
How to use this dashboard?
The Use my own data button on the top-right corner of the dashboard allows you to connect your Google Ads account. Then, you’ll be able to edit and share your reports.
Pricing
This template from Looker Studio is available for free.
#15. Google Ad group performance dashboard by Looker Studio
This is another single-page Google Ads template from Looker Studio that you can use to monitor and gain insights into ad group performance for different advertising periods.
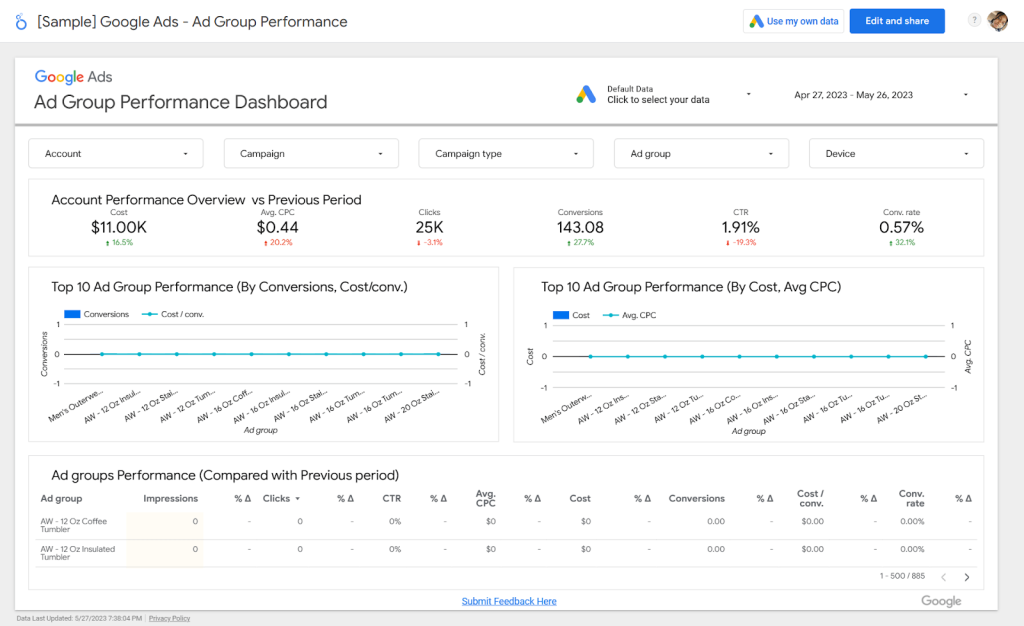
Template metrics description
You can compare account performance overview with the previous period using metrics like clicks, cost, CTR, average CPC, conversion rate, and conversions. There are also charts for the top 10 ad group performance and ad group performance compared with previous periods.
How to use this dashboard?
Click the Use my own data button on the dashboard to connect your Google Ads account.
Pricing
It’s free.
#16. Google Ads monitoring report by Two-Minute Reports
As the name suggests, this Looker Studio report template can be used to monitor your ads performance in Looker Studio. It’s a one-page template from Two Minute Reports – a Looker Studio connector.
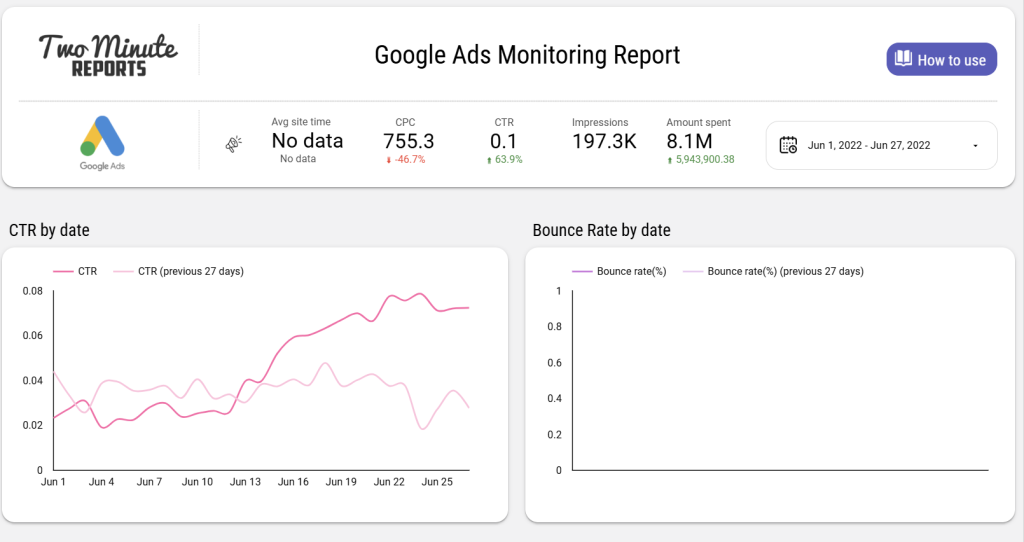
Template metrics description
This dashboard contains major KPIs, such as CPC, CTR, impressions, amount spent, and average site time. There are also sections for CTR by date, bounce rate by date, average pageviews by date, CPC by date, impressions by country and device, and campaign overview. At the time of writing, there seemed to be some issues with the underlying data, as you can see below, but the template should work just fine once you connect your data.
How to use this dashboard?
You need to create a new data source using the Two Minutes Reports connector in Looker Studio. Then, you’ll make a copy of the Looker Studio report and connect the template to the new data source.
Pricing
This Google Ads dashboard is free to access, but you need a subscription to connect your data.
#17. Google Ads overview report by Two Minute Reports
This dashboard from Two Minute Reports helps to display an overview of your Google Ads performance in Looker Studio. It’s perfect for quick analytics and reporting.
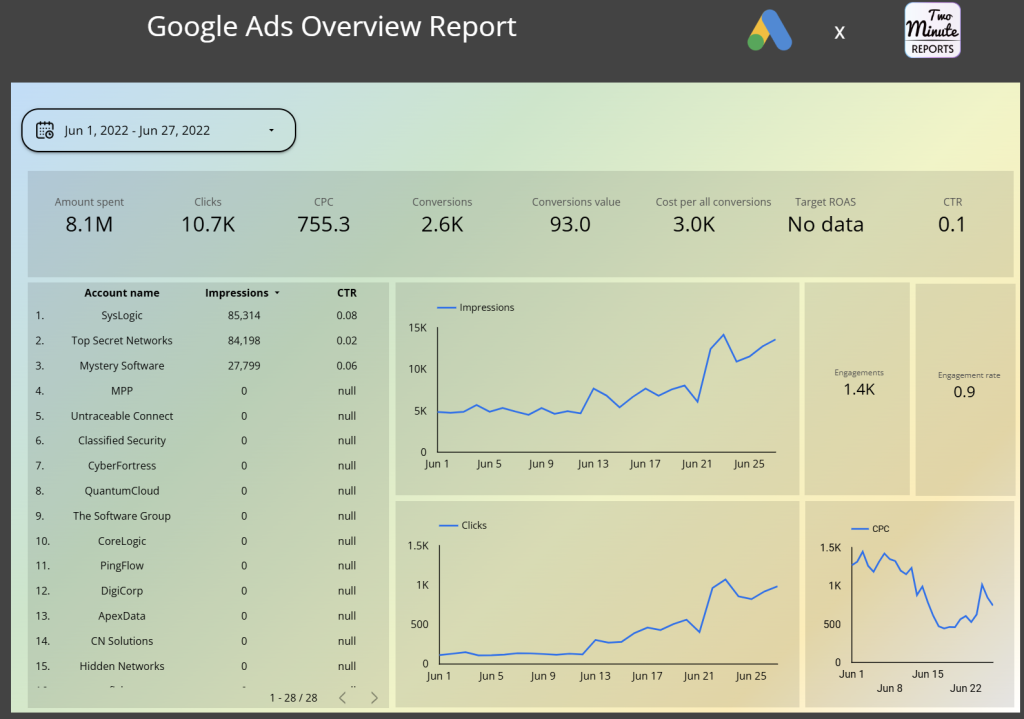
Template metrics description
There are two pages in this Google Ads Looker Studio template. The Overview page is quite straightforward, and it includes important metrics like clicks, CPC, conversions value, target ROAS, CTR, amount spent, and cost per all conversions. It also has a section where it displays account names and their respective impressions and CTRs. The charts also help to view impressions, CPC, and clicks for every day in the stipulated advertising timeframe.
How to use this dashboard?
The How To Use page provides a set of instructions on how you can get started with this template. You’ll have to create a new data source with the Two Minute Reports connector, make a copy of the report, and then connect the template to the new data source.
Pricing
This dashboard is free to access, but you need a subscription to connect your data.
How to choose the right Google Ads Looker Studio templates?
Now that we’ve discussed the best Google Ads Looker Studio templates, it’s time to know how to select the best one for you. Below are some things to consider when choosing the right templates that best suit your advertising needs.
Define your reporting goals
You should be clear on your reporting goals in order to determine what Google Ads templates to use. For example, you should be particular about the key performance metrics and KPIs that need to be measured in your reporting.
It’s a good idea to consider how detailed and granular your reports are meant to be. You also have to take into account the primary stakeholders for these reports and what they value most in ads dashboards. Then, you may proceed with efficient data visualizations that are best for your reporting goals.
Assess template features
There are different Google Ads Looker Studio templates that help you simplify your reporting. Some are focused on helping users measure campaign performance. Others may be based on ad group performance, overview, and so on.
You may notice that a single-page template is very straightforward since it’s meant to analyze specific metrics. On the other hand, multi-page Google Ads report templates allow you to analyze your data in one place without having to switch templates. You can also share pages at once.
Seek automation and efficiency
Automated reports make it possible for you to create regular reports faster. For example, Coupler.io offers an out-of-the-box solution with templates that automatically update precisely when you need them to, as well as 200+ ready-to-use Looker Studio integrations. So you won’t have to connect data every time you want to analyze or create a report.
The right Google Ads Looker Studio template should provide enough efficiency for your reporting. For example, dashboards that come with auto-connected connectors can be set up with a few clicks and may have the capability to automatically populate your report with data.
Consider added benefits
You should consider the benefits that may come with the Google Ads Looker Studio template. For example, Coupler.io offers a number of connectors for various apps, including Google Ads, Facebook Ads, LinkedIn Ads, Instagram Ads, Google Analytics 4, and so much more.
Such a platform provides the opportunity for you to fetch data from several business apps, blend or prepare data before connecting to Looker Studio, and build proper omnichannel reporting.

Create dynamic PPC and marketing reports with Coupler.io
Get started for free