QuickBooks keeps your finances organized and secure, but sometimes you just need more flexibility. The simplest solution here is to export your QuickBooks data to Excel, because with the help of Excel, users can:
- Create custom charts, pivot tables, and dashboards that reveal trends and insights QuickBooks can’t show
- Conduct deeper analysis, forecasts, and what-if scenarios
- Easily share data with accountants, investors, or team members without QuickBooks access.
Excel is already familiar to almost everyone, so collaboration is fast and painless. Learn how to export reports, transactions, lists, or custom data from QuickBooks to Excel, so you can analyze and visualize your numbers with ease. Let’s make your data work harder for you!
Step-by-step instructions for QuickBooks data to Excel export with Coupler.io
Coupler.io is your all-in-one no-code data integration tool that automatically pulls data from over 400 business apps on the schedule you choose. It provides a QuickBooks data connector that supports multiple destinations, including Microsoft Excel. To configure your data flow from QuickBooks to Excel immediately, click Proceed in the form below. You’ll be offered to sign up for Coupler.io for free with no credit card required.
In addition to the export of raw data from QuickBooks, you can export QuickBooks reports. For this, use QuickBooks Reports as a data source.
Follow the detailed setup instructions below to start automatic QuickBooks data export on your custom schedule.
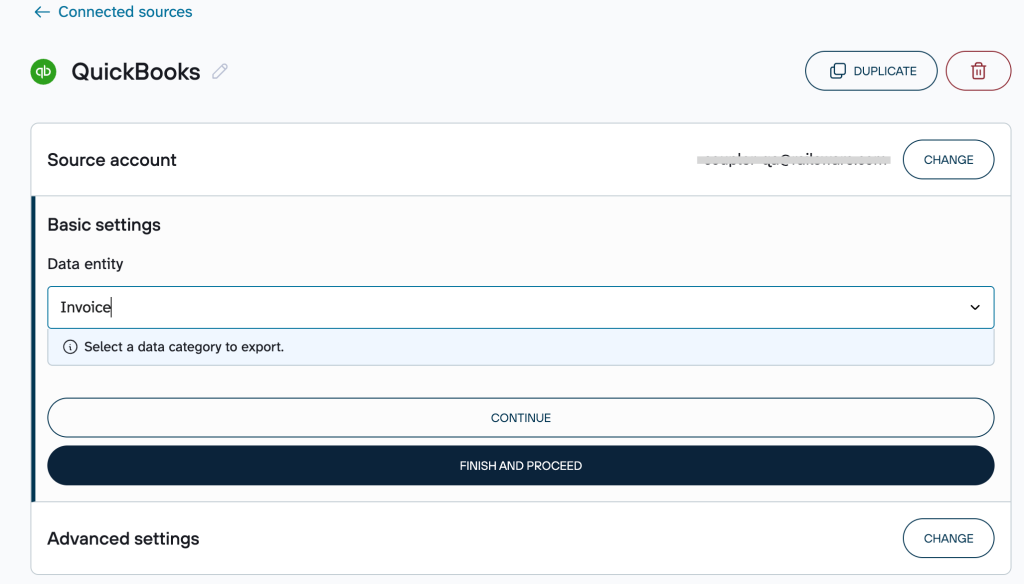
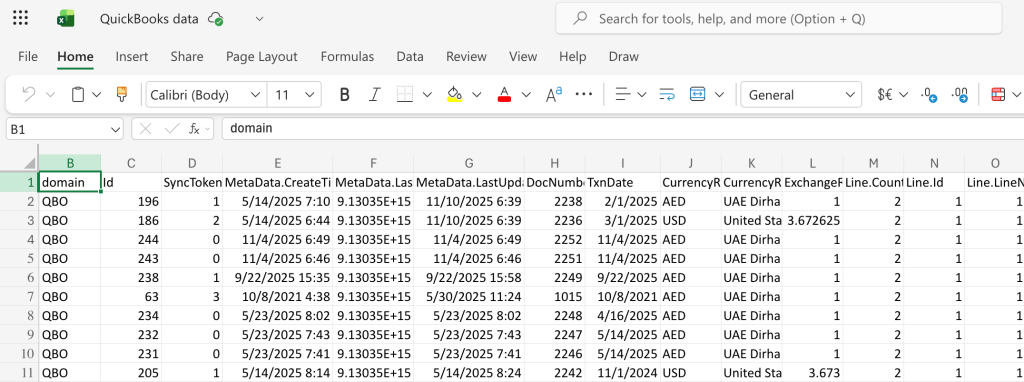
Step 1: Collect QuickBooks data
- Connect your QuickBooks account and select the data category you wish to export (e.g., Invoice).
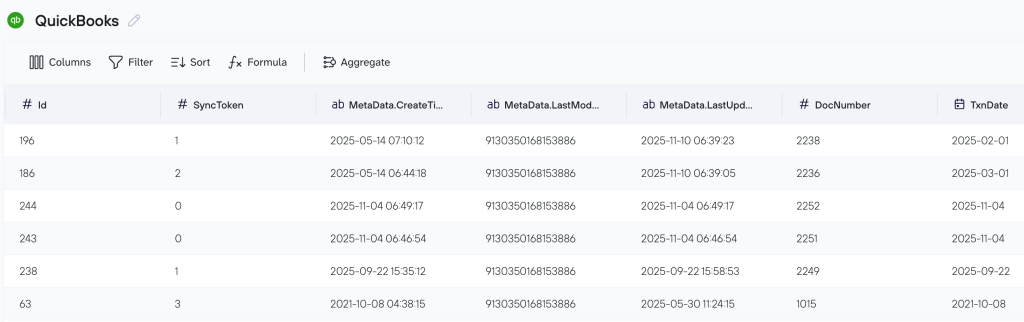
Step 2: Organize data sets
In the Data sets tab, you can prepare and organize your QuickBooks data before it’s exported. This section allows you to:
- Rename, hide, reorder, or adjust columns as needed
- Apply filters based on your own conditions
- Sort rows in the order that works best for you
- Add new columns with custom formulas for instant calculations
You can also use this tab to consolidate data across several QuickBooks entities or mix QuickBooks information with data from other integrations. More on multi-source blending appears further down.
Step 3: Connect the destination
Coupler.io supports data export to Excel in two formats: directly to Excel Online (stored in OneDrive) or as a downloadable file for Excel Desktop. The configuration steps differ as follows:
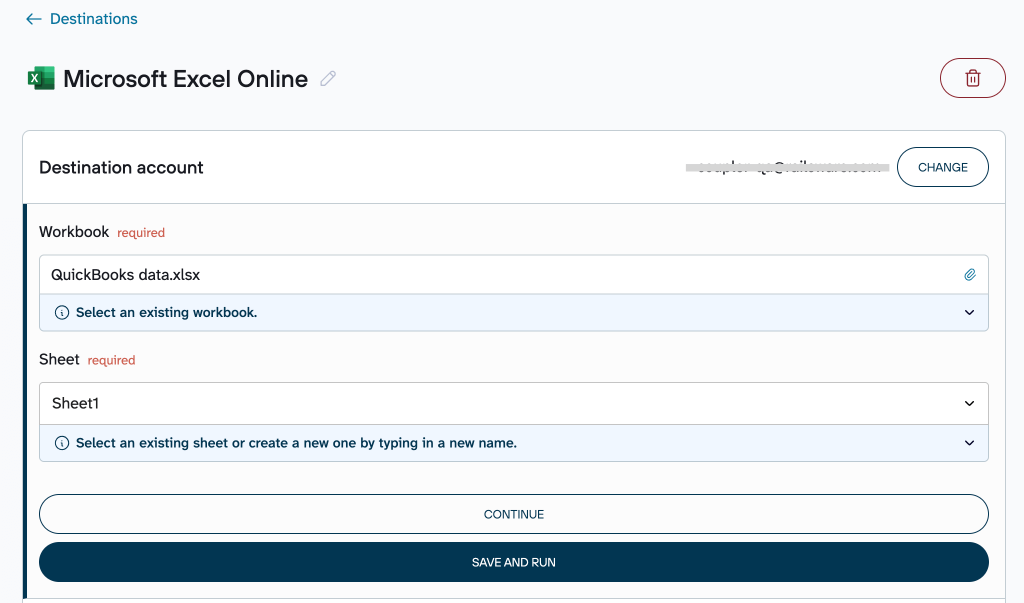
Excel Online setup:
- Select Microsoft Excel Online from the destination dropdown
- Authenticate with your Microsoft account
- Choose an existing workbook in your OneDrive folder and pick the sheet where the data should go.
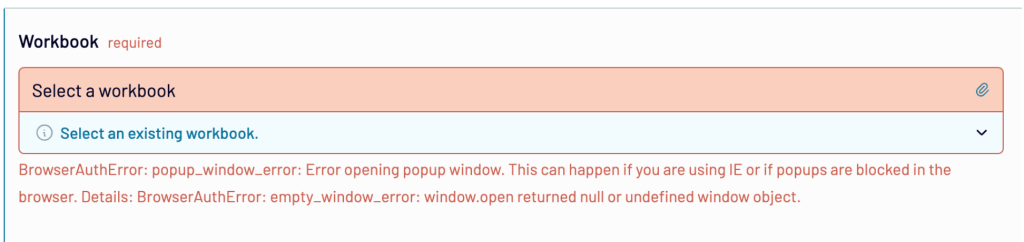
Tip: If the workbook picker doesn’t appear due to a pop-up error, ensure your browser allows pop-ups for this site. This is a common requirement for the OneDrive selection process.
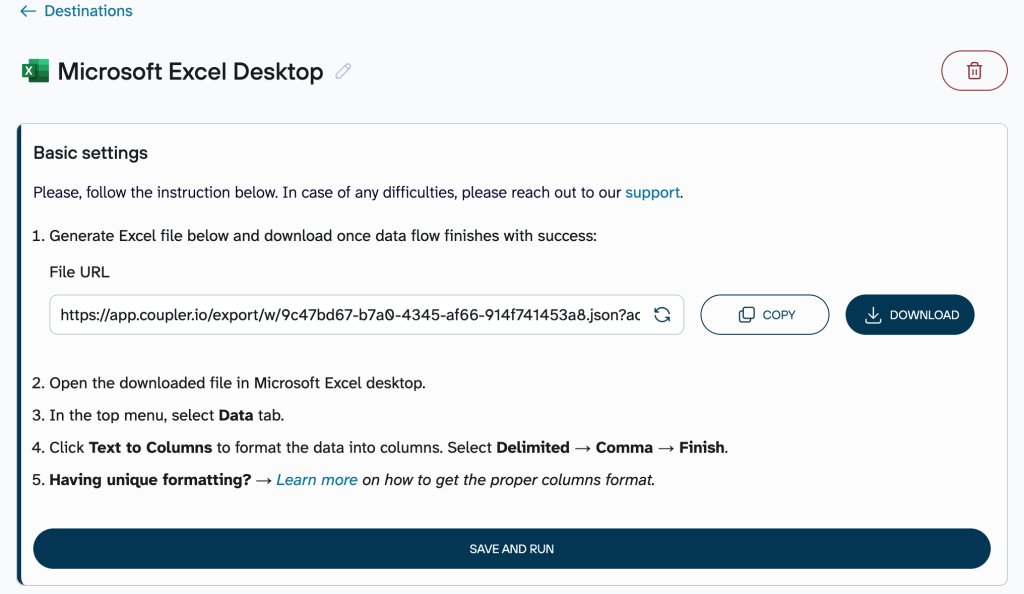
Excel Desktop setup:
- Select Microsoft Excel Desktop as the destination
- A CSV file will be prepared in the basic configuration
- Download the file and open it in your local Microsoft Excel application.
Step 4: Automate data refresh
The last step is the automation section. Enable the automatic data refresh option and set the desired schedule for regularly importing new data into your Excel destination.
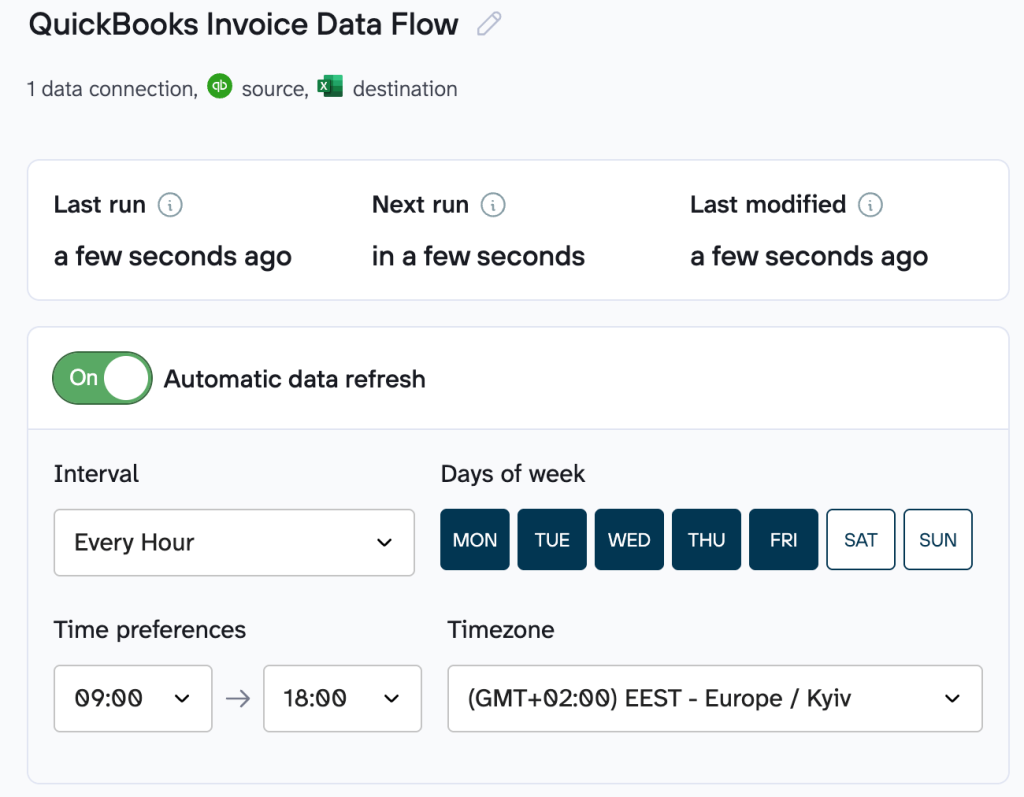
Once done, the data will automatically appear in the Excel sheet you’ve selected.
Coupler.io supports a wide range of destinations beyond Excel, including Google Sheets, data warehouses, and BI tools with ready-made dashboard templates in Looker Studio and Power BI. You can also analyze QuickBooks data with AI thanks to AI-powered features that help you quickly summarize datasets, explain trends in plain language, and spot important changes in your data. This makes it easier to build a scalable finance automation workflow that grows with your business and doesn’t require deep technical expertise.

Automate QuickBooks data export to Excel
Get started for freeTips on getting clean, up-to-date QuickBooks data with Coupler.io
Coupler.io allows you to export QuickBooks data directly to Excel as it appears in your account. At the same time, you can organize and adjust your data before it reaches your workbook. Here are the main data transformation options available in Coupler.io.
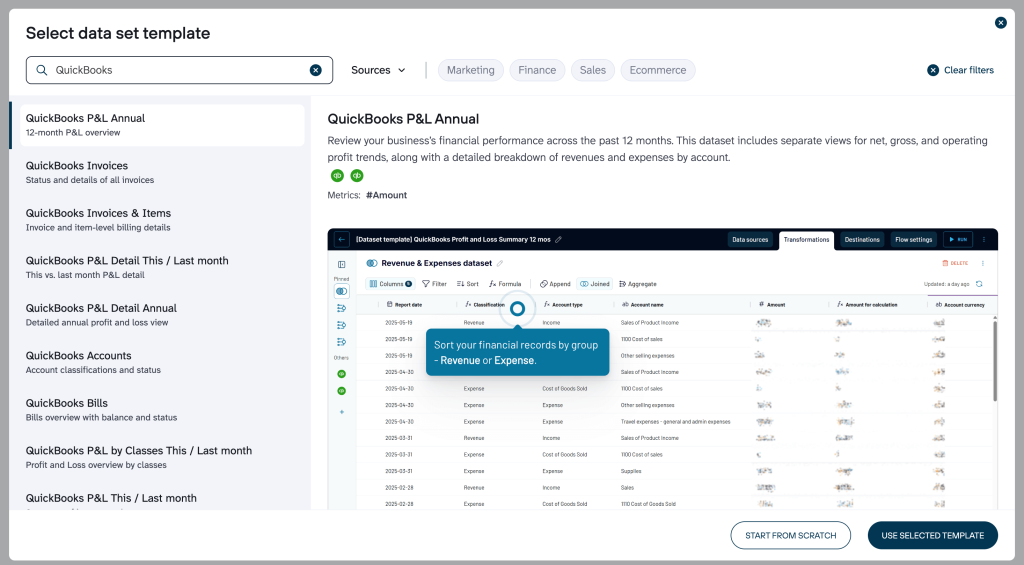
Plug-and-play QuickBooks data sets
To help you get started faster, Coupler.io provides pre-built QuickBooks data set templates. They come with QuickBooks data already organized and prepared for analysis, so you don’t need to structure or combine raw data manually:
- QuickBooks Invoices show the status and details of all the invoices.
- QuickBooks Bills provide an overview of the bills with balance and status.
- QuickBooks P&L Annual provides a 12-month profit and loss overview.
- And more
To get your data set template, create a new data flow and choose the Use prebuilt data set option.
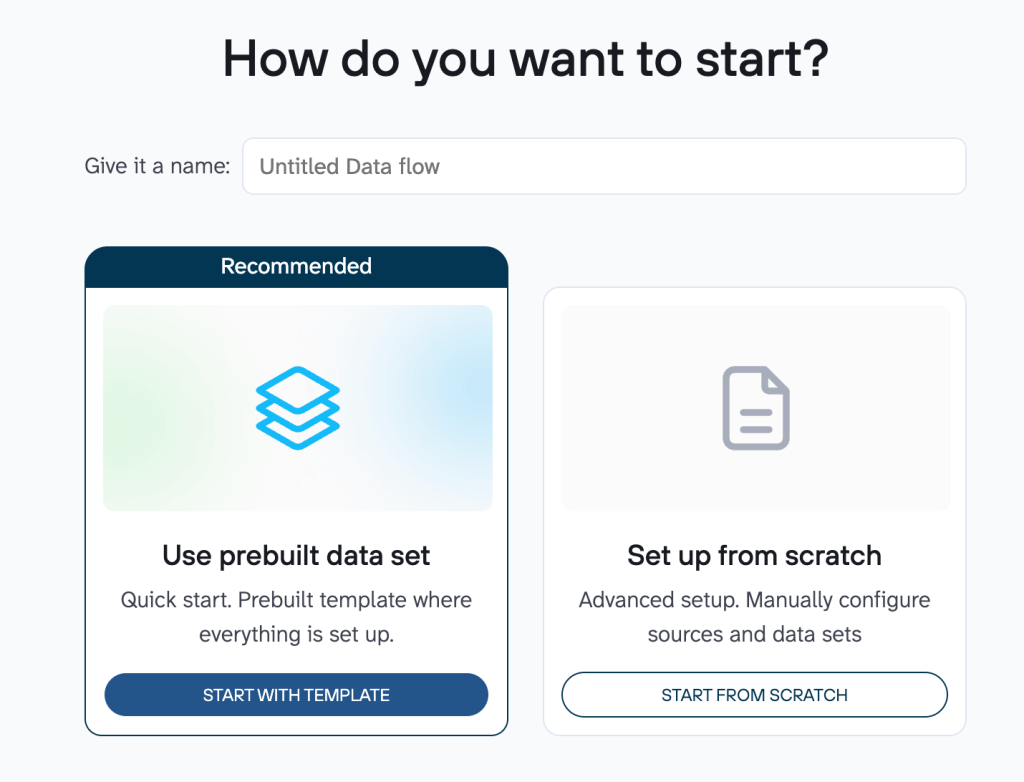
- Enter QuickBooks in the search bar. Now you can select any QuickBooks data set template that suits your business use case and proceed with its configuration.
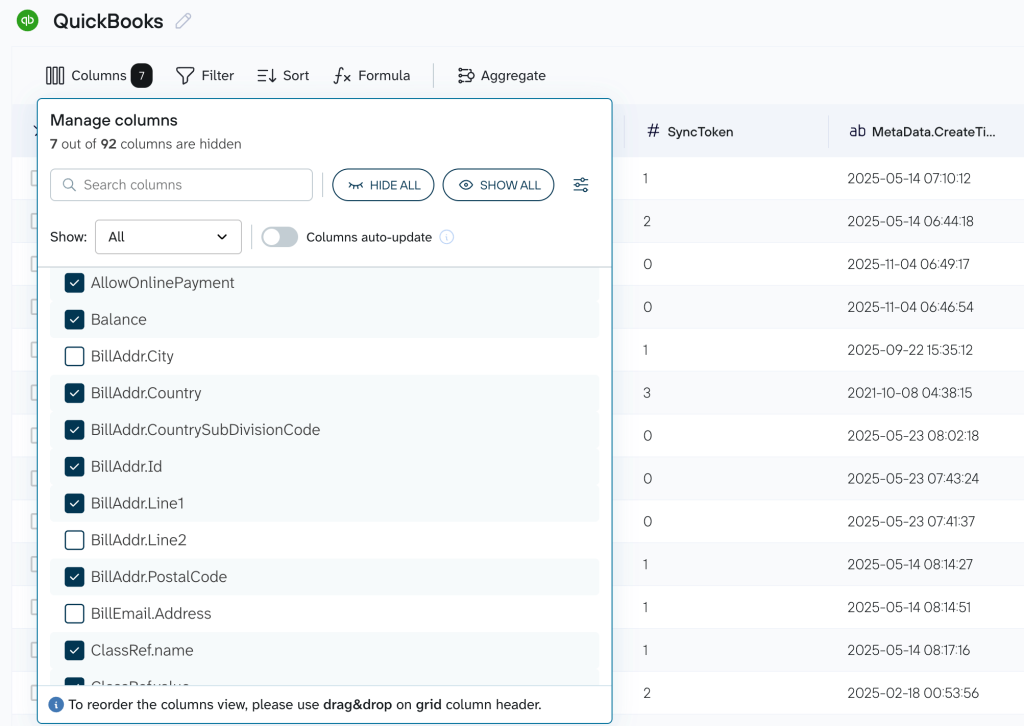
Basic data optimization options
Prepare your QuickBooks information in Coupler.io before exporting to Excel. This helps avoid manual adjustments later. Useful features include:
- Column changes: Rename for clarity (e.g., “LineItem” to “Item Description”), hide unneeded columns, or reorder to prioritize key fields like amounts or dates.
- Filtering and sorting: Focus on specific records, such as open invoices, transactions from the last quarter, or overdue payments; sort by date, amount, customer name (alphabetical), etc.
- Calculated columns: Add formulas to create new columns with instant results (e.g., days overdue, net amount after discounts).
Advanced options: data blending and summarizing
For more complex needs, Coupler.io lets you combine QuickBooks data from multiple entities or other sources, or summarize large volumes for a cleaner view and easier analysis.
The following options are available:
- Append stacks similar data vertically. It matches columns by name (e.g., “Date,” “Amount,” “Account”) and adds rows from each source. For example, use it when you need to consolidate transactions or reports from multiple QuickBooks companies into one complete view.
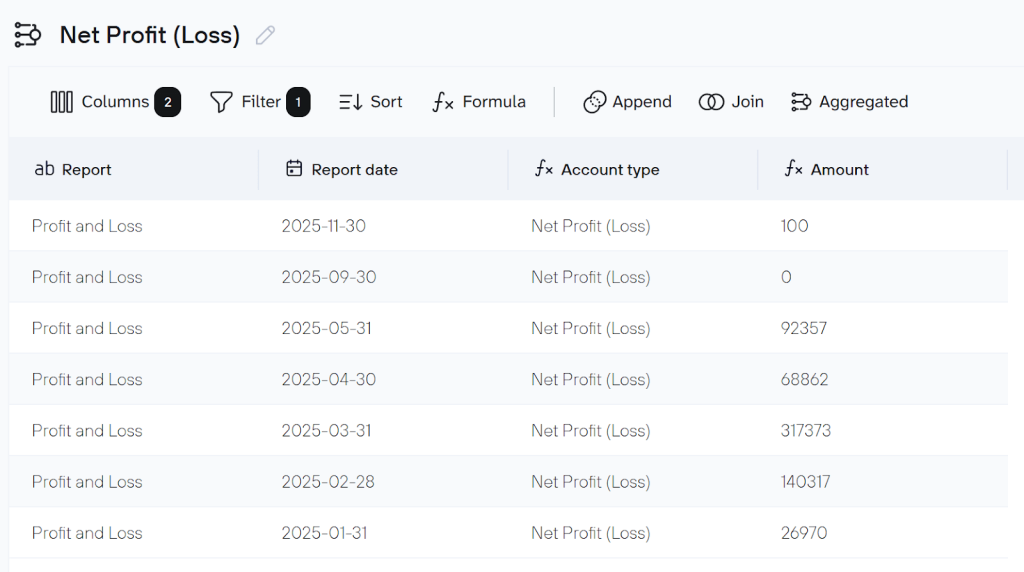
- Join connects datasets horizontally using a common field like account ID, customer name, or date. Your main QuickBooks data stays intact, while matching details from another source are added. For example, use it when you need to link QuickBooks account types with the Profit and Loss summary report.
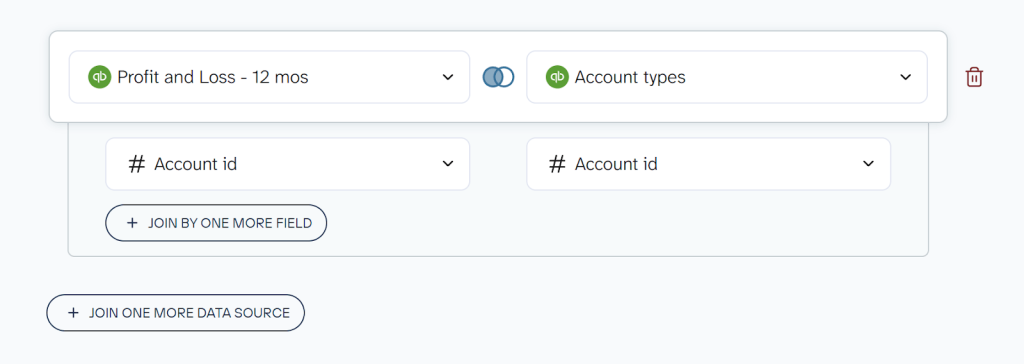
- Aggregate condenses many rows (e.g., daily transactions, line items, payments) into summaries. Group by fields and apply calculations like sum, average, count, min, or max. For example, use it when you need to get the total revenue by month, average invoice amount by customer, or the net profit (loss).
QuickBooks native export to Excel, and when to use it
Users can turn to QuickBooks’ built-in export to Excel feature precisely when they:
- just need this data once or very rarely
- want the results right now with absolutely zero setup (no accounts, connections, or third-party tools required)
- are working with a standard report where the default Excel formatting is perfectly acceptable for their purposes.
QuickBooks Online to Excel export using native functionality
QuickBooks Online (QBO) offers two built-in ways to export data. You can either use the Gear icon or go directly through the Reports section.
Option 1
To access your data via the Gear icon in QuickBooks Online, follow these steps:
- Log in to QuickBooks Online, click on the Gear icon at the top right-hand corner of the page.
- Select Export Data from the list.
- On the Reports tab, select the date range.
- Add or remove items from the Reports and Lists tabs by toggling the slider.
- Click Export to Excel at the bottom of the screen.
Option 2
Here’s how to quickly export any report to Excel directly from the Reports section in QuickBooks Online:
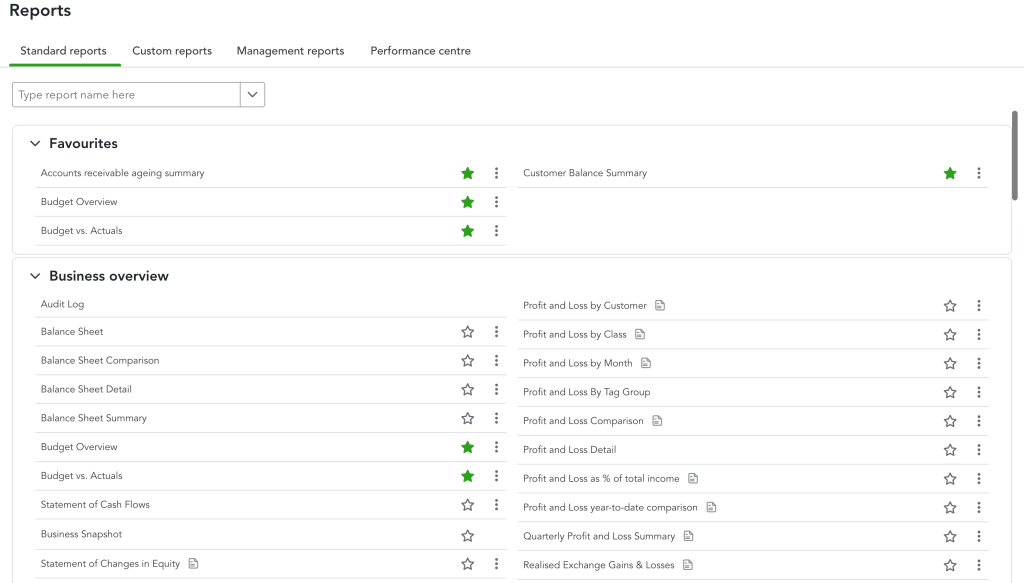
- Navigate to the Reports section in the left menu and select the type of report you need.
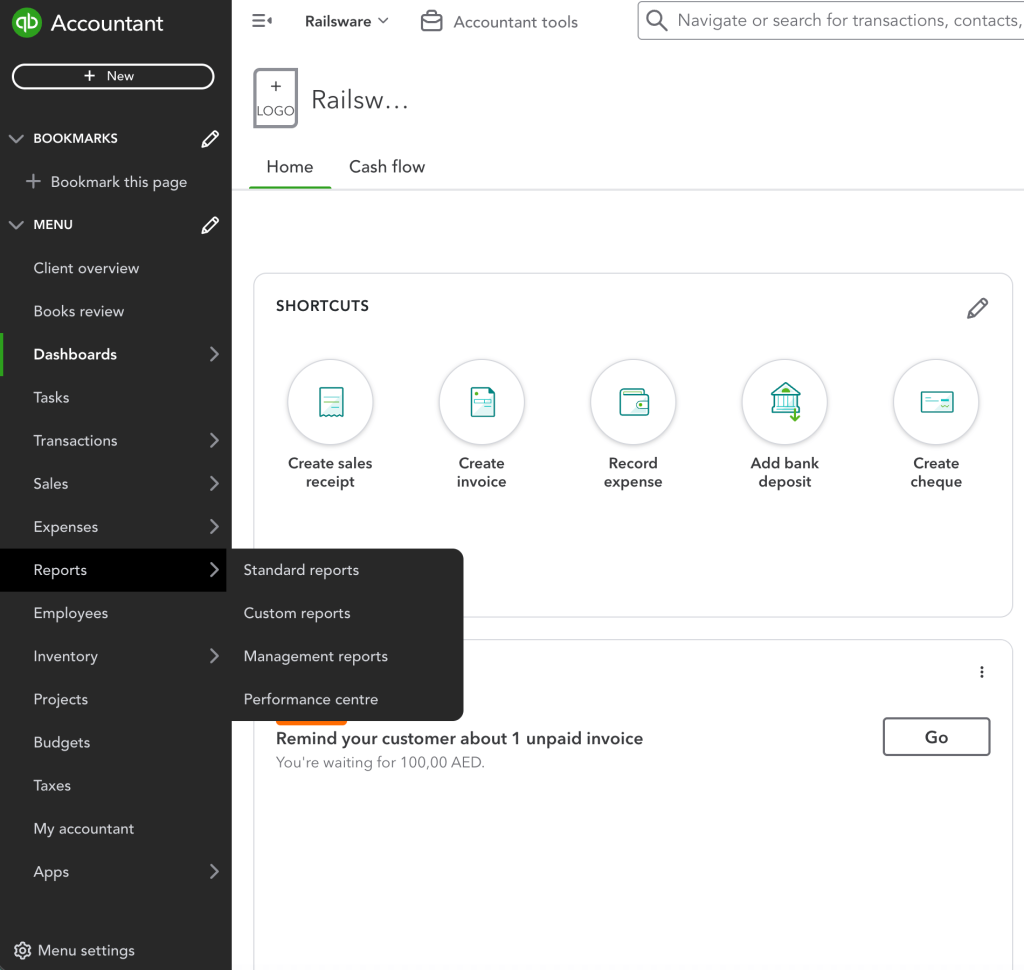
- Search for and choose the exact report you want to export on the Reports tab.
- At the top of the report, select the Export icon. Then, select Export to Excel.
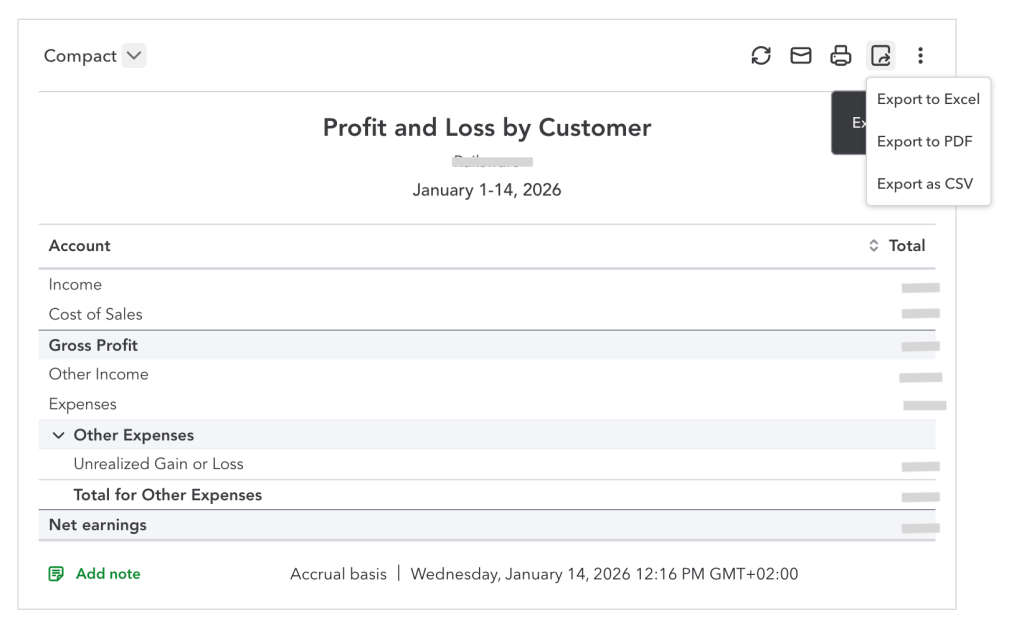
- Choose a location to save the file, such as your Downloads folder or desktop.
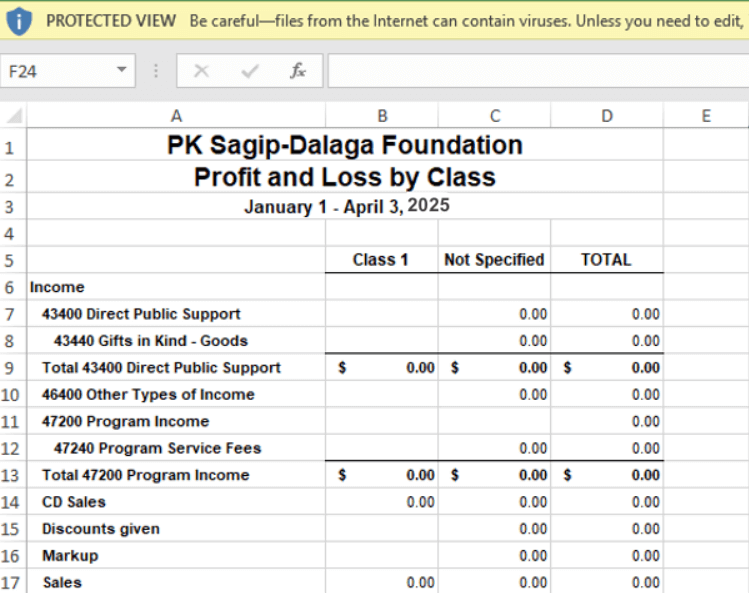
If you’re missing data when you open the report in Excel, the file may be in protected view. To view the full report, select Enable Editing.
How to export data from QuickBooks Desktop
One of the biggest perks of QuickBooks Desktop for Excel exports is the option to update an existing worksheet. QuickBooks Online doesn’t support this feature. This lets users efficiently refresh pre-existing spreadsheets with the latest report data without extra manual work, which saves considerable time and reduces errors.
To export data from QuickBooks Desktop:
- Launch QuickBooks Desktop and open the report you’d like to export.
- Click the Excel button located at the top of the report window.
- Choose Create New Worksheet for a fresh file or Update Existing Worksheet to refresh your current one.
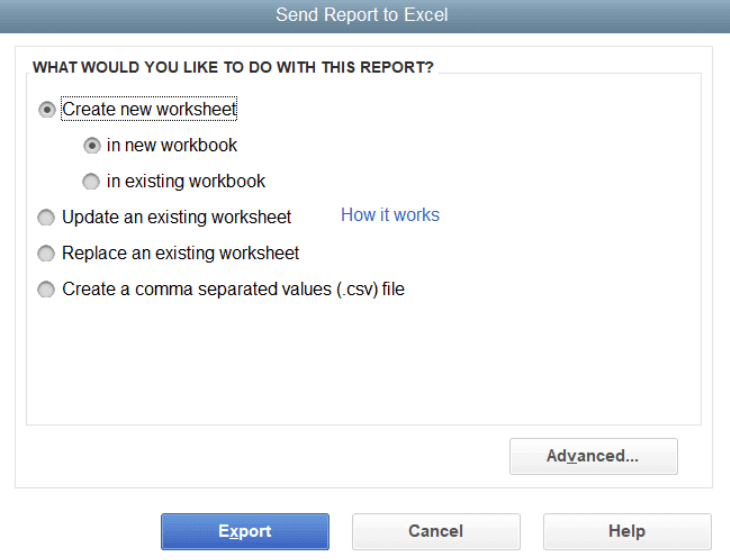
- Select your preferred Excel format (.xls or .xlsx).
- Click Export, then pick the save location for the file on your computer.
How to customize fields in QuickBooks before exporting?
Customizing fields in QuickBooks Online lets you capture the exact business details standard fields miss (project codes, sales reps, customer types, or industry-specific data) and delivers real value in the following ways:
- Smarter, more targeted reports: Filter, sort, and include custom data directly in custom reports (e.g., revenue by project or client industry).
- Cleaner, faster Excel exports: Pull only relevant data with your custom fields included as columns, which results in smaller files, less clutter, and minimal post-export cleanup or reformatting.
- Better accuracy & consistency: Use dropdowns, dates, or number-only types to reduce errors and ensure uniform data for reliable analysis and pivots.
- Time savings: Skip manual Excel tweaks; data exports are pre-organized and ready for review, sharing, or advanced tools.
- Seamless tracking & sorting: Quickly filter customer/vendor lists or transactions by custom values, then export sorted results for efficient workflows.
Note: Full enhanced custom fields (up to 12 per form/profile type, advanced data types, broader application) require QuickBooks Online Advanced. Basic tiers offer limited options.
To set them up quickly:
- Click the Gear icon > Custom fields.
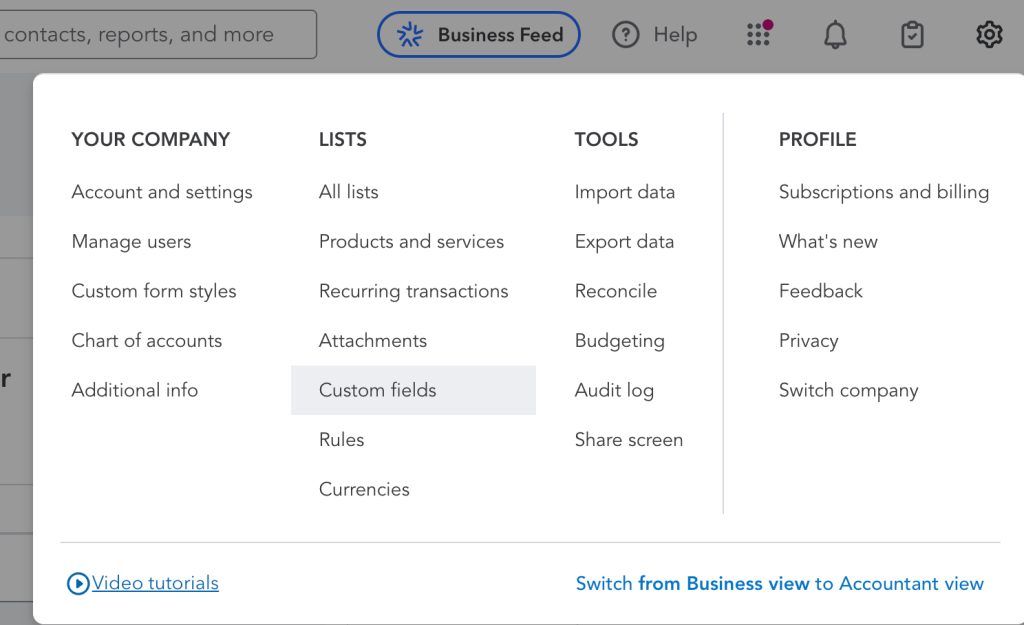
- Select Add custom field.
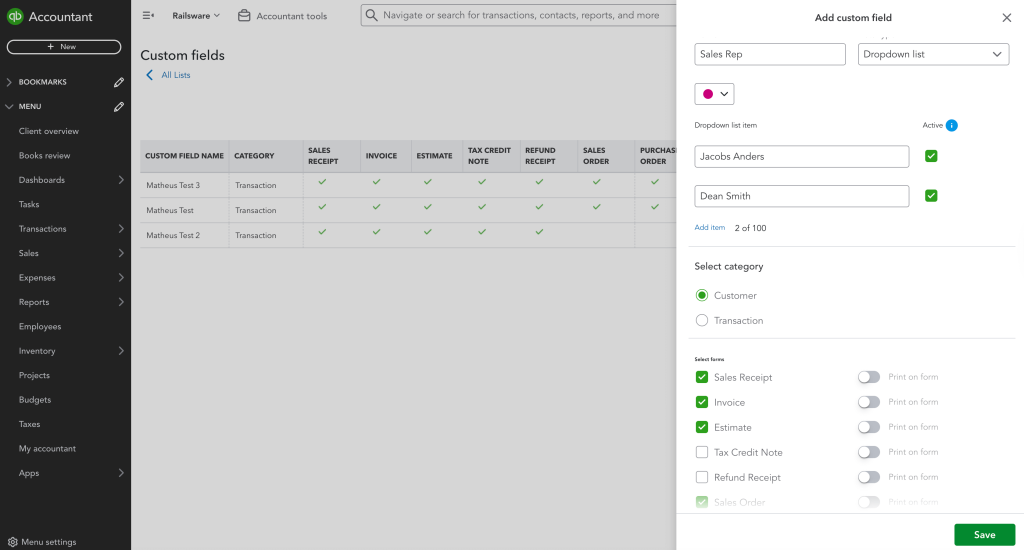
- Name it, choose the data type (Text/number, Number only, Date, or Dropdown for consistency).
- Pick the category (e.g., Customers or Transactions) and forms where it appears.
- Select the forms where you want the custom field to appear and toggle Print on form if needed for documents.
- Hit Save.
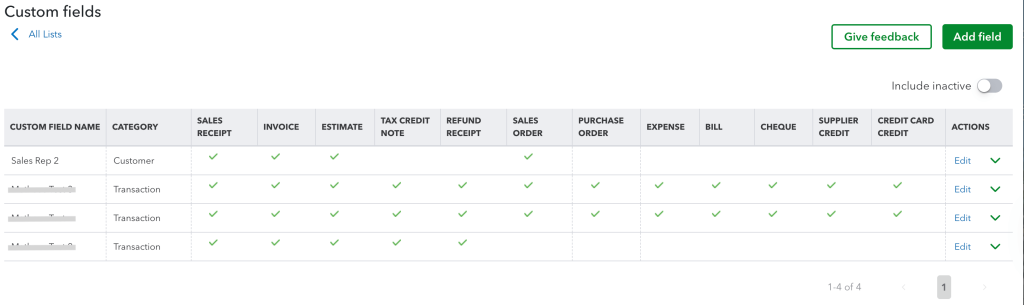
Once added, use them in reports/lists for precise filtering/sorting before exporting. For QuickBooks Desktop, custom field setup differs (often via lists/templates); check Intuit’s Desktop guides for specifics.
Which types of data can be exported from QuickBooks?
QuickBooks Online offers several ways to export your data to Excel (and sometimes CSV), depending on how much control and automation you need. With QuickBooks built-in options, you can export:
- Reports: Balance Sheet, Profit & Loss, Cash Flow, AR/AP Aging, General Ledger, etc.
- Lists: Customers, Vendors, Employees, Items.
- Transactions: Use reports like Transaction List or Export Data tool to download batches of invoices, bills, payments, etc., in Excel.
For custom fields, filters, scheduled refreshes, or large recurring exports, use Coupler.io because it lets you export both raw data entities and reports to Excel automatically.
The main data types you can export via Coupler.io include:
- Raw entities
Account, Bill, BillPayment, Budget, Class, CompanyInfo, CreditMemo, Customer, Department, Deposit, Employee, Estimate, Invoice, Item, JournalEntry, Payment, Purchase, PurchaseOrder, SalesReceipt, Vendor, VendorCredit, TaxCode, TaxRate, TimeActivity, Transfer.
- Reports & summaries
AP Aging Detail/Summary, AR Aging Detail/Summary, Balance Sheet, Cash Flow, Customer Balance Detail, Customer Income, Expenses by Vendor, General Ledger Detail, Inventory Valuation Summary, Journal Report.
The choice is simple:
- Need a one-time fast export? → Use built-in QuickBooks features
- Want automation, custom filters, or regular updates? → Choose Coupler.io
Turn QuickBooks numbers into clear insights with ready-to-go dashboards
Once your QuickBooks data is connected to Coupler.io, you can go far beyond basic exports. Coupler.io provides ready-made QuickBooks dashboard templates that automatically transform accounting data into clear, up-to-date visual reports. These dashboards are designed for business owners, finance teams, and accountants who want fast answers without manually building reports.
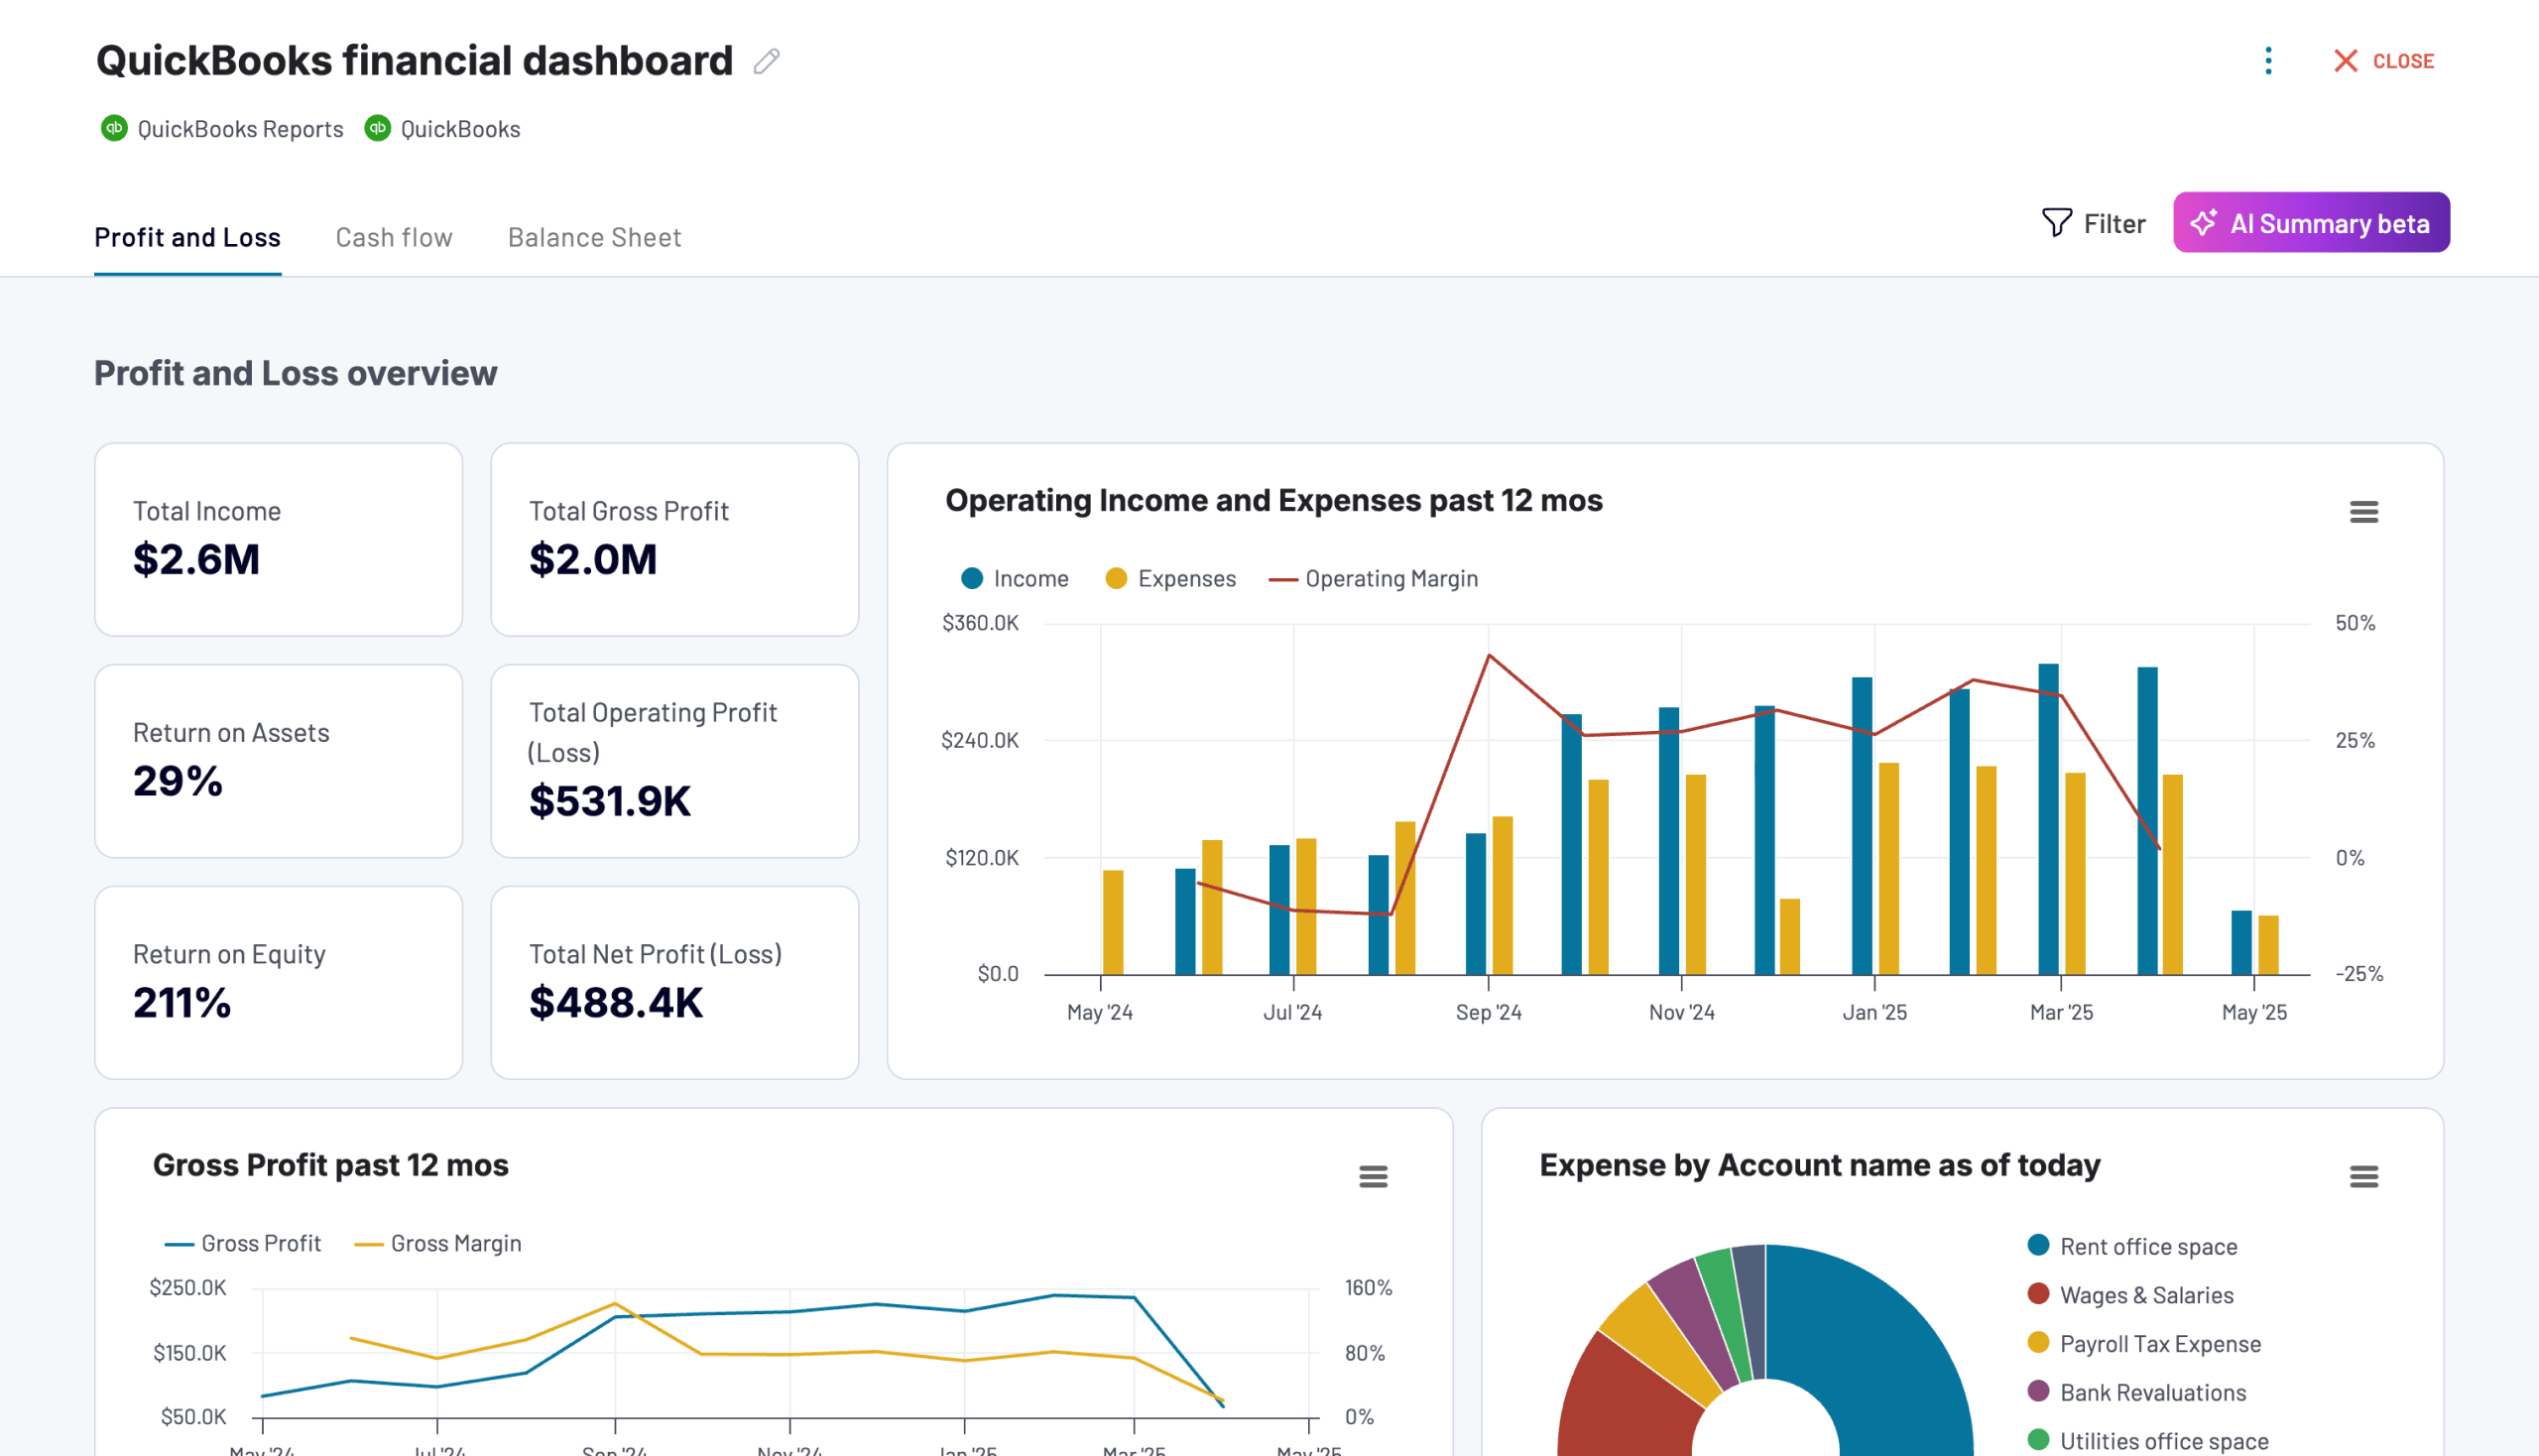
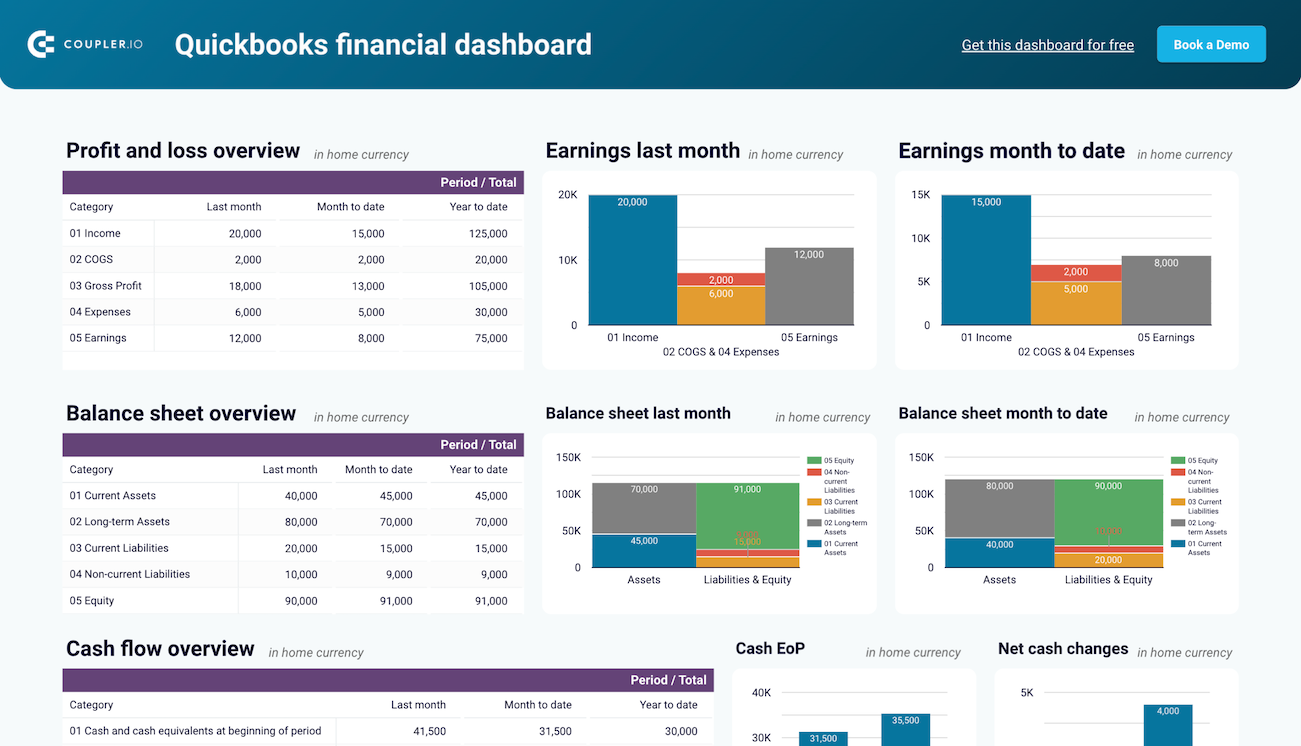
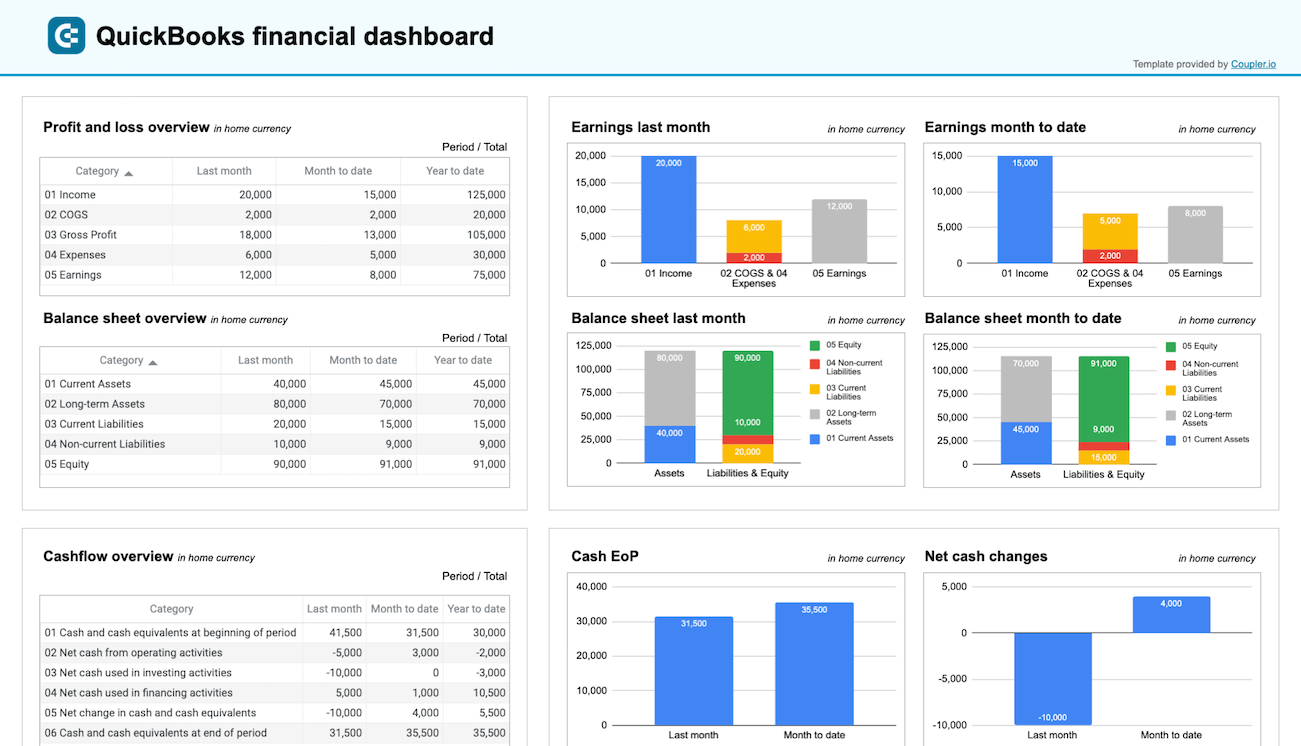
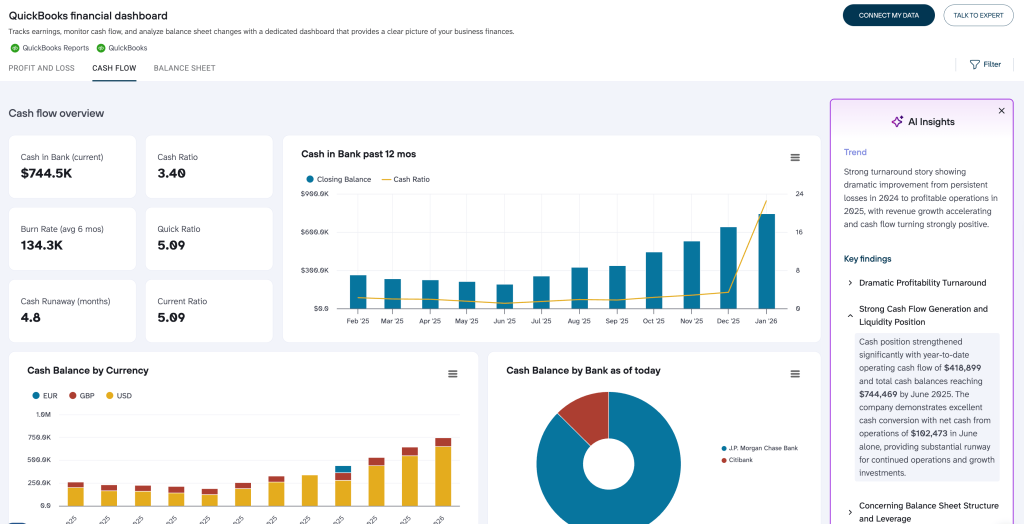
QuickBooks financial dashboard
The QuickBooks financial dashboard offers a consolidated view of your core financial data in one place. With automatic refreshes and structured visuals, it helps you track performance, monitor trends, and identify issues early without switching between multiple QuickBooks reports.
Quickbooks financial dashboard coupler
 Preview dashboard
Quickbooks financial dashboard coupler
Preview dashboardWhat insights the dashboard provides:
- High-level financial overview: View total income, expenses, net profit, cash balance, outstanding receivables, and payables to quickly assess the overall financial position of your business.
- Revenue and cost trends: Analyze how income and expenses evolve to uncover seasonality, unexpected fluctuations, or long-term cost increases.
- Profitability monitoring: Follow gross and net profit trends to understand how efficiently your business generates returns.
- Receivables and payables status: Track open invoices and unpaid bills, including aging breakdowns, to improve cash collection and avoid overdue payments.
- Spending and income structure: Break down financial results by account or category to see exactly where money is earned and spent.
How to use
The QuickBooks financial dashboard is available in Coupler.io and as a template in Looker Studio and Google Sheets. This dashboard is powered by the Coupler.io QuickBooks integration. After connecting your account, data updates automatically on the schedule you choose. Simply follow the Setup guide included in the template, and within minutes, the dashboard will populate with your QuickBooks data.


Coupler.io’s native dashboard includes an additional powerful feature — AI insights. It helps you quickly understand what’s happening in your data. Instead of manually reviewing charts and tables, AI insights automatically highlight key trends, changes, and anomalies in your reports, and explain them in plain language. This way, you can spot important shifts faster, focus on what matters most, and make data-driven decisions without deep analytical expertise.
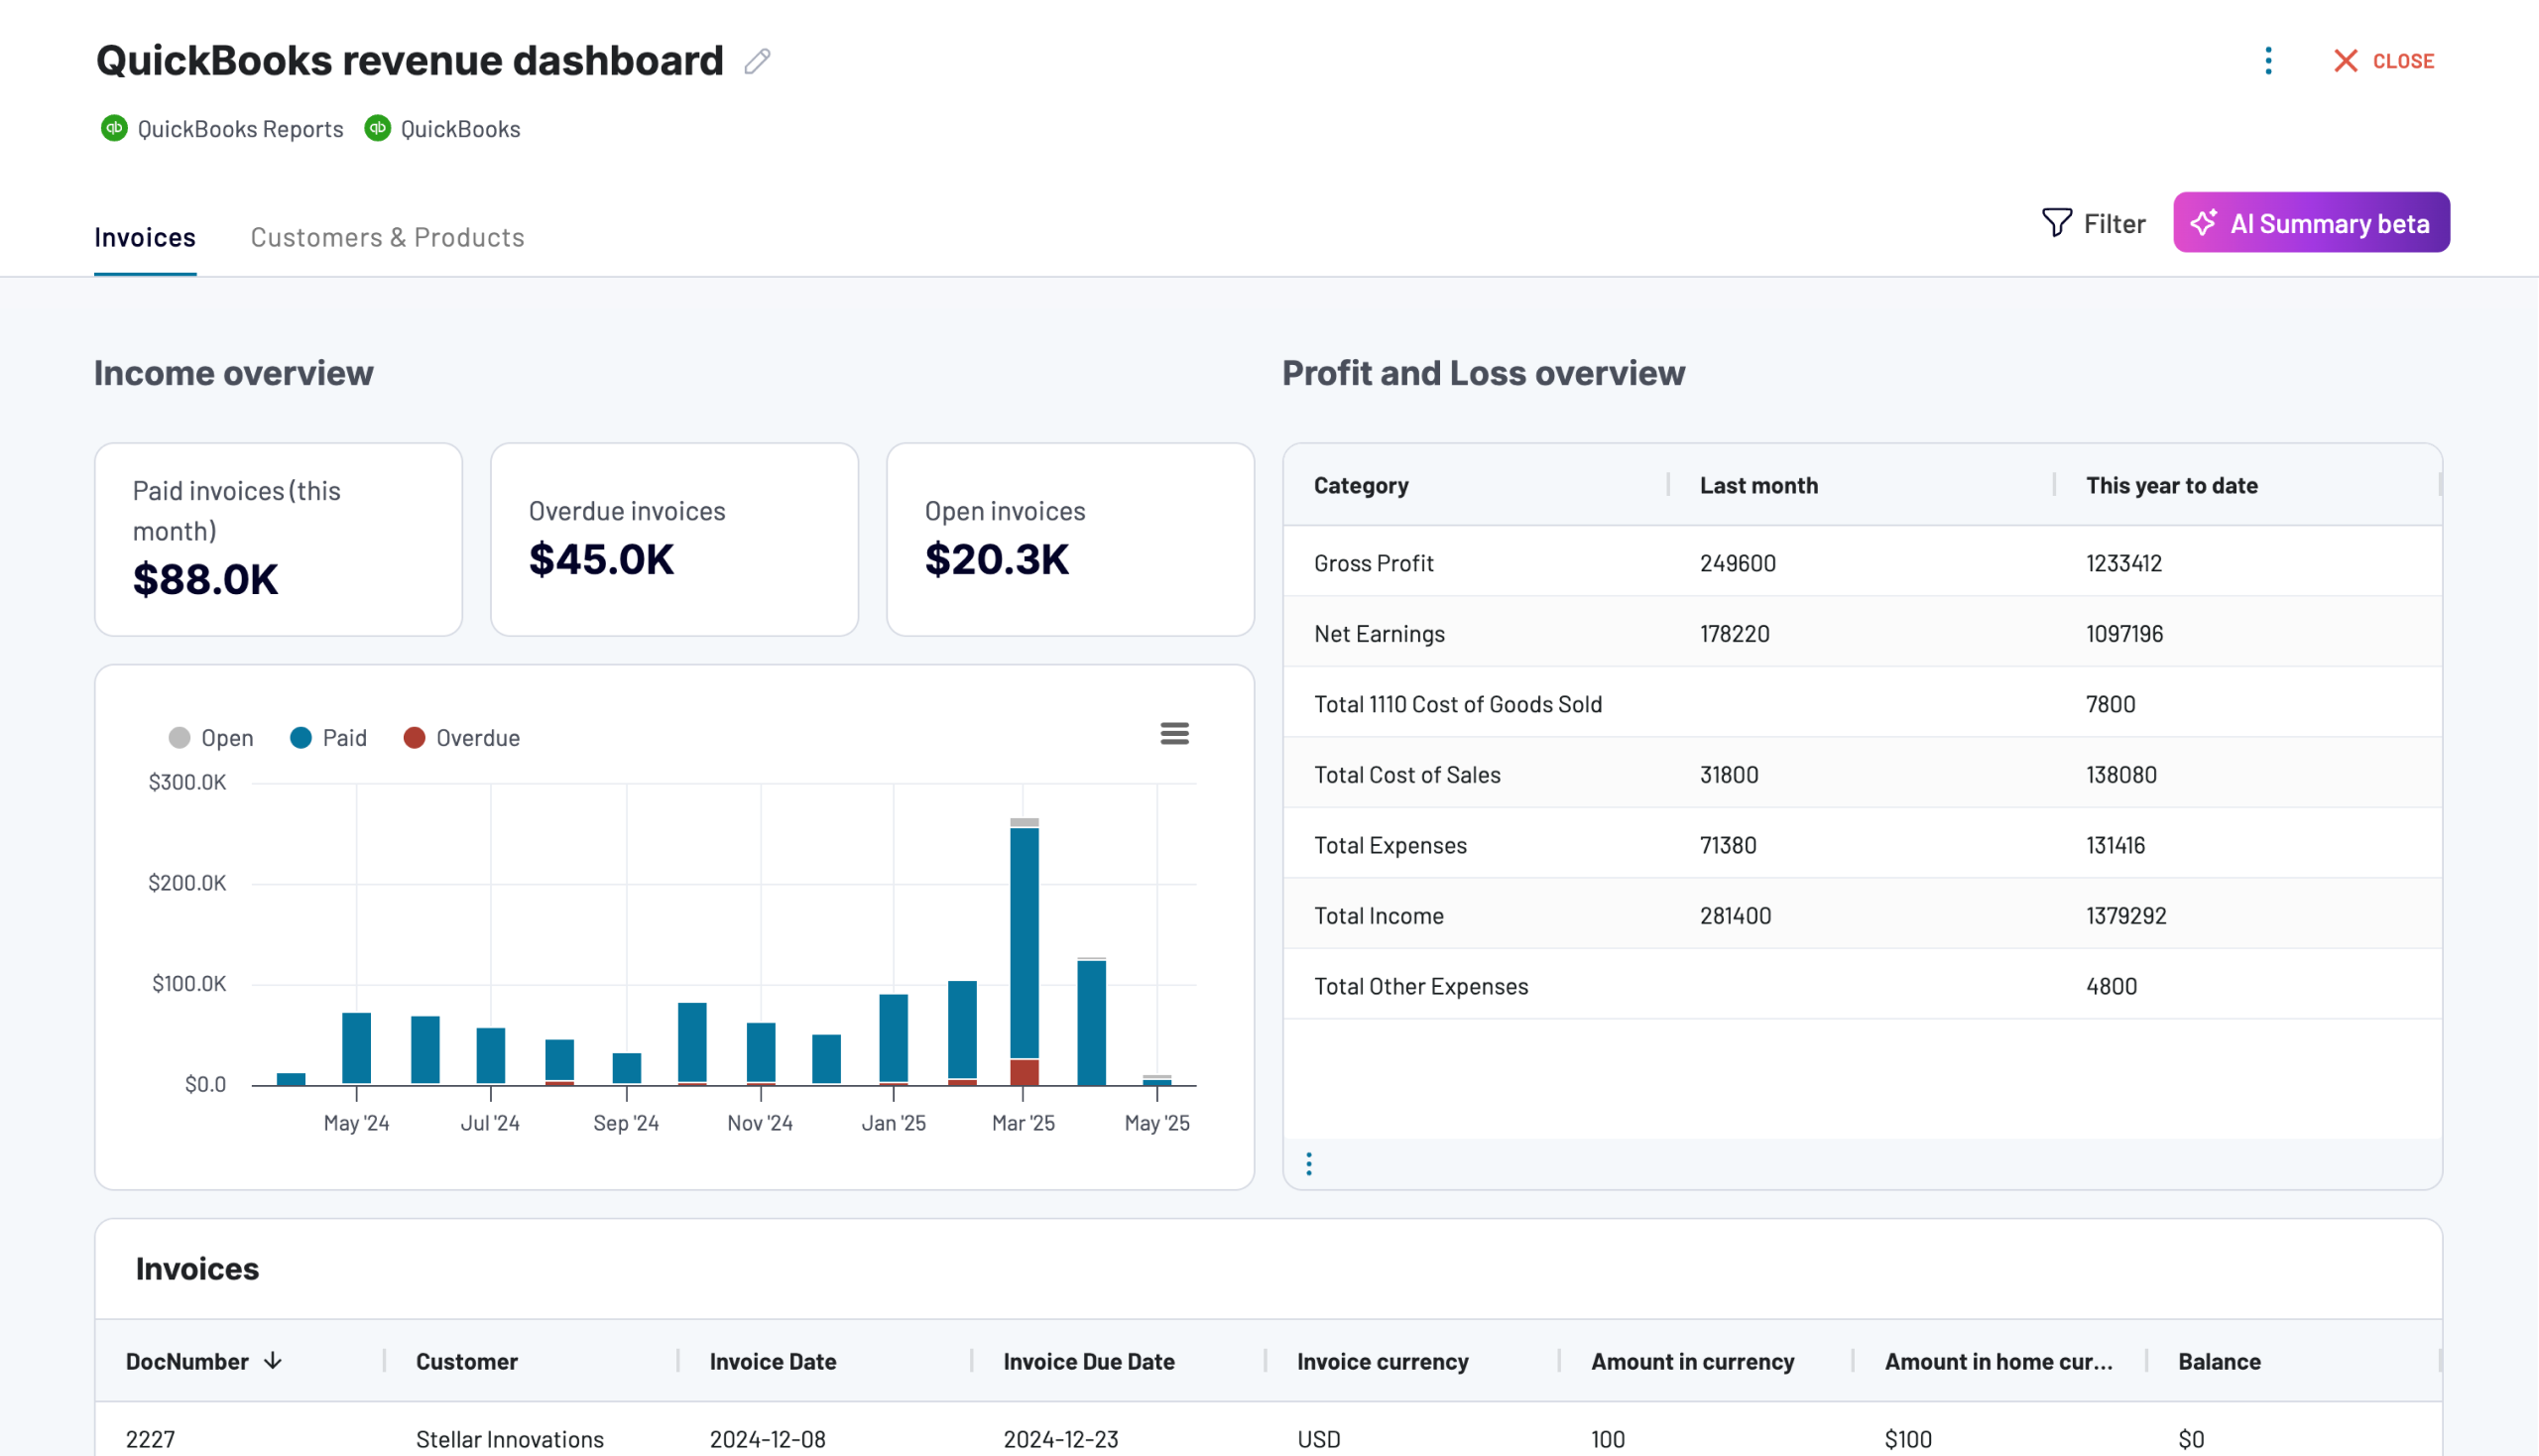
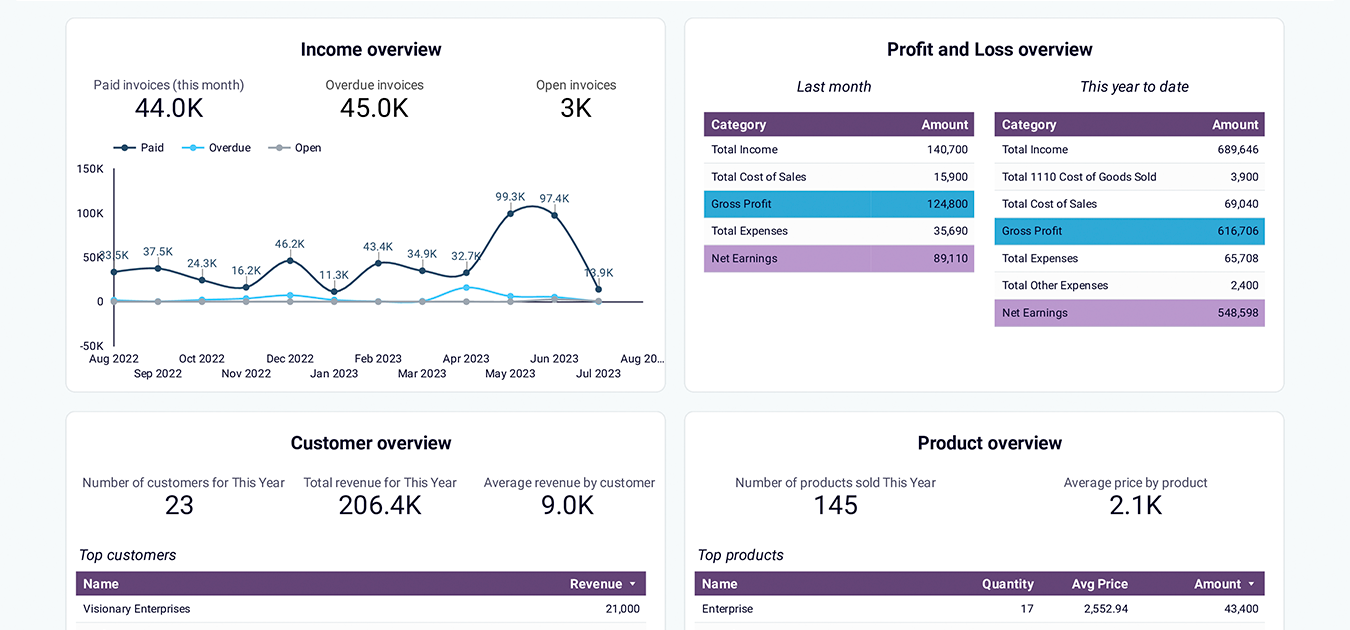
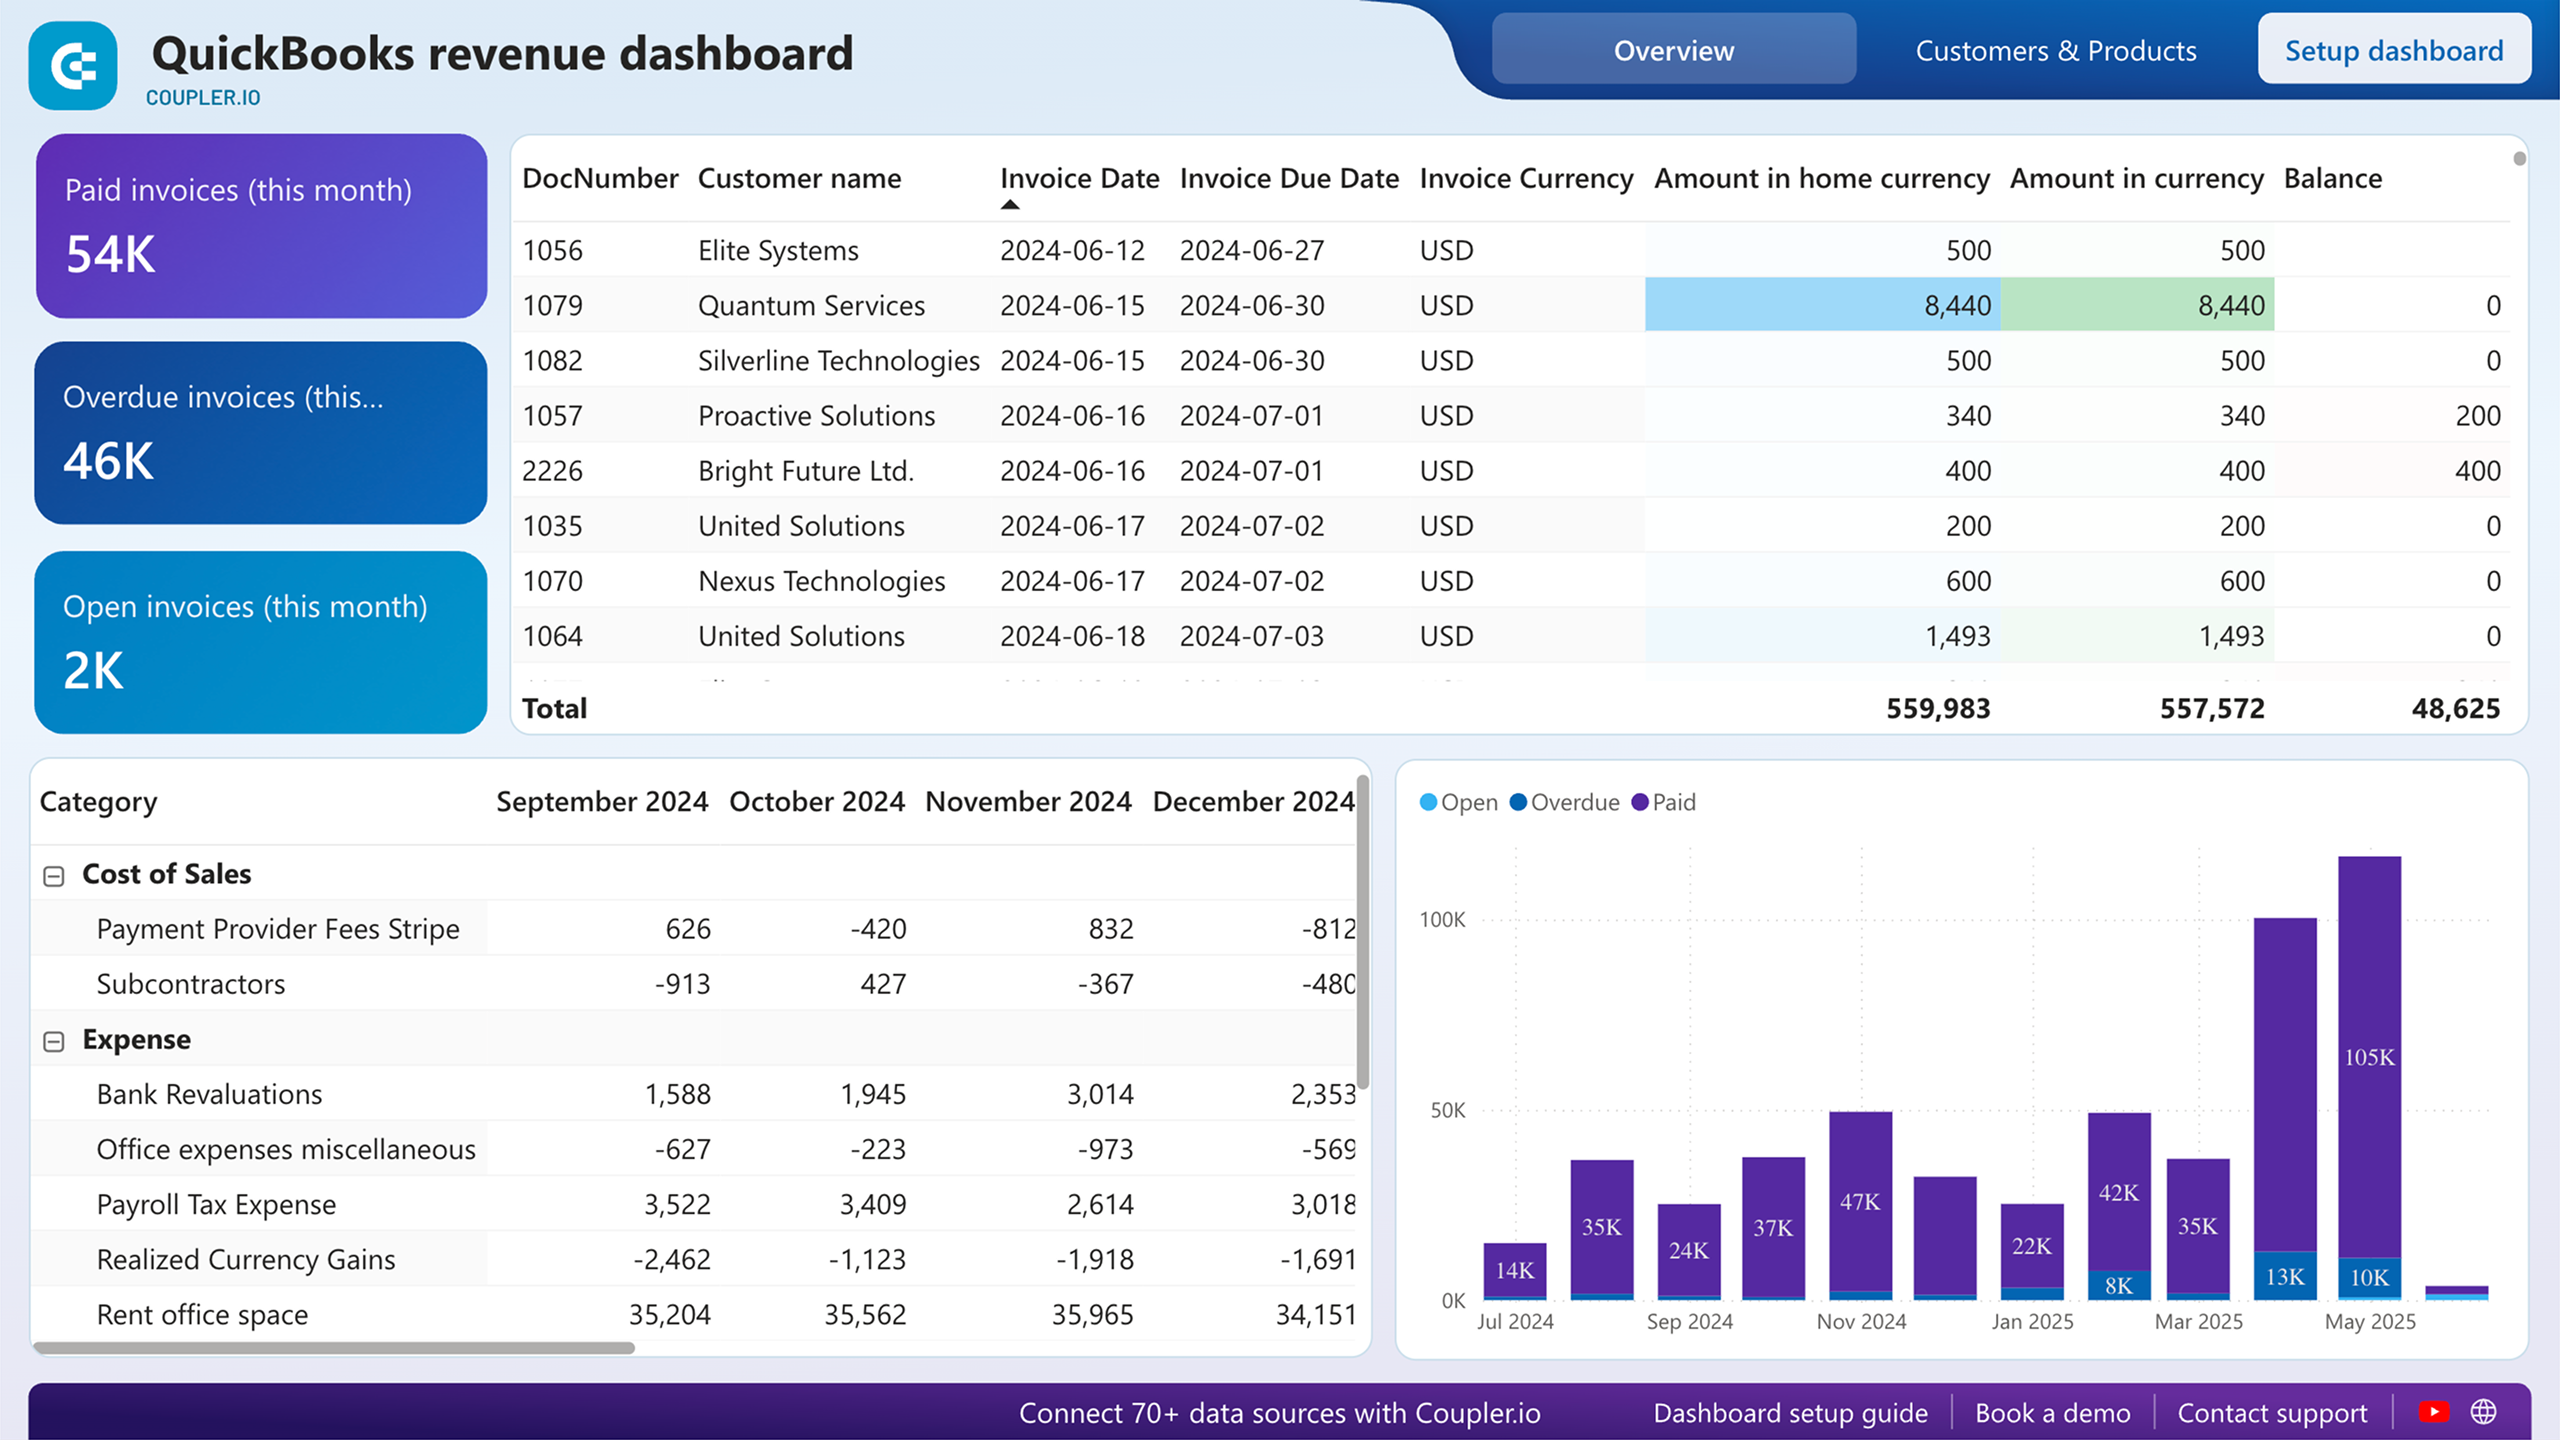
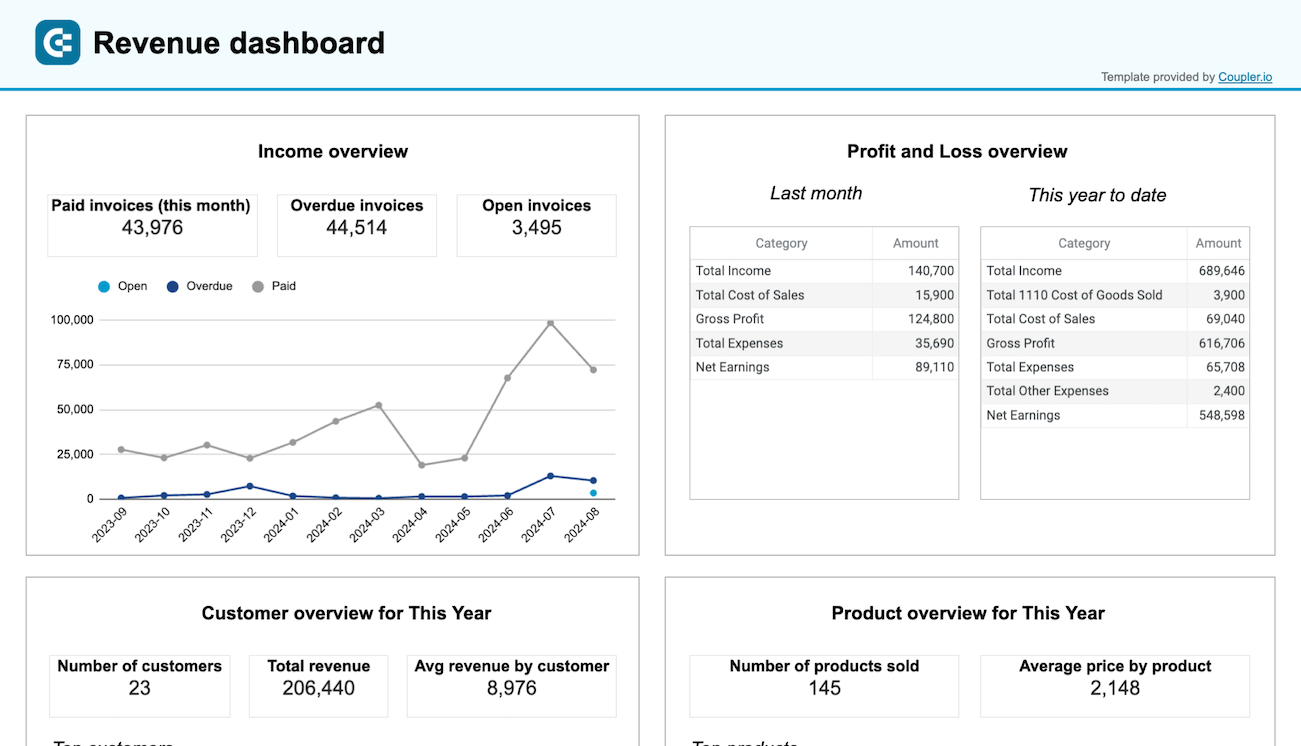
QuickBooks revenue dashboard
This ready-to-use QuickBooks revenue dashboard helps you understand where your income comes from and how it changes over time. With automatic data refreshes and structured visualizations, it provides a clear view of revenue performance without relying on manual exports or static reports.
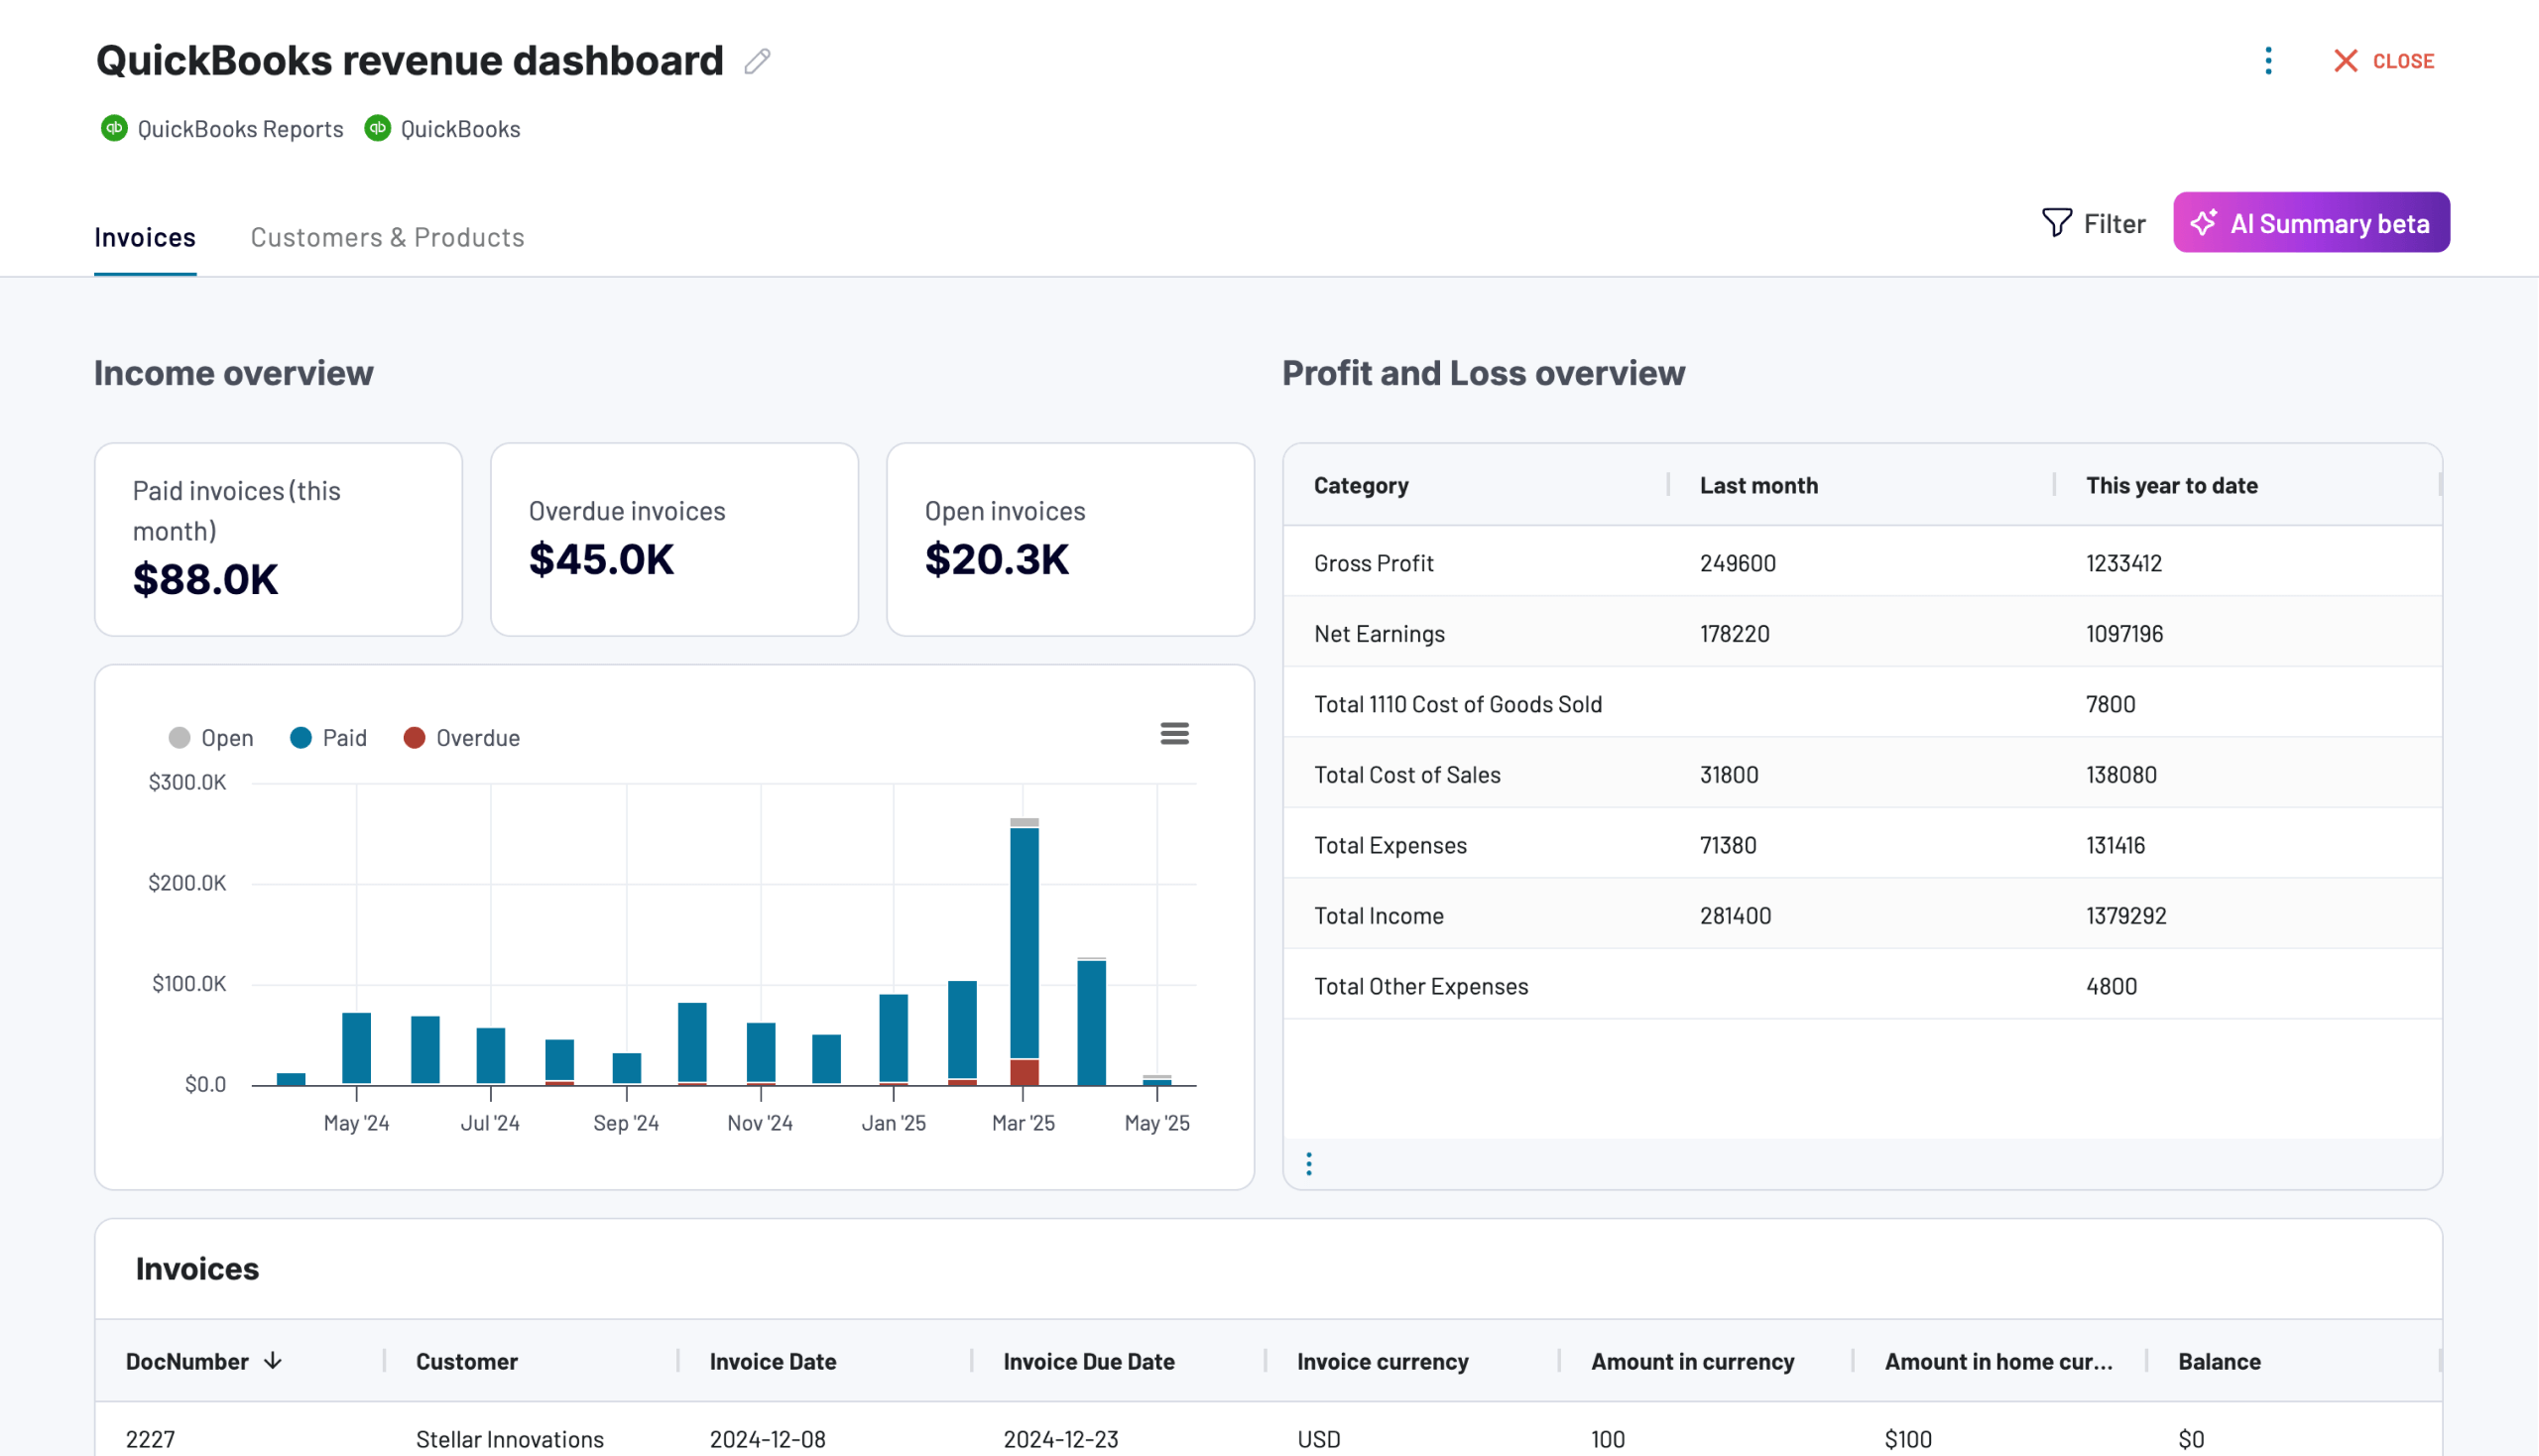
What insights the dashboard provides:
- Revenue overview: Track total revenue over the selected period and see how it compares across months or quarters.
- Revenue trends over time: Line and bar charts show how income evolves, which makes it easier to identify growth periods, seasonal patterns, or unexpected drops.
- Revenue by customer: Analyze which customers generate the most revenue and how their contribution changes over time.
- Revenue by product or service: Break down income by item, product, or service to understand what drives your top line.
- Invoice-based revenue visibility: Review revenue derived from issued and paid invoices to connect sales activity with actual financial results.
How to use
The QuickBooks revenue dashboard is available in Coupler.io and as a template in Looker Studio, Power BI, and Google Sheets. Once connected, your QuickBooks data updates automatically based on the schedule you choose. To start using the dashboard, follow the instructions in the Setup guide tab of the template. Within a few minutes, you’ll see your QuickBooks revenue data visualized in the dashboard.

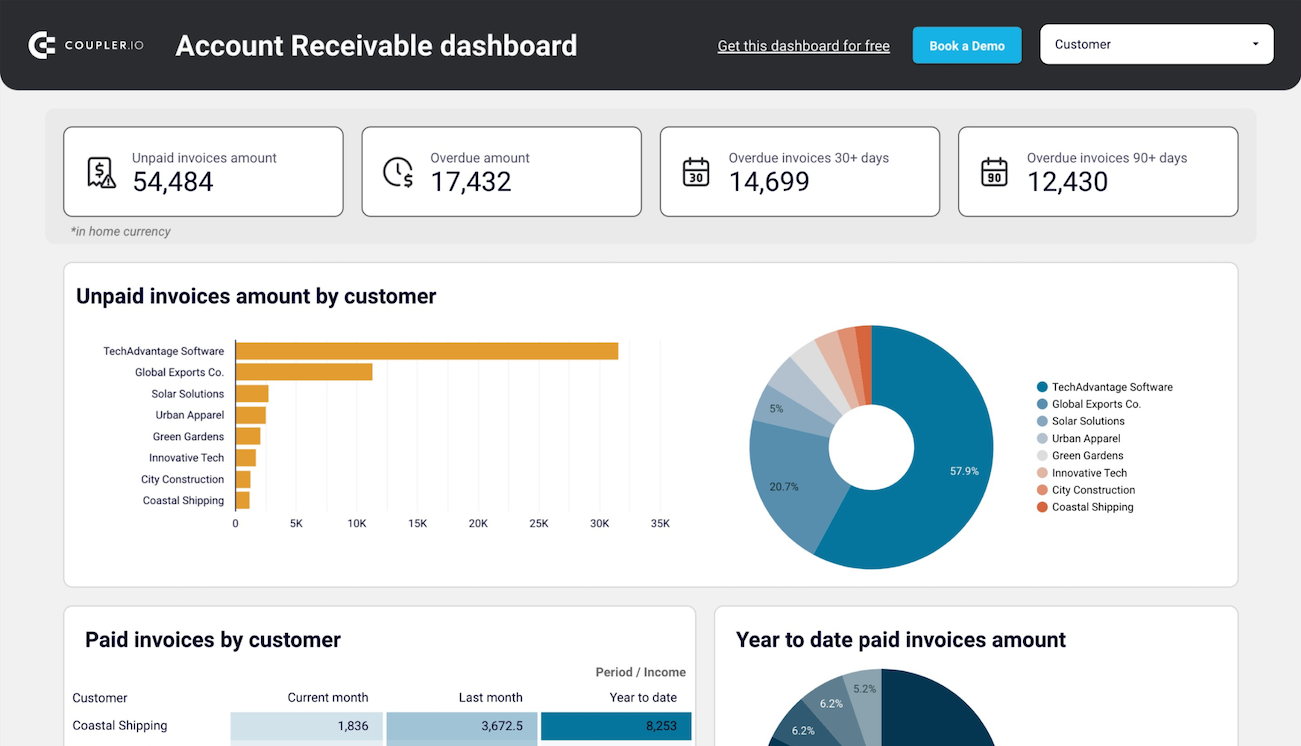
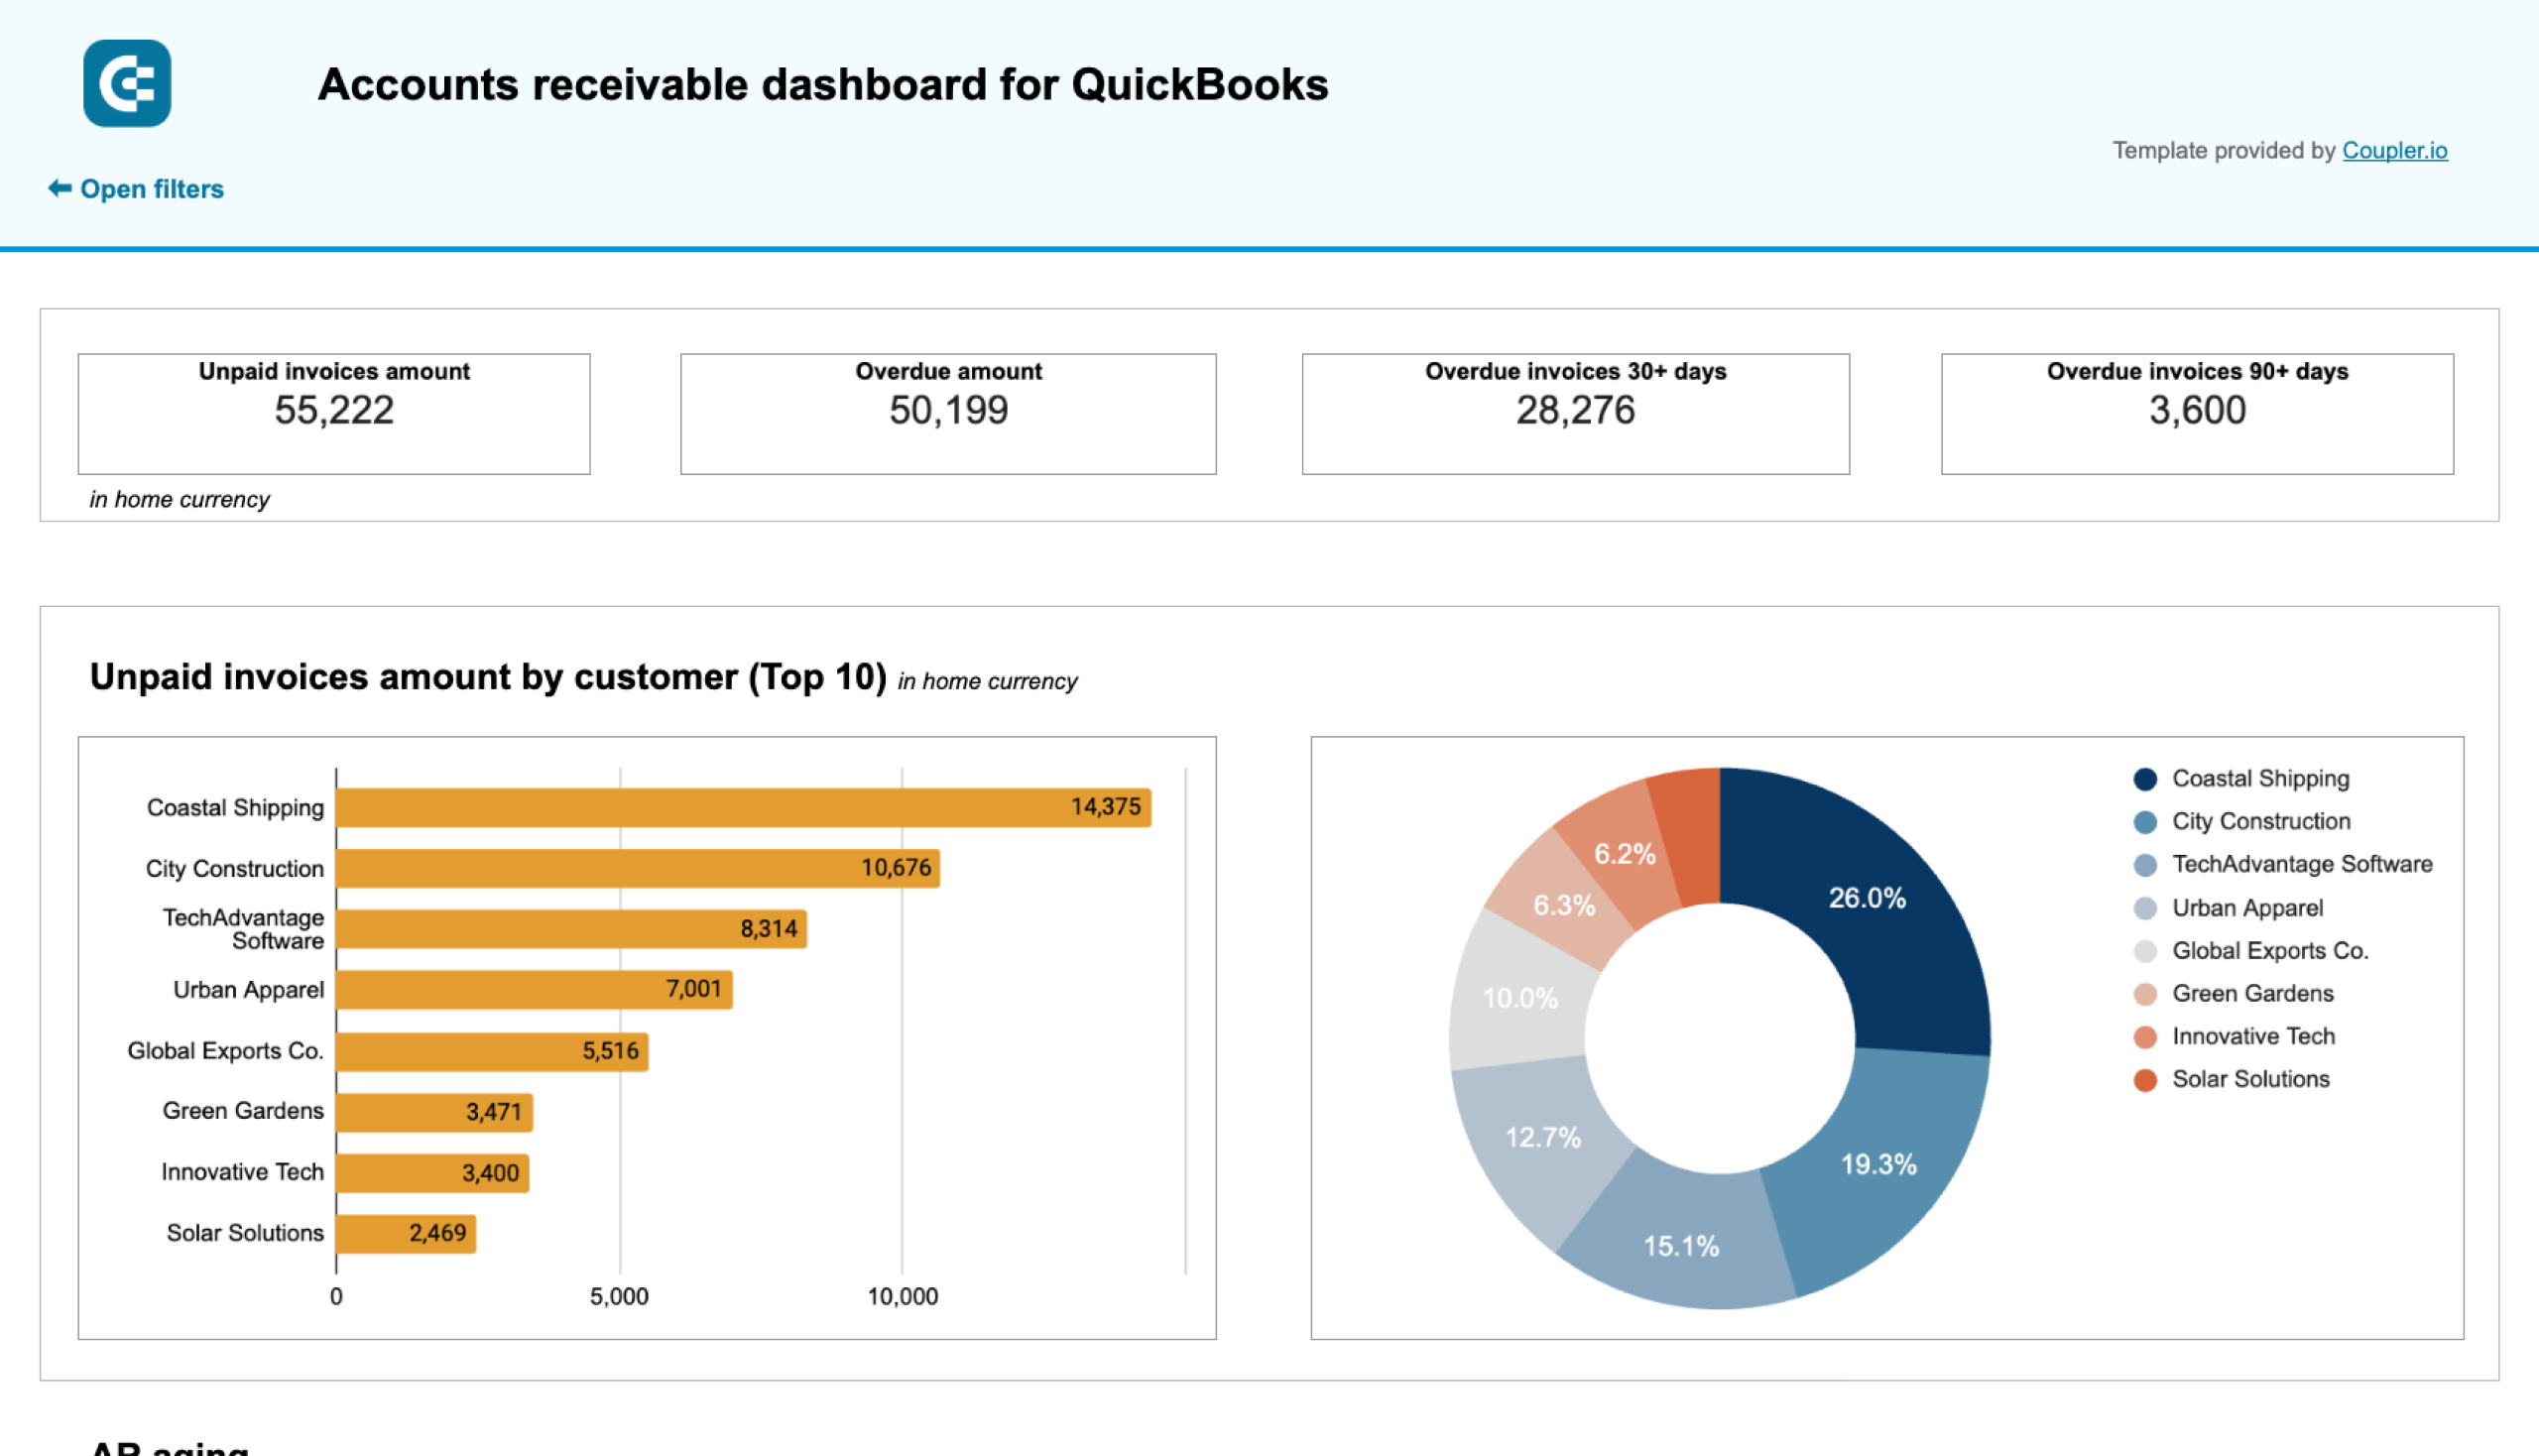
QuickBooks accounts receivable dashboard
This dashboard is designed to help you stay on top of unpaid invoices and cash that is still expected from customers. It brings clarity to receivables management and presents outstanding balances and payment timelines in a single, easy-to-read view.
Accounts receivable dashboard for Quickbooks
 Preview dashboard
Accounts receivable dashboard for Quickbooks
Preview dashboardWhat insights the dashboard provides:
- Outstanding receivables snapshot: View the total amount of unpaid invoices to quickly understand how much money is currently owed to your business.
- Aging analysis: See receivables grouped by aging buckets (for example, current, 1–30 days overdue, 31–60 days overdue) to prioritize follow-ups.
- Invoices by customer: Identify which customers have the highest outstanding balances and how long payments have been overdue.
- Overdue invoices monitoring: Track overdue invoices separately to spot payment delays early and reduce the risk of bad debt.
- Receivables trends over time: Visualize changes in outstanding balances to understand whether receivables are improving or becoming a recurring issue.
How to use
The QuickBooks accounts receivable dashboard is available as a template in Looker Studio and Google Sheets. After connecting your QuickBooks account, data on your QuickBooks accounts receivable dashboard refreshes automatically on the schedule you set. To get started, follow the Setup guide included in the template, and the dashboard will populate with your live QuickBooks receivables data.

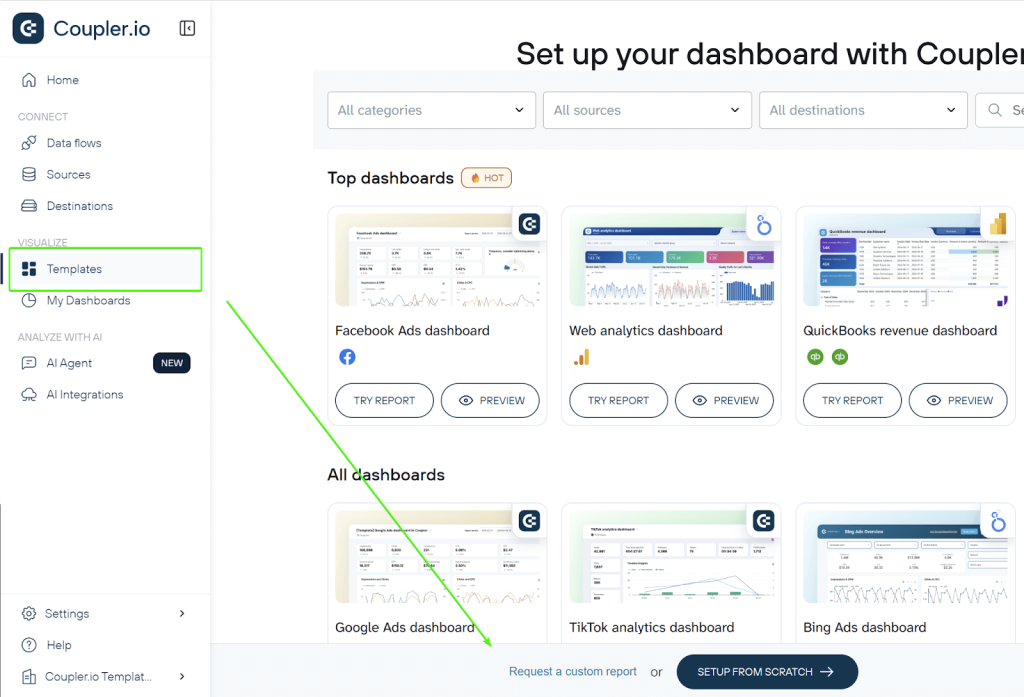
And if there’s no dashboard template for your specific use case, you can always request a custom report and create one from scratch.
To do so, go to your Coupler.io account, open the Templates tab, and select “Request custom report” at the bottom of the screen.
Common QuickBooks data export issues and easy troubleshooting fixes
Exporting data from QuickBooks to Excel is usually straightforward, but users often run into issues with the built-in functionality. Common problems include formatting errors, missing data, grayed-out options, or failed exports. These stem from compatibility glitches, large datasets, or software bugs. Coupler.io helps bypass these challenges. It automates exports, handles larger volumes, customizes fields/filters, and avoids most native limitations like version mismatches or formatting issues.
Common issues with built-in exporting include:
- Compatibility issues: The export may fail, show grayed-out options (only CSV available), or produce errors if QuickBooks and Microsoft Excel versions don’t align. QuickBooks Desktop requires a locally installed desktop version of Microsoft Office (not the web/browser version of Office 365). Compatible versions vary by QuickBooks release (e.g., recent ones support Microsoft 365, Office 2021, 2019, 2016, both 32-bit and 64-bit). Older mentions of Excel 2010/2013/2016 are mostly legacy for Desktop.
Fix: Keep both QuickBooks and Microsoft Office fully updated. Repair Office via Control Panel > Programs > Microsoft Office > Repair. For persistent issues, reinstall Office (ensure desktop version). Run QuickBooks Tool Hub > Program Problems > Quick Fix my Program, or use File Doctor.
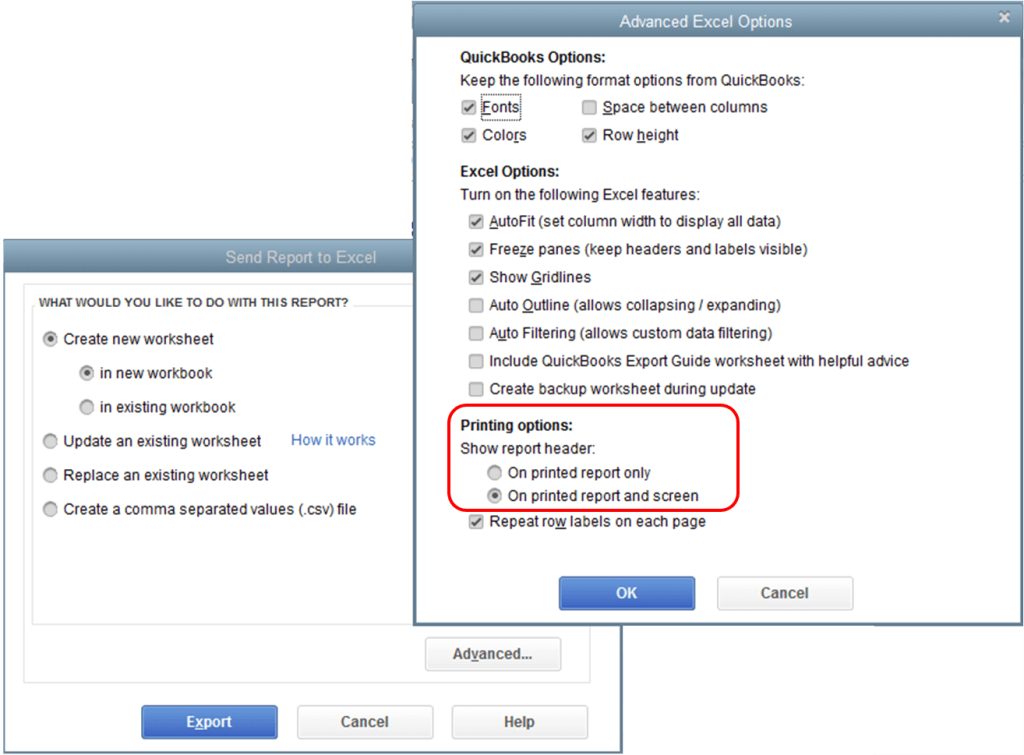
If you are using a newer version of MS Excel and the exported report does not show header information, go to the Printing options section by clicking on the Advanced button. Make sure the On Printed report and screen option are selected.
- File size or large report limitations: Exports can crash, freeze, or fail for very large reports/transactions.
Fix: Export smaller batches (narrow date ranges/filters). Or use Coupler.io for handling bigger datasets without limits.
- Permission errors: You might see “no permission” messages.
Fix: (mainly Desktop): Go to Company > Users > Set up Users and Passwords. Edit your user > Permissions > ensure export to Excel/CSV is enabled.
- Formatting or missing/incorrect data: Headers may disappear in newer Excel versions, columns may misalign, commas may cause CSV issues, or data may appear inaccurate (e.g., wrong totals in some reports).
Fix: In Excel, check Print options (File > Options > Advanced > ensure “Show row and column headers” or similar). Select the correct date ranges/filters in QuickBooks before exporting. Reconcile accounts regularly for accuracy. For commas, export as tab-delimited if needed (though CSV is standard now).
- Other tips: Clear browser cache (for QuickBooks Online) or try incognito mode. Restart your computer. If issues persist, check Intuit’s support for known bugs (e.g., occasional report export glitches reported in 2025).
Built-in exports work well for quick, small tasks (reports/lists/transactions to Excel/CSV/PDF), but for reliability, automation, or complex needs, Coupler.io is a solid alternative. But regardless of the export option you choose, keep your software updated, double-check settings, and test small exports first.
