A Facebook Ads report template is a must-have tool for obtaining insights into your Facebook Ad campaigns. It will help you understand which campaigns are successful and which aren’t, as well as analyze the outcomes of your campaigns properly and efficiently.
However, choosing between native and custom report templates is always a challenge. So, from our experience, we decided to explain when you should go with a native solution and the situations where custom Facebook Ads report templates may be better.
18 best Facebook Ad report templates
We’ve collected top Facebook Ad report templates and organized them into two groups:
- Free Facebook Ad report templates – you can explore and copy them without any signup or registration.
- Paid Facebook Ad report templates – a paid subscription is required to use these templates.
The key selection criteria for the chosen templates are the following:
- Integrability – the templates should be easily integrated with your Facebook Ads account.
- Usability – the templates should be easy to comprehend and use.
- Actionability – the templates should provide you with actionable insights.
Here is what we’ve got.
Facebook Ad report templates available for free
1. Facebook Ads campaign report template
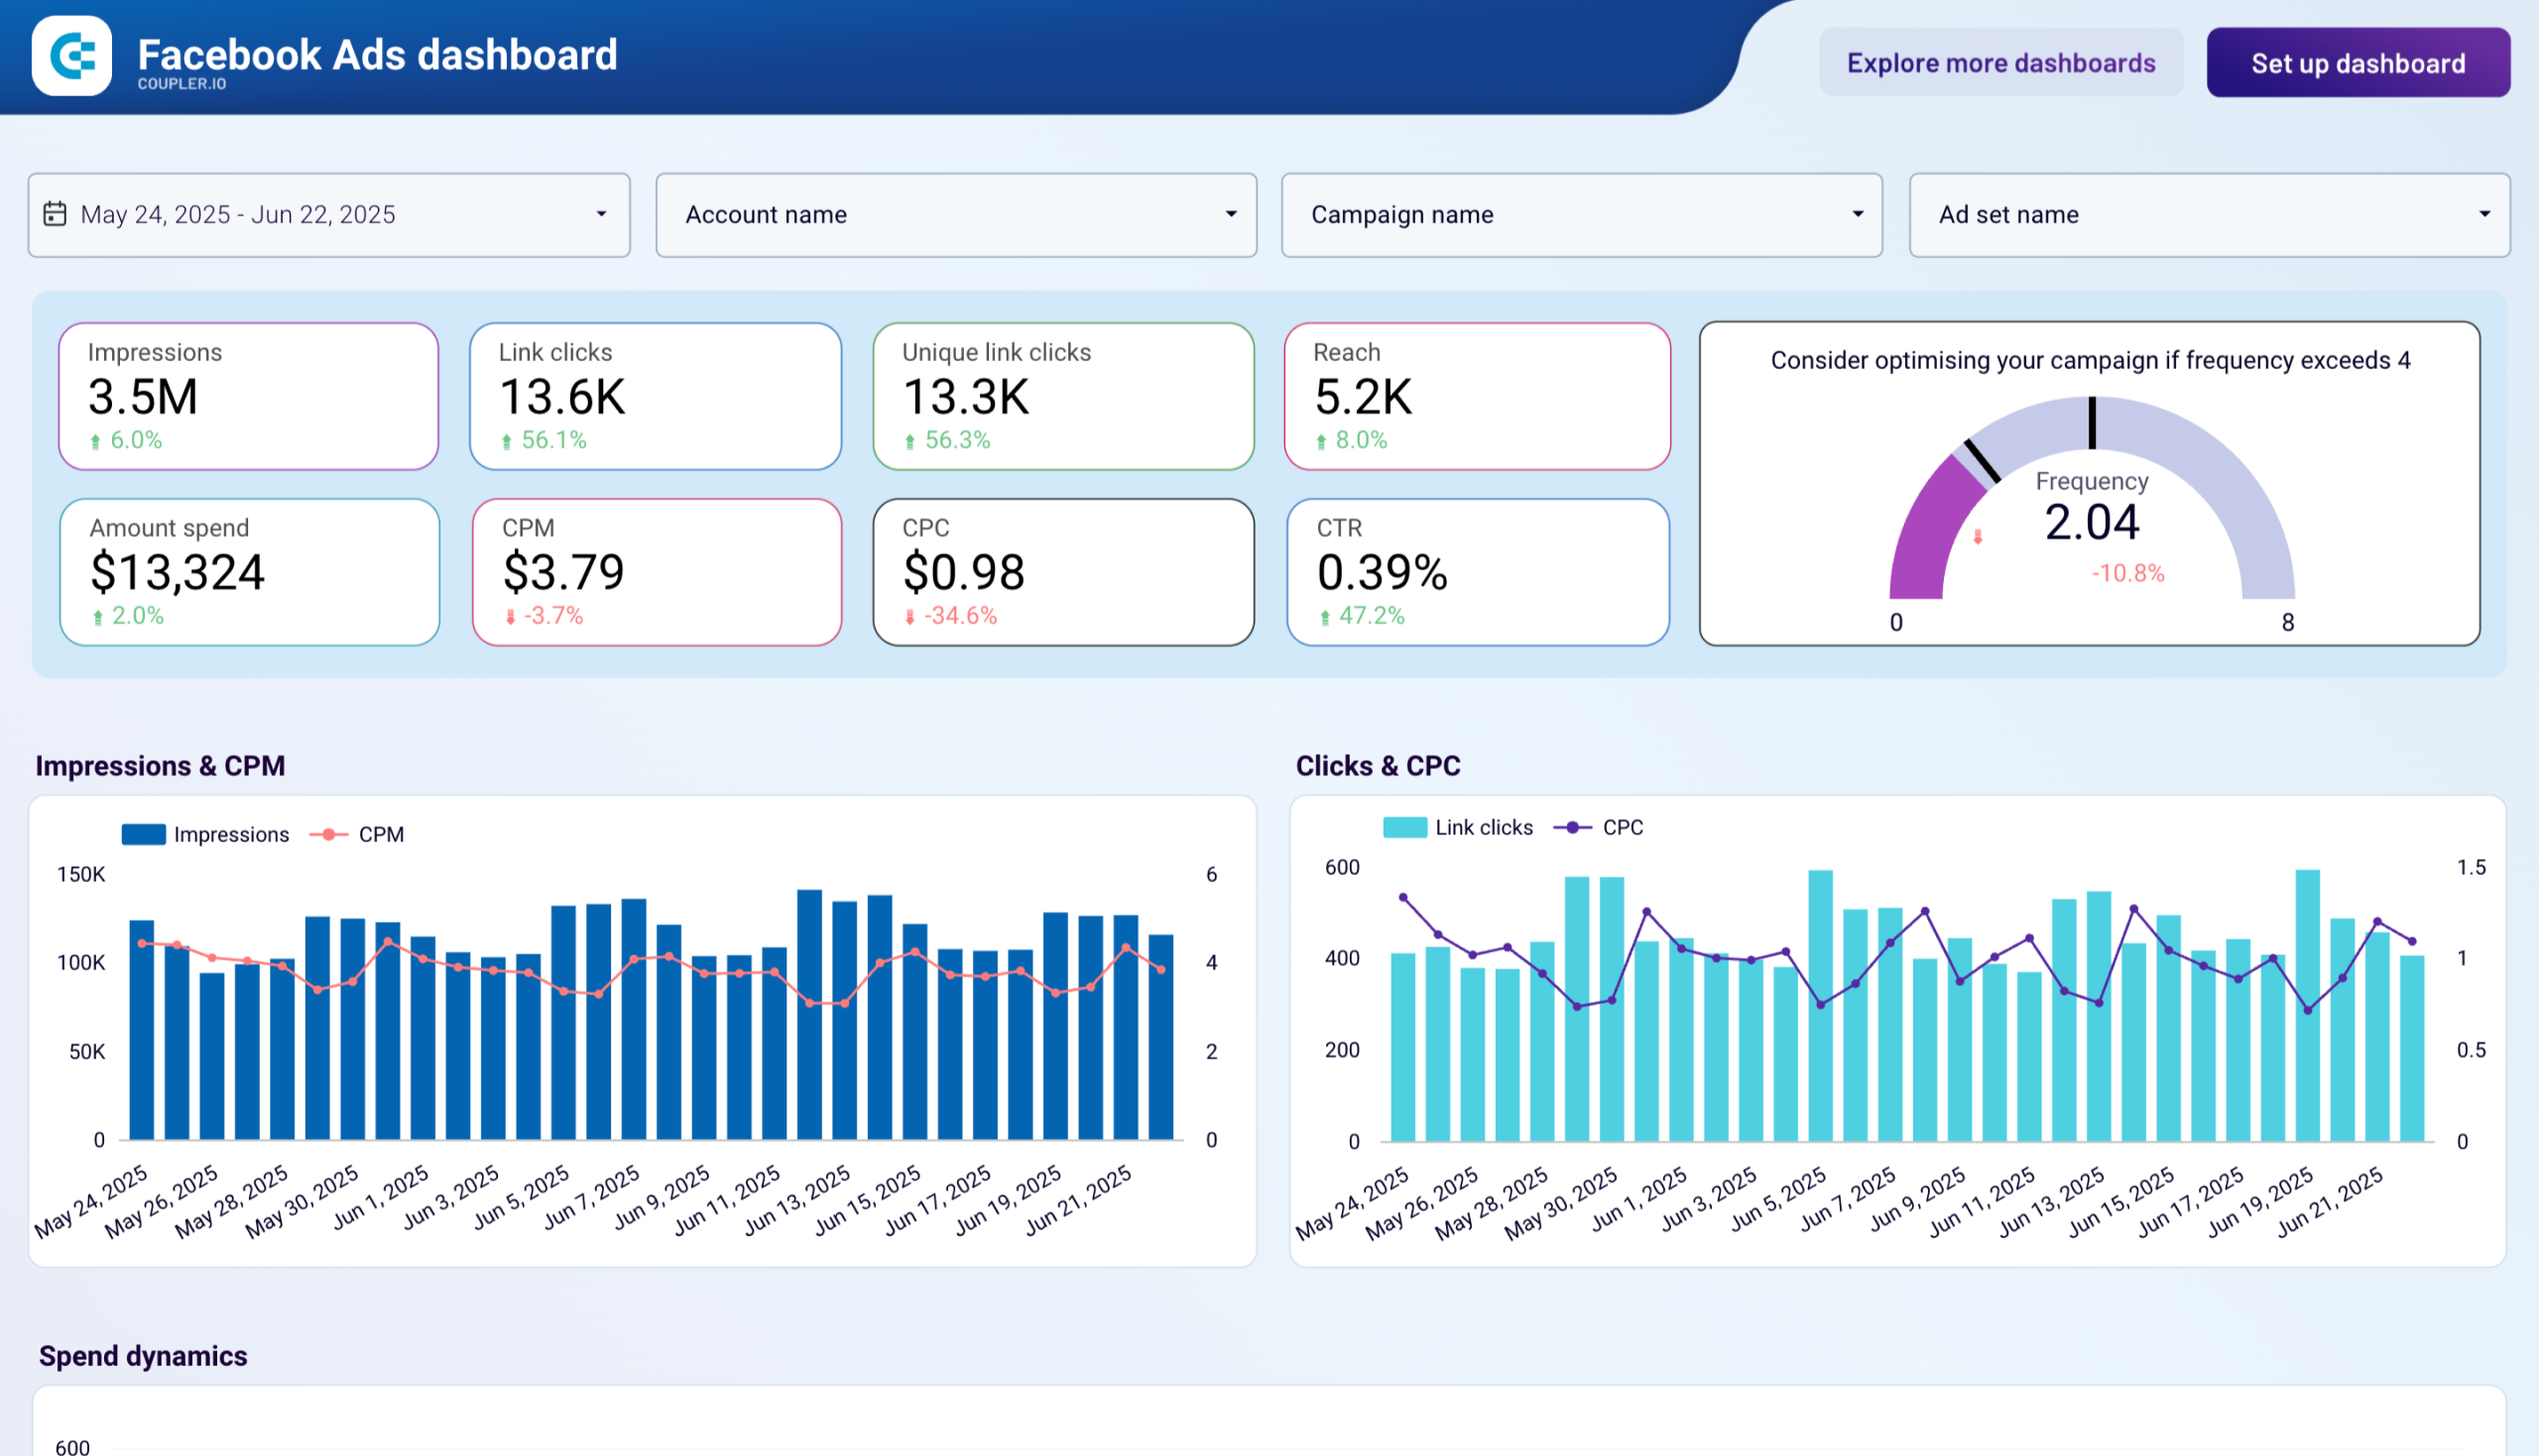
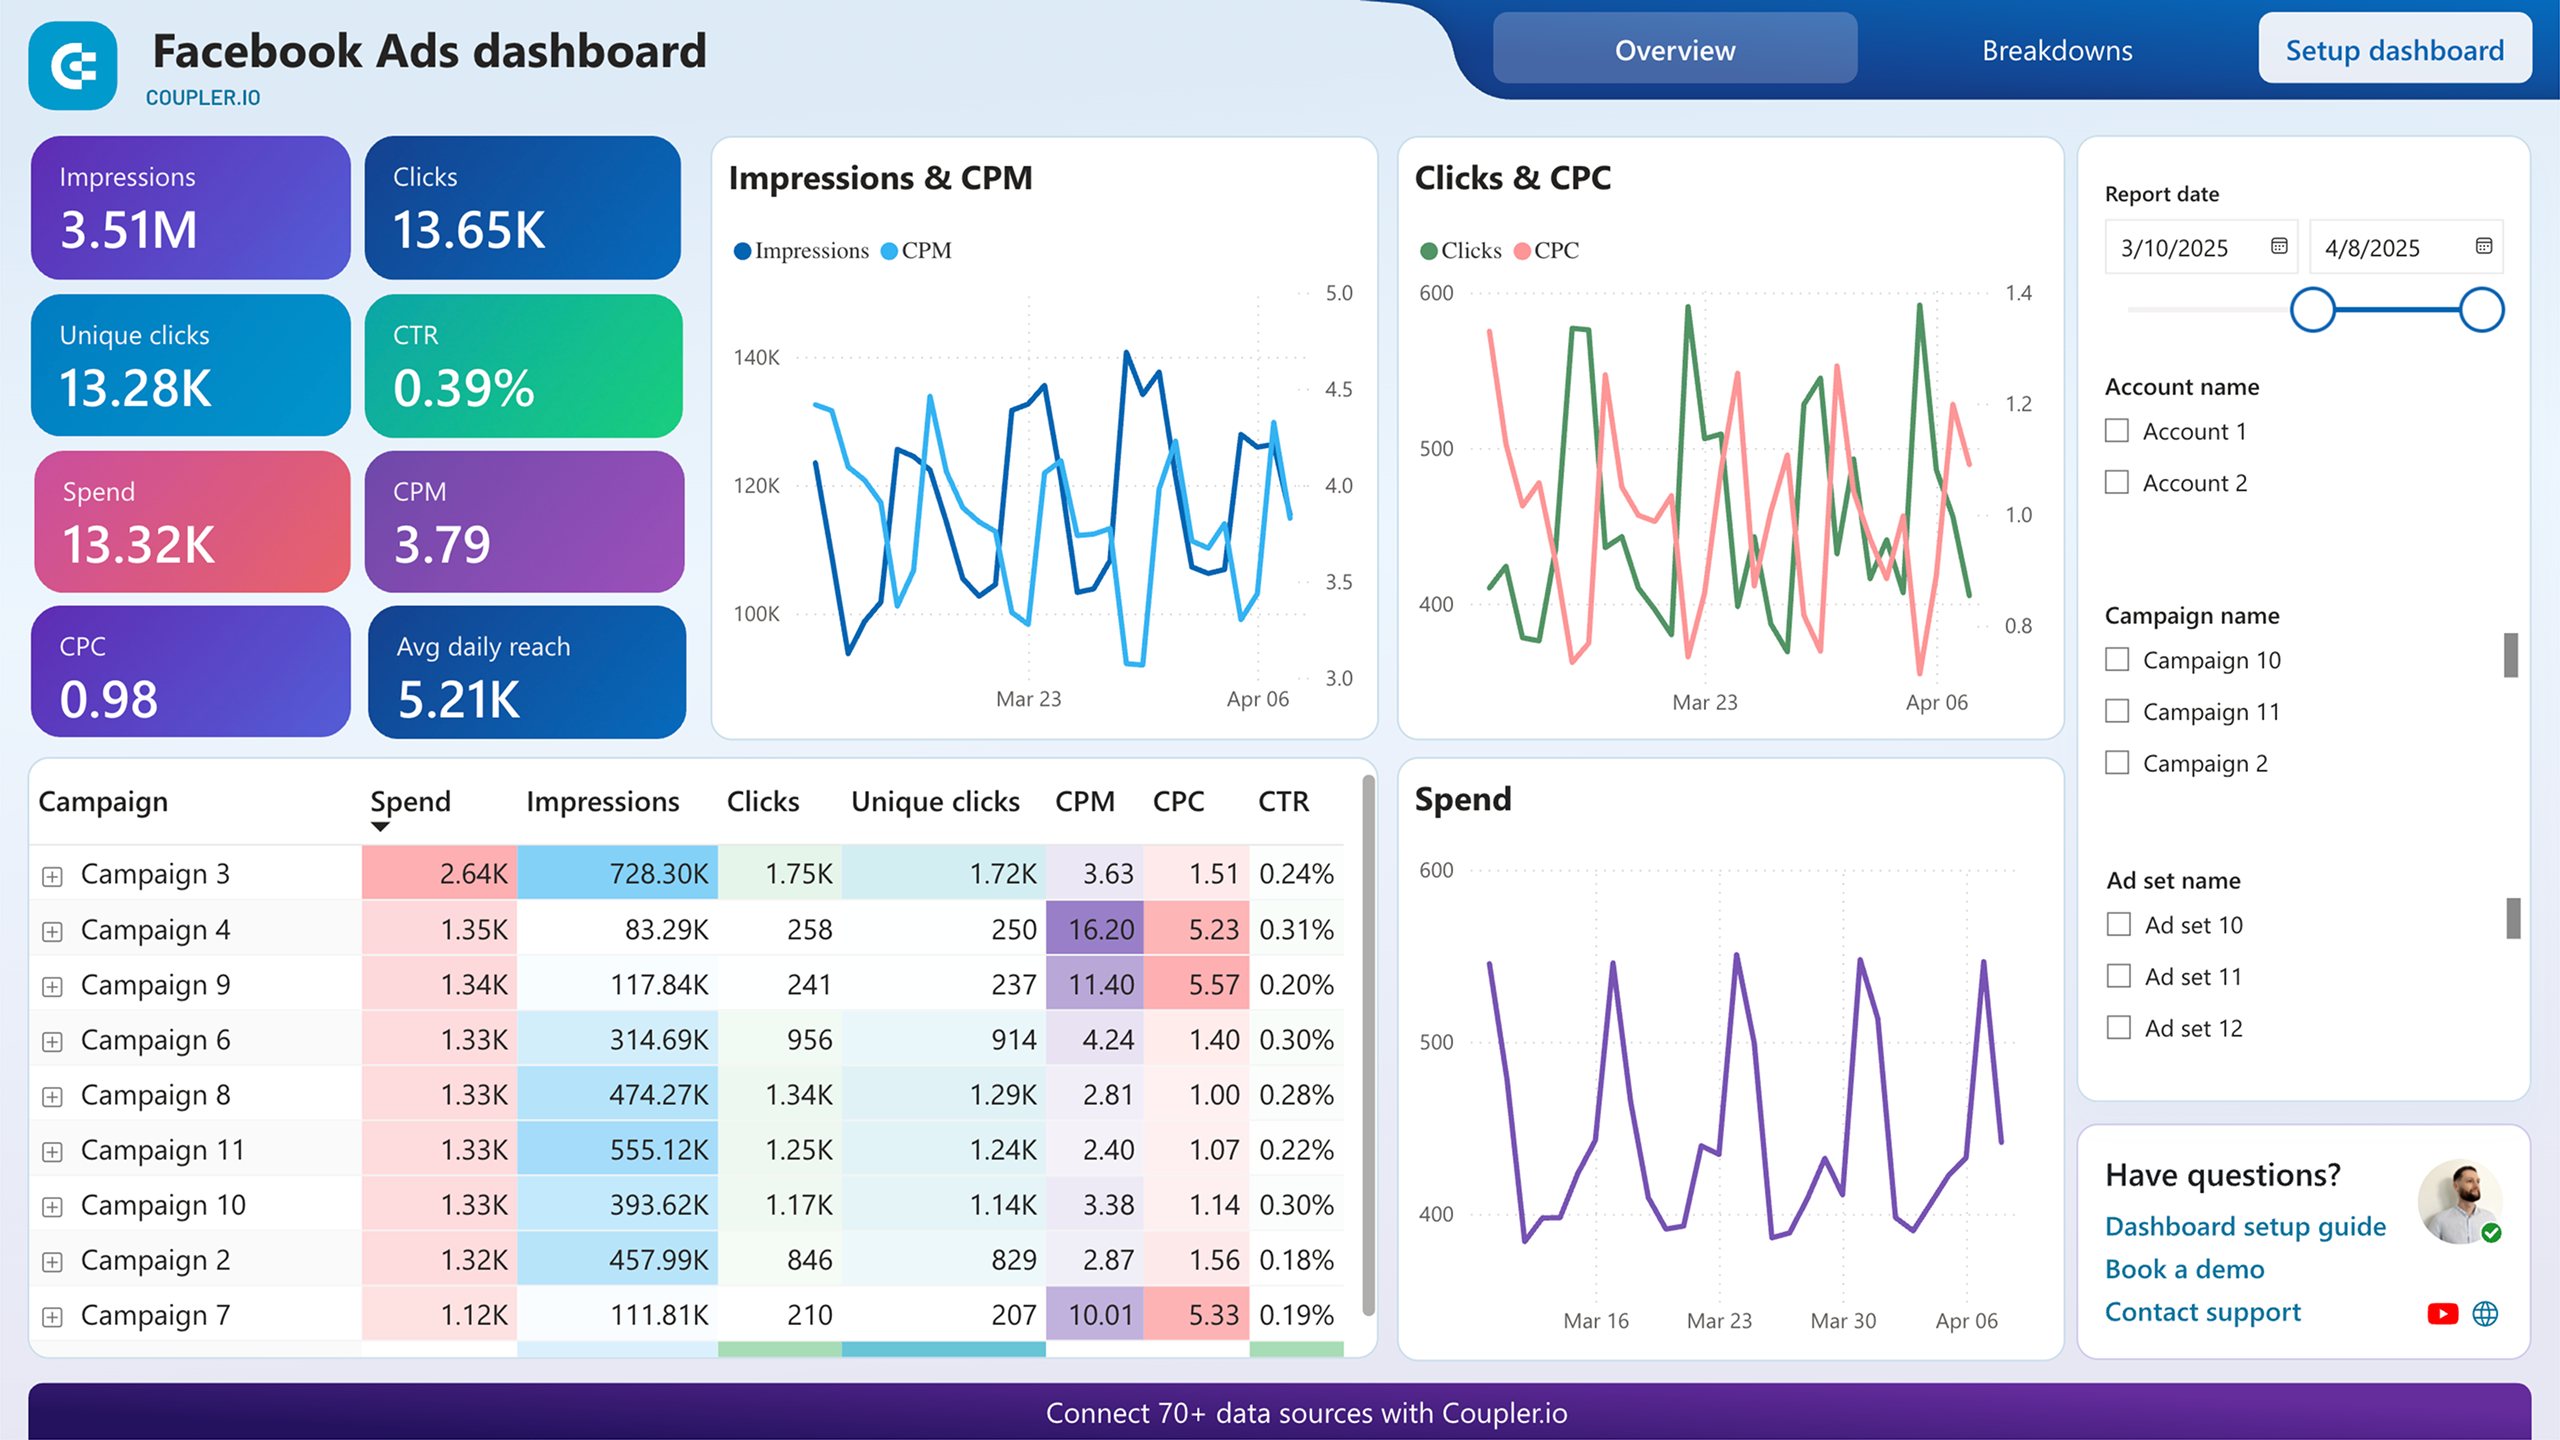
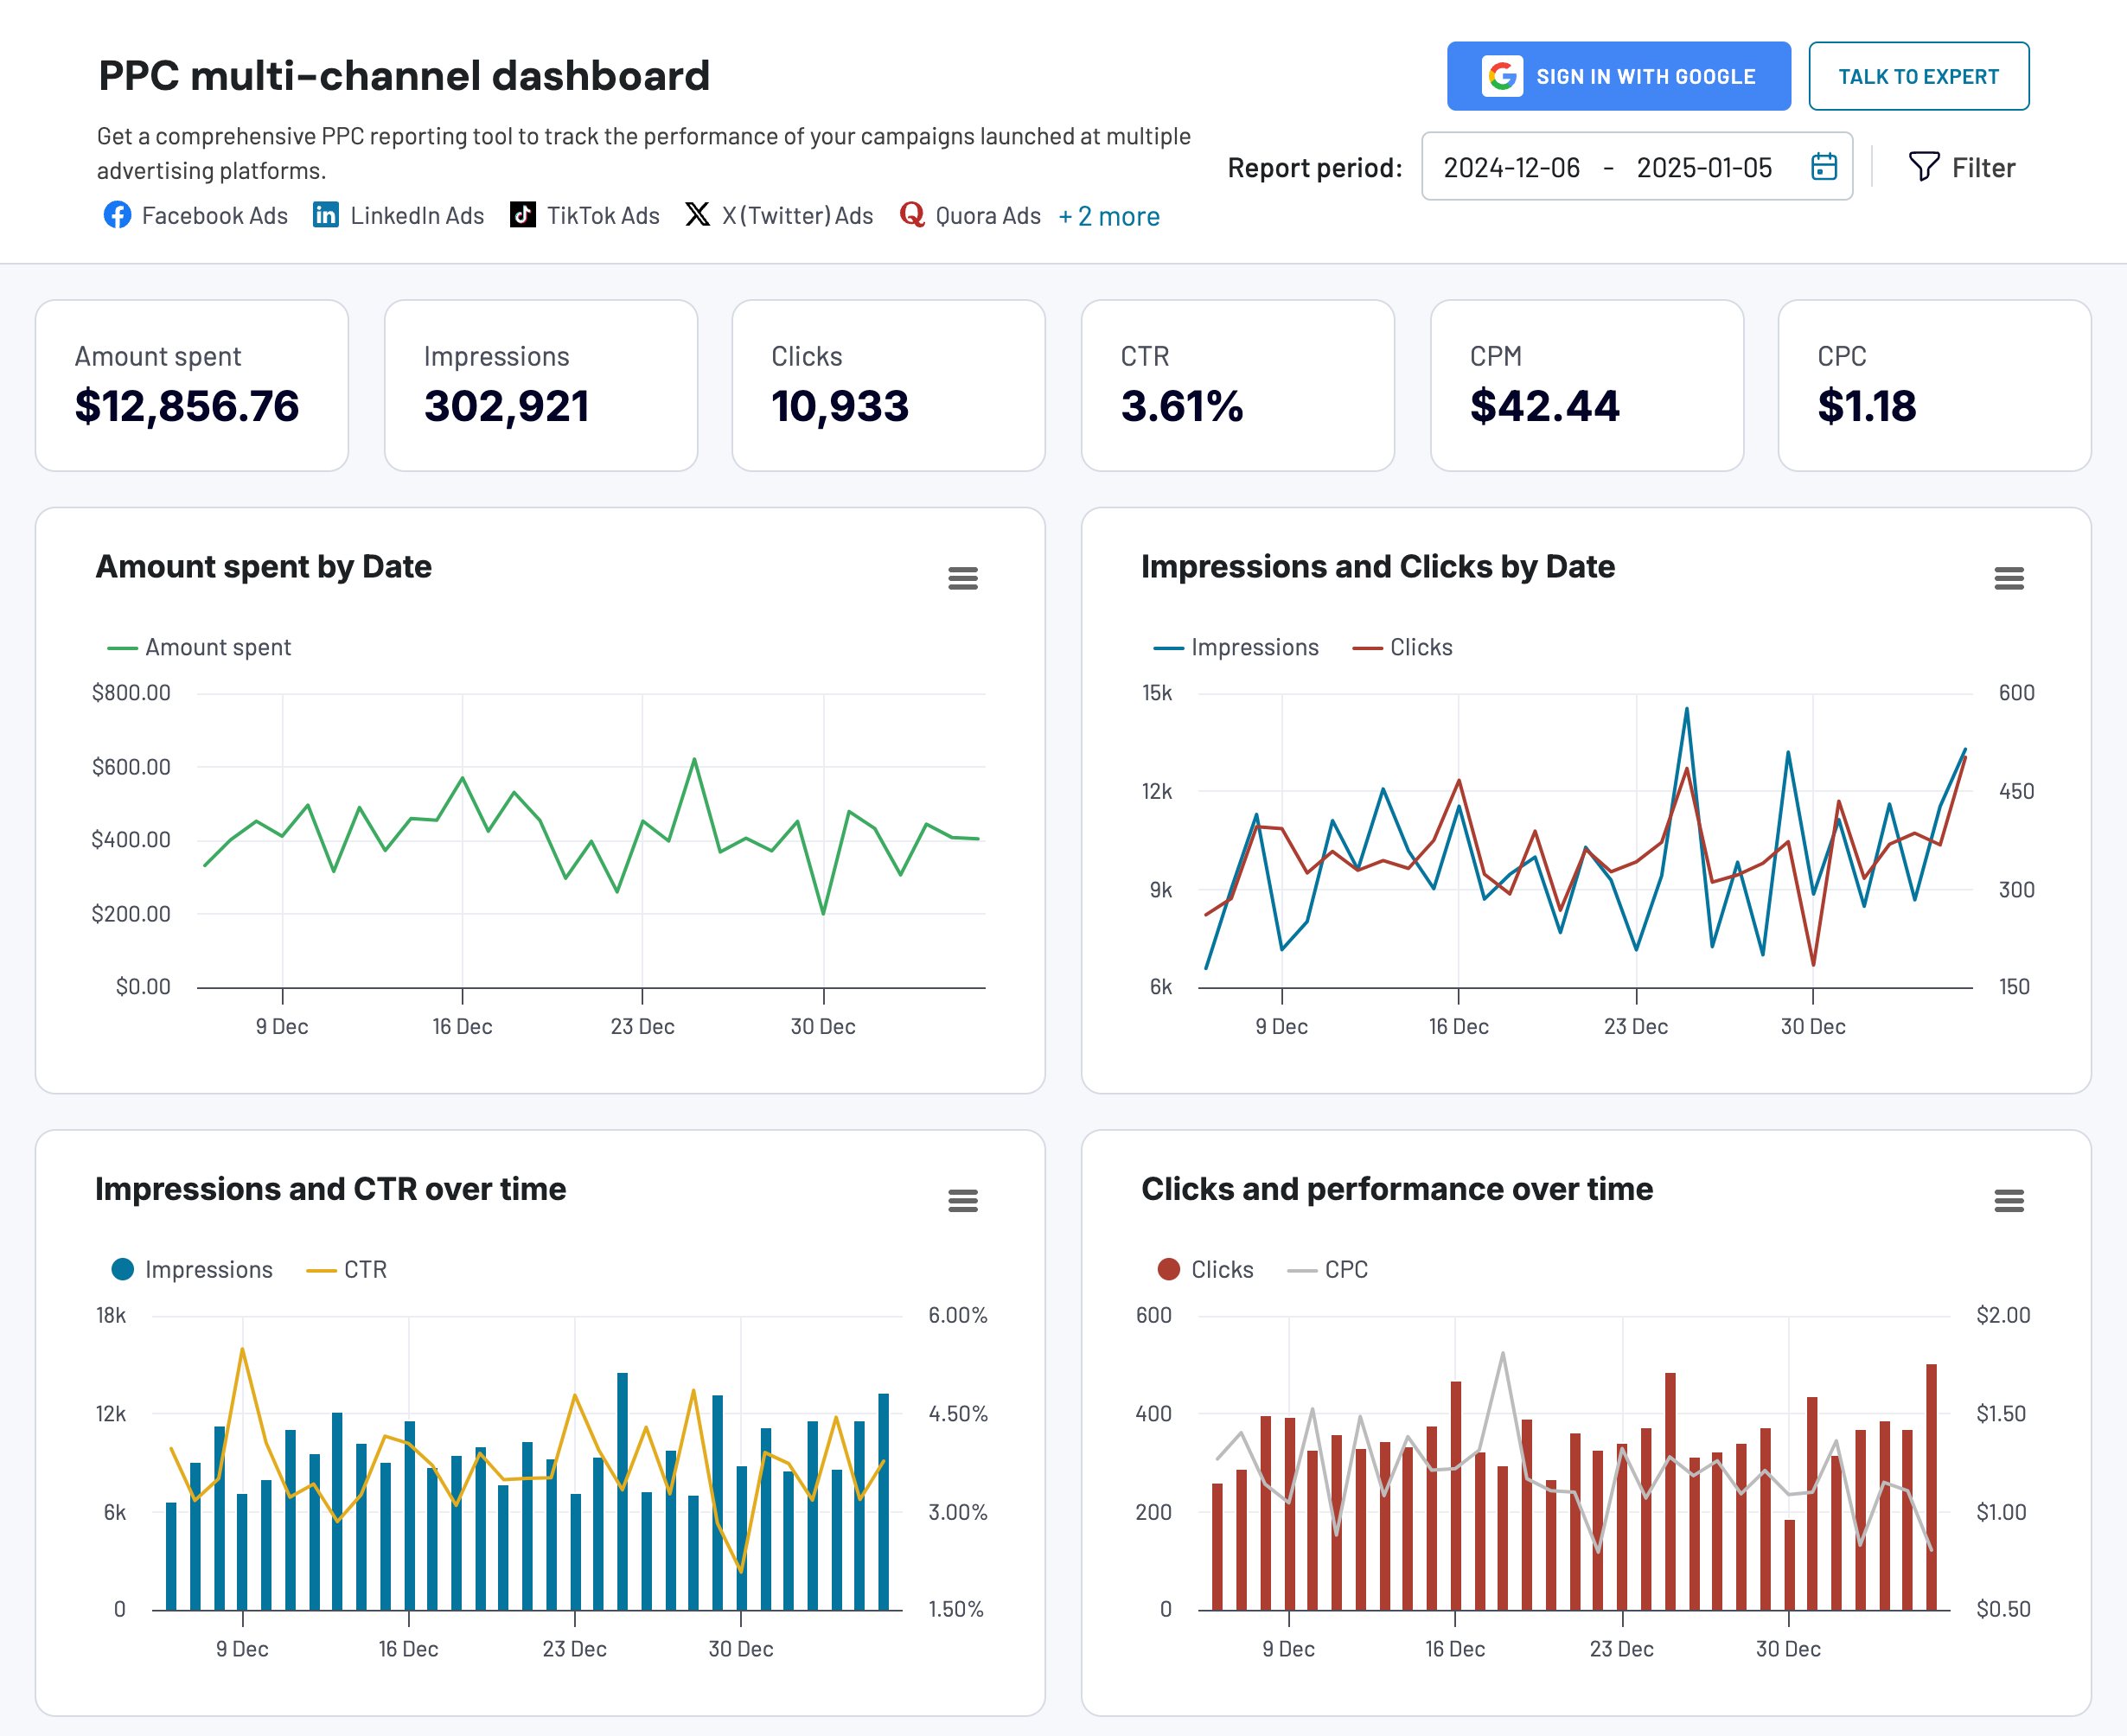
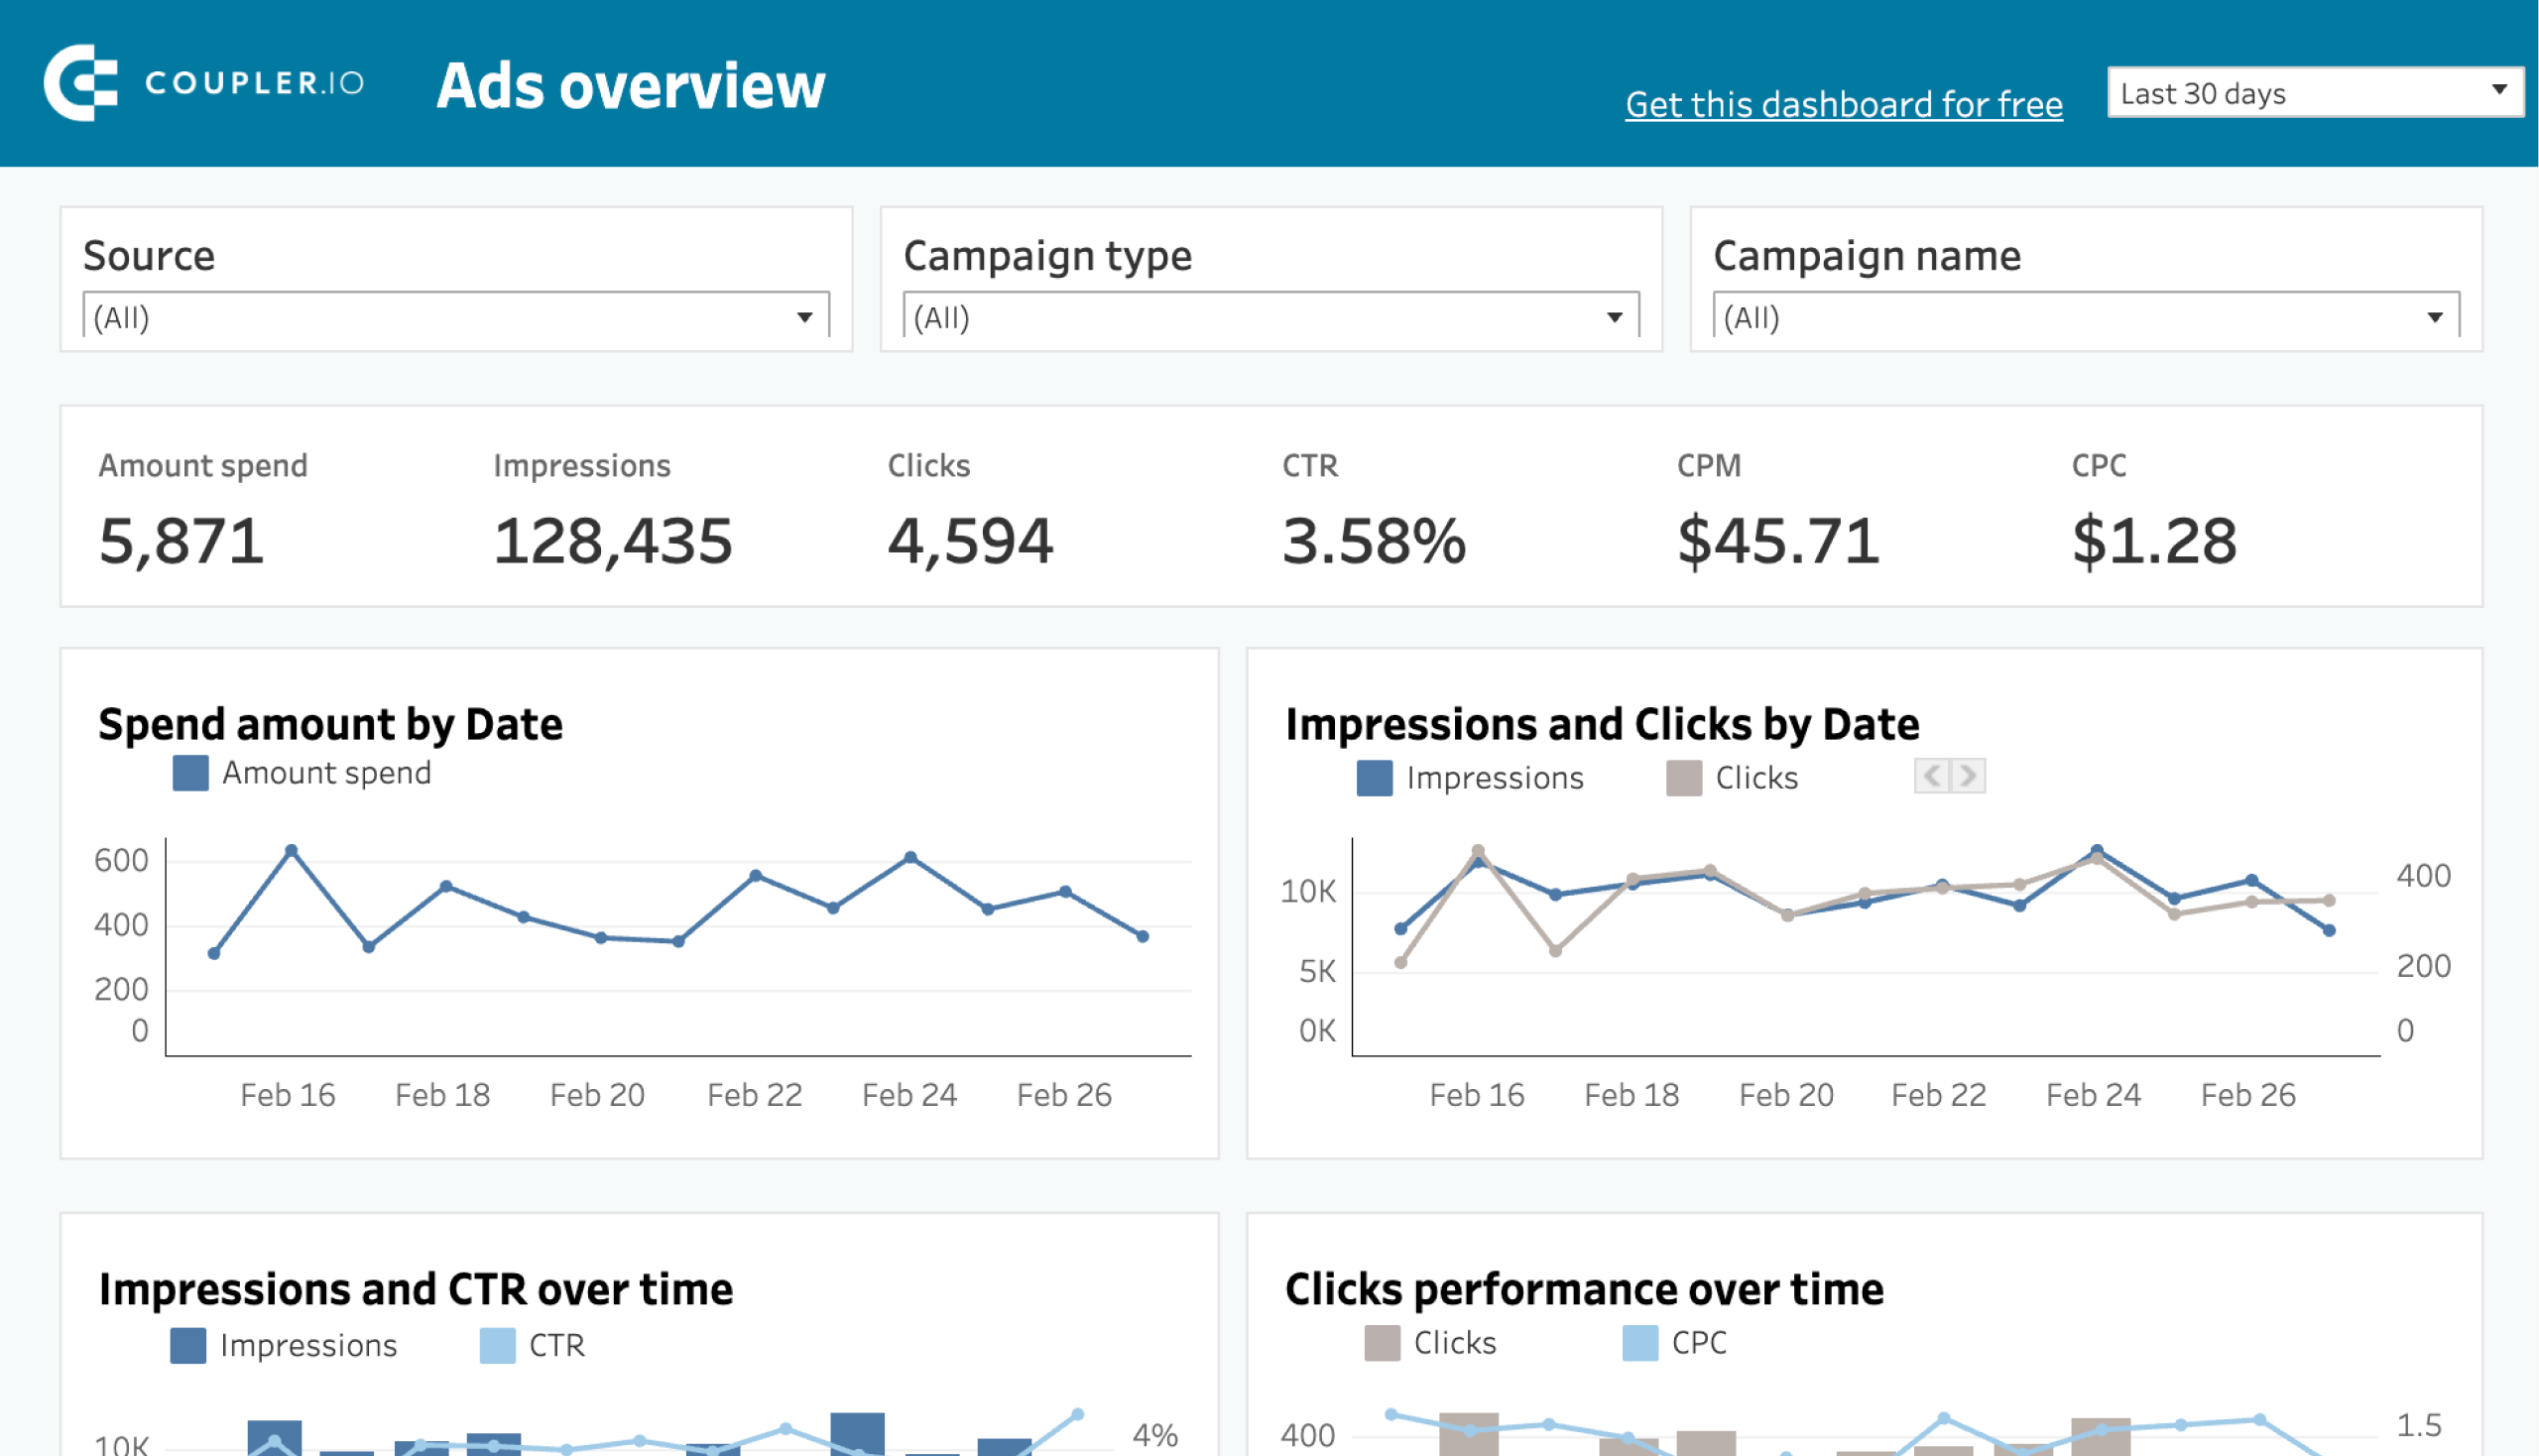
Tracking your campaign results is crucial to know how effective they are and whether any changes are needed. The Facebook Ads dashboard below gives you a complete overview of your campaigns, covering the most important metrics. You can filter your data by campaign to analyze the performance of each of them separately.
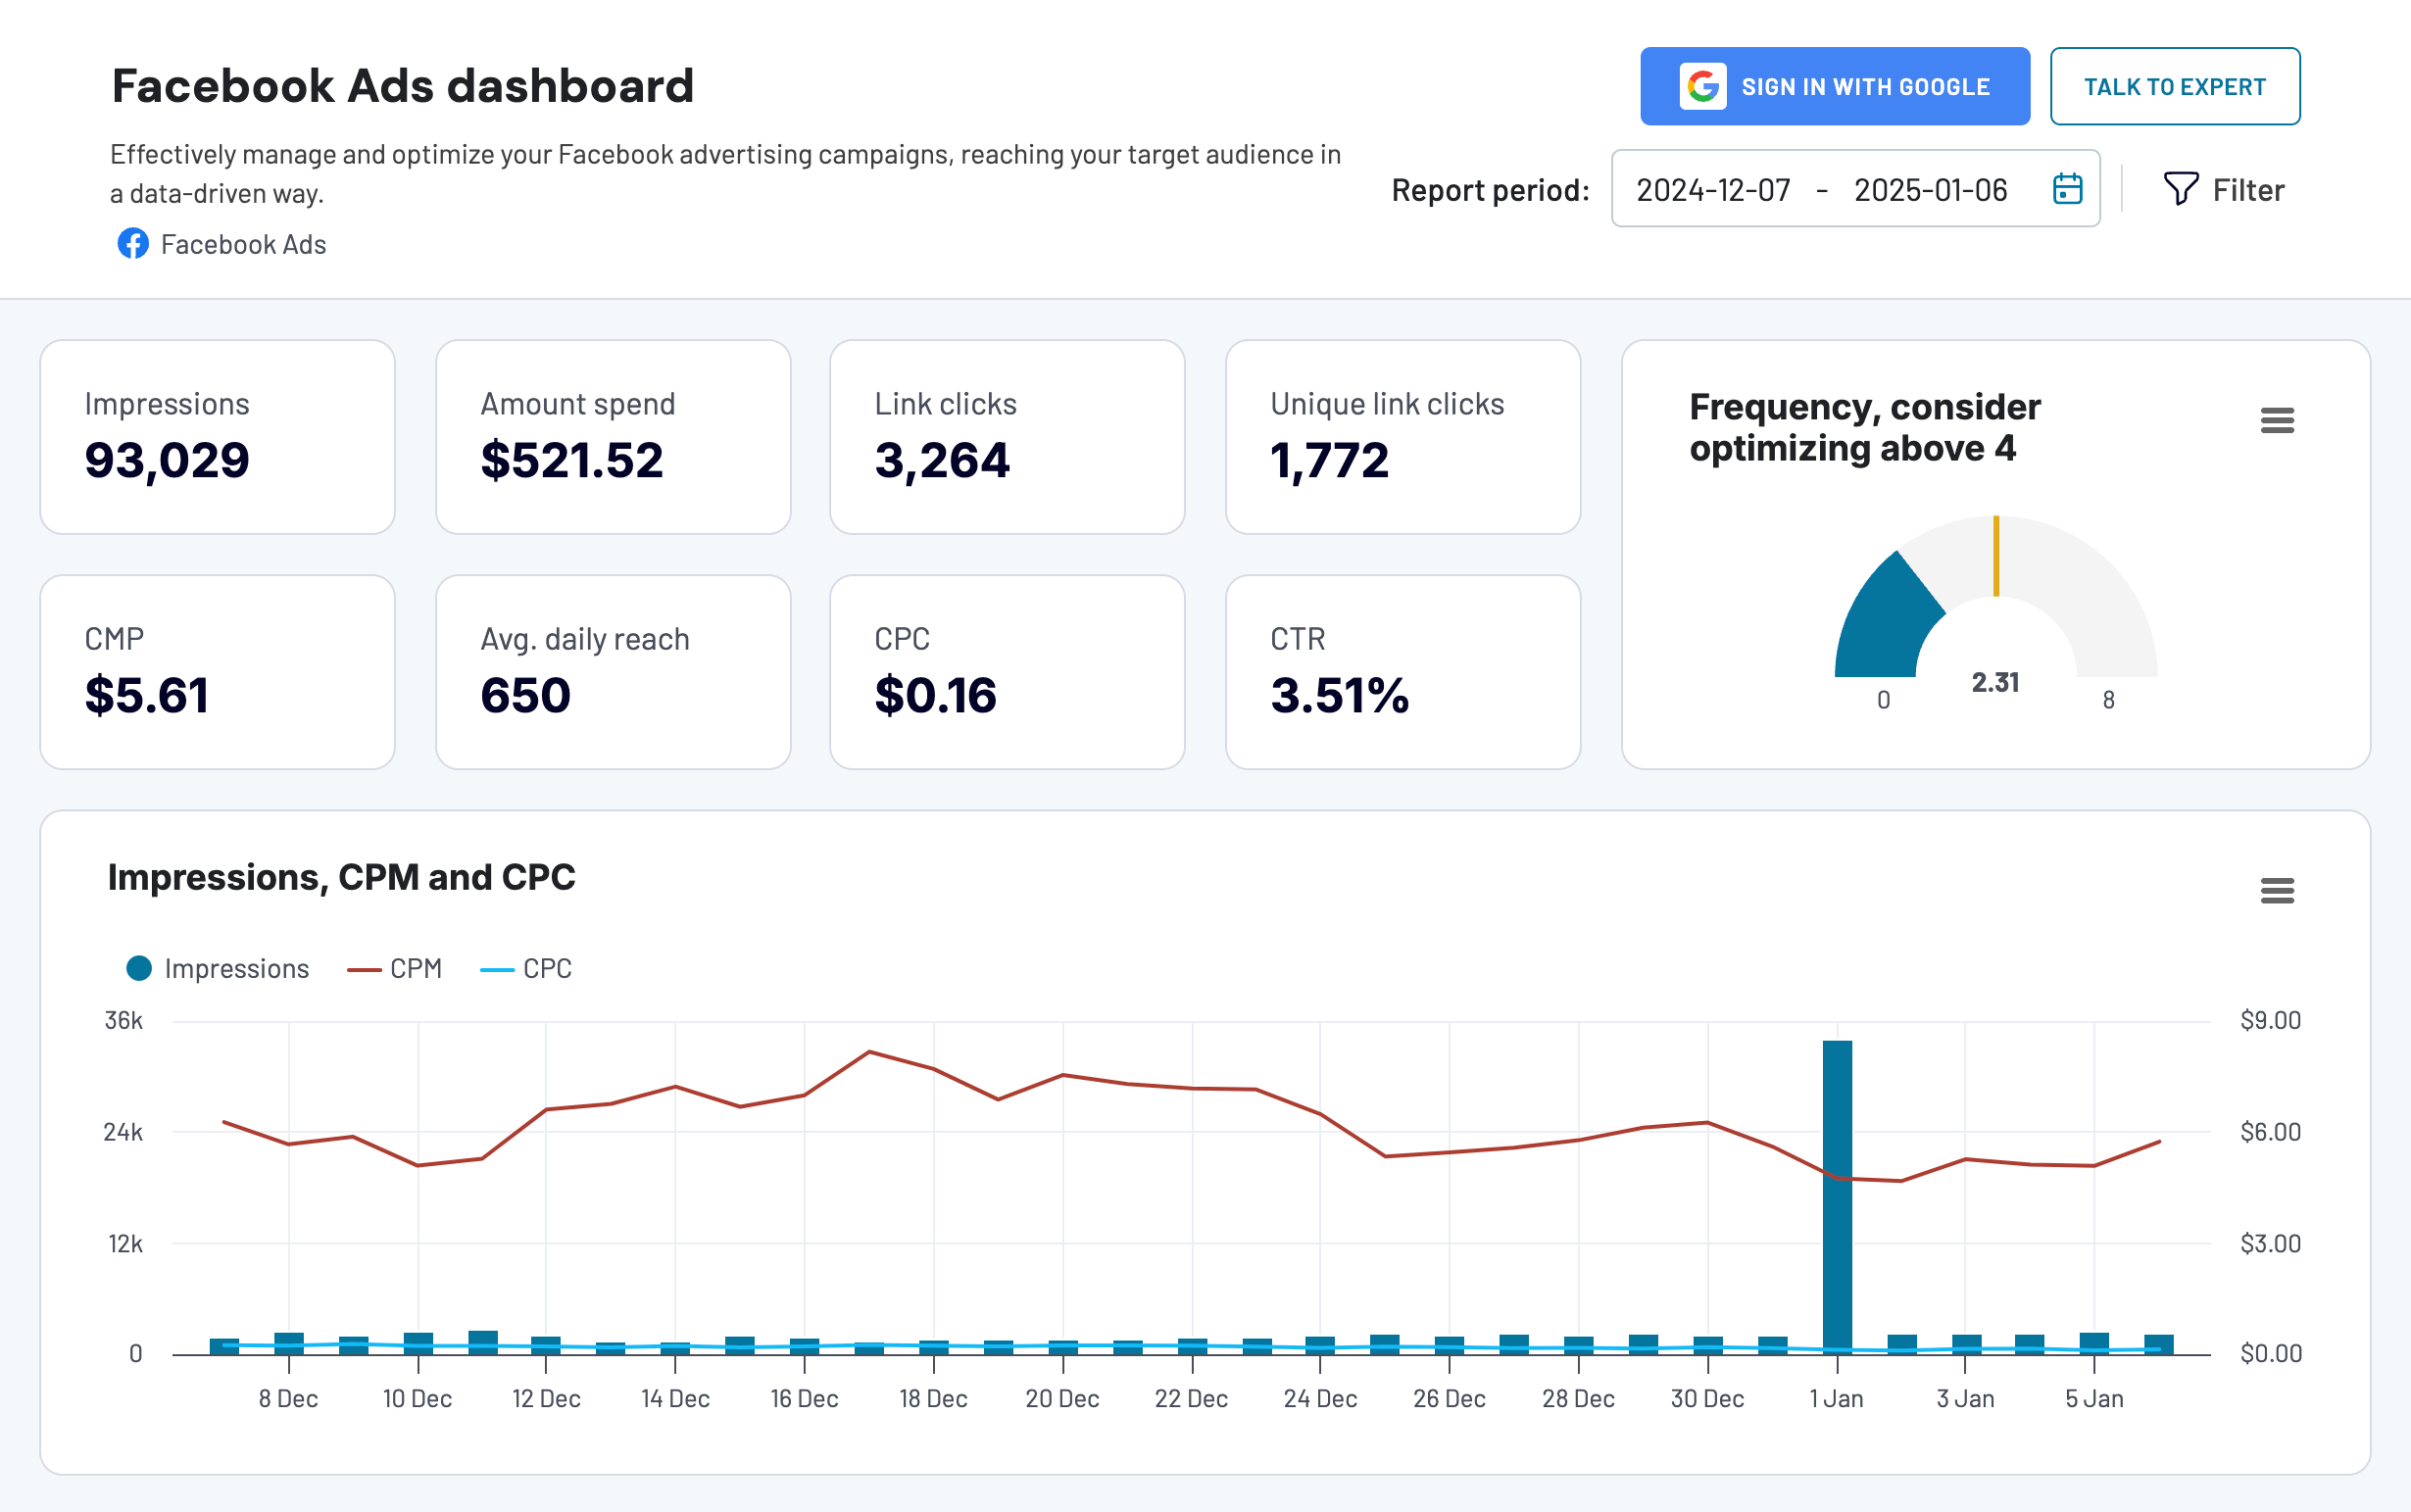
This is an automated template that allows you to instantly visualize your data. You just need to connect your ad account and the destination app account, and you will get a copy of this report with your Facebook Ads metrics.
The best thing about this dashboard is that it’s self-updating. It’s powered by Coupler.io, a reporting automation solution, that regularly extracts fresh data from Facebook Ads and updates the metrics in the dashboard. You can specify a custom schedule for the updates and refresh the dashboard as often as every 15 minutes.
This will help you keep track of the key metrics in near real time, conduct continuous analysis, and make sure your marketing efforts bring good results.
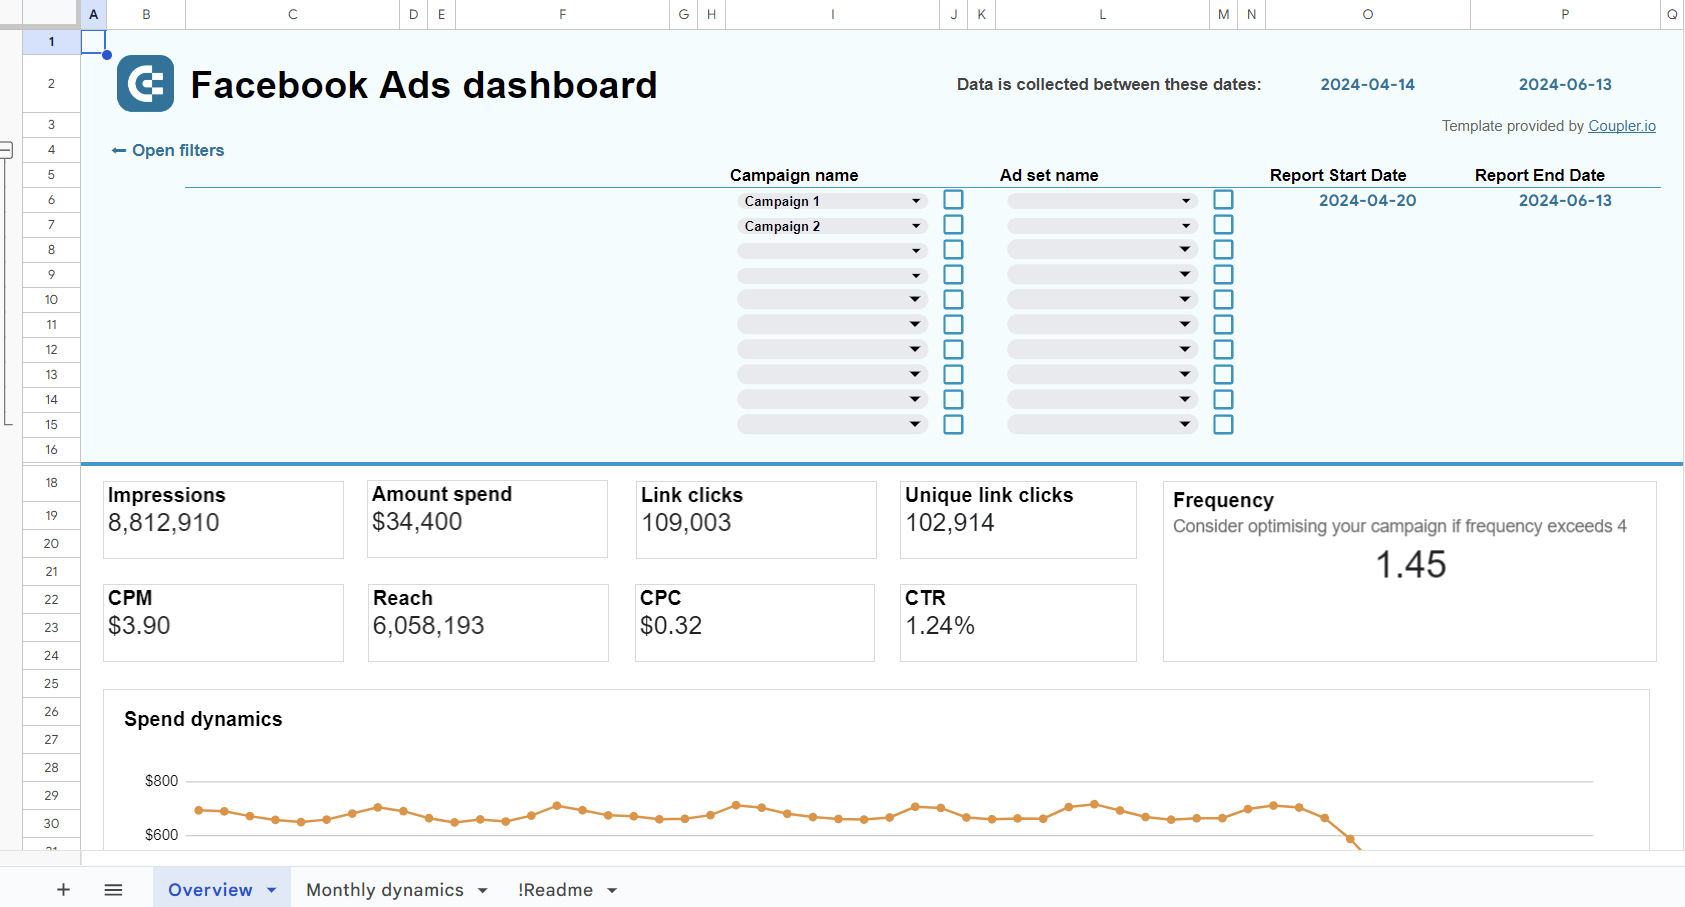
If you prefer using external tools for reporting and dashboarding, check out this template for Looker Studio, Power BI, and Google Sheets. Each is equipped with the Coupler.io Facebook Ads connector to automate your Facebook Ads data flow.


Template rating
| Integrability | ⭐⭐⭐⭐⭐ |
| Usability | ⭐⭐⭐⭐⭐ |
| Actionability | ⭐⭐⭐⭐⭐ |
2. Facebook Ads leads breakdown report template
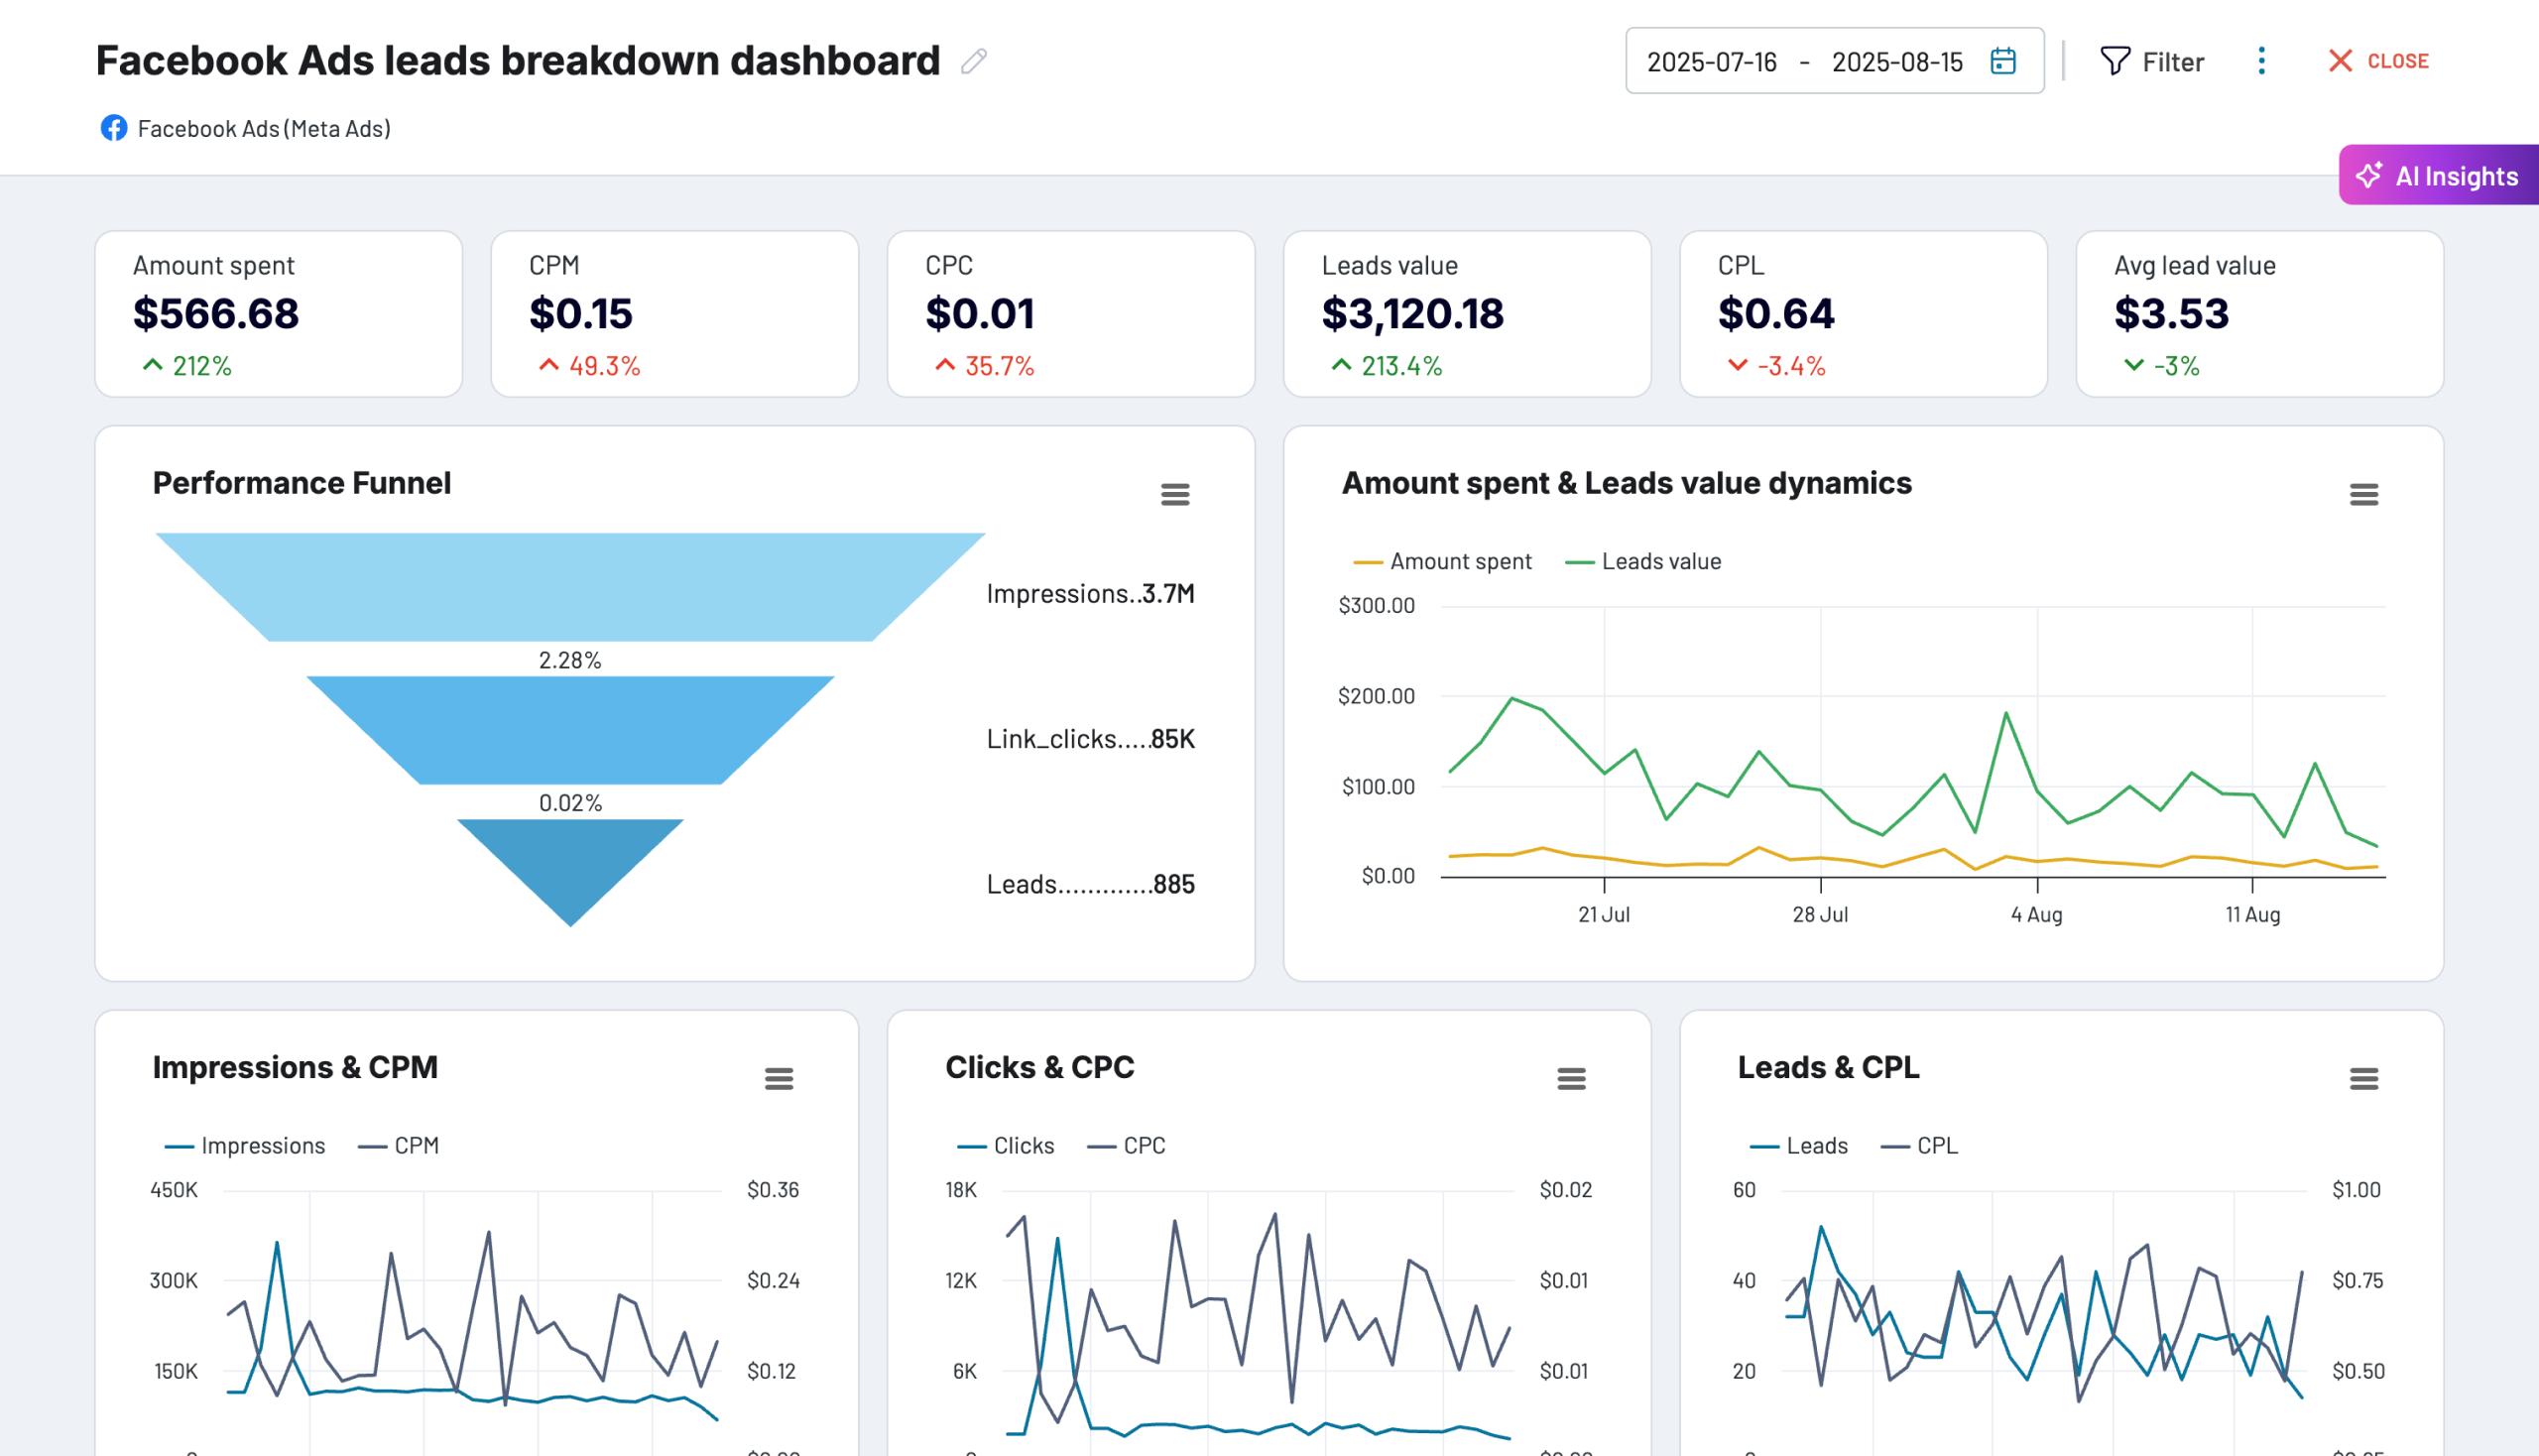
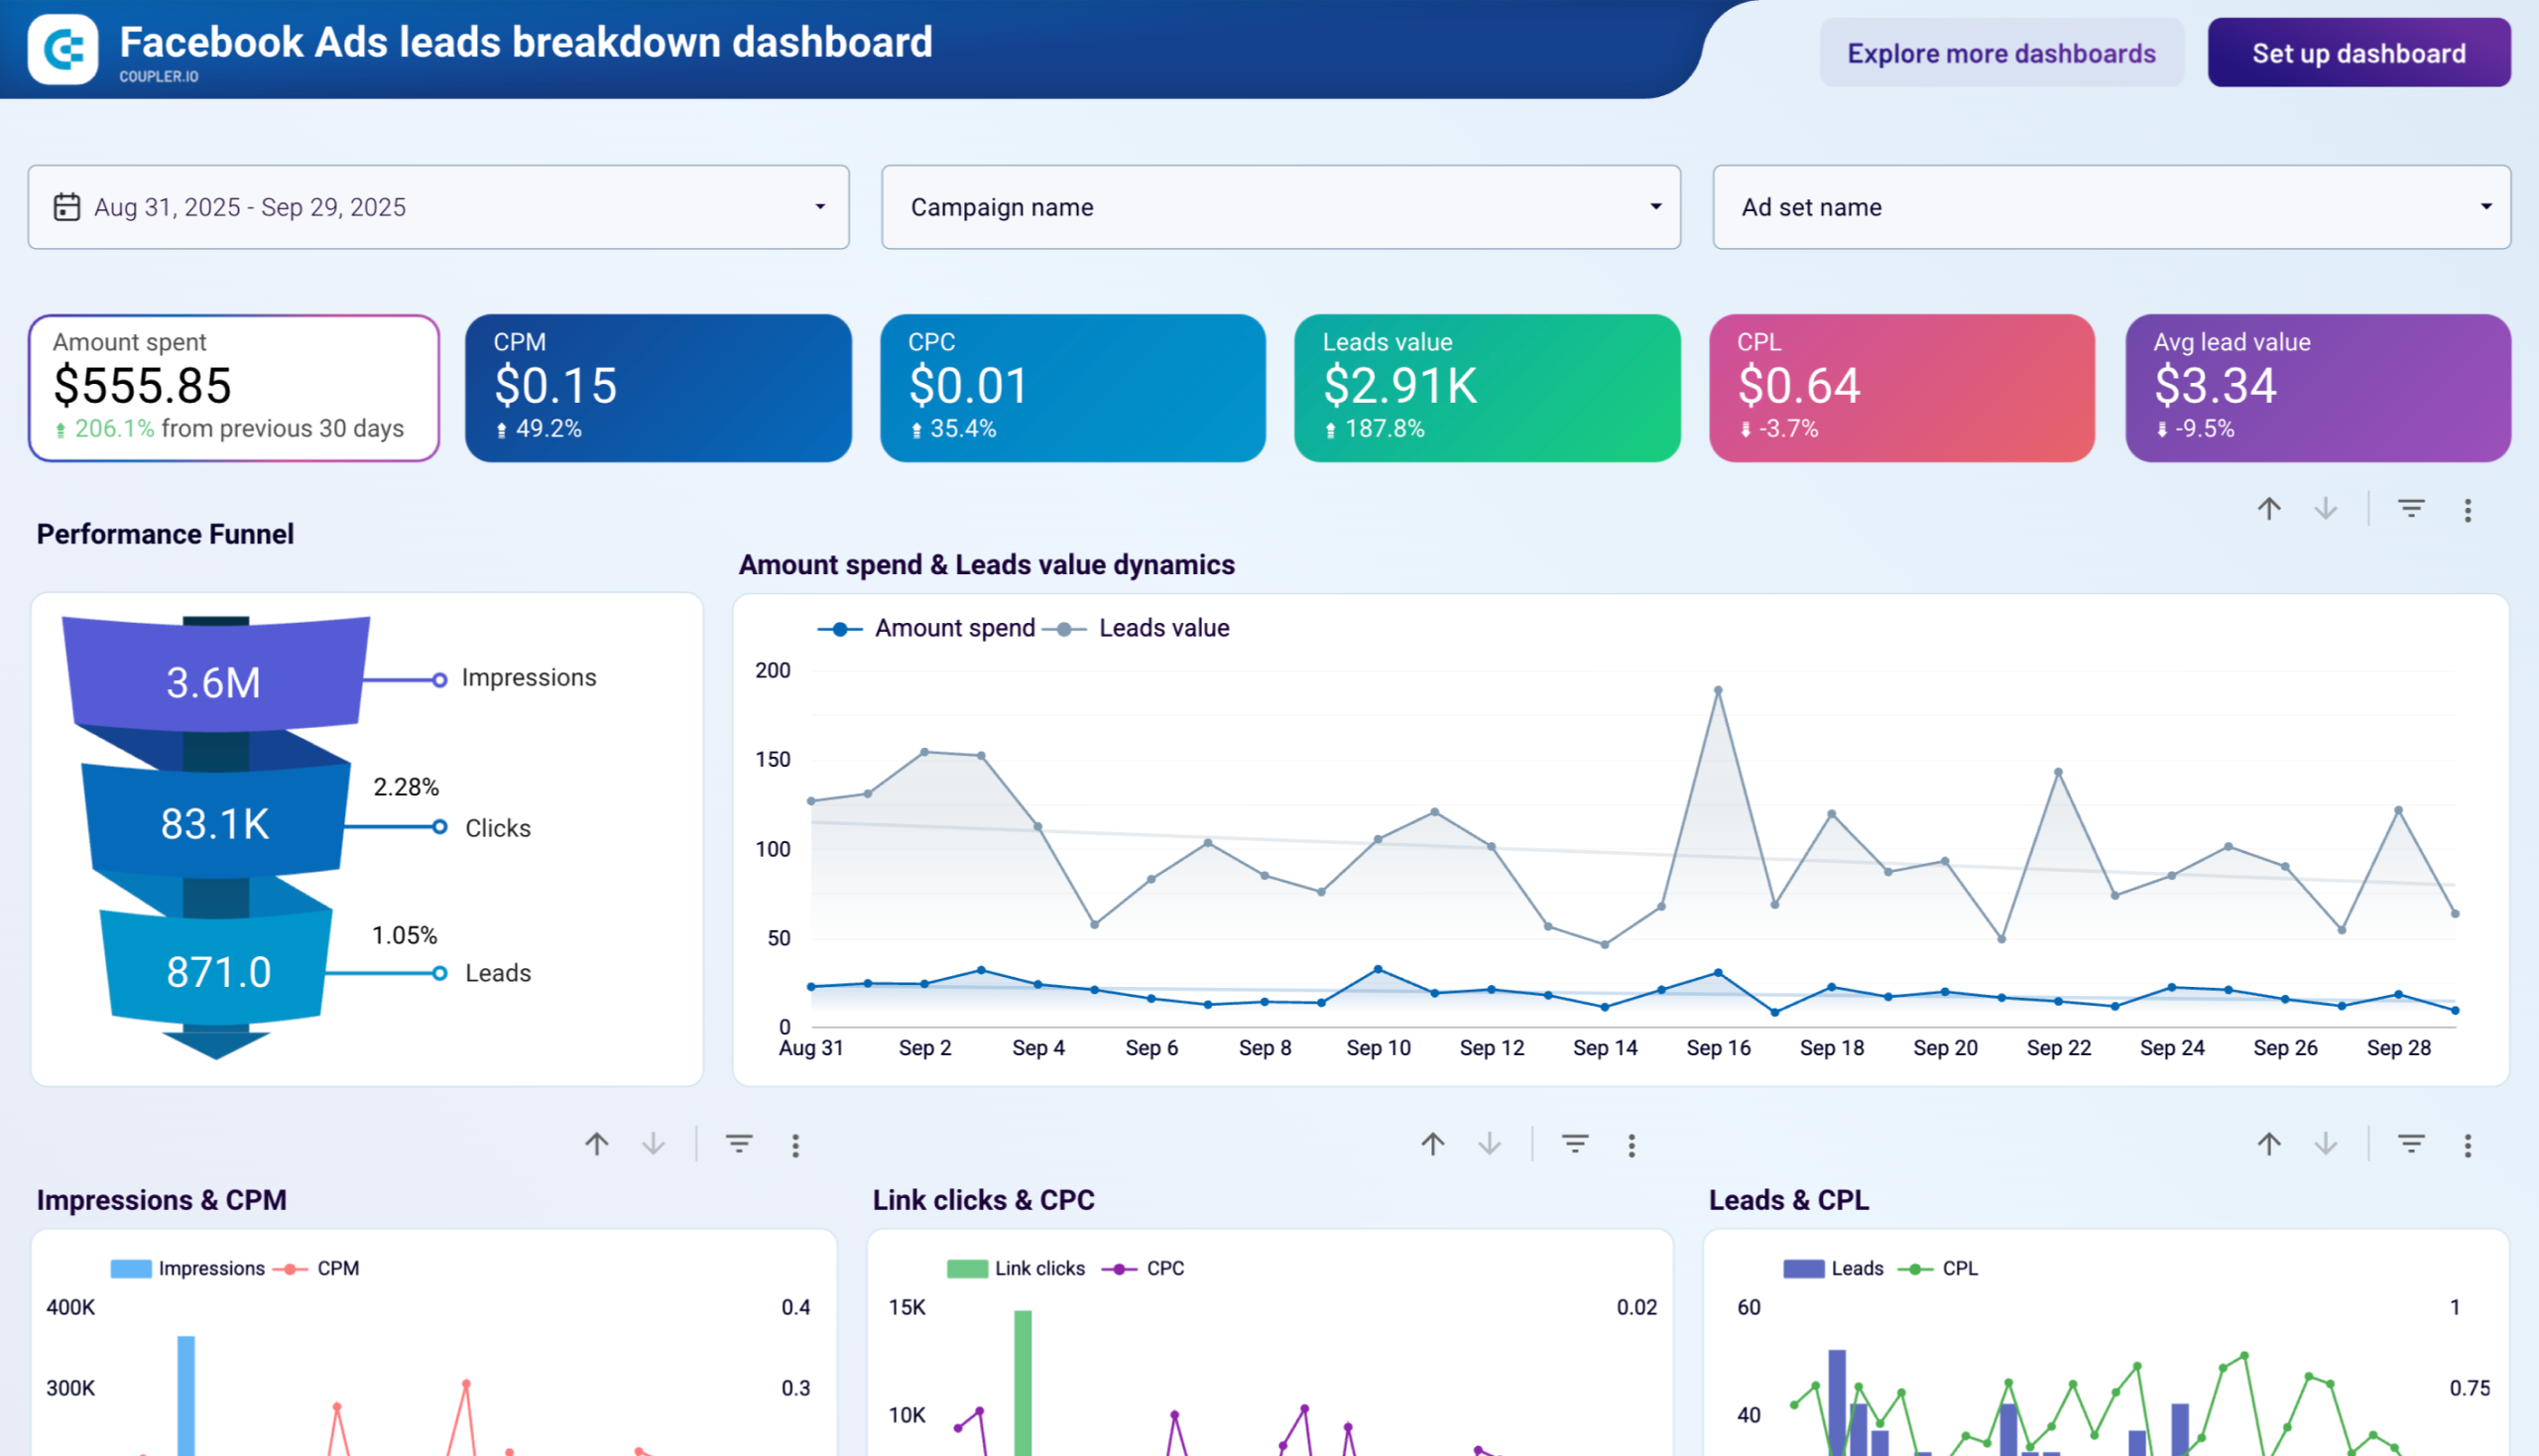
The Facebook Ads leads breakdown dashboard offers a detailed view of your ad performance, focusing on lead generation. You can filter data by campaign to analyze lead metrics for each one separately.
Facebook Ads leads breakdown dashboard
 Preview dashboard
Facebook Ads leads breakdown dashboard
Preview dashboardThe dashboard allows you to:
- Track how impressions turn into clicks and leads and monitor the total value of leads changes over time.
- Get detailed insights into the performance of individual campaigns, including lead count and value.
- Monitor month-over-month changes in key performance metrics, such as clicks, leads, and cost per lead.
- Analyze lead generation by age and gender to identify your top-performing audience segments.
- See which countries are driving the most leads and optimize your targeting strategy.
This automated template is designed in Coupler.io and is also available as a Looker Studio template. To start using it, connect your Facebook Ads account with the help of the built-in Coupler.io connector. In just a few moments, your report will be populated with your campaign metrics.

Template rating
| Integrability | ⭐⭐⭐⭐⭐ |
| Usability | ⭐⭐⭐⭐⭐ |
| Actionability | ⭐⭐⭐⭐⭐ |
3. Facebook Ads purchase breakdown report template
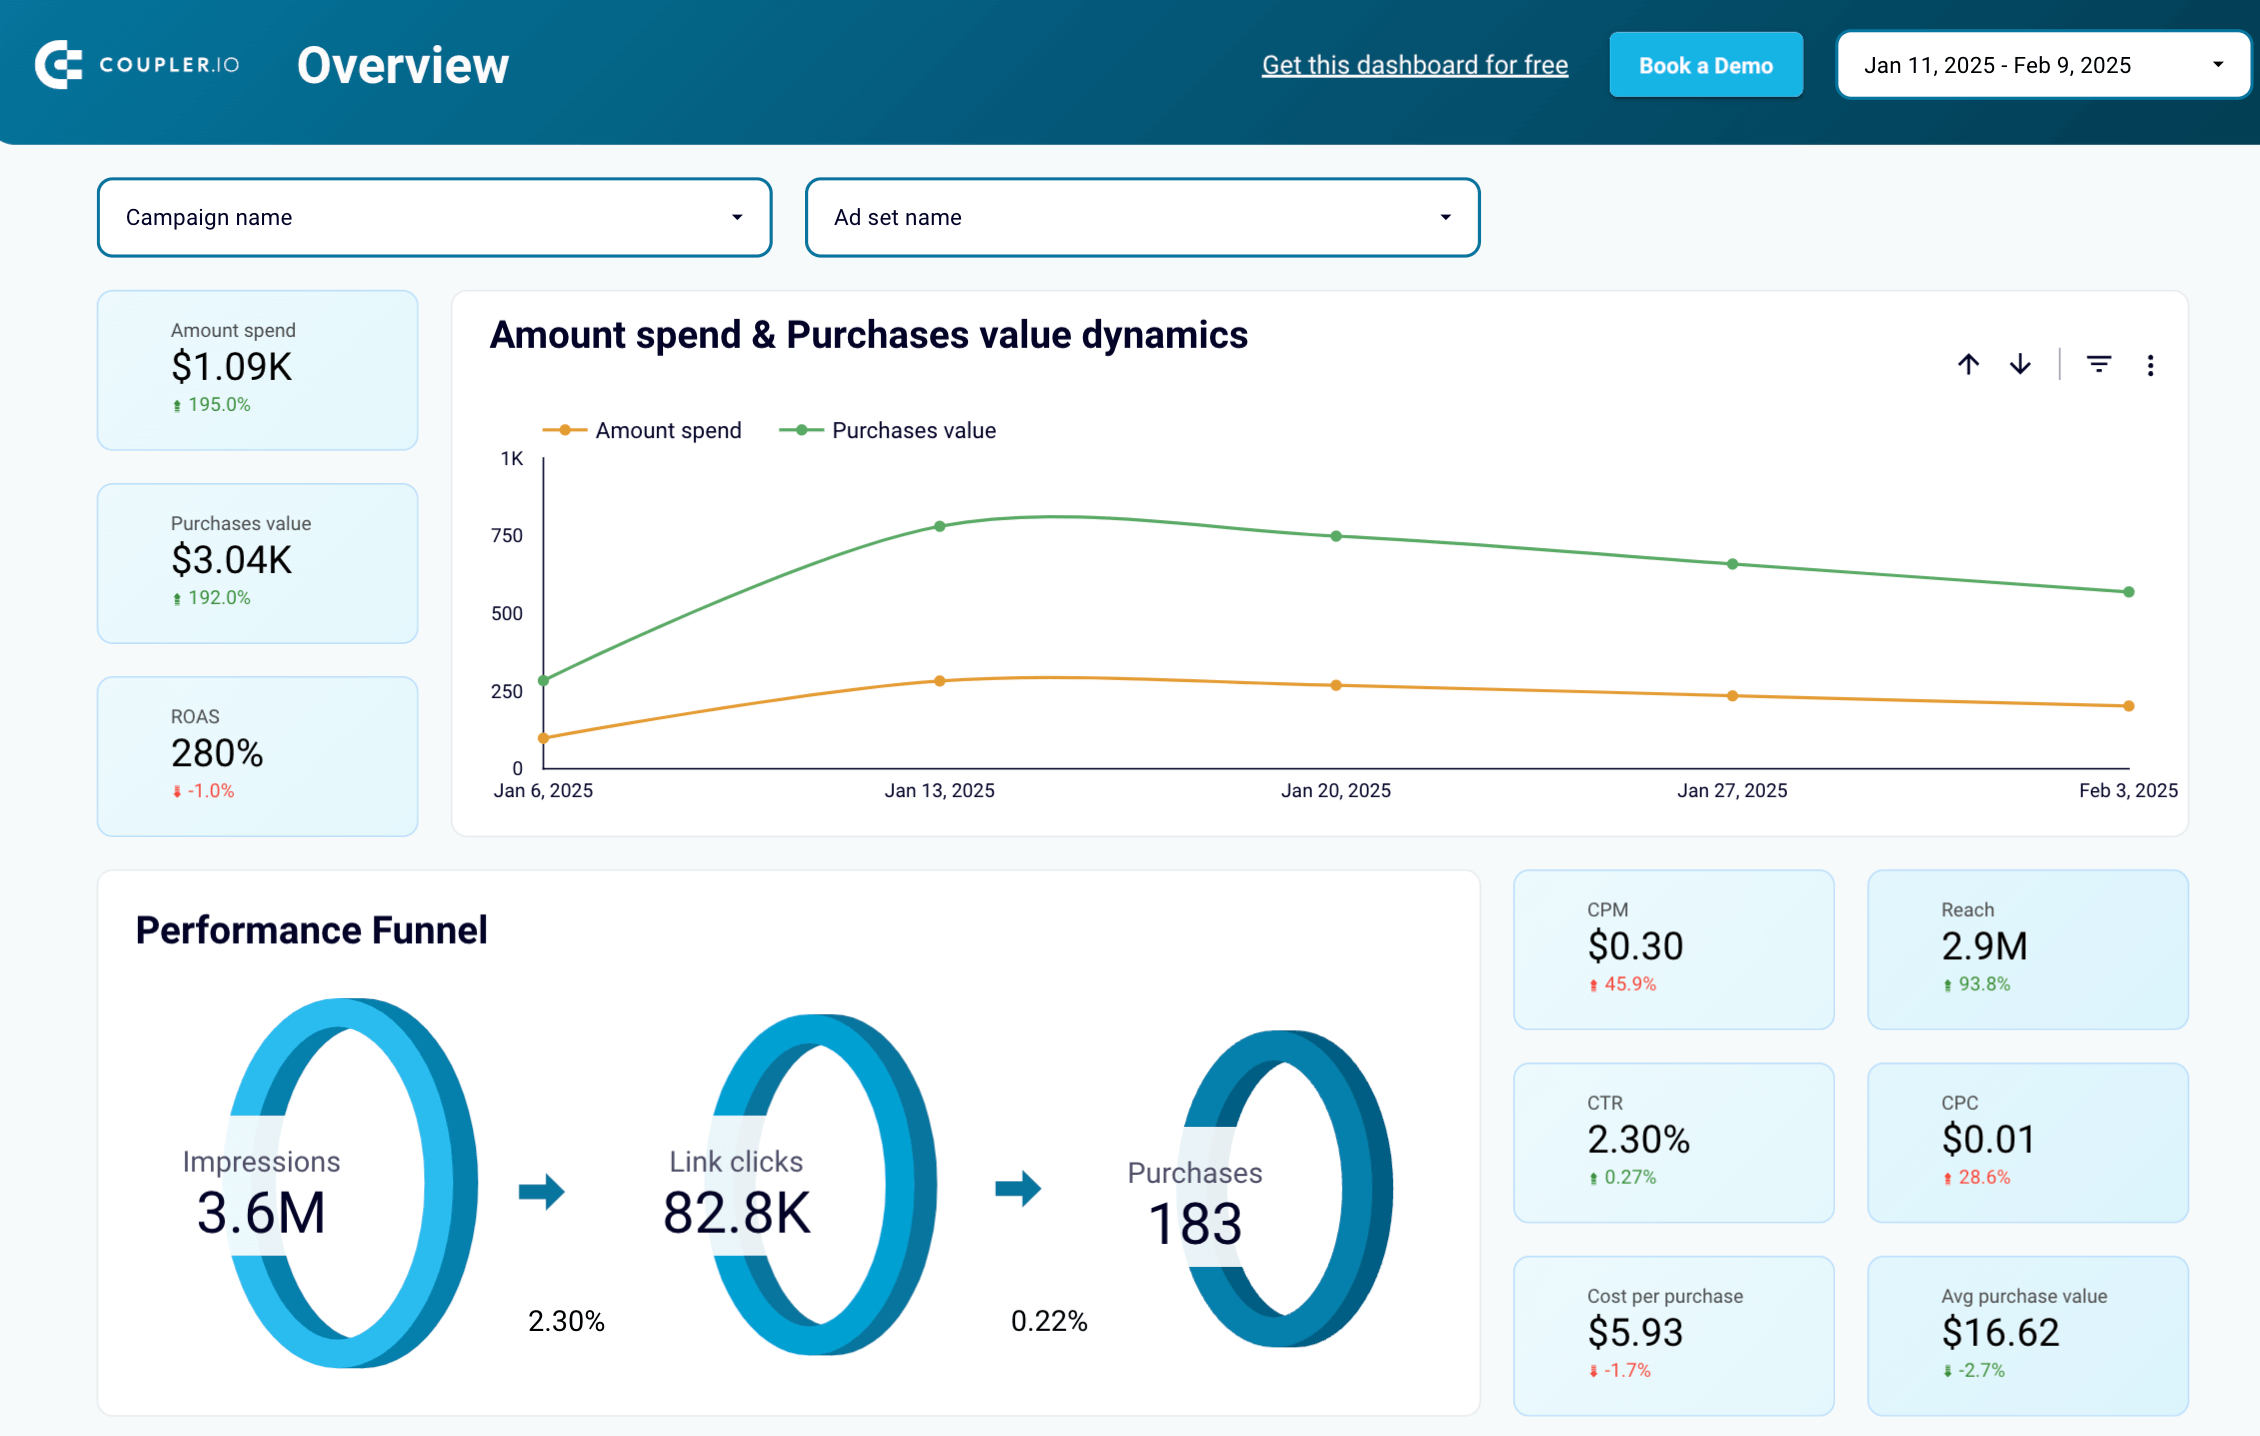
The Facebook Ads purchases breakdown dashboard offers a comprehensive analysis of how effectively your ad campaigns drive purchases. It enables you to explore key performance metrics such as clicks, CPC, and ad spend in relation to actual purchases.
Facebook Ads purchase breakdown dashboard
 Preview dashboard
Facebook Ads purchase breakdown dashboard
Preview dashboardWith this dashboard, you can:
- Track the progression from impressions to clicks, and finally to purchases, while monitoring how purchase value evolves over time.
- Dive deep into individual campaign performance with a breakdown of purchase count and total purchase value.
- Observe monthly trends in important metrics like clicks, purchases, and return on ad spend (ROAS).
- Analyze purchase behavior across different demographic groups, such as age and gender, to identify which audiences are generating the most revenue.
- Examine the geographic distribution of purchases to identify high-performing regions and refine your targeting strategy accordingly.
This Looker Studio template is powered by Coupler.io, making it easy to automate data updates from your Facebook Ads account. With just a few clicks, you’ll have a fully populated report that provides real-time insights into your campaigns. Set custom data refresh intervals as frequent as every 15 minutes, ensuring you always have up-to-date information at your fingertips.
Template rating
| Integrability | ⭐⭐⭐⭐⭐ |
| Usability | ⭐⭐⭐⭐⭐ |
| Actionability | ⭐⭐⭐⭐⭐ |
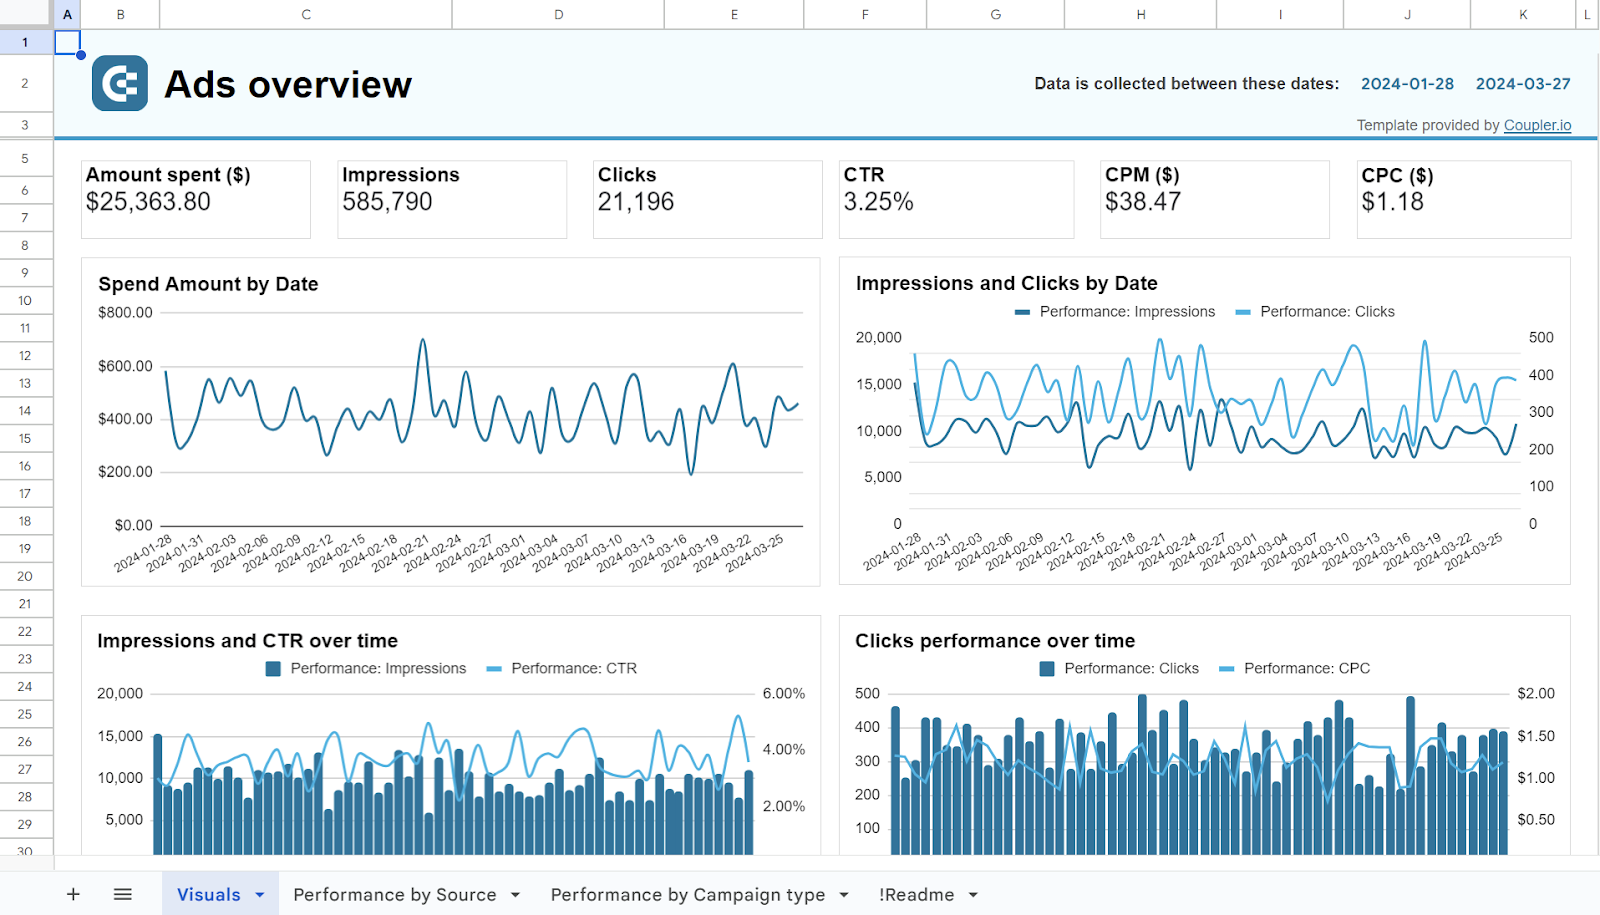
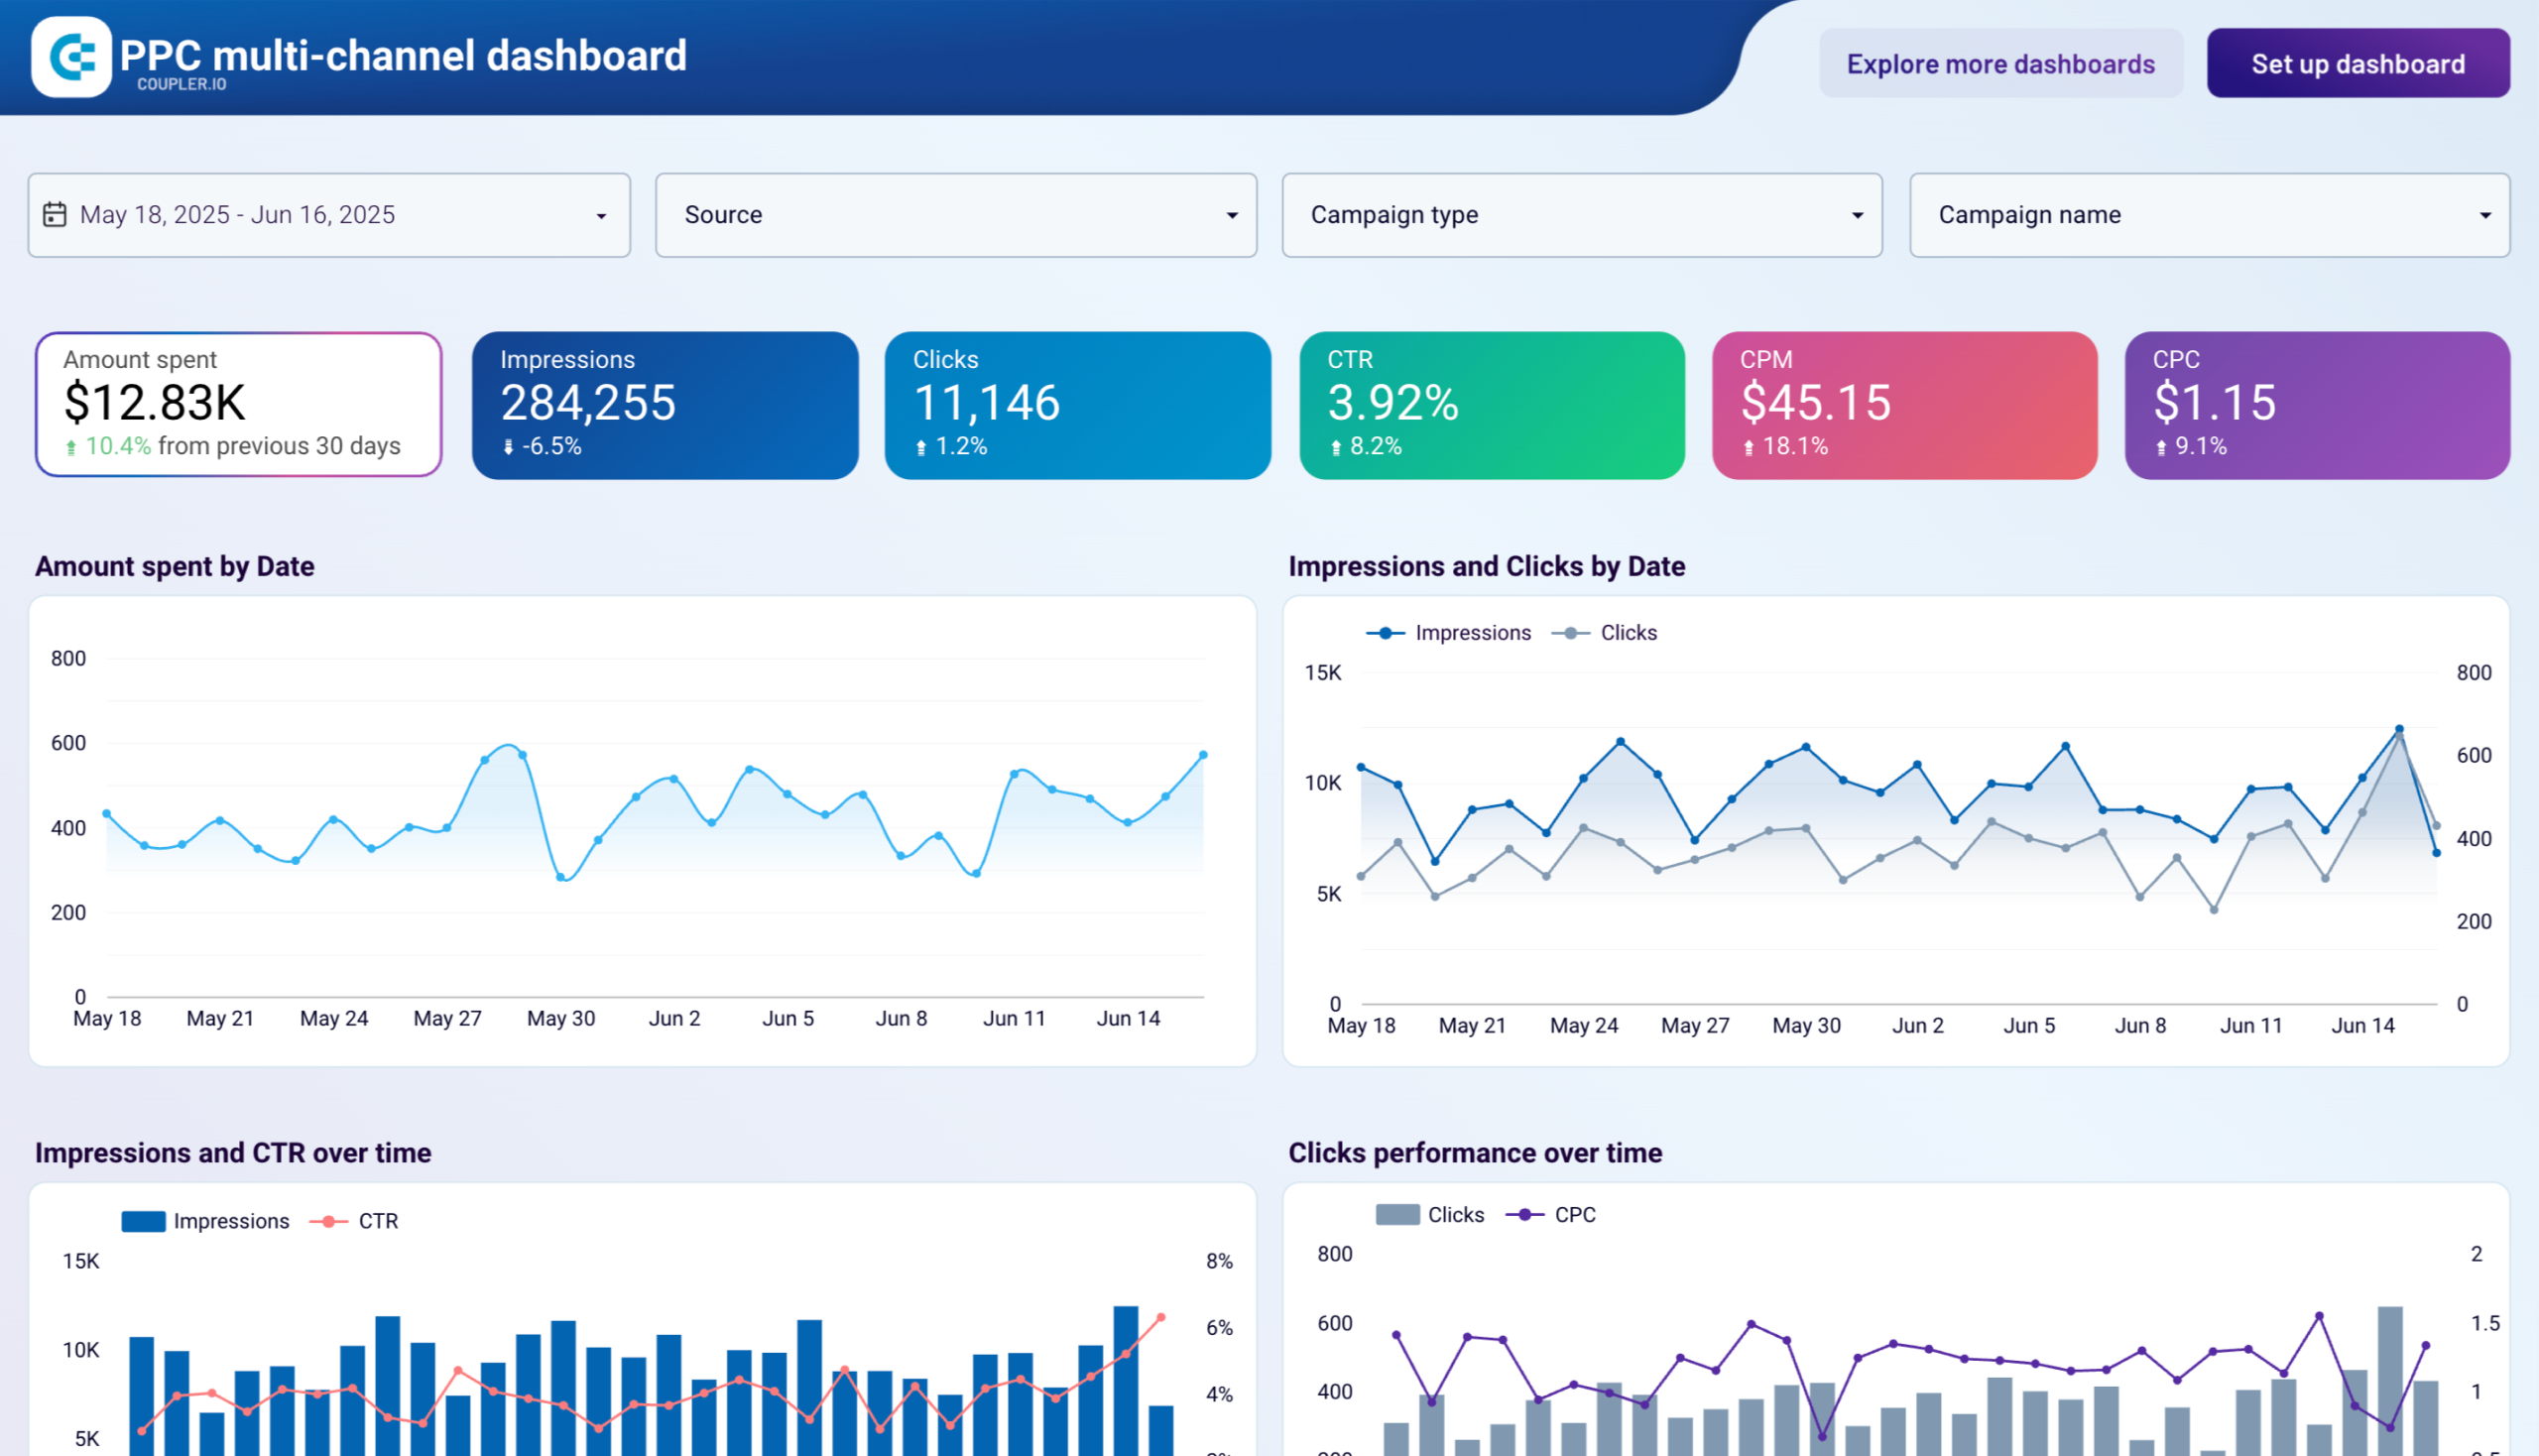
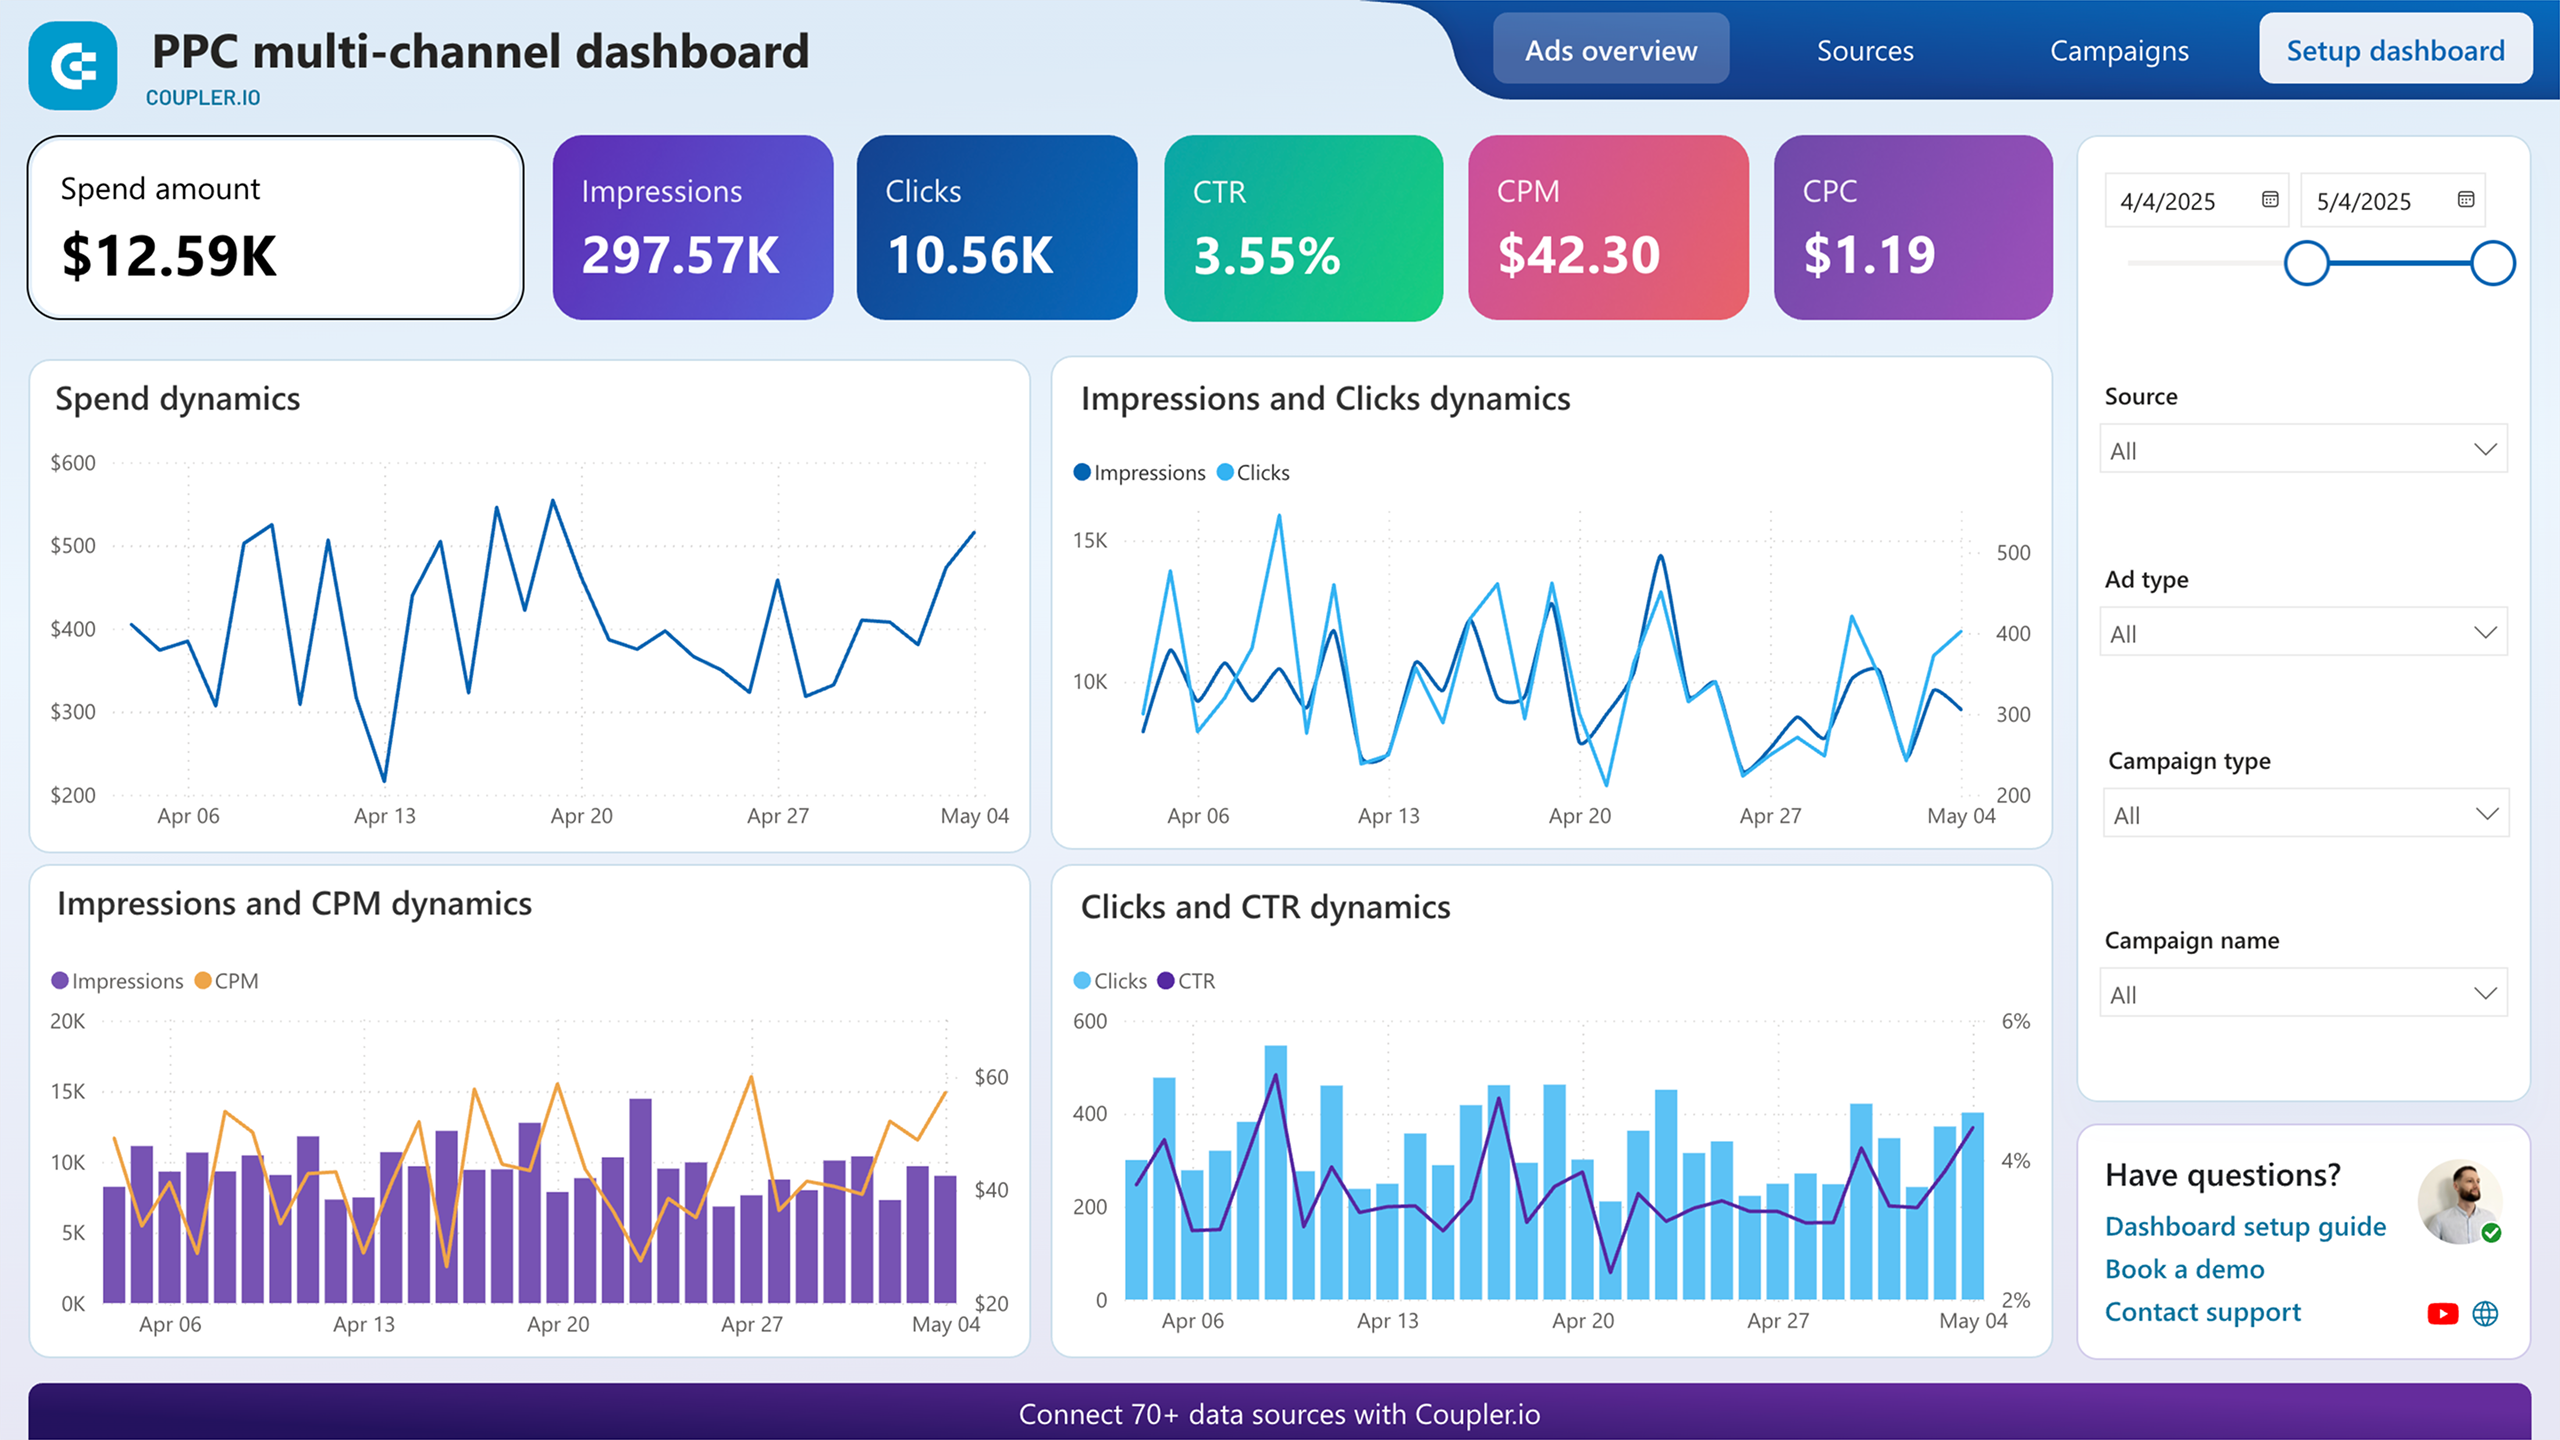
4. Facebook Ads PPC report template with cross-channel connectivity
Our next template is more versatile as it can show the performance of not only Facebook Ads campaigns but also campaigns run on other ad platforms. It’s a PPC multi-channel dashboard designed and powered by Coupler.io. This means you can connect it to LinkedIn Ads, Instagram Ads, Google Ads, and TikTok Ads to get a comparison overview of different metrics in one place.
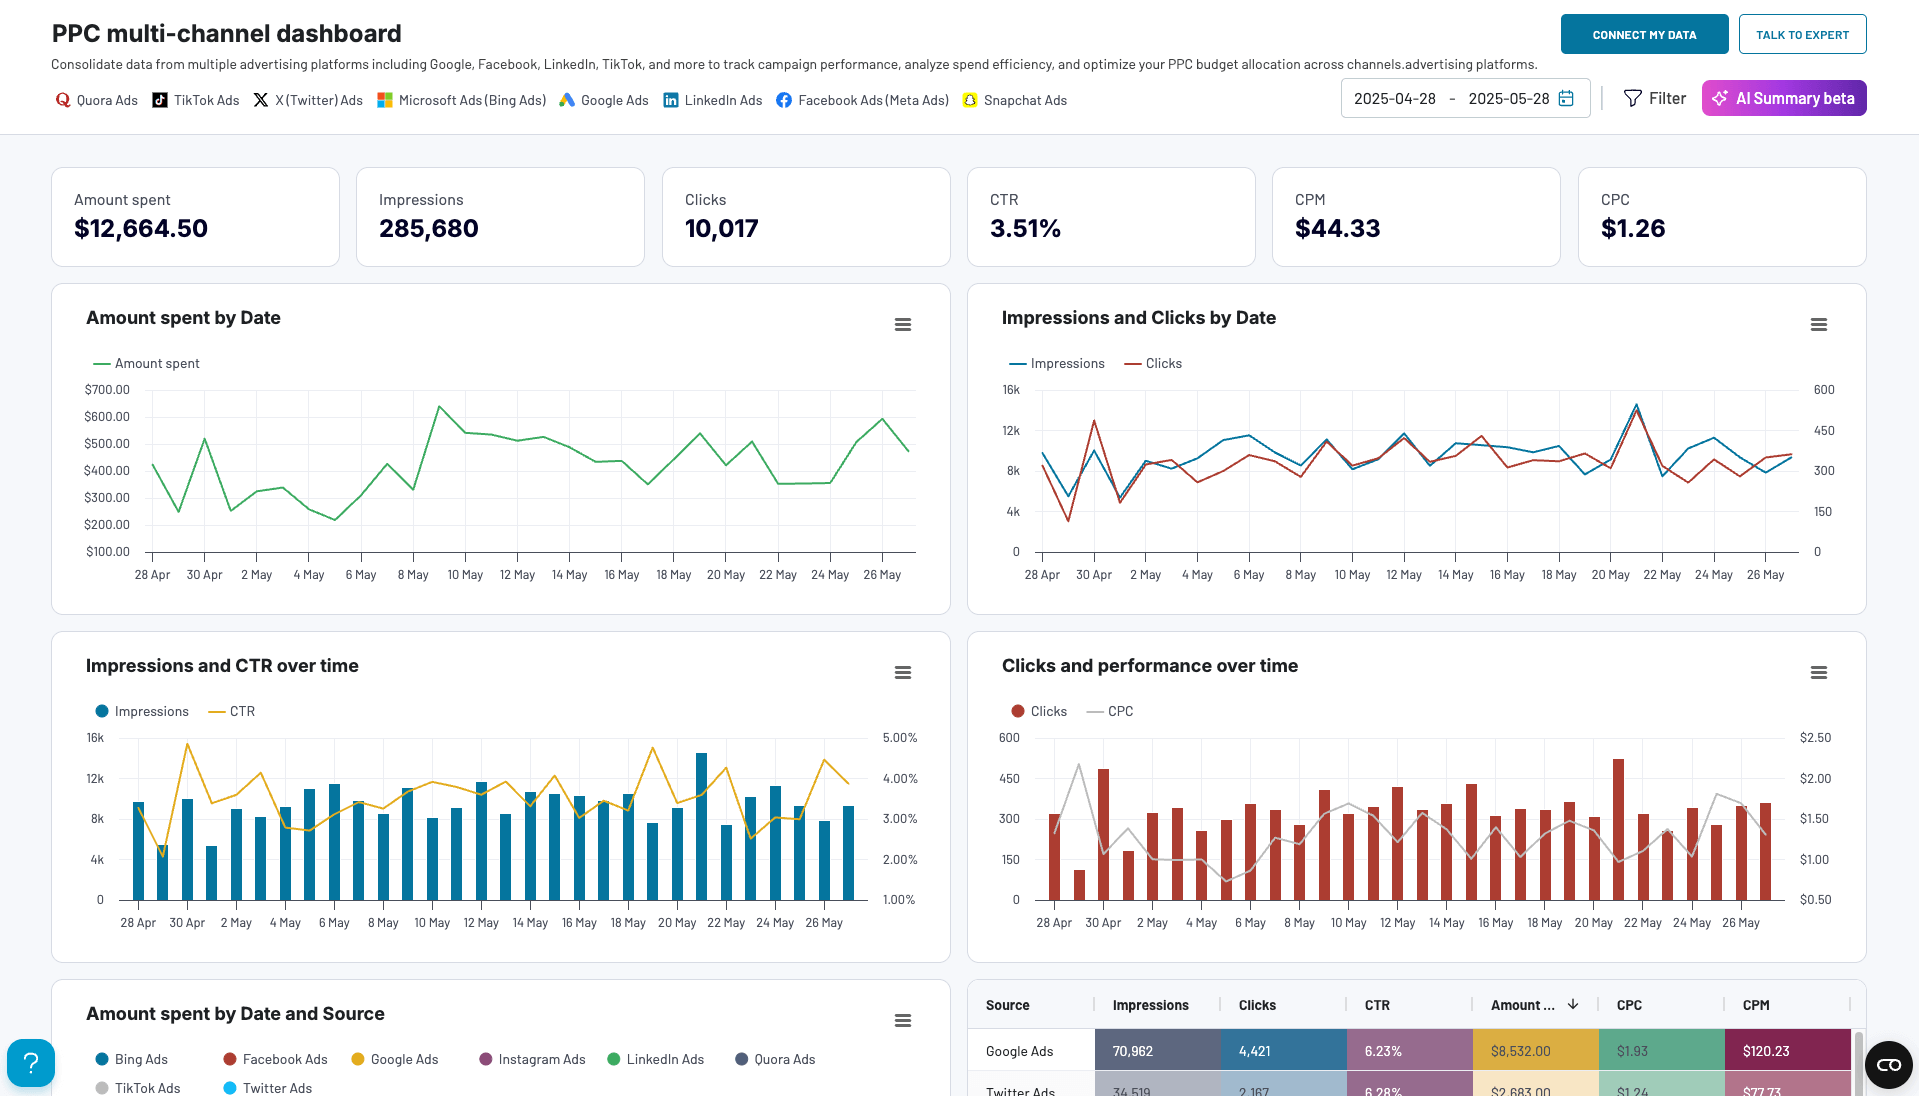
So, you don’t need to check metrics on every platform separately. Also, such a marketing report is easy to share with clients and stakeholders.
The report allows you to track such metrics as CPC, CPM, conversion rate, and more. You can also apply different filters, select the needed date range, or view Facebook Ads data separately from other data sources.
Coupler.io also provides this dashboard as a template for different destinations including Google Sheets, Looker Studio (former Google Data Studio), Power BI, and Tableau. Pick the version you like most and get it for free.


Template rating
| Integrability | ⭐⭐⭐⭐⭐ |
| Usability | ⭐⭐⭐⭐⭐ |
| Actionability | ⭐⭐⭐⭐⭐ |
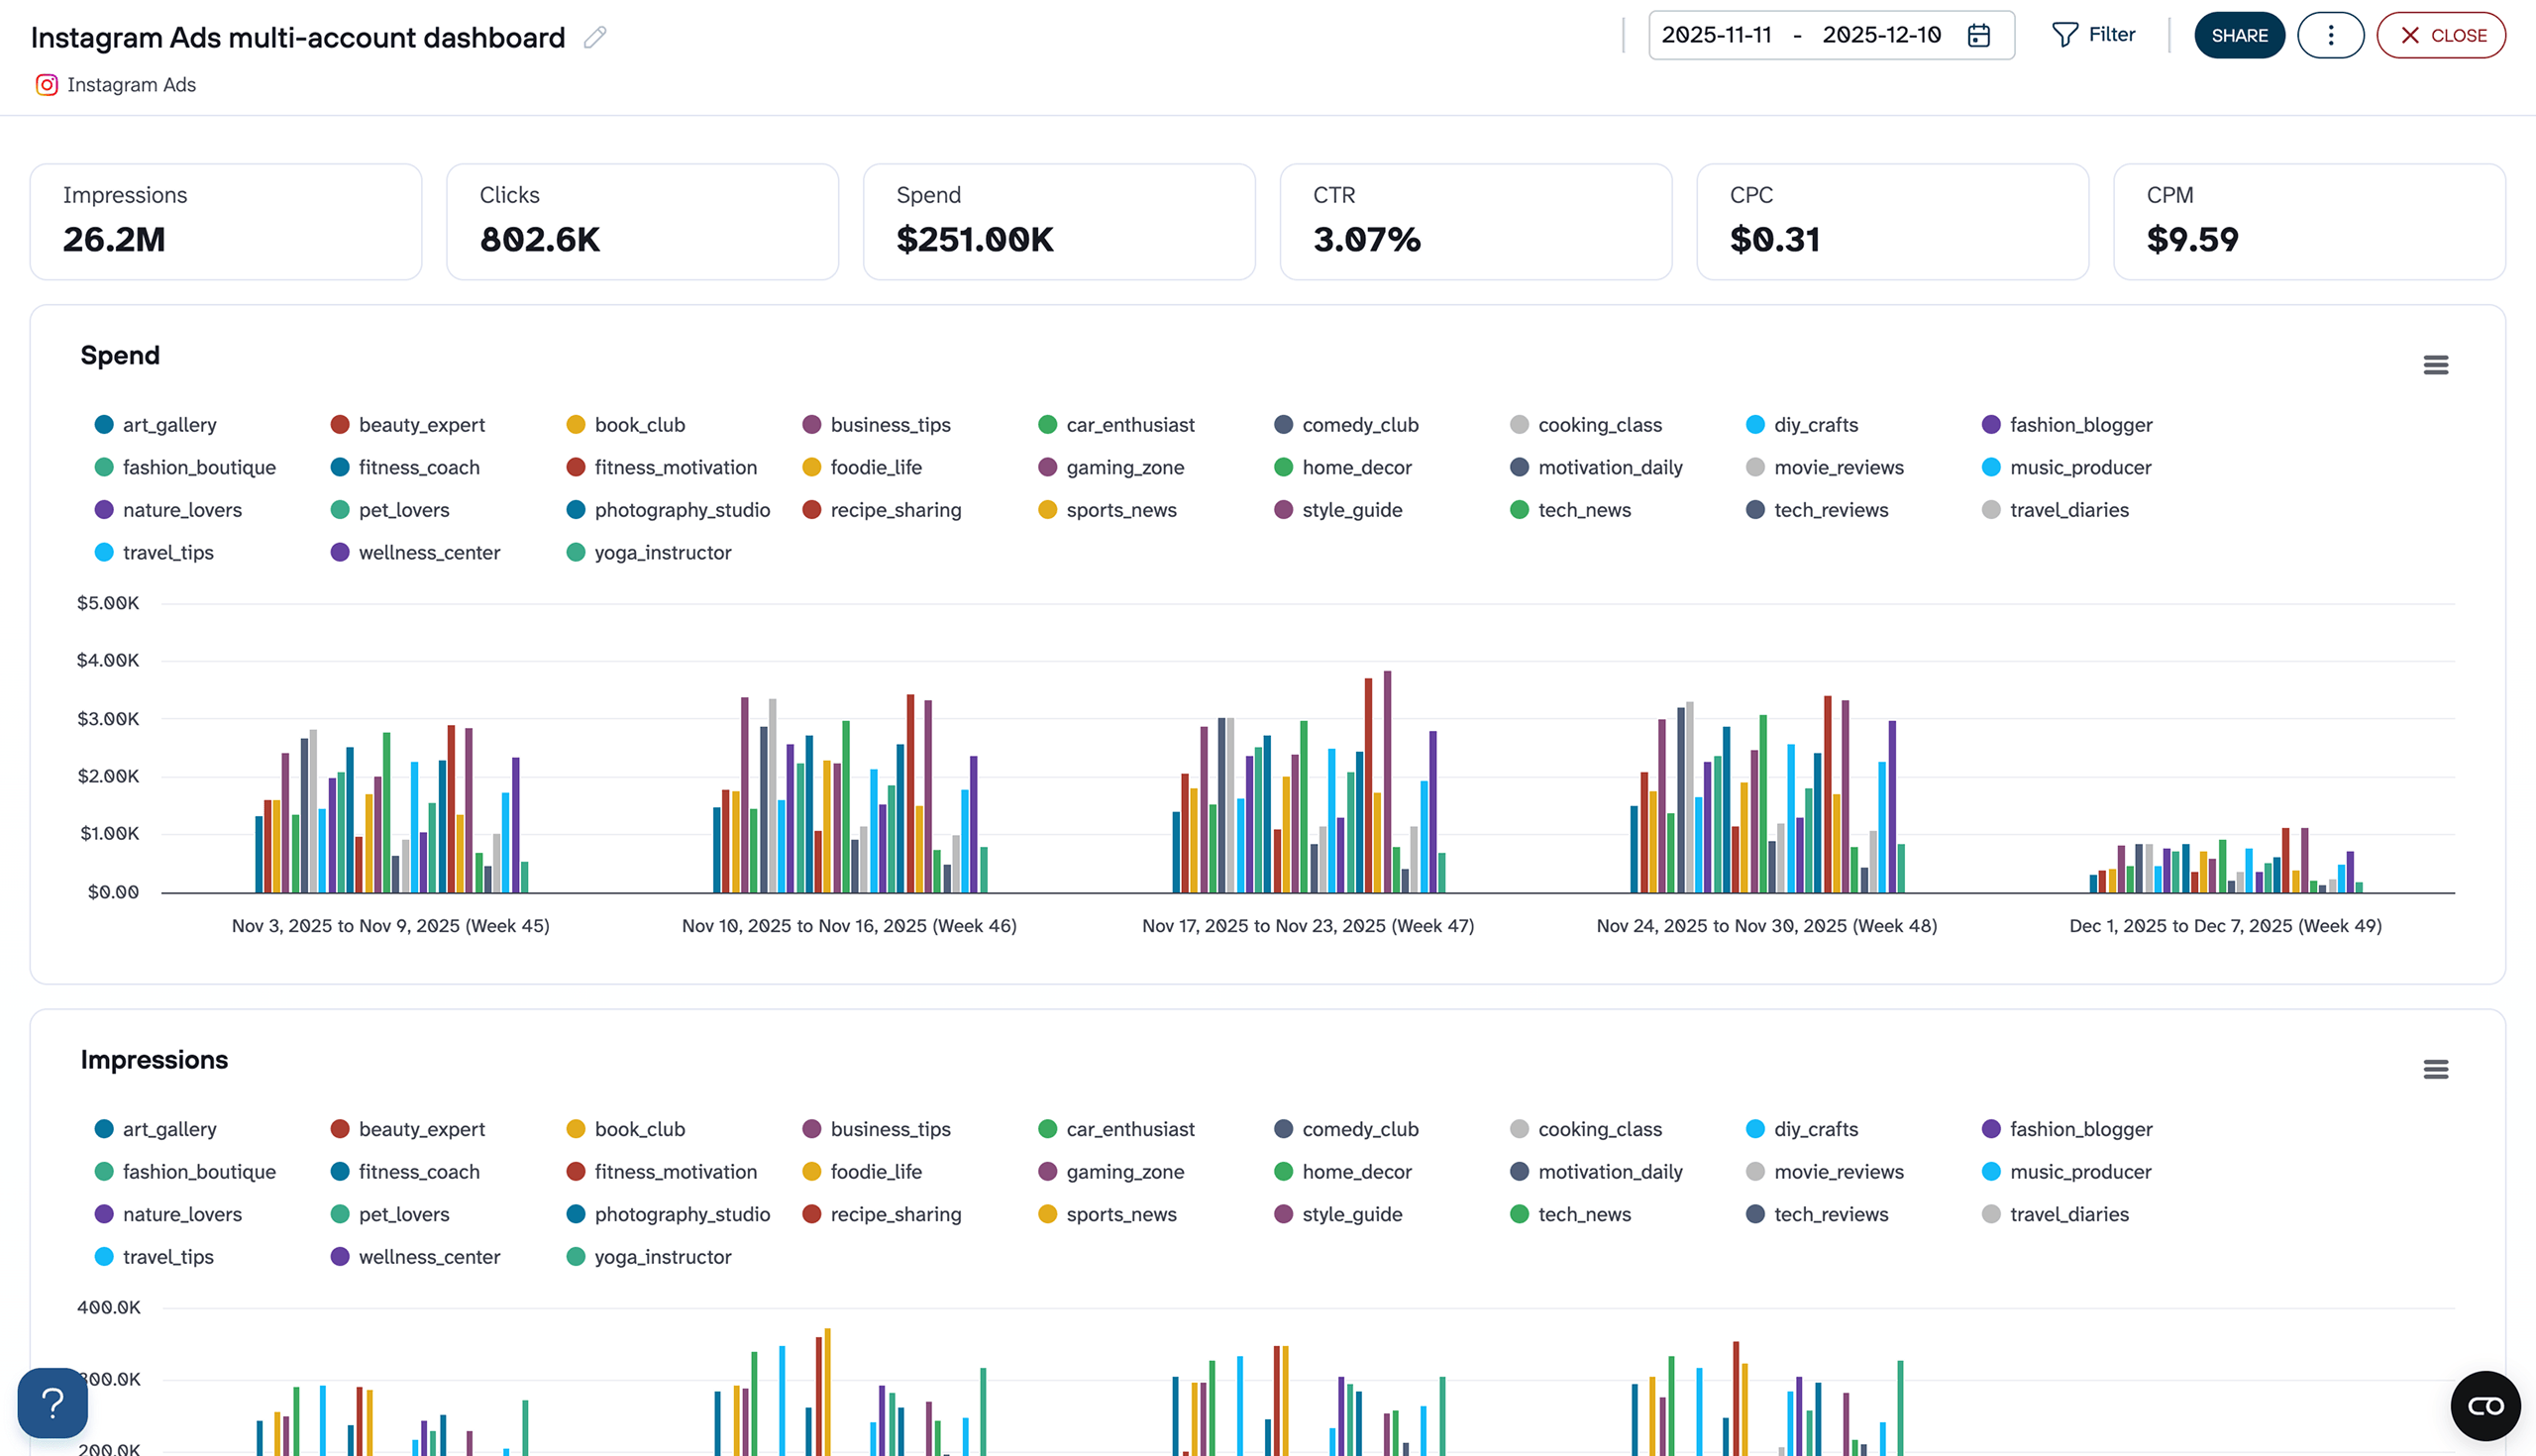
If your focus is specifically on Instagram advertising across multiple accounts, Coupler.io also offers an Instagram Ads multi-account dashboard to monitor spend, impressions, clicks, CTR, and other metrics from all connected Instagram ad accounts into one view.

5. Facebook Ads & brand awareness report template
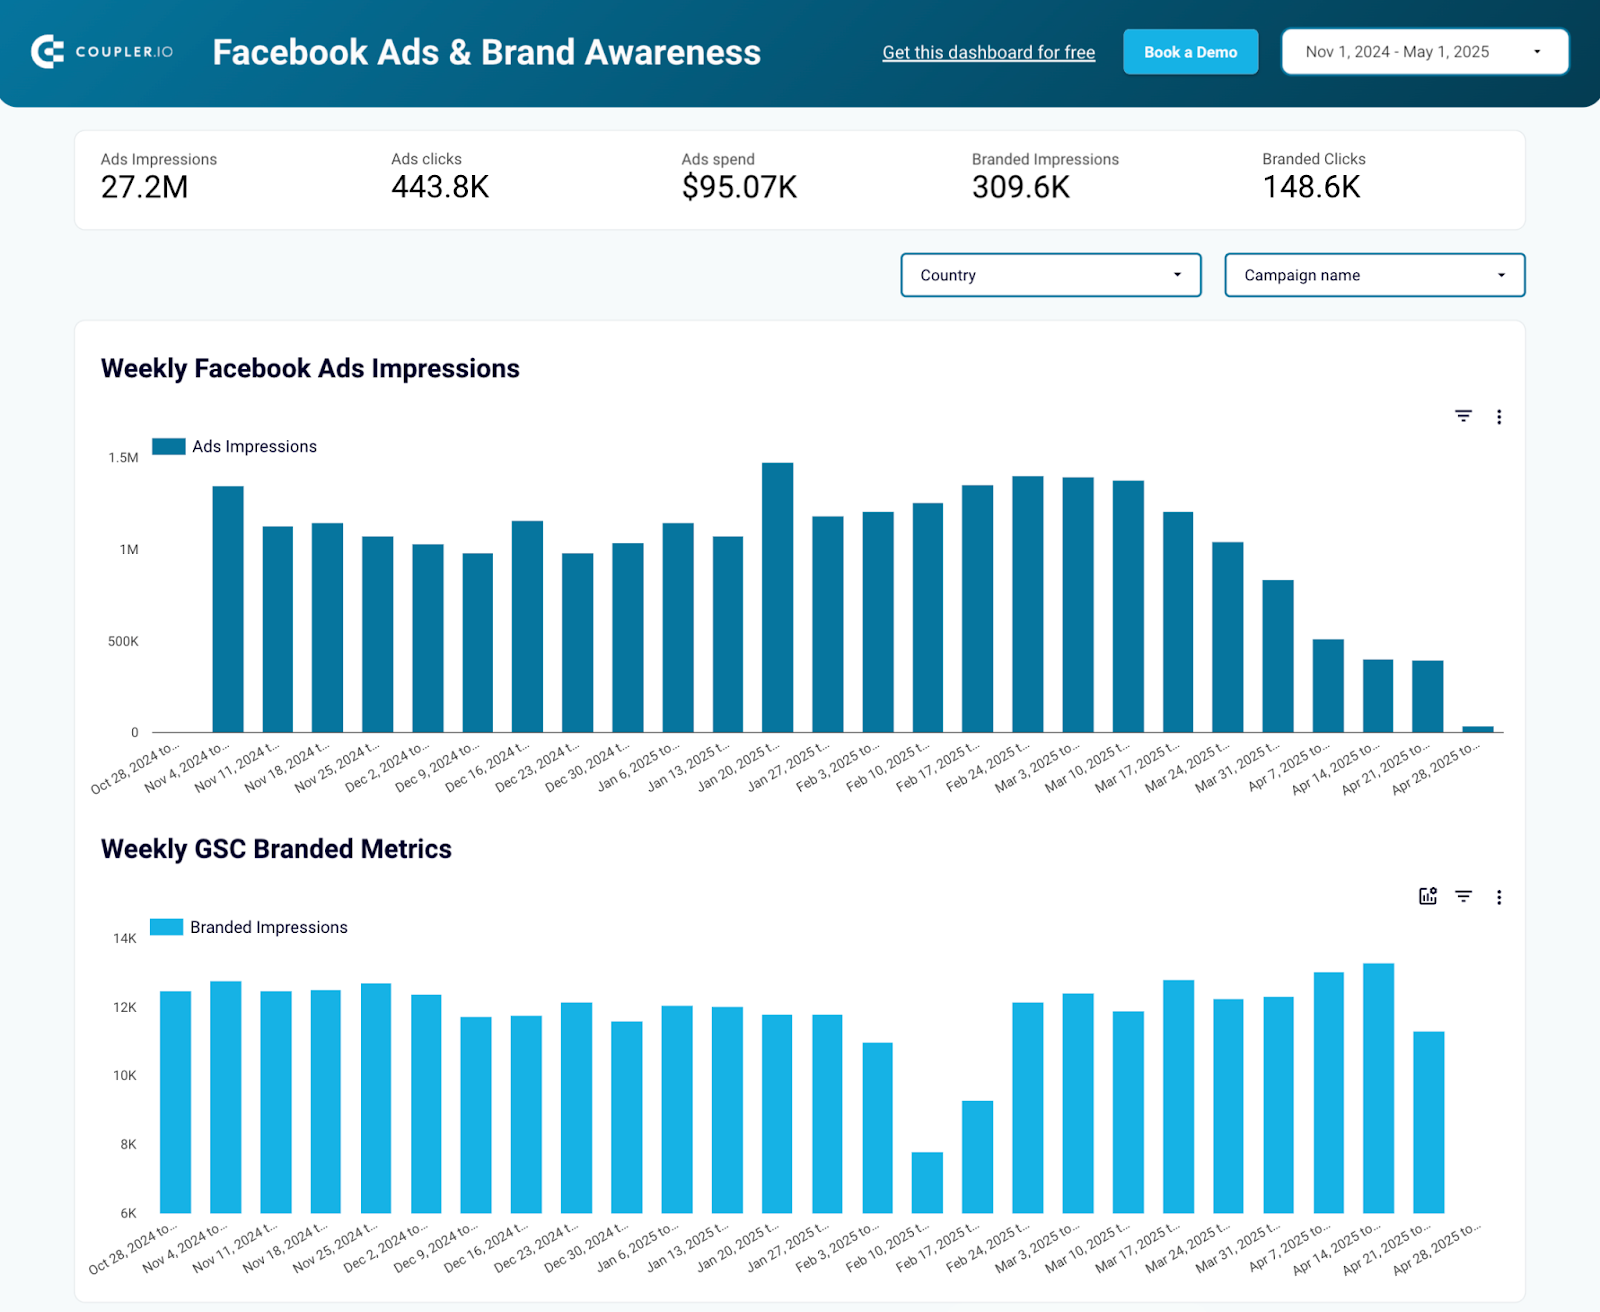
This Facebook Ads report lets you evaluate how your campaigns influence branded searches, so you can increase brand awareness.
Facebook Ads & brand awareness dashboard
 Preview dashboard
Facebook Ads & brand awareness dashboard
Preview dashboardThe template is designed in Looker Studio. It collects data from Facebook Ads (ad campaigns) and Google Search Console (branded searches). As a result, you get a one-page report showing the comparison of ads and branded impressions. To use the template, connect your Facebook and GSC accounts and select the specific region where you run plenty of ads on Facebook. The Readme tab contains detailed getting started instructions.
Template rating
| Integrability | ⭐⭐⭐⭐⭐ |
| Usability | ⭐⭐⭐⭐⭐ |
| Actionability | ⭐⭐⭐⭐ |
6. Facebook Ads PPC monthly budget report template in Google Sheets
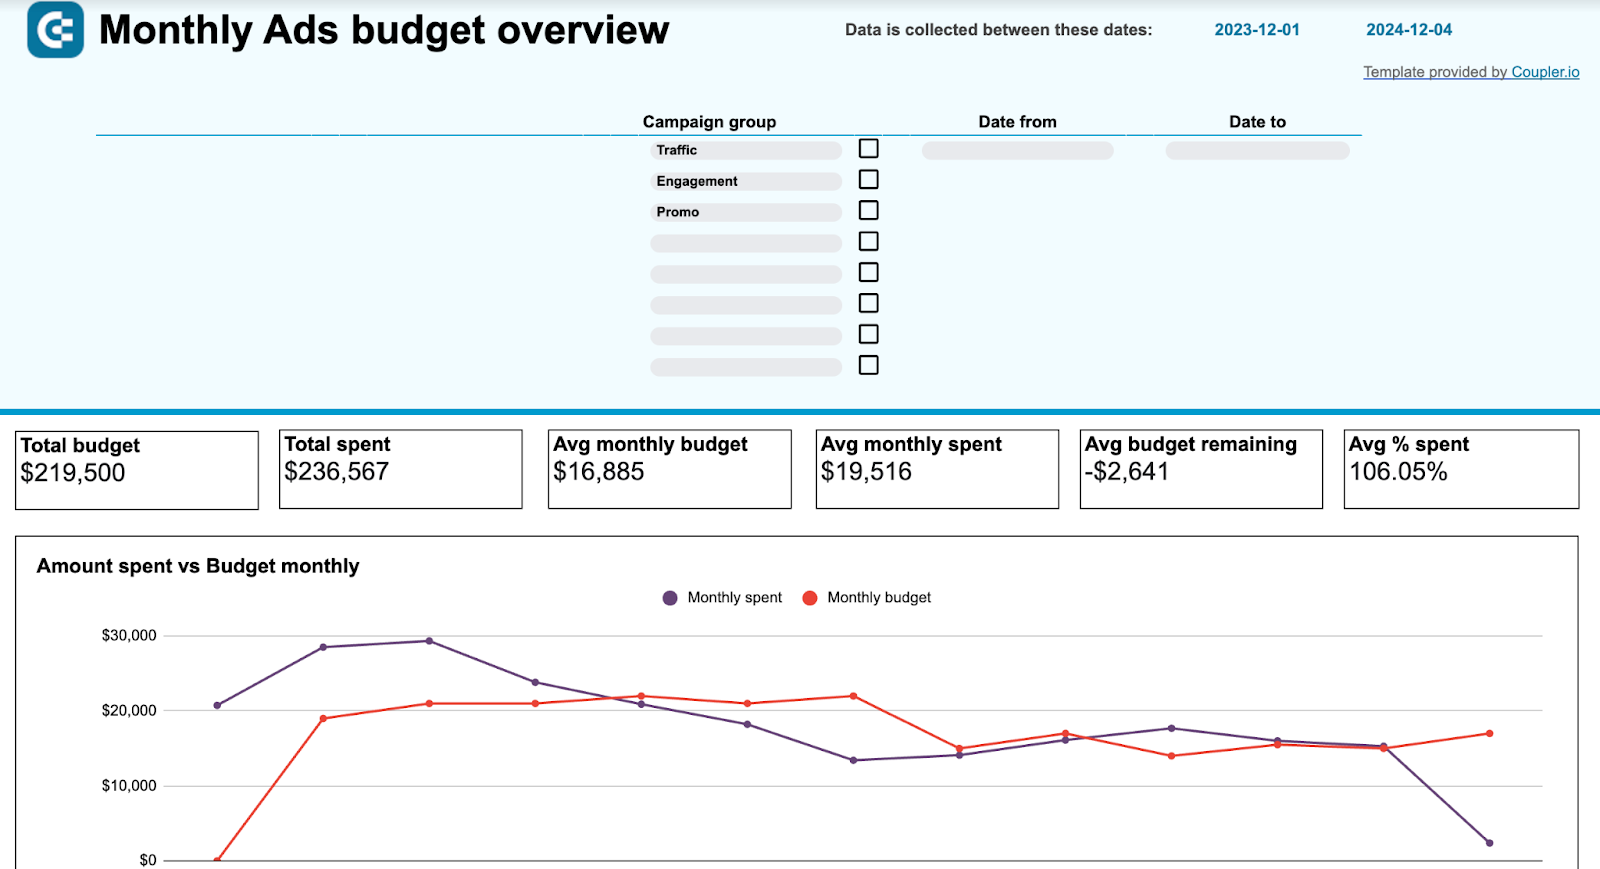
While the previous templates were built using BI tools (Looker Studio and Power BI), this Facebook Ads report is made in Google Sheets. It provides an overview of your monthly advertising budget.
Facebook Ads PPC monthly budget dashboard
 Preview dashboard
Facebook Ads PPC monthly budget dashboard
Preview dashboardIt’s not a single-channel report. In addition to Facebook Ads, you can add data from other platforms, including Google Ads, LinkedIn Ads, and so on. However, if you want to use it solely for analyzing ad budgets on Facebook, you’re free to go. The report lets you track the dynamics of spending on advertising, understand your over/under budget during the year, monitor the average daily costs, and more.
Follow the getting started instructions on the Readme tab to connect your Facebook Ads data to Google Sheets
Template rating
| Integrability | ⭐⭐⭐⭐⭐ |
| Usability | ⭐⭐⭐⭐ |
| Actionability | ⭐⭐⭐⭐⭐ |
7. Facebook Ads performance for mobile apps report template in Looker Studio
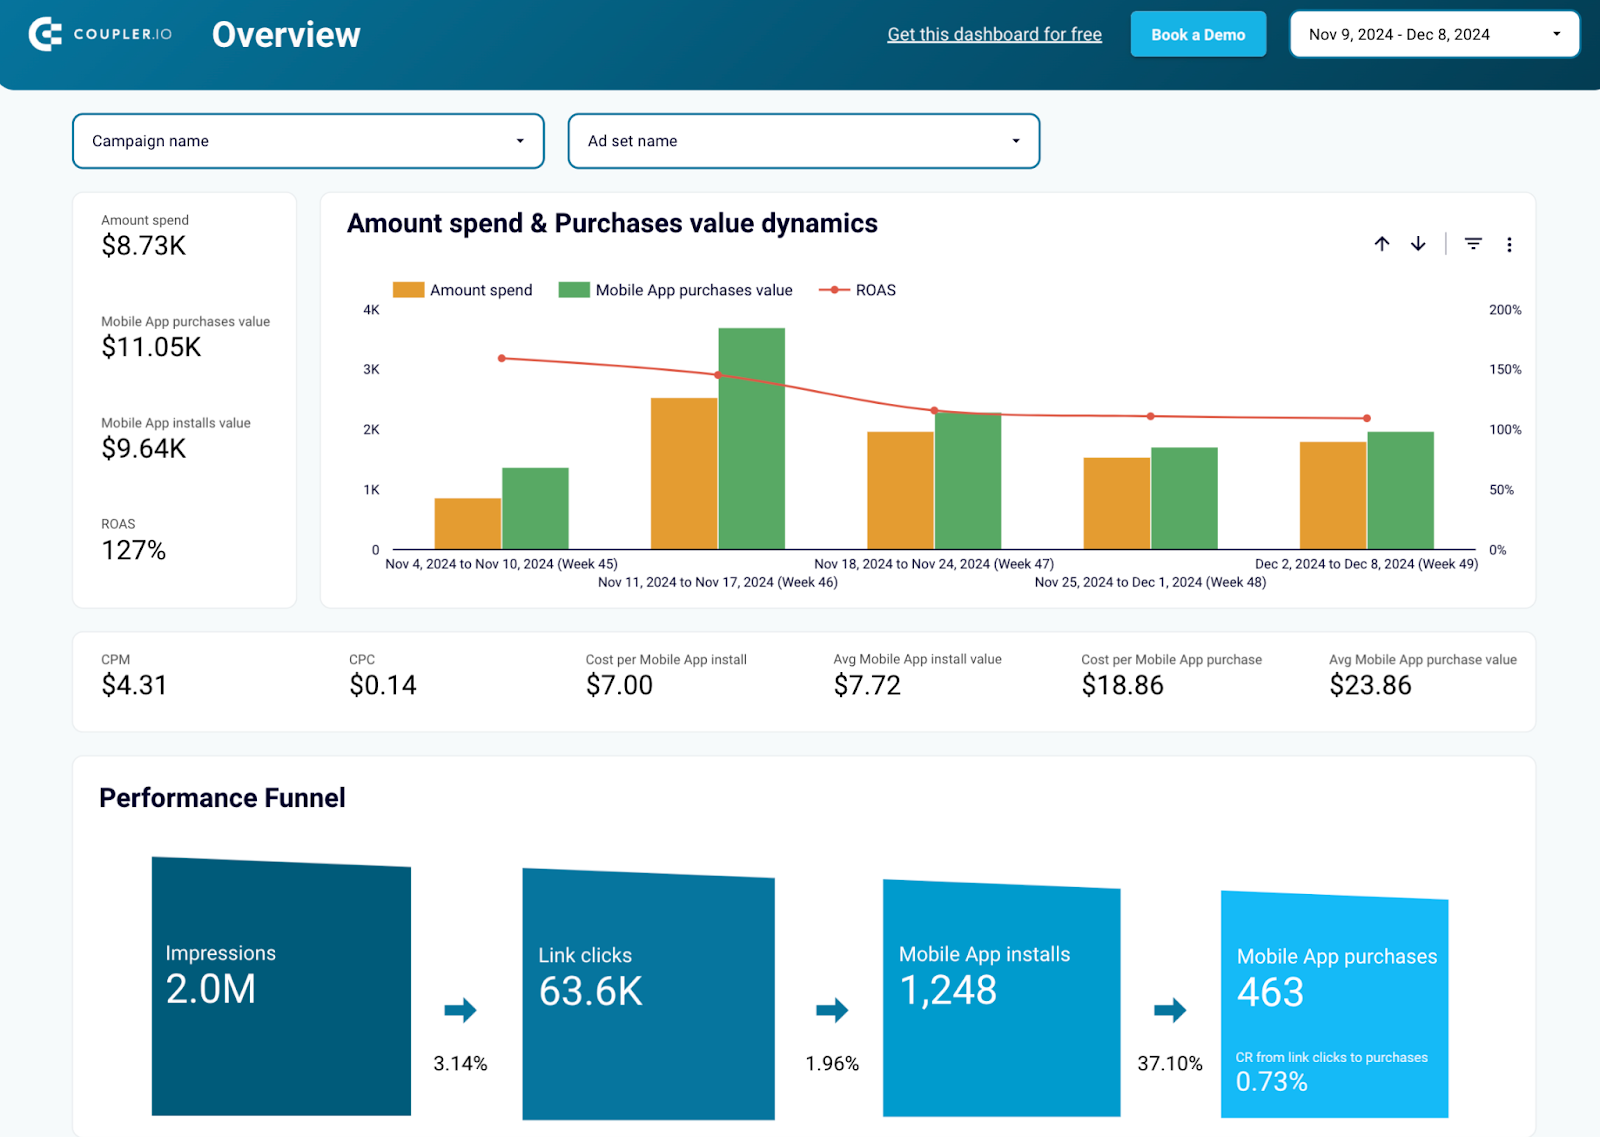
This Facebook Ads dashboard helps track your mobile app campaigns’ performance. It compares your ad spend to the number of app installs and in-app purchases. As a result, you can evaluate the ROAS of your campaigns.
Facebook Ads performance for mobile apps dashboard
 Preview dashboard
Facebook Ads performance for mobile apps dashboard
Preview dashboardWith this dashboard, you can:
- Monitor key metrics like ad spend, ROAS, app installs, and purchases in one place.
- Analyze the user journey from impressions to purchases, to identify drop-off points and optimize the funnel.
- Pinpoint high-performing campaigns and adjust underperforming ones for better results.
- See how app usage changes over time with App Uses Dynamics chart.
- Keep an eye on cost per install (CPI), cost per click (CPC), and cost per purchase (CPP) to ensure budget efficiency.
- Compare key performance metrics, including impressions versus CPM, link clicks versus CPC, installs versus cost per install, and purchases versus cost per purchase.
This Looker Studio template from Coupler.io allows you to easily sync mobile app campaign data from your Facebook Ads account. With minimal setup, you can create a report that provides live insights into your campaigns and refreshes automatically on a set schedule. This makes sure you always have up-to-date metrics to work with.
Template rating
| Integrability | ⭐⭐⭐⭐⭐ |
| Usability | ⭐⭐⭐⭐ |
| Actionability | ⭐⭐⭐⭐⭐ |
8. Facebook Ads ecommerce performance report template in Looker Studio
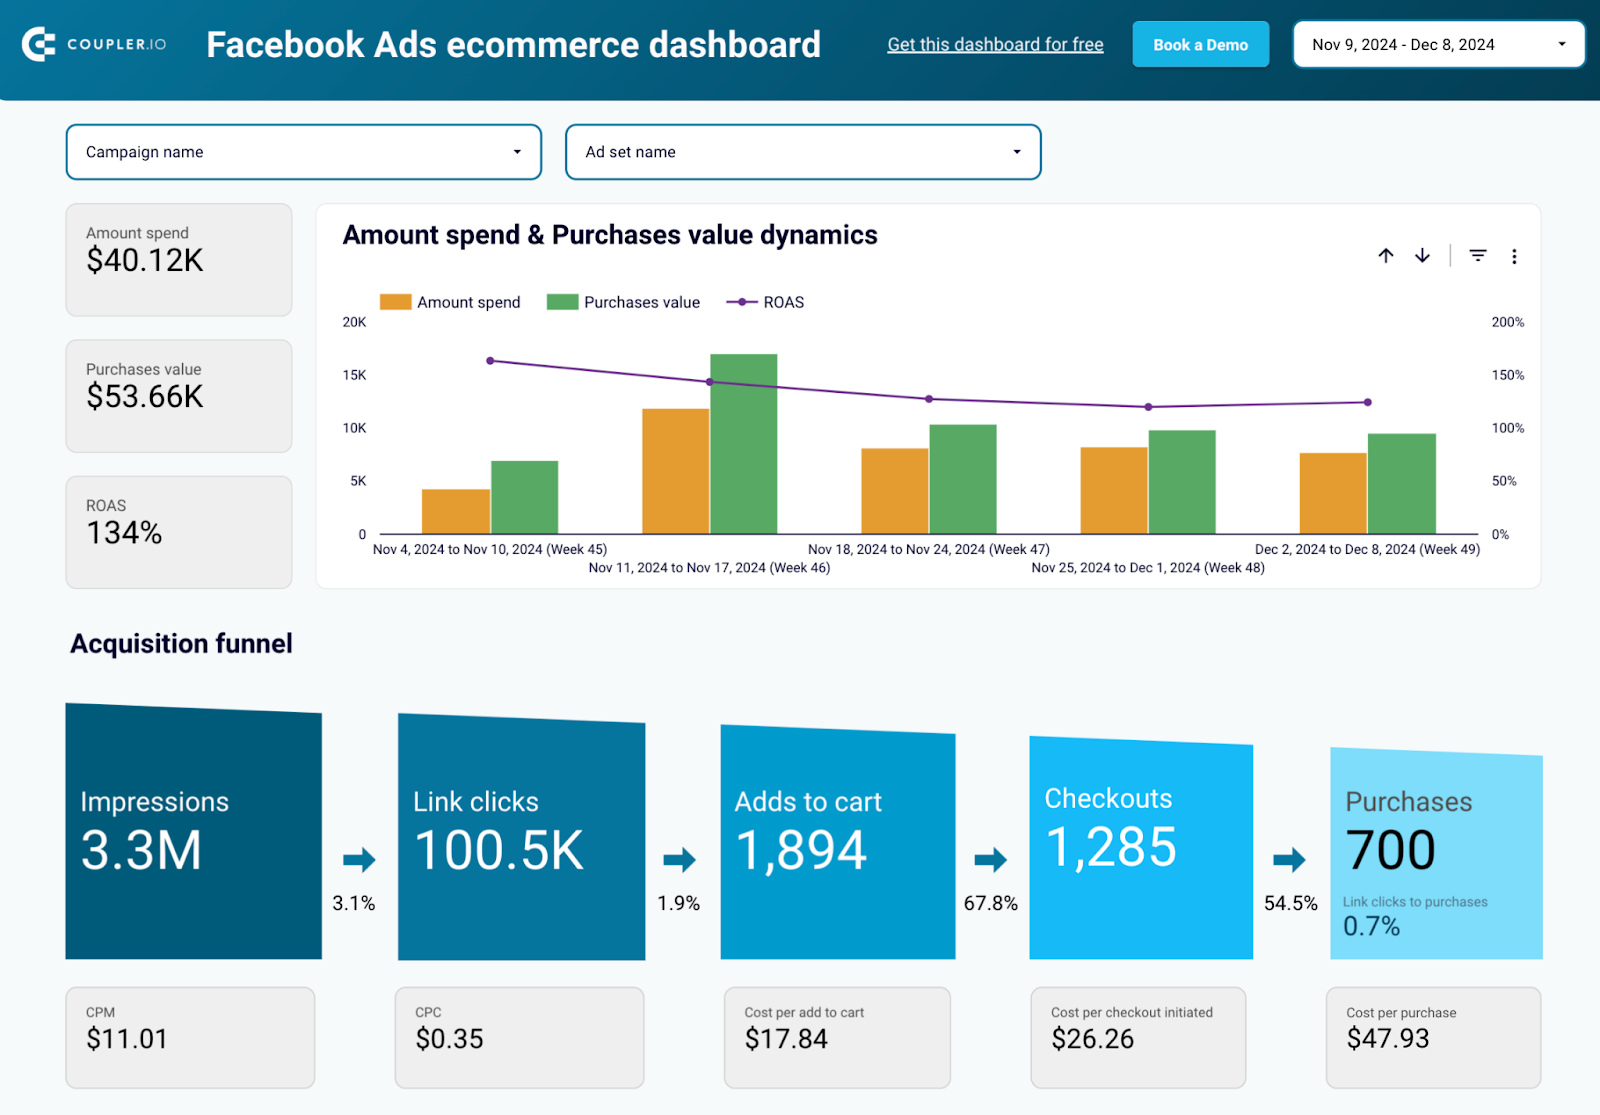
This is a comprehensive dashboard to track the performance of your advertising campaigns on Facebook for e-commerce. By comparing ad spend, purchases, and ROAS, it helps you to understand the profitability and efficiency of your advertising efforts, and see opportunities to optimize performance.
Facebook Ads ecommerce performance dashboard
 Preview dashboard
Facebook Ads ecommerce performance dashboard
Preview dashboardWith the Facebook Ads e-commerce performance dashboard, you can:
- Track weekly trends in ad spend, purchases, and ROAS to evaluate campaign performance over time.
- Identify periods with peak purchases or cost efficiency to allocate budgets effectively.
- Visualize the customer journey from impressions to link clicks, add-to-cart actions, and final purchases.
- Analyze drop-off rates between stages in the funnel to fine-tune your ad and checkout strategies.
- Evaluate cost per action at every stage, such as CPC, cost per add-to-cart, and cost per purchase, to maximize ROI.
This e-commerce dashboard template from Coupler.io is ideal for e-commerce marketers, business owners, and agencies. It integrates seamlessly with your Facebook Ads data and allows you to get live updates up to every 15 minutes. With real-time data at your fingertips, you can track performance effortlessly and make timely adjustments.
Template rating
| Integrability | ⭐⭐⭐⭐⭐ |
| Usability | ⭐⭐⭐⭐ |
| Actionability | ⭐⭐⭐⭐⭐ |
9. Meta Ads and Google Ads campaign performance report template in Looker Studio
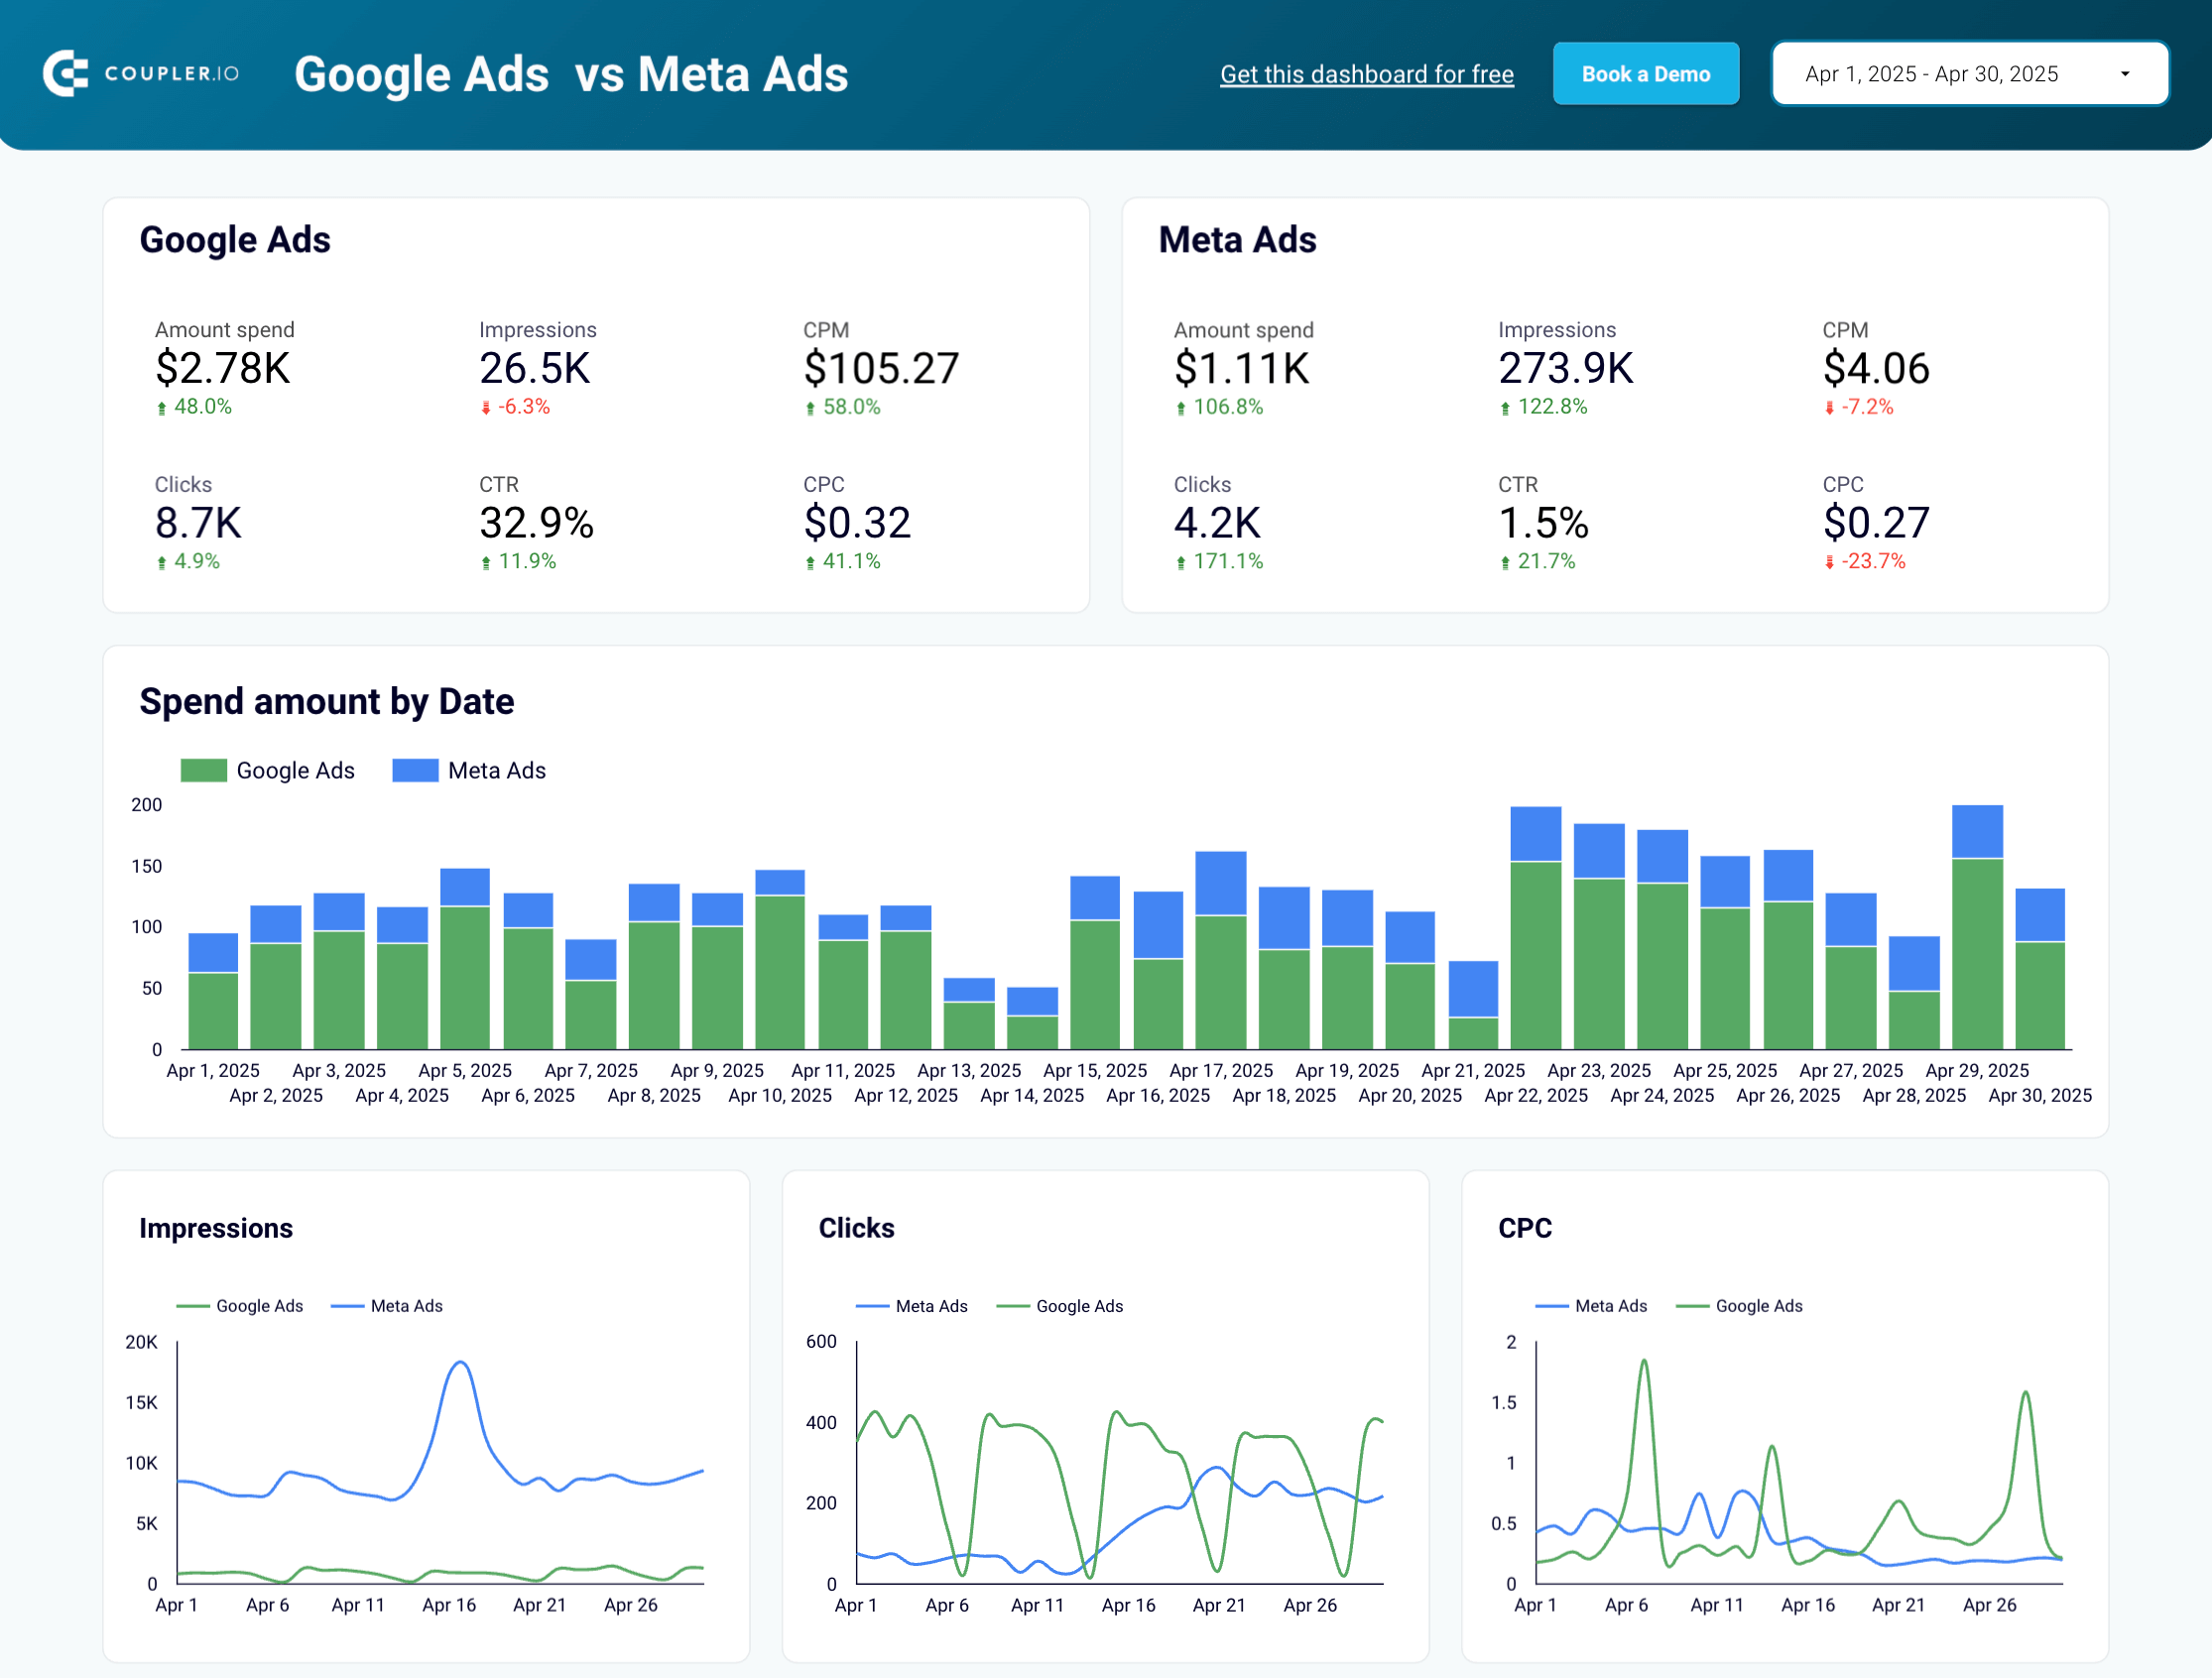
If you run ads on Instagram and Google as well as Facebook, this template gives you a complete overview of performance. You can compare key metrics for both Meta and Google, monitor the effectiveness of ads across platforms, and assess how your budget is allocated across campaigns.
Meta Ads and Google Ads campaign performance dashboard
 Preview dashboard
Meta Ads and Google Ads campaign performance dashboard
Preview dashboardThis dashboard allows you to:
- Directly compare performance metrics for Google and Meta ads: impressions, clicks, spend, CTR, CPM, and CPC. Use the date picker to explore results for different periods (e.g., past 7 days, 12 months, etc.).
- Track your daily spend on each platform to understand how your budget is distributed and if there is room for improvement.
- Monitor fluctuations in clicks, impressions, and CPC to identify the platform with the most consistent results.
- Analyze the granular performance of individual Meta and Google campaigns. Quickly spot top-performing ads and take steps to expand or replicate them on other platforms.
- View monthly dynamics in a separate page to track performance evolution and pinpoint the platform with the highest ROI.
Setting up the dashboard is simple! Create a free account with Coupler.io, then follow the instructions within the template to load data from Meta and Google Ads into Looker Studio.
Template rating
| Integrability | ⭐⭐⭐⭐⭐ |
| Usability | ⭐⭐⭐⭐ |
| Actionability | ⭐⭐⭐⭐⭐ |
10. Meta Ads monthly performance dashboard template
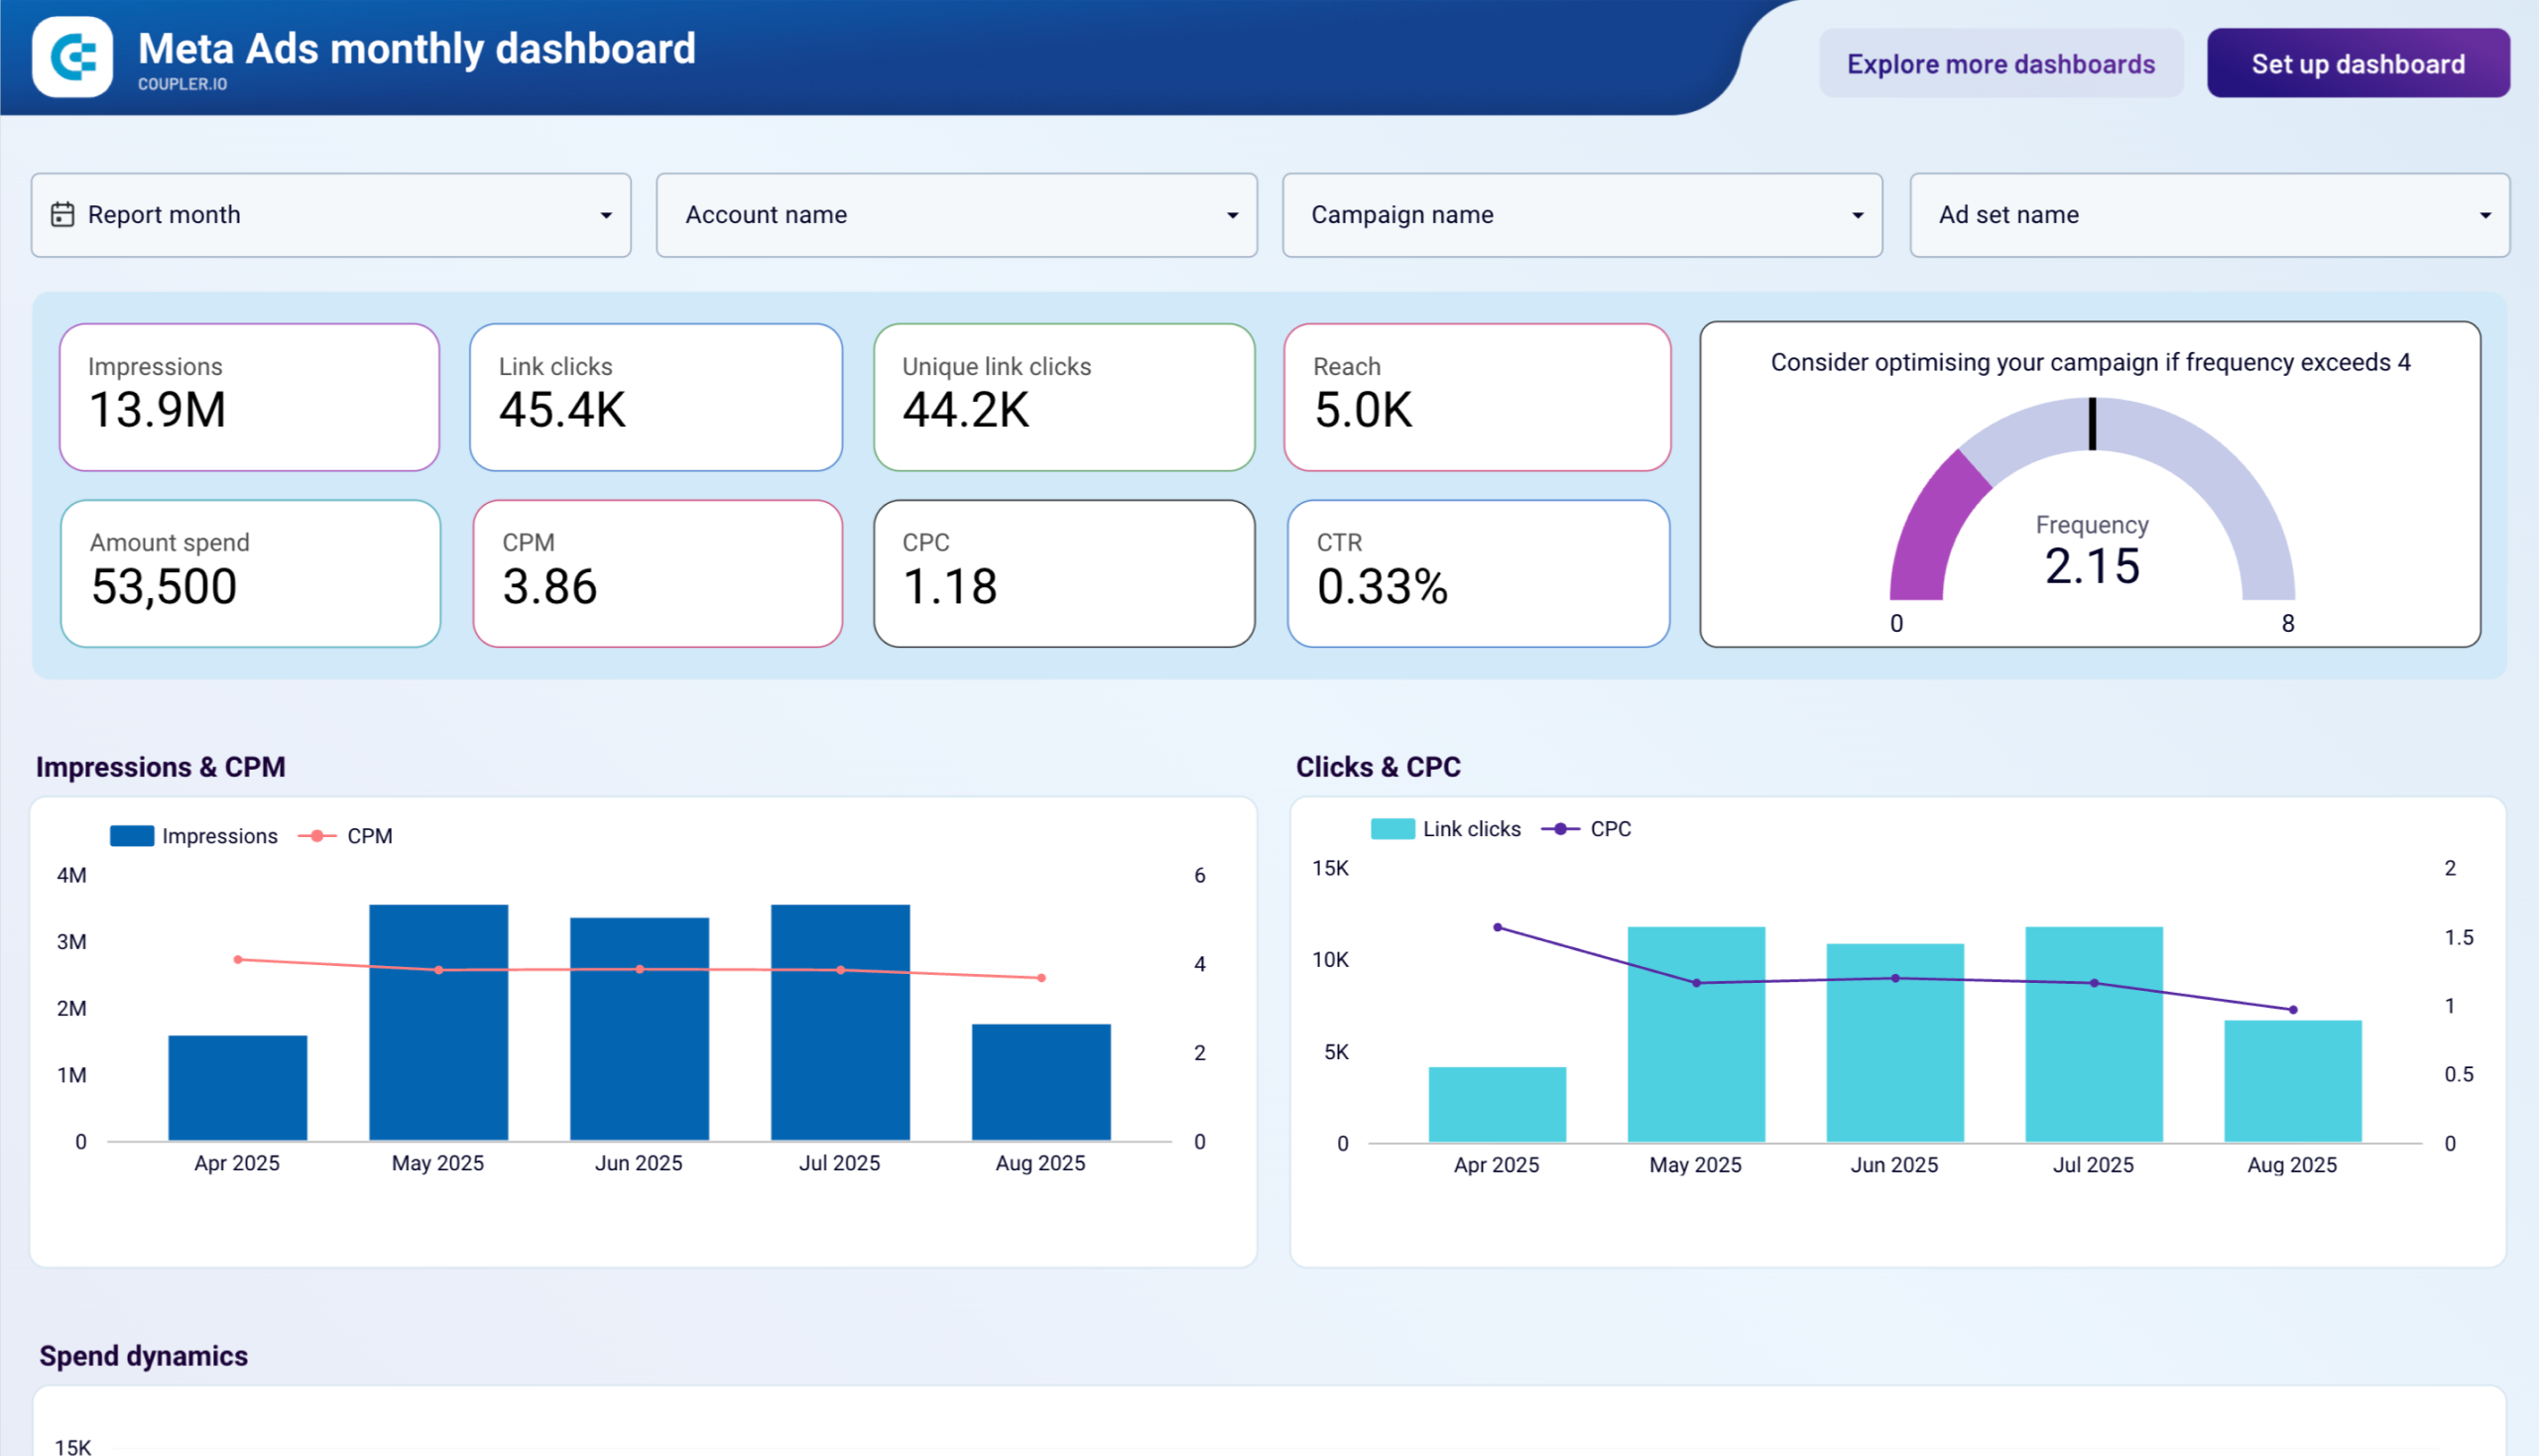
This Meta Ads monthly performance dashboard helps marketing teams track their Facebook and Instagram advertising performance with a focus on monthly trends and strategic insights. The dashboard provides comprehensive demographic analysis, device performance tracking, and geographic market evaluation to optimize your social media advertising strategy.
Meta Ads monthly performance dashboard
 Preview dashboard
Meta Ads monthly performance dashboard
Preview dashboardThis dashboard allows you to:
- Track monthly performance trends across key metrics like impressions, clicks, spend, and CTR with period-over-period comparisons
- Analyze demographic engagement patterns by age groups and gender to identify your highest-converting audience segments
- Monitor device performance across iPhone, Android, desktop, and tablet users to optimize creative formats and bidding strategies
- Evaluate geographic market performance with country-level breakdowns to identify expansion opportunities and budget reallocation needs
- Manage ad frequency levels with visual frequency meters to maintain optimal exposure without overwhelming your audience
This Looker Studio template is powered by Coupler.io, making it easy to automatically sync your Meta Ads data. The monthly focus makes it ideal for executive reporting, strategic planning, and quarterly campaign optimization. Simply connect your Facebook and Instagram ad accounts through the built-in connector, and the dashboard will populate with your campaign data. The Setup guide tab contains detailed setup instructions to get you started quickly.
Template rating
| Integrability | ⭐⭐⭐⭐⭐ |
| Usability | ⭐⭐⭐⭐⭐ |
| Actionability | ⭐⭐⭐⭐⭐ |
11. Meta Ads creatives report template in Looker Studio
This Meta Ads creatives dashboard offers a detailed view of the performance of all your creatives. It helps you analyze impressions, clicks, spend, and engagement metrics for each creative and how it impacts your ad performance. With insights into cost metrics like CPC, CPM, and CTR, you can optimize your ad creatives for higher engagement.
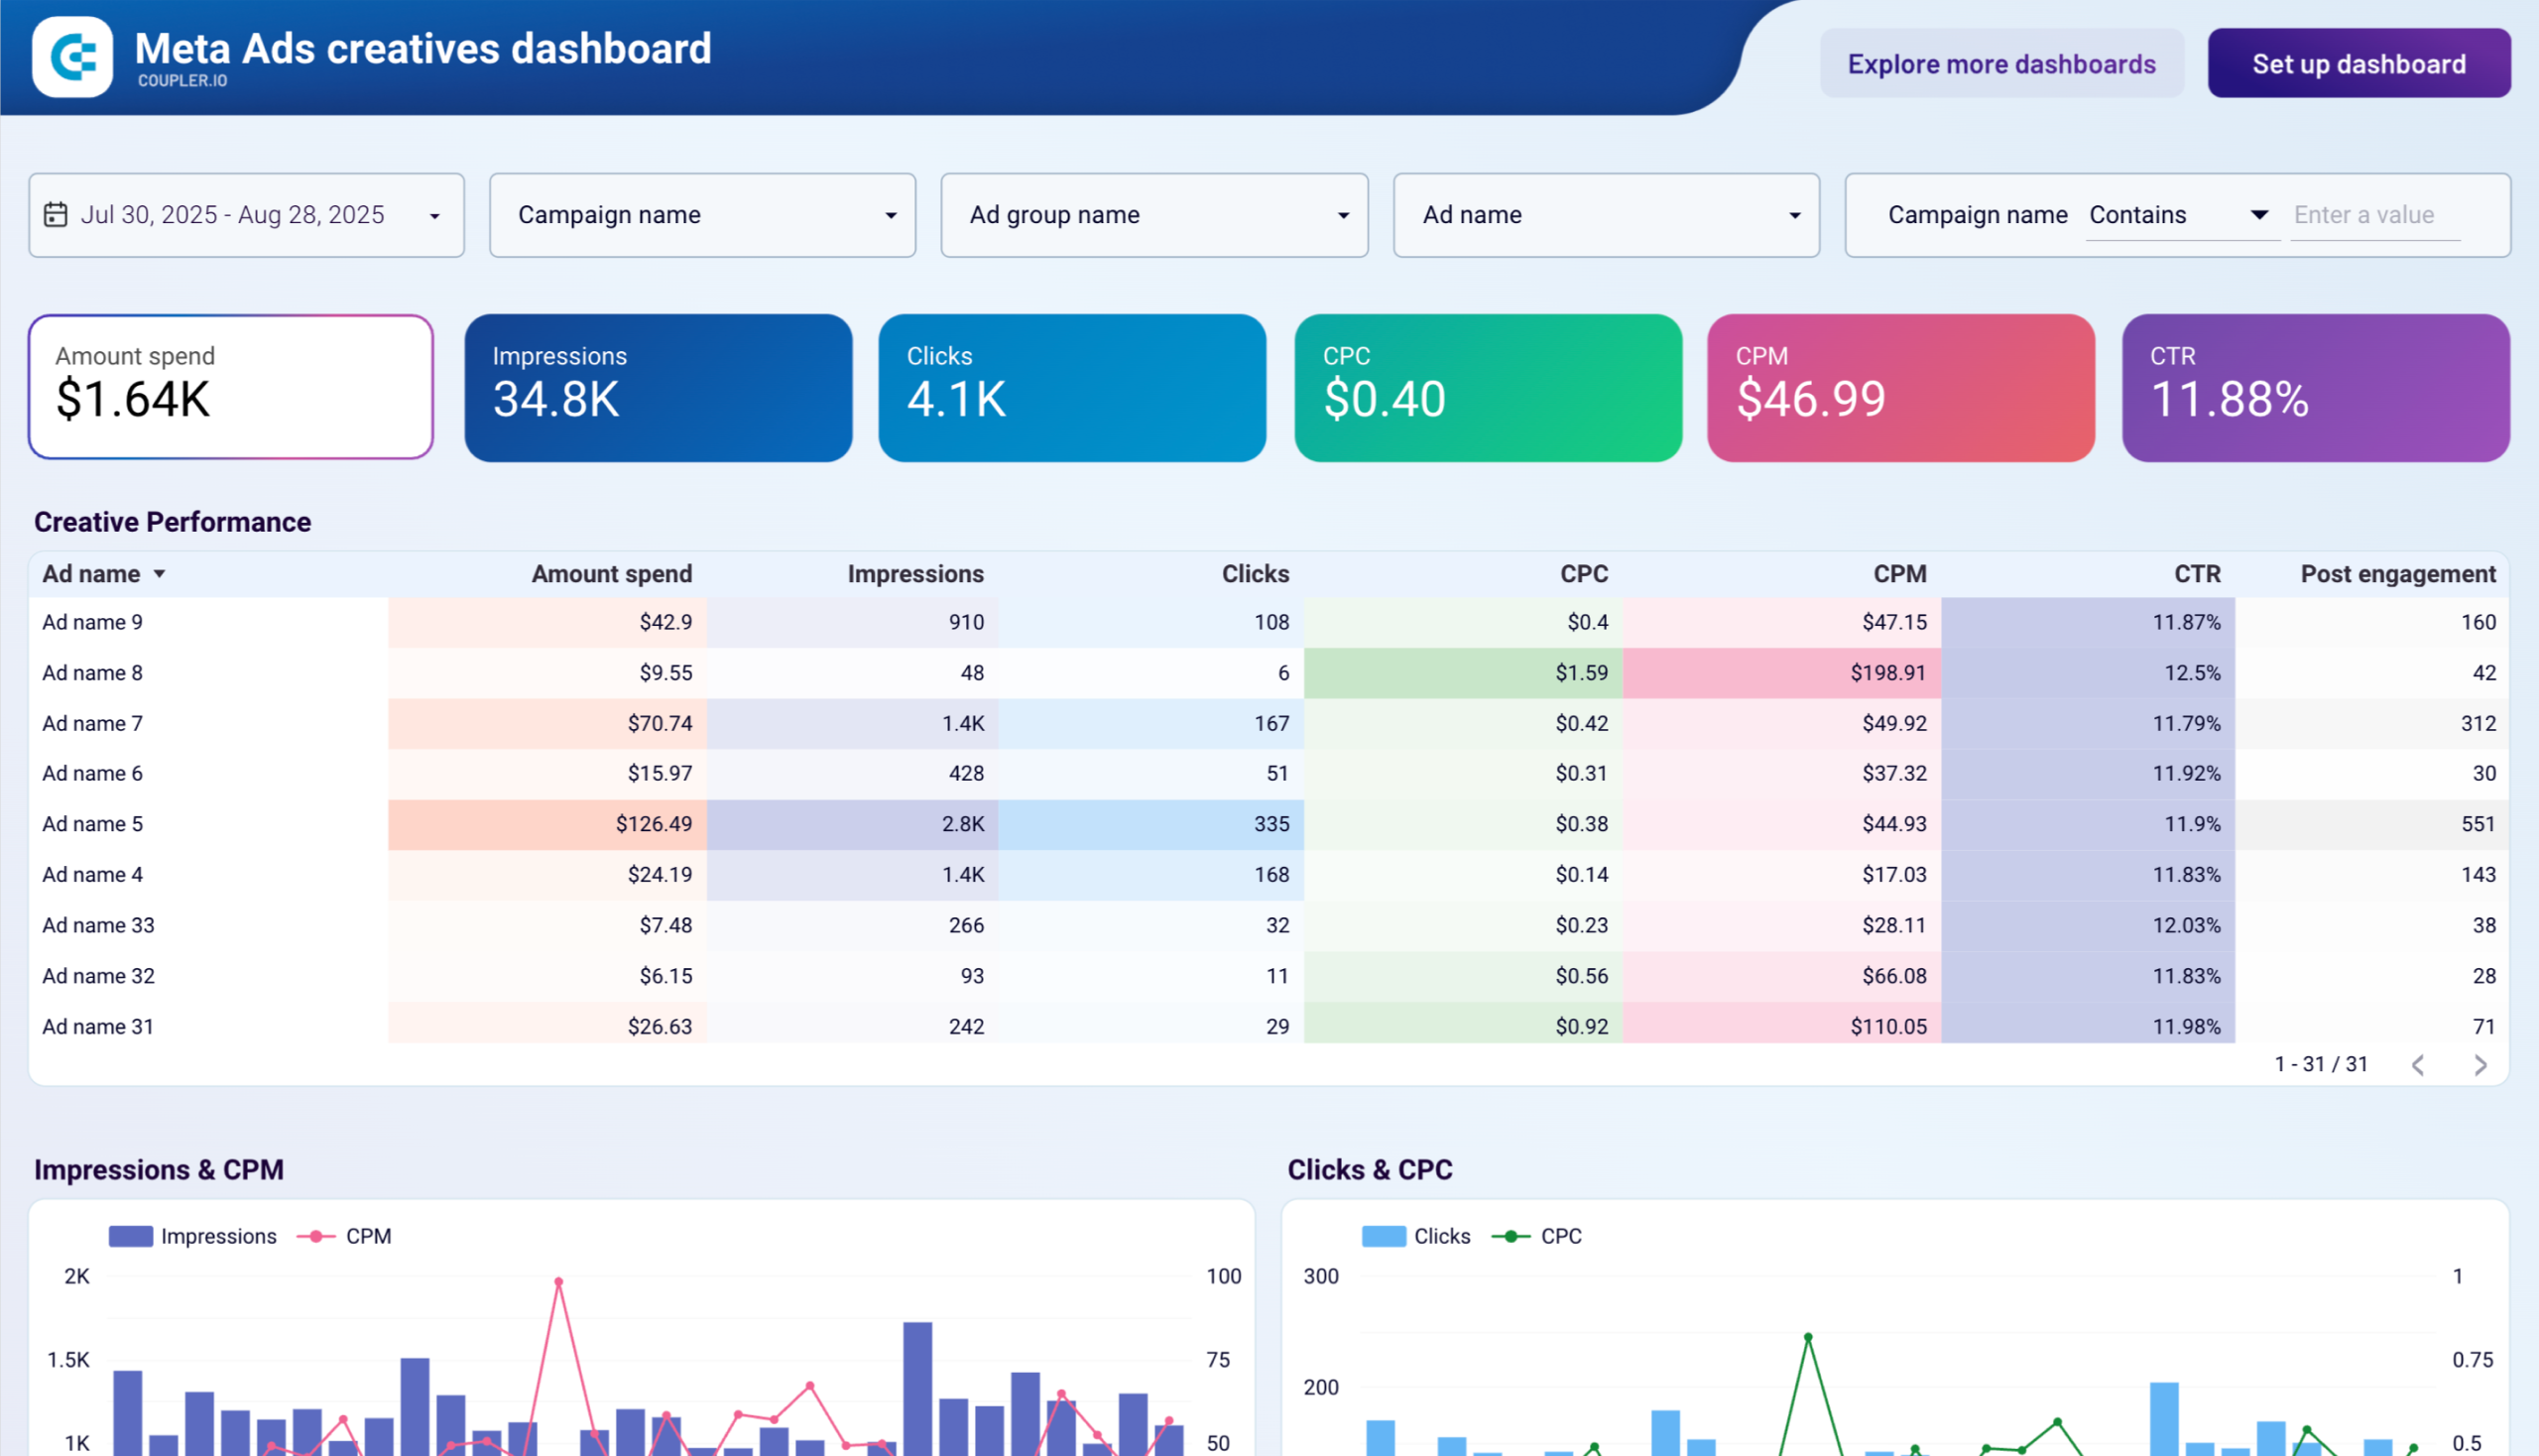
This dashboard is useful to:
- Compare impressions, clicks, and spend across different ad creatives. Evaluate key metrics like CPC, CPM, and CTR to identify the most cost-effective and engaging creatives.
- Understand patterns and identify which creatives deliver the best results.
- Use engagement data like post interactions to adjust and improve your ad campaigns.
- Identify low-performing creatives and refine them for better audience engagement.
- Visualize daily spending trends to monitor how your ad budget is being utilized over time.
This Looker Studio dashboard template for Ad creatives is powered by Coupler.io. It is easy to use and comes ready out of the box. With a built-in connector, you can load data from your Meta Ads account into Looker Studio easily. Once set up, all your creative performance data is in one place to analyze key metrics like CPC, CTR, and engagement right away. With live data updates every 15 minutes, you can quickly assess performance and make informed decisions to optimize your ad campaigns.
Template rating
| Integrability | ⭐⭐⭐⭐⭐ |
| Usability | ⭐⭐⭐⭐ |
| Actionability | ⭐⭐⭐⭐⭐ |
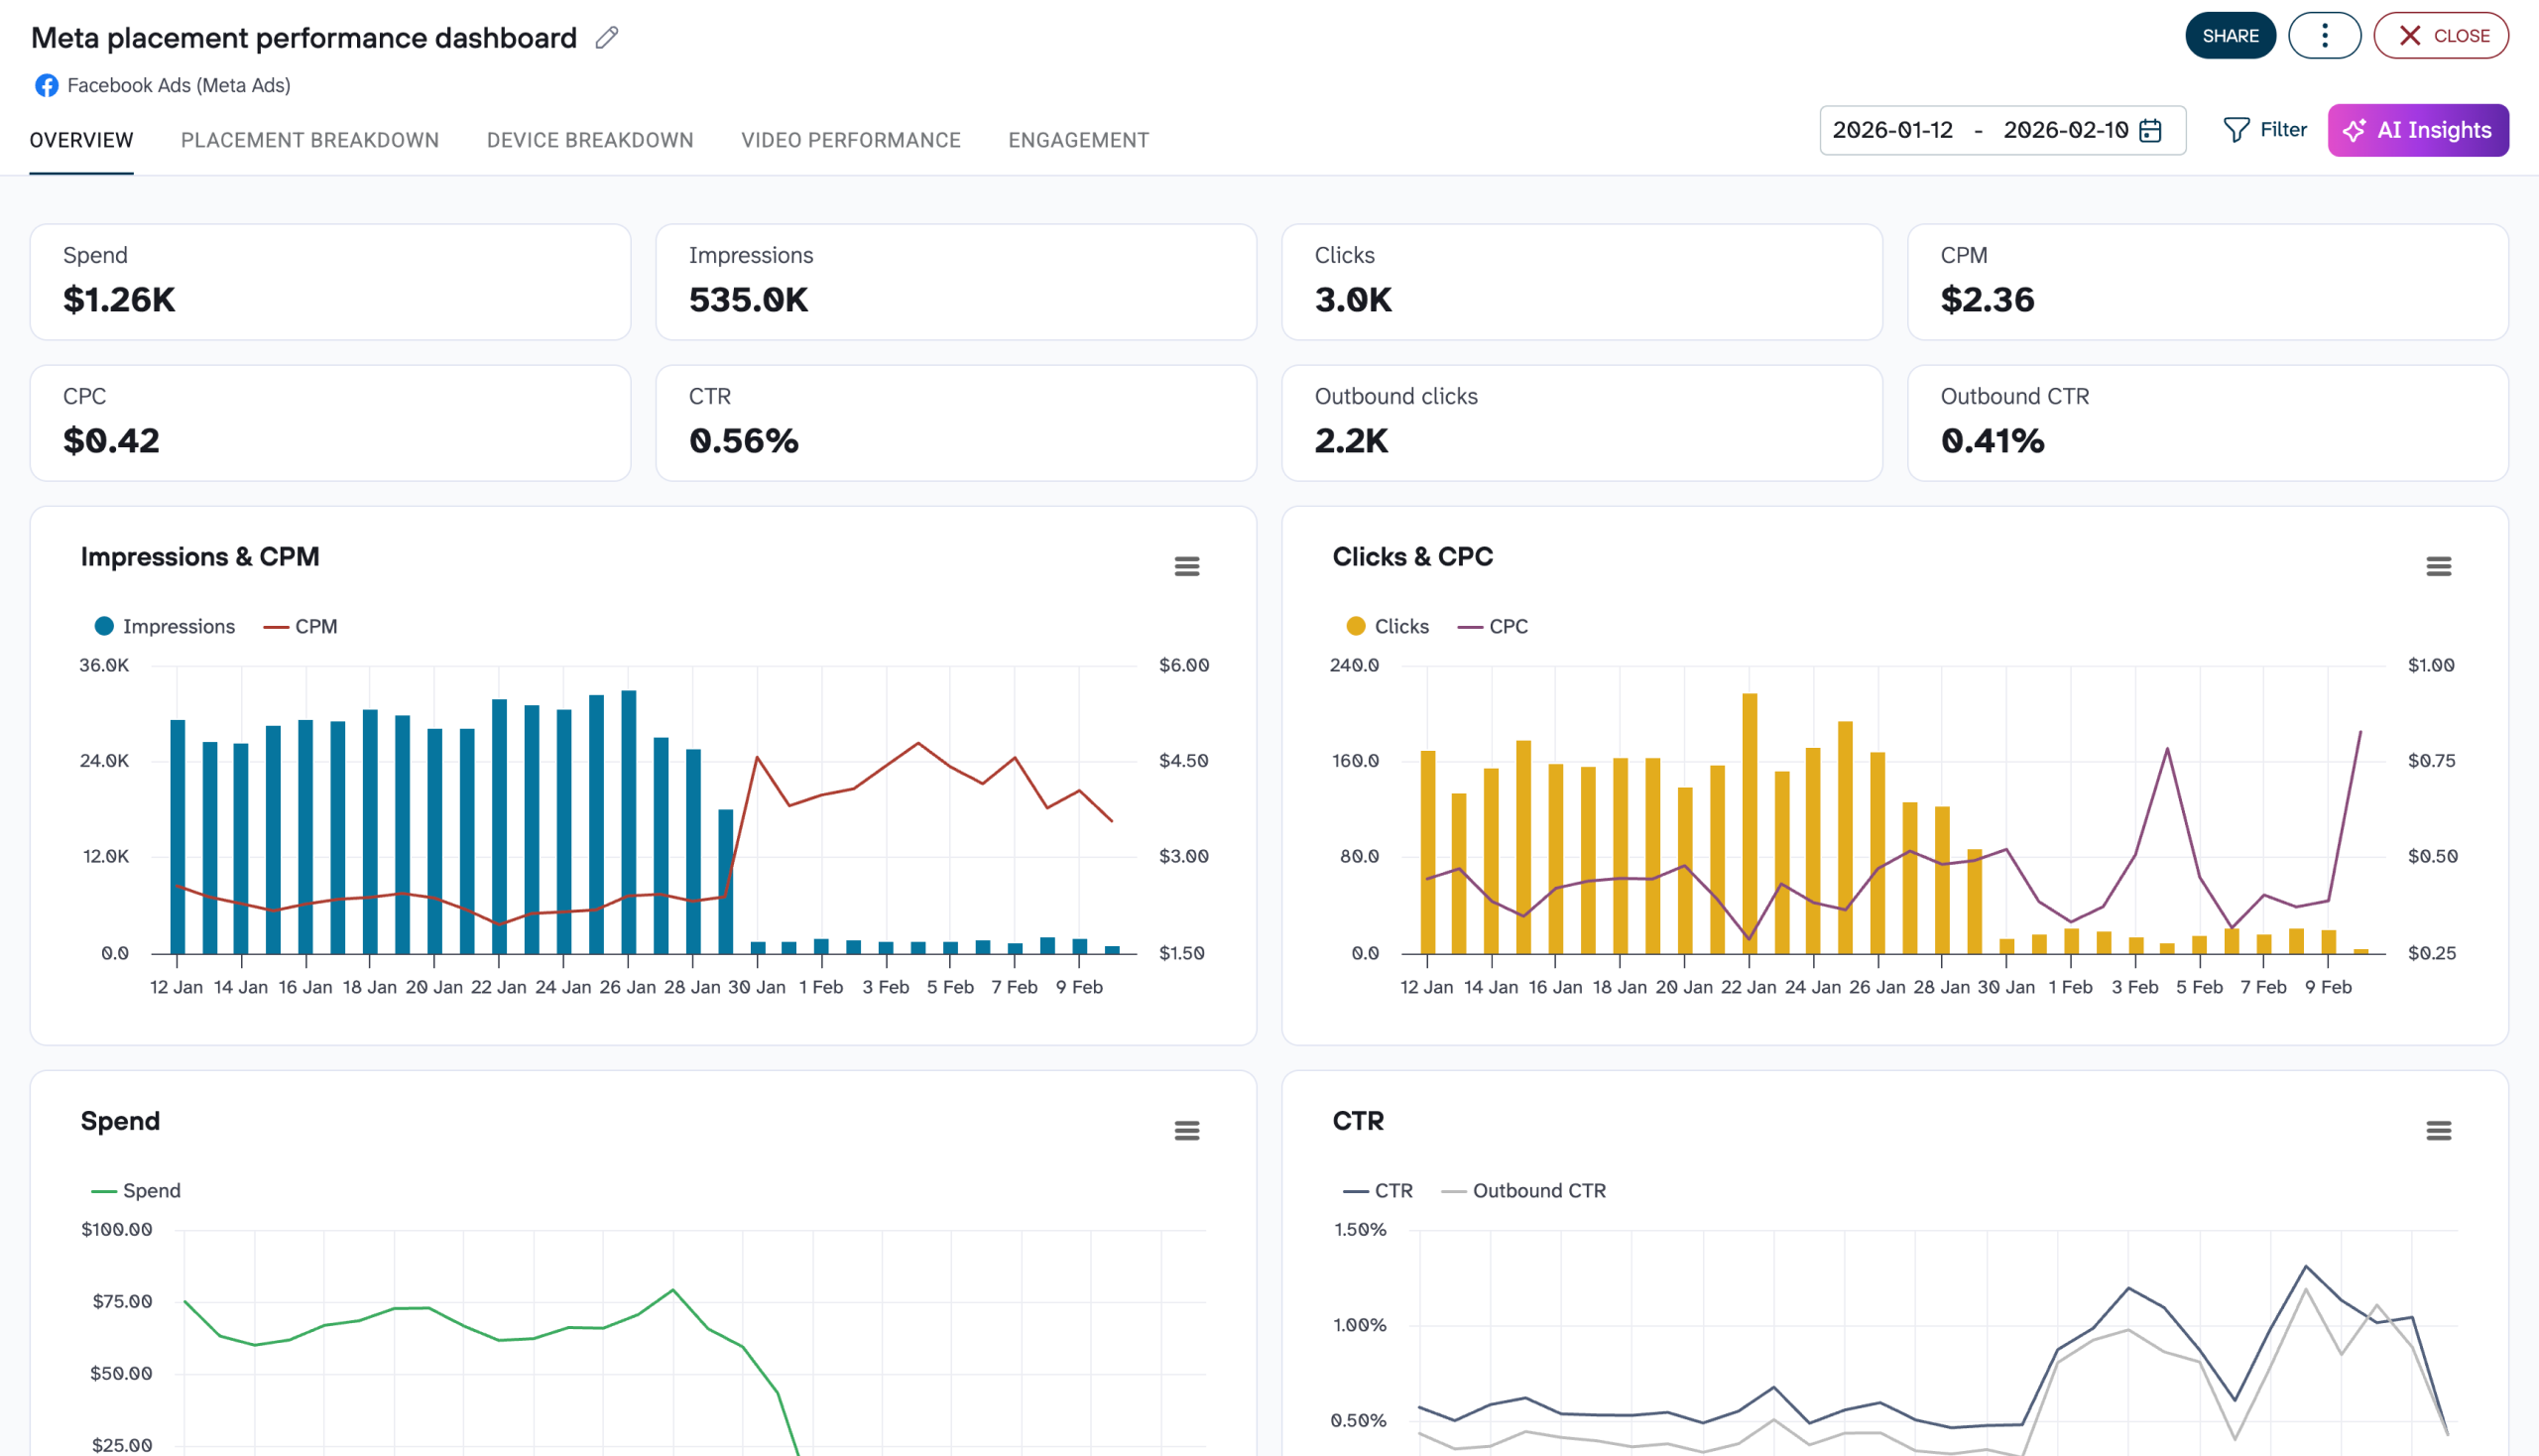
12. Meta Ads placement dashboard template
The Meta Ads placement dashboard lets you analyze Facebook and Instagram advertising performance broken down by ad placement. The dashboard also goes a layer deeper with device-level breakdowns and a video completion funnel, so you’re not limited to click data alone.
Meta Ads placement dashboard template
 Preview dashboard
Meta Ads placement dashboard template
Preview dashboardThe dashboard is especially useful when you’re running Advantage+ placements and want to audit where Meta is actually spending your budget. The dashboard allows you to:
- Track weekly performance shifts
- Compare placement efficiency
- Analyze device-level performance
- Evaluate video ad retention
- Measure engagement beyond clicks
This is an automated template powered by Coupler.io, which pulls data directly from your Facebook Ads account and keeps the dashboard updated on a schedule. Connect your ad account once, and the report populates with your placement-level data automatically.
Template rating
| Integrability | ⭐⭐⭐⭐⭐ |
| Usability | ⭐⭐⭐⭐ |
| Actionability | ⭐⭐⭐⭐⭐ |
13. Facebook Ad reporting template in Google Sheets
If you get used to running reporting or analytics in spreadsheets, then check out this Facebook ad reporting template in Google Sheets by Supermetrics. The template contains a few tabs, with the first one dedicated to a high-level monthly report. Here you can see several ads metrics and their dynamics displayed with the help of sparklines in Google Sheets.
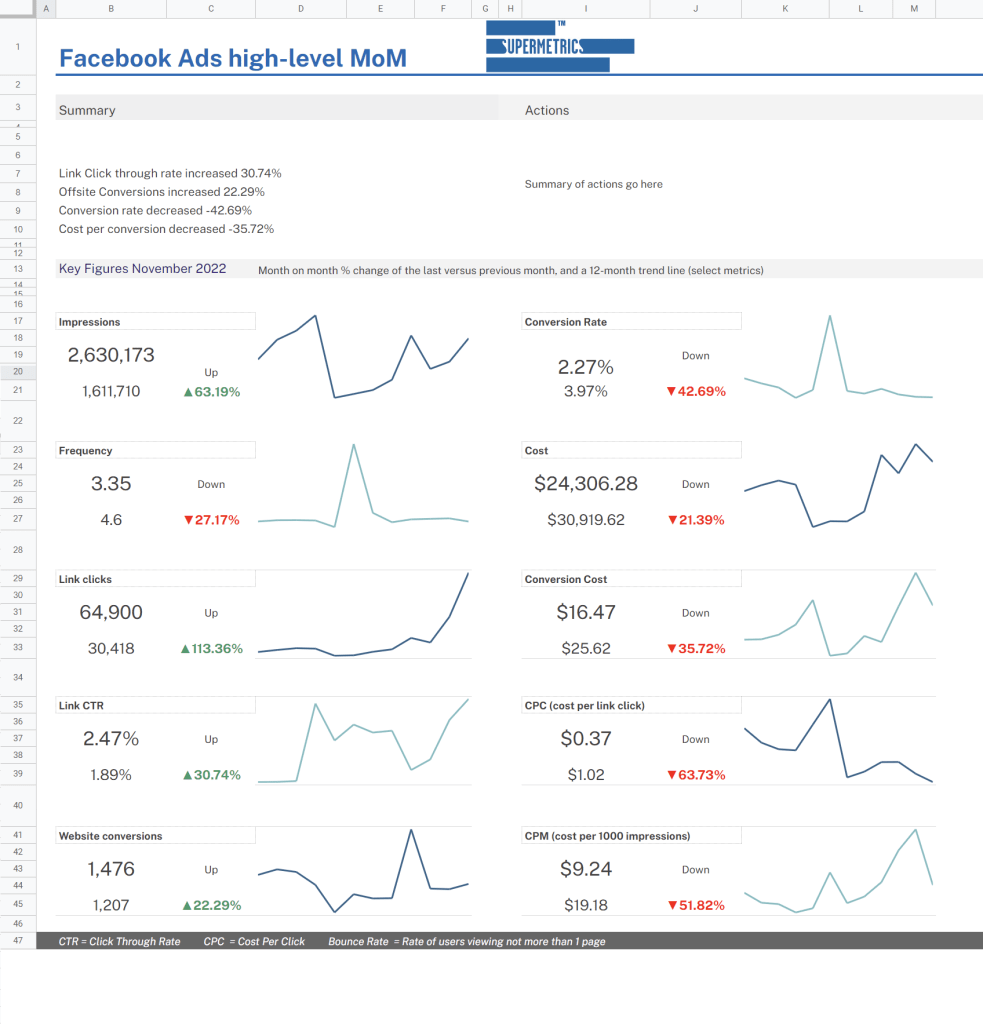
Other tabs are mostly spreadsheets without any visualizations. They show detailed campaign performance, monthly performance, device stats, and age & gender stats. You can connect this template to your Facebook Ads account with the help of Supermetrics. However, the connection flow is not as smooth as with Coupler.io since you’ll need to install the Google Sheets add-on.
Template rating
| Integrability | ⭐⭐⭐⭐ |
| Usability | ⭐⭐⭐⭐⭐ |
| Actionability | ⭐⭐⭐ |
14. Facebook Ad test report template in Tableau
Let’s get back to templates built with BI tools. Now it’s Tableau’s turn. This Facebook Ads report template contains different ad performance metrics grouped by sections: campaign, ad set, and audience. In addition to bar and column charts, you can also see a scatter plot as a visualization for the Distribution of Ad Sets by Spent.
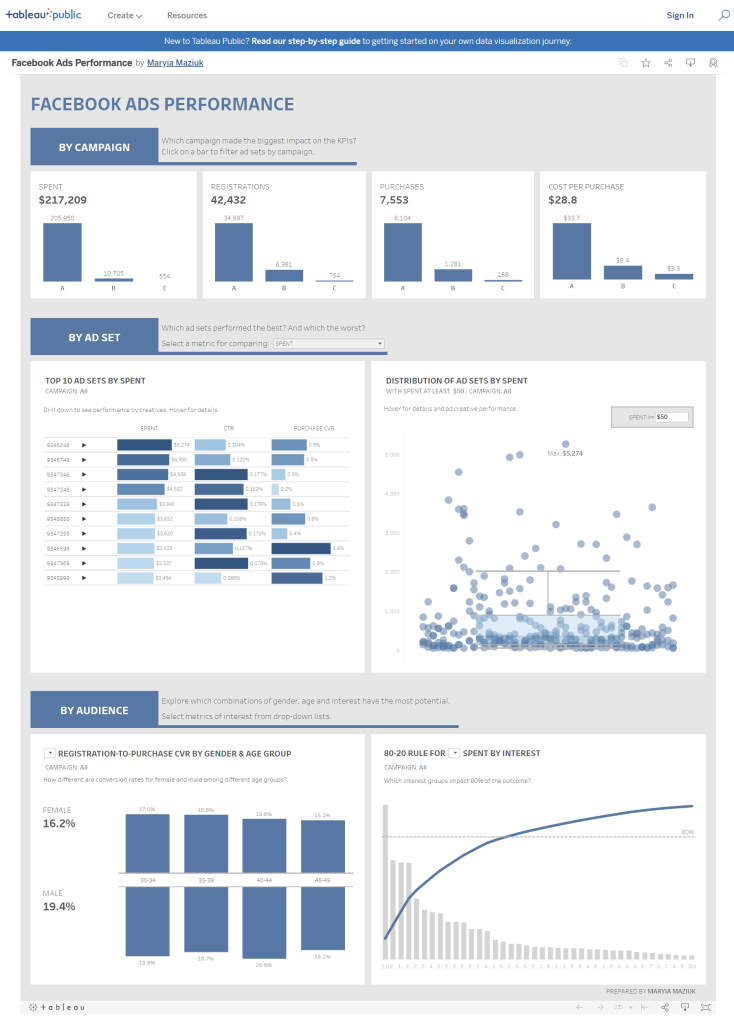
The template is a work by an analyst at Exness. She shared her template on Facebook Ads performance via Tableau Public so you can download and use it for your project. However, unlike the previously mentioned options, this one does not provide you with a data connector.
So, you’ll have to handle the export of Facebook Ads data to the template yourself, for example, with the help of Coupler.io. You can easily automate exports of Facebook Ads data to either BigQuery, Google Sheets, or Excel. Any of these destinations can be directly synchronized with Tableau becoming a data source for your report.
Template rating
| Integrability | ⭐⭐ |
| Usability | ⭐⭐⭐⭐ |
| Actionability | ⭐⭐⭐ |
Facebook Ad report templates that require payment
15. Facebook Ads performance template
This Facebook Ads Performance template gives you a complete overview of the most important KPIs. You can check how your Facebook Ads campaigns are performing, zoom in on details, and analyze your ad data.
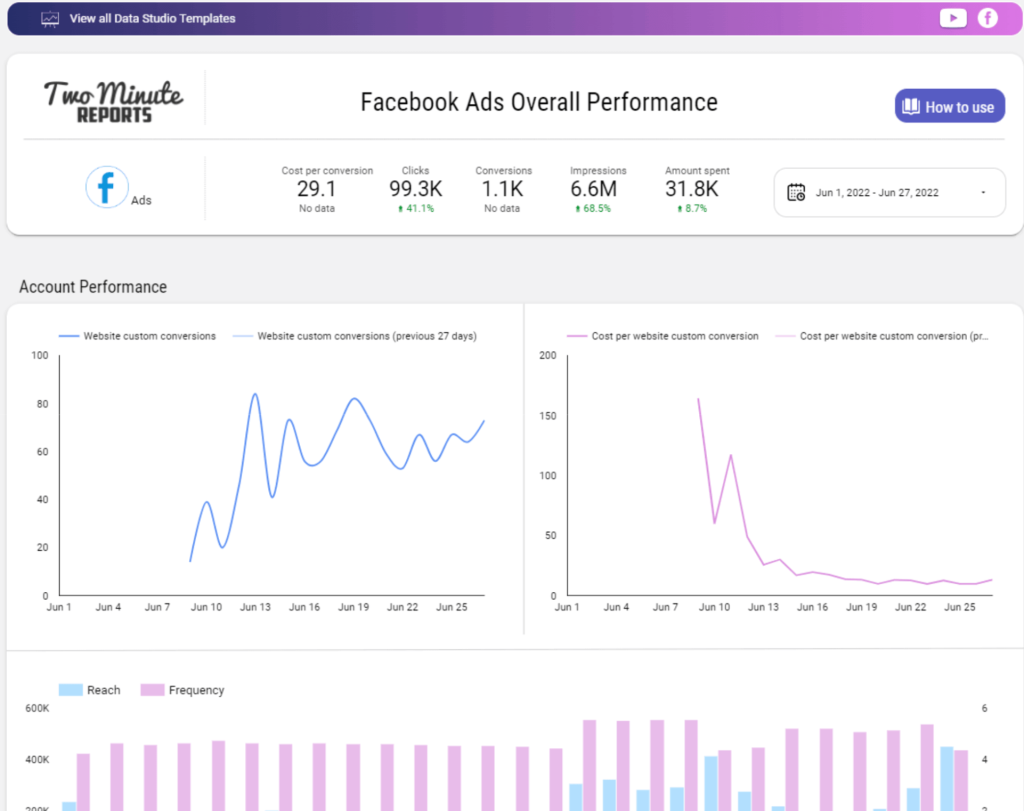
The dashboard reflects such metrics as amount spent, impressions, conversions, clicks, cost per conversion, etc. It allows you to track changes over time and compare results to the outcomes received in previous periods.
Template rating
| Integrability | ⭐⭐⭐⭐ |
| Actionability | ⭐⭐⭐⭐⭐ |
| Usability | ⭐⭐⭐⭐⭐ |
16. Facebook Ads report template by Whatagraph
On the screenshot, you can only see a part of a long Facebook Ads Report: Traffic designed by Whatagraph. In total, it contains the following sections:
- Performance overview including the amount spent, number of impressions, CPC, CTR and other data.
- Engagement overview including comments, reactions, shares, etc.
- Ad performance including top campaign by CTR, top campaign by link clicks, and top 6 ads by link clicks.
- User insights and media
- User insights including data breakdowns by gender, age, and device.
- Media insights including platform placement metrics (spend, reach, link clicks, etc.)
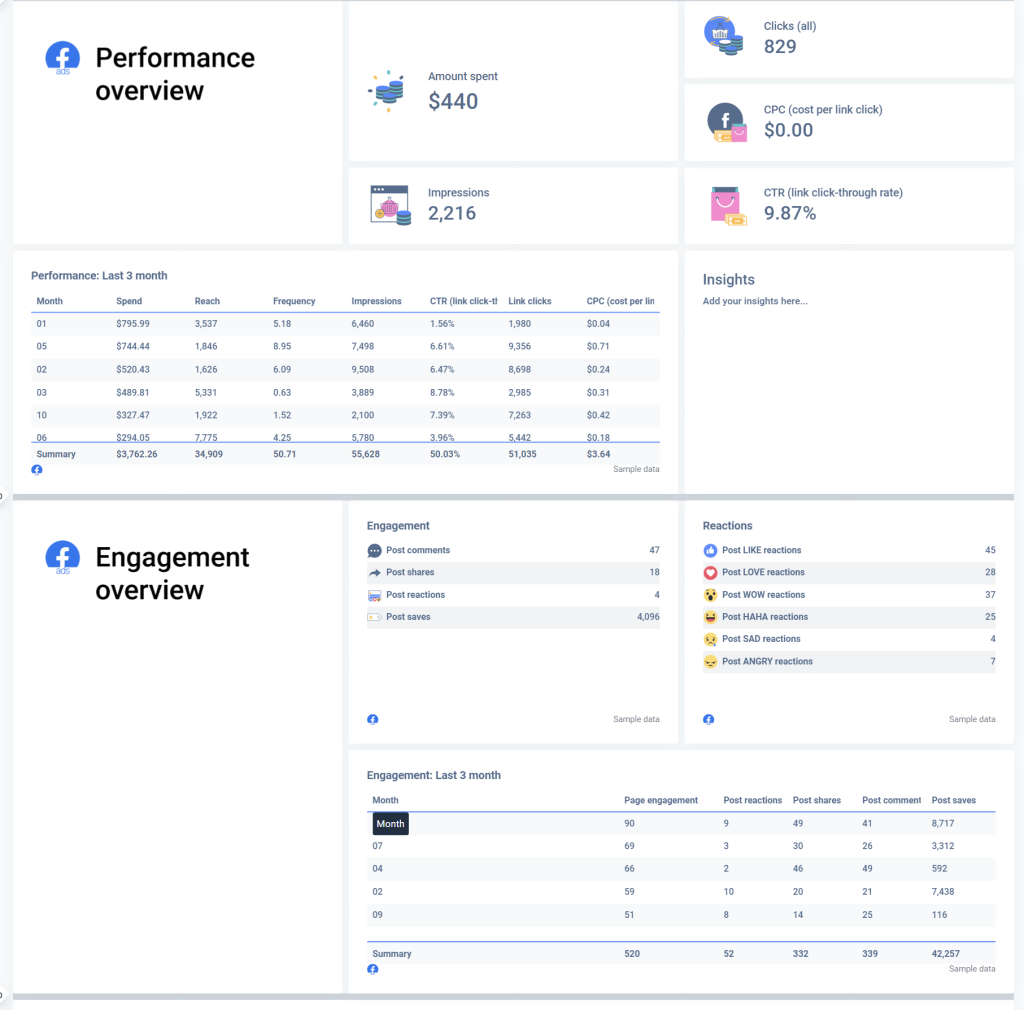
The template is available in a view-only mode. To use it, you need to create a Whatagraph account first.
Template rating
| Integrability | ⭐⭐⭐⭐⭐ |
| Usability | ⭐⭐⭐⭐⭐ |
| Actionability | ⭐⭐⭐⭐ |
17. Facebook Ads report template by Swydo
This Facebook Ads example report by Swydo allows you to track specific KPIs you need to help you or your client make insightful decisions.
- Key metrics: Amount Spent, Reach, Clicks, CTR, CPC, Impressions, Leads, Cost per Lead.
- Breakdowns by dimension: Amount Spent and CPC by Day, Campaign Performance, Clicks by Platform, Impressions and Reach by Campaign, Top-5 Ad Creative Performance, Ad Set Performance, Clicks by Region, Placement Performance, CPC and Amount Spent by Campaign.
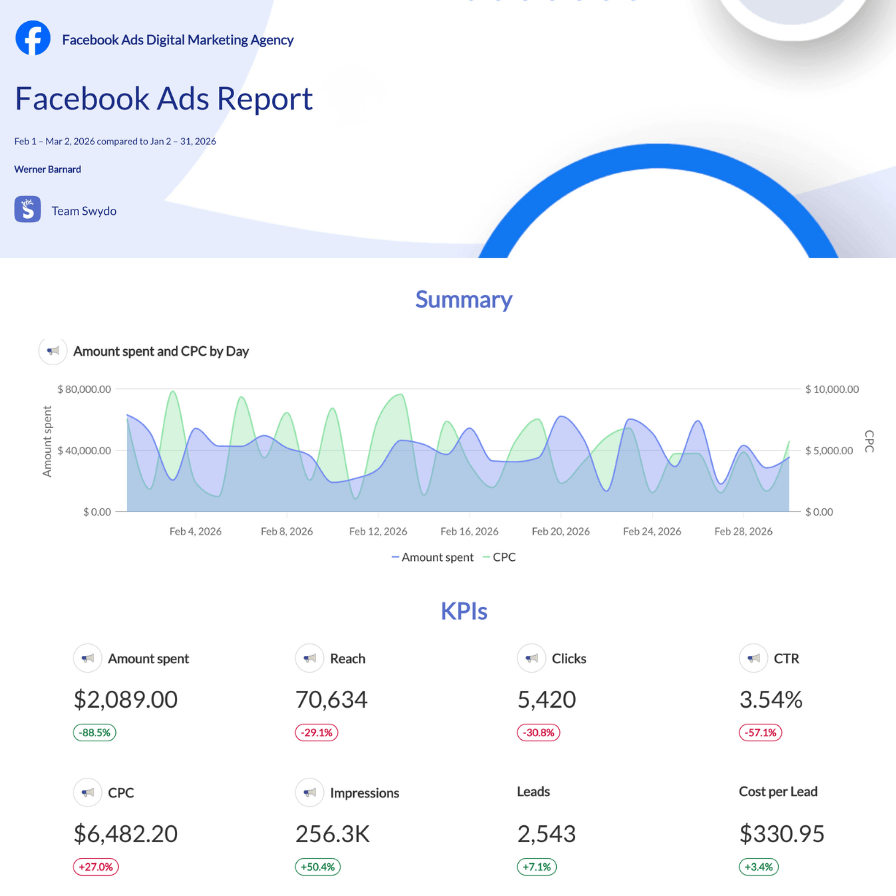
The template report is customizable, i.e. you can include pre-defined KPIs values and data visualizations (widgets). Also, it’s possible to include data taken from other sources, not only Facebook Ads, to get comprehensive insights across all paid campaigns you run.
Template rating
| Integrability | ⭐⭐⭐⭐ |
| Usability | ⭐⭐⭐⭐ |
| Actionability | ⭐⭐⭐⭐ |
18. Facebook Ads report template by DataMyth
And now, the last dashboard on our list of Facebook Ad reporting templates. We considered the options designed by Improvado, Dashthis, and other companies specialized in such solutions. However, in the end, the template provided by DataMyth got the most of our votes.
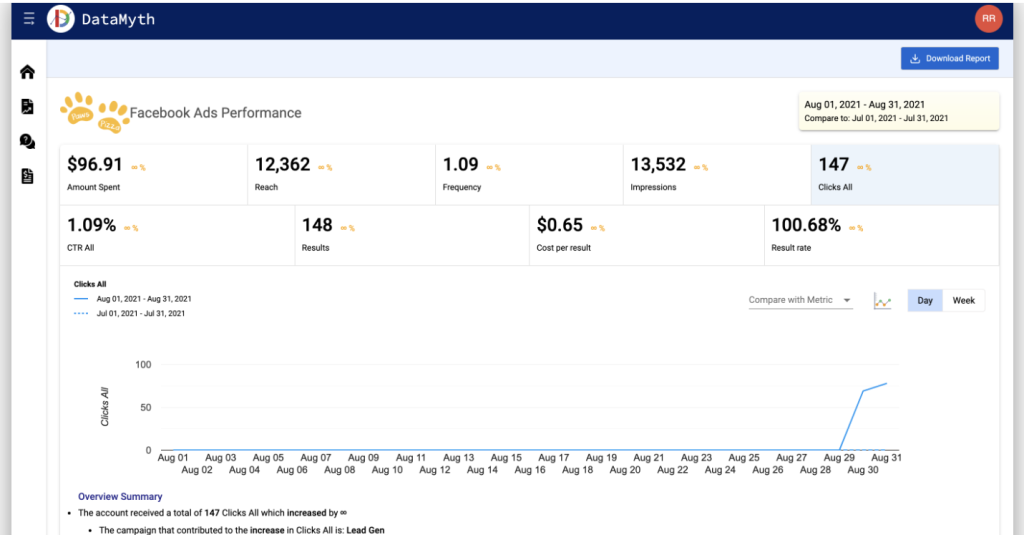
It’s a long report consisting of the following sections:
- Facebook Ads performance
- Platform and placement performance
- Objective performance
- Campaign performance
- Ad Set performance
- Ads performance
- Demographic performance
- Device performance
- Country/Location performance
Each section is accompanied by the Observations & Insights block which is generated based on the data imported and populated from Facebook Ads.
Template rating
| Integrability | ⭐⭐⭐⭐ |
| Usability | ⭐⭐⭐⭐ |
| Actionability | ⭐⭐⭐⭐ |
Native Facebook Ad reporting template
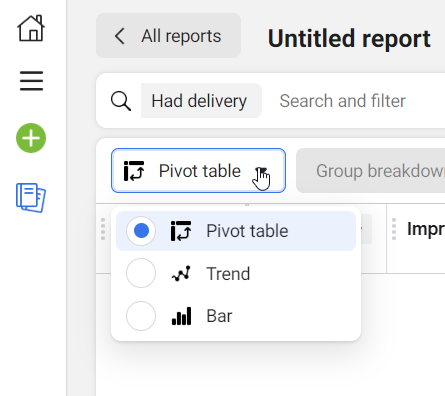
It’s most likely that you were not aware of out-of-the-box Facebook Ads reporting templates. However, if you read our guide on Facebook Ads reporting, you’ll learn that you can create Facebook Ads reports using one of three design layouts i.e. templates: Pivot table, Trend, and Bar.
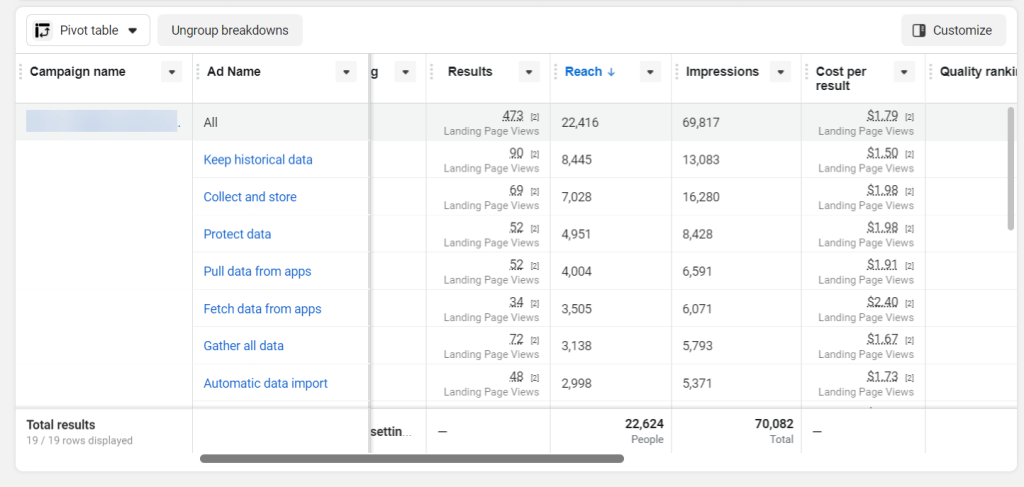
Pivot table template for Facebook Ads reports
A pivot table is a form of data organization to derive helpful conclusions easily. This Facebook Ads report template is basically a spreadsheet where columns represent Facebook Ads metrics, and rows – breakdowns. The report created using the pivot table template will let you get more details and granularity of your ads data. Here is what it may look like:
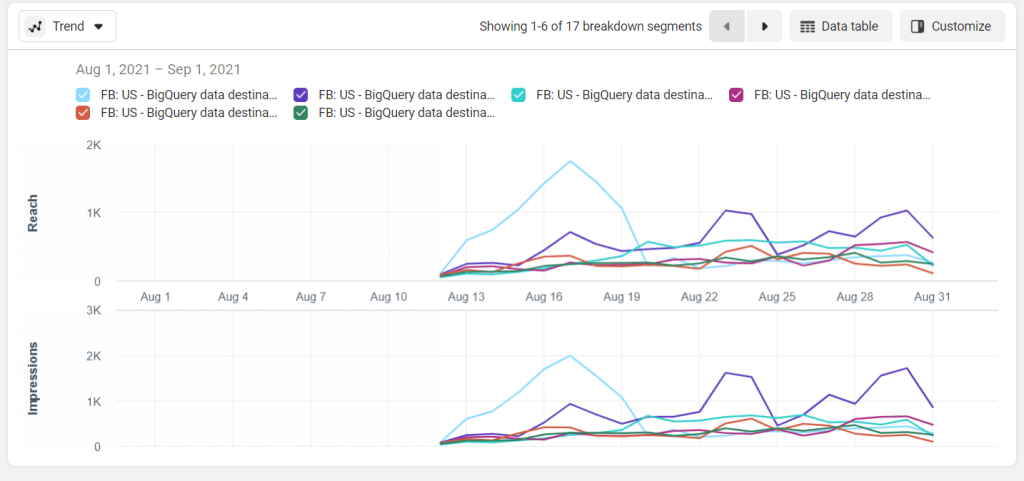
Trend template for Facebook Ads reports
Do you want to make your ads report somewhat visually appealing? Then you can check out the trend template, which includes a graph containing up to 10 lines. Lines show different breakdown segments. They stretch along the YX plane, where the X-axis represents the time interval, and the Y-axis – metrics. This Facebook Ads report template works well to compare metrics and understand trends. Here is what the report may look like:
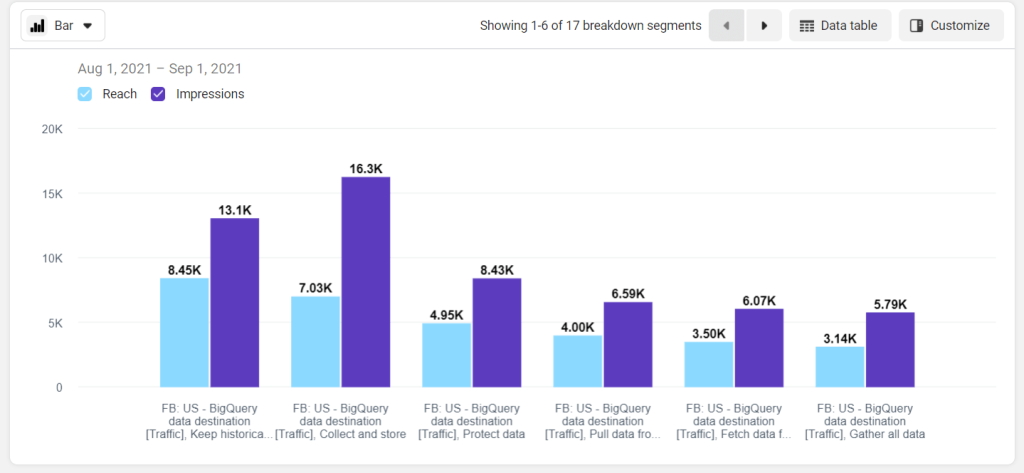
Bar template for Facebook Ads reports
The third native template for Facebook Ads reports is a bar chart. Similar to the trend template, the bar report can contain up to 10 bars, each representing up to 3 metrics. The groups of bars are represented by breakdowns. This template is good for comparing metrics across different sets of your data. Take a look at an example:
Why you should use a custom Facebook Ads report template
If the Native Facebook Ads reporting templates can meet your reporting requirements, then go ahead. They are pretty good for basic reporting and can work for small projects. You can juggle them around, however, it’s most likely that they won’t fit for more or less advanced analytics, which can grant actionable insights.
Most advanced business users tend to go with custom reports they can build on top of the data exported from Facebook Ads. Usually, the flow looks as follows:
- Select a tool for your custom Facebook Ads report. The options vary from spreadsheet apps such as Google Sheets to BI tools such as Tableau. Optionally, you can opt for one of the dedicated Facebook Ads reporting tools.
- Integrate the chosen tool with Facebook Ads to get data imported recurrently. For this, you can use such ETL connectors as Coupler.io or similar.
- Build a custom Facebook Ads report. You can do this with your own resources or by involving third-party data services.
Of course, Facebook Ads report templates can significantly simplify this flow since you won’t have to build the report from scratch. All you need to do is just connect the template to your Facebook Ads account to import data. So, let’s see what options you can consider.
Get data-driven insights from your Facebook Ads report template
Frankly, we don’t know which of these templates you’re going to choose. Maybe, the Google Sheets one will be a perfect choice for your team who may be used to running reports in spreadsheets. Or you may prefer the universal Facebook Ad reporting template by Coupler.io which allows you to combine data from multiple ad tools.
If none of the templates look good to you, or you want to tailor any of these to your specific needs, then feel free to contact the data analytics consulting service by Coupler.io. Our squad of data analysts can help you with any task related to data transformation or visualization. Check other Looker Studio Facebook Ads templates that we’ve collected for you. Good luck!

Automate PPC reporting with Coupler.io
Get started for free