Traffic isn’t just a number at the top of your online store dashboard. It reflects how well your SEO, marketing strategies, and marketing campaigns are driving potential customers to your site.
Shopify’s built-in analytics offers some helpful reports for a general overview, but if you want to dive deeper into traffic trends and visitor behavior, it has its limits.
In this post, you’ll learn how to analyze your Shopify store traffic the right way, including connecting your store to Google Analytics and using custom dashboards to bring everything together.
How to check traffic on Shopify stores?
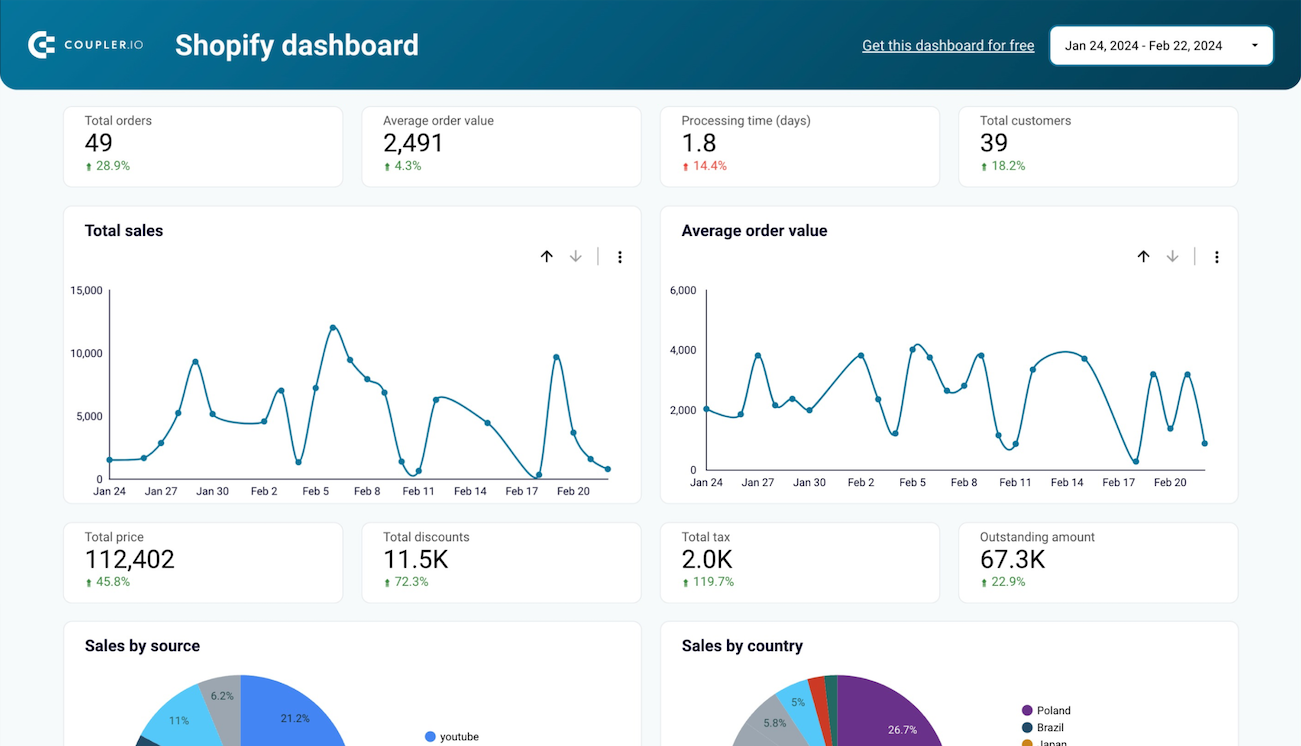
If you’re looking for a quick overview of your Shopify store traffic, Shopify analytics offers a built-in dashboard.
While it’s more limited than tools like GA4, it’s still a good starting point for basic insights. Here’s how to check your traffic:
- Log in to your Shopify Admin panel.
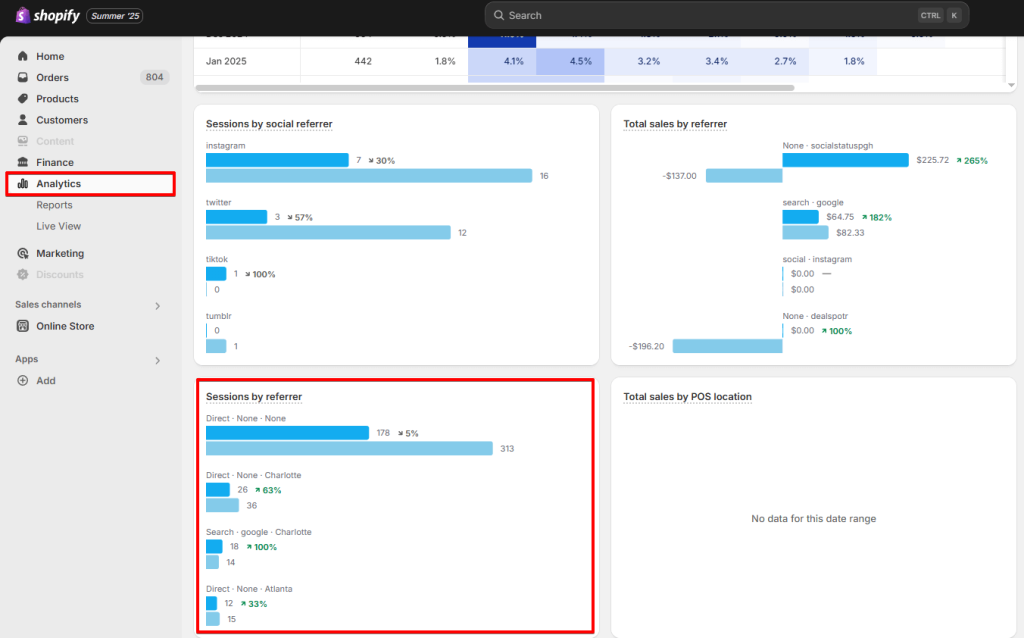
- In the left-hand sidebar, click on Analytics.
- From there, look for Sessions over time or scroll down and click Sessions by referrer reports to view visitor traffic. You can also access it via the “Reports” tab.
- You can filter by date range in the top right to see daily, weekly, or monthly trends.
What this tells you:
- How many people visited your store?
- Where they came from (e.g., direct, social, search engines).
- Basic engagement stats like conversion rate and average order value.
However, the built-in Shopify traffic analytics can only take you so far. It doesn’t give you deep behavioral data (like time on page or bounce rate), not to mention that segmentation is limited.
You can access basic customer reports, but they often lack the flexibility and depth needed for more advanced audience analysis.
What Shopify analytics can (and can’t) tell you
The built-in Shopify analytics dashboard offers store owners a quick, accessible snapshot of performance. It’s easy to navigate and provides a decent starting point, especially if you’re not using third-party analytics tools yet.
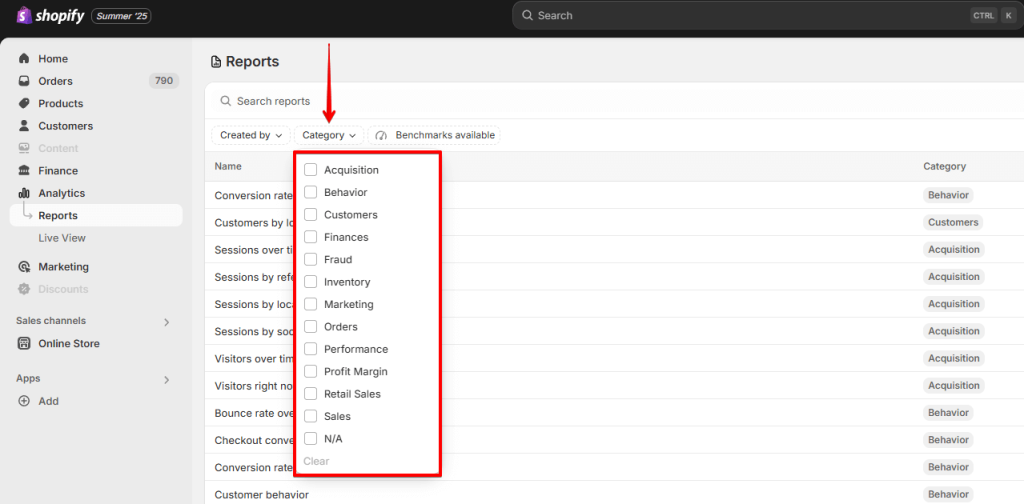
While Shopify analytics reports are organized into several categories, Acquisition and Behavior are the two most relevant to analyze Shopify store traffic.
There’s no dedicated “Conversion” category, but conversion metrics, such as add-to-cart and checkout rates are integrated into Behavior and other report types like Marketing or Sales.
For traffic analysis specifically, here are some of the most relevant reports to focus on:
- Sessions over time – how many visits your store received.
- Sessions by referrer – where your visitors are coming from (e.g., direct, search, social).
- Sessions by location – see sessions by country or city.
- Conversion rate – including add-to-cart, checkout, and total sales.
- Live view – basic Shopify real-time traffic data on who’s browsing your store from where, etc.
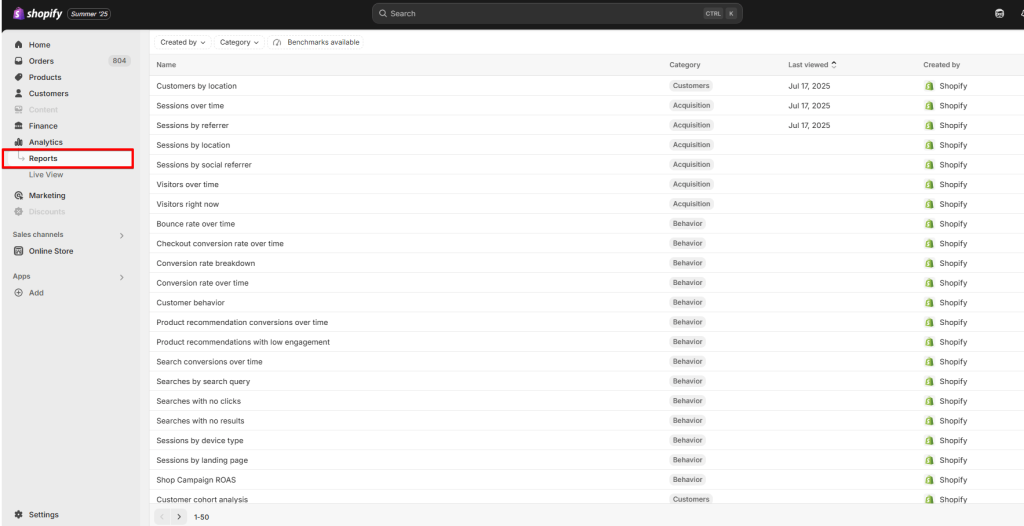
These are just some of the default reports Shopify analytics provides. Depending on your plan and setup, you may see over 100 report variations.
And as we discussed earlier, you can also create custom reports to get a quick idea of your sales, orders, and other important metrics.
So, where does it fall short?
While Shopify analytics gives you a quick look at surface-level metrics, it falls short when you need real insights into user behavior. This one of the mistakes Shopify owners make in traffic analysis.
The biggest mistake I see is relying solely on vanity metrics like total sessions or bounce rate without context. It’s easy to think traffic is healthy when in reality, you’re attracting the wrong audience. My advice: segment traffic by channel and intent (paid vs. organic, new vs. returning) and tie it directly to conversions. Tools like GA4 and Shopify’s attribution reports can help surface what actually drives revenue—not just visits.

For instance, it won’t tell you how long users stayed on your site, what pages they visited in sequence, or how far they scrolled on a product page.
You also can’t easily segment traffic to isolate mobile users who came from Instagram ads or analyze bounce rates by specific sources.
For more advanced insights, you’ll want to integrate your store with Google Analytics 4, which we’ll cover next.
Shopify traffic analytics with GA4
Shopify analytics gives you a starting point, but if you want to truly understand your website traffic, like which sources actually lead to purchases or where users drop off before converting, you’ll need a more advanced tool.
Google Analytics gives you a more complete picture of how users interact with your store across devices, channels, and over time, including traffic from email marketing campaigns and social media.
Let’s walk through how to set it up.
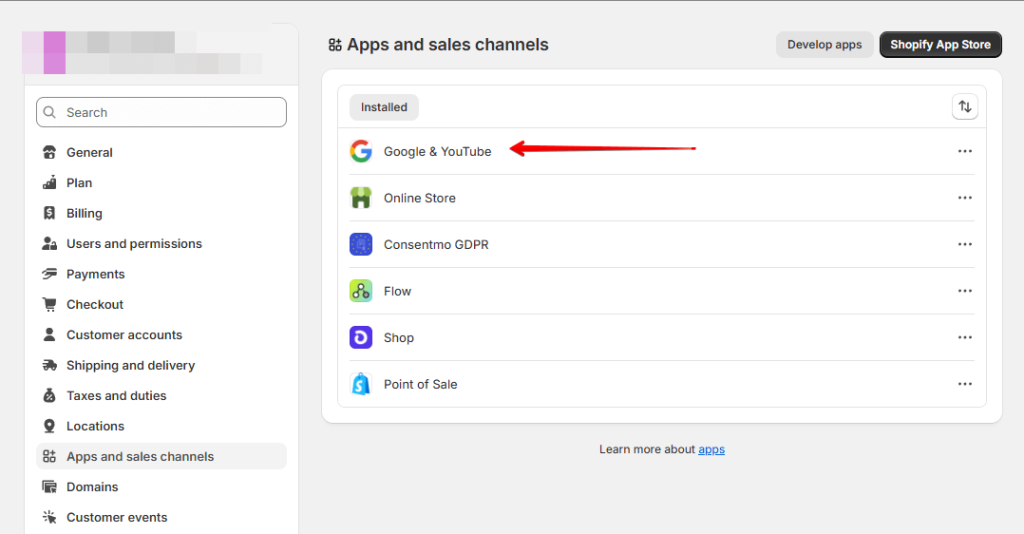
Option 1: Google & YouTube Channel App (easiest for most stores)
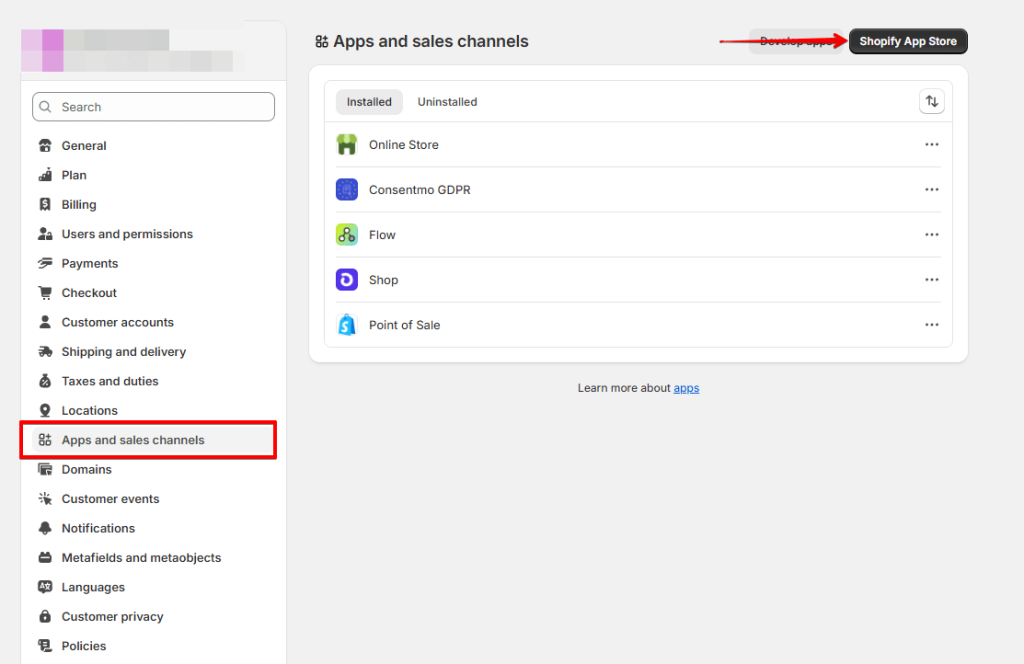
- From your Shopify admin, go to “Apps and sales channel” and search for the Google & YouTube channel.
- Install and connect your Google account.
- During setup, you’ll be prompted to link your Google Analytics property. Select the correct property from the list.
- Shopify will automatically inject the GA4 tag across your store pages.
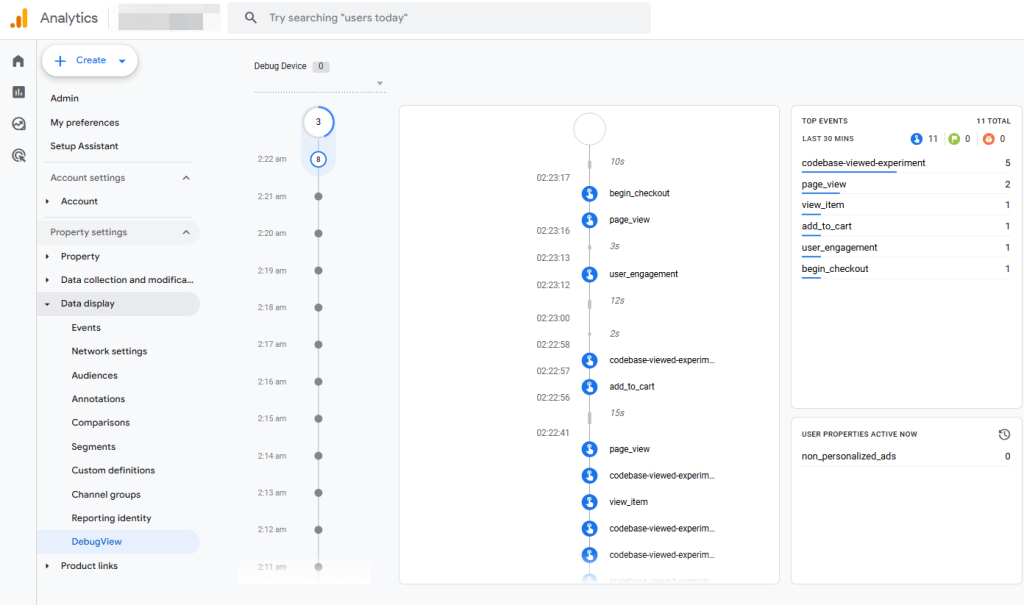
To verify that data is flowing:
- Go to your Google Analytics property.
- Open the DebugView from Admin > Data display
- Navigate your site in a new tab and check that your visit appears in GA4.
Option 2: Google Tag Manager + Customer Events (more advanced/flexible)
If you want more control over what you track, like button clicks, form submissions, or ecommerce events beyond what Shopify analytics offers, you can install Google Analytics 4 using Google Tag Manager (GTM) via Shopify’s Customer Events feature.
Behavioral signals like scroll depth, time on page, and exit intent are gold if you know how to act on them. For example, if visitors are dropping off before adding to cart, I test new product page layouts or FAQ placements. Heatmaps, session replays, and on-site surveys help me find friction points. Fixing those improves conversion—and when your conversion rate goes up, you can scale paid traffic more confidently.
This method involves creating a custom pixel inside the Customer Events interface, where you manually inject your GTM container and custom JavaScript code.
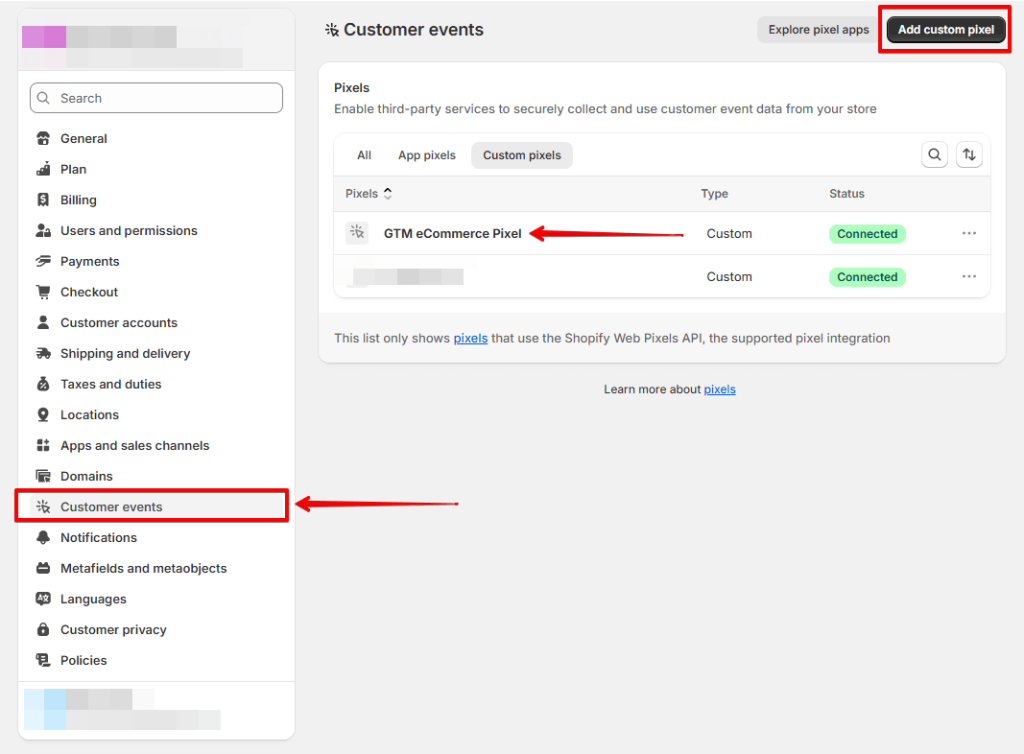
Basic workflow:
- In Shopify Admin, go to Settings > Customer Events.
- Click “Add custom pixel”, then paste your GTM container snippet along with custom JavaScript that captures ecommerce interactions and pushes them to the dataLayer.
- In GTM, create a GA4 Configuration Tag using your Measurement ID.
- Add GA4 Event Tags for events you want to track actions (e.g., view_item, add_to_cart, begin_checkout, etc.).
- Publish your GTM container and verify tracking in GA4 Realtime reports.
Yes, it’s a more advanced setup and not something Shopify supports out of the box. We won’t go into full detail here, but you can follow this excellent step-by-step guide by Analytics Mania to learn more.
Note: This setup usually requires help from an analytics specialist to ensure you receive the correct data.
How to track Shopify store visitors and get insights with a traffic dashboard
Setting up GA4 is just the start. What really matters is what you do with the data. And that’s where a Shopify-specific dashboard can become quite a useful weapon.
It’s not just about analyzing Shopify traffic, but uncovering what drives sales, what stalls conversions, and where your growth is coming from.
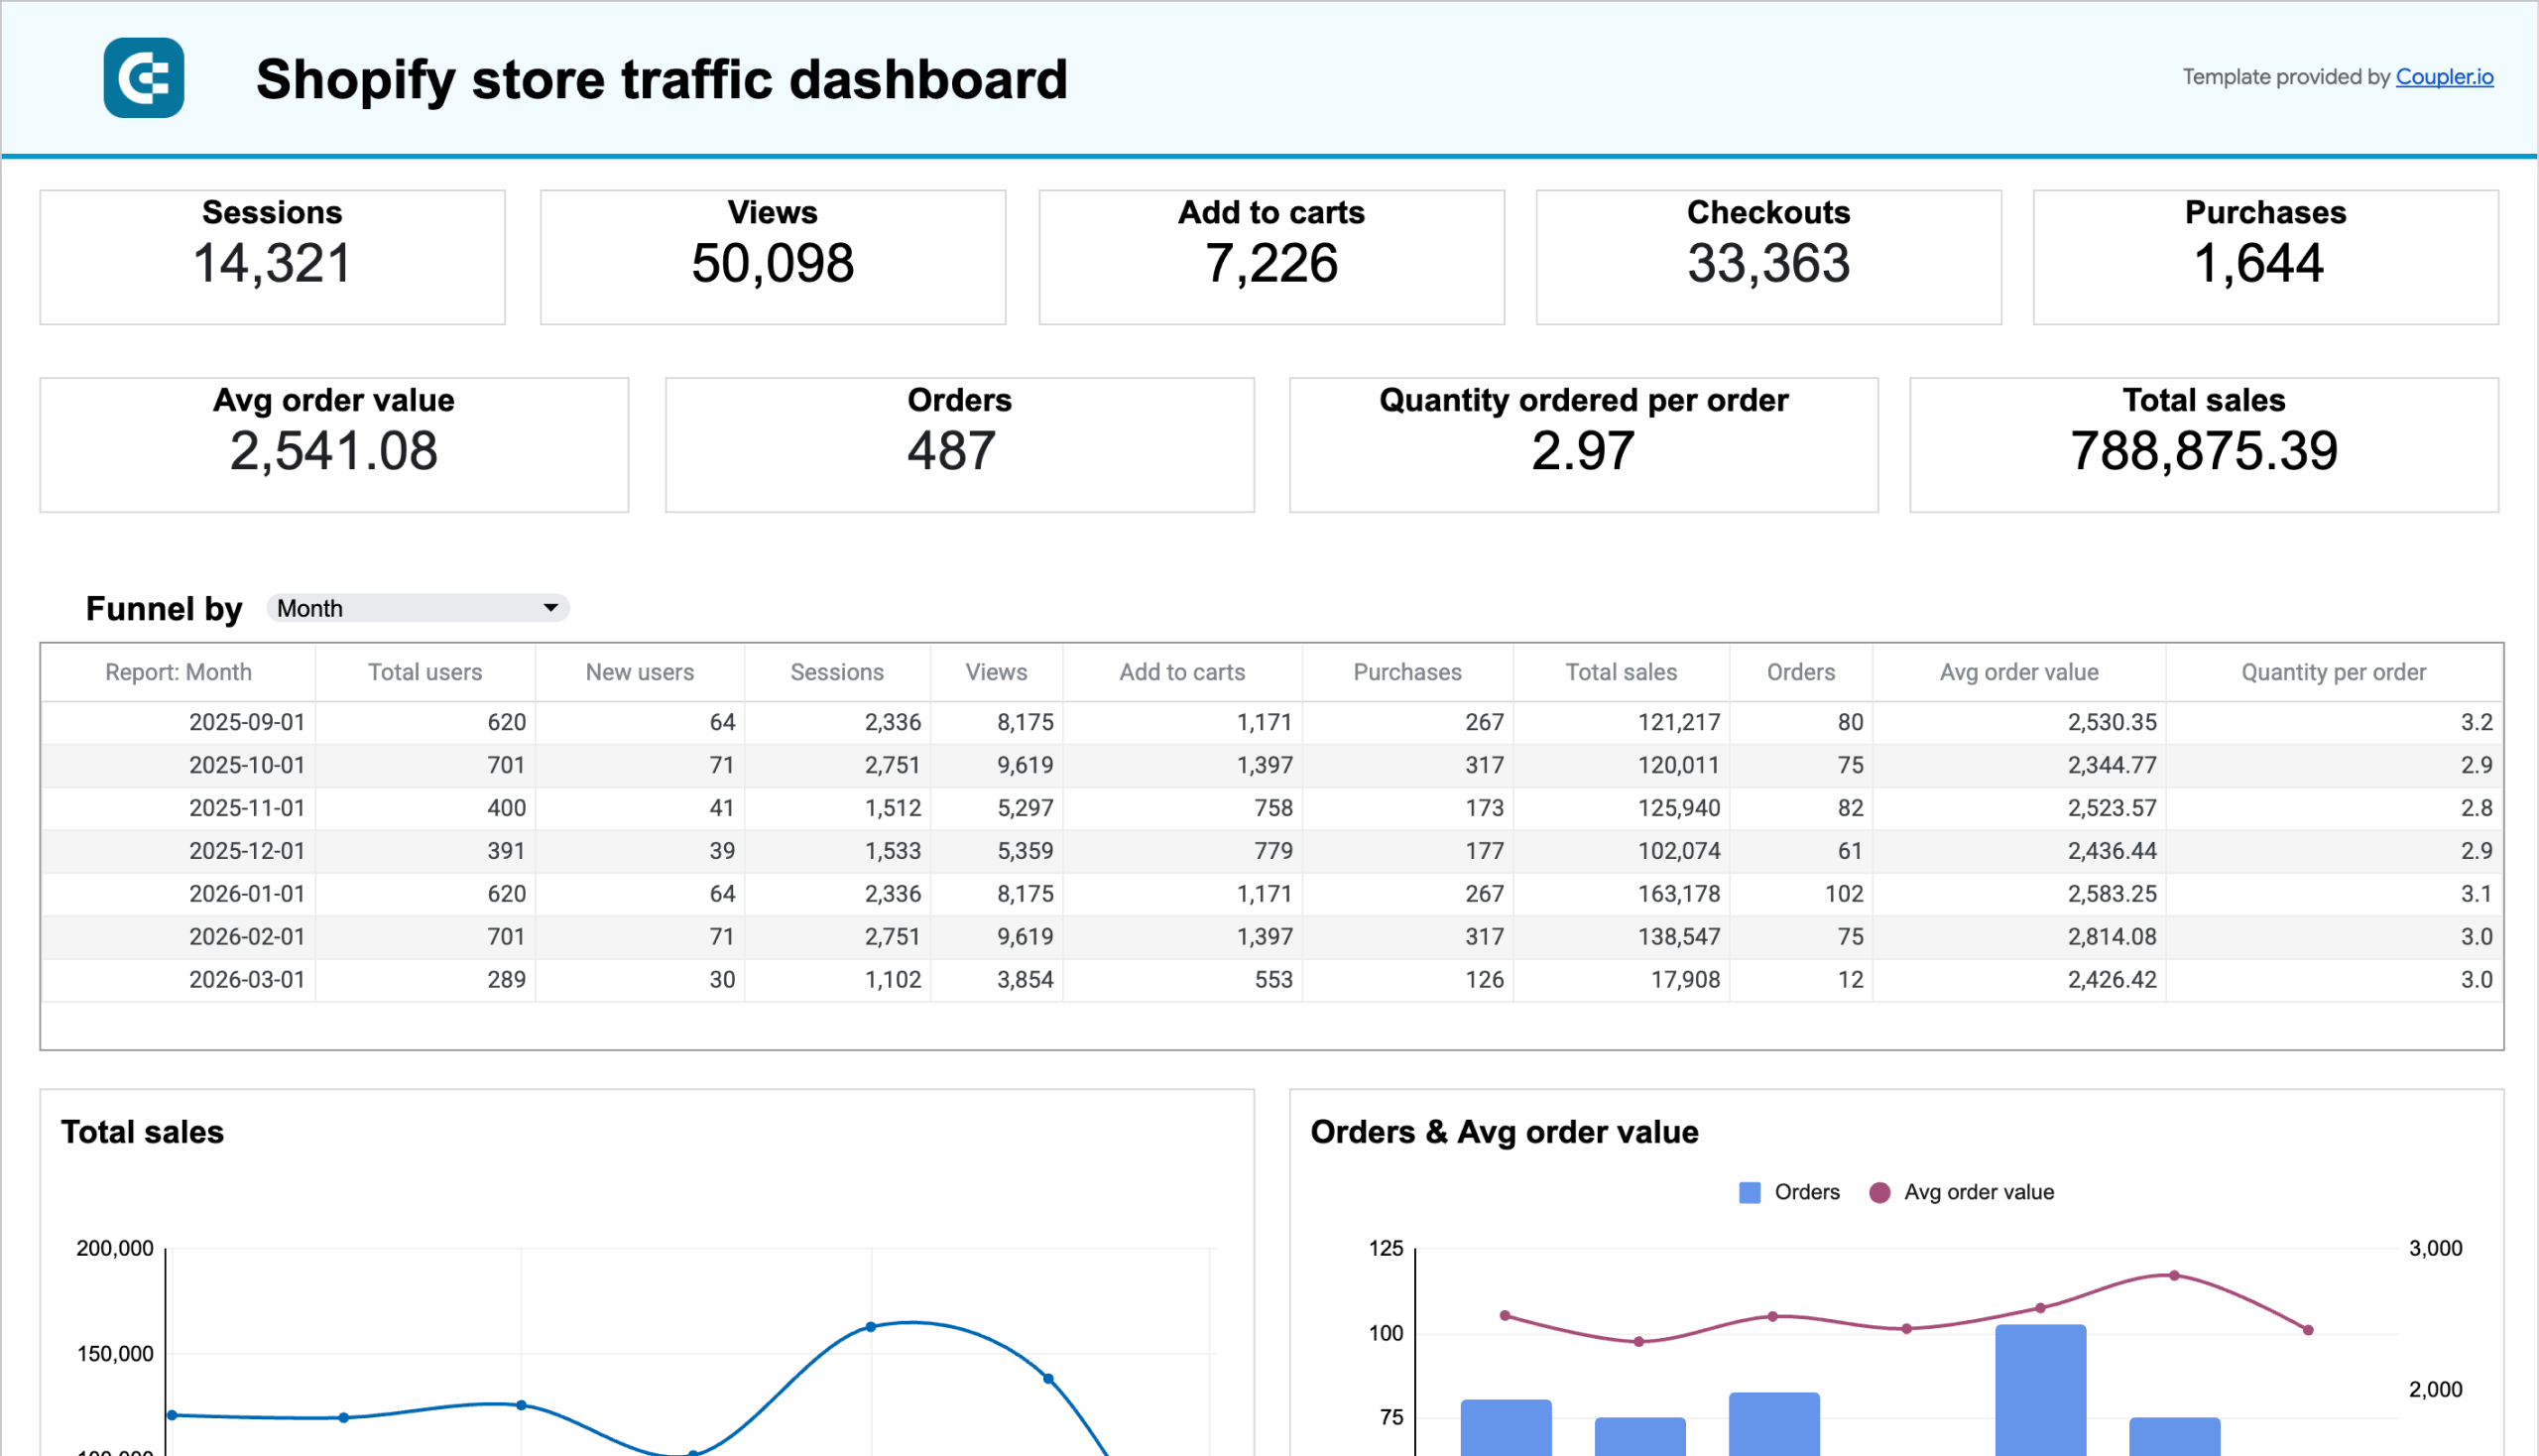
Instead of jumping between GA4 reports or waiting for your analyst to piece together insights, you can rely on Coupler.io’s Shopify traffic analytics dashboard to give you a real-time, visual breakdown of your store’s performance.
It’s updated every 15 minutes and pulls your GA4 data into a clean, decision-ready layout that helps you focus on important KPIs.
Let’s walk through what this dashboard can reveal and how it’s useful for your business.
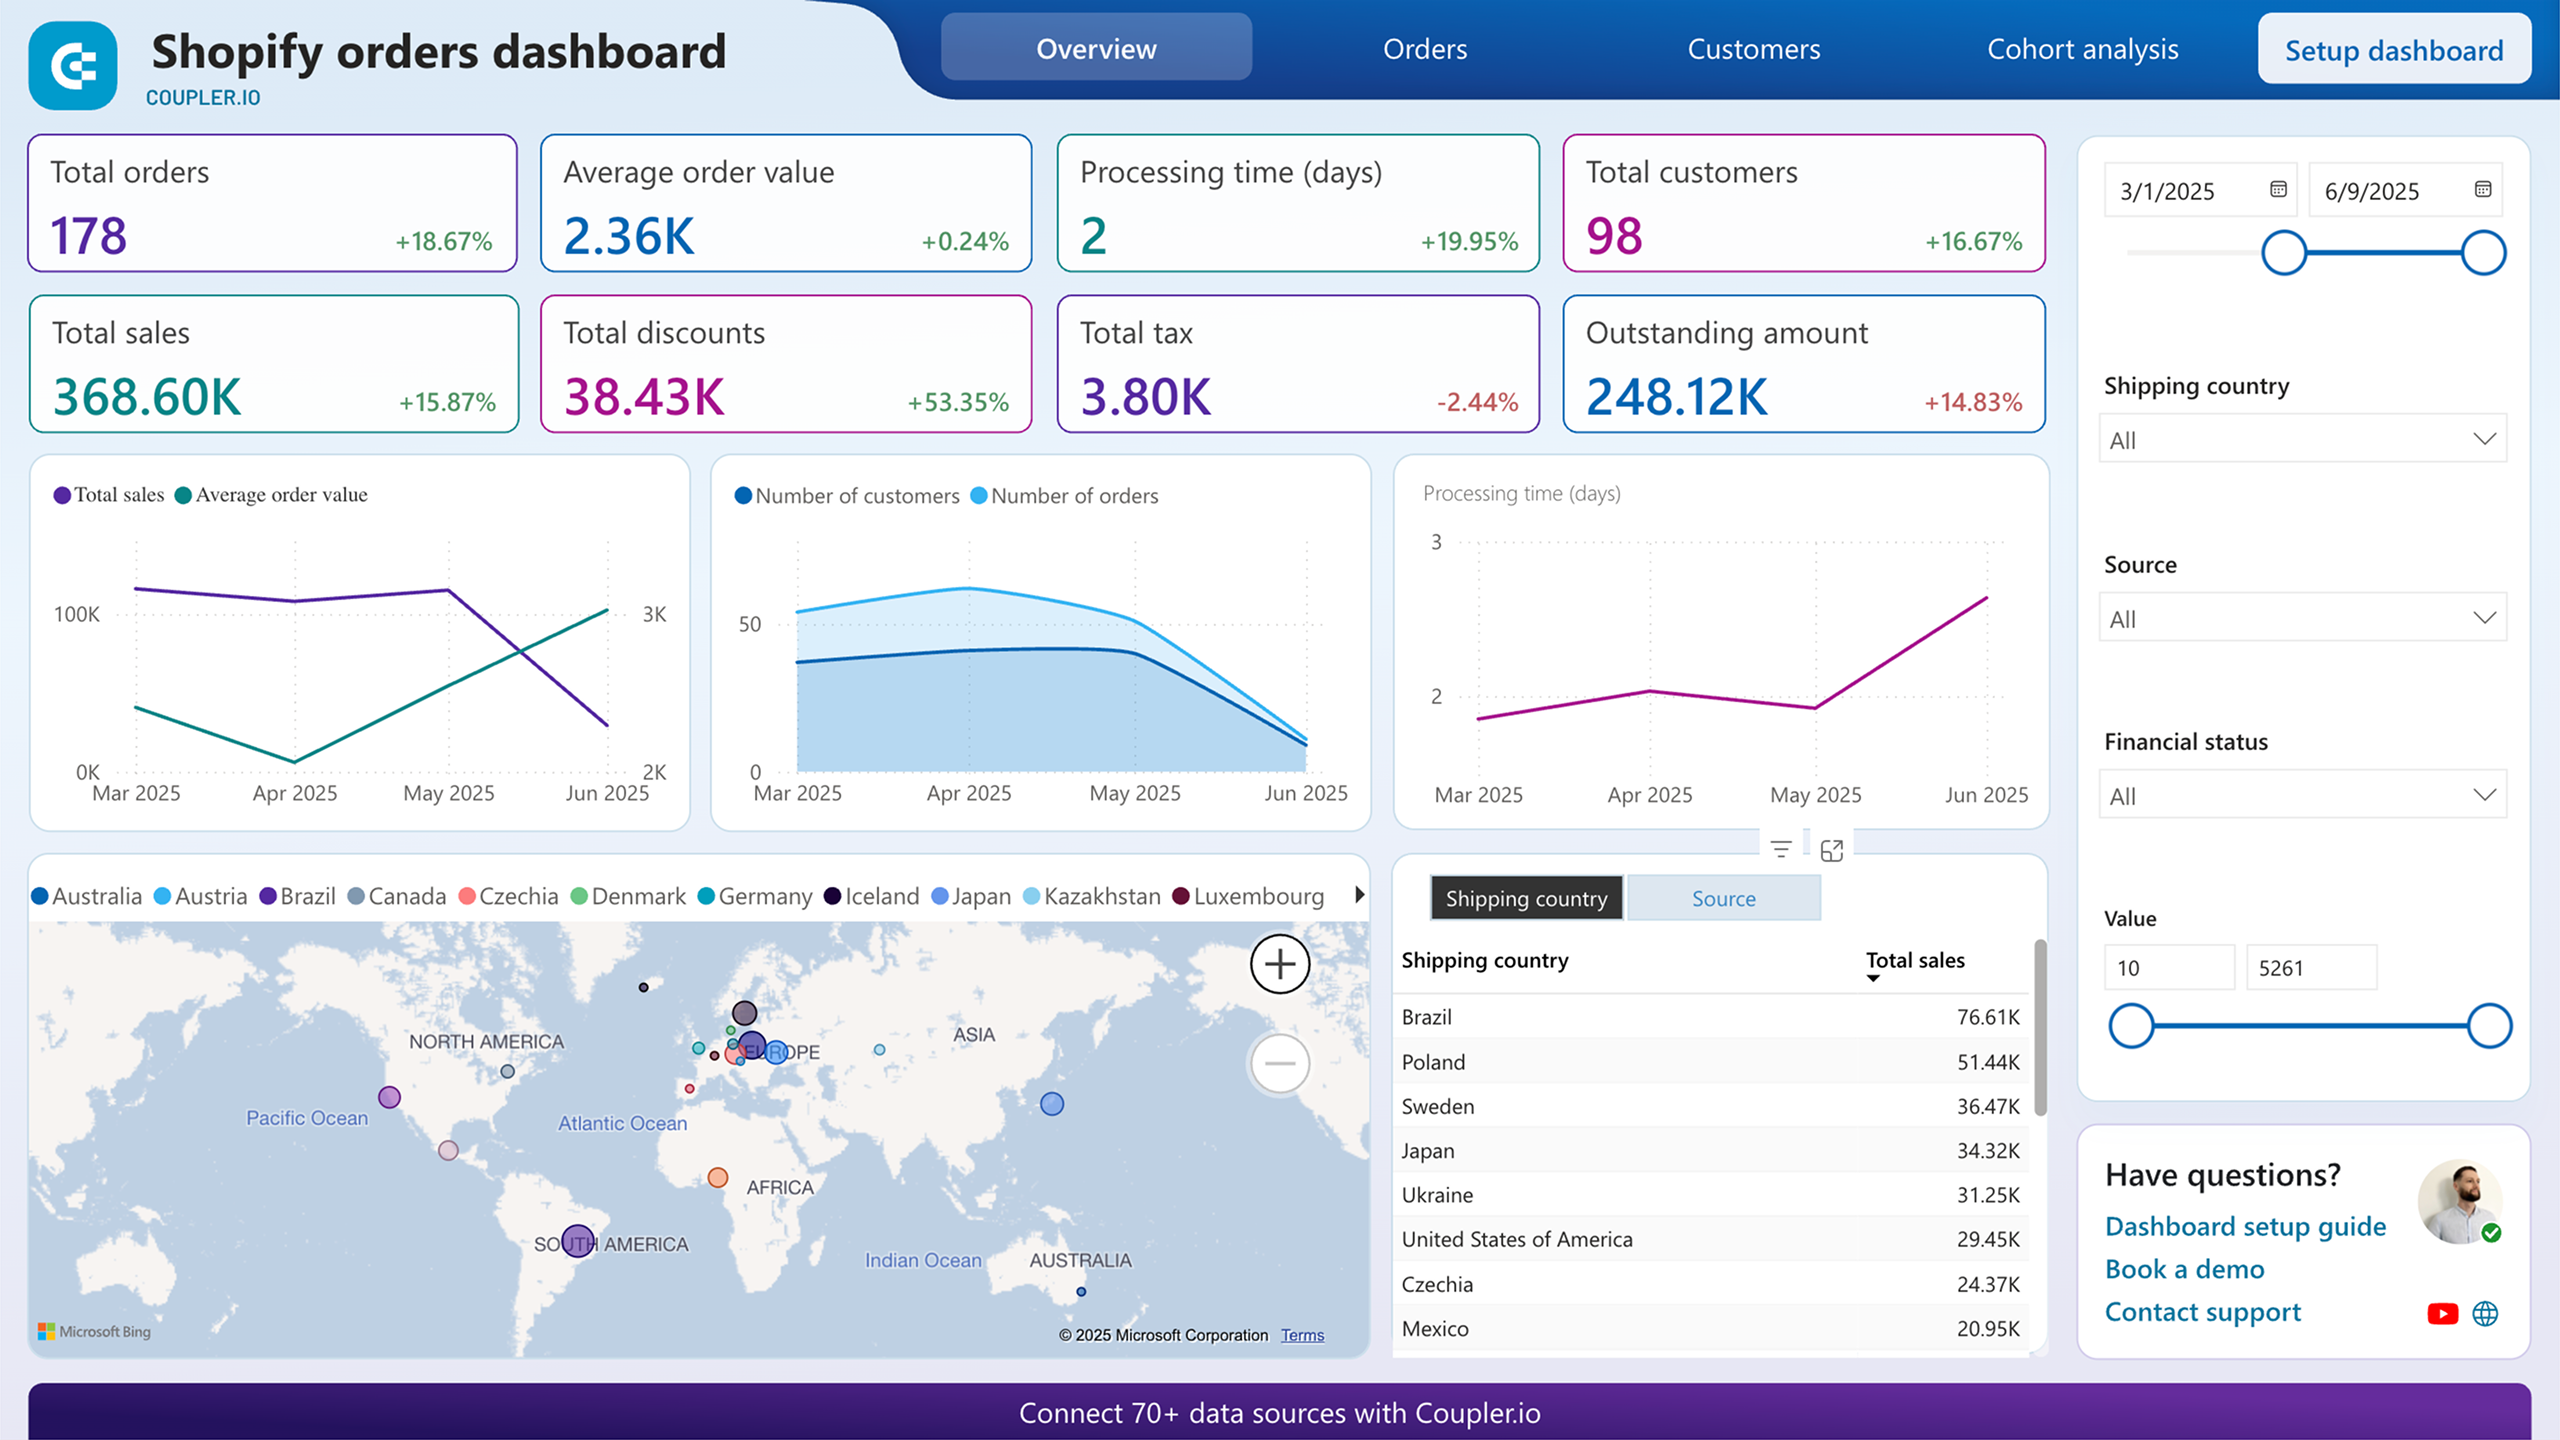
Access Shopify analytics to get the complete traffic-to-sales picture
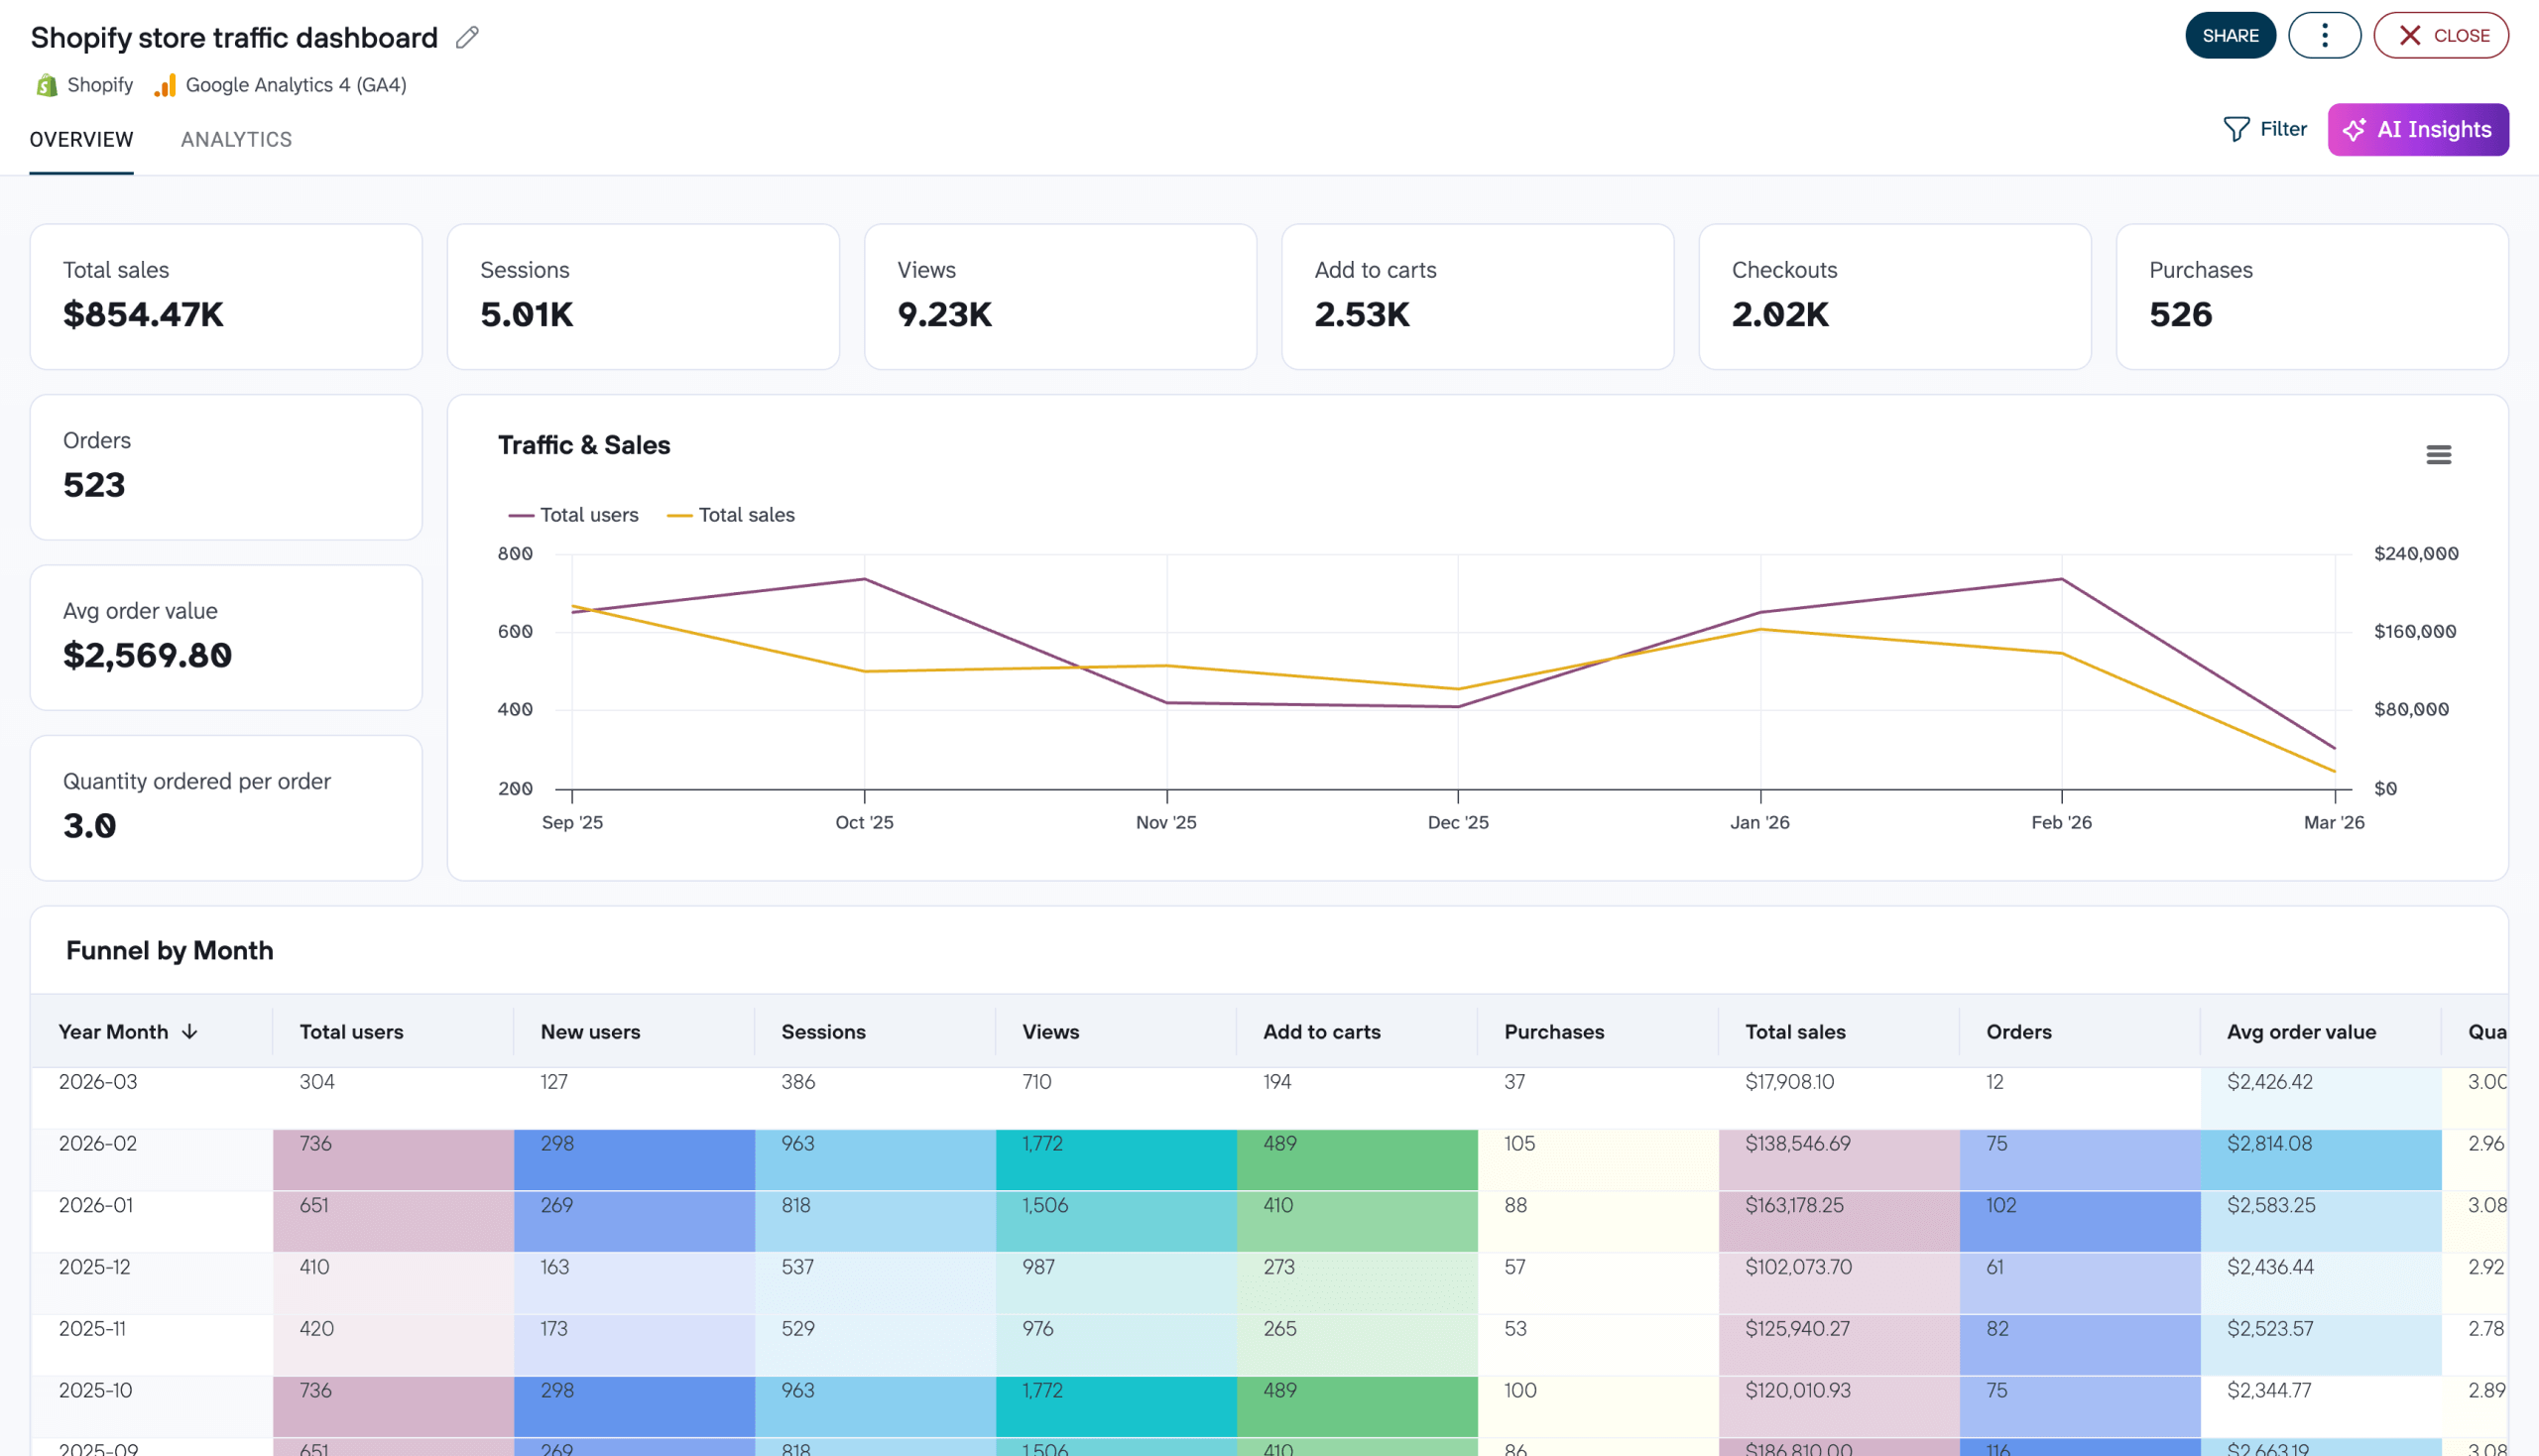
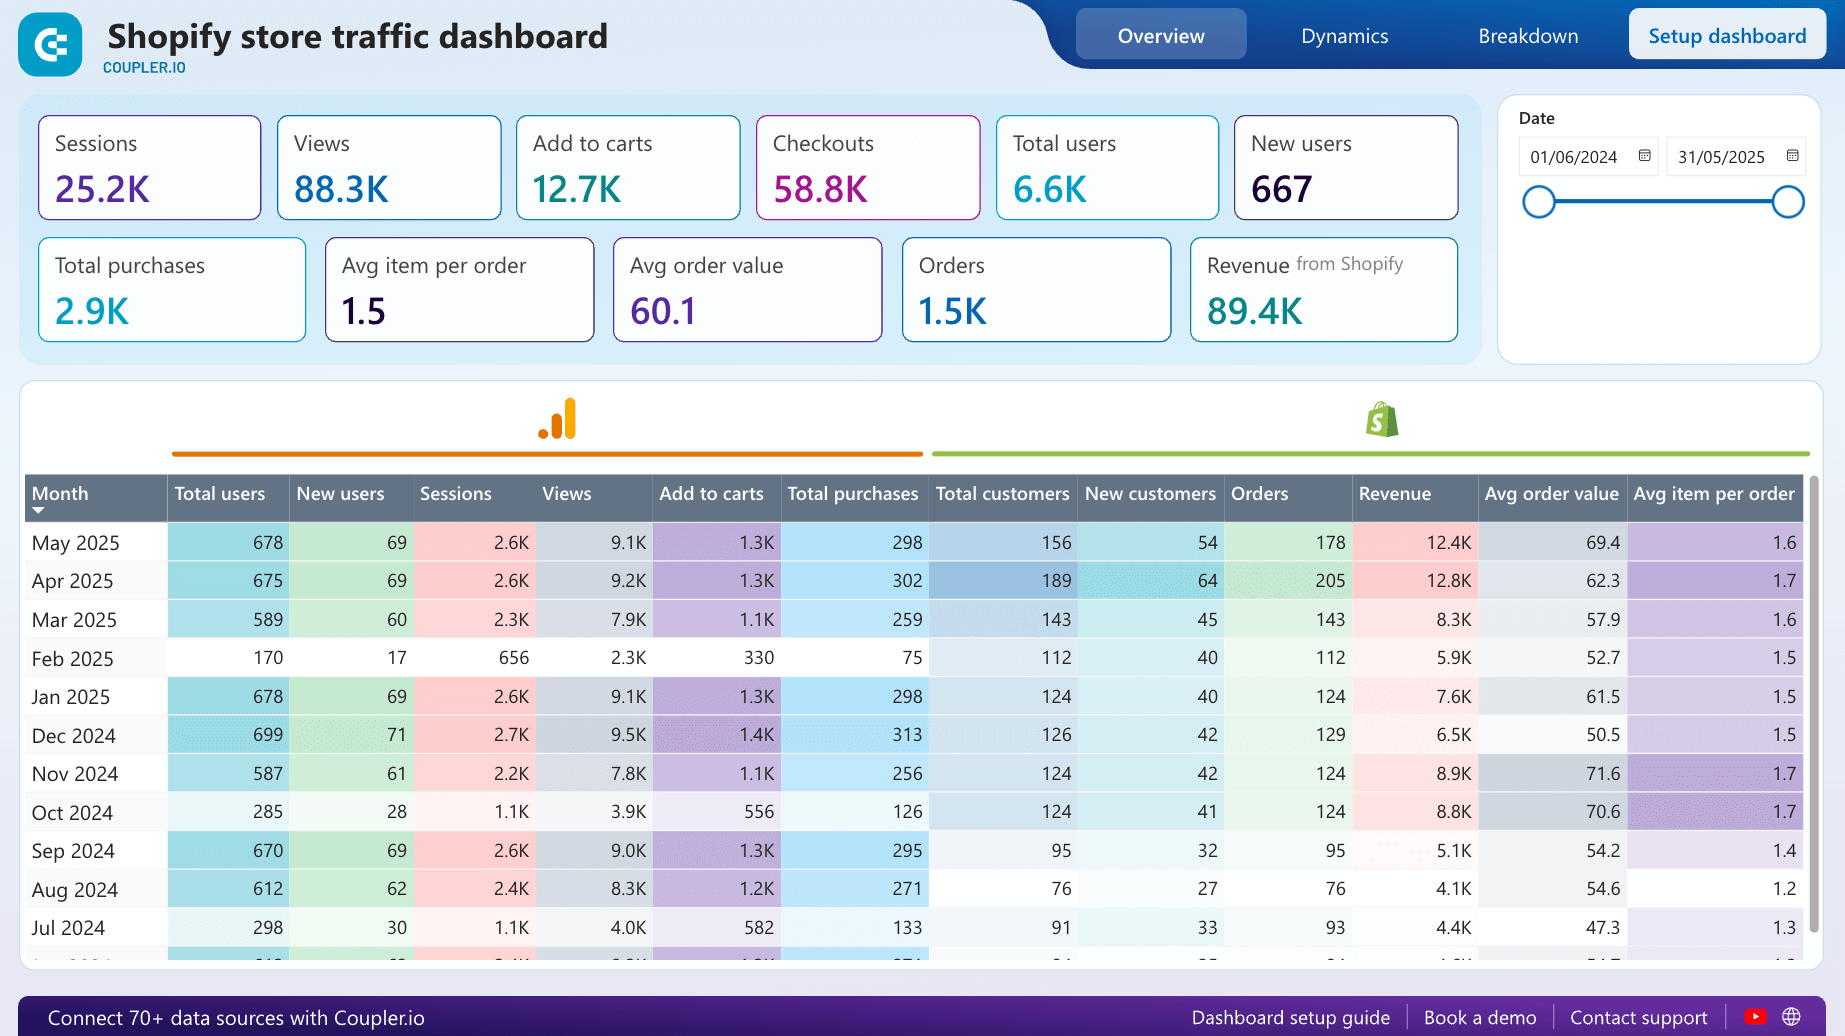
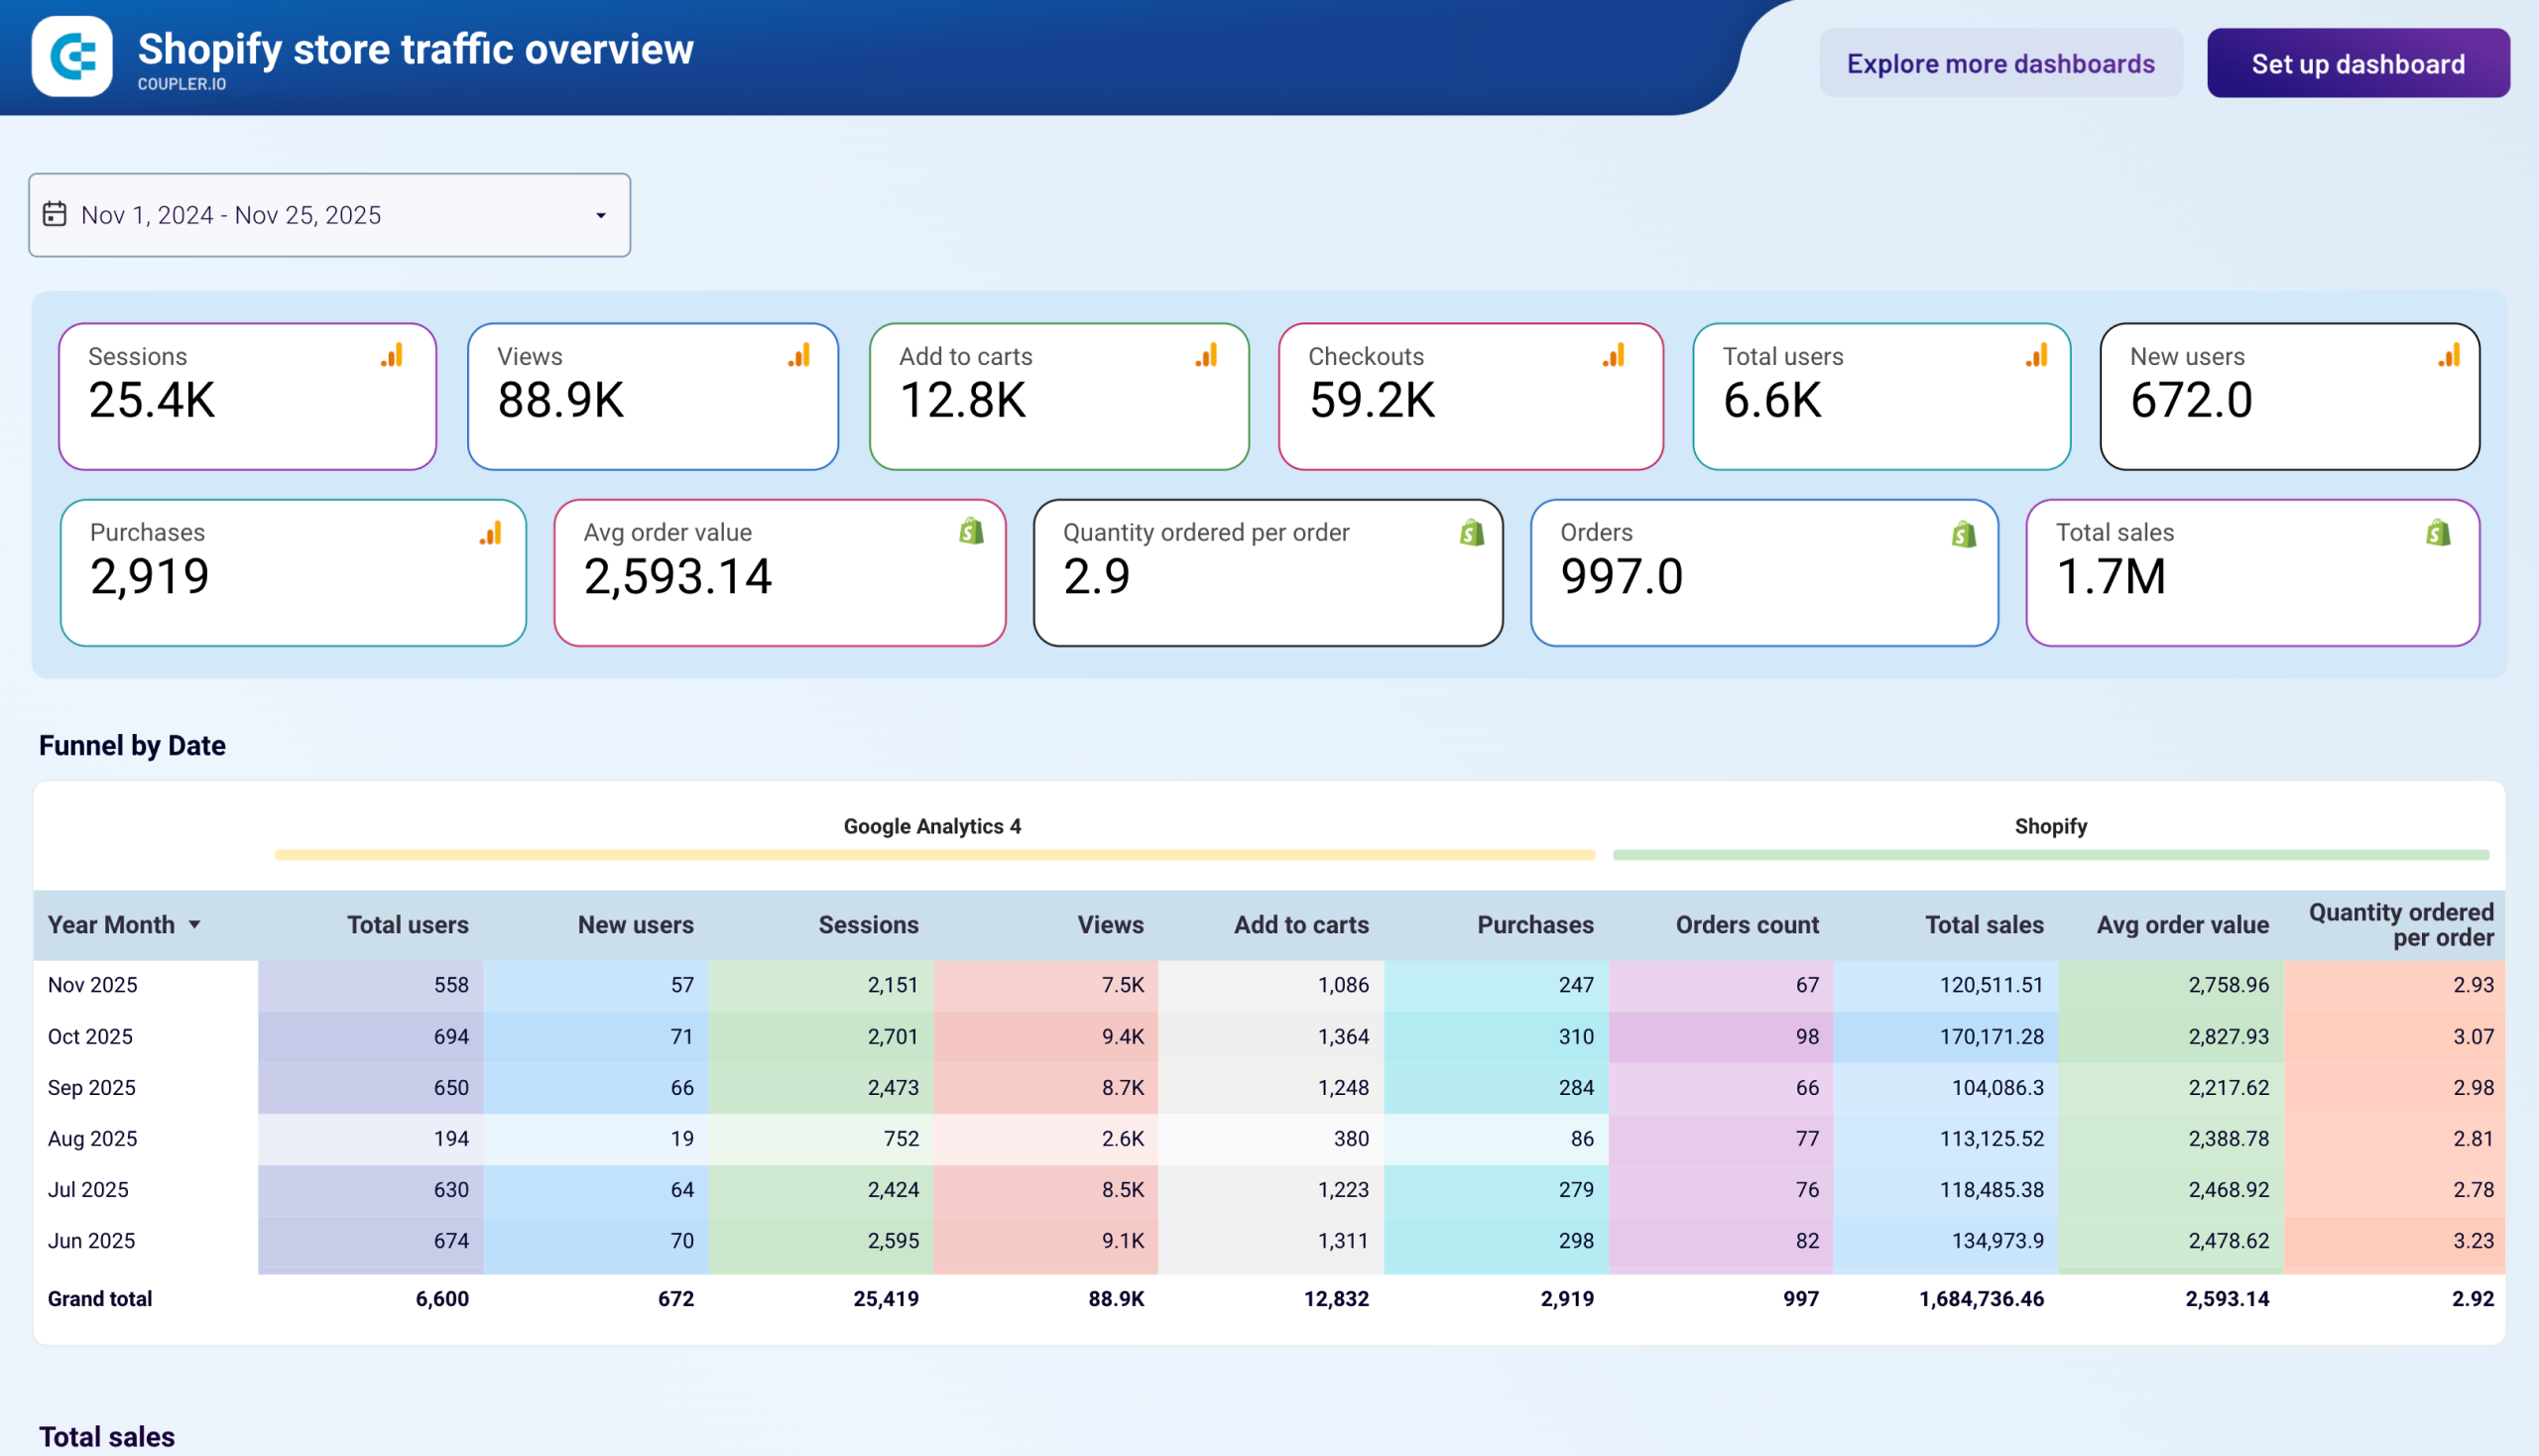
Your visitors aren’t just traffic numbers, they’re potential customers at different stages of the buying journey. This dashboard gives you the full conversion funnel in one view:
- Top-line metrics: Sessions, views, add-to-carts, checkouts, total users, and new users – all with trend indicators showing whether you’re moving up or down.
- Revenue impact: Total purchases, average order value, items per order, total orders, and sales figures that connect traffic directly to your bottom line.
- Monthly performance breakdown: A detailed table showing how each month compares across all key metrics, making it easy to spot seasonal patterns and growth trends, but it also allows you to compare GA4 vs Shopify analytics data side-by-side, so you understand how each platform is measuring performance.
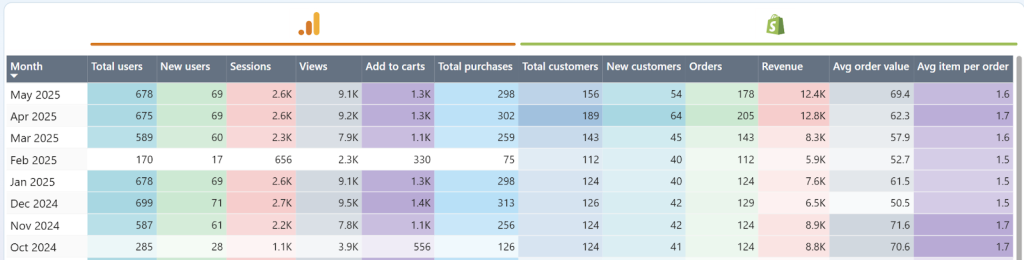
The beauty is seeing everything connected. You can instantly see if a spike in sessions actually translates to more sales, or if your conversion rates are dropping even as traffic grows.
Understand your best and worst Shopify store traffic sources
All traffic sources are not created equal. Paid traffic might bring volume, but maybe it’s your email list that’s quietly converting best.
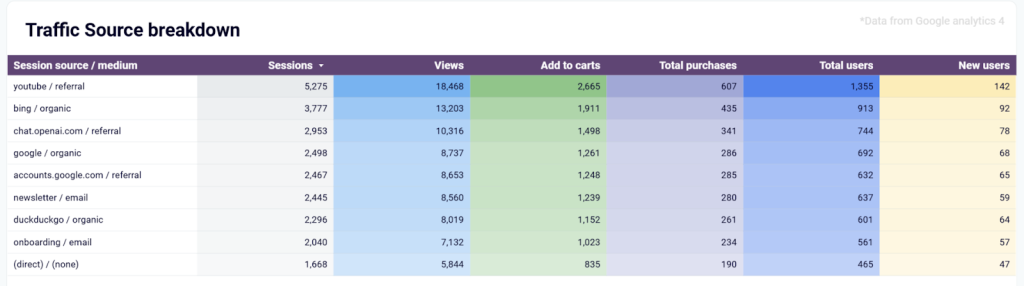
The dashboard’s traffic source breakdown shows you exactly which channels are driving both volume AND revenue:
- Performance by source: See sessions, views, add-to-carts, total purchases, and user counts for each traffic channel.
- Quality insights: YouTube referrals might bring fewer sessions than organic search, but they could have higher conversion rates.
- ROI clarity: Email newsletters and referral traffic often show surprisingly strong performance compared to paid channels.
This source-level insight lets you move from gut-based decisions to data-backed marketing strategies. You’ll know exactly where to double down your efforts and budget.
There’s an expert piece of advice on how to better understand traffic sources:
My advice would be to contextualising and dig deeper into the data and ascertain where exactly the traffic is coming from and landing. If it’s mostly direct and going to top-of-the-funnel content like blogs, there is most likely work to be done. Prioritize commercial product and collection pages first then concentrate on supporting content and thought leadership pieces 🙂

Monitor Shopify store performance in sales and customer trends over time
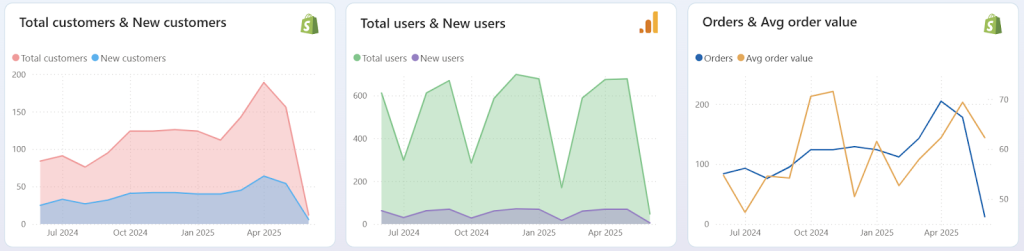
The visual charts make it easy to spot patterns that would be buried in spreadsheets:
- Sales trajectory: Clear visualization of your revenue trends, helping you identify growth periods and seasonal dips.
- Customer acquisition: Compare total users vs. new users to understand how well you’re attracting fresh audiences versus retaining existing ones.
- Purchase patterns: Track total purchases alongside order values to see if you’re growing through more customers or higher-value orders.
Why the Shopify traffic dashboard changes the game for store owners
Shopify analytics built-in reports give you surface-level metrics. But if you want to grow, you need context. You need to know why your traffic behaves the way it does and what to do next.
The Shopify traffic dashboard gives you that context, without the noise. It turns raw data into key metrics. And that’s how you:
Stop guessing: See exactly which marketing efforts drive profitable traffic
Find bottlenecks: Identify where visitors drop off in your funnel
Scale confidently: Know which channels and strategies actually work before investing more
The dashboard makes it easier for busy store owners who don’t have time to log into multiple Shopify traffic analytics platforms and piece together performance data. Everything you need is in one place, updated automatically, and designed specifically for ecommerce store decisions.
Ready to get started? Get this dashboard for free in Coupler.io or in your preferred reporting tool, including Google Sheets, Looker Studio, or Power BI. See your Shopify store’s complete traffic picture in minutes, not hours.


Combine traffic analysis with sales & funnel metrics
You’ve seen how Shopify store traffic data helps answer the “who” and “where” of your Shopify visitors. But to truly understand your store’s performance, you need to connect that traffic to what happens next.
What number of visitors view products? Add anything to the cart? Complete purchases?
This is where Coupler.io comes in. This data integration platform allows you to export Shopify data and combine it with information from other sources, for example, Google Analytics, advertising platforms, CRM apps, etc. Coupler.io also provides ready-to-use Shopify dashboard templates to monitor Shopify store analytics across user behaviour, sales, and inventory, all without complex setup.
Shopify dashboards by Coupler.io
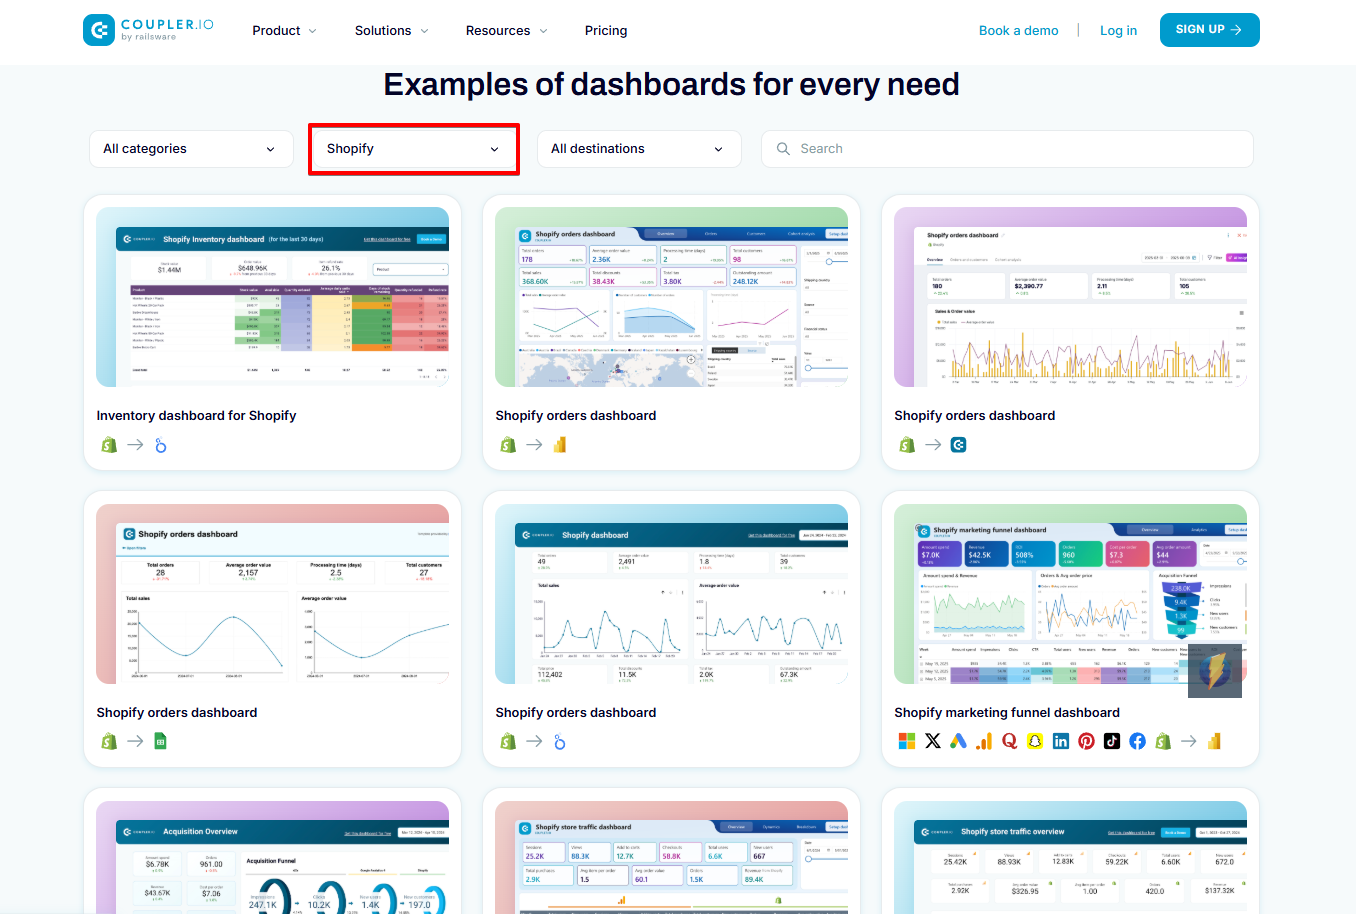 Explore dashboards
Shopify dashboards by Coupler.io
Explore dashboardsShopify marketing funnel dashboard
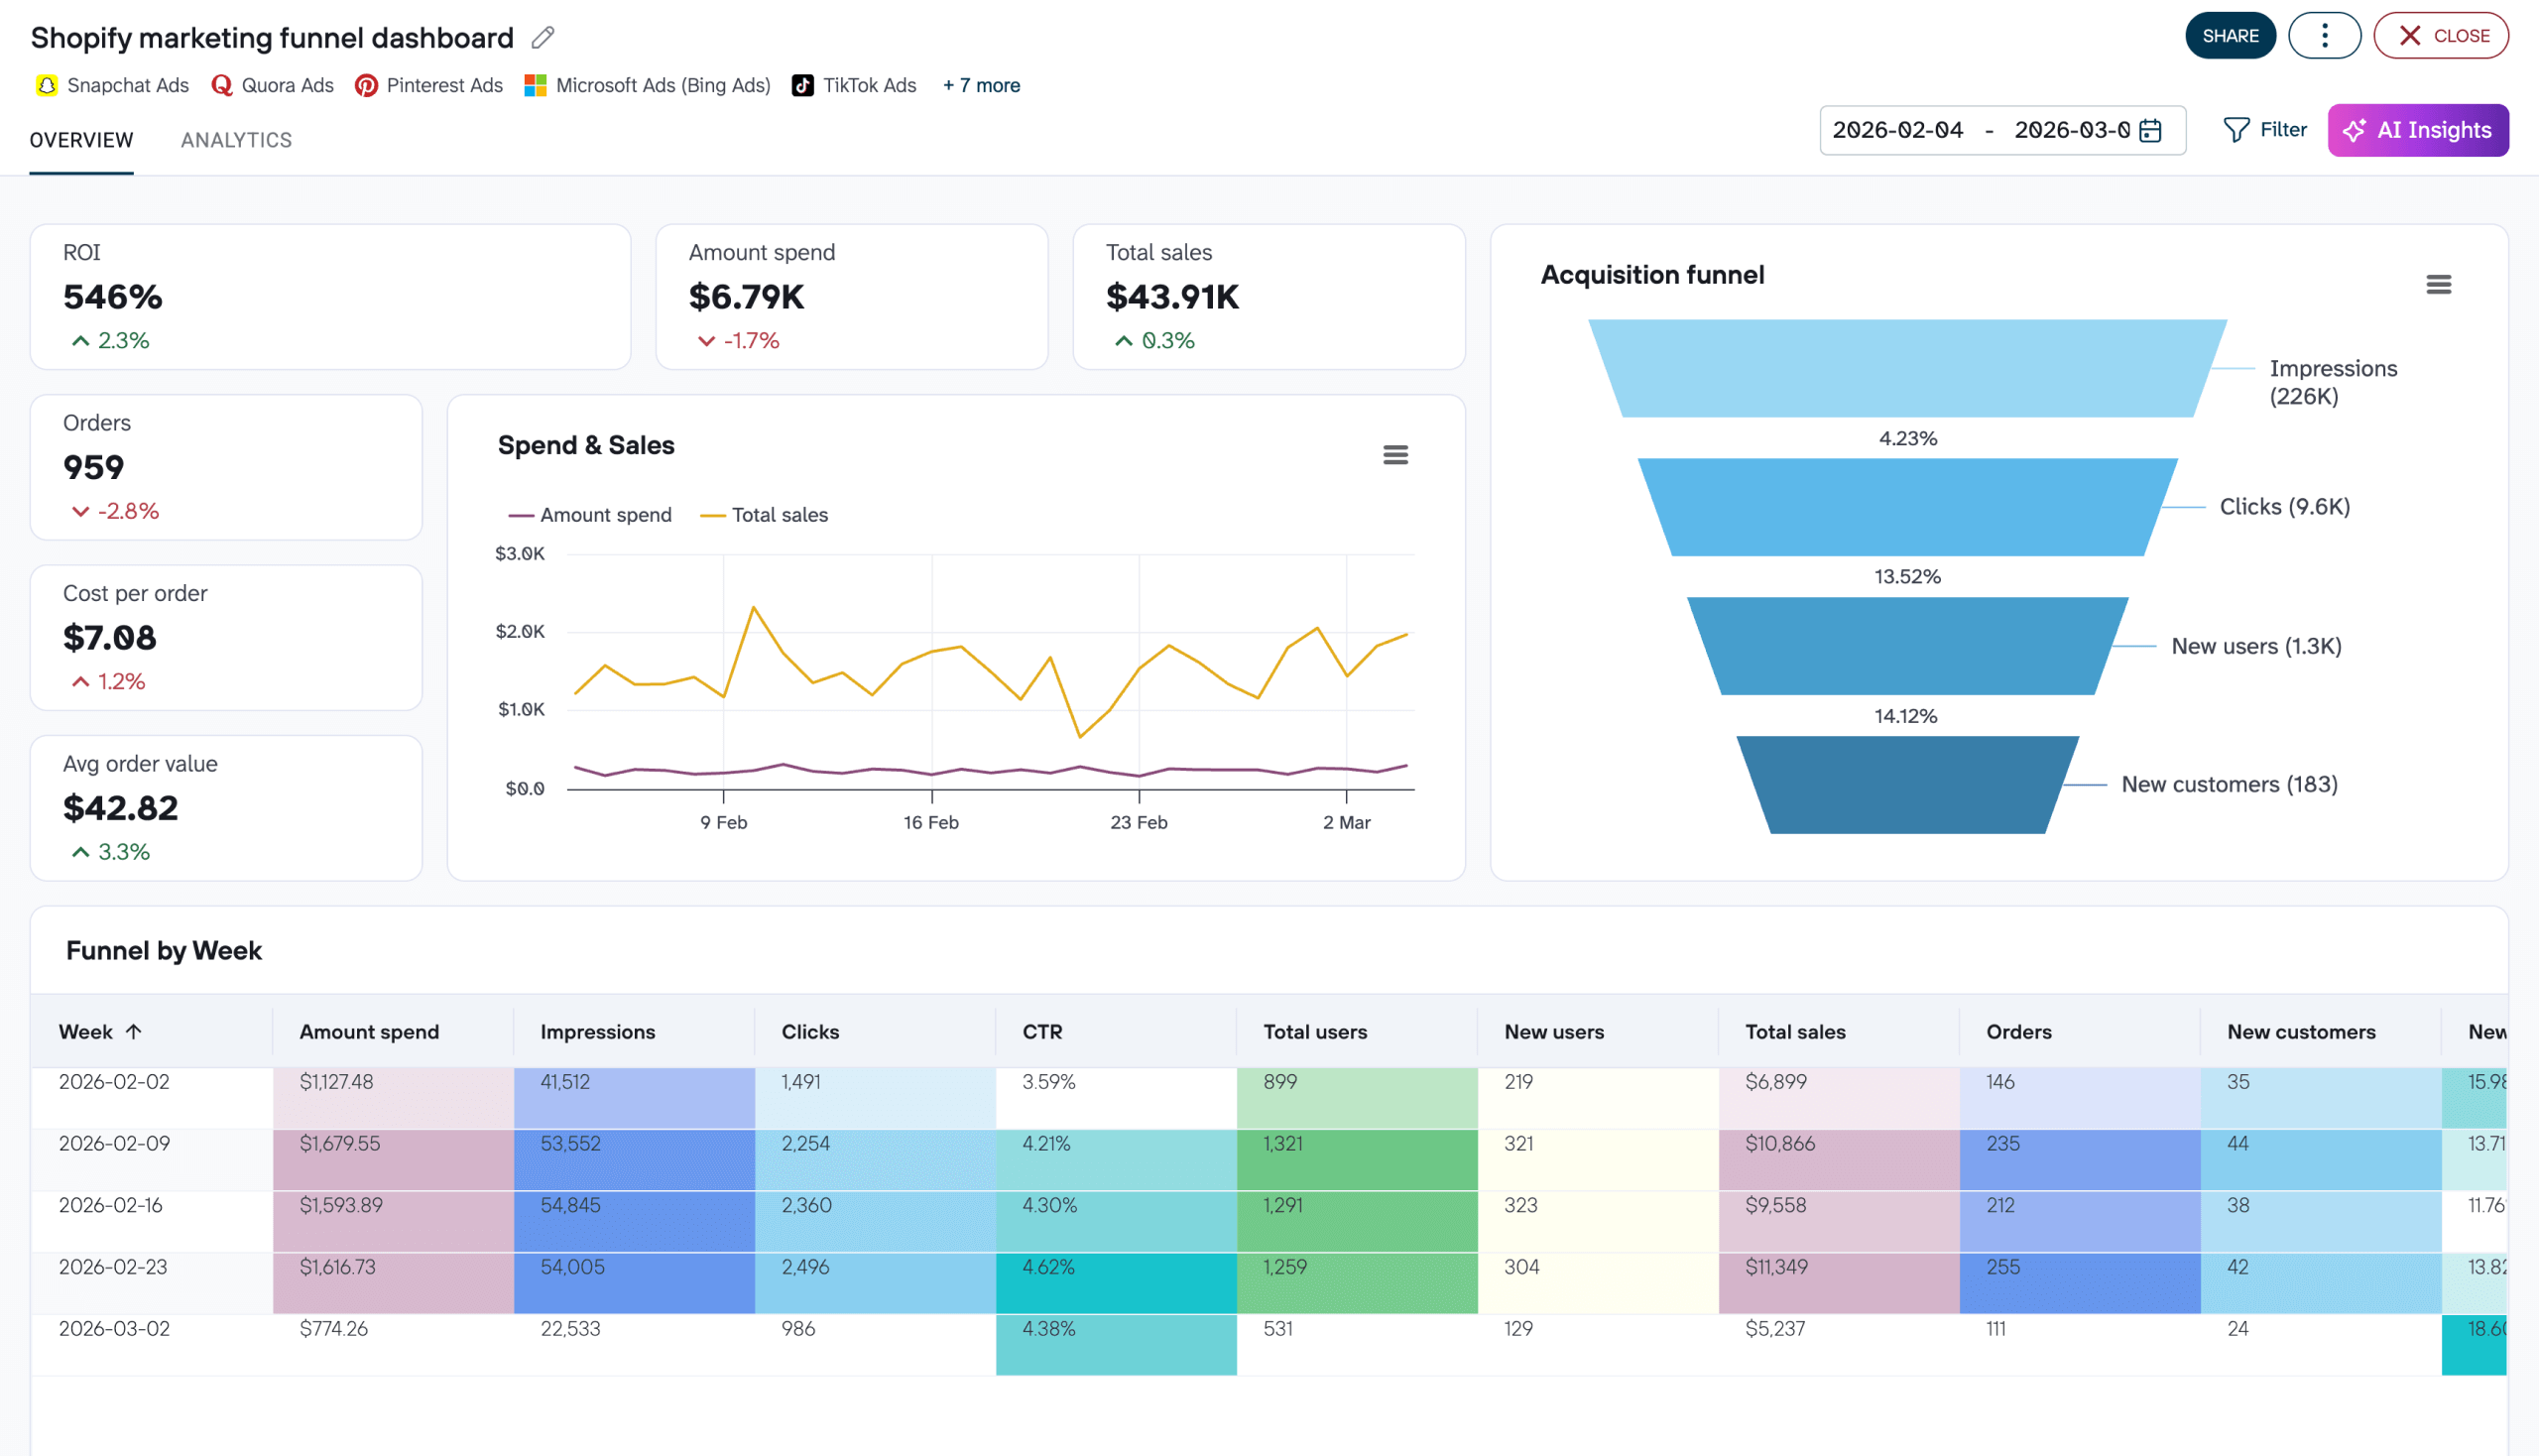
This Shopify dashboard gives you a high-level yet detailed overview of how your marketing efforts translate into real results. It is an ideal solution if you’re running paid campaigns and want a reliable, high-level overview of Shopify store performance across both marketing and ecommerce metrics. The dashboard collects data from Shopify, advertising platforms, and Google Analytics 4.
Shopify marketing funnel dashboard
 Preview dashboard
Shopify marketing funnel dashboard
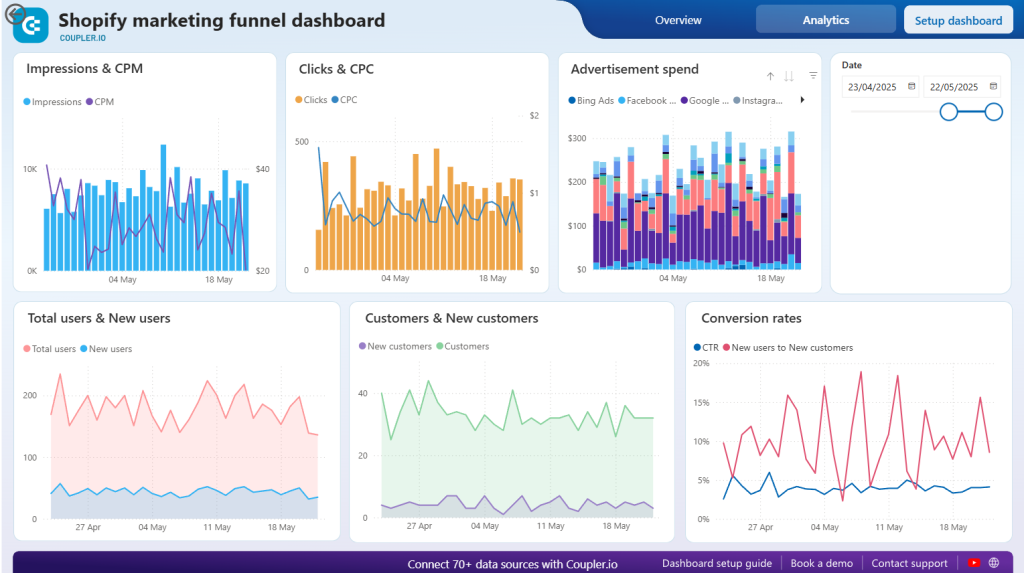
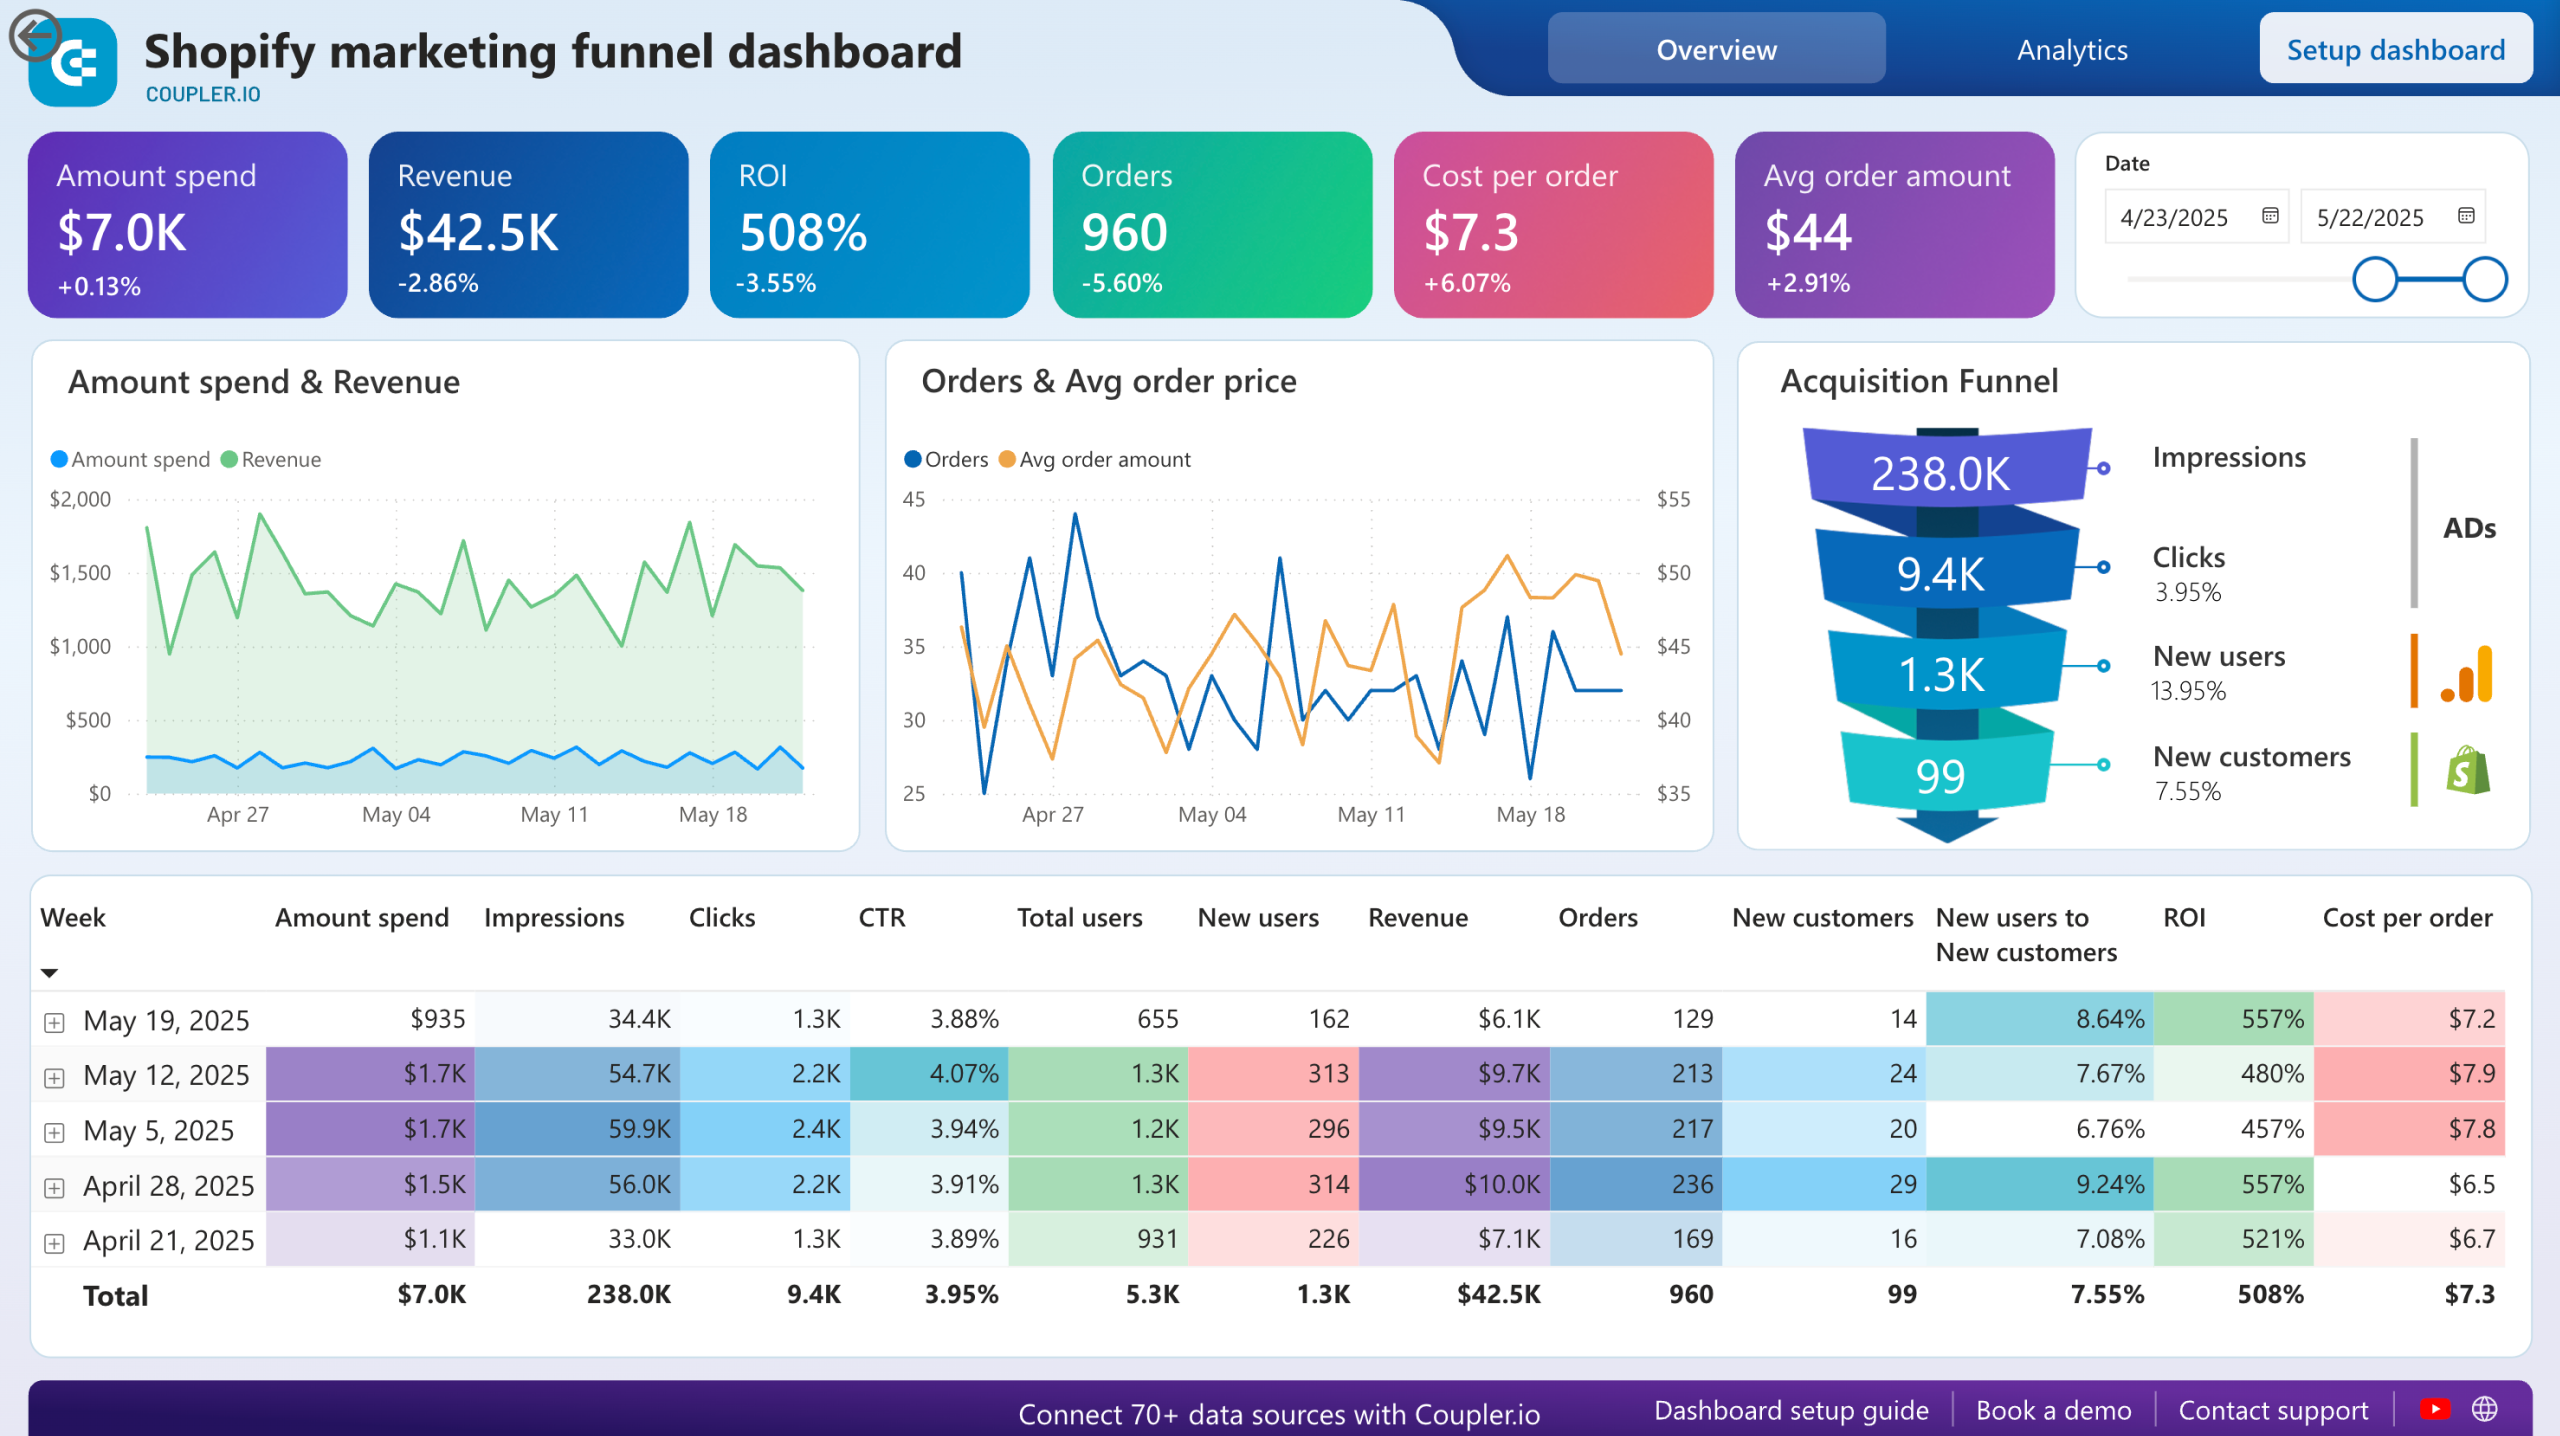
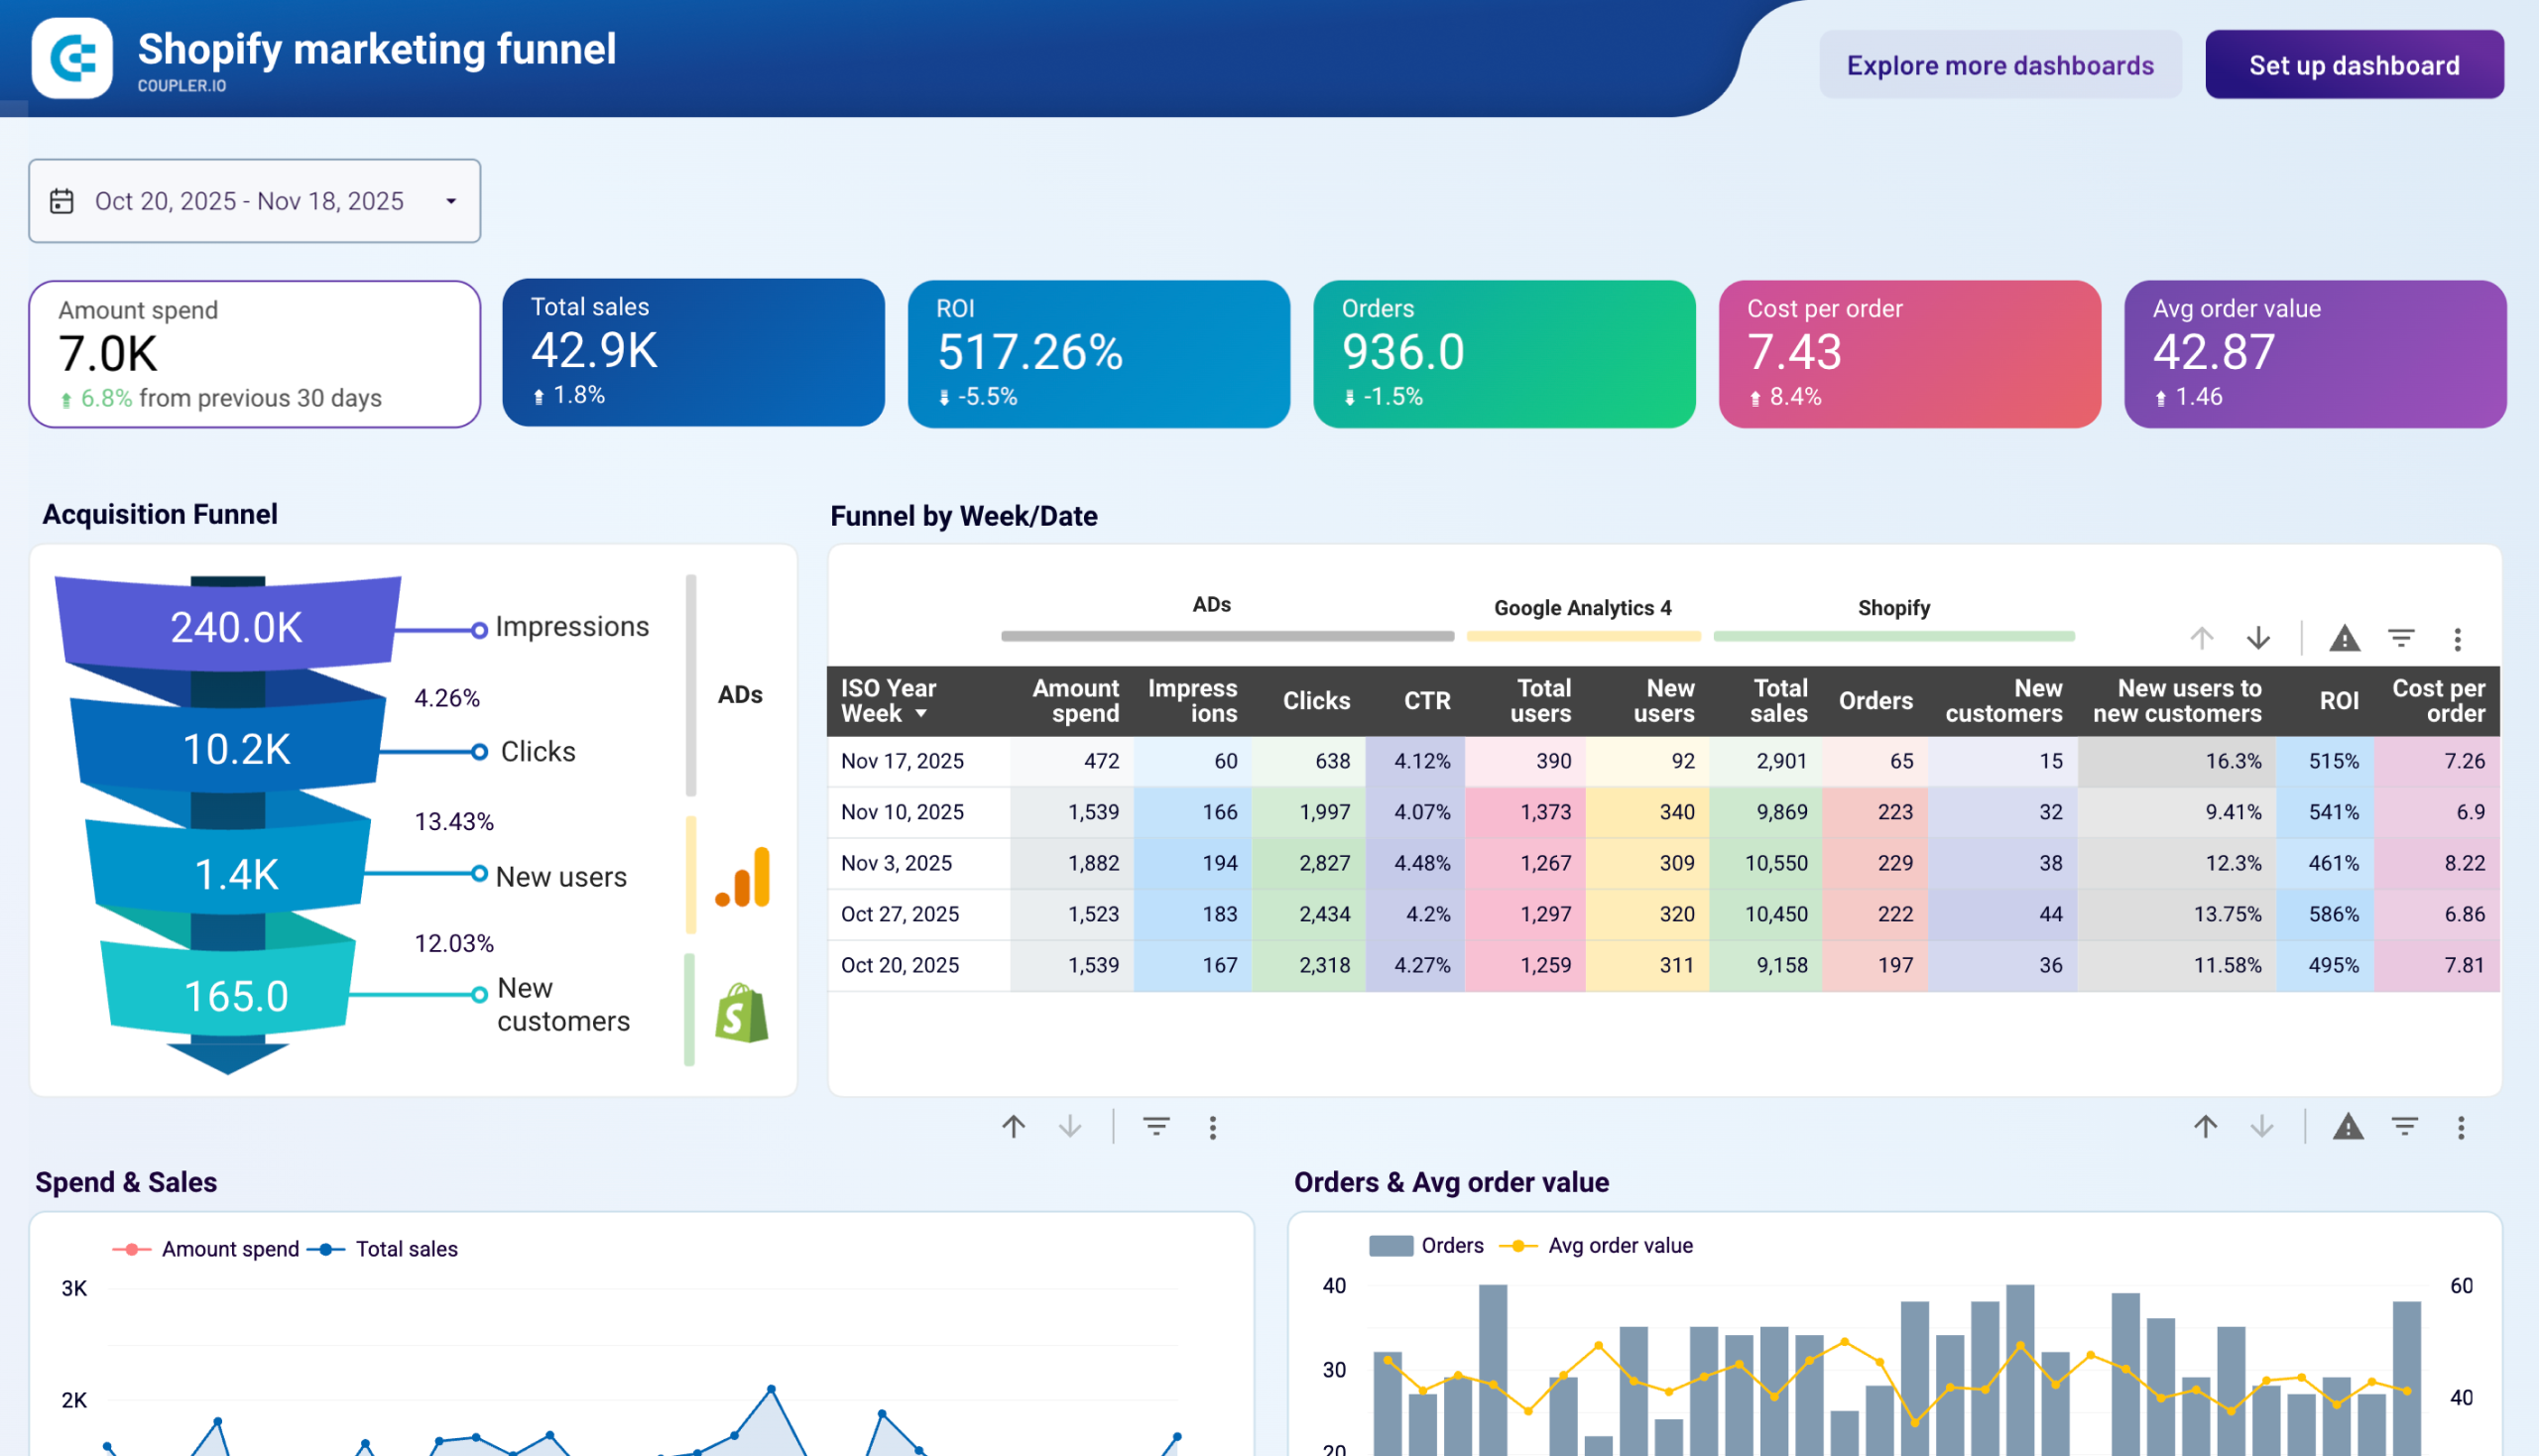
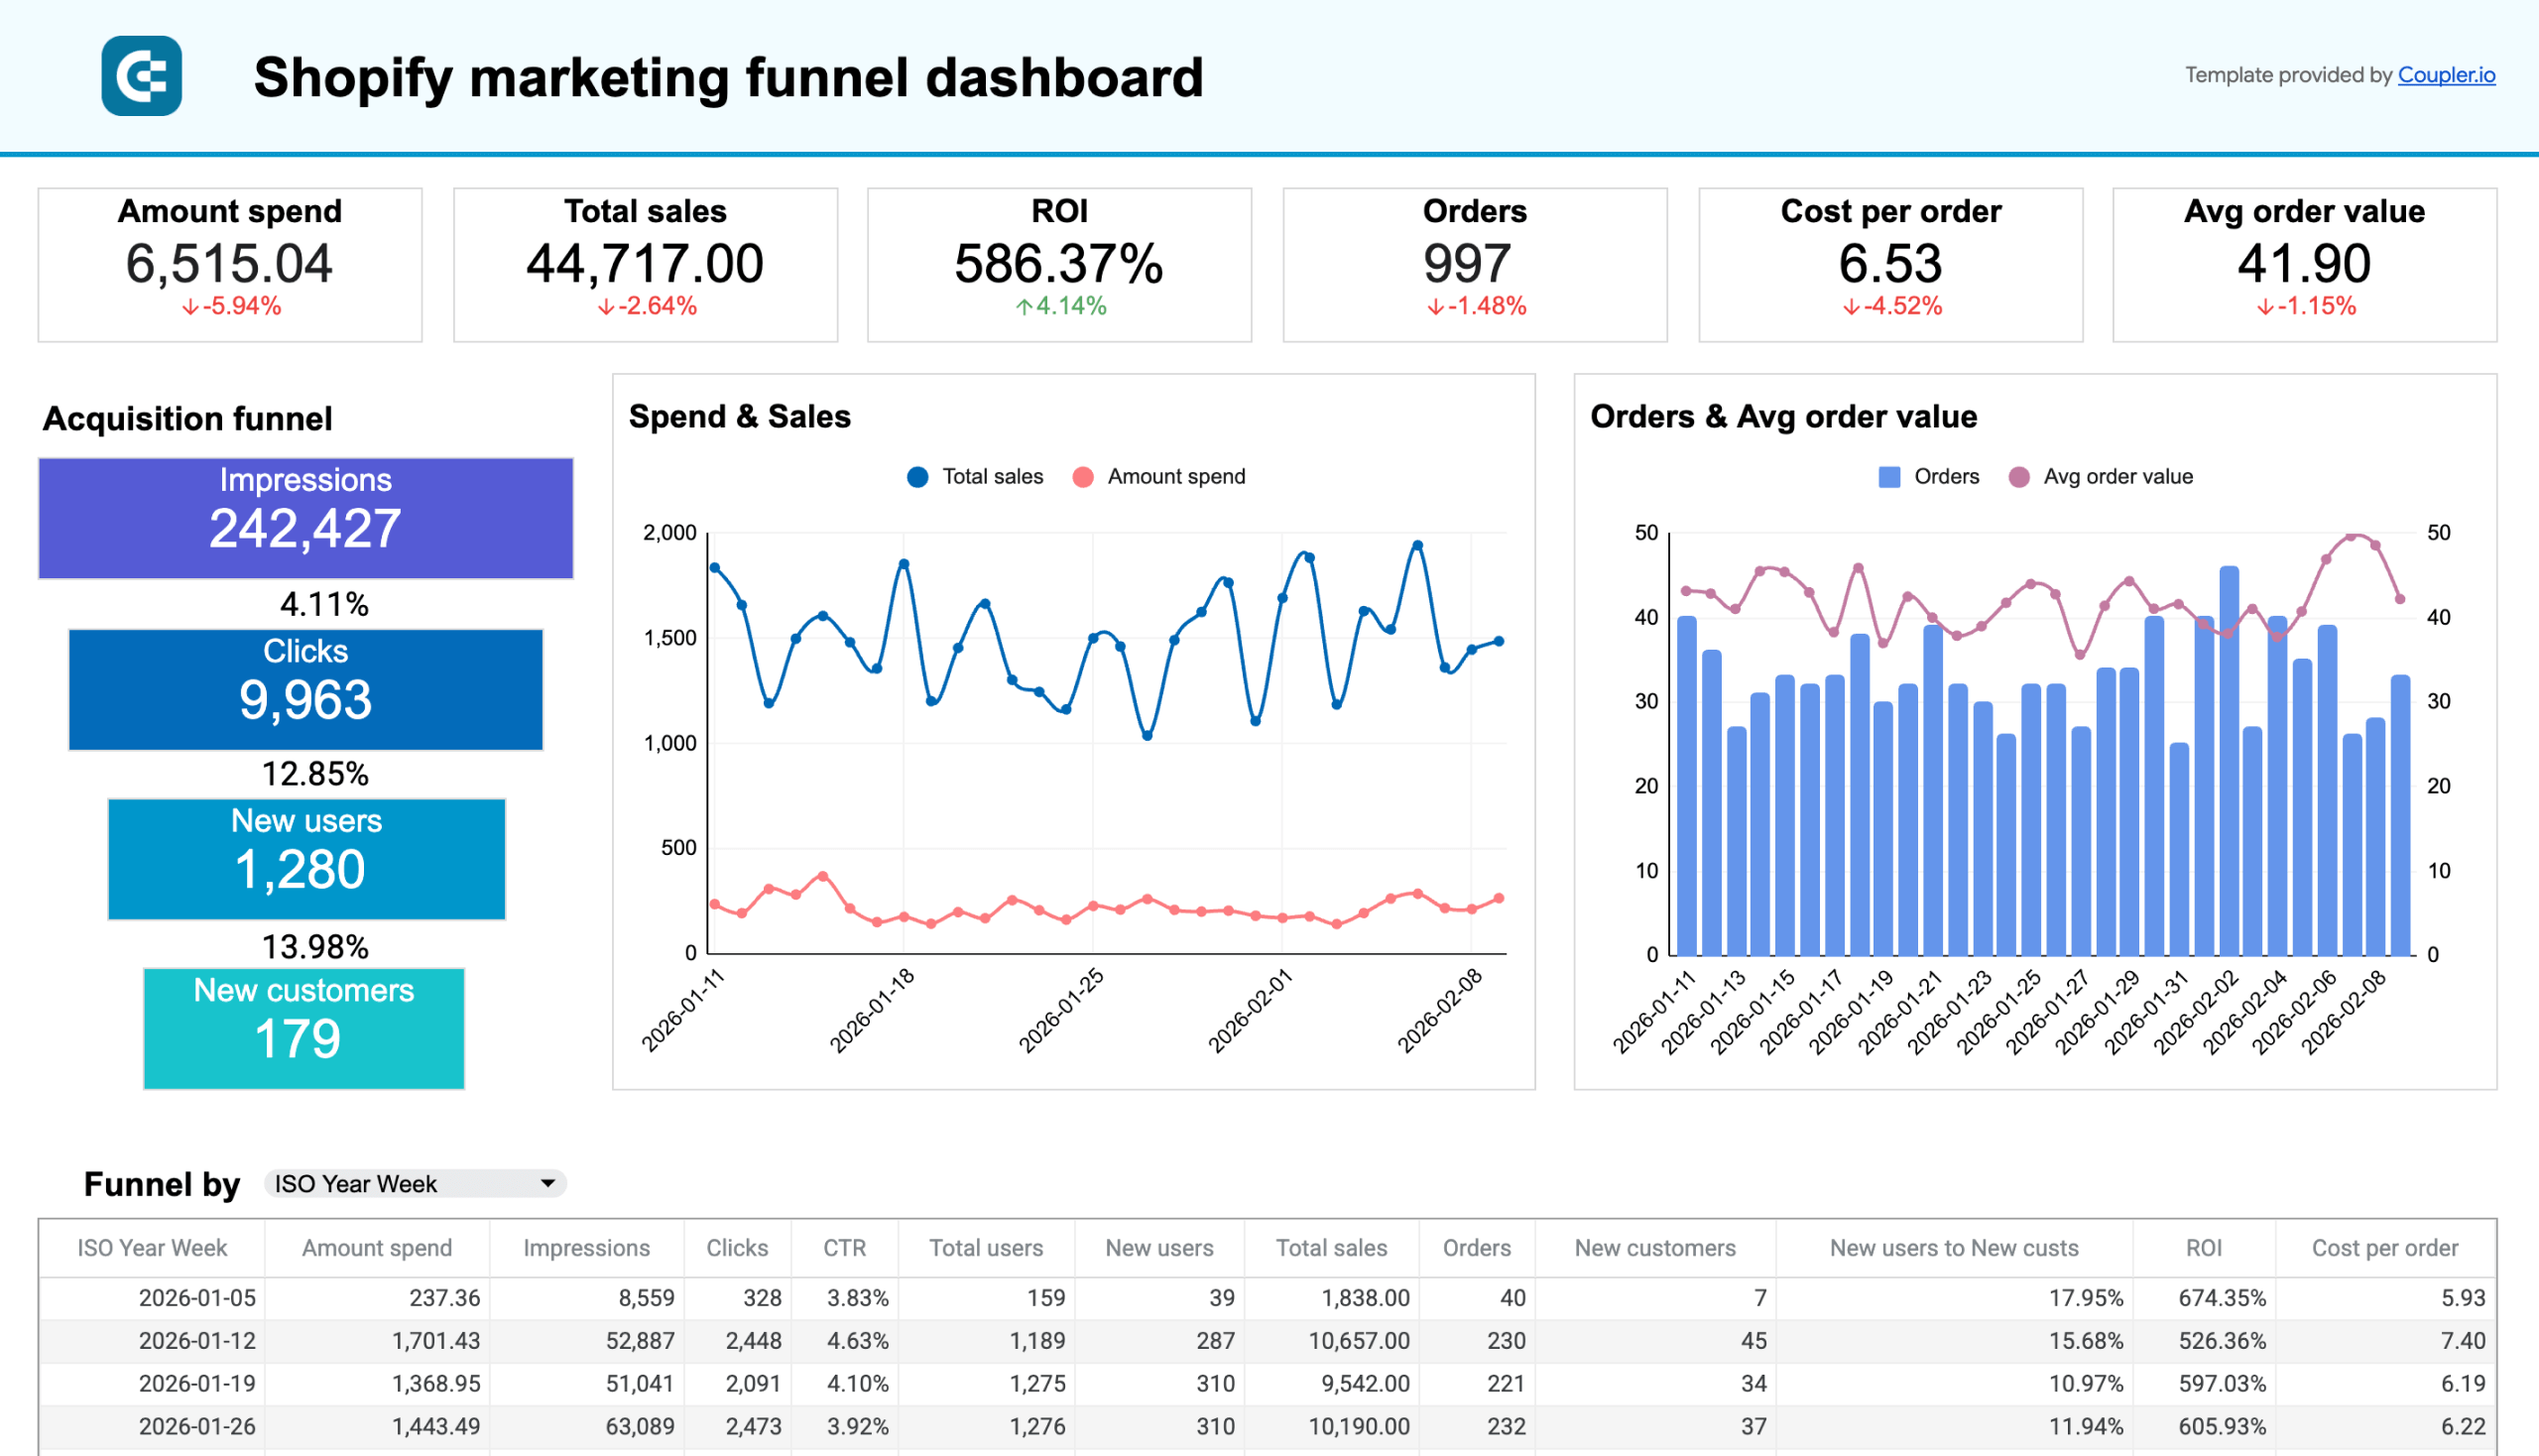
Preview dashboardWith this dashboard, you’ll find the following data points:
- Top-level KPIs like ad spend, revenue, ROI, orders, and cost per order, instantly showing you whether your campaigns are generating returns.
- Shopify sales funnel visualization tracking the full acquisition journey.
- Trend charts that compare: Spend vs. revenue over time, and orders vs. average order value.
- Weekly breakdowns with key metrics like CTR, new customers, ROI, and cost per order, making it easy to spot performance shifts.
If you want to dive deeper, the Analytics tab is where you’ll find a breakdown of total vs. new users, with visual segmentation and much more.
This dashboard is available in Coupler.io and as a template in Looker Studio, Google Sheets, and Power BI. Choose your version and try it right away for free.


Shopify inventory dashboard
Inventory decisions shouldn’t be guesswork, as they can have a major impact on your store’s bottom line
This Shopify inventory dashboard helps you stay on top of stock levels, order trends, and refund rates – all in one view.
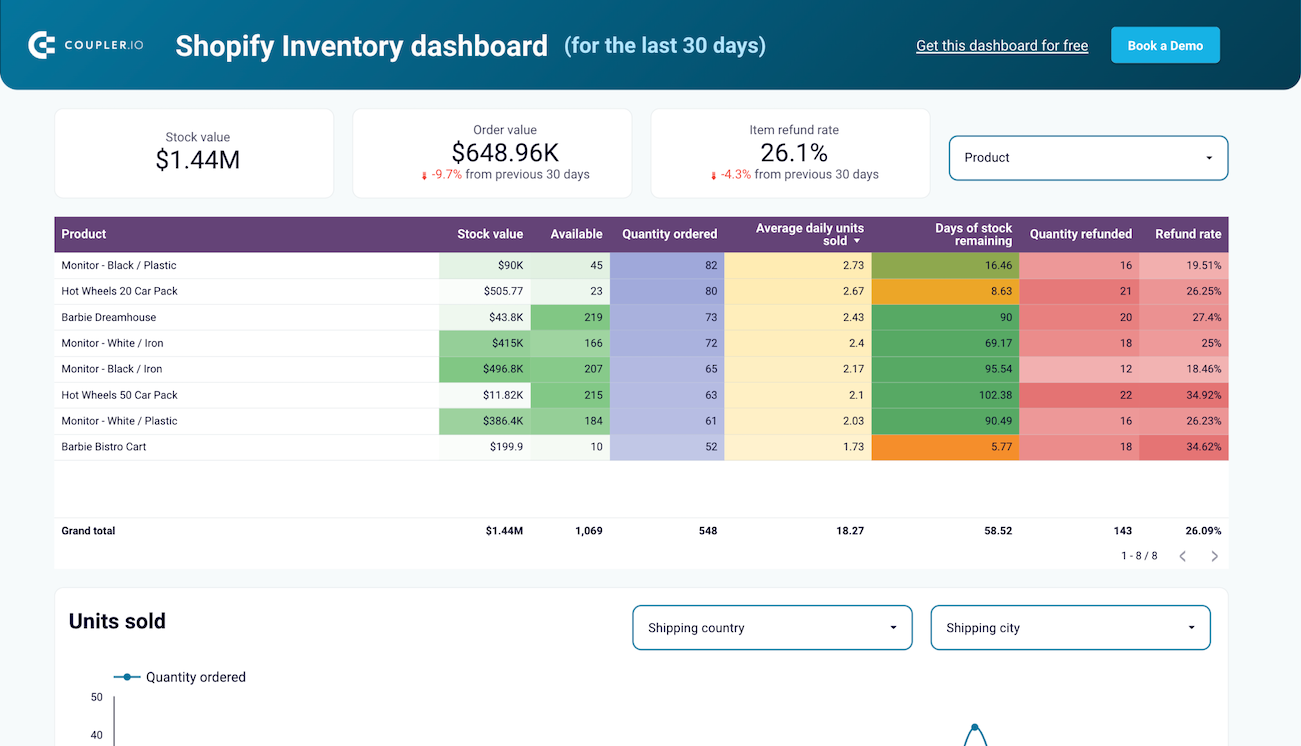
Quickly spot which items are moving fast, which ones are piling up, and how much stock you’ve got left in the tank.
You can even break it down by product, country, or location to optimize restocking and reduce waste. This is also beneficial when it comes to targeting certain locations where sales for some products are high.
So, if you need to monitor Shopify store performance from a supply chain angle, then this dashboard keeps your fulfillment team just as informed as your sales team and fulfilled (pun intended).
The Coupler.io Shopify inventory dashboard is available as a Looker Studio template.
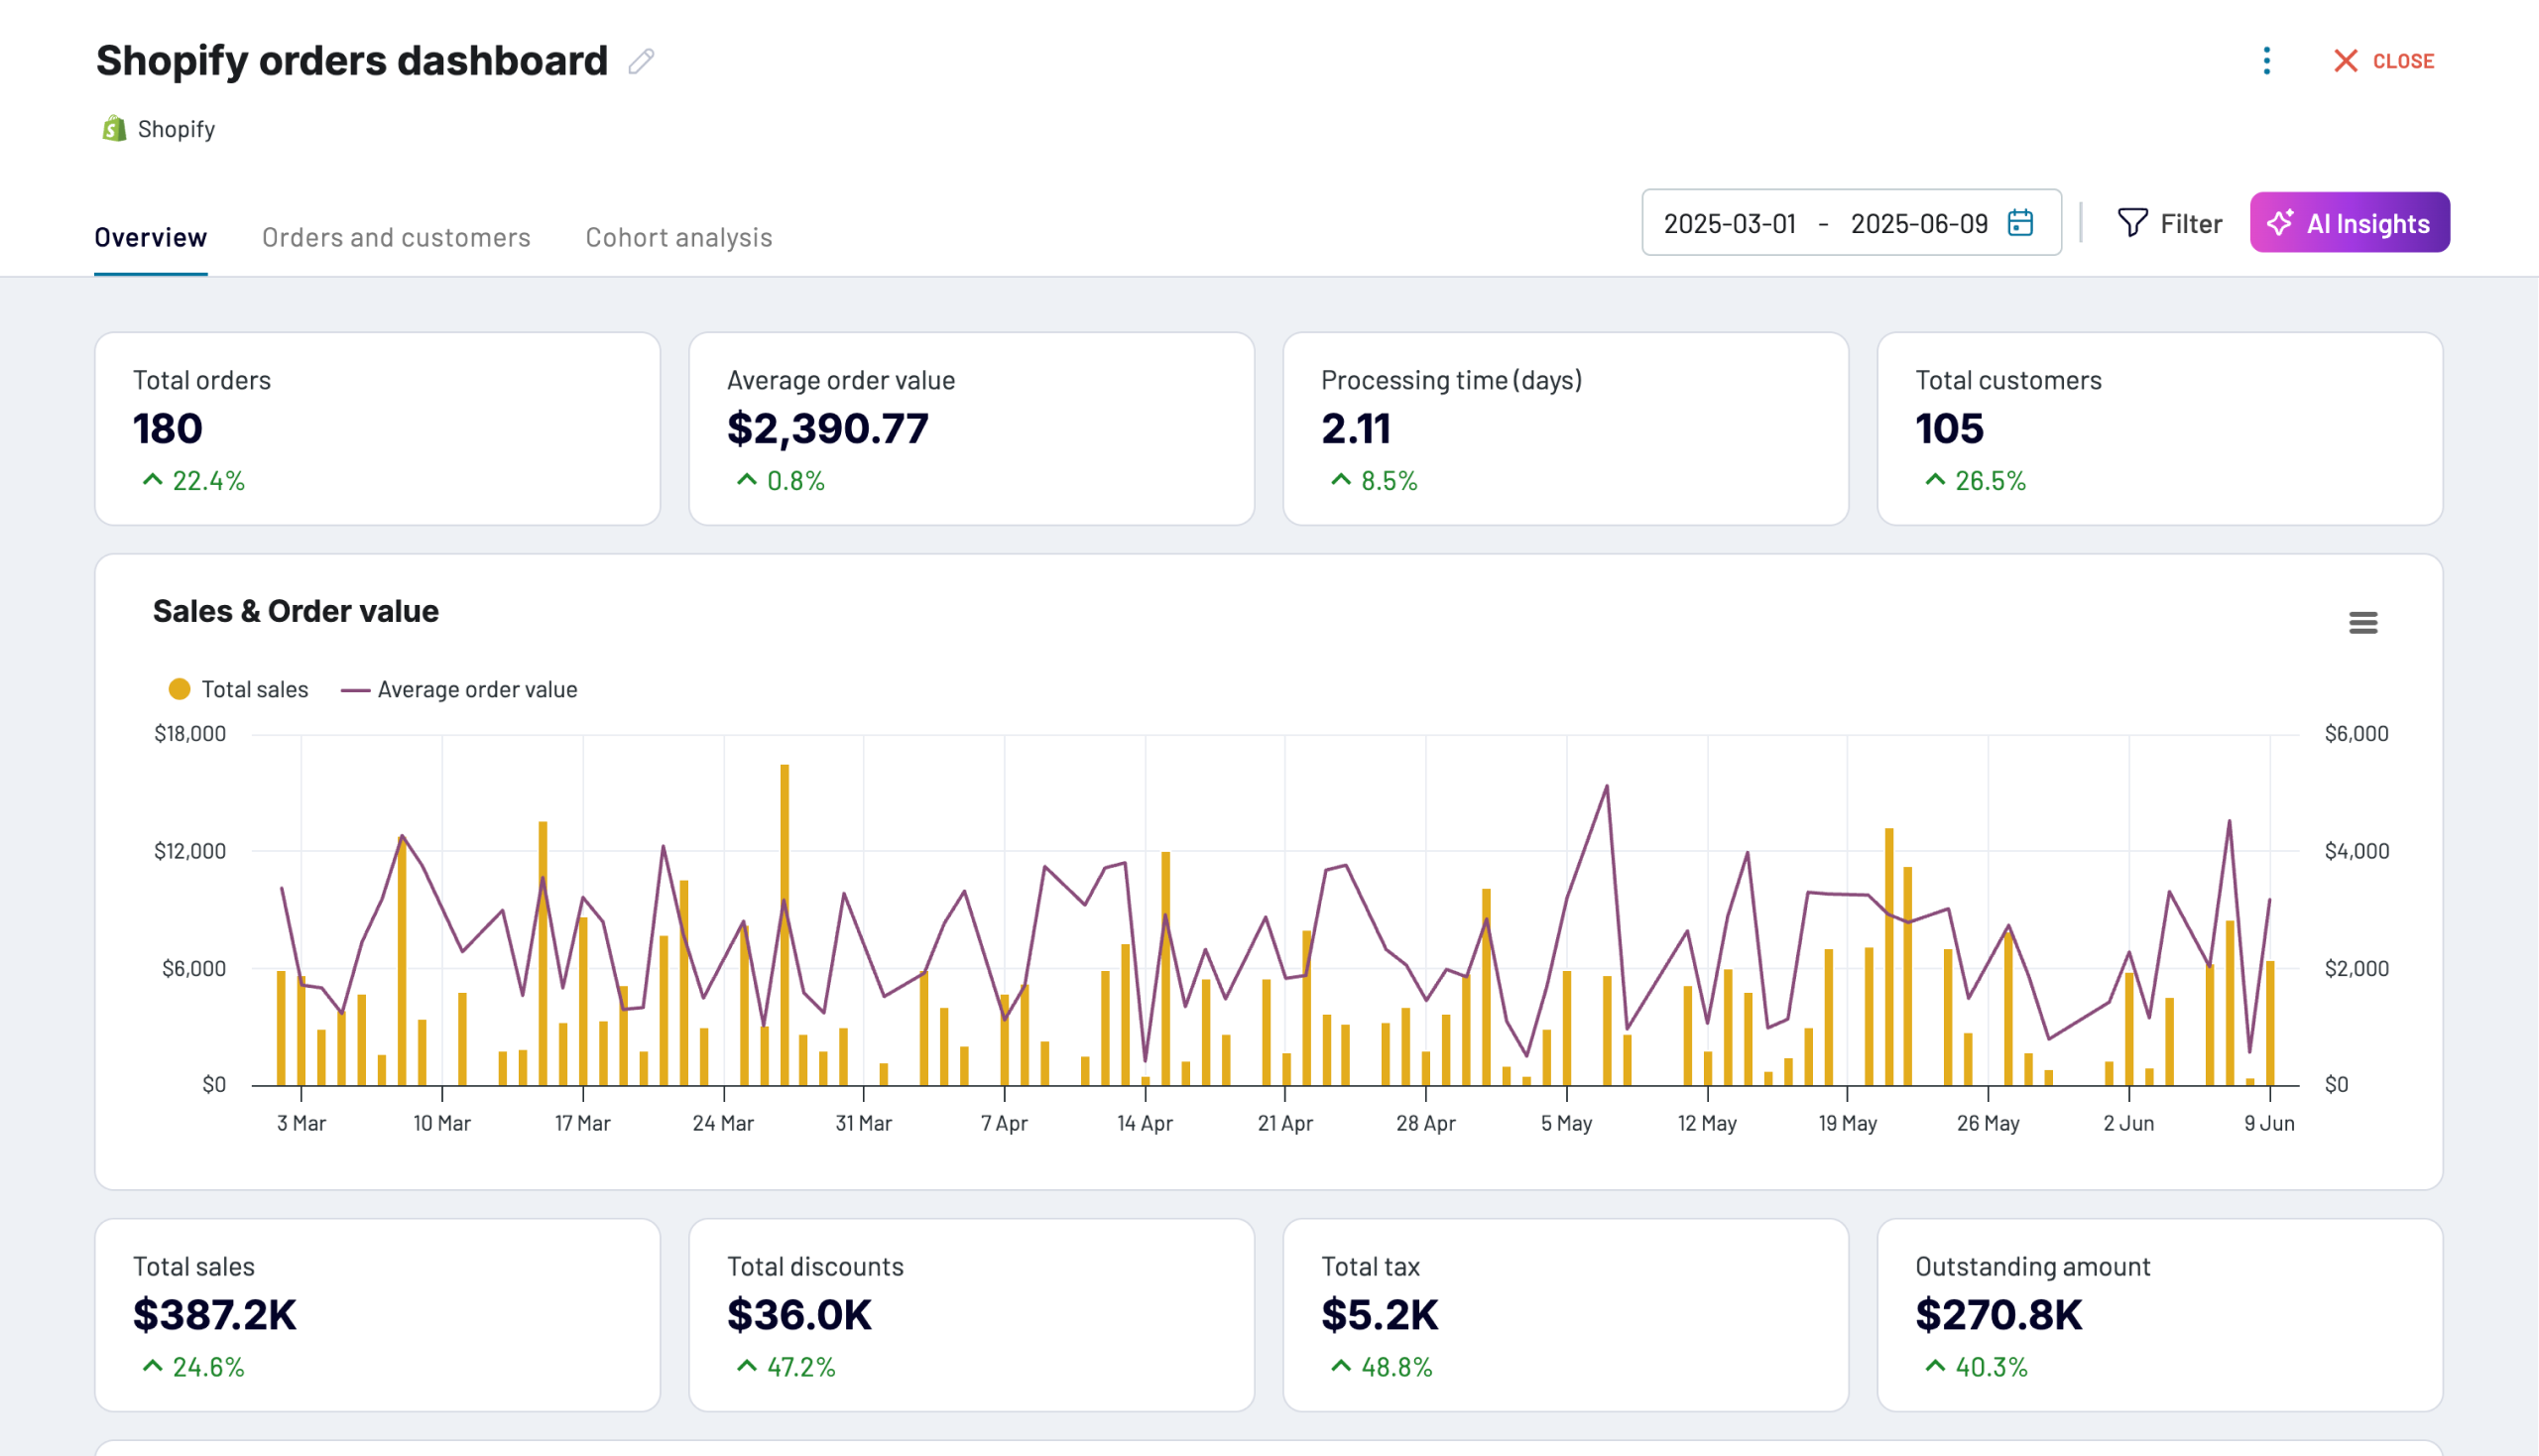
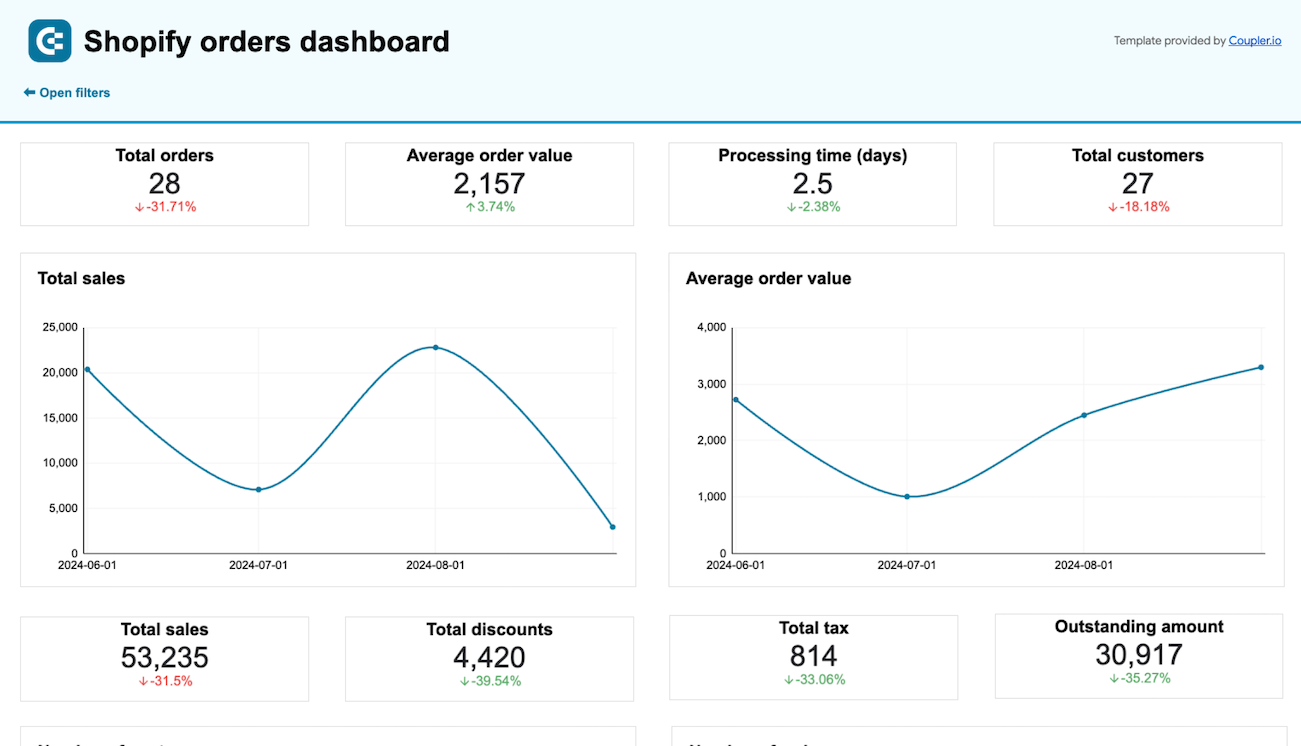
Shopify orders dashboard
Want to understand what’s really going on with your orders? This Looker Studio Shopify orders dashboard brings clarity to your order volume, value, and fulfillment trends, again, no complex setup needed.

Here’s what it shows:
- Number of orders, customers, and average order value over time.
- Processing time insights to spot fulfillment delays early.
- Visual trends for total sales, returns, discounts, and outstanding amounts.
- Breakdown of orders by shipping country and sales source.
- Table with order date, financial status, and discounts.
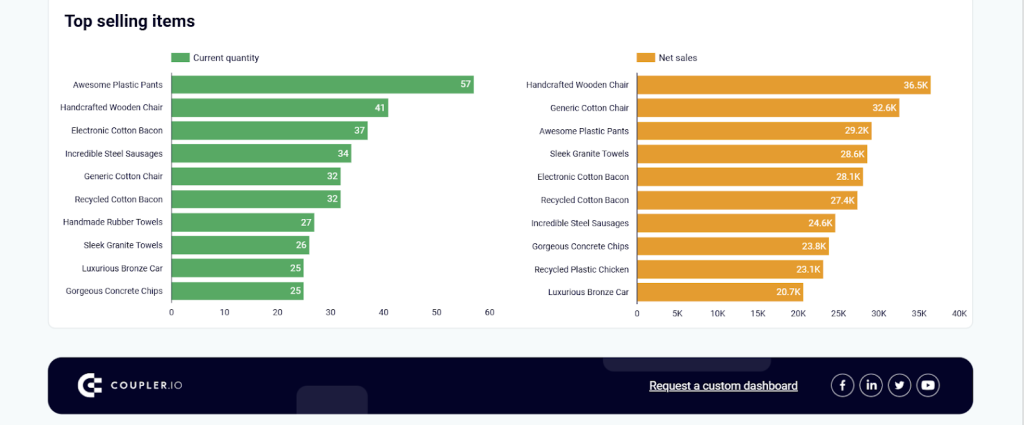
- Clean bar chart of your best-selling items and a lot more.
If you’re managing high volumes or multiple shipping zones, this dashboard helps you stay ahead of issues before they snowball. Try it right away for free with the native Shopify orders dashboard in Coupler.io or as a template in Looker Studio, Power BI, or Google Sheets.
Why analyzing Shopify traffic matters
So why does it matter? When you analyze Shopify traffic, the three most important questions are:
- Who are your visitors?
- Where are they coming from?
- What are they doing once they land on your store?
Shopify traffic analytics isn’t just about watching sessions climb or bounce rates dip, it’s your first signal into what’s working (and what’s not) so you can optimize your marketing efforts.
When you pair traffic data with performance metrics like conversion rates, product engagement, or channel ROI, you shift from reacting to leading.
Attribution is messy, especially with iOS privacy changes and cross-device shopping. Many store owners still over-credit last-click channels like email while undervaluing top-of-funnel sources. I recommend using blended attribution models (first-click + last-click) and reviewing post-purchase survey data. Combining Shopify’s reports with tools like Triple Whale or native pixel tracking gives you a fuller picture of what’s working.
Suddenly, you’re not guessing why sales dipped last week or which ad campaigns drive traffic. You’re working with answers, not assumptions.
Take SellThru for example. As a performance-focused marketing agency, they struggled with slow onboarding and scattered channel insights. After switching to Coupler.io’s automated dashboards, they:
- Reduced client setup time from 2 weeks to just 2–3 days
- Achieved 95%+ tracking reliability across all campaigns
- Saved over 20 hours per month previously spent on manual reporting
- Used the time saved to focus on campaign optimization and retention
And then there’s PlumbBooks, a bookkeeping service for home contractors that faced a different challenge: their clients struggled to understand financial performance without digging through QuickBooks reports.
With Coupler’s automated dashboards, they helped the clients in the following ways:
- Track financial goals and monitor key performance indicators
- Automatically compare performance across time periods
- Make quicker, data-driven business decisions
- Increased revenue for PlumbBooks by 40%
In both cases, the data was already there. The only thing that changed was how it was analyzed, visualized, and then used.
And that’s the real benefit of traffic analysis, it helps you spot opportunities, fix bottlenecks, and make smarter decisions that move the needle.
True data story winners aren’t just about gathering data; they are also about taking action at the right time!