Catchr.io automates marketing reporting, but the setup process requires switching between Catchr and your destination tool to configure connectors, metrics, and schedules. This back-and-forth creates friction as reporting scales.
Since Catchr only handles marketing data, answering questions like “How does ad spend connect to revenue?” requires additional tools for CRM and finance data. We’ll explore seven Catchr alternatives that reduce workflow complexity and support cross-functional reporting..
What are the best Catchr.io alternatives?
| Feature | Catchr.io | Coupler.io | Funnel.io | Improvado | Power My Analytics | Dataslayer | Windsor.ai | Fivetran |
| Starting price | ~$20/month | $24/month | Custom | Custom | $49.95/month | $30/month | $19/month | $19/month |
| Free trial | ✅ | ✅ | ✅ | ✅ | ✅ | ✅ | ✅ | ✅ |
| Total data sources | 80+ | 400+ | 500+ | 500+ | 100+ | 50+ | 325+ | 700+ |
| All data sources available in all plans | ⛔ | ✅ | ⛔ | ⛔ | ⛔ | ✅ | ⛔ | ⛔ |
| Data destinations | BI tools, Spreadsheets, and warehouses | BI tools, Spreadsheets, databases, warehouses, JSON, AI tools | BI tools, warehouses | BI tools, warehouses | Spreadsheets, BI tools, SQL/BigQuery | Spreadsheets, BI tools, warehouses | BI tools, Spreadsheets, warehouses | Warehouses, data lakes |
| Data transformation | ⛔ | Filter, sort, calc, aggregate, join, append | Normalization & harmonization | Advanced transformations & governance | Basic formulas & blending | Limited (dashboard-level) | Normalization & custom metrics | SQL/dbt downstream |
| Min. update frequency | Hourly | Every 15 min | Near real-time/hourly | Hourly / custom | Hourly / daily | API-based | Every 15 min (higher tiers) | 1–15 min (plan-based) |
| Dashboard templates | 100+ | 170+ | Limited | Enterprise only | 40+ | 10+ | 70+ | ⛔ |
| AI capabilities | ⛔ | AI tools, insights, AI agent | ⛔ | Enterprise AI | AI insight credits | ⛔ | AI chats & attribution | AI data readiness |
| User reviews (G2/Capterra) | No reviews | G2: 4.8/5 Capterra: 4.9/5 | G2: 4.5/5 Capterra: 4.7/5 | Custom | G2: 4.5/5 Capterra: 4.7/5 | G2: 4.8/5 Capterra: 4.7/5 | G2: 4.5/5 | G2: 4.4/5 Capterra: 4.4/5 |
Top Catchr.io alternative: Coupler.io

Coupler.io is a no-code data integration & AI analytics platform designed to reduce workflow friction as reporting scales.
While Catchr.io relies on a connector-first setup, Coupler.io keeps the entire workflow in one place. You connect a source, transform the data, choose the destination, and set the refresh schedule without switching between tools. That positions Coupler.io as one of the most comprehensive Catchr software alternatives available.
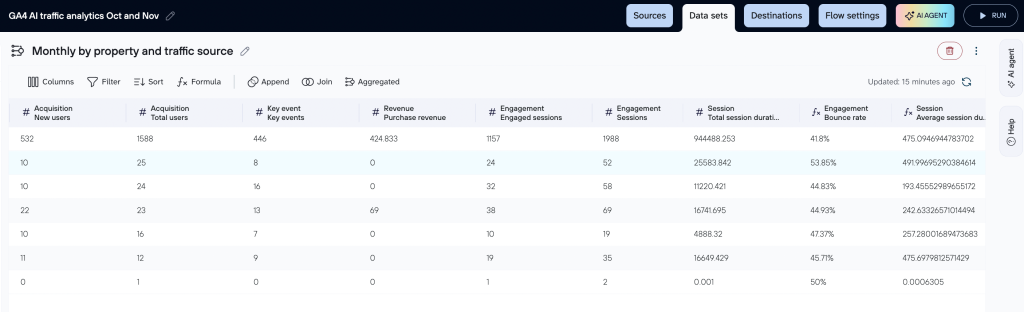
Beyond extraction, Coupler.io lets teams filter and sort data, manage columns, aggregate metrics, combine multiple sources, and create new calculated fields before the data reaches the destination. This removes the need to repeat the same setup work across Looker Studio, Power BI, or Excel.
What this looks like in practice: A marketing team at ClaritySeed automated multichannel reporting from GA4, Facebook Ads, and Google Ads using Coupler.io. The setup saved over 40 hours per month and reduced report delivery time by nearly five hours by eliminating repeated queries and manual cleanup across tools.
Coupler.io also avoids plan-based bottlenecks. All plans include access to 400+ data sources across marketing, finance, CRM, sales, product, and operations, along with all destinations. Teams can scale without upgrading just to unlock basics.
On top of that, Coupler.io offers 100+ ready-made datasets, 170+ dashboard templates, built-in AI integrations, AI-powered insights, and its own AI agent. Data refreshes run on flexible schedules, from monthly to every 15 minutes, or trigger via webhooks. Support is another differentiator, with a 95% customer satisfaction rate.
For teams that want a no-code and value-for-money solution that simplifies reporting across departments, Coupler.io is often the first alternative worth considering.
Head-to-head comparison table
| Feature | Coupler.io | Catchr.io |
| Data sources | 400+ (all plans) | 80+ (limited) |
| Unified UI to manage all destinations | ✅ One tool, one price | ⛔Multiple tools, higher costs |
| Min. refresh frequency | Every 15 min | Every hour |
| Data transformation | Column management Filter Sort Custom calculations Data aggregation Data unification (append & join) | None |
| Data blending | ✅ | ⛔ |
| Prebuilt transformation and dataset templates | ✅ | ⛔ |
| Data destinations | BI tools Spreadsheets Databases Data warehouses JSON AI tools | BI tools Spreadsheets Data warehouses Databases |
| Dashboard templates | 170+ | 100+ |
| AI tool integration | ✅ Claude, ChatGPT, Perplexity, Cursor | ⛔ |
| AI-generated insights | ✅ | ⛔ |
| Webhooks and automation | ✅ | ⛔ |
| Quality of support (G2 & Capterra) | G2: 4.8/5 Capterra: 4.9/5 | No reviews |
| Pricing starts at | $24/ month | $20/ month |
Coupler.io vs Catchr.io overview
Below is how Coupler.io addresses the core gaps of Catchr.io and additional capabilities that make it a compelling alternative.
Integrations
Coupler.io supports
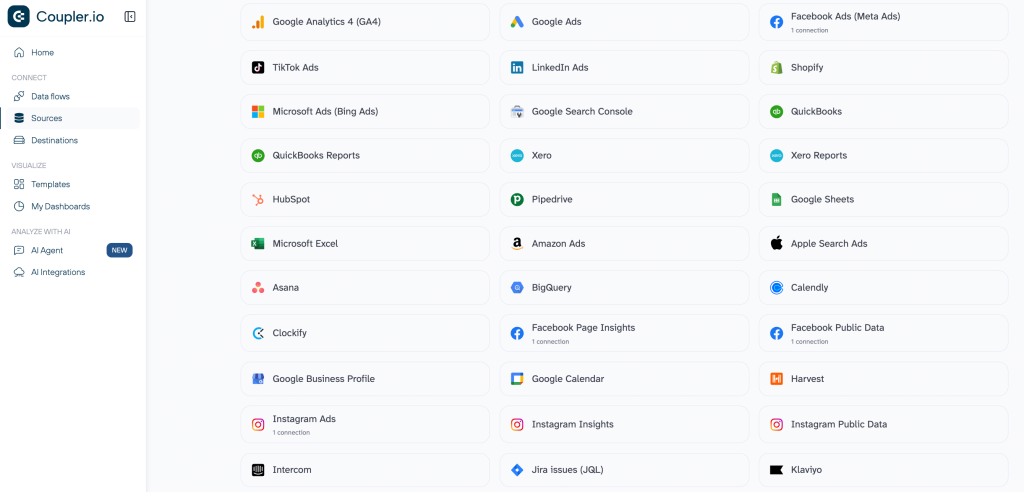
- 400+ sources, including marketing, CRM, finance, sales, operations, and more
- Sources span cloud apps like Google Analytics, Facebook Ads, HubSpot, Salesforce, QuickBooks, Shopify, and beyond
- Destinations include spreadsheets (Google Sheets, Excel), BI tools (Looker Studio, Power BI, Tableau), data warehouses (BigQuery, Redshift, PostgreSQL), and AI tools
- No-limiting access across plans. You can combine any source with any destination on all plans
With Coupler.io’s breadth, you can pull in non-marketing data (CRM or finance) and deliver it to multiple destinations from one setup. This way, you don’t have to reconfigure connectors and queries across tools.
Data transformation
Coupler.io provides built-in transformations before exporting data. It allows you to:
- Filter rows
- Sort data
- Rename, hide, reorder columns
- Aggregate metrics
- Combine data from multiple sources (e.g., append, join, aggregate)
All these transformations happen in the same workflow as the export without any coding.
Catchr.io primarily extracts and centralizes marketing data, then leaves it to the destination tool to shape it. But, Coupler.io lets you prepare and blend data up front, reducing the need to build formulas or transformation logic downstream.
Dashboards/templates
Coupler.io offers a large library of reporting assets that include:
- ~100 ready-made dataset templates so that you can start with prebuilt layouts instead of designing reports from scratch
- 170+ dashboard templates for tools like Looker Studio, Power BI, and Tableau that cover use cases across marketing, sales, finance, and cross-channel reporting
AI integrations & AI-powered insights
Coupler.io includes AI capabilities that sit on top of its data pipelines. Once data is connected and transformed inside Coupler.io, teams can use:
- AI integrations to send prepared datasets into AI tools and get insights to analyze trends and anomalies across synced data
- Coupler.io’s AI agent to explore and understand datasets without writing queries or formulas
Automatic data refresh
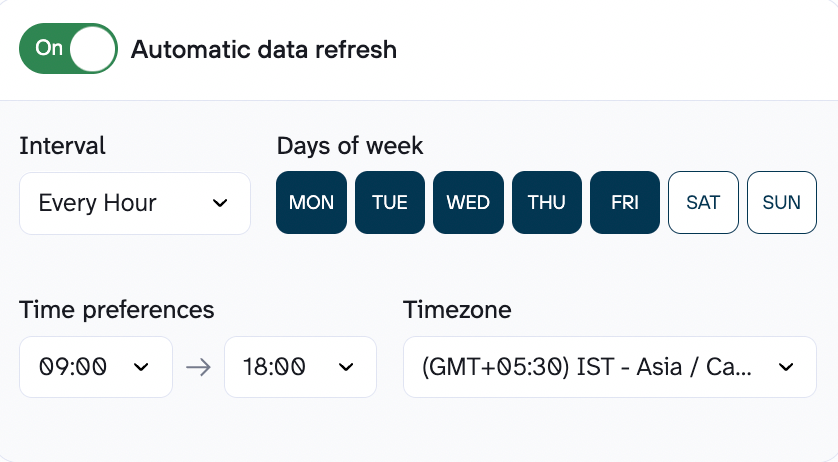
With Coupler.io, you’ll have fully automated scheduling for data refresh.
You can
- Set up a time-based data refresh cycle: Monthly → Daily → Hourly → Every 15 minutes
- Use webhooks for event-driven automation in some workflows
Pricing
Instead of comparing plans in isolation, it’s more useful to look at how pricing plays out in real setups. Below is how Catchr.io and Coupler.io compare across four common scenarios.
Scenario 1: Solo marketer or small business owner
| Setup requirements | Catchr.io cost | Coupler.io cost | Winner |
| • 1 user • 2 data sources • 2 destinations • Daily refresh | Growth plan: ~$177/month Extra destination: +$177/month Total: ~$354/month | Active plan: $99/month Includes unlimited users, unlimited sources, and 3 destinations | ✅ Coupler.io Saves $255/month ($3060/year) |
Scenario 2: Small marketing team
| Setup requirements | Catchr.io cost | Coupler.io cost | Winner |
| • 5 users • 10 data sources • 2 destinations • Daily refresh | Base plan: ~$177/month Extra destination: +$177/month Extra users and sources: +~$445/month Total: ~$799/month | Active plan: $99/month Includes unlimited users, unlimited sources, and 3 destinations | ✅ Coupler.io Saves $700/month ($8400/year) |
Scenario 3: Marketing analyst + team
| Setup requirements | Catchr.io cost | Coupler.io cost | Winner |
| • 15 users • 25 data sources • 4 destinations (BI + warehouse) • Hourly refresh | Business/custom plan Estimated: ~$800–1,400/month | Pro plan: $199/month Unlimited users, sources, and destinations Hourly refresh included | ✅ Coupler.io Saves $600–1,200/month ($7,200–14,400/year) |
Scenario 4: Large marketing agency
| Setup requirements | Catchr.io cost | Coupler.io cost | Winner |
| • 50+ users • 50+ data sources • 6+ destinations • 15-minute refresh | Enterprise plan Custom pricing (sales-led, variable) | Business plan Custom pricing, but with a lower and more predictable starting point Unlimited users, sources, and destinations included | ✅ Coupler.io More predictable pricing and easier cost control as the agency scales |
Across all scenarios, Coupler.io remains consistent because of how pricing is structured:
- No per-user charges: unlimited users on Active and Pro plans
- No per-source charges: all 400+ sources available on every plan
- No per-destination charges: Pro plan includes unlimited destinations
- No regional pricing differences: same rates globally
- Transparent scaling: you know what you’ll pay as usage grows
With account-based billing, you pay based on connected accounts, not users, sources, or destinations. So, there are no surprise costs, which makes budgeting simple.
When to use Coupler.io instead of Catchr.io
Both tools solve data automation problems, but they’re built for different stages of reporting maturity. The right choice depends on how complex your workflow is and how far beyond marketing data you need to go.
If you need basic marketing data extraction and are comfortable building and managing reporting logic inside destination tools, Catchr.io works for you. But if you want to keep reporting scalable, reusable, and cross-functional, Coupler.io is the better choice.
For teams with more complex requirements, Coupler.io also offers custom data analytics services. These include custom integrations, dashboard creation, automation setup, and reporting optimization.

Automate your data integration and analytics with Coupler.io
Get started for freeOther alternatives to Catchr.io
Funnel.io
Funnel.io is a marketing intelligence platform for teams that manage large volumes of marketing data across many channels, brands, or regions, and need that data cleaned and standardized before reporting.
Its primary differentiator is that it acts as a central marketing data hub. Funnel focuses on collecting marketing data, normalizing it (currencies, naming conventions, time zones), and making it analysis-ready before it reaches dashboards or BI tools.
Comparison Table between Funnel.io, Coupler.io, and Catchr.io
| Feature | Funnel.io | Coupler.io | Catchr.io |
| Data sources | 500+ marketing & ad platforms | 400+ (all plans) | 80+ (limited) |
| Unified UI to manage all destinations | ⚠️ Multiple setup layers | ✅ One tool, one price | ⛔Multiple tools, higher costs |
| Min. refresh frequency | Near real-time / hourly | Every 15 min | Every hour |
| Data transformation | Normalization, harmonization, custom transformations | Column management Filter Sort Custom calculations Data aggregation Data unification (append & join) | None |
| Data blending | ✅ Yes (marketing-focused) | ✅ | ⛔ |
| Prebuilt transformation and dataset templates | ⚠️ Limited / custom | ✅ | ⛔ |
| Data destinations | BI tools & data warehouses | BI tools Spreadsheets Databases Data warehouses JSON AI tools | BI tools Spreadsheets Data warehouses Databases |
| Dashboard templates | Limited | 170+ | 100+ |
| AI tool integration | ⛔ | ✅ Claude, ChatGPT, Perplexity, Cursor | ⛔ |
| AI-generated insights | ⛔ | ✅ | ⛔ |
| Webhooks and automation | ✅ | ✅ | ⛔ |
| Quality of support (G2 & Capterra) | G2: 4.5/5 Capterra: 4.7/5 | G2: 4.8/5 Capterra: 4.9/5 | No reviews |
| Pricing starts at | Custom | $24/ month | $20/ month |
Integrations
Funnel.io offers a deep library of marketing-focused integrations.
- 500+ sources, primarily across:
- Advertising platforms (Google Ads, Meta Ads, TikTok, LinkedIn)
- Analytics tools (GA4, attribution platforms)
- E-commerce and marketplace data
- Some CRM and revenue-related tools
- Destinations include:
- Google Sheets and Excel
- Looker Studio, Power BI, Tableau
- Data warehouses such as BigQuery and Snowflake
These integrations are optimized for marketing use cases, meaning common breakdowns and metrics are already structured in a way that works for reporting.
Features
- A marketing data hub that centralizes all marketing data in one place
- No-code normalization and transformation rules so that users can standardize metrics and naming conventions
- Automatic handling of global reporting complexity that supports time zones, currencies, and multi-region setups reduces manual cleanup
- Historical data storage and backfills for rebuilding reports or analyzing long-term performance trends
- Exports data to BI tools and warehouses to use Funnel as a preparation layer before advanced analysis or visualization
- Advanced measurement add-ons like optional modules for attribution, marketing mix modeling, and AI-assisted analysis
Pricing
Funnel.io uses a plan + flexpoints pricing model.
- Each plan includes a base number of flexpoints
- Flexpoints are consumed based on:
- Number of connected sources
- Data granularity and breakdowns
- Destinations and exports
- As reporting complexity grows, flexpoint usage increases
To help teams plan costs, Funnel.io provides a pricing estimate calculator, which lets users model expected spend based on their setup before committing to a plan. Enterprise pricing is custom and typically includes onboarding and support.
This model works well for teams with evolving needs, but costs can become harder to predict at scale.
Pros & Cons
| Pros | Cons |
| Purpose-built for marketing data at scale | Pricing can increase quickly as flexpoint usage grows |
| Strong normalization reduces manual cleanup in BI tools | Less suitable for deep cross-functional modeling beyond marketing |
| Handles multi-brand and multi-region reporting well | Requires active management of data rules and governance |
| No-code setup reduces dependency on data engineering | Can feel heavyweight for small or static reporting setups |
| Acts as a single source of truth for marketing performance |
When to use Funnel.io over Catchr.io
Choose Funnel.io when your main challenge is managing complexity in marketing data like multiple platforms, regions, currencies, or brands, and you need standardized data before reporting. Funnel works best when a marketing analyst or ops team owns data quality and governance.
Stick with Catchr.io if you simply need to move marketing data into reports and are comfortable shaping that data inside spreadsheets or BI tools.
Improvado

Improvado is an AI-powered marketing analytics and intelligence platform that automates complex data workflows, combines hundreds of marketing data sources, and generates analysis-ready datasets with minimal manual effort.
The primary use case for Improvado is marketing analytics at scale. It’s built for companies and agencies that need strong data governance, standardized schemas, and advanced analysis across regions, brands, or business units.
Comparison Table between Improvado, Coupler.io, and Catchr.io
| Feature | Improvado | Coupler.io | Catchr.io |
| Data sources | 500+ (wide marketing + CRM + other sources) | 400+ (all plans) | 80+ (limited) |
| Unified UI to manage all destinations | ⚠️Enterprise-oriented setup + configurations | ✅ One tool, one price | ⛔Multiple tools, higher costs |
| Min. refresh frequency | Hourly / Custom (enterprise) | Every 15 min | Every hour |
| Data transformation | Advanced transformations & harmonization | Column management Filter Sort Custom calculations Data aggregation Data unification (append & join) | None |
| Data blending | ✅ Yes (marketing-focused) | ✅ | ⛔ |
| Prebuilt transformation and dataset templates | ⚠️ Yes (enterprise templates) | ✅ | ⛔ |
| Data destinations | Warehouses, BI tools, CSV/Excel | BI tools Spreadsheets Databases Data warehouses JSON AI tools | BI tools Spreadsheets Data warehouses Databases |
| Dashboard templates | Enterprise dashboards | 170+ | 100+ |
| AI tool integration | Enterprise AI/analytics features | ✅ Claude, ChatGPT, Perplexity, Cursor | ⛔ |
| AI-generated insights | ⚠️ Yes (advanced reporting & insights) | ✅ | ⛔ |
| Webhooks and automation | ⚠️ Yes (enterprise workflows) | ✅ | ⛔ |
| Quality of support (G2 & Capterra) | G2: 4.4/5 Capterra: 4.5/5 | G2: 4.8/5 Capterra: 4.9/5 | No reviews |
| Pricing starts at | Custom | $24/ month | $20/ month |
Integrations
Improvado supports a large ecosystem of connectors geared towards comprehensive marketing coverage:
- 500+ marketing, sales, CRM, and analytics sources
- Integrates deeply with major ad platforms (e.g., Google Ads, Meta, TikTok), CRM systems (e.g., HubSpot), and performance tools
- Destinations include data warehouses (BigQuery, Snowflake, MS SQL, Databricks), BI tools (Looker Studio, Power BI, Tableau), and spreadsheets
This makes Improvado suitable for complex, multi-channel reporting needs where disparate marketing and sales datasets must be consolidated into a consistent model.
Features
- Automatically pulls data from a large number of marketing and sales platforms and keeps it synced on a recurring schedule
- Transforms and harmonizes data so metrics, naming conventions, and dimensions stay consistent across channels and regions
- Applies governance rules to catch issues like broken campaigns, missing parameters, or inconsistent naming before reports are built
- Structures data into unified schemas that analysts can query directly in BI tools or warehouses
- Supports AI-assisted analysis, such as detecting anomalies or exploring performance using natural language
- Handles large historical datasets and frequent refreshes, which is useful for long-term trend analysis and enterprise reporting
Pricing
Improvado uses custom, sales-led pricing based on scale and complexity.
- Plans are typically aligned to Growth, Advanced, and Enterprise tiers.
- Pricing depends on factors like:
- Annual data volume (rows/events)
- Number of connected sources and destinations
- Frequency of data refresh
- Level of governance and analytics required
Costs are generally higher than connector-based tools and make the most sense when data complexity justifies the investment. Teams usually go through a discovery and scoping process before receiving an estimate.
Pros & Cons
| Pros | Cons |
| Handles complex, high-volume marketing data environments well | Not cost-effective for small teams or simple reporting |
| Strong data standardization reduces manual cleanup in BI tools | Requires time and ownership to configure schemas and governance |
| Built-in governance supports reporting quality at scale | Relies on external BI tools for visualization |
| Integrates smoothly with warehouses and analytics stacks | Sales-led evaluation and onboarding process |
| AI-driven insights add value for large datasets | – |
When to use Improvado over Catchr.io
Go for Improvado when marketing reporting becomes hard because of scale and complexity, many platforms, regions, currencies, or strict reporting standards. It’s a strong fit when a dedicated analyst or data team owns marketing analytics and needs reliable, governed data pipelines.
Catchr.io works well if your goal is simply to extract marketing data and shape it inside spreadsheets or BI tools.
Power My Analytics

Power My Analytics is a reporting automation and marketing data hub. It helps digital marketers, small teams, and agencies collect data from advertising, social media, email, CRM, and e-commerce platforms and send it directly to reporting tools like Google Sheets, Looker Studio, and Excel.
The primary strength of Power My Analytics is making automated marketing reporting simple and affordable using tools teams already work with.
Comparison Table between the Power My Analytics, Coupler.io, and Catchr.io
| Feature | Power My Analytics | Coupler.io | Catchr.io |
| Data sources | ~100+ (wide marketing, CRM + analytics connectors) | 400+ (all plans) | 80+ (limited) |
| Unified UI to manage all destinations | ⚠️ One tool with multiple setup steps | ✅ One tool, one price | ⛔Multiple tools, higher costs |
| Min. refresh frequency | Hourly / Daily | Every 15 min | Every hour |
| Data transformation | Basic transformations, blending, formulas | Column management Filter Sort Custom calculations Data aggregation Data unification (append & join) | None |
| Data blending | ⚠️ Yes (dashboard-focused) | ✅ | ⛔ |
| Prebuilt transformation and dataset templates | ⚠️ Yes (templates vary) | ✅ | ⛔ |
| Data destinations | Spreadsheets, Looker Studio, Excel, BigQuery/SQL | BI tools Spreadsheets Databases Data warehouses JSON AI tools | BI tools Spreadsheets Data warehouses Databases |
| Dashboard templates | 40+ | 170+ | 100+ |
| AI tool integration | AI insight credits / basic integrations | ✅ Claude, ChatGPT, Perplexity, Cursor | ⛔ |
| AI-generated insights | AI insight credits | ✅ | ⛔ |
| Webhooks and automation | ⚠️ Yes (scheduled automations) | ✅ | ⛔ |
| Quality of support (G2 & Capterra) | G2: 4.5/5 Capterra: 4.7/5 | G2: 4.8/5 Capterra: 4.9/5 | No reviews |
| Pricing starts at | $49.95/ month | $24/ month | $20/ month |
Integrations
Power My Analytics lets users connect a broad range of marketing and analytics platforms to reporting tools:
- Sources: Includes popular marketing, social, email, CRM, shopping, and advertising tools like Facebook, Instagram, LinkedIn, Google Search Console, Google Analytics, Amazon, Shopify, and more
- Destinations: Common reporting endpoints like Google Looker Studio (Data Studio), Google Sheets, Microsoft Excel, and BigQuery/SQL exports for deeper analytics if supported on higher plans
- API Access: A dedicated API enables custom BI or analytics app reporting, unlimited queries, and JSON output for flexibility
Features
- Automated data collection from multiple marketing and CRM platforms, eliminating manual exports
- Built-in data warehousing, so historical metrics are stored and available for reporting without additional infrastructure
- Connectors with support for Looker Studio, Spreadsheets, and Excel lets users build dashboards in familiar tools quickly
- Data builder/blending tools combine and transform metrics without coding (varies by plan)
- ISO 27001 and SOC 2 certified data handling for compliance and security, which is a huge plus when working with sensitive marketing and CRM data
- AI Insights credits (on certain plans) to generate talking points or surface anomalies in data.
Pricing
Power My Analytics offers a range of plans that scale from small teams to larger setups:
- Free: Forever free tier with sample data and unlimited sources for testing transformations before going live
- Business: From $49.95/month (billed annually). Includes 5 live data sources, 5 accounts per source, basic reporting connectors, and email support.
- Pro: From $199.95/month. Unlimited sources, up to 10 accounts per source, exports to Google Sheets and Excel, hourly refreshes, 100 AI Insight credits, and priority support.
- Custom/Enterprise: Tailored plans with unlimited everything, exports to warehouses (BigQuery, SQL, FTP), dedicated support, sovereign data options, and custom AI credits.
The pricing is transparent and modular, so that teams can start small and expand coverage by upgrading plans rather than buying add-ons per source.
Pros & Cons
| Pros | Cons |
| Affordable and easy to set up for non-technical teams | Smaller source coverage than enterprise platforms |
| Built-in data warehousing included in every plan | Limited advanced transformations and modeling |
| Strong integrations with Looker Studio, Google Sheets, and Excel | Account or connector limits on lower plans |
| ISO 27001 and SOC 2 certified for compliance | Dashboard templates are less robust than BI tools |
| Flexible pricing lets teams start small and scale | – |
| Consistently rated easy to use for reporting automation | – |
When to use Power My Analytics over Catchr.io
Power My Analytics is your go-to tool when you want affordable and straightforward automation of marketing reporting into familiar dashboards like Looker Studio, Google Sheets, or Excel. And, you don’t need a complex data transformation layer or warehouse-first infrastructure. It’s especially useful for in-house marketers or small agencies who want to reduce repetitive reporting tasks and automate data collection across multiple platforms without breaking the budget.
You can continue using Catchr.io if your primary concern is directed at consolidating marketing metrics with minimal setup, and you’re comfortable shaping data downstream inside your reporting tools.
DataSlayer

Dataslayer is a marketing reporting automation tool built for teams that want fast, lightweight, and highly flexible data pulls into tools like Google Sheets and Looker Studio. Its primary use case is automating multi-source marketing dashboards without setting up a warehouse or managing transformation logic inside the data tool.
What sets Dataslayer apart is its focus on direct API-driven reporting. Instead of bundling warehousing or transformation layers, Dataslayer prioritizes speed and control over how often and how much data you pull.
Comparison Table between the DataSlayer, Coupler.io, and catchr.io
| Feature | DataSlayer | Coupler.io | Catchr.io |
| Data sources | ~50+ | 400+ (all plans) | 80+ (limited) |
| Unified UI to manage all destinations | Pulls to dashboards/spreadsheets | ✅ One tool, one price | ⛔Multiple tools, higher costs |
| Min. refresh frequency | Daily / frequency based on API usage | Every 15 min | Every hour |
| Data transformation | Dashboard-centric data pulls + limited blending | Column management Filter Sort Custom calculations Data aggregation Data unification (append & join) | None |
| Data blending | ⚠️ Basic (dashboard blending) | ✅ | ⛔ |
| Prebuilt transformation and dataset templates | ⚠️ Some templates for Looker Studio / Spreadsheets | ✅ | ⛔ |
| Data destinations | Spreadsheets, Looker Studio, BI tools, warehouse exports (depending on plan) | BI tools Spreadsheets Databases Data warehouses JSON AI tools | BI tools Spreadsheets Data warehouses Databases |
| Dashboard templates | 10+ | 170+ | 100+ |
| AI tool integration | ⛔ | ✅ Claude, ChatGPT, Perplexity, Cursor | ⛔ |
| AI-generated insights | ⛔ | ✅ | ⛔ |
| Webhooks and automation | ⚠️ Scheduled / API usage triggers | ✅ | ⛔ |
| Quality of support (G2 & Capterra) | G2: 4.8/5 Capterra: 4.7/5 | G2: 4.8/5 Capterra: 4.9/5 | No reviews |
| Pricing starts at | $30/month | $24/ month | $20/ month |
Integrations
Dataslayer supports a wide range of marketing and analytics integrations, optimized for dashboard-first workflows.
Sources include:
- Advertising platforms (Google Ads, Meta Ads, TikTok Ads, Microsoft Advertising)
- Analytics and search tools (GA4, Search Console, YouTube)
- Social insights and selected e-commerce / CRM tools
Destinations include:
- Google Sheets
- Looker Studio
- Excel and Power BI
- BigQuery, Snowflake, Redshift, Amazon S3 (on higher plans)
- API Query Manager for custom reporting workflows
Features
- Pulls data directly from marketing APIs into dashboards and spreadsheets without intermediate storage
- Unlimited users and unlimited connectors across plans, which simplifies collaboration and scaling
- Usage-based limits are tied to daily API calls rather than the number of accounts or destinations
- Scheduled refreshes keep dashboards up to date automatically
- Optional warehouse exports for teams that need deeper analysis, without forcing a warehouse-first setup
Pricing
Dataslayer uses transparent and usage-based pricing.
- Plans start at$30/ month for Looker Studio connectors and $41.2/month for Google Sheets or Excel connectors
- Higher-tier plans for warehouse destinations typically start around $419/month, depending on API usage and row volume
- All plans include unlimited users and connectors
- Costs scale based on API calls per day, not team size or number of dashboards
Pros & Cons
| Pros | Cons |
| Very fast to set up for dashboard-first reporting | Limited built-in data transformation |
| Unlimited users and connectors reduce scaling friction | API usage limits affect high-frequency reporting |
| Usage-based pricing aligns costs with consumption | Focused mainly on marketing data |
| Strong fit for Looker Studio and Google Sheets | Advanced modeling must happen downstream |
| No forced warehousing or transformation layer | – |
When to use DataSlayer over Catchr.io
Choose Dataslayer when you want easy and usage-based reporting automation and prefer working directly in Google Sheets or Looker Studio without managing multiple tools. It’s a strong fit for teams that build many dashboards, want unlimited users and connectors, and don’t need built-in warehousing or transformation layers.
Use Catchr.io if you’re comfortable managing queries and schedules across tools, and your reporting needs are simpler and more static.
Windsor.ai
Windsor.ai is a no-code ELT/ETL data integration and analytics platform built for cross-channel marketing analysis. It brings together paid, organic, CRM, and analytics data into a single dataset. On top of integration, Windsor.ai supports attribution analytics to help teams understand how channels work together to drive conversions. All of this happens without manual exports or spreadsheet stitching.
Comparison Table between the Windsor.ai, Coupler.io, and Catchr.io
| Feature | Windsor.ai | Coupler.io | Catchr.io |
| Data sources | 325+ native connectors | 400+ (all plans) | 80+ (limited) |
| Unified UI to manage all destinations | ✅Yes | ✅ One tool, one price | ⛔Multiple tools, higher costs |
| Min. refresh frequency | Every 15 minutes (on Professional/Enterprise plans) Hourly/daily on lower tiers | Every 15 min | Every hour |
| Data transformation | Includes auto-schema matching, data normalization, custom metrics, and filtering | Column management Filter Sort Custom calculations Data aggregation Data unification (append & join) | None |
| Data blending | ✅ | ✅ | ⛔ |
| Prebuilt transformation and dataset templates | ✅ | ✅ | ⛔ |
| Data destinations | Looker Studio, Power BI, Tableau, BigQuery, Snowflake, Amazon S3, and Google Sheets | BI tools Spreadsheets Databases Data warehouses JSON AI tools | BI tools Spreadsheets Data warehouses Databases |
| Dashboard templates | 70+ | 170+ | 100+ |
| AI tool integration | ✅AI chats and LLMs | ✅ Claude, ChatGPT, Perplexity, Cursor | ⛔ |
| AI-generated insights | ✅ | ✅ | ⛔ |
| Webhooks and automation | ✅ | ✅ | ⛔ |
| Quality of support (G2 & Capterra) | G2: 4.5/5 | G2: 4.8/5 Capterra: 4.9/5 | No reviews |
| Pricing starts at | $19/ month | $24/ month | $20/ month |
Integrations
Windsor.ai gives users broad data access and flexibility:
- 325+ native connectors spanning marketing, ad platforms, CRM, analytics, e-commerce, and business systems
- Popular source examples: Google Ads, Facebook Ads, TikTok, LinkedIn, Google Analytics 4, Search Console, CRM tools like HubSpot
- Destinations include: Looker Studio, Google Sheets, Power BI, Tableau, Excel, and data warehouses such as BigQuery, Snowflake, Redshift, and Databricks
- Connectors automatically map and normalize metrics like spend, clicks, sessions, and conversions so that reports align across channels
Features
- Automated data extraction, transformation, and delivery to dashboards, spreadsheets, and warehouses, all without coding
- Unified schema and normalization across multiple platforms (e.g., ad networks, analytics, CRM), reducing field mismatches and inconsistencies
- Support for blended paid + organic data, making cross-channel performance comparisons easier
- Pre-built and customizable templates for fast dashboard setup across Looker Studio, Power BI, Excel, and more
- Incremental refresh and scheduling support (daily/hourly/every 15 mins depending on source and plan) so reports stay fresh
- Data attribution modeling and analytics workflows that help teams understand channel impact without separate tools
Pricing
Windsor.ai uses tiered subscription plans with usage and volume management:
- Free plan: 30-day free trial or ongoing free tier with 1 user, 1 data source, 1 account and limited warehouse volume
- Basic: ~$19/month, typically includes unlimited users, multiple BI destinations, and a small number of source connections
- Standard: ~$99/month with more source support and expanded accounts
- Plus: ~$249/month with additional sources and higher limits
- Professional: ~$499/month with even more capacity and MAR (monthly active row) allowances
- Enterprise: custom pricing for very large setups, high row counts, and advanced governance
Plans include unlimited users and unlimited destinations. Higher tiers significantly increase the amount of data (MAR) you can sync monthly before overage fees apply.
Pros & Cons
| Pros | Cons |
| Broad connector support enables cross-channel and blended marketing reporting | Pricing tiers can jump quickly as usage grows |
| No-code setup reduces reliance on engineering resources | High data volumes (MAR) require monitoring or plan upgrades |
| Unified schema and normalization reduce manual cleanup across platforms | Primarily focused on marketing data |
| Flexible destinations cover spreadsheets, BI tools, and warehouses | Full cross-domain business data may need additional tools |
| Attribution and blended analytics help evaluate paid, organic, and CRM impact | Advanced modeling beyond basic attribution may require BI tools |
| Free trial and free tier allow testing without upfront cost | – |
When to use Windsor.ai over Catchr.io
Among Catchr competitors, Windsor.ai is a strong choice when you need to blend data from multiple marketing channels into a unified, normalized dataset and run cross-channel attribution analysis. Catchr.io is a better fit for simpler setups focused on extracting and refreshing marketing data.
Fivetran

Fivetran is a fully managed, cloud-native ELT data integration platform that automates pipelines from source systems into data warehouses or lakes. It is mostly used by analytics teams and data engineers who need reliable, scalable, low-maintenance data pipelines so they can centralize and analyze data without building and maintaining custom ETL infrastructure.
Comparison Table between Fivetran, Coupler.io, and Catchr.io
| Feature | Fivetran | Coupler.io | Catchr.io |
| Data sources | 700+ | 400+ (all plans) | 80+ (limited) |
| Unified UI to manage all destinations | ✅Yes | ✅ One tool, one price | ⛔Multiple tools, higher costs |
| Min. refresh frequency | 1 minute (Enterprise/Business Critical plans). Standard plans typically start at 5 or 15 minutes. | Every 15 min | Every hour |
| Data transformation | Automated schema drift handling, integrated dbt Core orchestration, and column-level masking/hashing | Column management Filter Sort Custom calculations Data aggregation Data unification (append & join) | None |
| Data blending | ⛔ | ✅ | ⛔ |
| Prebuilt transformation and dataset templates | ✅ | ✅ | ⛔ |
| Data destinations | Snowflake BigQuery Databricks Redshift S3 Data Lake | BI tools Spreadsheets Databases Data warehouses JSON AI tools | BI tools Spreadsheets Data warehouses Databases |
| Dashboard templates | Limited | 170+ | 100+ |
| AI tool integration | ✅AI data readiness | ✅ Claude, ChatGPT, Perplexity, Cursor | ⛔ |
| AI-generated insights | ⛔ | ✅ | ⛔ |
| Webhooks and automation | ✅ | ✅ | ⛔ |
| Quality of support (G2 & Capterra) | G2: 4.4/5 Capterra: 4.4/5 | G2: 4.8/5 Capterra: 4.9/5 | No reviews |
| Pricing starts at | $19/ month | $24/ month | $20/ month |
Integrations
- 700+ connectors covering SaaS apps, marketing platforms, databases, ERPs, and file systems.
- Supports ELT for cloud warehouses and data lakes, including Snowflake, BigQuery, Redshift, Databricks, and others
- Automatically manages schema changes and API updates so pipelines don’t break when sources evolve
This breadth makes Fivetran a strong choice for teams centralizing data from many functions, not just marketing
Features
- Automated ELT pipelines that extract data, load it into your warehouse, and let transformations happen downstream in SQL/dbt.
- Schema drift handling that automatically adapts to changes in source schemas without manual intervention
- Incremental and near-real-time syncs are available for many connectors
- Built-in connector SDK for custom or niche source connections
- Logging, monitoring, sync history, and alerts to track pipeline health
Pricing
Fivetran uses usage-based pricing centered on Monthly Active Rows (MAR) the number of unique rows that are added, updated, or deleted in your destination each month.
- Free plan: Up to 500,000 MAR and 5,000 model runs per month. Good enough for exploring the platform
- Standard: Usage billing (~$500/million MAR estimated), suitable for teams syncing moderate volumes
- Enterprise: Adds faster syncs, enterprise database connectors, advanced security, and governance controls
- Business Critical: Highest tier with premium support and compliance features; pricing varies by volume and contract
Fivetran also offers a pricing estimator to help model expected monthly costs based on your data volume and connector configuration.
Pros & Cons
| Pros | Cons |
| 700+ connectors across SaaS apps, databases, ERPs, and file systems | Usage-based MAR pricing can become expensive at scale |
| Automatic schema and API change handling keeps pipelines stable | Requires SQL or dbt for transformations |
| Incremental syncs keep warehouses up to date efficiently | No built-in dashboards or reporting |
| Seamless integration with Snowflake, BigQuery, Redshift, Databricks | Can be overkill for simple marketing reporting |
| Connector SDK supports custom or internal integrations | – |
| Monitoring, logs, and alerts improve pipeline reliability | – |
When to use Fivetran over Catchr.io
Fivetran when you need scalable ELT pipelines that centralize data from across the business into a warehouse for analytics and BI. It’s a strong fit for teams building a modern analytics stack with SQL or dbt.
Tools like Catchr.io work better for simple marketing data extraction into reports.
Catchr.io alternatives: Which should you choose?
If you’re comparing alternatives to Catchr, consider three key factors:
- Scale and complexity of your data (number of sources, teams, dashboards)
- Where you need your data delivered (spreadsheets, BI tools, warehouses)
- How much transformation, modeling, or cross-domain analysis do you want before reporting
Not all tools solve the same problems. Some focus on simple reporting automation, others on enterprise-grade pipelines, and others on blended analytics.
Below are recommended tools with clear scenarios.
- If you want an all-in-one, no-code data integration and AI analytics platform, choose Coupler.io.
It lets you connect, transform, deliver, analyze data, and make actionable decisions with the help of AI for your business. It’s the best fit if you want flexibility and coverage without enterprise complexity.
- If your main goal is automated dashboards in Spreadsheets or Looker Studio, choose Dataslayer or Power My Analytics.
Dataslayer works best for lightweight, usage-based reporting, while Power My Analytics adds built-in warehousing and light transformations for teams that want a bit more structure.
- If you manage many marketing channels and need normalized, blended data, choose Funnel.io or Windsor.ai.
Funnel.io focuses on marketing data normalization at scale, while Windsor.ai is better suited for cross-channel attribution and understanding how channels work together.
- If you’re building a warehouse-centric analytics stack, choose Fivetran or Improvado.
Fivetran is ideal for scalable ELT pipelines owned by data teams, while Improvado fits enterprise marketing organizations that need governance, harmonized schemas, and advanced analytics.
Automate data reporting with Coupler.io
Get started for free