Email marketing success depends on understanding the complete customer journey from initial send to final purchase. However, most businesses struggle with fragmented data across email platforms and e-commerce systems. This disconnect between email engagement metrics and actual revenue generation leaves marketers operating with incomplete insights.
Coupler.io bridges this gap by integrating email marketing data from platforms like Mailchimp and Klaviyo with e-commerce data from Shopify and web analytics from GA4. As a result, you get a complete funnel analysis to reveal how email campaigns actually drive revenue.
Key insights the email marketing funnel report can offer
Track complete email-to-revenue conversion paths
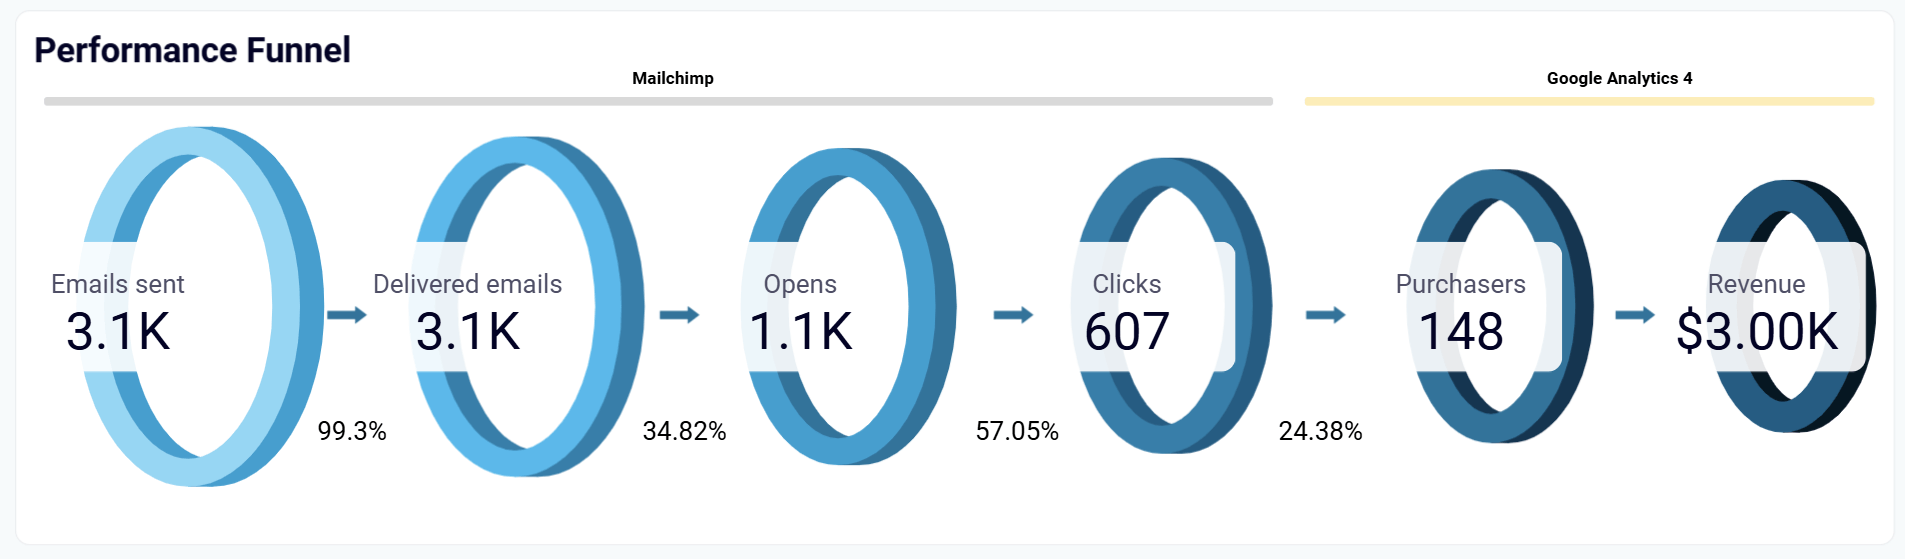
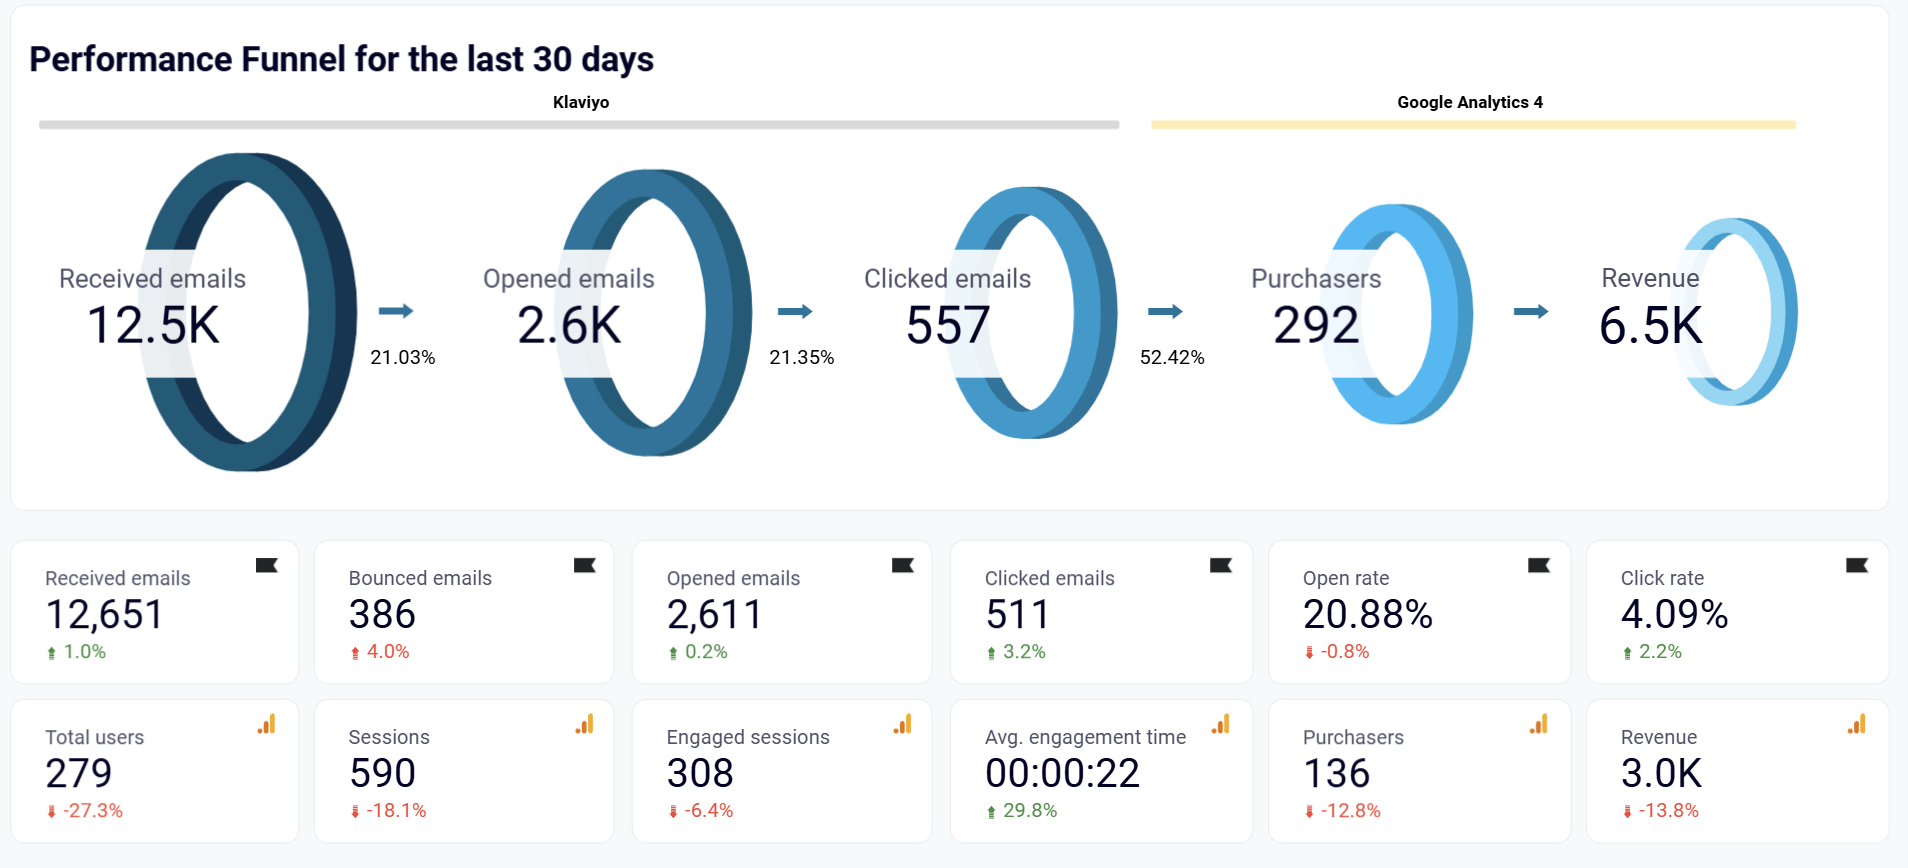
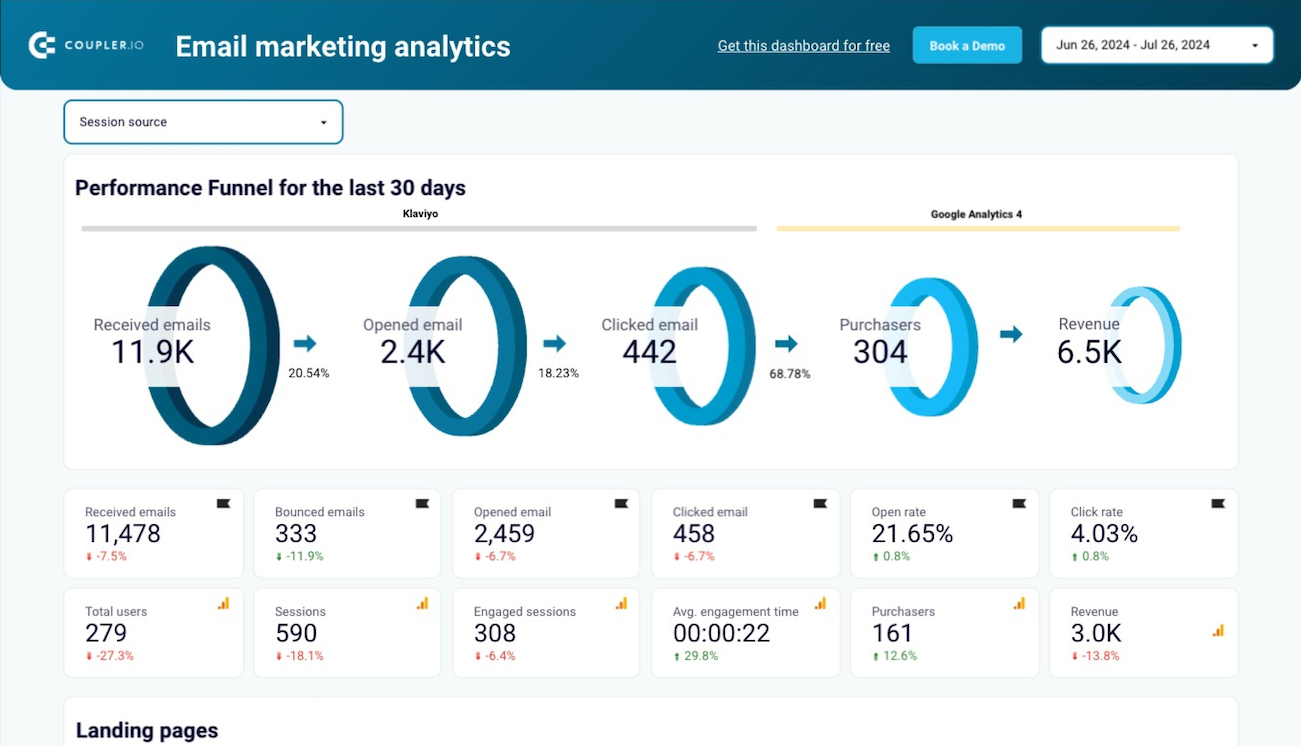
Understanding your email marketing performance requires more than open rates and click-through rates. The complete funnel reveals how many recipients progress from email delivery through purchase, exposing critical drop-off points that impact revenue generation. The email performance funnel visualization shows the exact progression from emails sent through delivered, opened, clicked, to final purchases with total revenue generated. Here is what it looks like in the email marketing dashboard for Klaviyo.
Email marketing analytics dashboard for Klaviyo
 Preview on dashboard
Email marketing analytics dashboard for Klaviyo
Preview on dashboardWhat you can do:
- Identify conversion bottlenecks: Pinpoint exactly where potential customers drop off by comparing each stage’s numbers – if you see high opens but low clicks, focus on email content; if you see high clicks but low purchases, optimize your landing pages
- Calculate true email ROI: Track revenue generated per email sent to understand the actual financial impact of your campaigns rather than relying on engagement metrics alone
- Optimize campaign targeting: Compare funnel performance across different audience segments to identify which subscriber groups convert most effectively and allocate budget accordingly
- Set realistic expectations: Use historical funnel data to forecast revenue from future campaigns and set achievable targets for each stage of the customer journey
- Prioritize optimization efforts: Focus improvement efforts on the funnel stages with the largest drop-offs to maximize impact on overall conversion rates
Monitor email engagement patterns
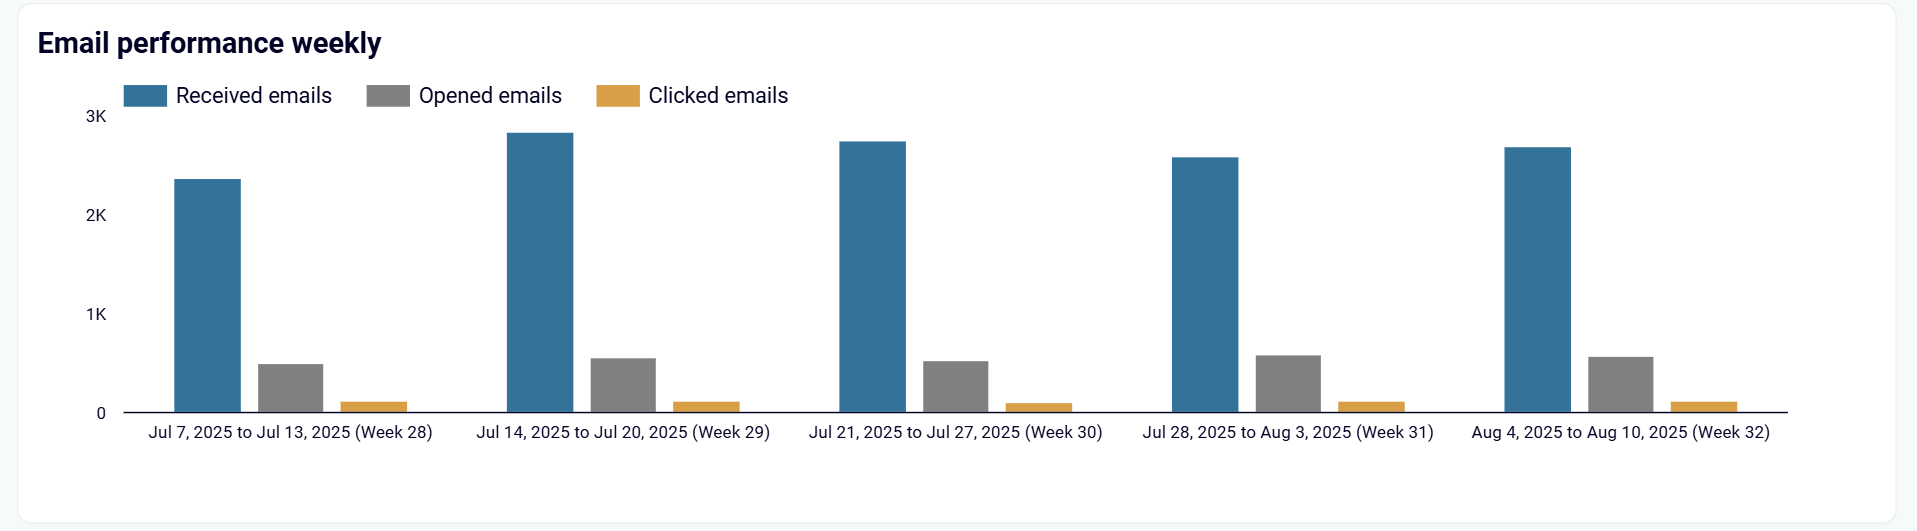
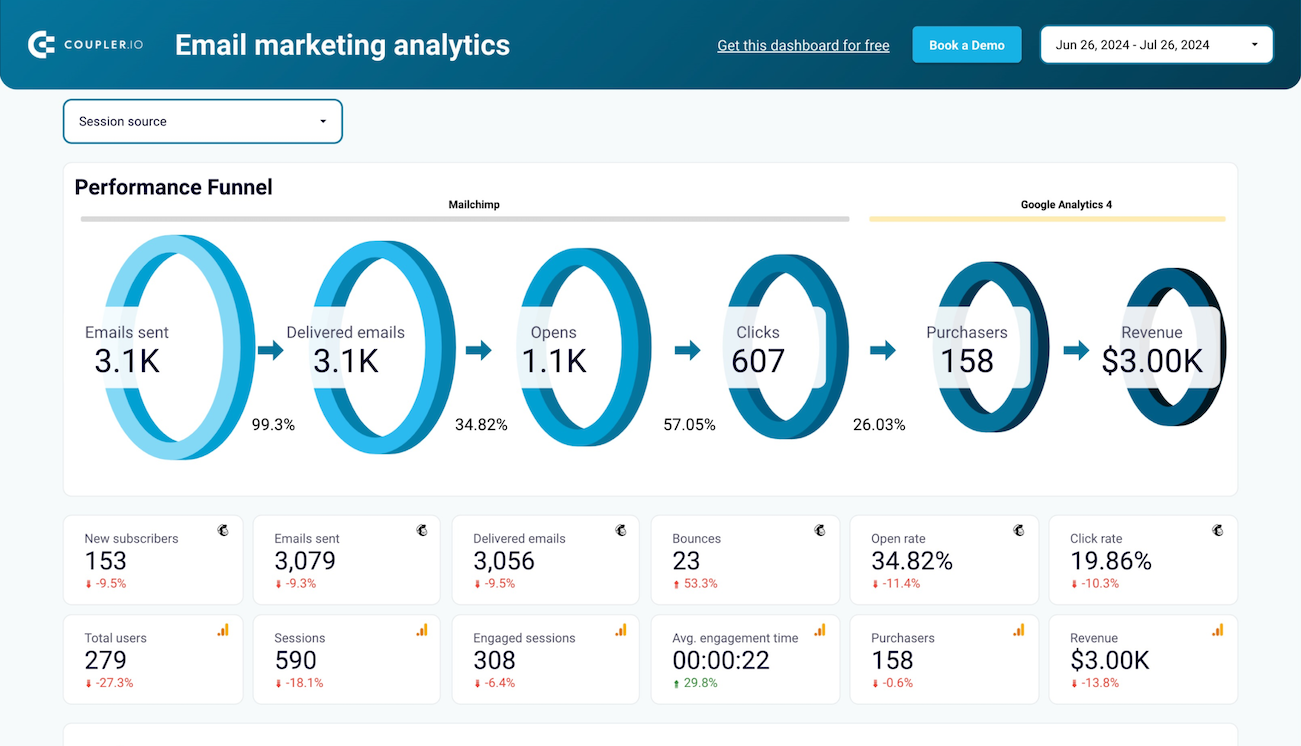
Consistent email performance tracking reveals engagement trends and helps identify optimal sending strategies. You can track weekly performance showing emails received, opened, and clicked. The same Klaviyo dashboard displays it as follows.
Email marketing analytics dashboard for Klaviyo
 Preview on dashboard
Email marketing analytics dashboard for Klaviyo
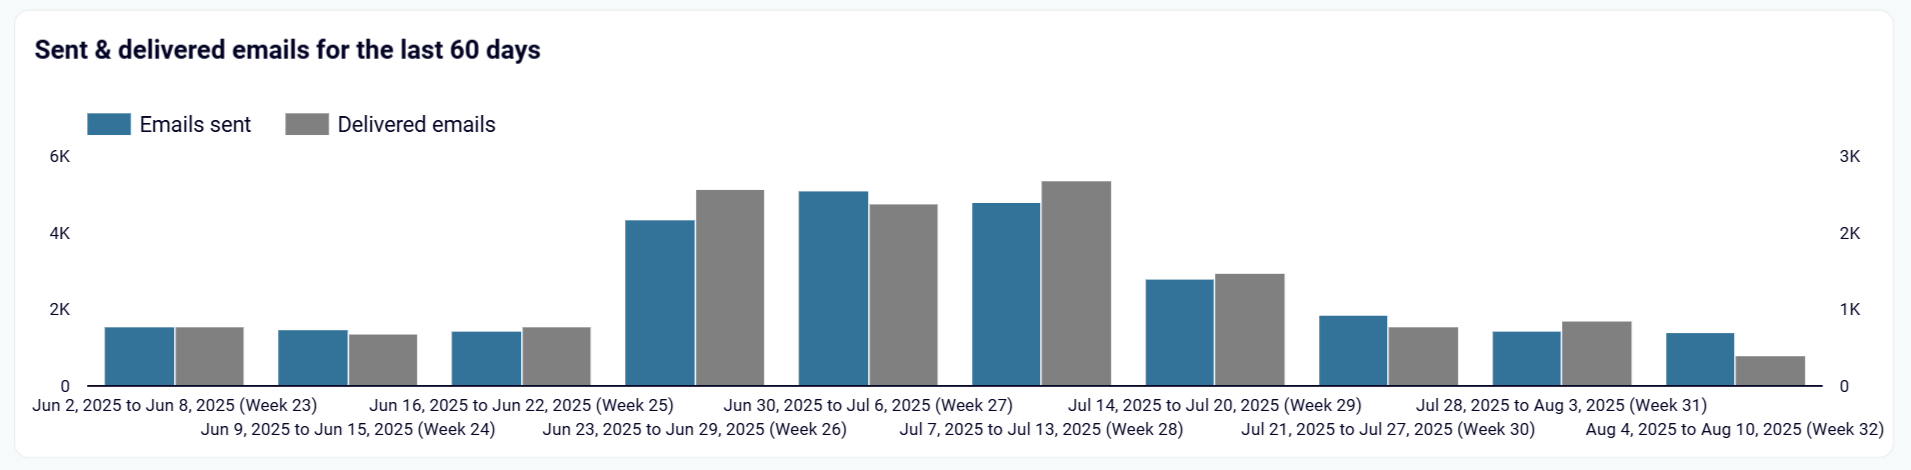
Preview on dashboardOr analyze the daily patterns for sent and delivered emails, like in the Mailchimp email campaign performance dashboard for Shopify store.
Mailchimp email campaign performance dashboard for Shopify store
 Preview on dashboard
Mailchimp email campaign performance dashboard for Shopify store
Preview on dashboardWhat you can do:
- Identify optimal sending periods: Spot periods with consistently higher engagement rates to schedule important campaigns during periods when your audience is most responsive
- Detect engagement decline early: Monitor for drops in open and click rates that might indicate list fatigue, content issues, or deliverability problems requiring immediate attention
- Plan campaign frequency: Use weekly engagement patterns to determine sustainable sending schedules that maintain audience interest without overwhelming subscribers
- Optimize seasonal campaigns: Leverage historical data to identify periods of peak engagement for planning product launches, promotions, or special announcements
- Balance volume with quality: Find the sweet spot between sending frequency and engagement rates to maximize total reach while maintaining strong per-email performance
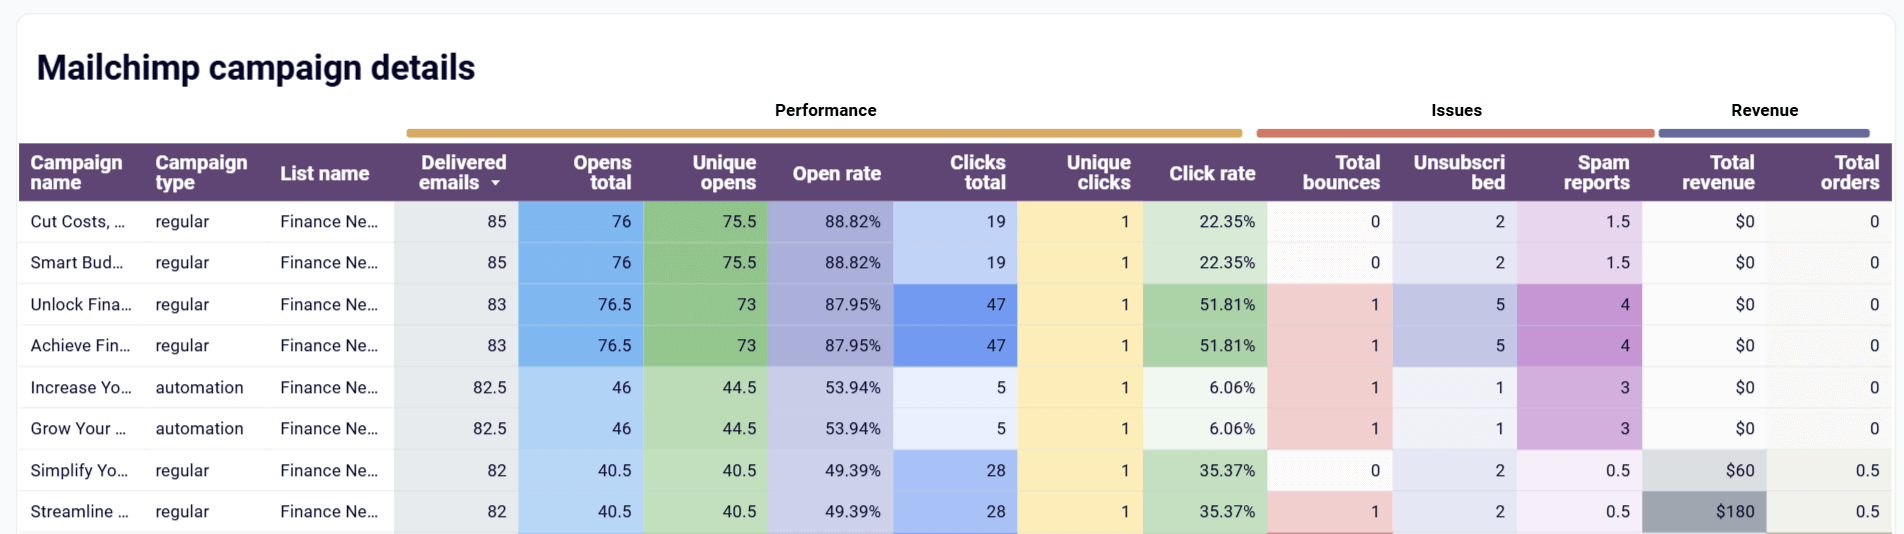
Analyze individual campaign effectiveness
Campaign-level analysis reveals which specific emails drive the best results and identifies common characteristics of high-performing content. The campaign details table for Mailchimp shows performance metrics, engagement rates, deliverability issues, and revenue generation for each individual email campaign.
Email marketing analytics dashboard for Mailchimp
 Preview on dashboard
Email marketing analytics dashboard for Mailchimp
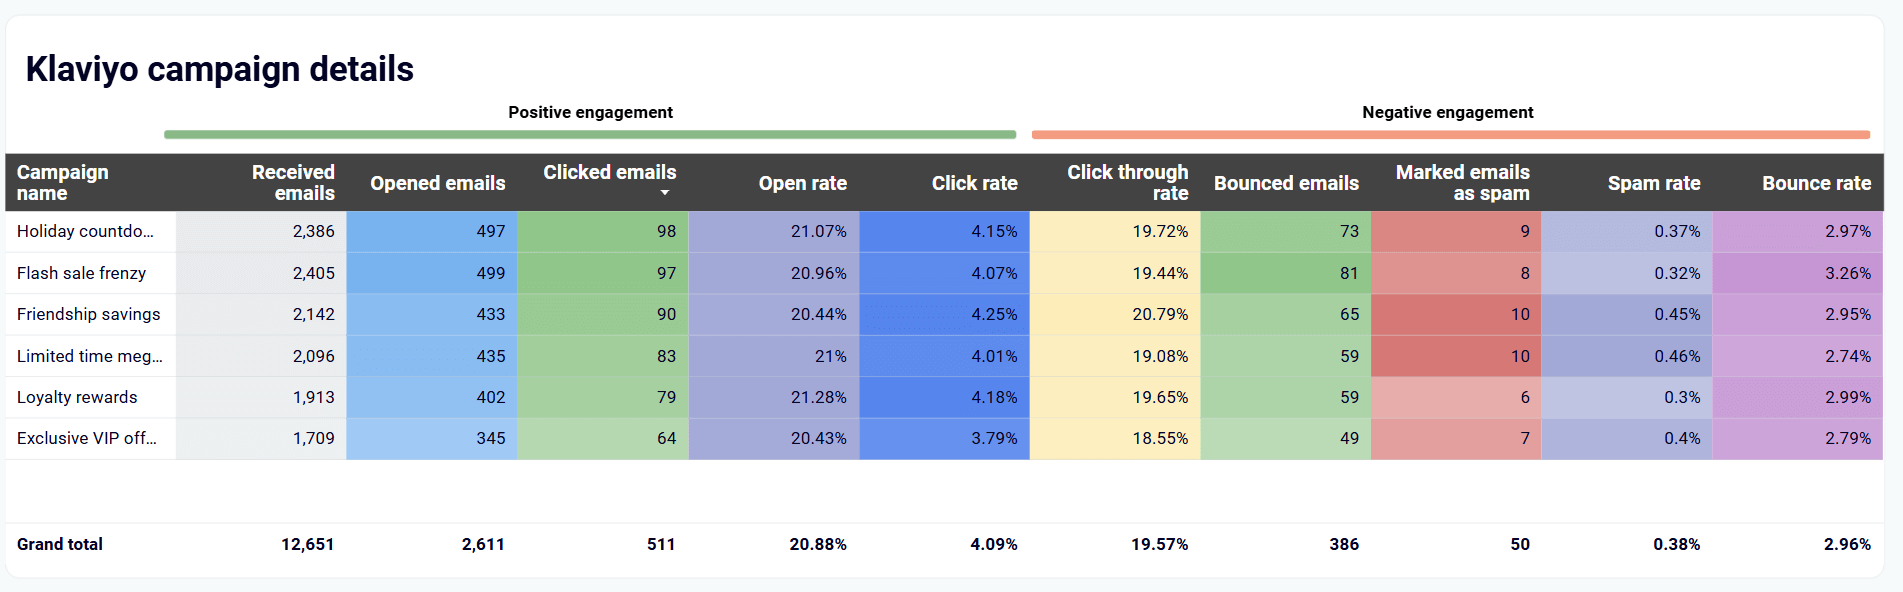
Preview on dashboardFor Klaviyo, the approach is to let you see metrics to differentiate between positive and negative engagement.
Email marketing analytics dashboard for Klaviyo
 Preview on dashboard
Email marketing analytics dashboard for Klaviyo
Preview on dashboardWhat you can do:
- Identify top-performing campaign types: Compare regular campaigns vs. automation sequences to understand which approach generates better engagement and revenue for your audience
- Spot deliverability issues: Monitor bounce rates, spam reports, and unsubscribe patterns across campaigns to identify content or technical issues affecting email delivery
- Optimize subject line strategies: Analyze open rates across different campaigns to identify subject line patterns that consistently drive higher engagement
- Improve click-to-revenue conversion: Compare campaigns with high click rates but low revenue to identify landing page or offer optimization opportunities
- Replicate successful campaign elements: Use revenue and engagement data to identify your most effective campaigns and apply their strategies to future communications
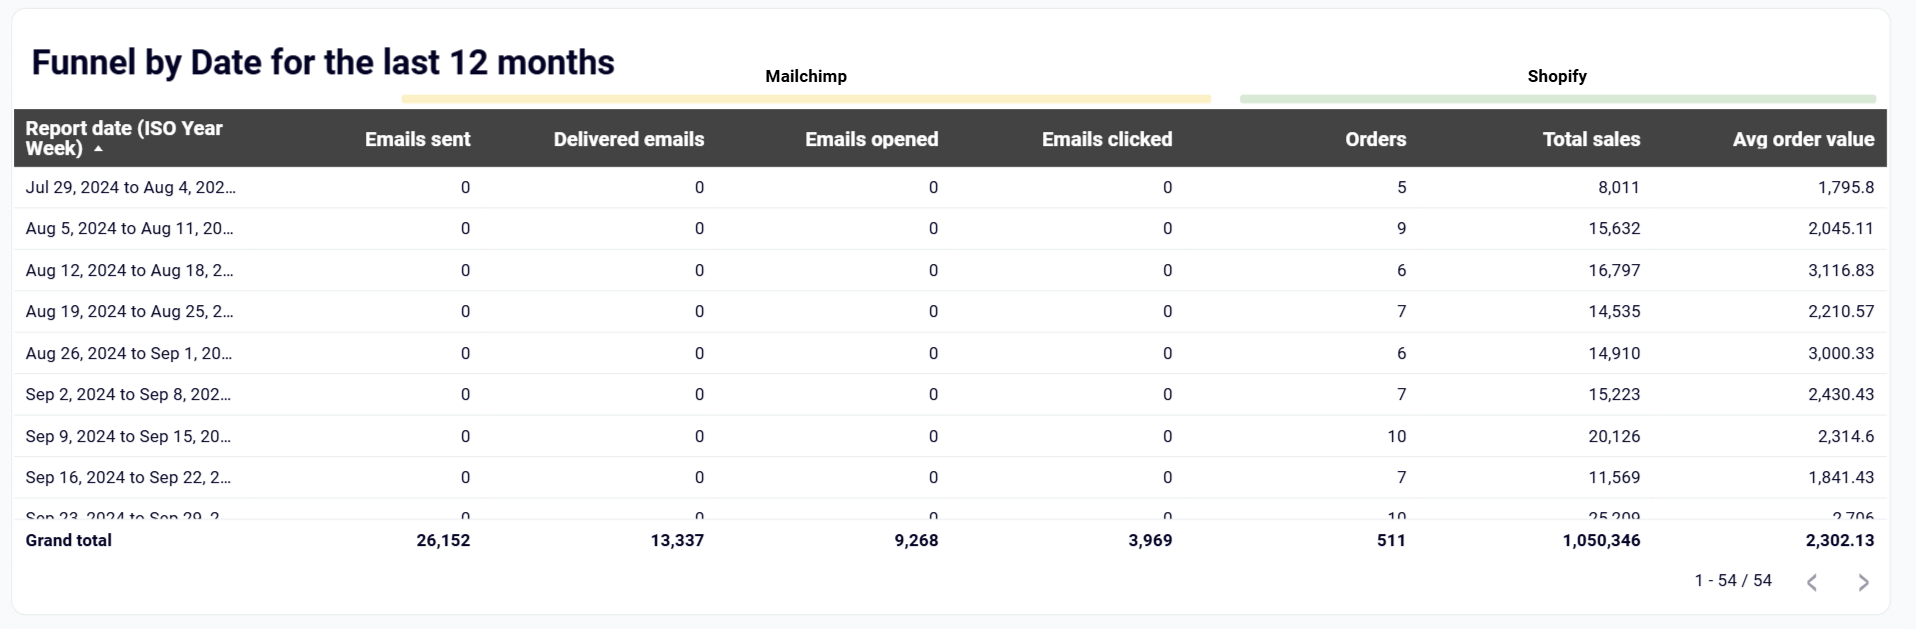
Track long-term funnel performance trends
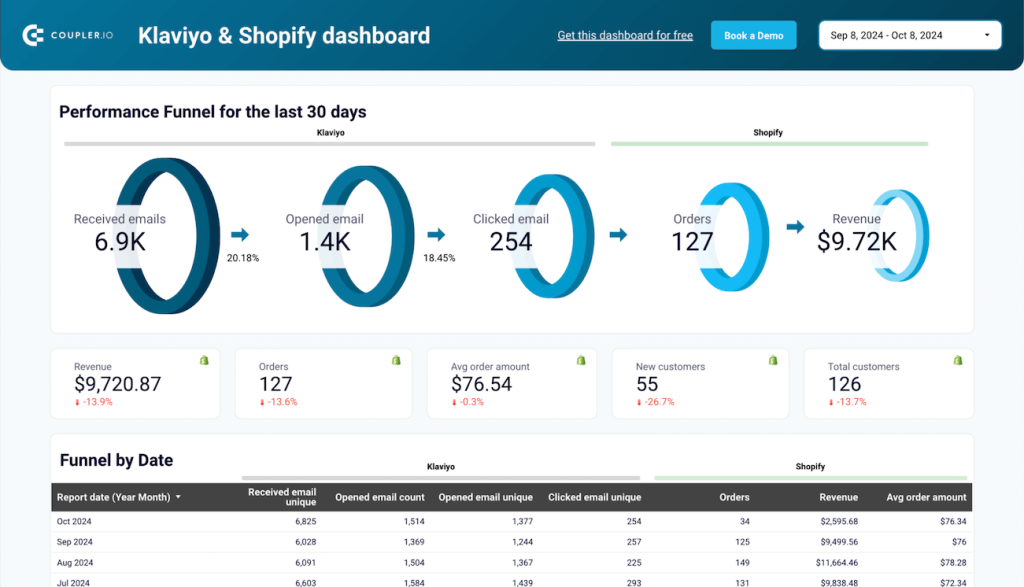
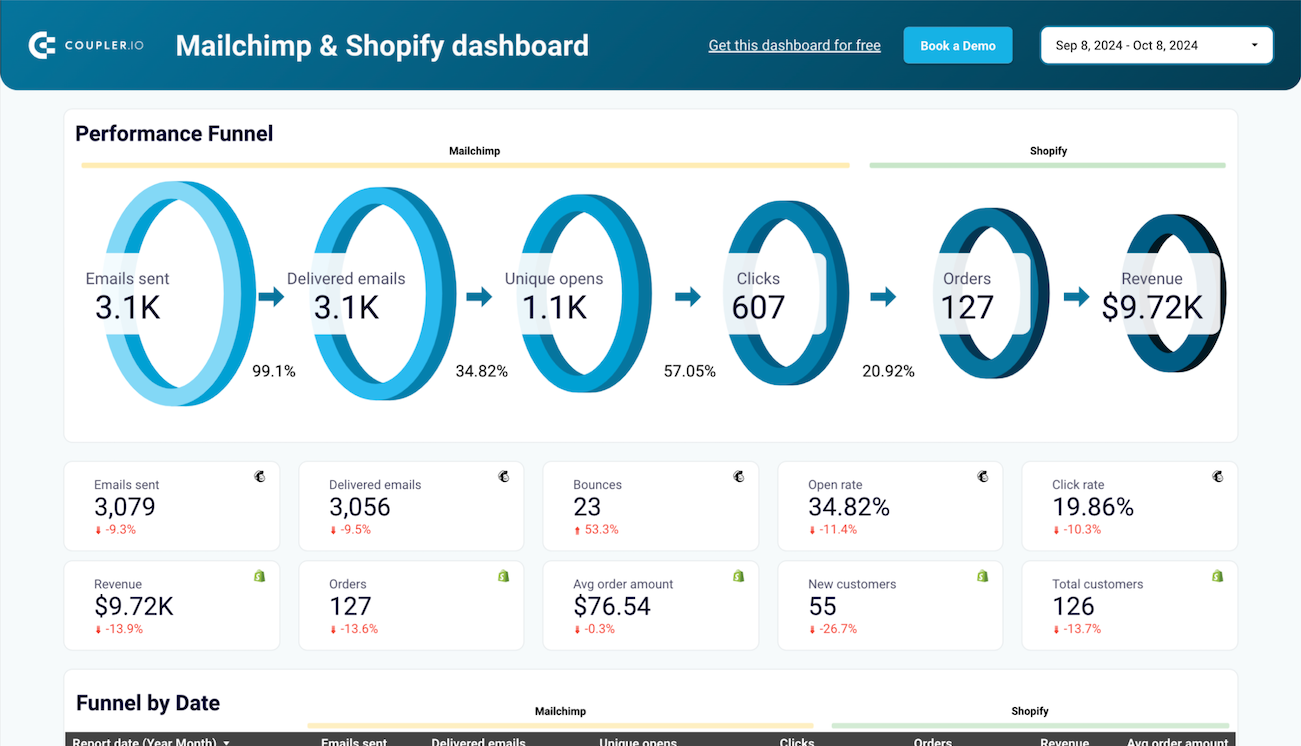
Historical funnel analysis reveals how email marketing effectiveness evolves over time and helps identify seasonal patterns or long-term trends. The funnel by date table in the Mailchimp & Shopify dashboard tracks email metrics alongside sales data over 12-month periods. You can see the relationship between email engagement and business outcomes.
Mailchimp email campaign performance dashboard for Shopify store
 Preview on dashboard
Mailchimp email campaign performance dashboard for Shopify store
Preview on dashboardWhat you can do:
- Measure campaign impact over time: Track how changes in email strategy affect long-term engagement rates and revenue generation rather than just immediate campaign results
- Identify seasonal revenue patterns: Spot months when email campaigns consistently drive higher average order values or more orders to optimize annual marketing calendars
- Monitor audience quality changes: Detect gradual declines in engagement rates or conversion ratios that might indicate list quality issues or changing audience preferences
- Plan budget allocation: Use historical performance data to predict which months will generate the best email marketing ROI and allocate resources accordingly
- Set realistic growth targets: Establish achievable benchmarks for funnel performance based on actual historical trends rather than industry averages or assumptions
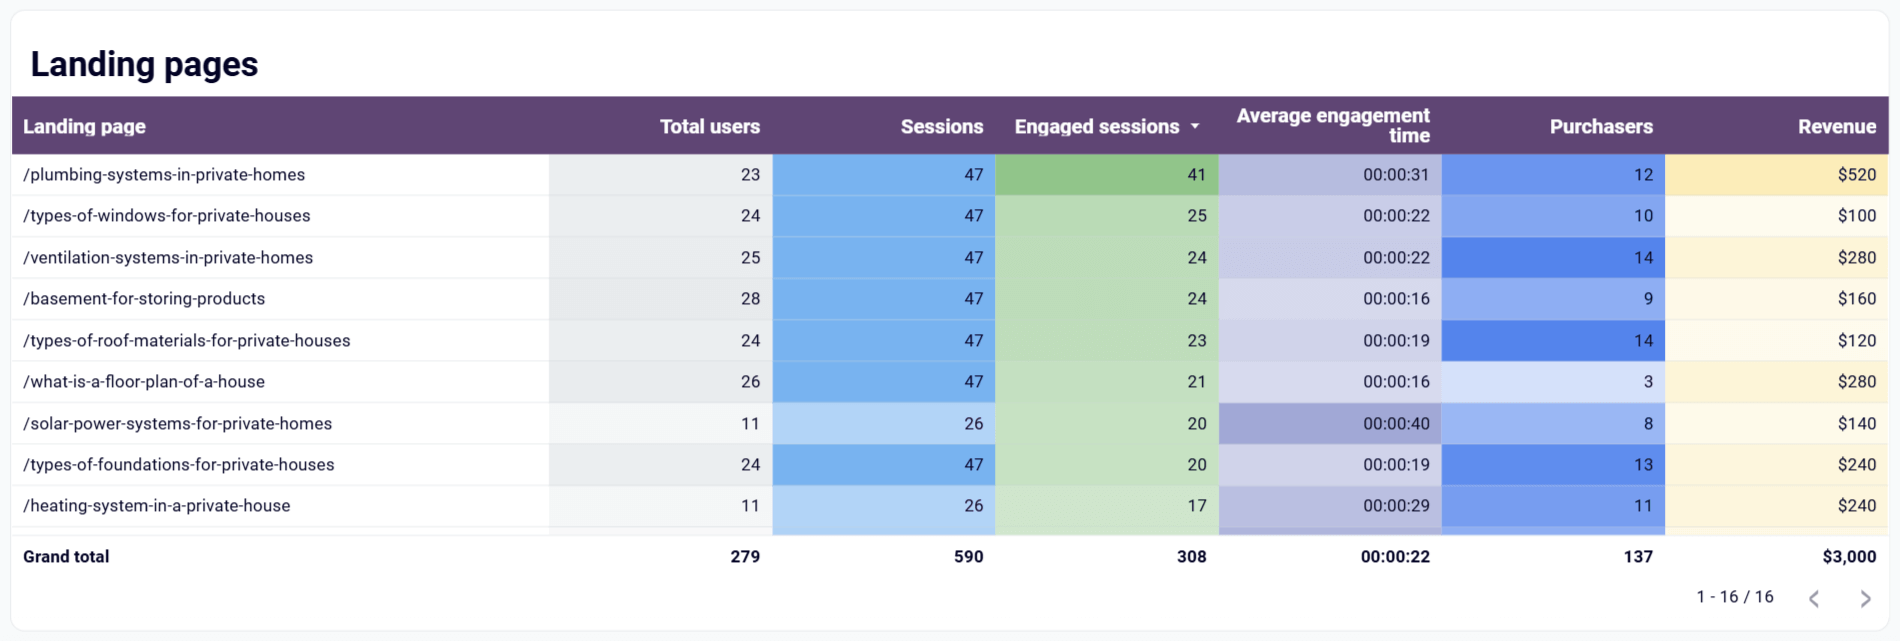
Measure landing page effectiveness for email traffic
Email clicks are meaningless if landing pages fail to convert visitors into customers. Analyzing the complete journey from email click to purchase reveals whether your landing pages support or sabotage email marketing efforts. The landing page performance table is available in the email marketing analytics dashboard for Mailchimp and Klaviyo. It shows specific pages with their traffic sources, engagement metrics, and revenue generation to identify which pages convert email visitors most effectively.
Email marketing analytics dashboard for Mailchimp
 Preview on dashboard
Email marketing analytics dashboard for Mailchimp
Preview on dashboardWhat you can do:
- Fix high-traffic, low-converting pages: Identify landing pages that receive significant email traffic but generate minimal revenue (high sessions, low conversion rates), then optimize these pages’ content, design, or offers to improve performance
- Replicate successful page elements: Find landing pages with exceptional email visitor conversion rates and apply their design patterns, messaging, or offers to underperforming pages to boost overall campaign effectiveness
- Align email promises with page delivery: Compare email click-through rates with corresponding landing page conversion rates to identify mismatches where email content creates expectations that pages don’t fulfill
- Optimize mobile experience for email traffic: Use the session and conversion data to identify pages where email visitors (often mobile users) experience poor performance, then prioritize mobile optimization efforts
- Improve email-to-purchase attribution: Track the complete customer journey from email click through purchase to understand which email campaigns drive the most valuable landing page traffic and optimize accordingly.
Ready-to-use solutions for page performance analytics
Setting up a comprehensive email marketing funnel analysis doesn’t require complex integrations or custom development. Coupler.io offers pre-built dashboard solutions that automatically combine your email platform data with e-commerce and web analytics for immediate insights.
Email marketing analytics dashboard for Mailchimp/Klaviyo
The email marketing analytics dashboard is designed for businesses focused on understanding email campaign performance and website conversion optimization. It combines email platform data (Mailchimp or Klaviyo) with GA4 web analytics. As a result, you get detailed insights into how email traffic behaves on the website and which campaigns drive the most valuable visitor engagement.

Email marketing insights these dashboards provide:
- Complete email funnel visualization showing the progression from emails sent through website visits and conversions with revenue attribution
- Landing page performance analysis revealing which pages convert email visitors most effectively and identifying optimization opportunities
- Campaign traffic analysis showing how different email campaigns drive website engagement, session duration, and goal completions
- Email campaign engagement tracking with detailed metrics on opens, clicks, spam rates, and bounce rates for performance optimization
- Subject line performance insights highlighting which messaging approaches consistently generate the highest engagement rates
- Weekly and monthly performance trending enabling identification of optimal send times and seasonal campaign opportunities
How to get started:
Connect your Mailchimp or Klaviyo account along with GA4 through Coupler.io’s integration system. These dashboards immediately begin analyzing how your email campaigns drive website traffic and conversions, providing detailed insights into visitor behavior and campaign effectiveness.


Mailchimp/Klaviyo email campaign performance dashboard for Shopify store
Designed specifically for eCommerce businesses using Shopify, these dashboards provide complete email-to-purchase funnel analysis. You can integrate email marketing data from either Klaviyo or Mailchimp with sales information from Shopify. It’s an ideal solution for online store owners who need to understand exactly how email campaigns drive product sales and customer acquisition.
Email marketing insights these dashboards provide:
- Complete email-to-revenue funnel tracking showing progression from email sends through product purchases with detailed revenue attribution
- Product performance analysis identifying which items generate the most email-driven sales and revenue contribution
- Customer acquisition and retention metrics distinguishing between new customer acquisition and repeat purchase patterns through email campaigns
- Campaign comparison capabilities enabling identification of high-performing email strategies and content approaches that drive sales
- Daily and monthly performance trends highlighting optimal send times and seasonal patterns for maximizing revenue generation
- Long-term funnel analysis tracking email marketing effectiveness over 12-month periods with detailed sales correlation
How to get started:
Integrate your Mailchimp or Klaviyo account, as well as your Shopify store through Coupler.io’s automated connection process. In a couple of minutes, the dashboard providies insights into campaign performance, product sales, and customer behavior with real-time revenue data.


Analyze your email marketing funnel with AI easily
Email marketing funnel analysis traditionally requires hours of manual work. An old-fashioned ways looks like this: you export data from platforms, clean it in a spreadsheet, calculate conversion rates, and identify patterns across campaigns. This time-intensive process often means insights arrive too late to influence current campaigns.
Coupler.io lets you optimize this workflow by integrating your email marketing funnel data with AI tools like Claude or ChatGPT. No need to wrestle with spreadsheets and formulas – just ask specific questions about funnel performance and receive immediate, actionable insights. AI integrations can become a sort of an AI-powered analyst to talk about your funnel using natural language conversations. It will provide contextual recommendations tailored to your specific audience behavior, campaign history, and business goals.
Natural language queries you can ask:
- “Which email campaigns generated the most revenue last month and what made them successful?”
- “Show me the products that convert best through email marketing and their average order values”
- “What’s causing the drop in email-to-purchase conversion rates for our November campaigns?”
- “Which customer segments have the highest email engagement and lifetime value?”
- “How do our email send times affect open rates and revenue generation?”
Real-world example: Worst-performing email campaigns
Sample query: “Show me our worst-performing email campaigns by revenue and recommend specific improvements”
AI analysis results:
Based on your Mailchimp and Shopify data, here are your underperforming email campaigns and specific improvement recommendations:
CAMPAIGN PERFORMANCE ANALYSIS
- November Product Launch Campaign: 2,847 sends, 18.2% open rate, 2.1% click rate, $1,247 revenue
- Performance: $0.44 revenue per email sent
- Problem: High open rate but extremely low click-to-purchase conversion (0.3%)
- Recommendation: Landing page optimization needed – 78% of email clicks abandon at product page level
CUSTOMER SEGMENT ISSUES
- VIP Customer Re-engagement Series: 892 sends, 12.1% open rate, 1.8% click rate, $312 revenue
- Performance: $0.35 revenue per email sent
- Problem: Low engagement from historically high-value customers indicates message relevance issues
- Recommendation: Personalize offers based on previous purchase history and implement urgency-driven messaging
TIMING AND FREQUENCY PROBLEMS
- Weekly Newsletter Campaign: 5,234 sends, 15.7% open rate, 2.8% click rate, $891 revenue
- Performance: $0.17 revenue per email sent
- Problem: Send frequency causing subscriber fatigue in key customer segments
- Recommendation: Reduce frequency to bi-weekly and implement behavioral triggers for high-engagement subscribers
Priority actions:
- Immediate fix: Audit and optimize landing pages for the November Product Launch campaign to improve conversion rates
- Strategic improvement: Implement dynamic content personalization for VIP customer segments based on purchase history
- Frequency optimization: Test reduced send frequency with A/B testing to measure engagement and revenue impact

Integrate your marketing funnel data with AI for conversation analytics using Coupler.io
Get started for freeMake the most out of your email marketing funnel analysis
Email marketing optimization is evolving from reactive reporting to proactive intelligence. The combination of integrated dashboards and AI-powered analysis represents a fundamental shift in how marketers understand and improve their funnel performance, moving from “what happened” to “what should happen next.”
Use ready-to-use dashboards when you need:
- Continuous monitoring of your email funnel performance with real-time visibility into conversion rates, revenue trends, and campaign effectiveness
- Team alignment around shared metrics that everyone can access and understand without technical expertise
- Automated tracking of key performance indicators that update automatically as campaigns run
- Historical trend analysis to identify seasonal patterns, long-term growth trajectories, and performance benchmarks
- Quick health checks before important campaigns to ensure your funnel is performing optimally
Use AI-powered analysis when you need:
- Rapid problem diagnosis to understand why specific campaigns underperformed or conversion rates dropped
- Strategic recommendations for improving funnel performance based on your actual data patterns rather than generic best practices
- Complex pattern recognition across multiple variables that would take hours to analyze manually
- Scenario planning to predict how changes in send frequency, timing, or targeting might affect revenue
- Personalized optimization strategies that account for your unique audience behavior and business model
The integrated approach delivers compound benefits: Dashboards provide the foundation of consistent measurement and team visibility, while AI analysis enables rapid optimization and strategic decision-making. Together, they create a feedback loop where continuous monitoring informs intelligent optimization, which in turn improves the metrics being monitored.
The future belongs to marketers who can both see their performance clearly and act on insights quickly. Start with dashboards for visibility, add AI for intelligence, and watch your email marketing funnel become a predictable revenue engine.