The Smart Business Guide to Revenue Analytics: Build Revenue Tracking Systems That Actually Work

Whether it’s a spreadsheet updated monthly or a basic report from accounting software, every business tracks revenue in some form. But there’s a critical difference between simply recording revenue and actually understanding what drives it. Most business owners can tell you their total revenue for last month. But ask them why it increased or decreased, which customers are most profitable, or which products are trending down, and you’ll often get silence or guesses.
This gap between knowing the numbers and understanding them creates real consequences. Founders can’t explain sudden revenue changes to investors. Marketing teams waste budget on campaigns that don’t convert. Finance teams spend hours manually compiling reports that are outdated by the time they’re finished.
I’ve created this guide to cover practical methods for tracking revenue performance: from essential metrics to monitor to solutions for connecting scattered data sources and using revenue analytics to spot trends and identify growth opportunities.
What is revenue analytics, and why does every business need it?
Revenue analytics is the practice of systematically collecting, measuring, and interpreting data about your business’s income. It helps you track essential KPIs, understand what’s working, what isn’t, and where opportunities lie.
A recent Gong study found that more than 80% of companies have missed their sales forecasts and revenue projections in the past two years, often because they lack systematic revenue data analytics to catch problems early.
Unlike basic bookkeeping, which simply records transactions after they happen, revenue analytics helps you see patterns, predict future performance, and make proactive decisions before problems emerge.
The difference matters because many organizations still struggle to use data effectively in their decision-making.
Without revenue performance analytics, common problems emerge quickly:
- Why did revenue drop 20% last month? Was it churn, seasonality, or something else entirely?
- Will you hit next quarter’s targets? Sales forecasts are unreliable because you’re guessing instead of tracking actual pipeline conversion patterns.
- Which marketing campaigns actually drive profitable customers? Your team can’t answer, so budget decisions are based on clicks instead of revenue.
- How much time does your finance team waste on reports? Hours pulling data from multiple systems, only to have it outdated before anyone reads it.
Revenue data analytics benefits virtually any business, but it’s especially valuable for:
- Startups for recurring revenue tracking and burn rate monitoring that need to demonstrate traction to investors and make every dollar count.
- Growing businesses managing increasing complexity across multiple products, channels, or customer segments.
- Entrepreneurs running multiple revenue streams who require visibility into which ventures deserve more attention and resources.
- Small business owners competing with larger players who need data-driven insights to punch above their weight.
Revenue performance analysis enables businesses to answer fundamental business questions with confidence.
The challenge of revenue performance tracking: where your data lives
For most businesses, revenue data doesn’t live in one convenient location. It’s scattered across multiple platforms, each serving a different purpose, but all containing pieces of the puzzle you need to understand your financial performance.
Revenue data typically hides within:
- Payment processors (Stripe, PayPal) capture transaction details and subscription billing
- Accounting software (QuickBooks, Xero, FreshBooks) records invoices and expenses
- CRM systems (Salesforce, HubSpot, Pipedrive) track deal values and sales pipeline
- E-commerce platforms (Shopify, WooCommerce, BigCommerce) log product sales and refunds
- Advertising tools (Google Ads, Facebook Ads, LinkedIn Ads) show marketing spend and campaign performance
Each system holds critical revenue information, but none gives you the complete picture on its own. This fragmentation creates real problems:
- Manual exports introduce errors. A missed export or broken formula means your analysis is wrong, and you won’t know until someone questions the numbers.
- Version control becomes a nightmare. Three people have different versions of “Final_Revenue_Report.” Which one is actually final?
- You’re always looking backward. By the time you manually compile last month’s data, you’re already two weeks into the next month, making decisions blindly.
- Time vanishes into data wrangling. Hours spent copying, pasting, and formatting instead of actually analyzing and making decisions.
Manual revenue tracking becomes even more problematic as your business grows. What starts as a two-hour monthly routine for a startup with one product and 50 customers quickly spirals into a multi-day ordeal when you’re managing three product lines, multiple payment processors, and thousands of transactions.
The system that worked at $10K MRR breaks completely at $100K, exactly when you can least afford to lose visibility.
Methods for revenue tracking management
Businesses typically have three main approaches to tracking revenue, each with distinct trade-offs between effort, cost, and capability.
Manual revenue tracking
Manual tracking means regularly exporting data from your various platforms and consolidating it yourself, usually in spreadsheets.
Manual tracking is fine if you have a simple business model with few revenue sources, low transaction volume (under 100 transactions monthly), and minimal reporting needs. Even then, it’s usually a temporary solution.
Limitations or why businesses outgrow this quickly:
- Requires dedicated time each week or month for data updates
- High risk of human error in formulas and data entry
- No automated alerts when metrics decline
- Difficult to track trends across multiple time periods
- Breaks down quickly as transaction volume grows
Note: If you’re spending more than 4 hours per month on tracking revenue manually, automation will pay for itself immediately.
Best for: Solo entrepreneurs and very small startups willing to trade time for zero software costs can use manual revenue tracking in their early stages of growth.
Native accounting software reports
Accounting platforms like QuickBooks and Xero include built-in revenue reports and basic analytics dashboards that work well for compliance and tax reporting. At the same time, they often fall short in strategic decision-making.
They provide standard financial reports (profit and loss (P&L), revenue by customer, revenue by product), some customization options, and data that syncs automatically from connected accounts.
Limitations or where they fall short:
- Rigid reporting structures. You get predefined reports, not custom views tailored to your business model. Need to see MRR by customer cohort? Not happening.
- Data silos persist. These tools can’t pull in marketing spend from Google Ads, customer behavior from your CRM, or product usage from your app—exactly the data you need for strategic decisions.
- Built for accountants, not operators. The reports answer “what do we owe in taxes?” not “which customer segment should we invest in?”
- Missing key growth metrics. CAC, LTV, cohort retention, MRR growth rate: these require manual calculation or aren’t possible at all.
Best for: Businesses primarily concerned with financial compliance and basic revenue reporting, without complex analytics needs. If you’re asking strategic questions like “which marketing channel has the best ROI?” or “what’s our customer retention rate?”, you’ve already outgrown this approach.
Automated revenue tracking with custom dashboards
This approach uses data integration tools to automatically sync information from all your revenue sources into customized dashboards built in platforms like Google Sheets, Looker Studio, or specialized business intelligence (BI) tools.
Instead of manual exports, integration platforms connect to your data sources via APIs, automatically pulling fresh data on a schedule you set (hourly, daily, or weekly). This data flows into dashboards explicitly designed around the metrics that matter to your business model.
Key advantages:
- Up-to-date visibility. See today’s revenue to easily compare it to last month’s. Spot problems while you can still fix them.
- Unified data view. Combine payment processors, accounting software, CRM data, and marketing spend in one dashboard. Finally, see the complete picture.
- Custom metrics for your business. Track MRR growth by customer cohort, CAC by channel, revenue per product line—whatever matters to you, not what a vendor decided to include.
- Automatic updates eliminate manual work. Configure once, then your dashboards update themselves. No more Friday afternoons lost to spreadsheet updates.
- Scales effortlessly. Works the same whether you have 100 or 100,000 transactions per month.
- Collaborative by default. Share live dashboards with team members, investors, and advisors. Everyone sees the same up-to-date information.
Historically, connecting multiple platforms to dashboards required technical knowledge, developer time, or expensive integration consultants. Setting up an automated pipeline from QuickBooks + Google Ads + Pipedrive into a dashboard could take weeks and cost thousands.
Coupler.io solves this by providing pre-built no-code connectors. You select your data source (Stripe, Xero, QuickBooks, HubSpot, etc.) and choose what data you want. The platform handles authentication, data formatting, and automatic data refresh in the background. Configure once, then focus on analysis and decisions while the integration handles the data flow.
Best for: Any growing business that needs strategic insights, real-time visibility, and wants to eliminate manual data work. Particularly valuable when you have multiple revenue sources, complex customer segments, or need to make fast decisions based on current data.
How to track revenue: building your system
To track revenue effectively, you need to know what data to measure, have the right tools to collect it, and use dashboards that turn it into clear insights.
Here’s how to build a revenue tracking system in four steps.
Step 1: Define your revenue tracking goals
Start by mapping your complete revenue picture. Common revenue streams include:
- Direct sales: One-time purchases, contracts, product sales
- Recurring revenue: Subscriptions, retainers, memberships
- Service revenue: Consulting, hourly work, professional services
- Affiliate or partnership income: Commissions, referral fees, joint ventures
Next, choose 5-8 metrics that align with your business model. For example, a SaaS company might track MRR, churn rate, customer acquisition cost, revenue growth rate, and average revenue per user. At the same time, an e-commerce business would focus on total revenue, average order value, customer acquisition cost, and revenue by product category.
Finally, set your tracking frequency based on your decision-making speed.
- Daily tracking works for fast-moving businesses or those with cash flow concerns.
- Weekly suits most growing companies.
- Monthly suffices for stable businesses with predictable revenue.
Step 2: Select your revenue analytics tools
Choose tools based on three critical factors: integration capabilities, visualization quality, and ease of use.
Your tools must connect to all your revenue data sources if you use Stripe for payments, QuickBooks for accounting, and HubSpot for CRM; your analytics platform needs to be able to pull from all three.
Some popular dashboard platforms include:
- Google Sheets: Free, familiar, great for startups. Works well with add-ons and automation tools.
- Looker Studio (formerly Google Data Studio): Free, powerful visualization, connects to many data sources.
- Microsoft Excel/Power BI: Industry standard, excellent for complex analysis, integrates with Microsoft ecosystem.
- Specialized BI tools (Tableau, Metabase): Advanced features, steeper learning curve, higher cost.
No matter which platform you pick, you need automation to get the most out of it.
Step 3: Connect your revenue data sources
This step makes or breaks your revenue tracking system. Without automated connections, you’re just building a prettier version of manual tracking.
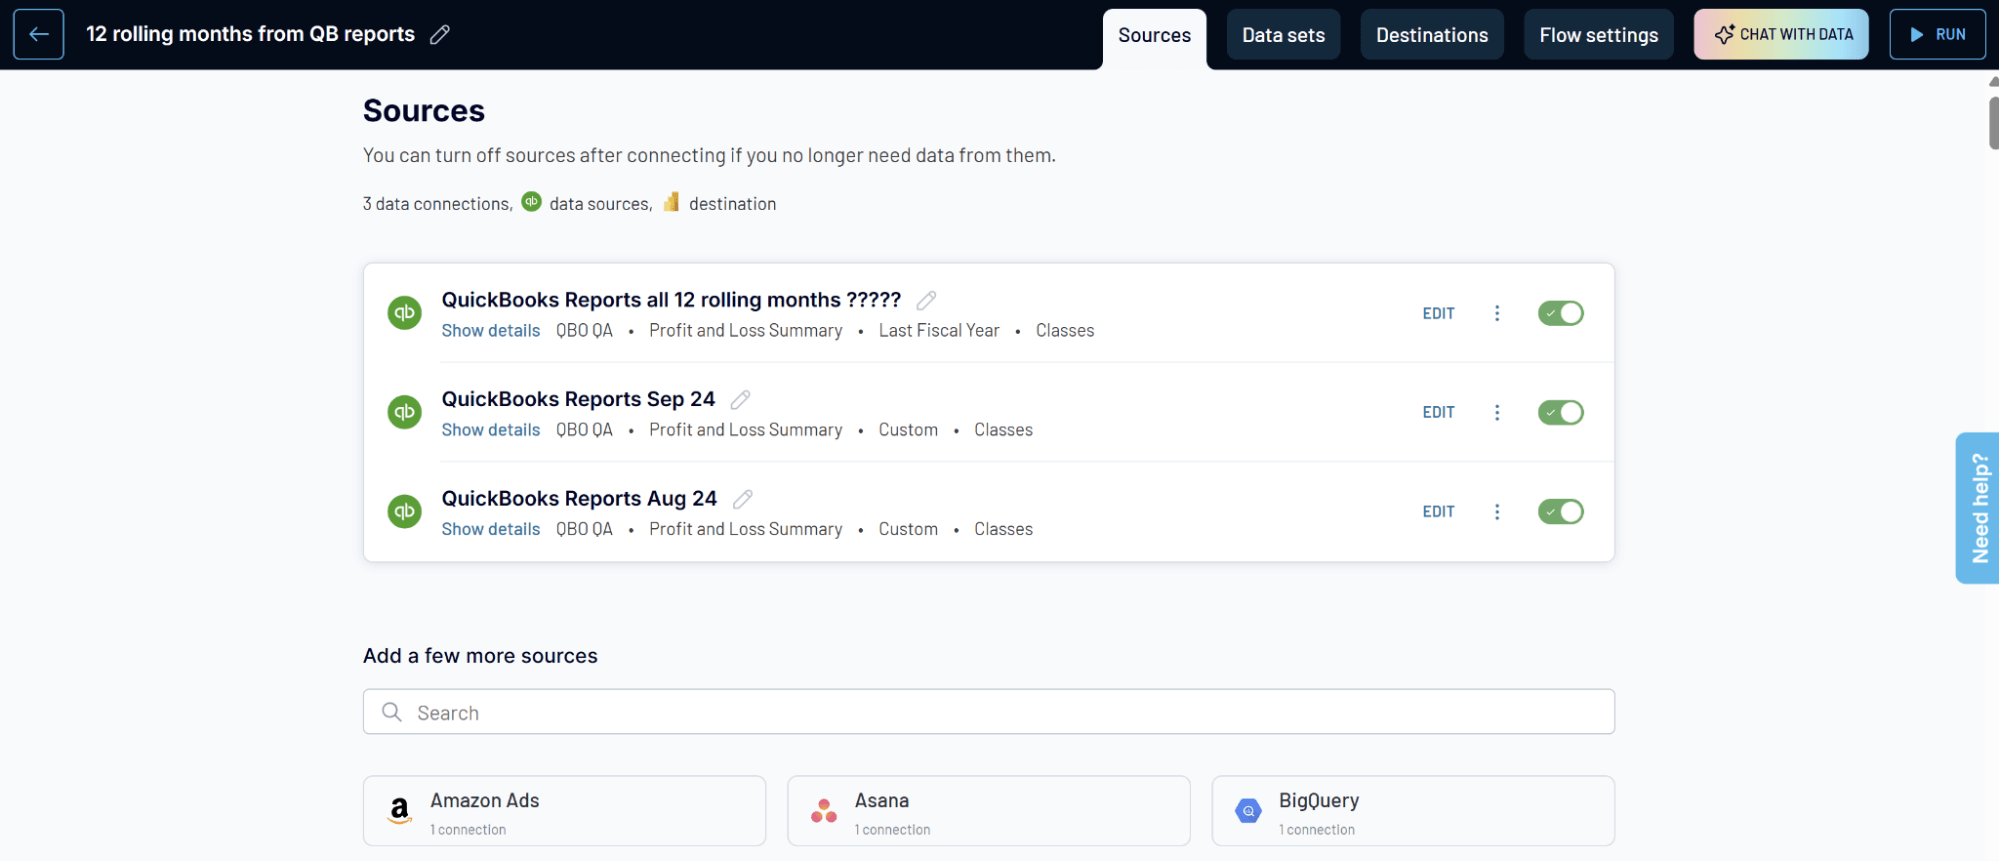
Coupler.io connects your revenue platforms directly to your dashboards through simple, no-code integrations. To set up a connection:
- Select your data source: Stripe, Xero, QuickBooks, HubSpot, Shopify, and 300 other sources.
- Choose what data you need: Transactions, customers, invoices, etc.
- Organize your data set: Use filters, aggregations, column management tools, etc.
- Load data to destination: Spreadsheets, BI tools, databases
- Set your refresh schedule (hourly, daily, weekly, or custom)
Coupler.io handles authentication, manages API changes, formats data consistently, and runs your syncs in the background. You configure the connection once, typically in 10-15 minutes, then focus on analysis while the platform maintains the data pipeline.
Once configured, Coupler.io runs automatically in the background. No manual exports, no formatting issues, no wondering if you’re looking at complete data. You focus on analysis and decisions while the integration handles the data flow. The automation provides you with:
- Accuracy: No copy-paste errors, no missed exports, no formula mistakes
- Consistency: Data formats stay standardized across all sources
- Timeliness: Dashboards reflect current reality, not last week’s manual export
- Scalability: Works the same whether you have 100 or 100,000 transactions
- Time savings: Hours per week returned to actual business decisions
Automate revenue tracking with Coupler.io
Get started for freeStep 4: Design your revenue analytics dashboard
A well-designed dashboard answers your most important questions at a glance. Poor design buries insights under clutter.
Essential components for revenue performance tracking include:
- Top-line revenue: Current period revenue with comparison to previous period and targets
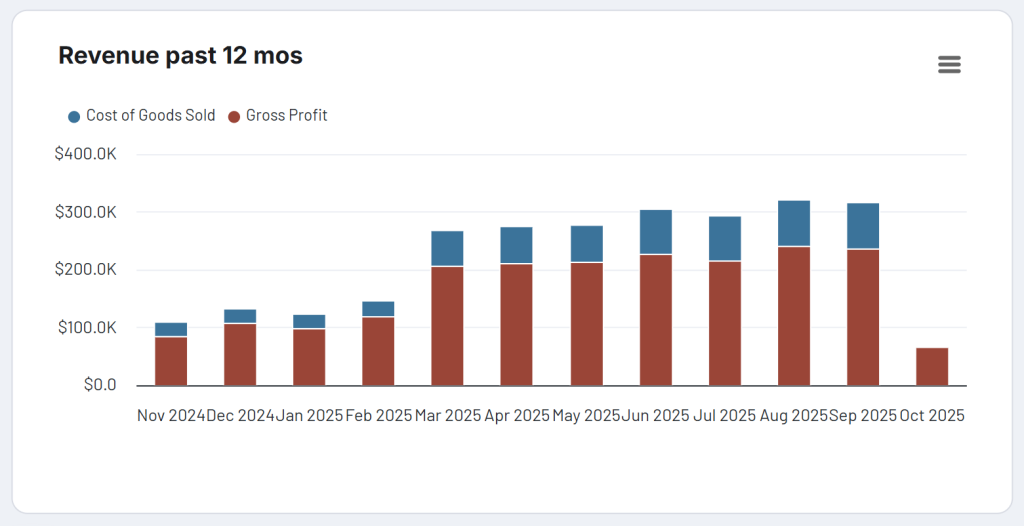
- Revenue trends: Line or bar chart showing revenue over time (last 12 months, quarter-over-quarter)
- Revenue by source: Breakdown showing which products, services, or channels generate revenue
- Key growth metrics: Whatever matters most to your business model (MRR growth, customer acquisition, repeat rate)
Some visualization best practices include:
- Using line charts for trends over time and bar charts for comparing categories
- Keeping color coding consistent (green for positive, red for negative)
- Always including comparisons to previous periods or targets for context
- Avoiding pie charts with more than 3-4 segments. Use bar charts instead
- Placing your most important metric at the top left, where eyes naturally go first
Even with these best practices in mind, designing a dashboard from scratch could take hours. Or, you can get one up and running in under two minutes with Coupler.io’s ready-made revenue dashboard templates.
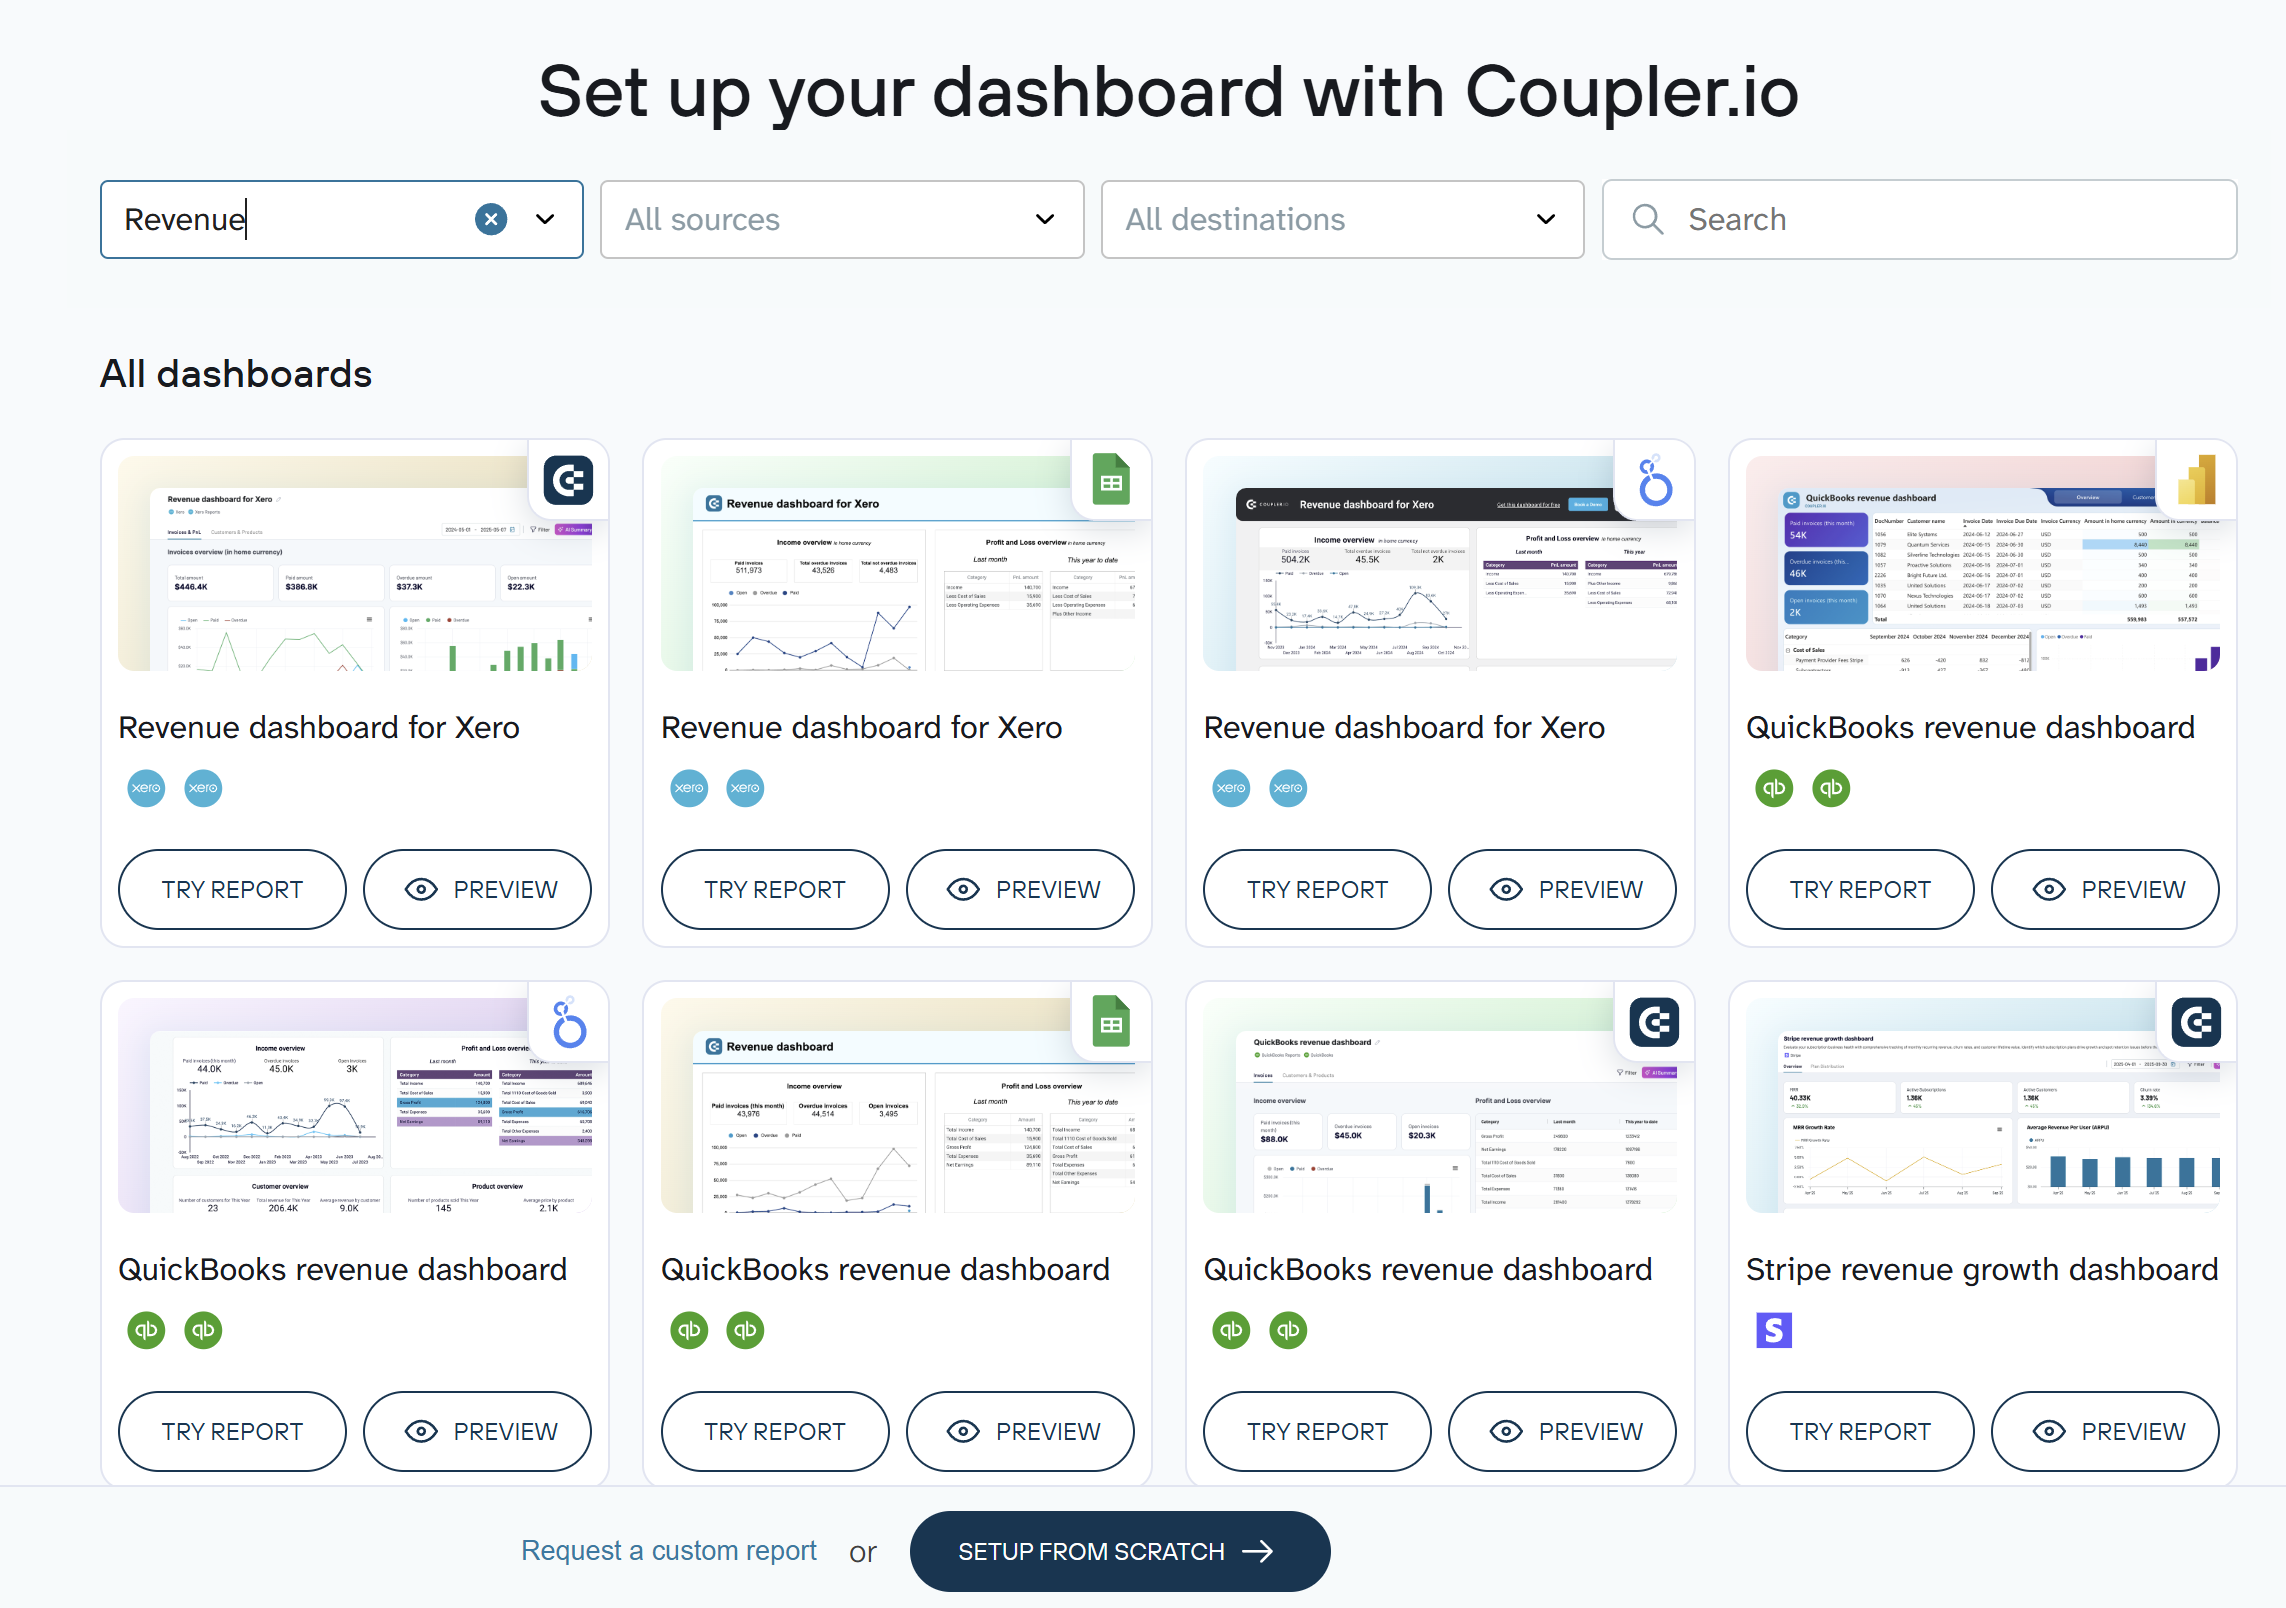
These templates come pre-configured with all the essential components above, professional visualizations, and best-practice layouts—you simply connect your data source and start tracking.
Revenue tracking template solutions
Building a revenue tracking system from scratch takes time. For starters, you’ll need to map metrics, design layouts, and configure your data connections.
Templates eliminate this work by providing pre-built dashboards with proven layouts and automated data connections already configured. Coupler.io offers ready-made dashboard templates for Stripe, Xero, and QuickBooks that connect directly to your data.
Stripe revenue growth analytics dashboard
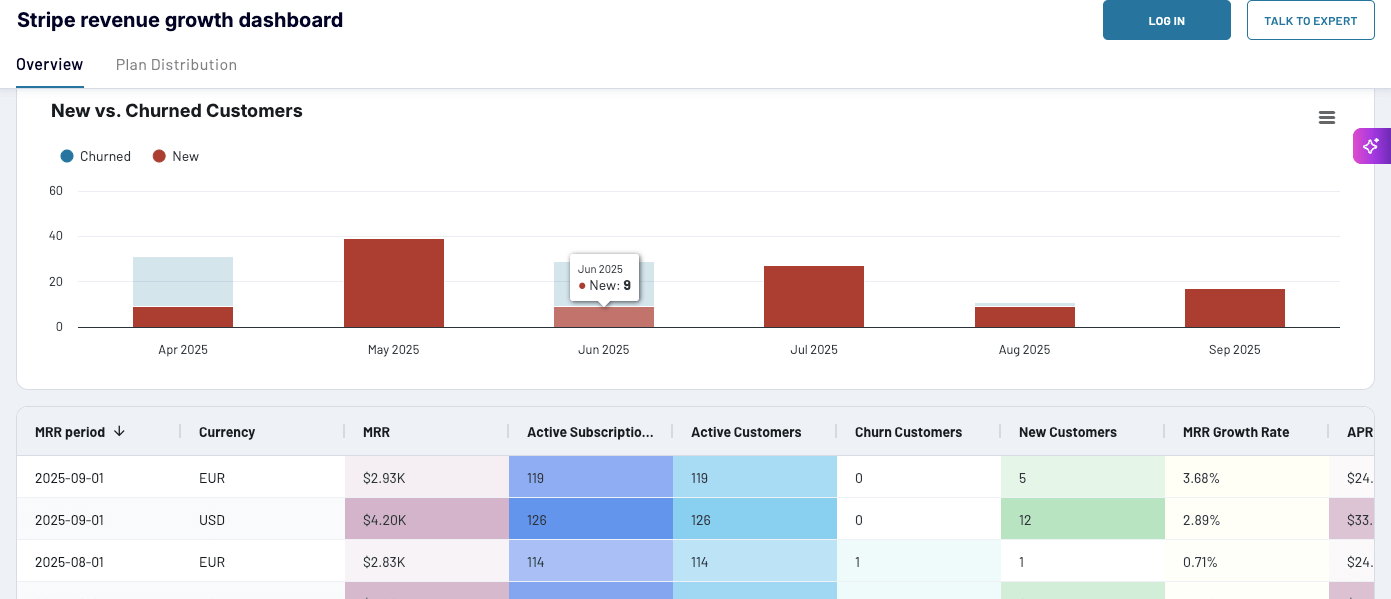
The Stripe revenue growth dashboard provides SaaS businesses and subscription-based companies with detailed insights into recurring revenue performance, customer retention patterns, and subscription plan effectiveness.
It consolidates Stripe billing data to track MRR health, identify churn risks, optimize pricing strategies, and forecast revenue growth with confidence.
Stripe revenue growth dashboard in Looker Studio
 Preview dashboard
Stripe revenue growth dashboard in Looker Studio
Preview dashboardWith the insights from this dashboard, you’ll be able to:
- Optimize customer value: See whether revenue growth comes from acquiring more customers or increasing value from existing ones through ARPU trends that reveal if you’re growing through volume or higher-value customers.
- Identify which subscription plans drive sustainable growth: Analyze trends for each pricing tier and revenue distribution across plans to see exactly where your money comes from.
- Spot retention issues early: Track new customer acquisition against churn patterns with visual comparisons that make it immediately clear when churn spikes threaten your growth.
How to get started:
You can use the dashboard right in Coupler.io with the built-in AI insights available or as a Looker Studio template equipped with the Stripe connector by Coupler.io. Choose the version you prefer and follow the instructions to set it up.
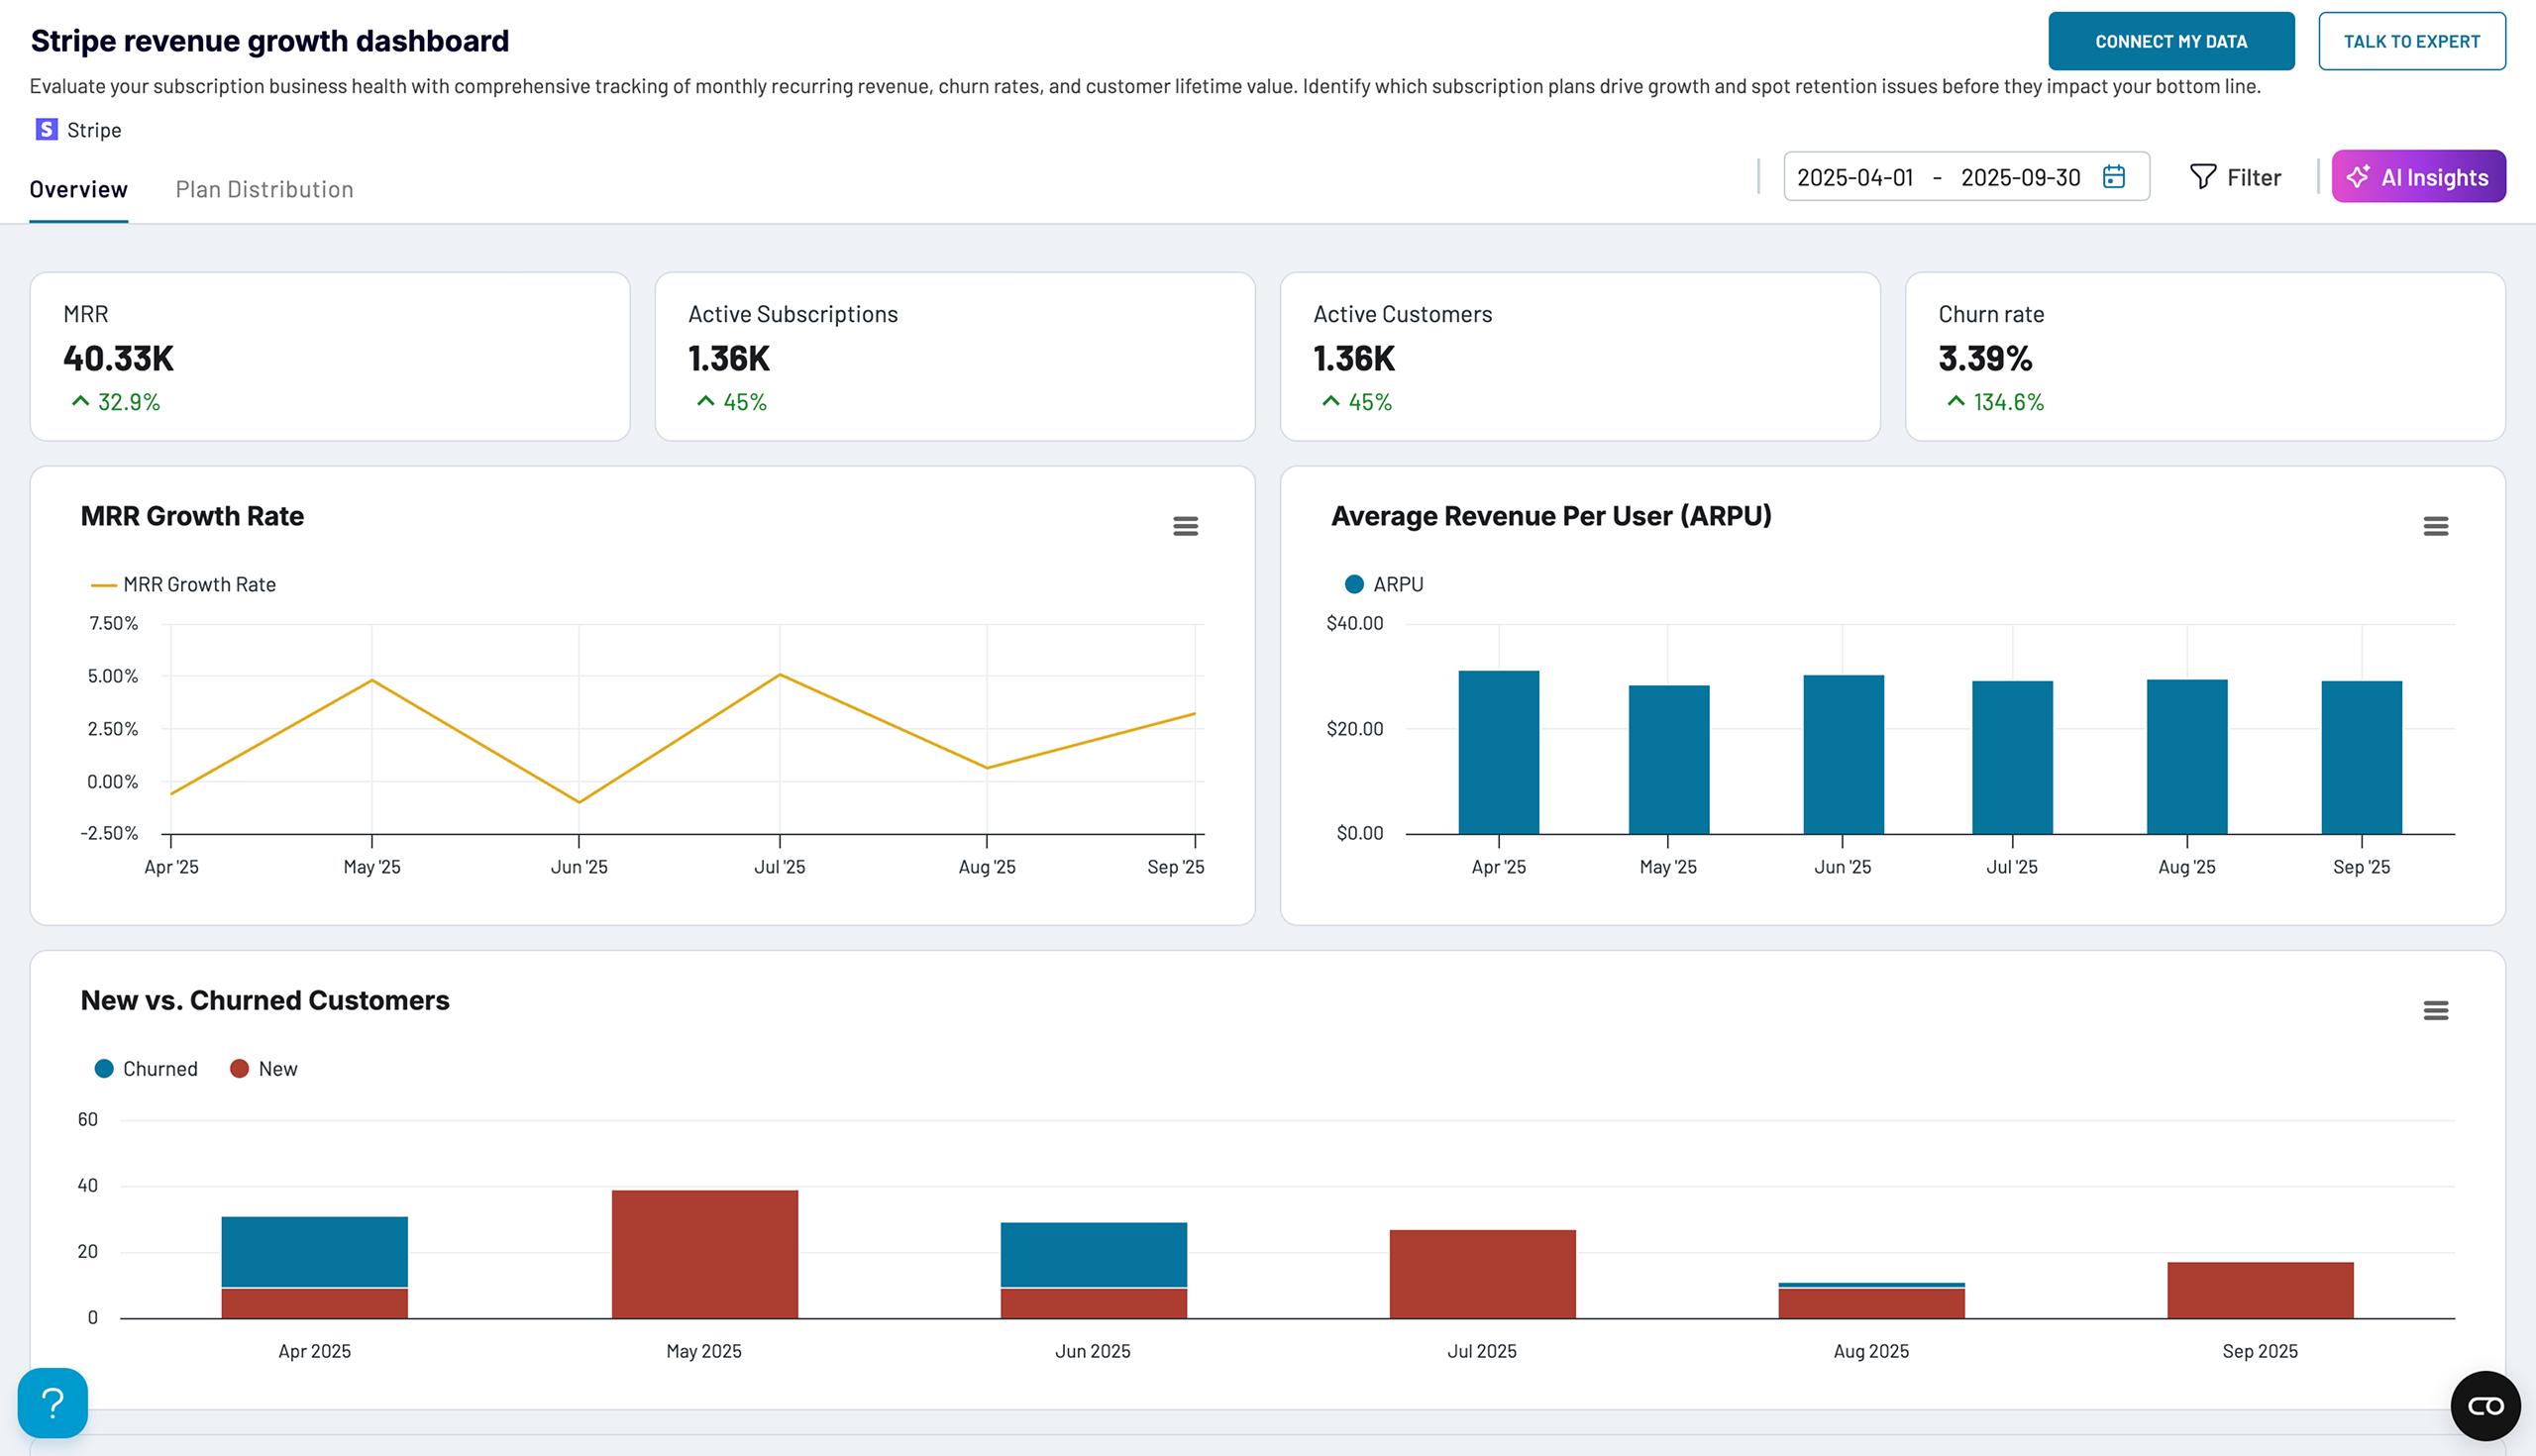
Stripe revenue growth dashboard in Coupler.io
Evaluate your subscription business health with comprehensive tracking of monthly recurring revenue, churn rates, and customer lifetime value. Identify which subscription plans drive growth and spot retention issues before they impact your bottom line.


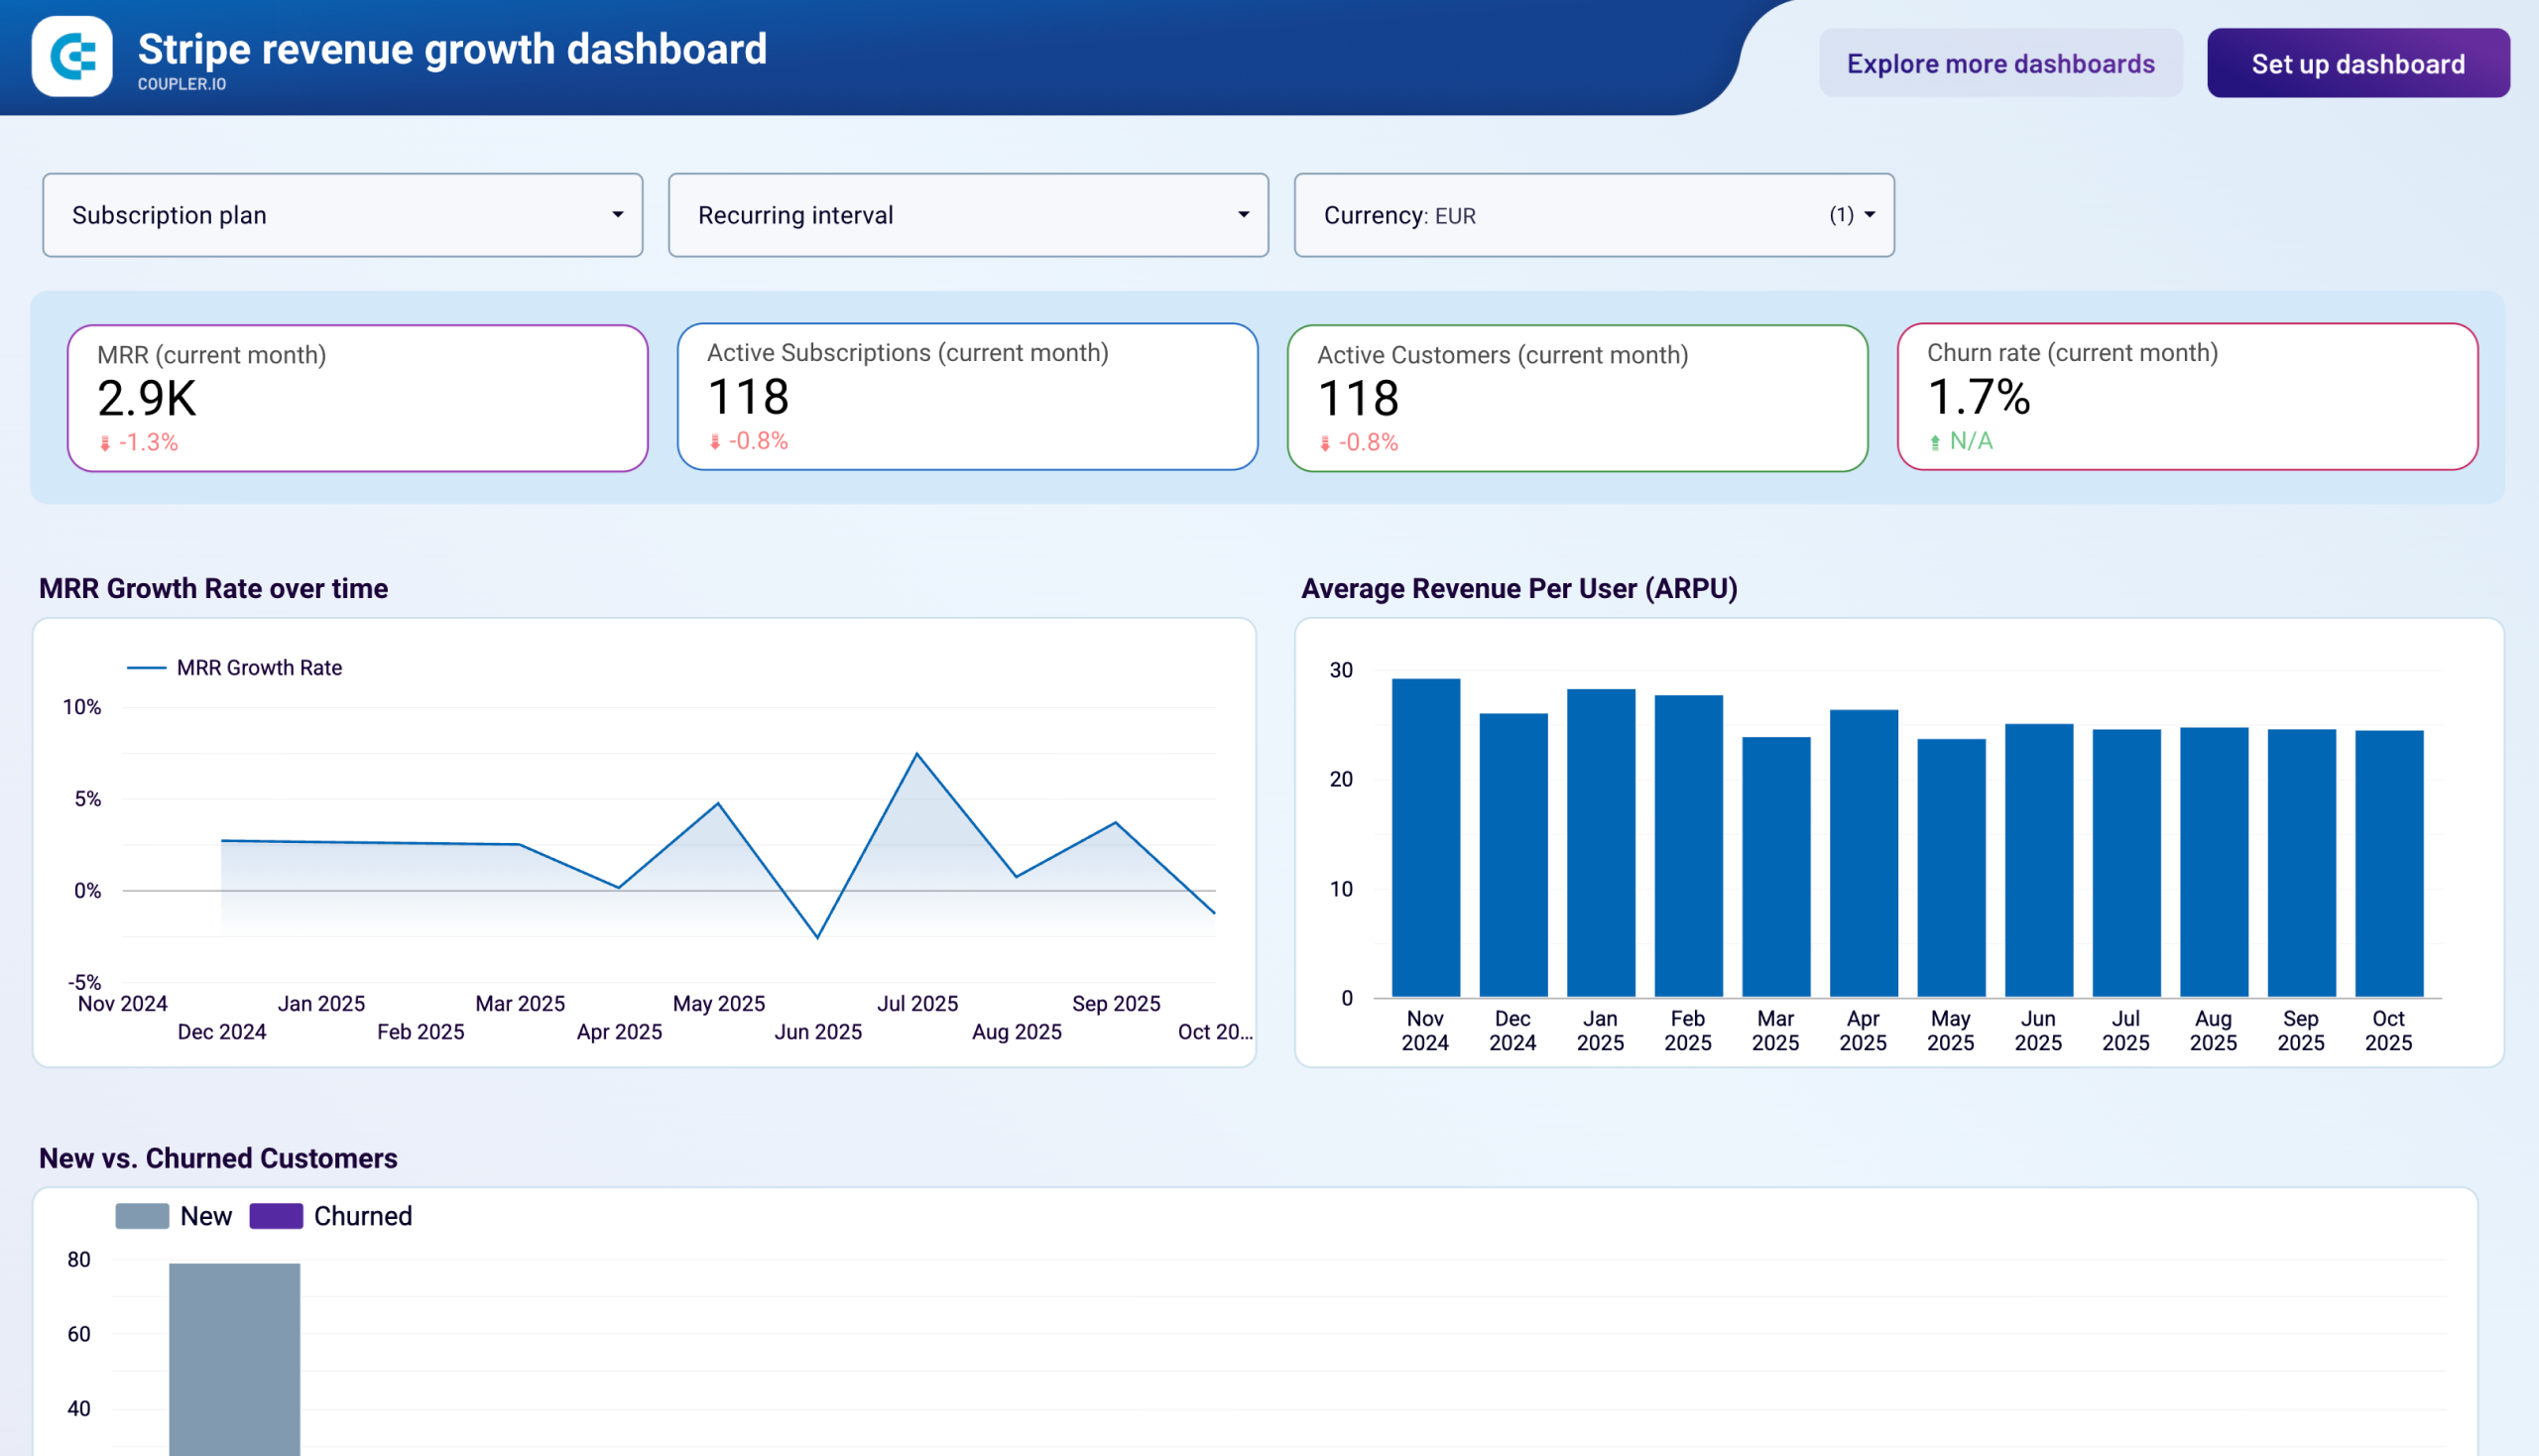
Stripe revenue growth dashboard in Looker Studio
Track your SaaS subscription performance with detailed MRR growth tracking, churn analysis, and customer retention metrics. Monitor revenue per user, analyze subscription plan distribution, and identify opportunities to reduce churn and optimize pricing strategies.

Xero revenue analytics report
This revenue dashboard template helps business owners and accounting officers monitor income and expenses comprehensively.
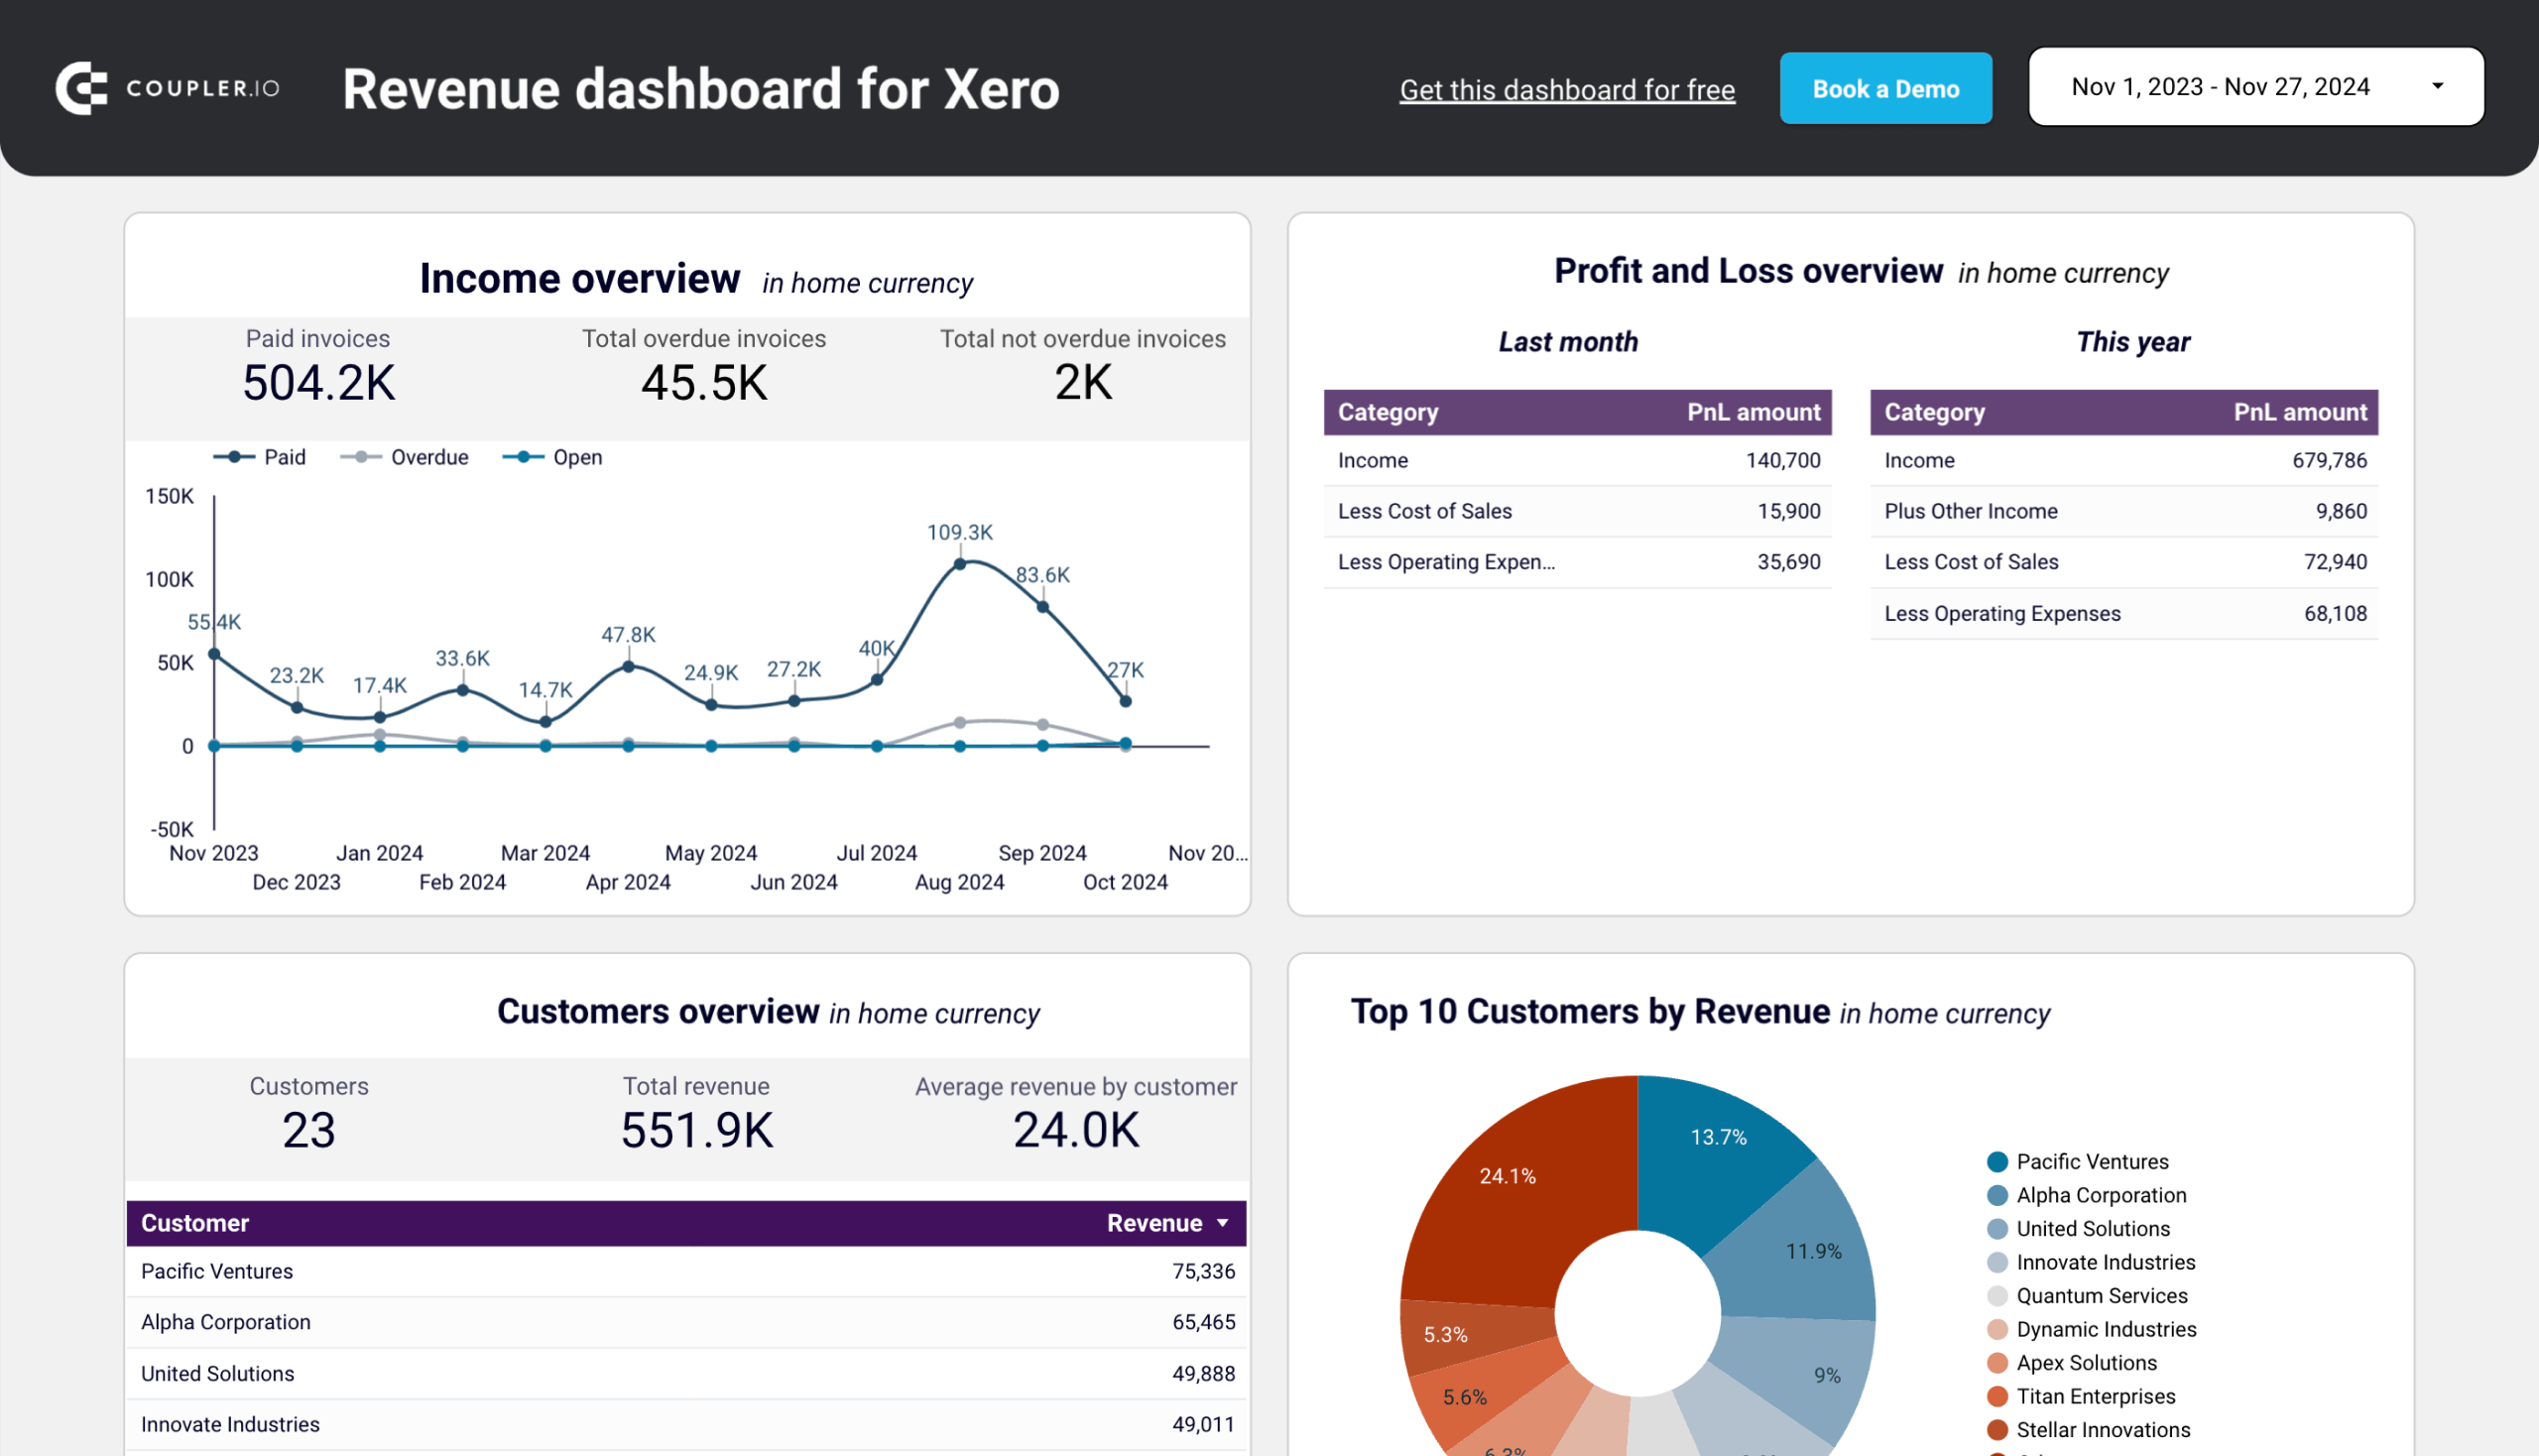
It shows revenue distribution by customers and products, depicts key revenue metrics, lists top customers, and displays best-selling products, giving you a complete picture of where your money comes from and where it goes.
The insights from this dashboard allow you to:
- Track revenue trends: Monitor income for the last 12 months to identify seasonal fluctuations, peak revenue periods, and unexpected dips.
- Assess cost management: Compare revenue and expenses in the Profit and Loss overview to see how well you’re managing costs relative to income for better budgeting and financial planning.
- Discover top customers: Identify your most valuable customers by revenue contribution for targeted marketing efforts and retention strategies like loyalty incentives.
- Identify revenue drivers: See which products or services generate the most revenue to inform inventory management, product promotion, and sales strategy adjustments.
How to get started:
This dashboard works directly in Coupler.io, where you’ll get AI Insights automatically. Or you can use it as a template in Looker Studio or Google Sheets equipped with Coupler.io’s Xero connector. Pick the platform that fits your workflow and connect your Xero account to get started.
Available in: Coupler.io, Looker Studio, Google Sheets
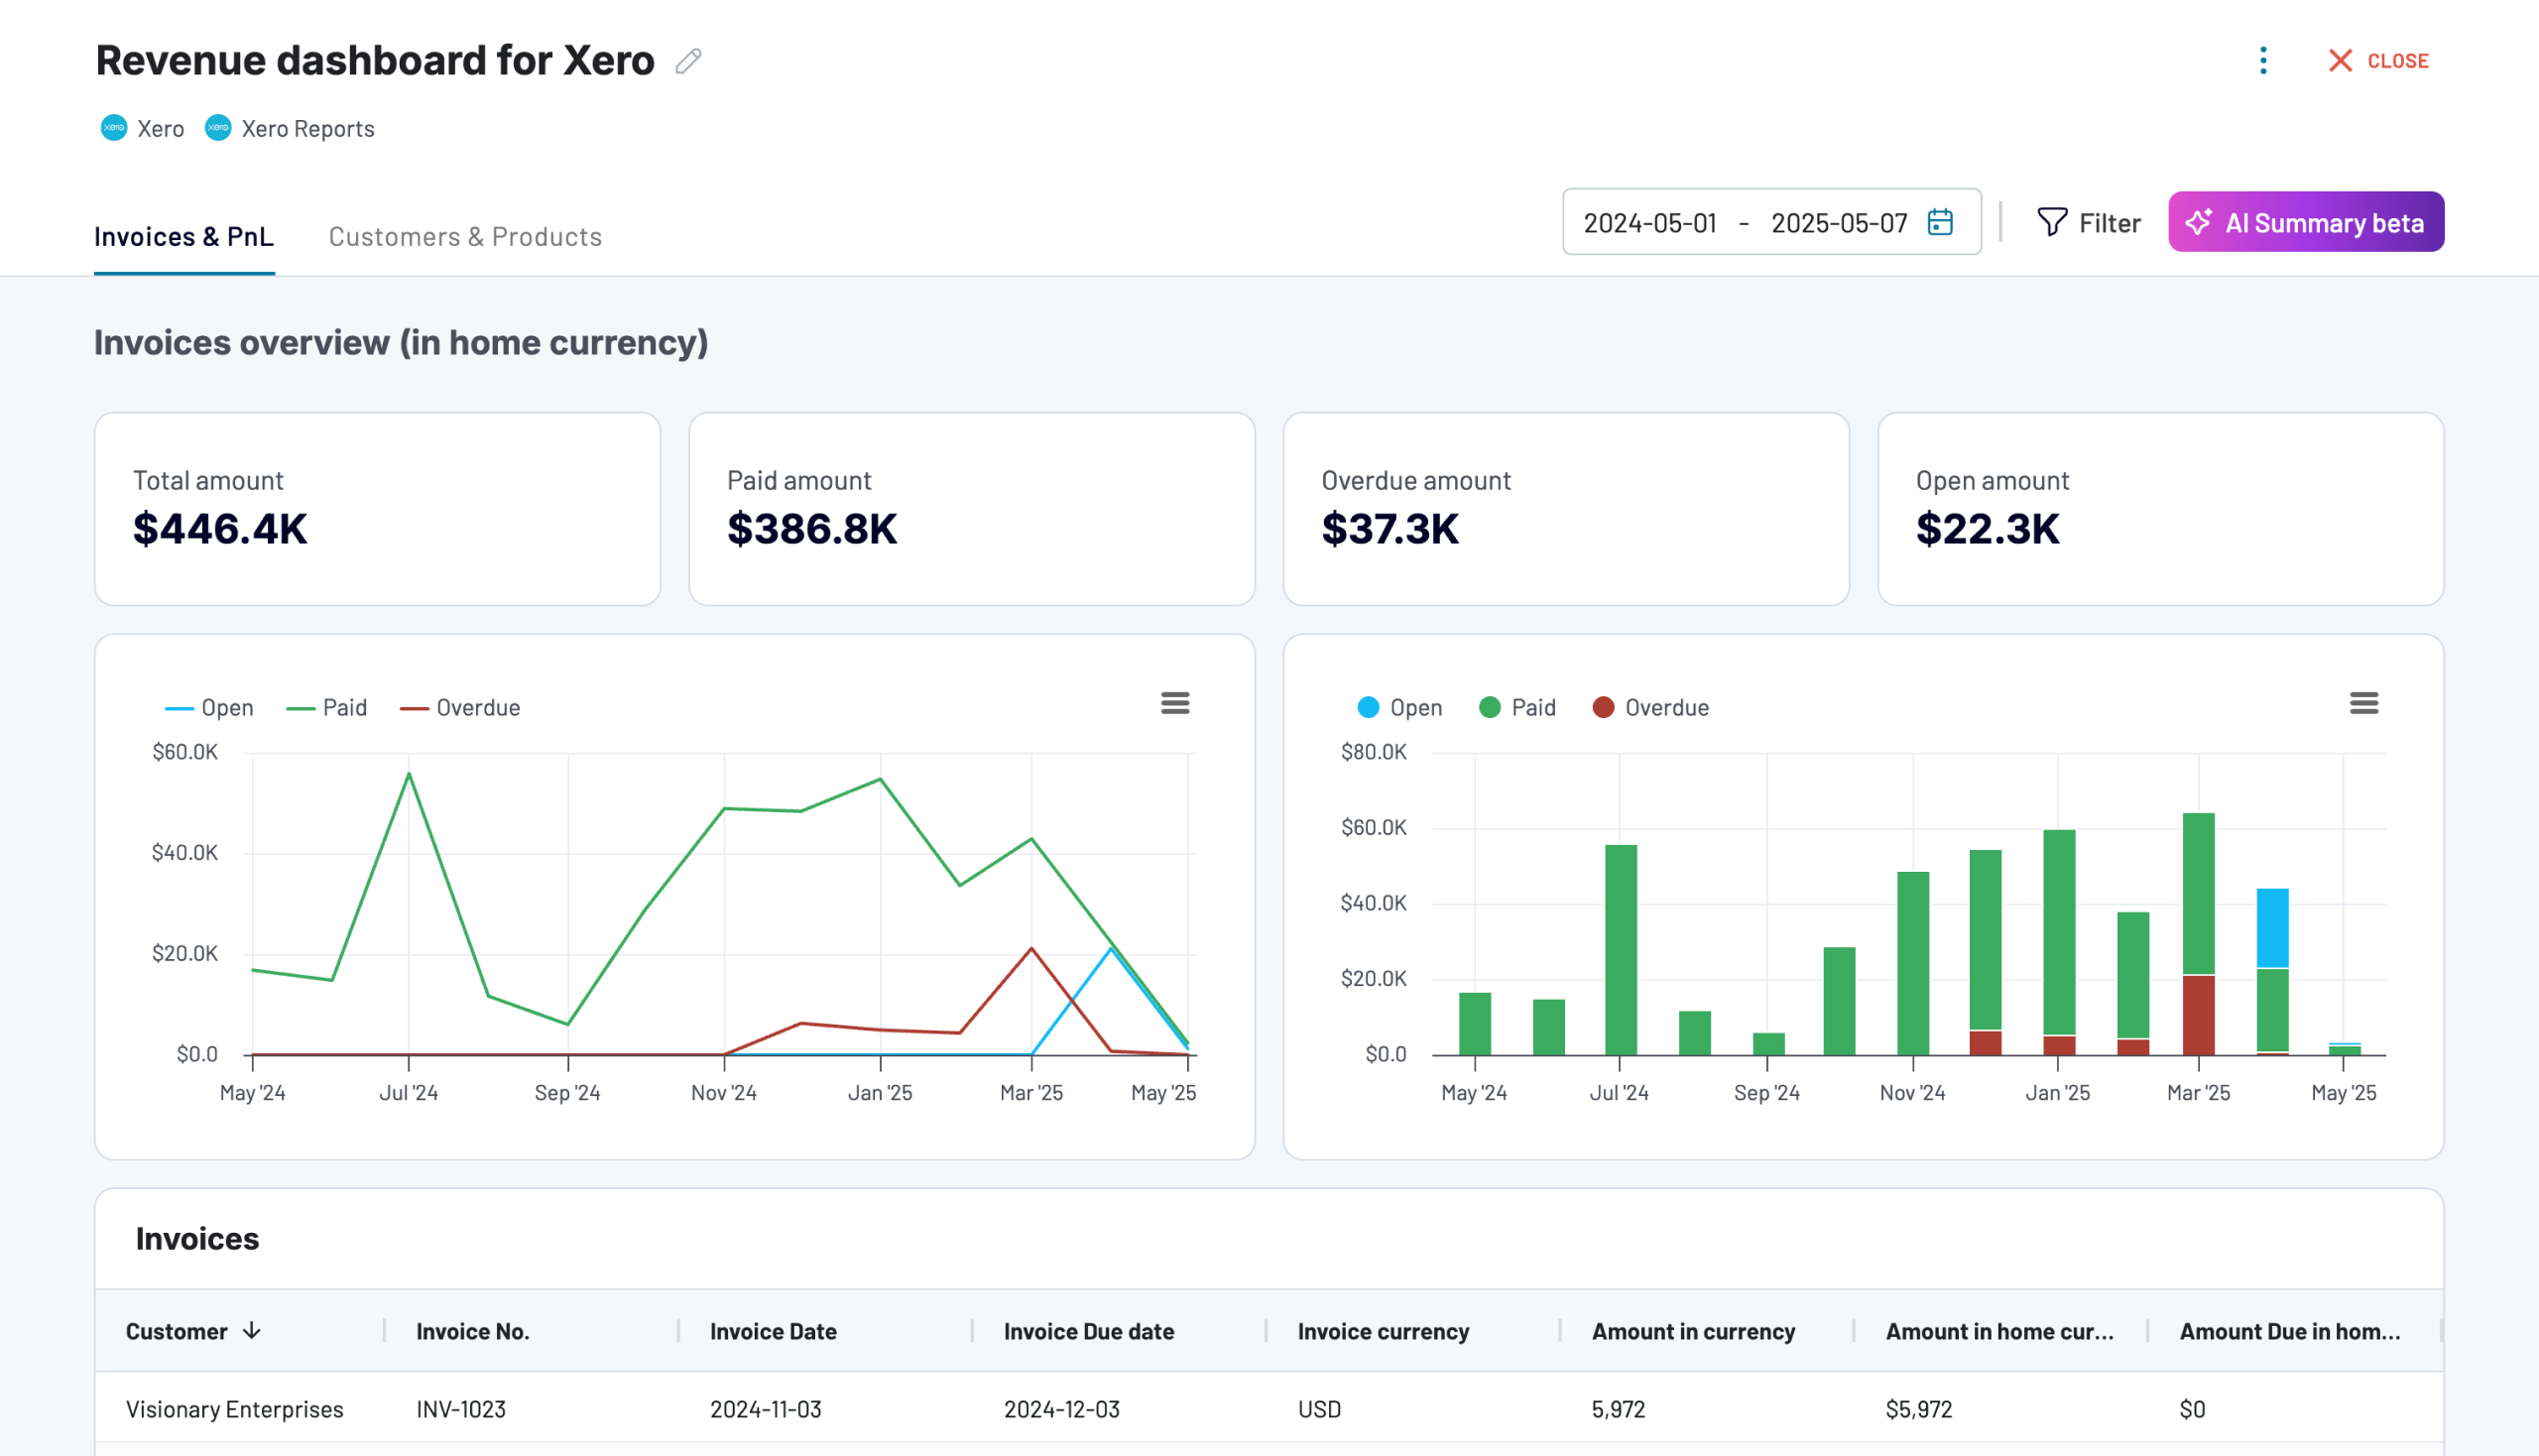
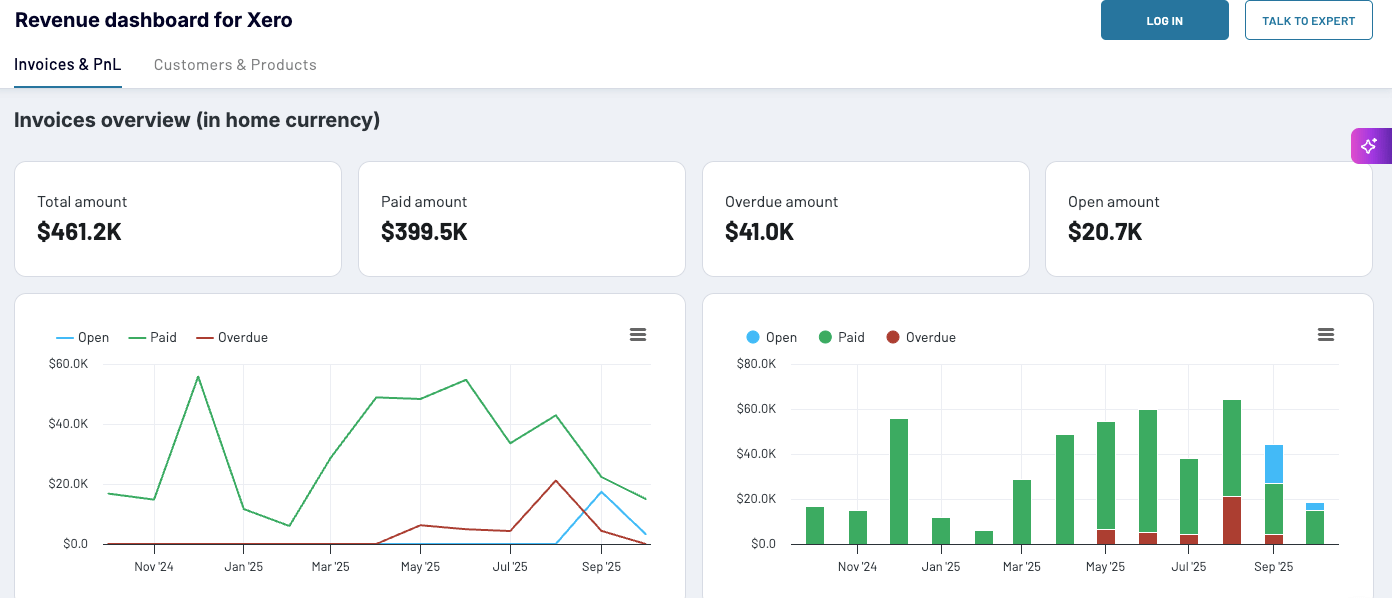
Revenue dashboard for Xero
Analyze revenue streams, customer spending patterns, and product performance with data automatically synced from Xero. Gain actionable insights into sales trends, top-performing products, and high-value customers to drive growth strategies.

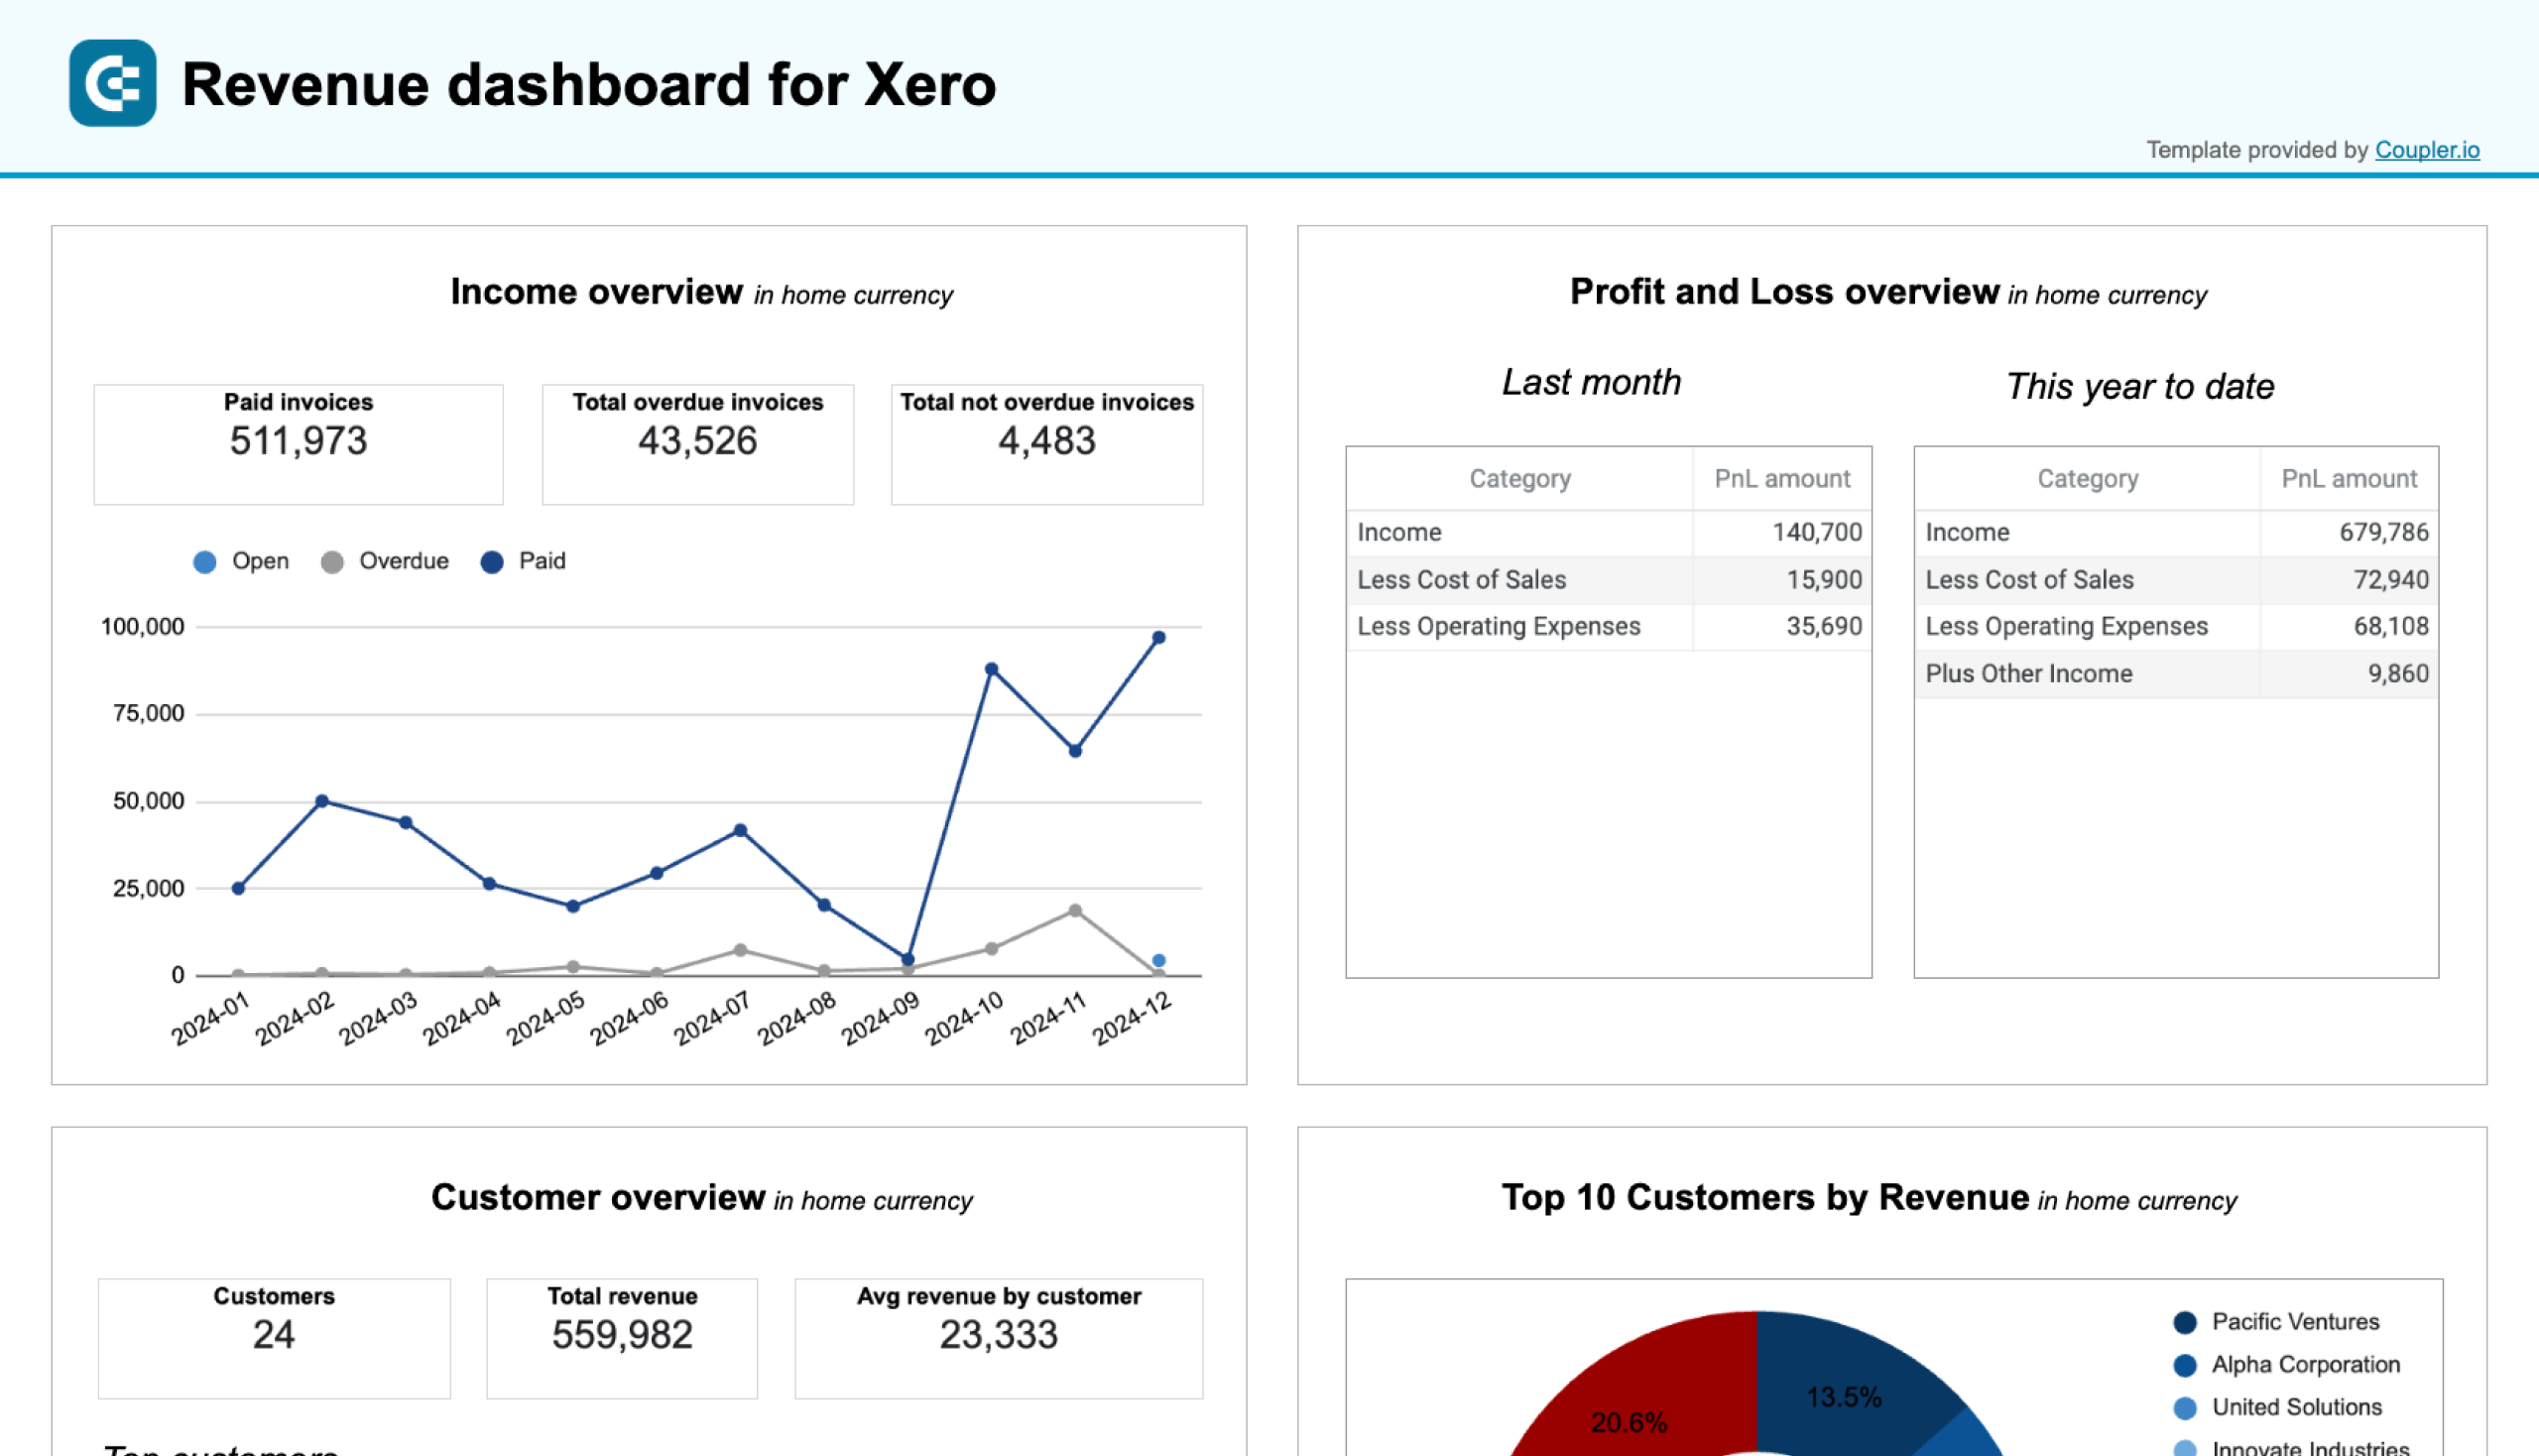
Revenue dashboard for Xero in Looker Studio
Get an overview of your profit and loss, products, and customers through a set of reports collected from Xero.
Revenue dashboard for Xero in Google Sheets
Track your revenue, costs, and customer insights with a comprehensive dashboard connected to your Xero account.

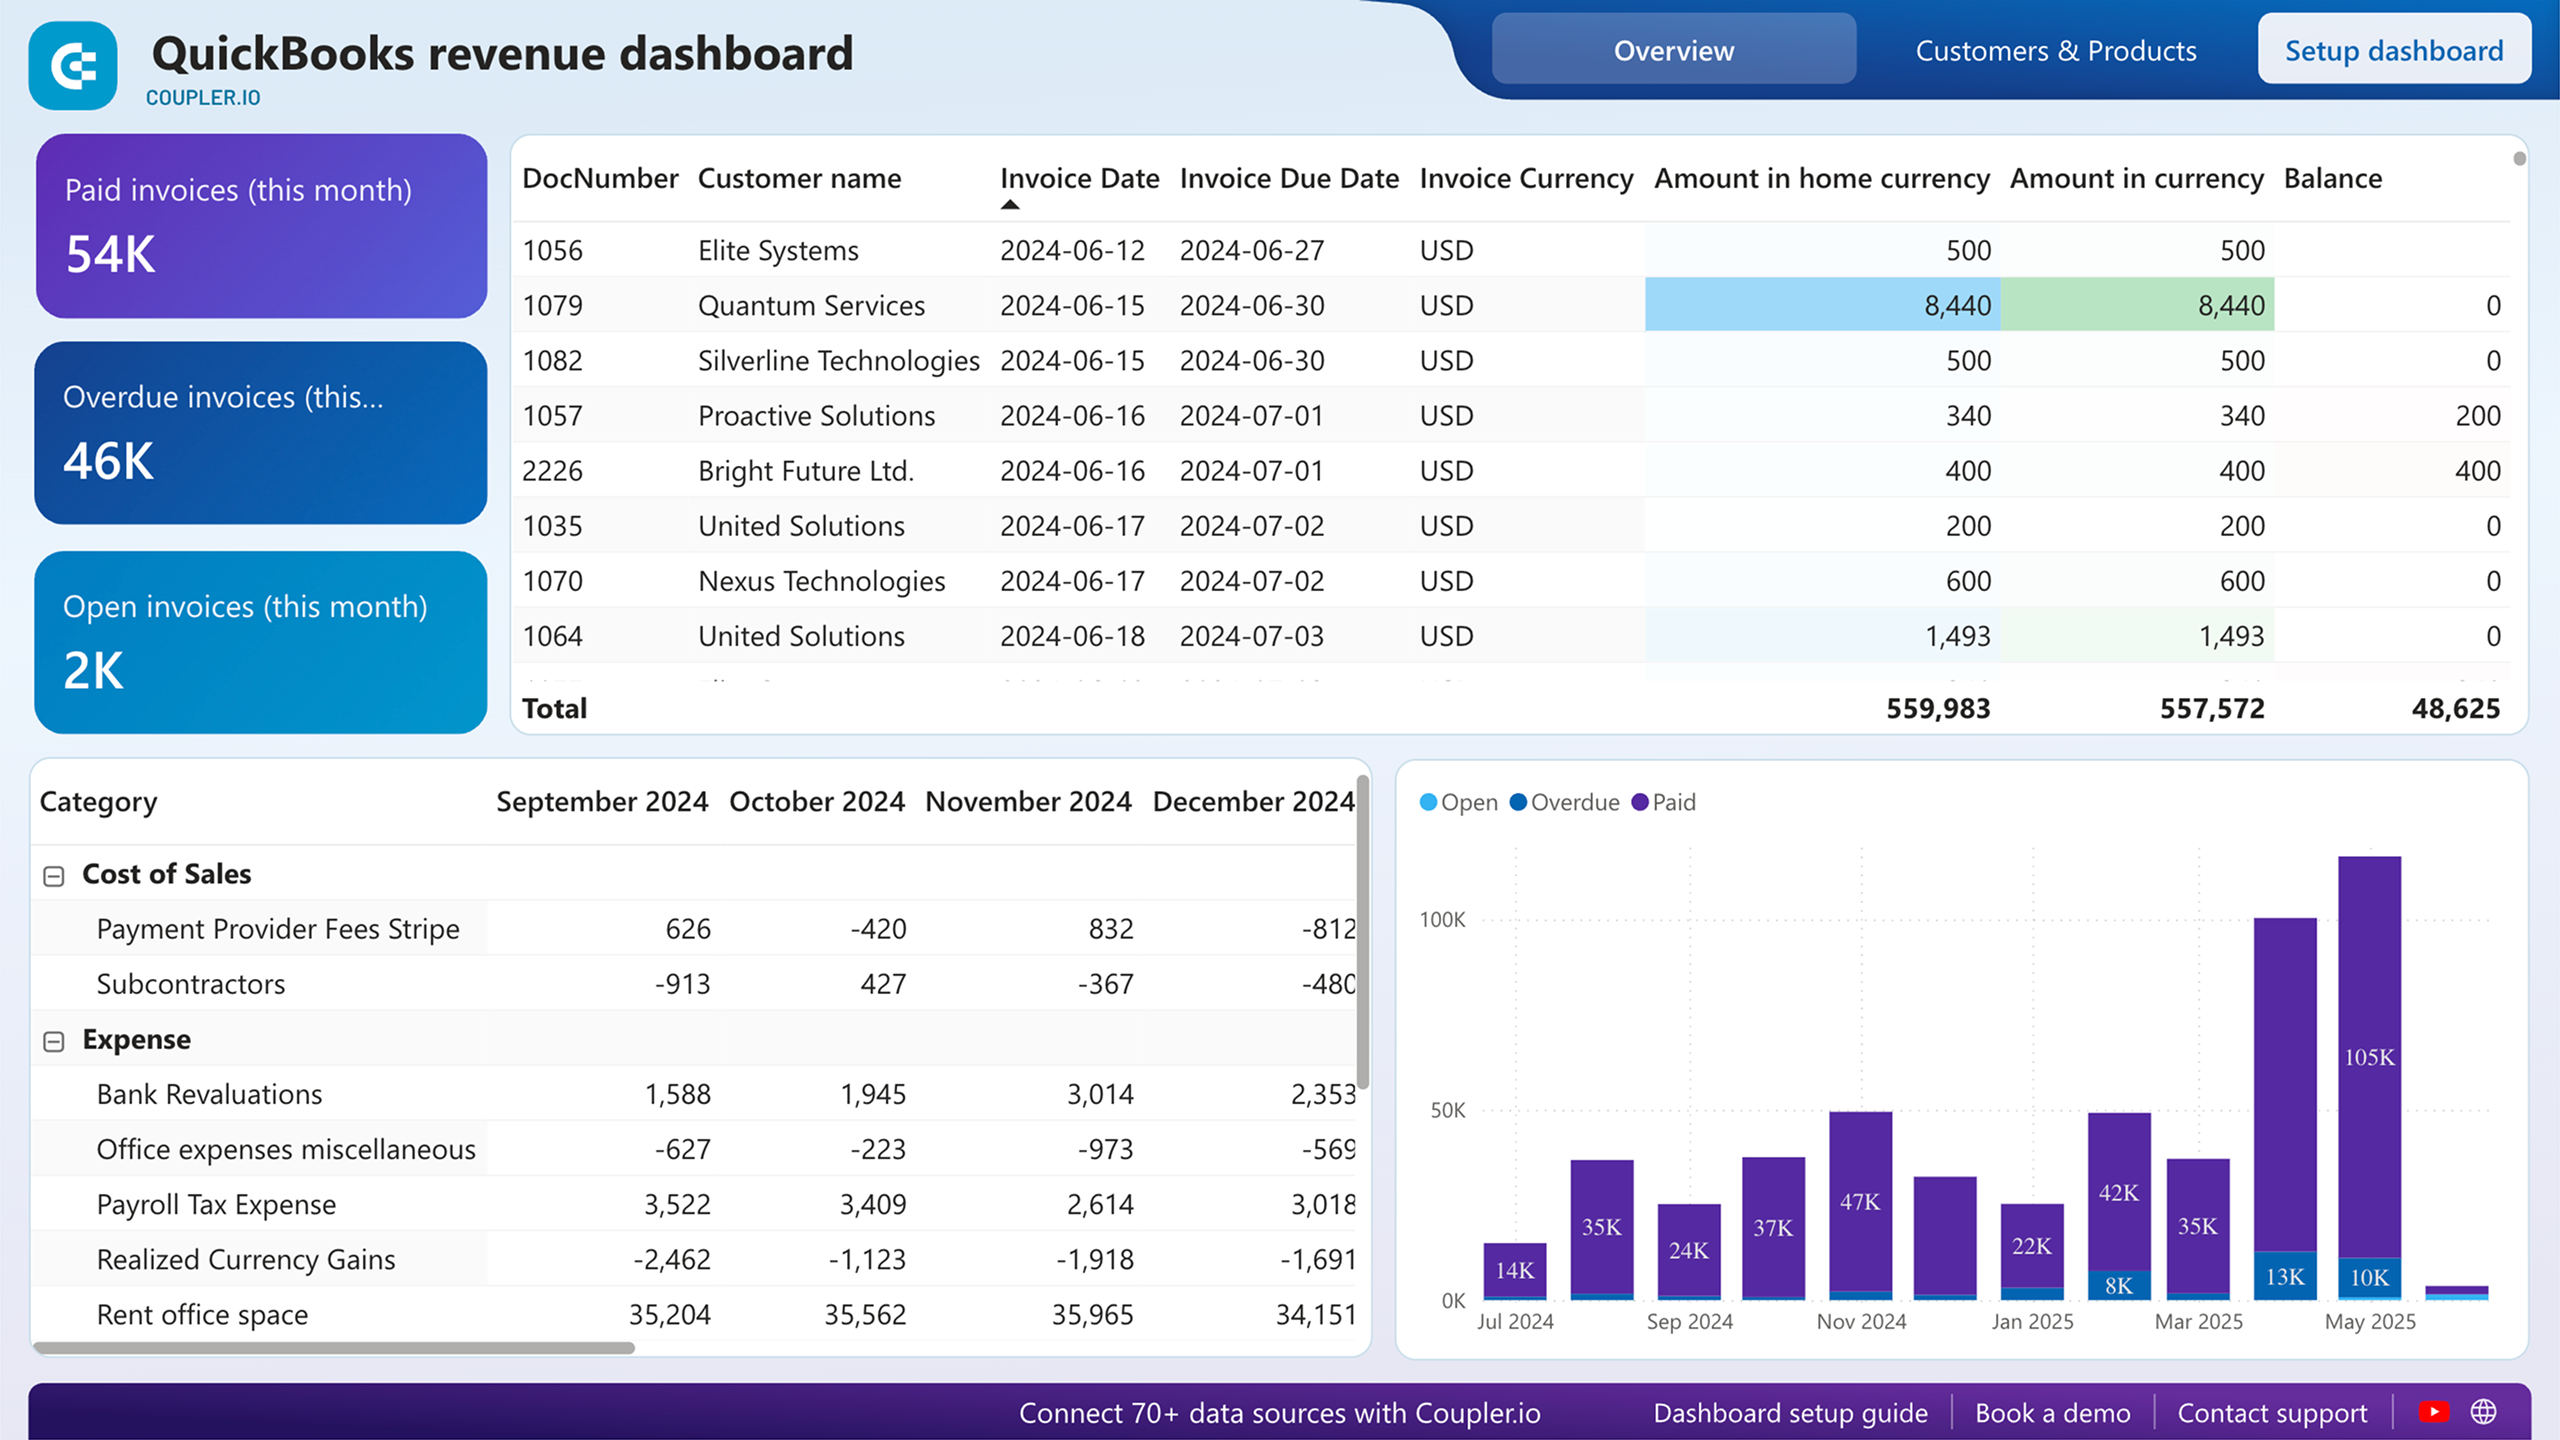
QuickBooks revenue dashboard
This revenue dashboard template helps small business owners and accounting officers using QuickBooks Online monitor income and expenses efficiently.
It displays revenue distribution by customers and products, key revenue metrics, top customers, and best-selling products, transforming your QuickBooks data into actionable revenue intelligence.
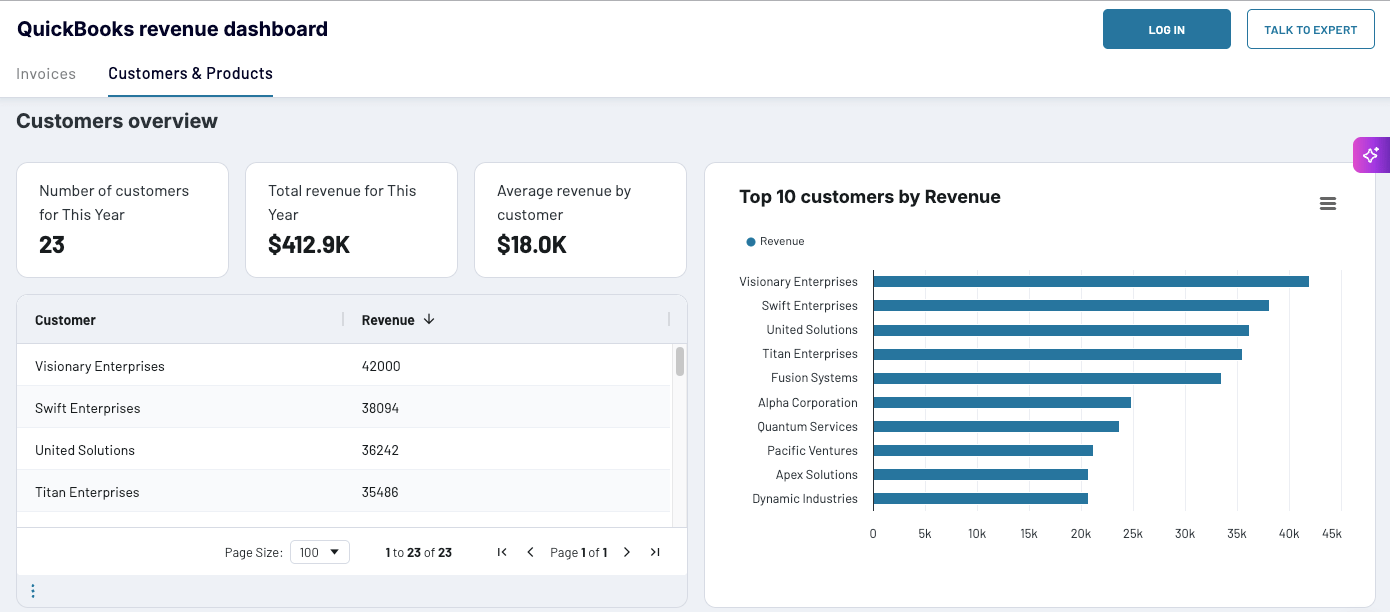
Insights from this dashboard enable teams to:
- Monitor income patterns: Track revenue trends for the last 12 months to identify seasonal patterns, peak revenue periods, and unexpected dips that need investigation.
- Evaluate profitability: Compare revenue against expenses to assess cost management effectiveness and support better budgeting decisions.
- Focus on valuable customers: See which customers contribute the most revenue to target retention efforts and loyalty programs where they matter most.
- Understand product performance: Identify which products and services generate the most income to optimize inventory, adjust pricing, and refine your sales approach.
How to get started:
Access this dashboard through Coupler.io, with AI Insights included, or use it in your preferred platform—Looker Studio, Power BI, or Google Sheets—using Coupler.io’s QuickBooks connector. Choose where you want to work and follow the setup guide to link your QuickBooks account.
Available in: Coupler.io, Looker Studio, Power BI, Google Sheets
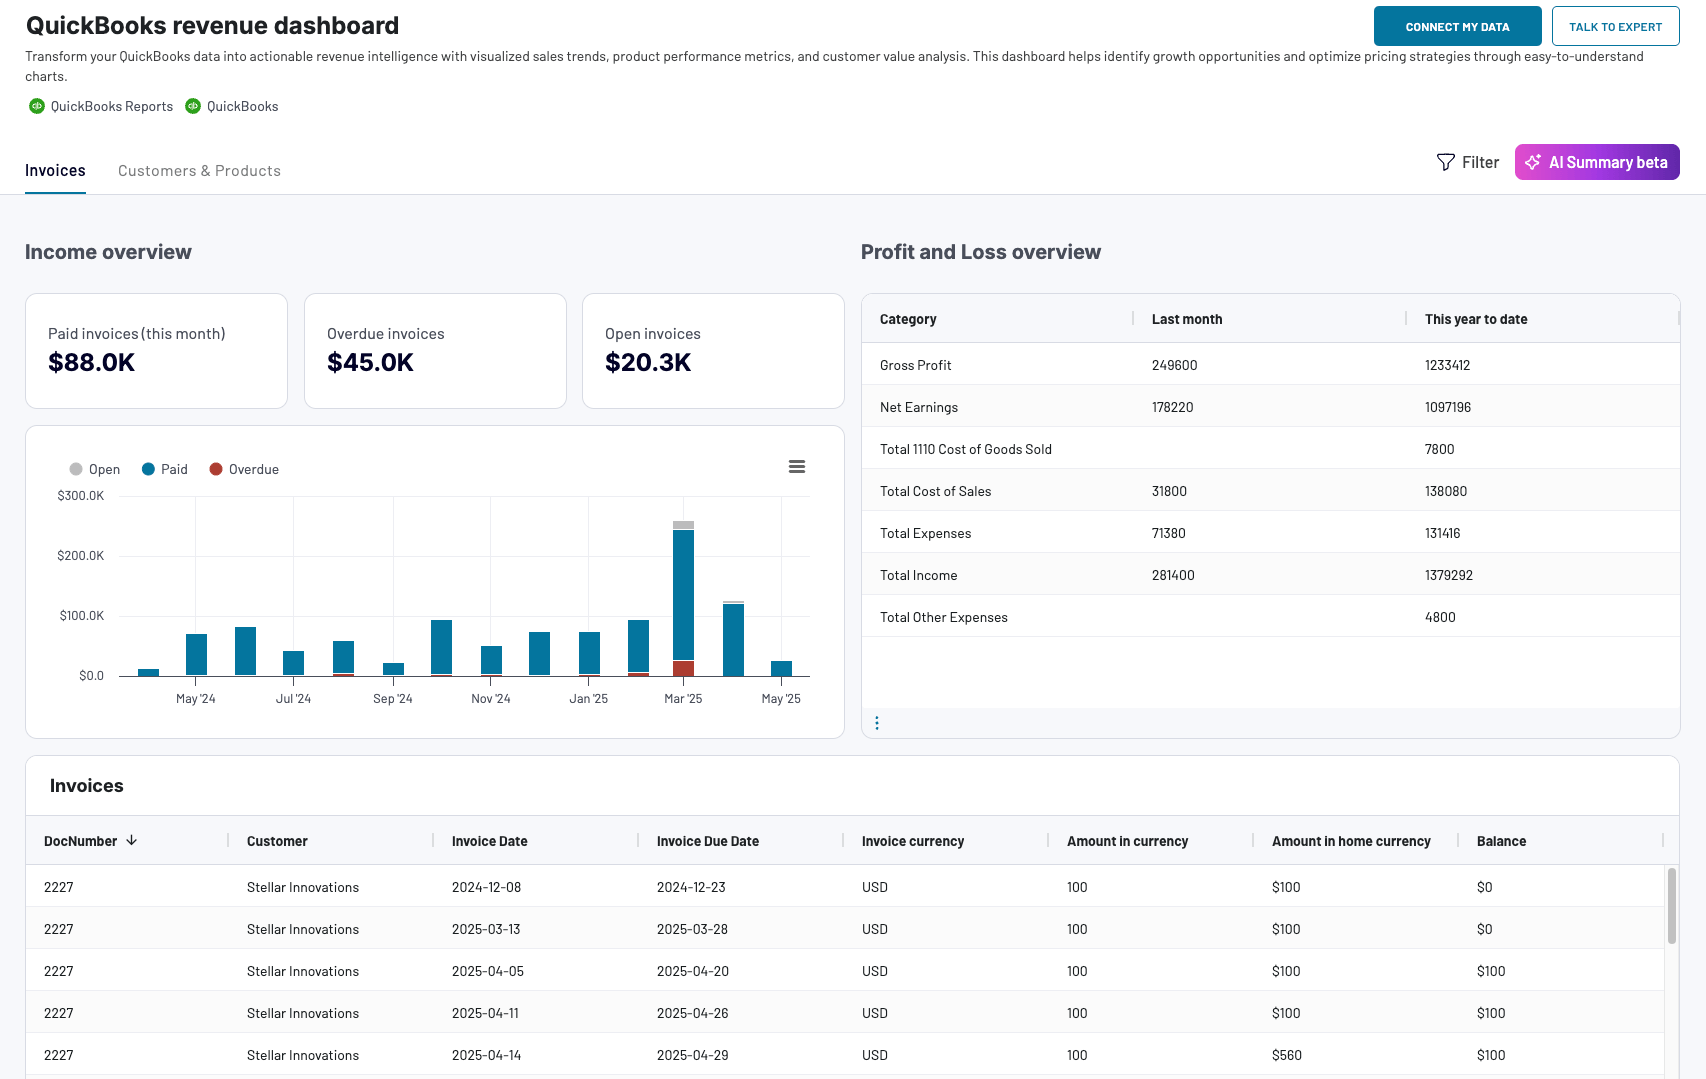
QuickBooks revenue dashboard
Transform your QuickBooks data into actionable revenue intelligence with visualized sales trends, product performance metrics, and customer value analysis. This dashboard helps identify growth opportunities and optimize pricing strategies through easy-to-understand charts.


QuickBooks revenue dashboard in Google Sheets
Analyze your revenue through a set of reports collected from QuickBooks Online on a single dashboard.

QuickBooks revenue dashboard in Looker Studio
Get an overview of your revenue based on the data from QuickBooks and unlock in-depth insights to drive informed business decisions.
QuickBooks revenue dashboard in Power BI
Monitor your income and expenses on an all-in-one revenue dashboard connected to your QuickBooks Online account.

Revenue performance analytics powered by AI
Building an effective revenue tracking system requires three key elements: the right data connections, well-designed dashboards, and the ability to understand what your numbers mean quickly.
But revenue analysis is only valuable if it leads to better decisions. That’s where Coupler.io’s AI capabilities enhance everything you’ve built, transforming static dashboards into intelligent systems that surface insights automatically and answer your specific questions on demand.
Your revenue dashboards from Stripe, Xero, and QuickBooks can include an AI Insights button that analyzes your data automatically. Click it once and get a summary of trends, key findings, and recommendations in under 20 seconds.
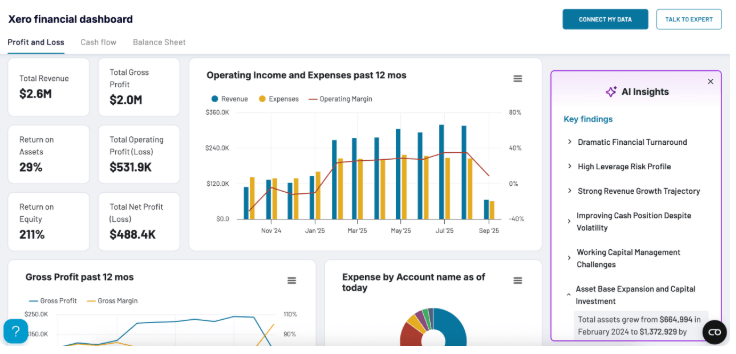
The AI identifies patterns you might miss: consistent profitability turnaround, high-leverage debt risks, strong revenue generation, and specific operational challenges. Each insight includes relevant metrics and actionable recommendations.
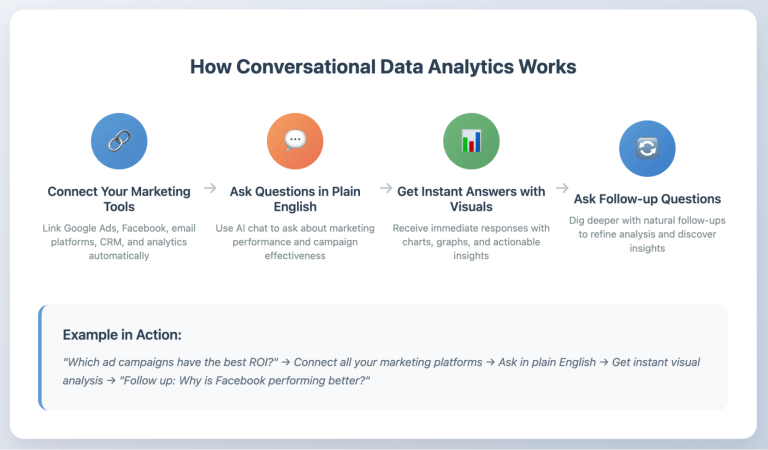
Beyond automated insights, you can also have natural conversations with your revenue data through Coupler.io’s AI integrations. Connect your Stripe, Xero, or QuickBooks data to Claude or ChatGPT and ask specific questions in plain language:
- “Why did revenue drop 15% last month?”
- “Which customer segment has the highest lifetime value?”
- “What’s driving the increase in churn this quarter?”
- “Show me revenue trends by product for the last 6 months”
The AI accesses only the specific revenue datasets you’ve connected through Coupler.io; you control exactly what data it can see. You can ask follow-up questions, explore different scenarios, and get insights tailored to your business through an ongoing dialogue with your data.
How it works:
- Connect your revenue platform (Stripe, Xero, or QuickBooks) to Coupler.io
- Choose which datasets to share with AI—like bills, invoices, or cash flow reports
- Set your automatic refresh schedule to keep data current
- Access your AI tool (Claude or ChatGPT) and start asking questions
Setup takes under 10 minutes with no coding required.
Connect your data automatically, visualize it in customizable dashboards, get instant AI analysis, and ask questions in plain language—all without writing code.
Key revenue metrics every business should track
Building a revenue data analytics system is only valuable if you’re measuring the right things. Track too few metrics and you miss critical warning signs. Track too many and you drown in data without gaining insights.
The metrics you track depend on your business model and goals. However, these key metrics are relevant for most businesses and directly reveal health and growth potential.
Annual and monthly recurring revenue analytics
What it is: Predictable revenue from subscriptions, retainers, or contracts that renew automatically. MRR is the monthly total; ARR is MRR multiplied by 12.
Why it matters: Recurring revenue tracking is the foundation of sustainable growth. Unlike one-time sales that require constant customer acquisition, recurring revenue compounds over time. A $10K MRR business that retains customers only needs to add $2K in new MRR monthly to reach $34K MRR in one year.
What’s healthy: For SaaS and subscription businesses, recurring revenue should represent at least 70% of total revenue. Growth rates vary by stage: early-stage companies often see 10-20% monthly MRR growth, while mature companies might see 5-10%.
Revenue growth rate
What it is: The percentage increase or decrease in revenue over a specific period, typically month-over-month (MoM) or year-over-year (YoY).
How to calculate:
((Current Period Revenue - Previous Period Revenue) / Previous Period Revenue) × 100
Example: ($120K - $100K) / $100K × 100 = 20% growth
Why it matters: This single metric tells you if your growth strategies are working. It reveals momentum and helps you forecast future performance. Consistent growth compounds—20% monthly growth turns $100K MRR into $892K in 12 months.
What’s healthy: Depends heavily on business stage and model. Early-stage startups often target 10-20% MoM. Established businesses might see 20-50% YoY. Slowing growth isn’t always bad if your absolute revenue is high, but accelerating negative growth demands immediate attention.
Customer acquisition cost (CAC) vs. customer lifetime value (LTV)
What they are:
- CAC: Total sales and marketing spend divided by number of new customers acquired in that period
- LTV: Average revenue per customer × average customer lifespan (or more precisely, average monthly revenue × gross margin % × average lifetime in months)
Why they matter together: This ratio determines if your business model is sustainable. If you spend $500 to acquire a customer who only generates $400 in lifetime revenue, you’re losing money on every sale—a fast track to failure.
What’s healthy: The standard benchmark is an LTV:CAC ratio of 3:1 or higher. This means you earn back three times what you spent to acquire the customer. Below 3:1, your margins are too thin. Above 5:1, you might be under-investing in growth.
Red flag: If your CAC payback period (time to earn back acquisition cost) exceeds 12 months, you’ll struggle with cash flow even if your LTV:CAC ratio looks good.
Churn rate and net revenue retention (NRR)
What they are:
- Churn rate: Percentage of customers (or revenue) lost in a given period
- NRR: Revenue retained from existing customers over time, including upgrades and expansion
How to calculate:
Customer churn: (Customers lost / Total customers at start) × 100NRR: ((Starting MRR + Expansion - Churn) / Starting MRR) × 100
Why they matter: Churn is the silent killer of growth. Even “just” 5% monthly customer churn means you lose 46% of customers annually—you’re running on a treadmill, replacing half your customer base every year just to stand still.
Meanwhile, NRR above 100% means your existing customers are spending more over time through upgrades, add-ons, or increased usage. This is the hallmark of product-market fit.
What’s healthy:
- B2B SaaS: Under 5% annual churn is excellent; 10-15% is acceptable; above 20% signals serious problems
- Consumer subscriptions: Under 5% monthly churn is good; above 10% is concerning –
- NRR: Best-in-class companies exceed 120%; 100-110% is solid; below 100% means you’re shrinking from within
Revenue by source
What it is: Revenue broken down by product, service, sales channel, or customer segment. Instead of seeing “$500K total revenue,” you see “$350K from Product A, $100K from Product B, $50K from services.”
Why it matters: This breakdown reveals where your business actually makes money versus where you think it does. It exposes concentration risk, identifies upselling opportunities, and shows which initiatives deserve more investment.
- If one product/service dominates (70%+ of revenue): That’s your core business—protect it fiercely and optimize it relentlessly. Everything else is experimental.
- If one channel dominates: You’re vulnerable to changes in that channel (algorithm updates, price increases, competition). Start building alternatives before you’re forced to.
- If one customer segment dominates: You have deep expertise there, but also concentration risk. Can you replicate success in adjacent segments?
Average revenue per customer
What it is: How much revenue you generate per customer, measured differently based on your business model:
- Average Order Value (AOV): For transaction businesses (e-commerce, restaurants)
- Average Revenue Per User (ARPU): For subscription businesses, measured monthly or annually
How to calculate:
AOV: Total revenue / Number of ordersARPU: Total revenue / Number of active customers (in a given period)
Why it matters: Increasing average revenue per customer is often the fastest path to growth because you’re extracting more value from customers you’ve already acquired. Raising AOV from $50 to $60 increases revenue by 20% without spending another dollar on marketing.


