The gap between analyzing data and taking action
You’ve automated data collection, learned how to clean and combine information from different sources, and created a data delivery system that works for your team. Your dashboards look smart, and you check them often. Yet decisions still take forever to make.
It’s not that you don’t have enough information, expertise, or the right tools. What’s missing is the ability to move quickly from insight → action. This isn’t a unique problem – in fact, plenty of data-driven businesses are dealing with it right now:
- According to a McKinsey survey, 48% of businesses struggle to make fast decisions, even when they have lots of relevant data to work with.
- Oracle’s global study revealed that 72% of people avoid taking action due to overwhelming and unreliable data.
- In the same Oracle study, 77% admitted that their analytics dashboards don’t connect to the decisions they need to make.
‘Analysis paralysis’ typically happens when we build analytics for reporting rather than decision-making. So how can you avoid getting stuck? It’s about creating a repeatable process to turn insights into action plans and tangible improvements. This is the main idea behind a continuous optimization loop.
What the continuous optimization loop looks like in practice
A closed-loop approach to marketing data analytics can be broken down into six parts.

Let’s explore what needs to be done at each stage of the cycle.
1. Consolidate and organize disconnected data. Your marketing data lives in dozens of different locations: social media platforms, email marketing tools, CRMs, web analytics tools, etc. The first step is to unify information from these sources into centralized data flows. This will let you spot gaps and opportunities in your strategies more easily.
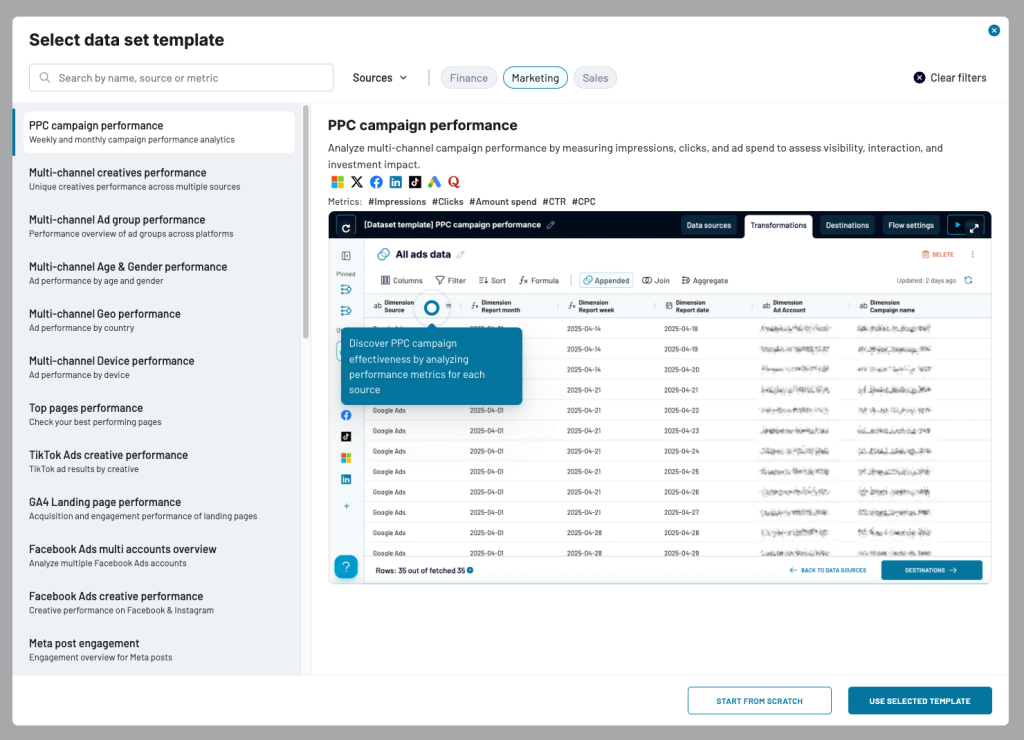
In Coupler.io, you can use data set templates (shown below) to quickly gather and organize data from different sources, or create custom data sets from scratch. Building from scratch allows you to blend data from multiple business apps – HubSpot, GA4, LinkedIn + 230 more – and design reports with custom fields, metrics, and aggregations.
2. Analyze to find actionable insights. Use dashboards and/or AI tools to identify patterns, correlations, or anomalies in your data. Focus on key performance metrics (e.g., clicks, CTR, website traffic, session duration) that you can influence through campaign adjustments or strategy pivots.
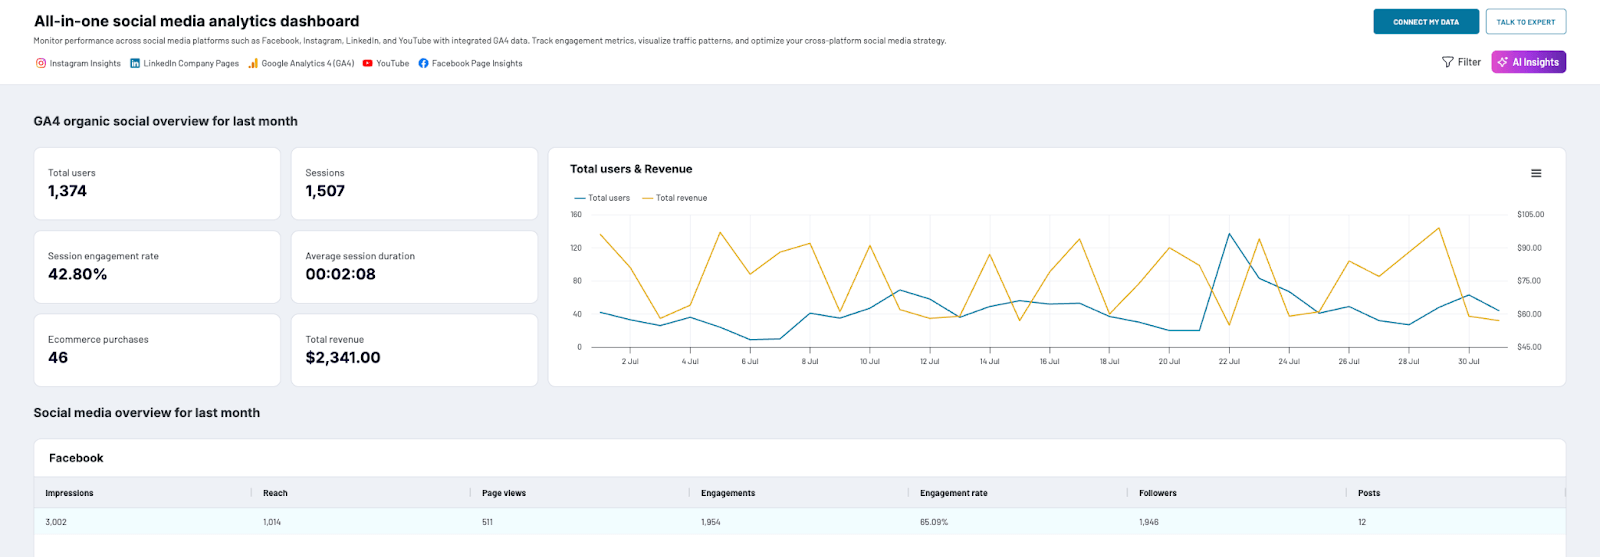
Here’s an example of consolidated social media and GA4 data in the All-in-one social media analytics dashboard by Coupler.io.
3. Make informed decisions by connecting your analysis outcomes to potential solutions. At this point, the team makes next-step decisions and sets success criteria with numbers and deadlines. Different specialists are assigned the responsibility to implement the changes.
4. Execute optimizations. This might involve updating landing page copy, adjusting budget allocation between channels, creating new email sequences, or launching variants of underperforming video ads.
5. Measure results. After a set period, check whether your optimizations hit the targets you defined earlier in the cycle. You should compare the before and after performance using the same metrics. For instance, 1 month ago, you adjusted your ad targeting in response to a low click-through rate. Has it led to a 20% increase in CTR as expected?
6. Iterate and feed your learnings back into strategy. Determine what worked and didn’t work about your optimizations. Then, use this knowledge to make further strategic changes, e.g., launch a new creative based on the refined targeting parameters and see how it affects CTR. If your initial optimization was successful, apply these learnings to similar campaigns or channels.
Key approaches for ‘closing the loop’ in marketing analytics
We’ve talked in broad terms about the process of turning insights into action. But let’s explore a few practical approaches you can implement at different stages to make faster, better decisions.
Ask questions that lead to action
It’s important to structure your analytics around decisions, not status updates. Your goal isn’t just to check how a campaign performed; it’s to understand what did or didn’t work and determine which strategies to scale, adapt, or experiment with. Focus less on ‘Why exactly did this happen?’, and more on ‘What do we do next?’
For instance, here are a few action-oriented questions to ask when analyzing different aspects of marketing performance:
- Instagram CPM keeps rising, but TikTok is showing lower costs for similar audiences → Do TikTok conversions result in the same customer retention and repeat purchase behavior as Instagram?
- Blog content consistently generates more qualified leads than paid ads → Which topics/formats are driving the highest-quality traffic, and how can we scale this approach?
- Our pricing page has a much higher bounce rate than other pages where prospects evaluate our solution → Where do visitors come from before bouncing? Are there patterns by customer segment or traffic source?
The right dashboards enable you to craft better questions or even generate answers upfront. Later on, you’ll find a practical example of how AI-powered reports can help you close the loop faster.
Focus on optimization-critical campaign metrics
Prioritize metrics that influence your decisions about budget allocation or creative optimizations. For example, if you are analyzing paid ads performance, you should focus on CPC and CTR over metrics like reach, new followers, or post shares.
It’s not that you shouldn’t pay attention to engagement and account growth. But these types of metrics rarely translate into specific actions you can take to improve performance. When you have limited time or resources, it’s better to optimize channel spend, web conversions, and audience targeting parameters that directly impact your bottom line.
Run small experiments and iterate based on results
Experimentation in marketing is nothing new, but it’s especially valuable when you’re uncertain about your next move. Instead of going all-in on a strategic optimization, try running small tests to validate your assumptions first.
For example, before investing $3,000 into a guest post campaign targeting a new audience segment, test it with a budget of $500 first. Instead of redesigning a low-converting landing page, experiment with fresh CTAs and messaging to see if anything changes.
Set up continuous, automated reporting
Manual reporting processes consume time that could be better spent on strategy and analysis. When you have round-the-clock access to performance dashboards with fresh data, it’s easier to stay on top of your results and make decisions quickly.
Automated reports or dashboards typically have several useful features that simplify analytics workflows. For instance, when you create automated reports with Coupler.io, it means:
- You only need to connect your data sources once. No need to export files or create new reports every time you want to analyze performance.
- You can view consolidated data in a single screen, rather than searching for insights across multiple tools (GA4, YouTube Analytics, etc.)
- Your data refreshes automatically on a pre-defined schedule – hourly, daily, weekly, up to every 15 minutes.
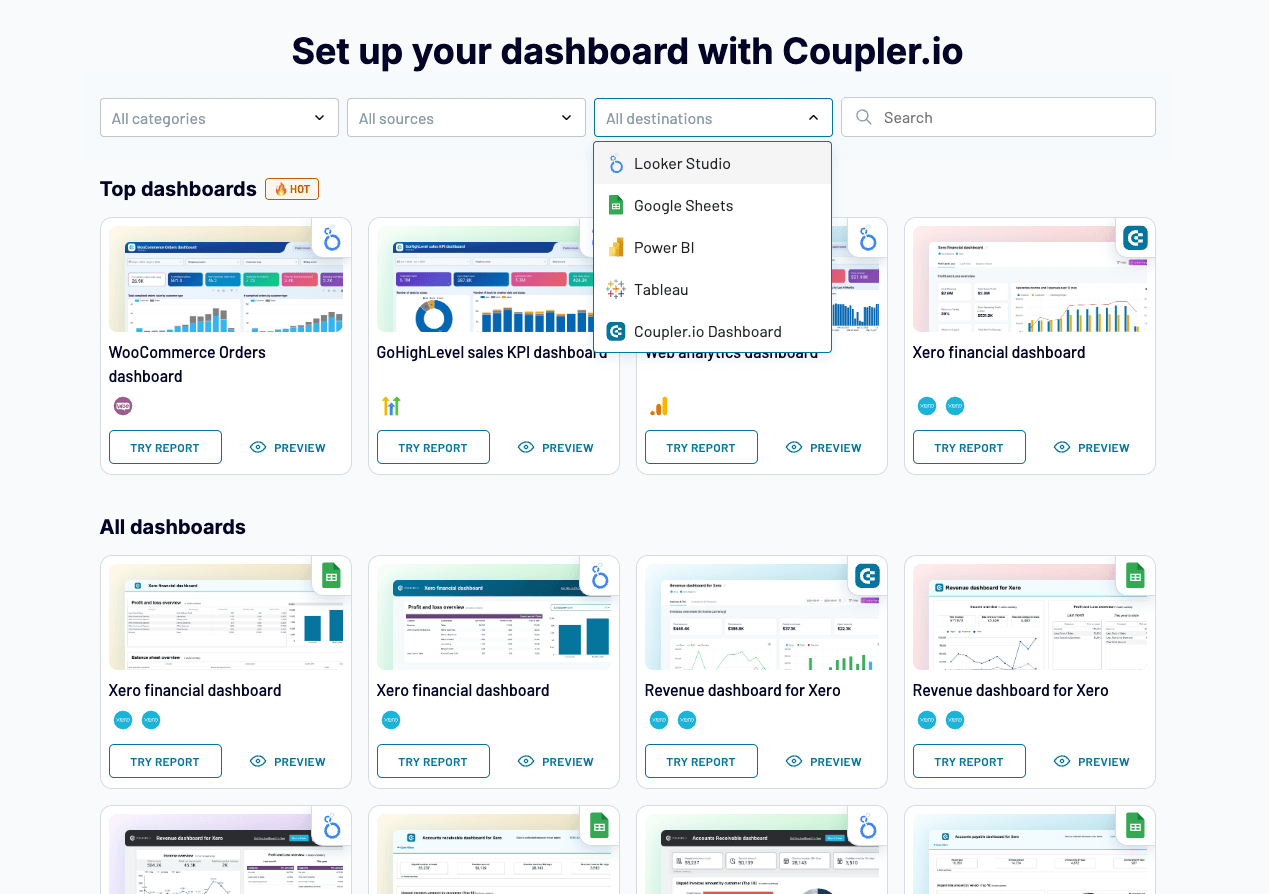
To set up continuous reporting, you can either design from scratch or start with a template. Coupler.io makes it easy by offering a selection of 160+ dashboard templates with pre-chosen metrics and ready-made visualizations. It takes less than 5 minutes to connect your data and start analyzing performance in tools like Looker Studio, Google Sheets, Power BI, etc.
Set up your dashboard with Coupler.io
 Try for free
Set up your dashboard with Coupler.io
Try for freeMethods for measuring the impact of data-driven decisions
How can you know if your decisions are making a meaningful difference? It’s easy to say ‘follow the numbers in Meta Ads or HubSpot,’ but campaign-level data only tells part of the story. Here are a few ways to manage expectations and measure the business impact of your results:
Set quantifiable objectives from the start
Before implementing any major optimization, define success criteria with clear, quantifiable metrics. Instead of a vague goal like ‘improve lead gen performance on LinkedIn by the end of the month’, set concrete targets like ‘increase lead volume by 25% while maintaining a cost-per-lead below $75.’
This specificity leaves little room for confusion or decision-making delays among the team. It also helps you measure the true impact of your results and take action if they fall short of the mark.
Track business-focused KPIs
While it’s important to measure the results of your campaigns, it won’t give you the full picture of marketing impact. For that, you need to assess how your decisions to ‘scale up video production on TikTok’ or ‘invest ⅓ of the budget in automated paid advertising’ have led to improved business outcomes. For instance, you can track KPIs like:
- Revenue. Monitor sales/subscriptions by channel to understand how your marketing efforts translate to revenue. If a new TikTok series generates $5000 in MRR despite having lower views and engagement than expected, that’s a win.
- Team efficiency. Measure how process improvements have boosted productivity or saved time. For example, if marketing reporting cost you 40 hours a month before automation, and now your team only spends a couple of hours a week on the task, you’ve freed up 30+ hours for higher-value work.
- Decision speed and quality. Faster, better-informed decisions compound over time. When you identify a winning ad creative in 3 days instead of 2 weeks, or reduce budget reallocation time from 1 month to 1 week, those improvements add up significantly.
Compare with industry benchmarks
Benchmarking provides a sense of direction when you’re unsure about optimization outcomes. It helps you gauge whether your results are competitive or if there’s still room for improvement, so you can prioritize next steps. Here are just a few examples of 2025 benchmarks for different marketing channels:
- Videos under 1 minute are watched for an average of 16 seconds, whereas 60+ minute videos retain viewers for an average of 16 minutes and 40 seconds.
- B2B brands running email marketing campaigns can expect an average conversion rate of 2.4%; it’s slightly higher for B2C brands at 2.8%.
- The average website engagement rate across industries stands at 56%.
- Google Ads click-through rates average 6.6% across industries, while Facebook Ads see a lower CTR at 2.5%.
Keep in mind that benchmarking isn’t a reliable way to validate all of your decisions. What works for your business might not work for others, so don’t put too much stock into industry averages.
Practical example: Optimizing the customer journey with integrated marketing insights
The challenge
Let’s look at an example of a B2B SaaS company that runs marketing campaigns across multiple channels: paid advertising, email marketing, and content marketing. Each channel appears to perform well in isolation. Their emails receive steady opens, ads bring in thousands of impressions, and blog content drives consistent traffic.
However, something about their marketing strategy isn’t working. Despite all of this engagement, website visitors aren’t sufficiently converting into paying customers. On top of that, the team is spending too much on marketing projects across channels, but they aren’t sure which ones deliver the highest business ROI.
Here’s how continuous optimization loop approaches can be applied to this case:
Step 1: Consolidate
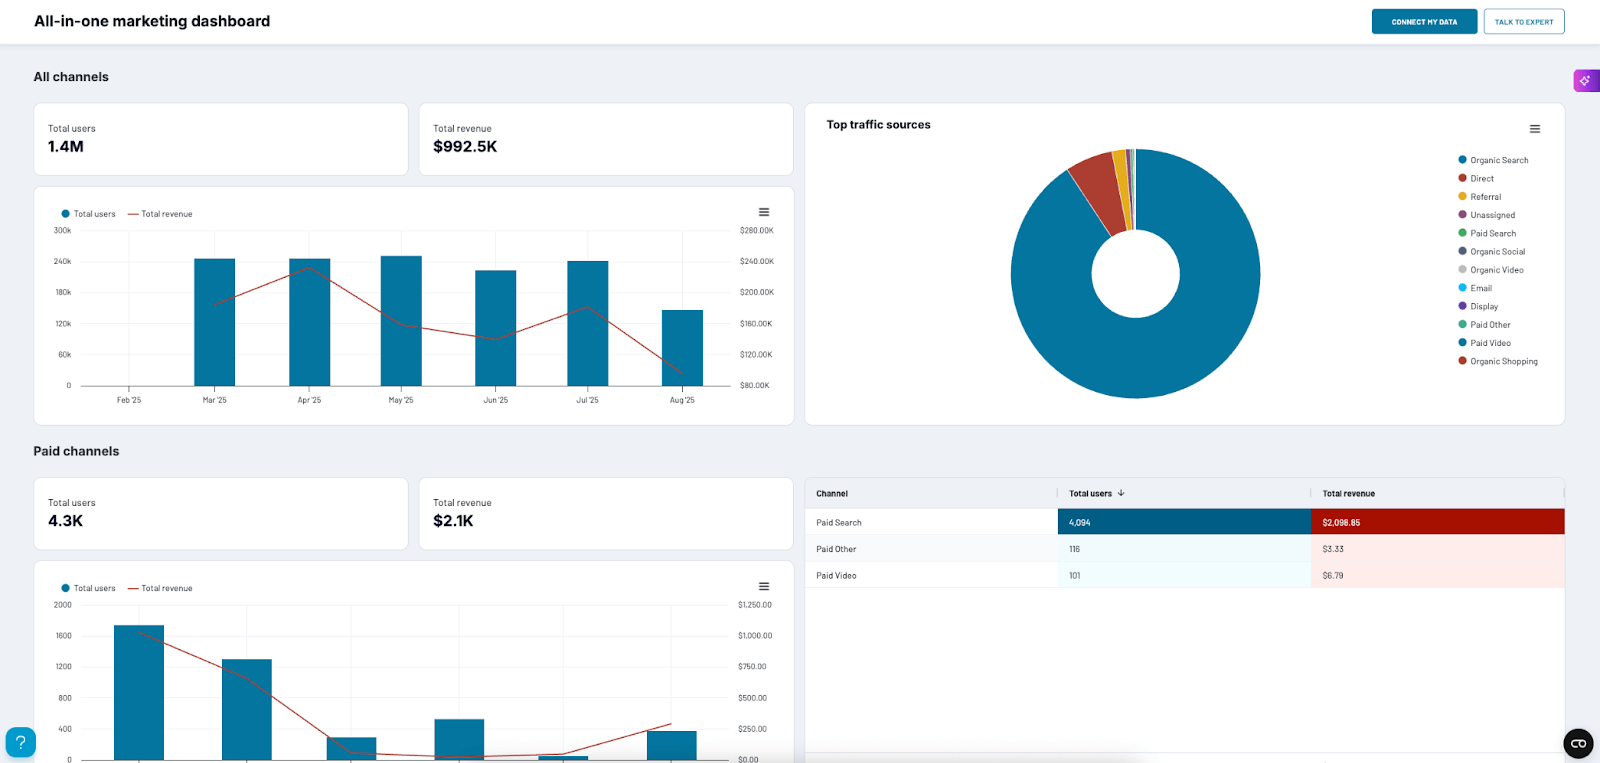
The team first needs to gather and aggregate data from different channels to build the full picture of marketing performance. This involves connecting their sources ( data from Google Ads, Meta Ads, Google Analytics 4, Google Search Console, Mailchimp, and YouTube) to a centralized dashboard.
They could use the All-in-one marketing dashboard by Coupler.io to view everything on a single page. The dashboard is divided by channel – paid, organic search, email – so they can easily compare performance.
Step 2: Analyze
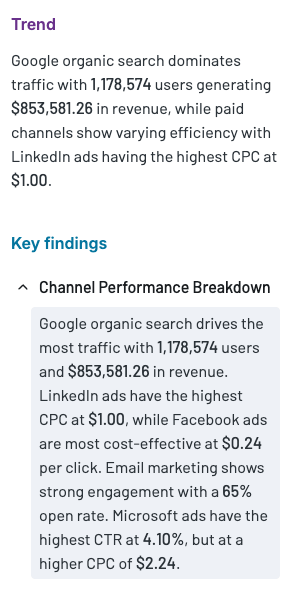
With consolidated data, the team is better able to spot patterns, trends, and opportunities for improvement. They can speed up analysis by using a built-in feature of the All-in-one marketing dashboard – AI Insights by Coupler.io. This provides a one-click summary of trends, findings, and recommendations based on the dashboard data. In less than 20 seconds, they can get insights like:
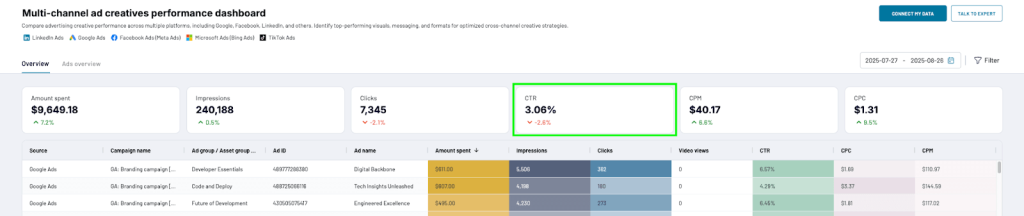
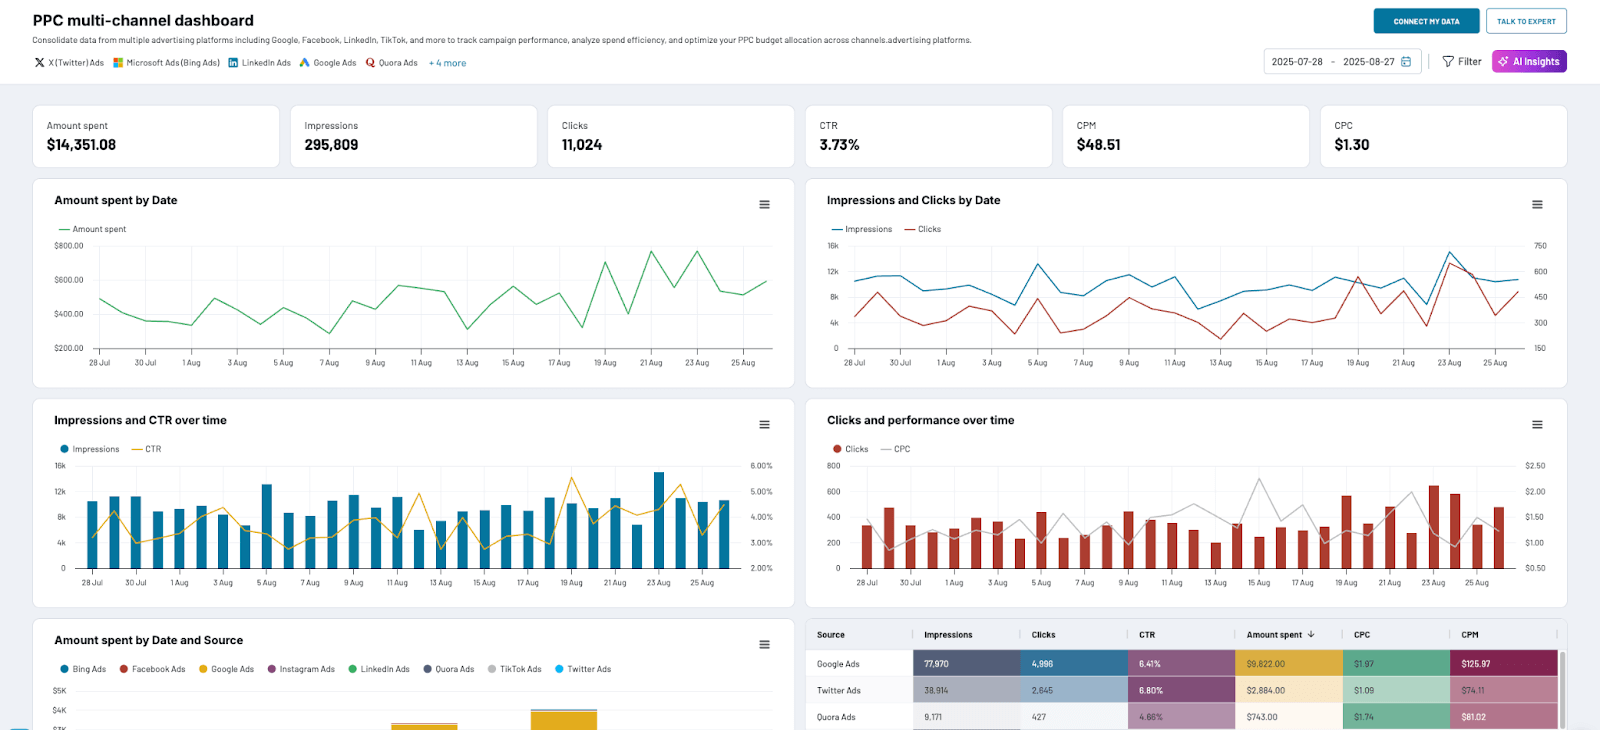
The team may also consult other specialized dashboards to dive deeper into data from each channel or platform. PPC multi-channel dashboard (also equipped with AI Insights) can help them identify specific platforms – LinkedIn, TikTok, etc. – that generate valuable web traffic.
AI integrations allow you to go further and talk to your data, i.e., ask for advice or performance-related questions in plain English. You can read more about its benefits and limitations in this guide to AI data analytics.
Step 3: Decide
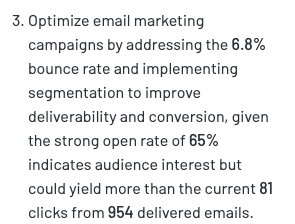
Based on the analysis results, the team identified three specific optimization opportunities and set measurable targets. The Top Recommendations element of AI Insights also guided what to do next. Here’s a snippet:
The decisions were to:
- Shift 20% of LinkedIn ad budget to Facebook Ads to lower CPC by 15% and capture more top-of-funnel prospects for nurturing.
- Boost email conversions by 15% using product recommendations and time-sensitive offers.
- Increase blog-to-lead (sign-up) conversion rate by 20% in the next quarter by adding personalized offers and targeted CTAs.
Step 4: Execute
The team implemented their targeted optimizations over the next few days. They allocated more budget to Facebook Ads campaigns, reduced investment in LinkedIn, created an email campaign with time-limited offers, and added pop-ups and special promotions to blog content geared towards particular audience segments.
Step 5: Measure
Using the same centralized dashboards, the team tracked the results of their optimizations over a set period. They compared changes in clicks, CTR, and CPC, email conversions, and website lead generation against the previous week/months to understand what worked. In a nutshell:
- Average CPC reduced by 10%, although there was no significant increase in the number of qualified leads captured from Facebook.
- Email conversion rate improved by 20%, partly due to the success of a Black Friday deal campaign.
- Sign-ups from the blog increased by 8% since adding personalized offers for specific visitor segments.
Step 6: Iterate
At this point, the team has a much better understanding of what’s motivating prospects to convert. They have identified the channels that bring valuable leads and pinpointed the type of content that drives conversion.
However, they can also see where their efforts fell short. Some targets weren’t met within the allotted time, indicating that those optimizations need refinement, further analysis, or a new approach. So the optimization loop continues.
While the above scenario was fictional, plenty of real B2B companies have seen success by implementing similar closed-loop approaches. Coupler.io has helped different marketing clients save up to 80 hours per month on reporting, lower product churn rates, and retain 2.5 times more customers.
How advances in marketing analytics are shortening decision cycles
The gap between collecting data and acting on it is shrinking fast. Nowadays, marketers are using various tools to not only automate the data pipeline but to streamline the decision-making process itself. Here’s what’s contributing to that shift:
AI-powered decisions
The most advanced teams are using AI to uncover insights that human-only analysis can’t catch. Instead of spending an hour examining graphs and correlations between different metrics, creatives, or audience segments, AI tools do it for you in seconds. Not only can they analyze data – they can also suggest specific optimizations and recommend next steps (as we showed earlier with AI Insights by Coupler.io).
At the next level, integrating your data with a tool like Claude or ChatGPT allows you to ask complex questions about performance and get immediate, in-depth answers.
For instance, you can ask, ‘What’s the reason for our 20% drop in organic traffic over the past 2 months?’, receive a detailed analysis in seconds, and ask follow-up questions to shape a decision. The example below shows how this works when you create an AI integration (in this case, Claude) with Coupler.io:
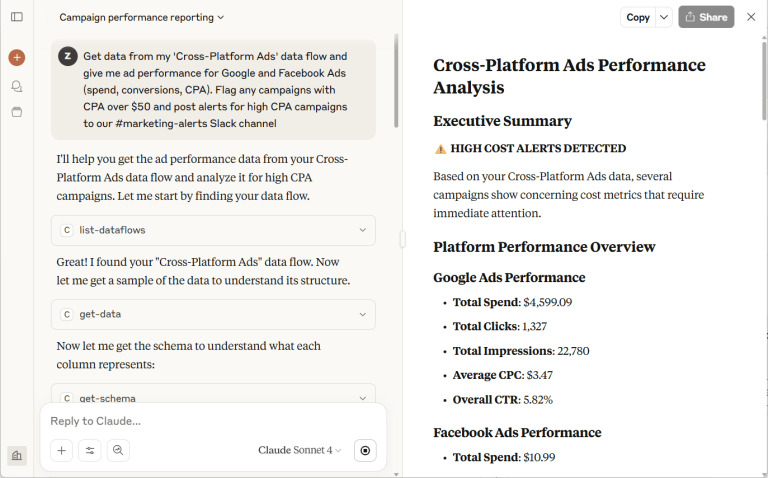
A balanced approach works best here. Remember: AI provides insights that help speed up decision cycles, but human judgment is essential for making the final call.

Integrate your data with AI for conversational analytics
Try Coupler.io for freeAlways-on optimization
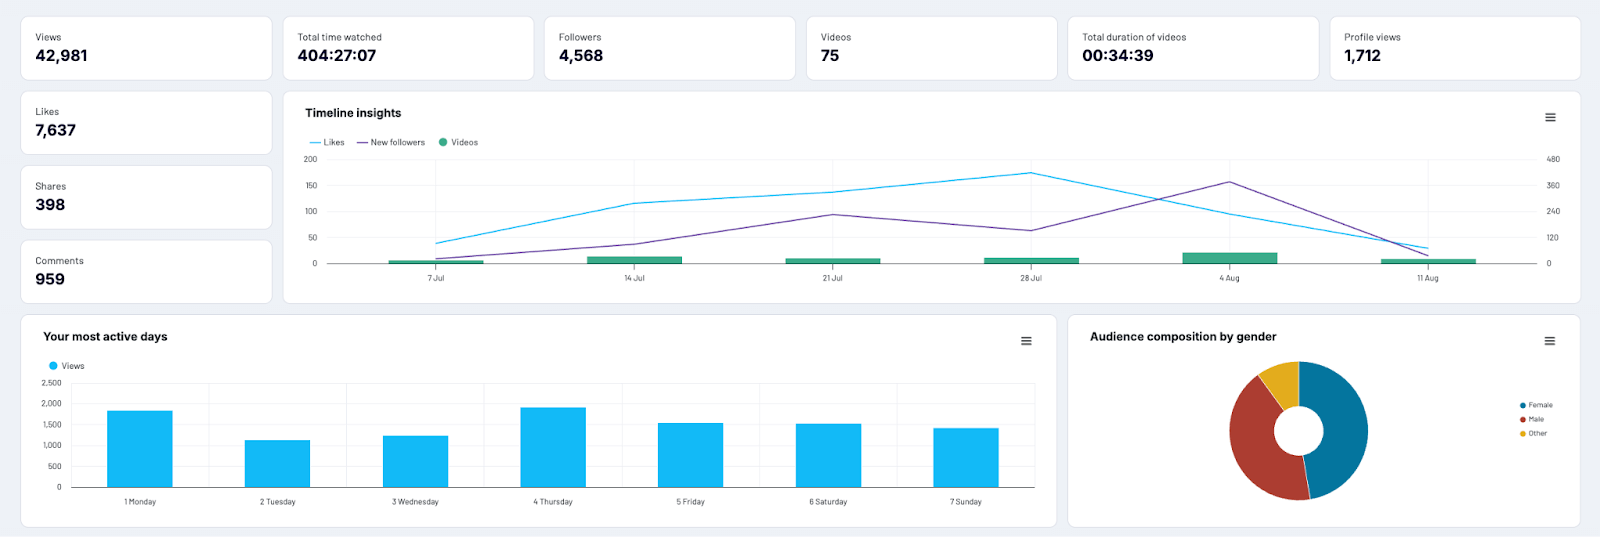
As we mentioned earlier, teams with access to real-time dashboards and AI tools can optimize continuously, instead of waiting for reports to reveal what went wrong weeks after the fact.
A social media manager who checks their TikTok analytics dashboard daily is better equipped to catch dips in metrics like views and time watched – signs that their latest videos aren’t resonating with followers. They can adjust campaign strategy in near real-time to prevent further losses.
Predictive analytics
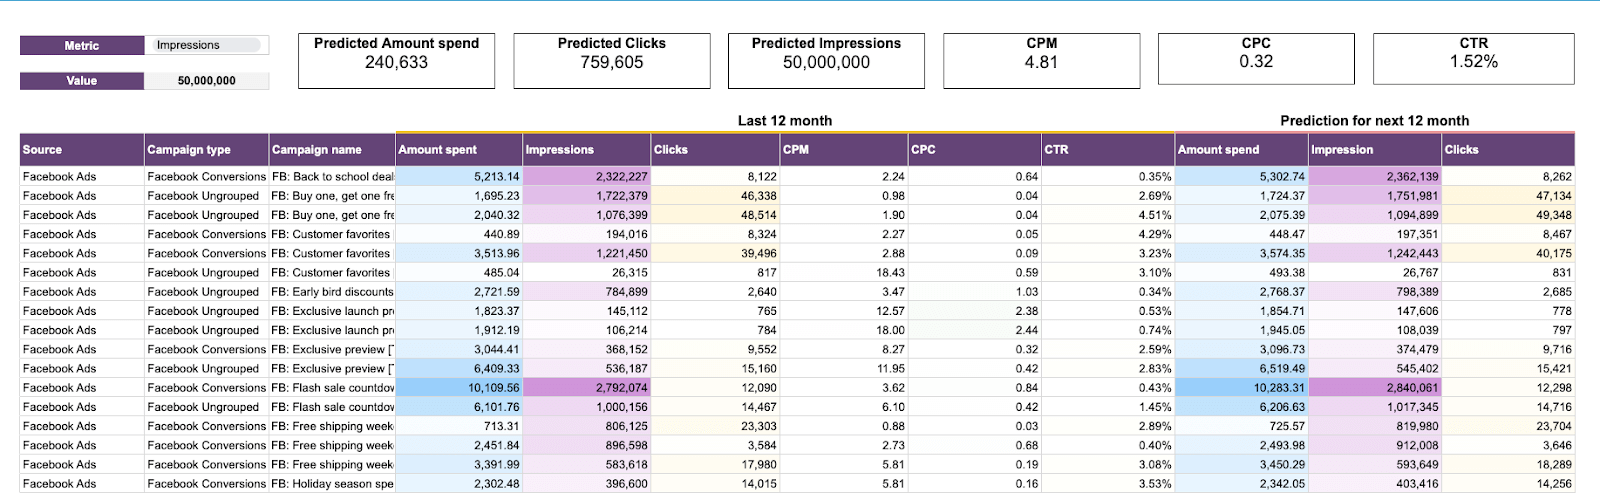
Predictive analytics uses your historical data to forecast budget, campaign, and audience outcomes. It’s a valuable tool or dashboard feature that allows you to make strategic pivots before performance issues can impact your bottom line.
For instance, with this Advertising budget forecast dashboard, you can estimate campaign spend and engagement for the next 12 months based on results from the past 12 months. If certain predicted outcomes are too high or low, you’ll have an opportunity to adjust your approach and optimize the results (e.g., 30% lower spending on campaigns that bring fewer clicks).
Advertising budget forecast dashboard in Google Sheets
 Preview dashboard
Advertising budget forecast dashboard in Google Sheets
Preview dashboardLike any data-driven tool, predictive analytics is only as reliable as the information it has to work with. Whether you do it with specialized dashboards, AI agents, or purpose-built platforms, it’s critical to ensure your historical data is accurate and complete.
The first step to creating an optimization loop that works for your team? Connecting your data across different sources, building dashboards that make sense, and making the most of AI features and integrations. Coupler.io helps you do all of this and more. Get started for free in under 5 minutes – no credit card required.