Data is king. However, true power lies in processing and analyzing the data to generate insights that ultimately lead to better decisions on future strategies.
This blog post explains what marketing data analytics is, its challenges, steps, and tools. We’ll also explore how it works and how to use it to improve your business results.
How can data analytics improve marketing strategy?
What gets measured, gets improved.
This principle holds true for marketing data analytics too. It helps businesses analyze huge amounts of data and come up with insights that can make marketing strategies more effective, targeted, and responsive.
Now, let’s see how data analytics actually helps in improving your marketing strategy.
- Increases conversion rates with personalization: Most marketing campaigns aim to boost conversions. One way to do this is by creating personalized content that aligns closely with the target audience’s interests. 90% of professional marketers attributed personalized marketing to greater business profits.
Using customer data, marketing analytics comes with unique insights about preferences, behaviors, and buying habits. For example, if a customer searches for a moisturizer and then immediately sees an ad for one, the likelihood of making a purchase significantly increases.
- Increased marketing productivity: By leveraging data analytics in marketing, businesses can streamline their marketing processes and make them more efficient. Analytics tools can automate the collection and analysis of data, freeing up marketing teams to focus on strategy and creative tasks rather than manual data handling.
For example, Clarityseed, a digital data-driven marketing agency used Coupler.io to automate their data integration and reporting. Now, they save 40 valuable hours every month on marketing reporting.
- Improved customer retention: Research shows that a 5% increase in customer retention rates can boost profits from 25% to 95%. Data analytics helps in recognizing what drives customer loyalty and identifying potential churn risks. By analyzing customer interactions, feedback, and purchase history, you can identify areas of improvement in your products, services, and the overall customer experience. Ultimately, data analytics increases profits by improving customer retention.
- ROI measurement: One of the key advantages of data analytics is to accurately measure the return on investment (ROI) of marketing campaigns. By tracking metrics such as click-through rates, conversion rates, and customer acquisition costs, businesses can clearly understand which marketing efforts are paying off.
How to use data analytics in marketing
Even though marketing data analytics sounds complicated, it consists of only 4 major steps: collect, organize, visualize, and act.
Step 1: Collect data
Making sense of your marketing performance starts with collecting data from relevant sources. But doing this manually is tedious, time-consuming, and prone to error. That’s why it’s important to automate data collection from the get-go.
The most efficient way to manage this process is with marketing data integration platforms like Coupler.io. It offers over 100 marketing data connectors, including PPC platforms (Google Ads, Facebook Ads, TikTok Ads, etc.), social media platforms (LinkedIn, YouTube, etc.), web analytics and SEO tools (GA4, Amplitude, Google Search Console), CRMs (Salesforce, HubSpot), email marketing platforms (Mailchimp, Klaviyo), and many, many more.
To get started with Coupler.io for free, choose your first source and preferred reporting destination in the form below and click Proceed.
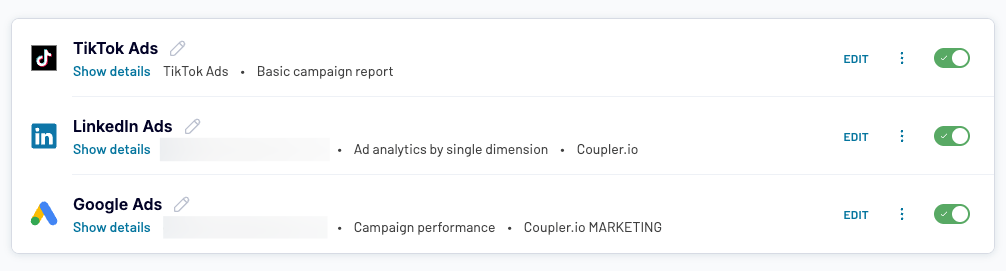
This will create an importer to collect data from your chosen marketing source and load it to destinations such as Google Sheets, Looker Studio, Power BI, Tableau, BigQuery, Excel, and other BI tools and data warehouses. You can add multiple sources to a single importer when your goal is to analyze data from interconnected channels.
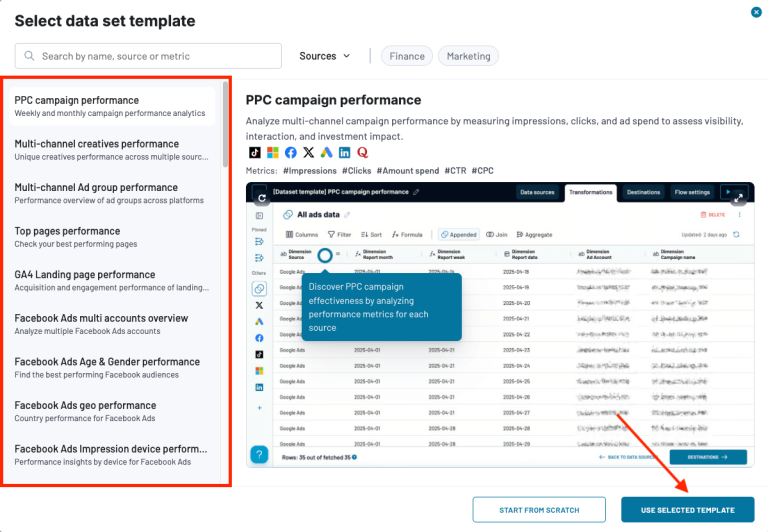
Data set templates are a handy tool if you already have a clear idea of the data you want to analyze, such as cross-channel PPC campaigns. These templates are out-of-the-box configurations of data sources, transformations (e.g., functions, aggregations), and key metrics that speed up the collection and preparation aspects of data analytics. You can choose a data set template when setting up a data flow from scratch.
Coupler.io ready-to-use connectors are based on APIs. At the same time, it allows you to create custom integrations with sales and marketing APIs.
Step 2: Organize and transform your data
Once all your data is collected, you need to make it analysis-ready. This step includes cleaning, transforming, and consolidating data from all your marketing sources. Coupler.io offers a range of options to organize your data:
- Manage columns – rename, reorder, or hide columns included in your imported datasets.
- Sort and filter – organize and refine your data based on criteria such as date (weekly/monthly summary), campaign name, traffic source, etc.
- Create new calculated columns – generate additional columns with custom formulas. For example, you could create a CTR column for your Facebook Ads data with the formula: CTR = (Clicks / Impressions).
- Join data from multiple sources – combine data from different platforms (e.g., CRMs, ad channels, web analytics) into a unified dataset using a shared metric or dimension such as campaign ID, email address, or date.
- Append data – merge data from similar sources with matching structures, such as performance data from Google Ads and Meta Ads.
- Aggregate data – use functions like sum, avg, count, min, or max to summarize and uncover trends or patterns in your data.
Even before you start transforming or calculating anything, it’s crucial to make sure your raw data is accurate, consistent, and complete. Here are a few measures you can take to properly prepare your data for analysis:
- Standardize naming conventions and formats: Align column names, metric labels, date formats, and units (e.g., currency, time zones) across all sources. Consistent naming – such as always using ‘cost per lead’ – prevents confusion and streamlines analysis.
- Automate data backups and track historical records: Create a data storage strategy and set up automated daily or weekly backups to protect your data from loss (platform outages, security breaches, etc.). Having access to historical data will allow you to analyze trends and seasonal patterns much more easily.
- Regularly review your data management approach: Periodically assess your data quality, synchronization settings, and storage capacity. Setting up alerts can help you quickly detect and address any problems before they impact your analytics.
You can find more tips and step-by-step advice in the guide to marketing data management.
Step 3: Visualize your data
The last step of marketing ETL involves loading your prepped data to a reporting destination for visualization. For instance, you may choose to create a basic report in a spreadsheet app like Excel or design an interactive, multi-layered dashboard in a specialized tool like Power BI.
Dashboards are one of the most important assets in data analytics, as they provide a framework for delving into marketing performance. With the right charts and graphs, you can effectively structure your data for analysis and understand what’s working and what needs improvement. We’ll introduce you to a few different dashboard examples in the next section. You can also find data visualization examples, best practices, and tool recommendations in this guide to marketing data visualization. With Coupler.io, you can also automate marketing reporting and analytics in Claude, ChatGPT, or other AI tools.
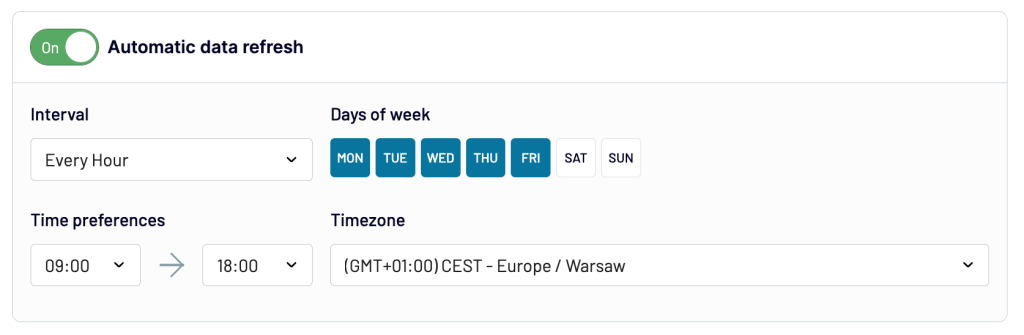
It’s also essential to make your report or dashboard self-updating. Coupler.io allows you to set up a refresh schedule so that your marketing data flows automatically to your reports as required. You can configure the interval frequency (every 15 minutes, once per week, etc.), time preferences (e.g., 9am-5pm), days of the week, and timezone.
Step 4: Act on your data
The final step in data analytics involves taking action based on insights from your reports. It’s not enough to track, monitor, and identify weaknesses in your strategies – you need to translate those findings into decisions that drive business results.
Now, that’s easier said than done. Analyzing data can be tricky when you don’t know what to look for or how performance relates to your marketing goals. But you can always use other tools besides visuals in your dashboard or reports to quickly make sense of your data.
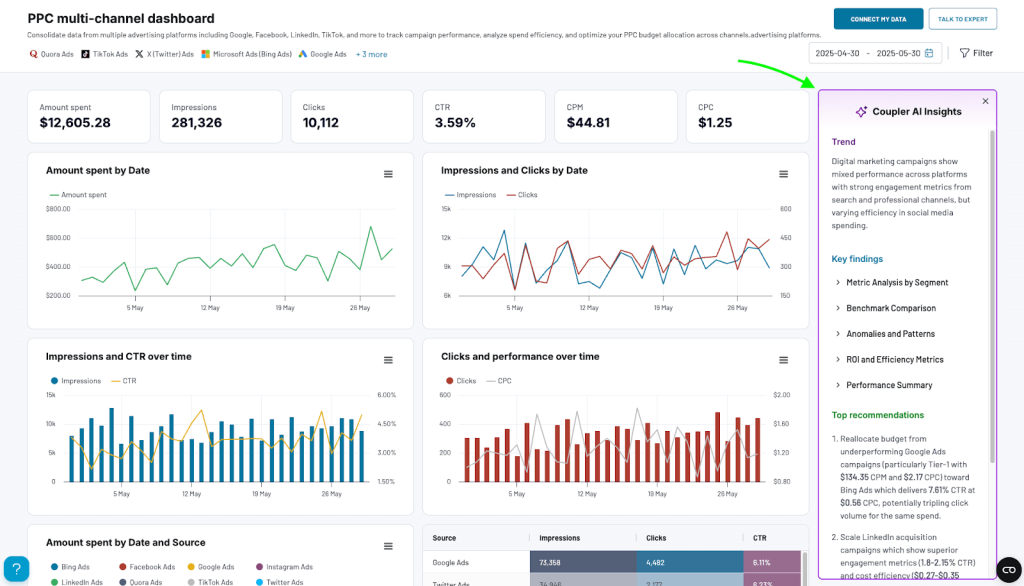
For example, AI Insights is an AI-powered feature available in Coupler.io marketing dashboard templates. It provides a summary of key trends, opportunities, and anomalies in your data, helping you identify problem areas and potential solutions. This way, you don’t have to spend hours on data analytics for different marketing contexts. You can get answers in seconds and use those insights to make decisions about the next steps.
MCP servers are also excellent resources for marketing data analytics, allowing you to query data in a conversational AI interface. For instance, Coupler.io MCP server lets you connect your dashboard data to Claude and ask natural-language questions, such as ‘What campaigns had the highest ROI last month?’ or ‘Which Facebook campaigns consistently generate the highest number of leads?’. Explore other MCP use cases for data analysis across industries.
As conversational AI becomes more prevalent in marketing, a natural debate emerges: will LLMs replace dashboards? In practice, marketers need both:
- Visual dashboards to scan campaign metrics, spot anomalies, and compare channel performance in seconds.
- LLMs to dig into specific questions, explain unexpected drops in CTR, or surface patterns that aren’t immediately visible in charts.
Think of dashboards as your monitoring system and LLMs as your on-demand analyst. The winning approach combines visual oversight with conversational depth. You can streamline data analytics and try all of these features for yourself in the Coupler.io app.
Data analytics in marketing – examples of dashboards and reports
To effectively analyze marketing data, you need to track and visualize it in dashboards or reports. However, building these from scratch can be difficult and time-consuming, especially when you need to visualize data from multiple marketing channels like Google Ads, Facebook Ads, GA4, Google Search Console, and more.
Coupler.io’s 150+ dashboard templates help you get started quickly with data analytics. Here is a selection:
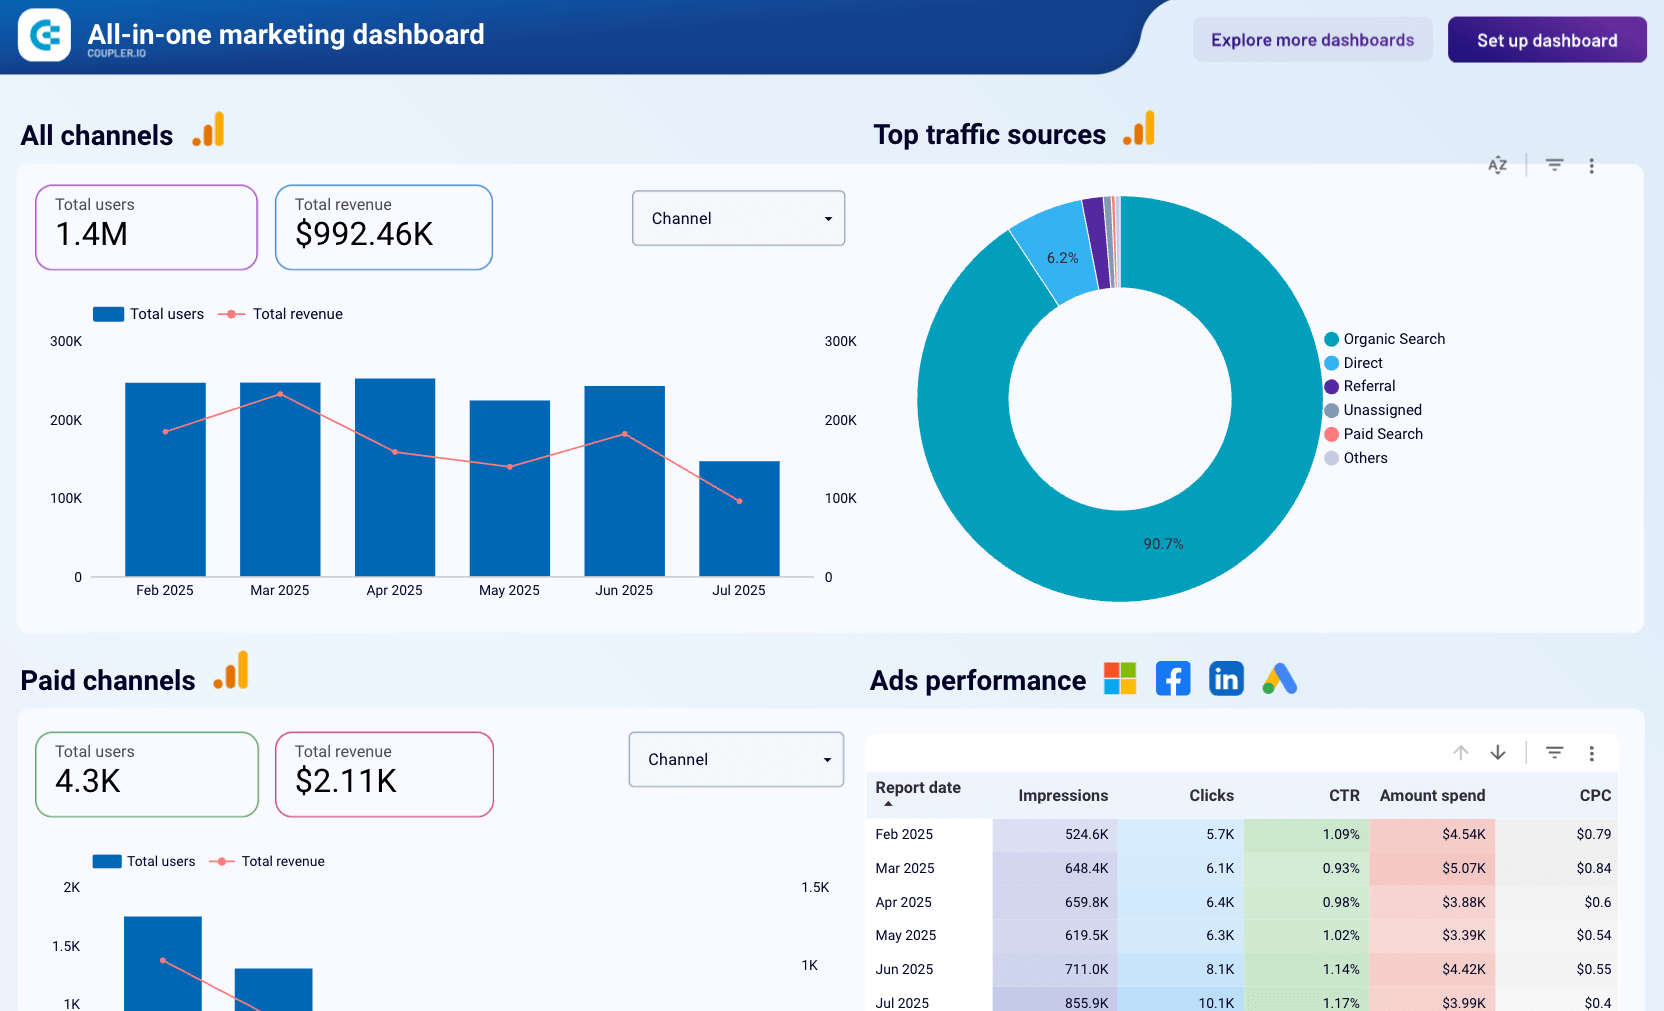
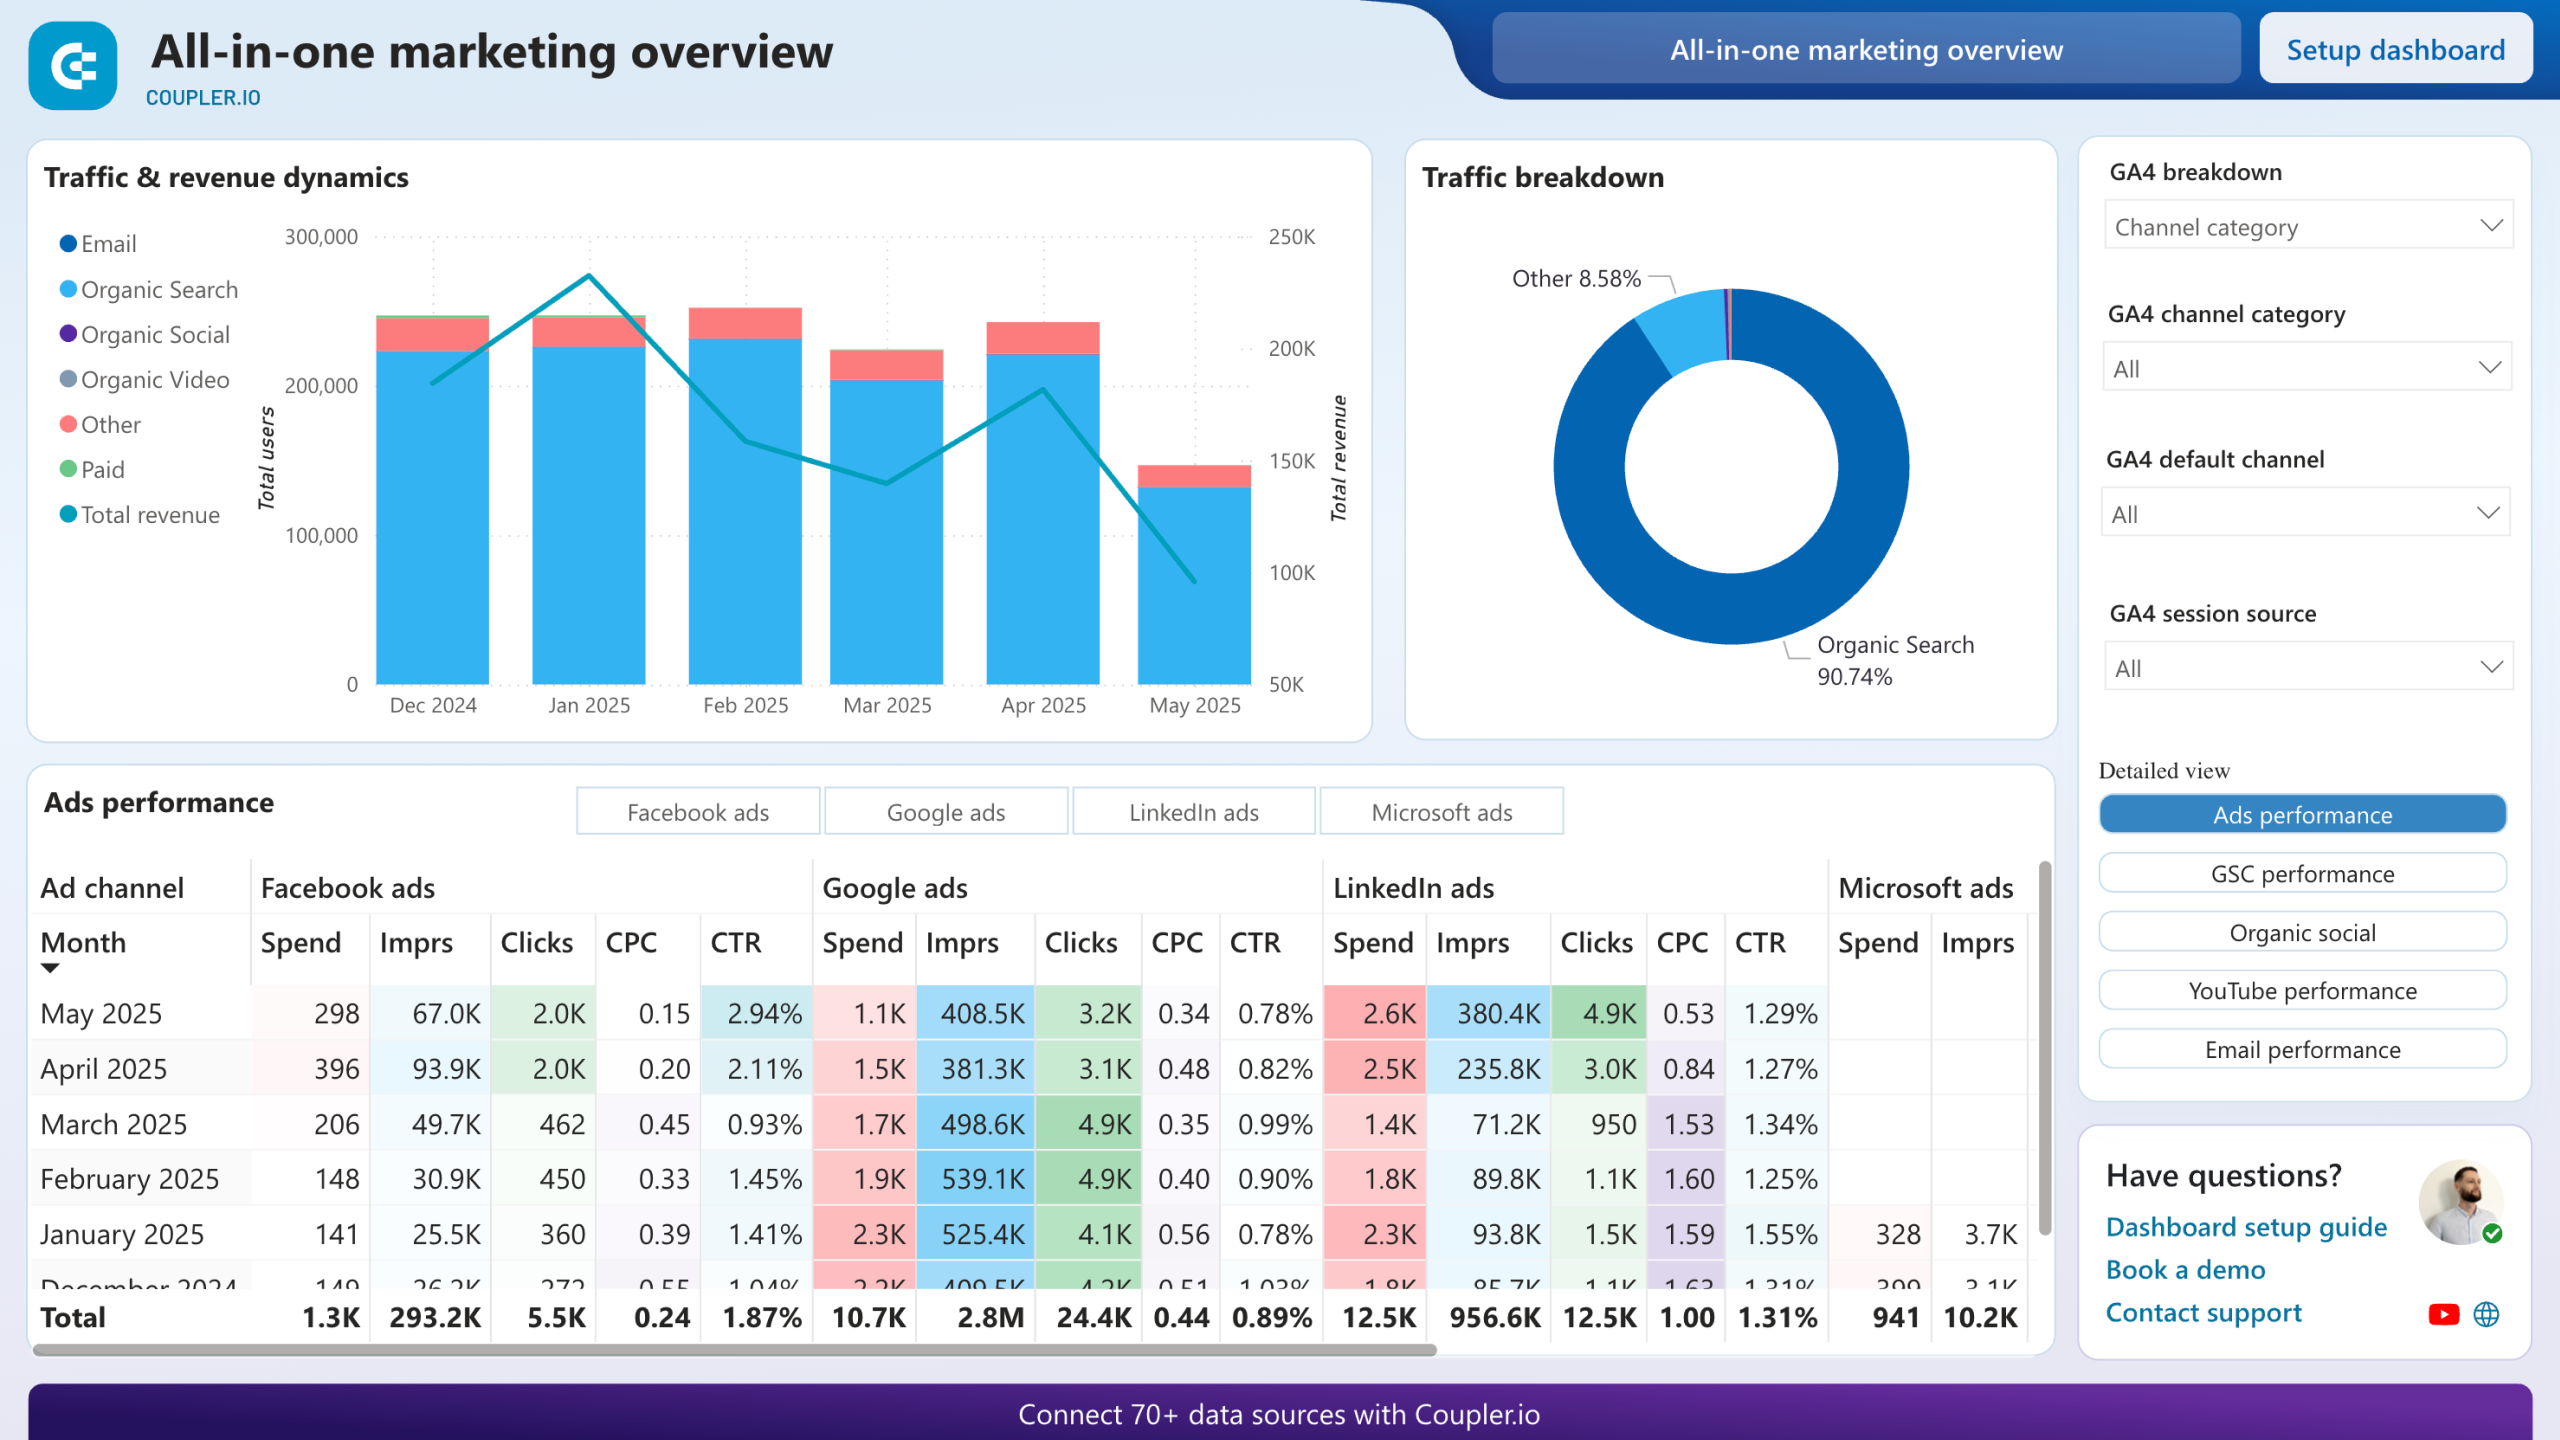
All-in-one marketing dashboard template
This dashboard is the perfect solution for marketers who need a complete view of their marketing performance across all channels. You can connect data from your key marketing platforms, including Facebook, Google Ads, LinkedIn, Mailchimp, Instagram, and GA4. Track traffic sources, compare ad results, and monitor the effectiveness of your video and email campaigns all from a single, comprehensive interface.
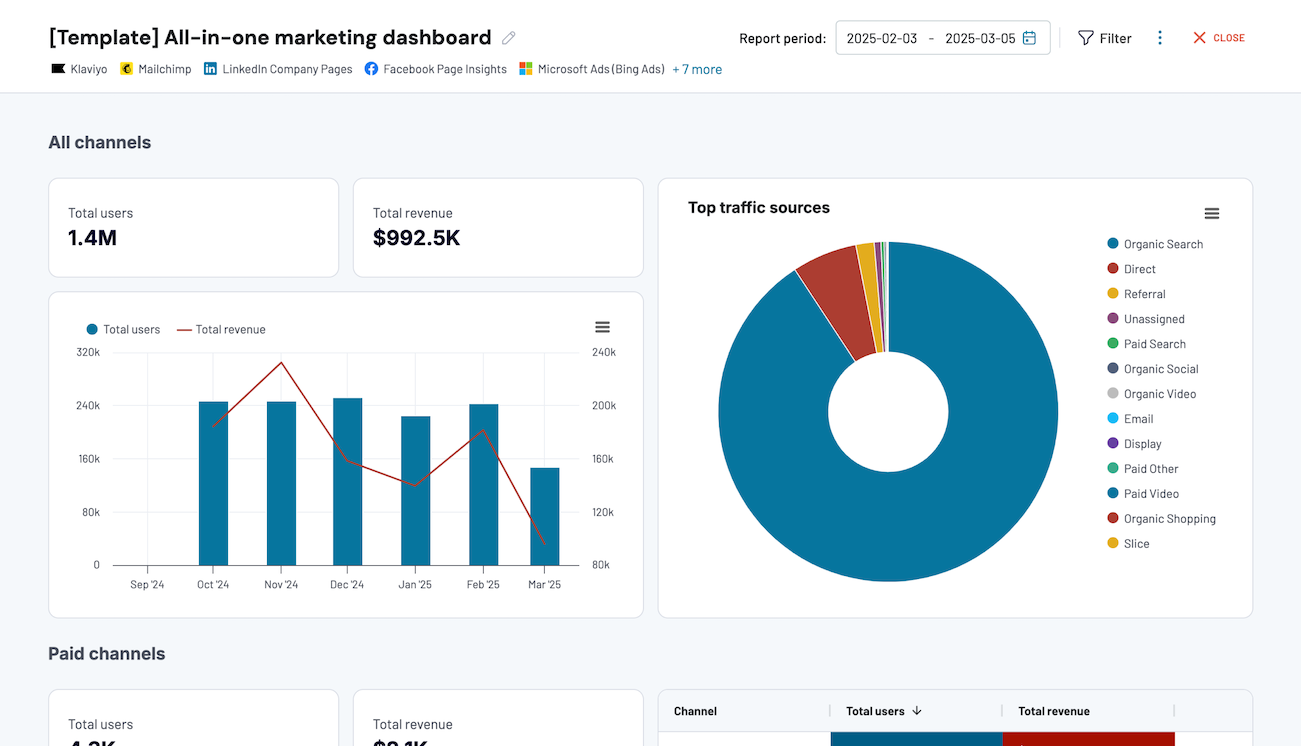
What you can do with this dashboard:
- View how each marketing channel contributes to your overall traffic with detailed breakdowns to identify your top-performing sources.
- Monitor spend, impressions, clicks, CPC, and CTR across Google Ads, LinkedIn Ads, and other PPC platforms to optimize your ad budget.
- Track search impressions, clicks, CTR, and rankings from Google Search Console with filtering by search engine source. Use this information to improve your SEO strategy.
- Analyze impressions and page views across all social platforms. Filter by source to pinpoint your best-performing channels.
- Measure video views, watch time, and engagement metrics to assess your video marketing impact.
- Track delivery rates, open rates, bounces, unsubscribes, and clicks from Klaviyo and Mailchimp campaigns to find opportunities for email optimization.
A template is available for three different tools: Coupler.io, Looker Studio, and Power BI. The Coupler.io version of the dashboard is equipped with AI Insights, the AI-powered feature we mentioned earlier.
To create a copy of the template for any tool, simply sign up for Coupler.io for free. It takes less than 5 minutes to load data from your marketing platforms and set up automatic data refresh.


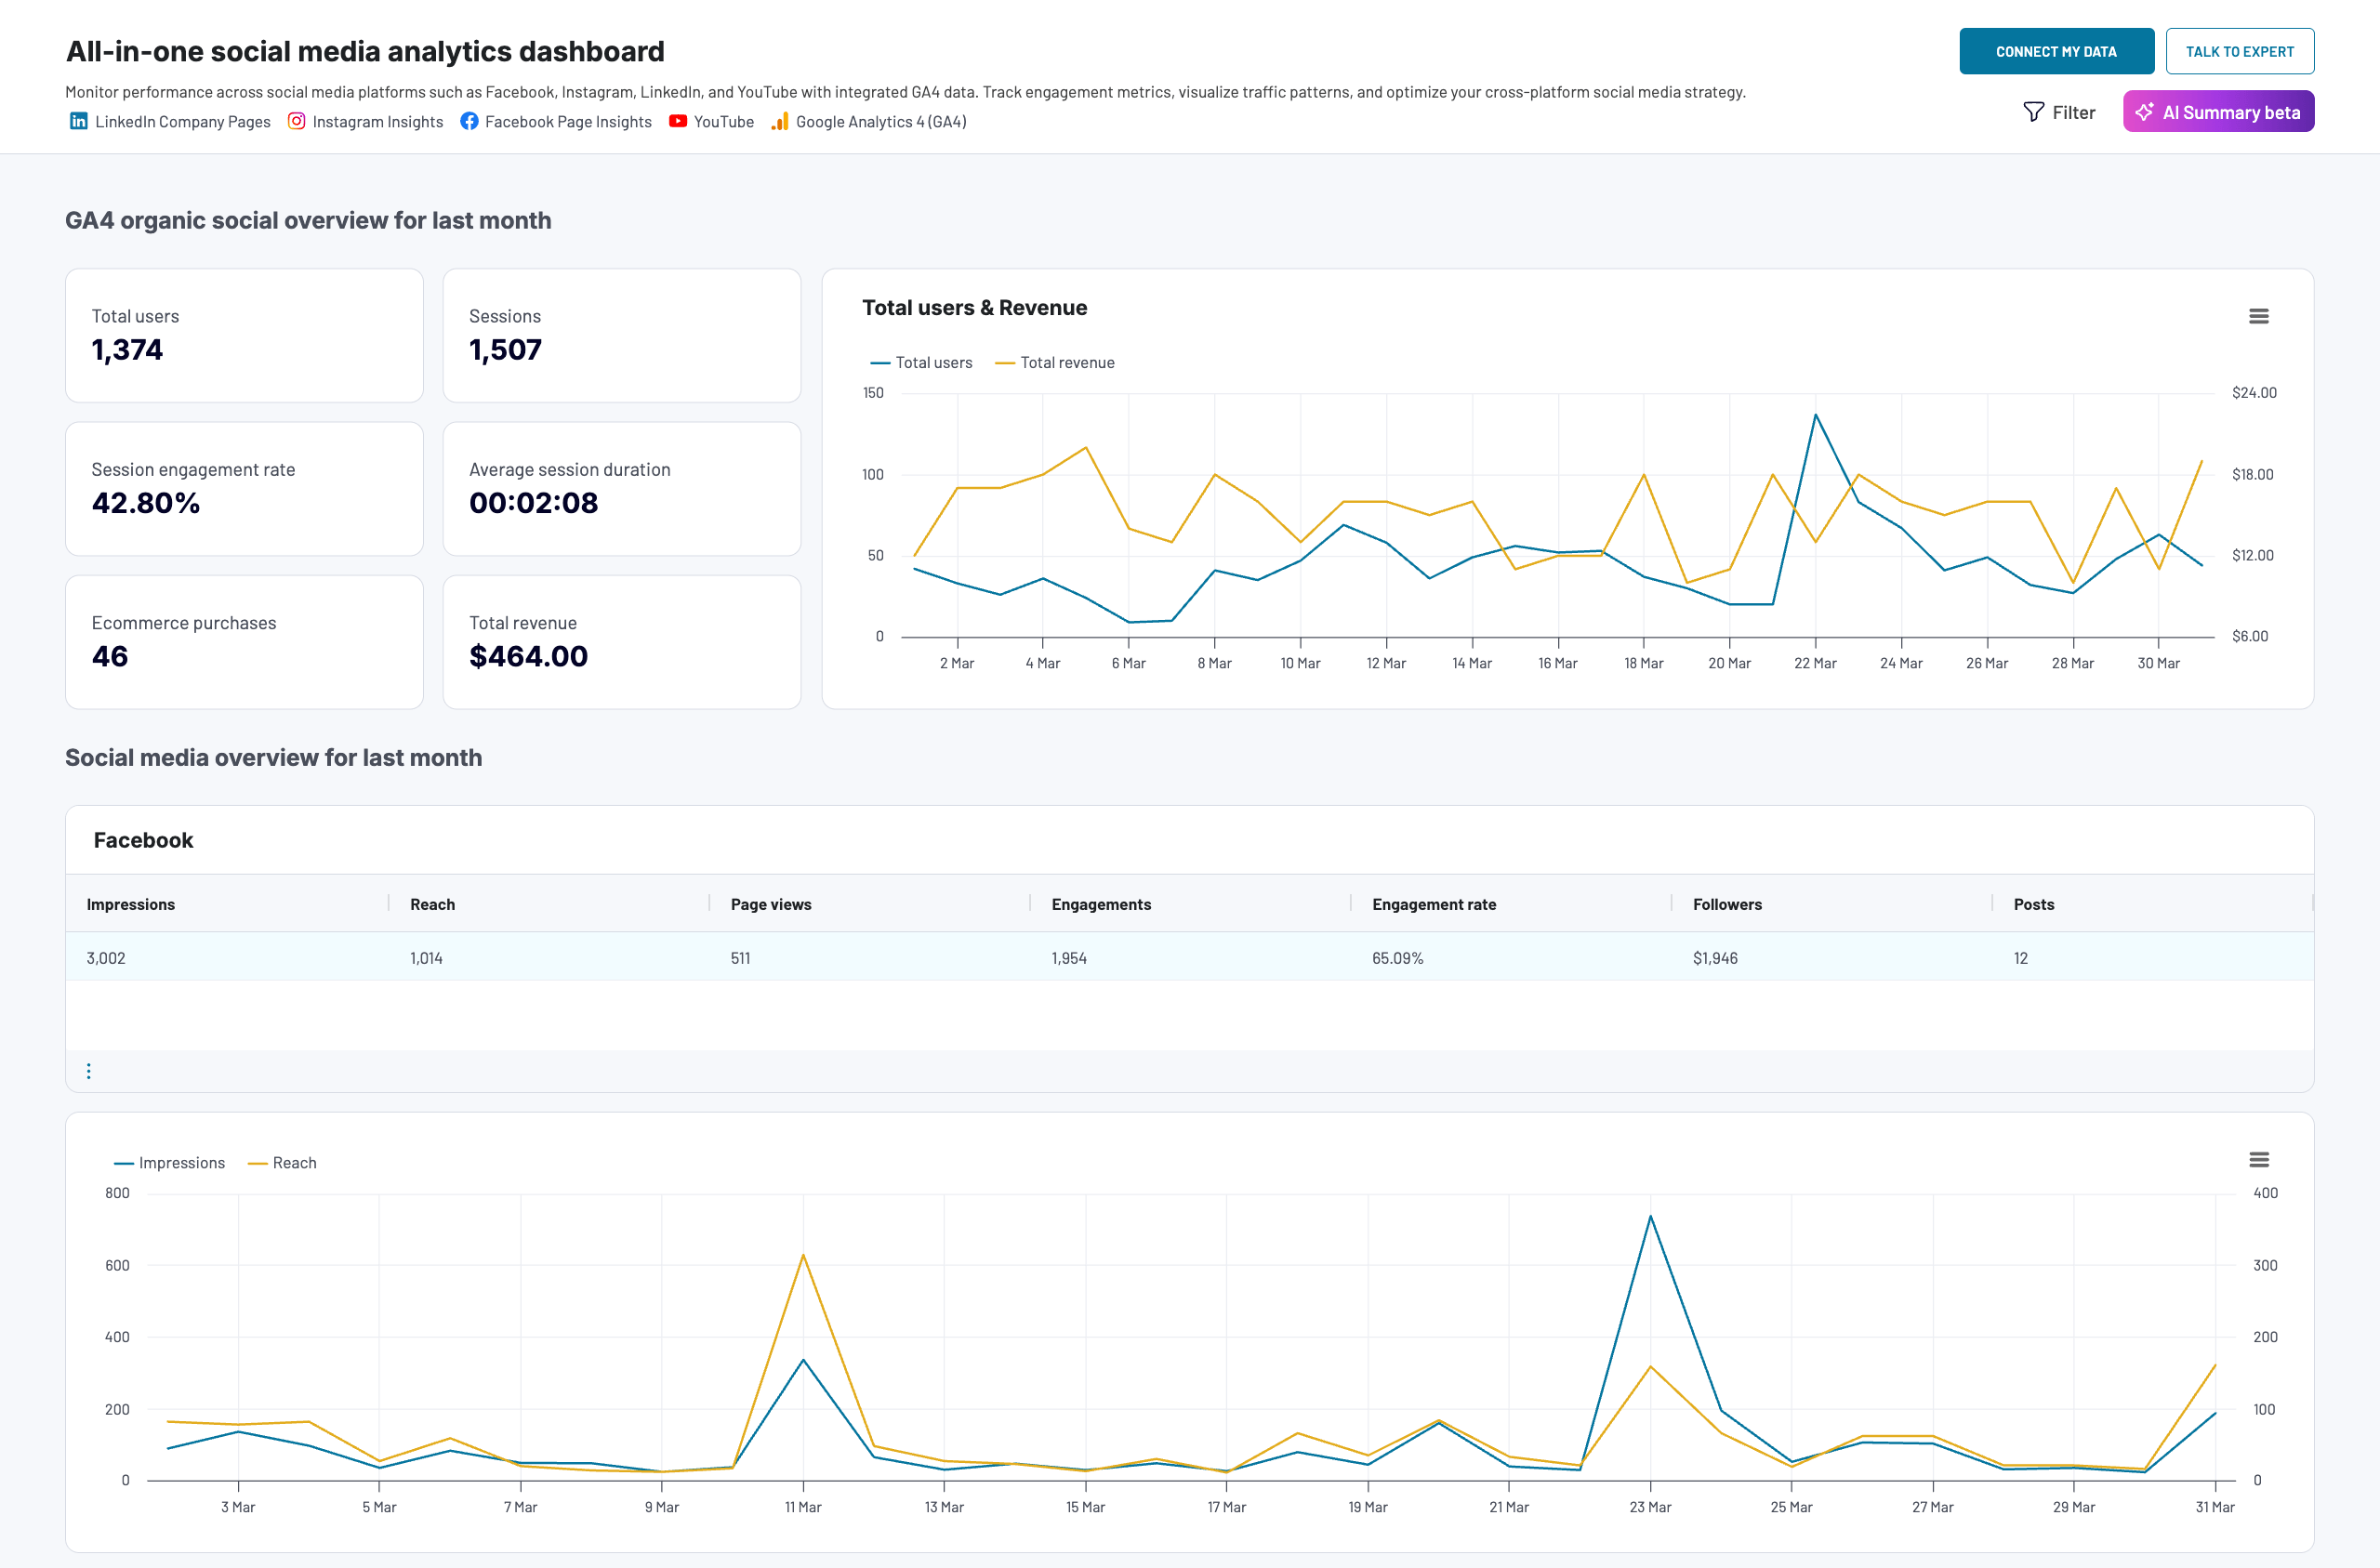
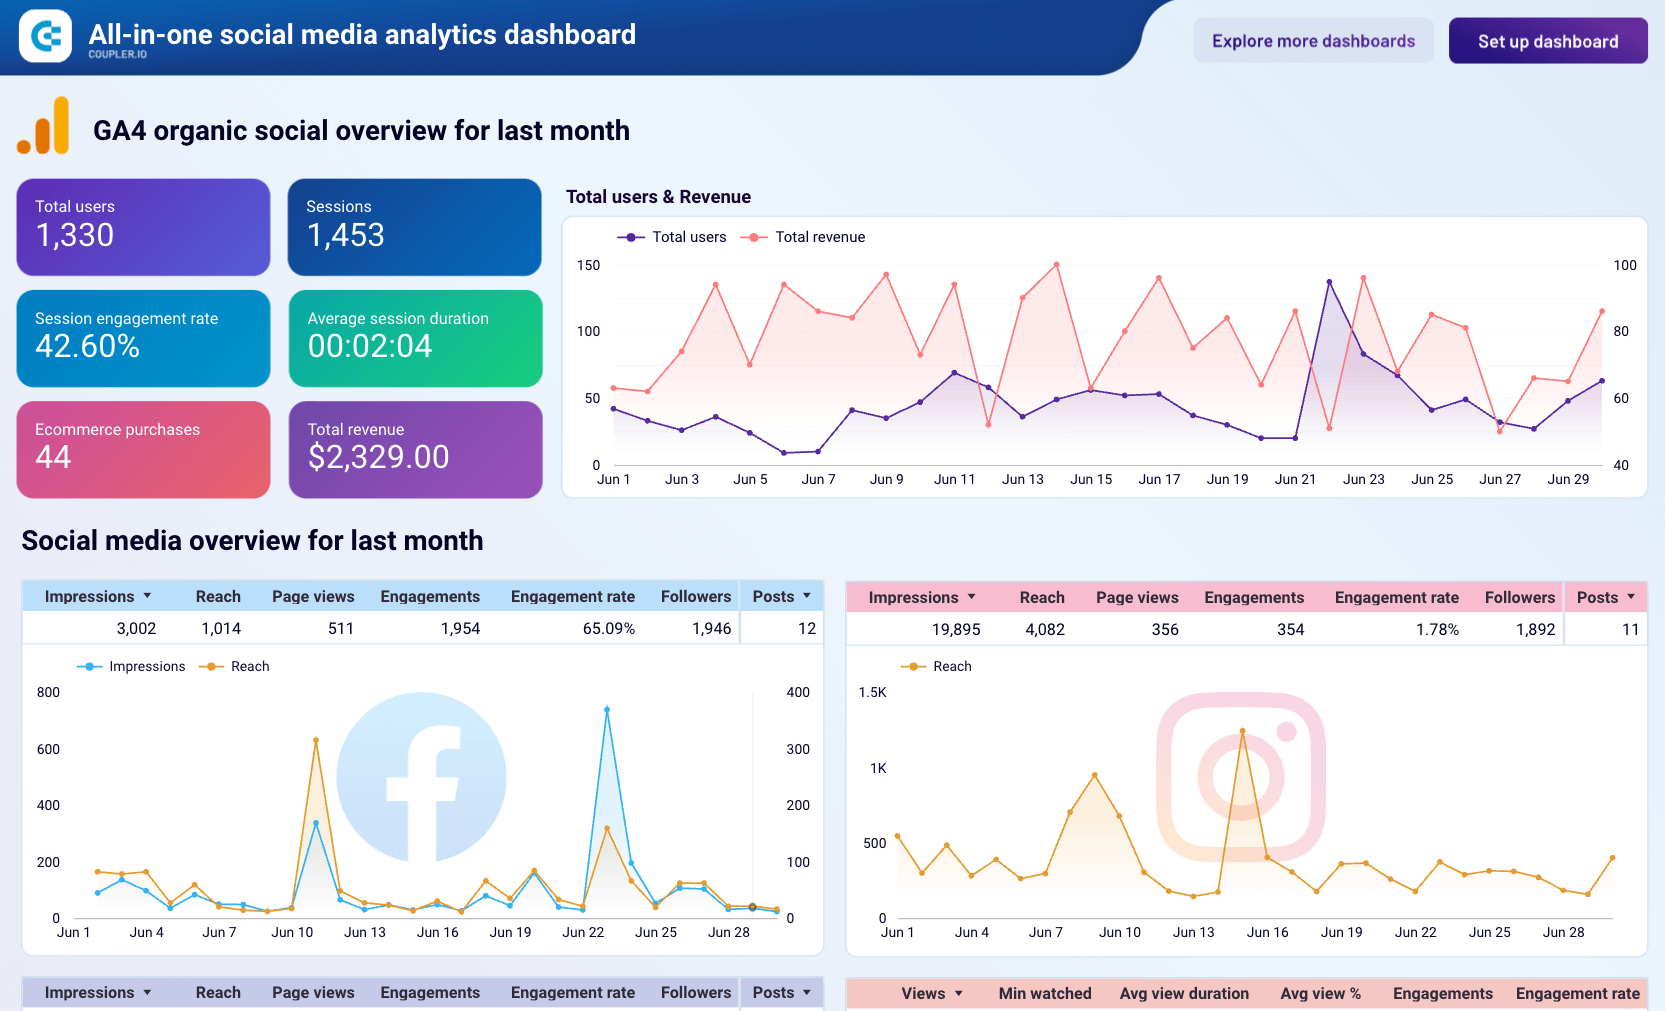
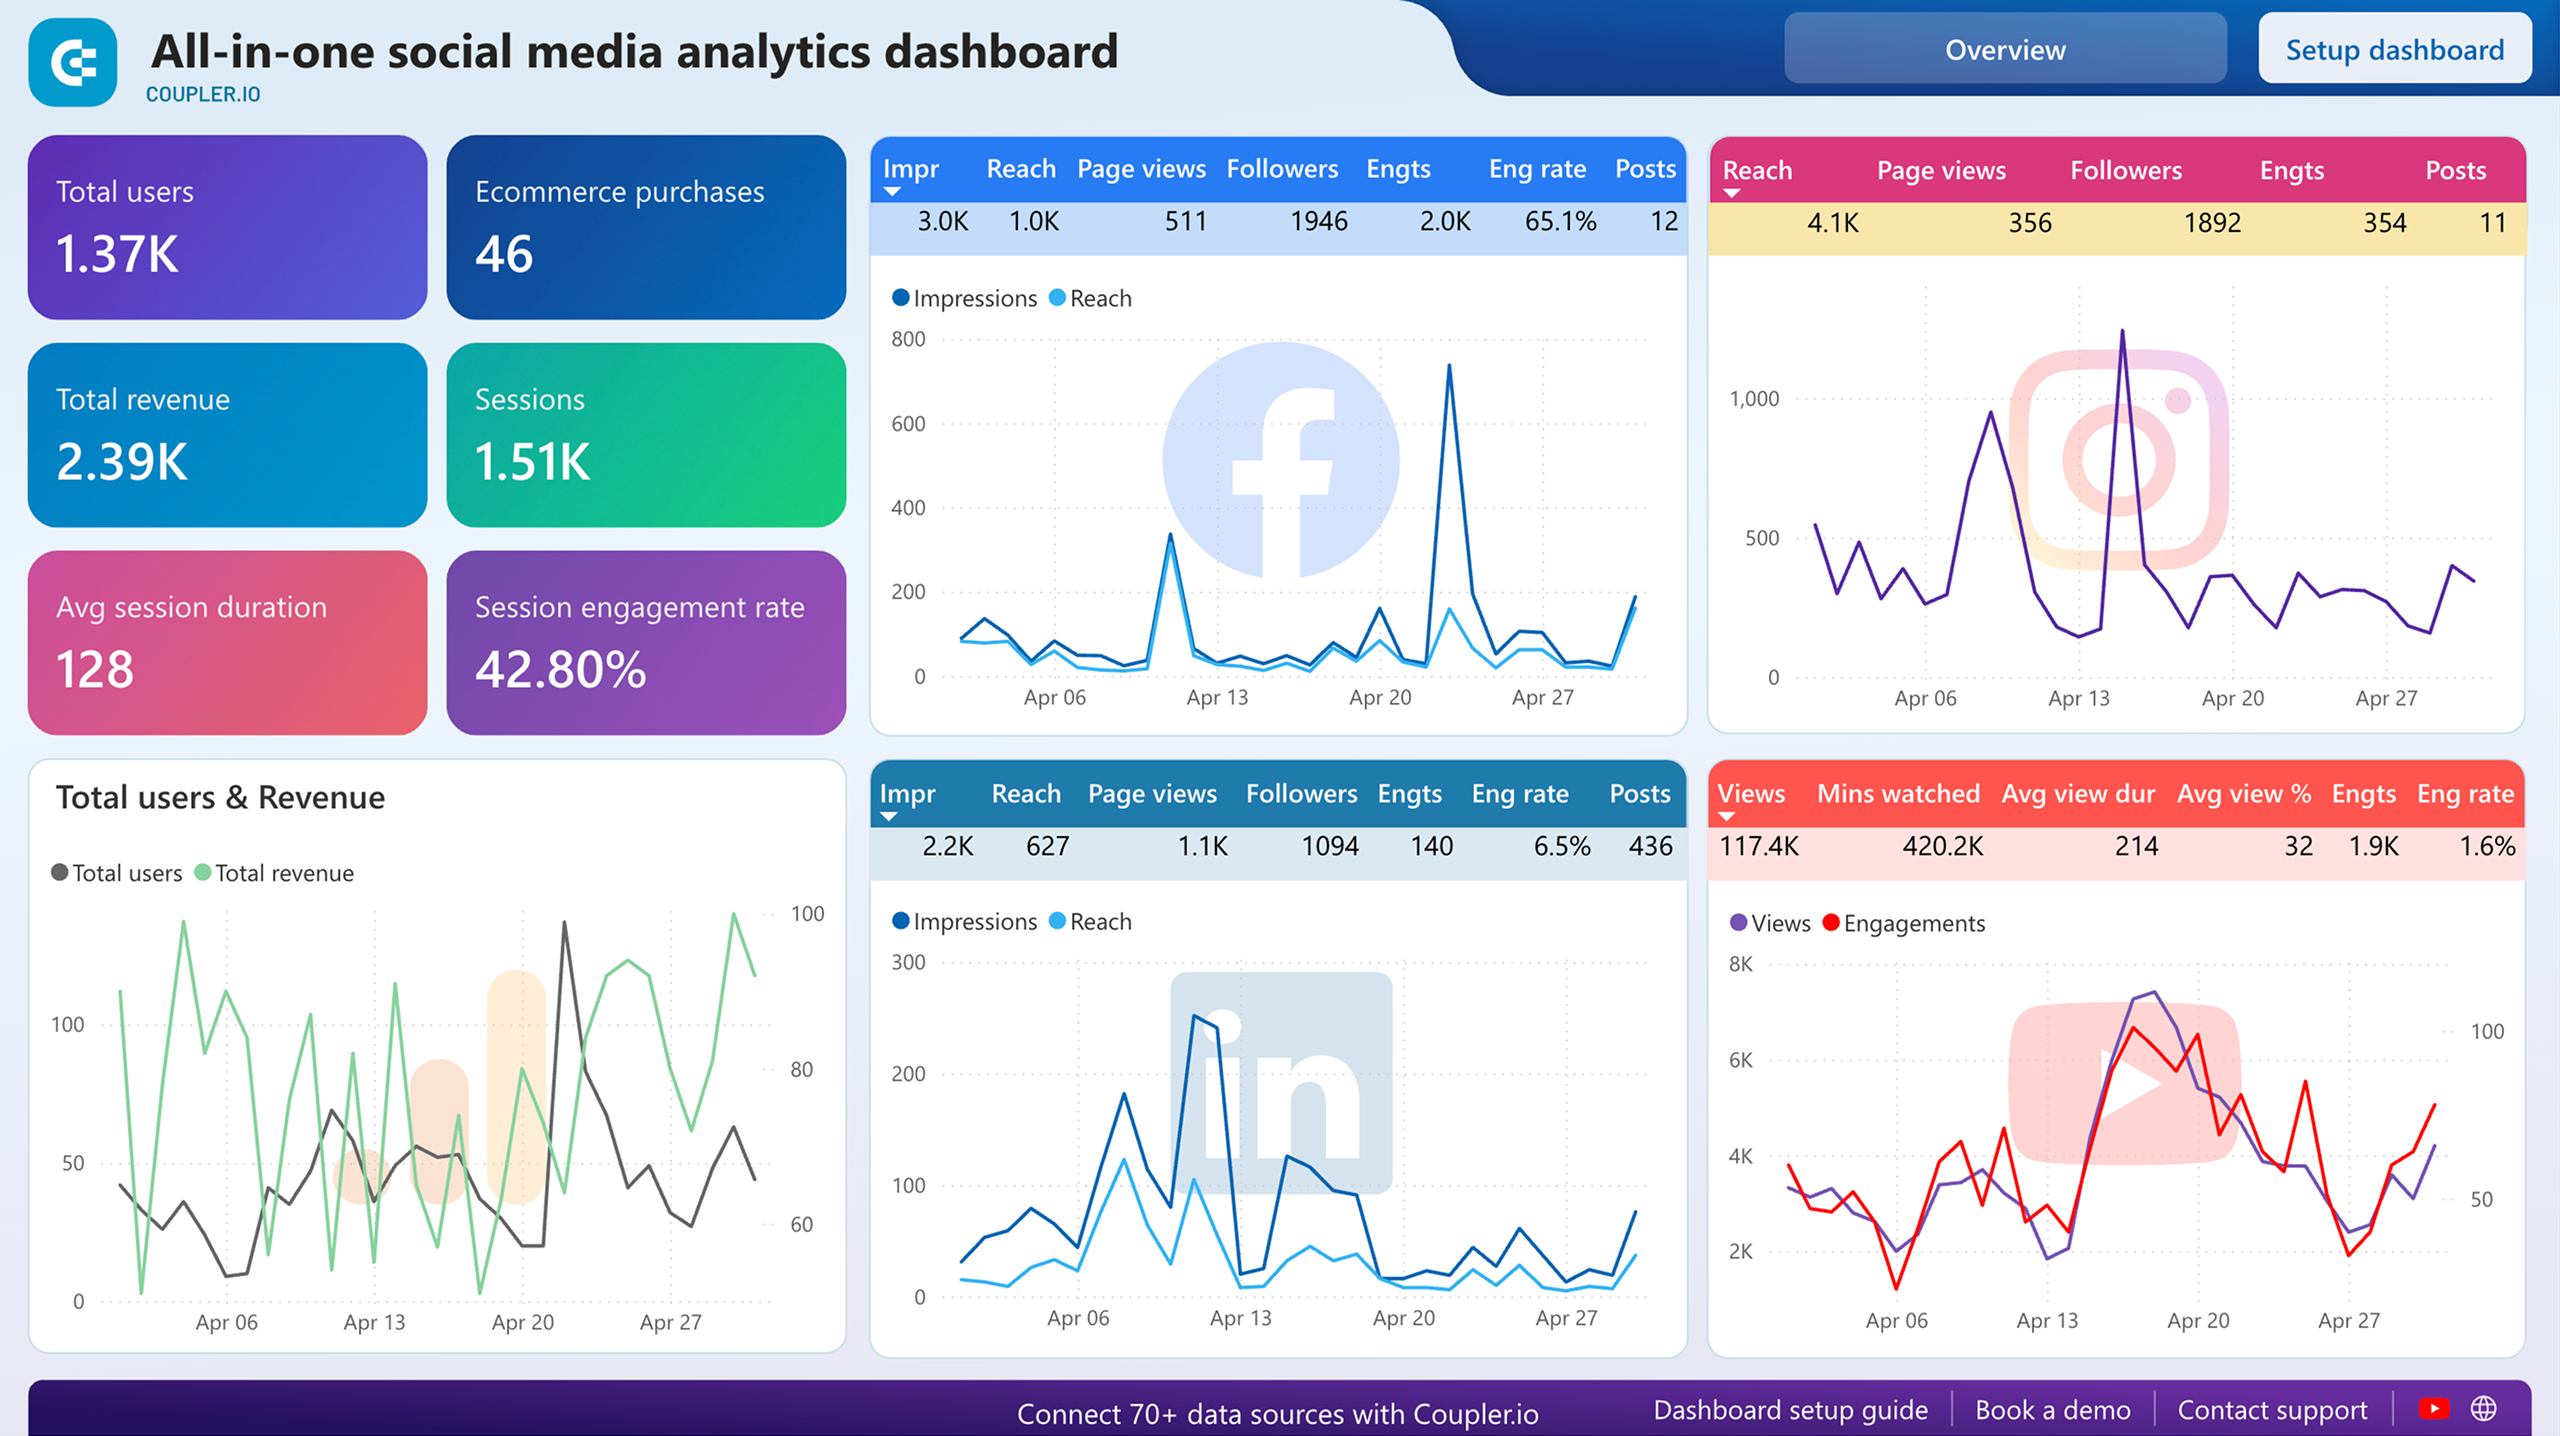
This dashboard brings all your social media analytics together in a centralized interface. It pulls performance data from key platforms, including Facebook, Instagram, LinkedIn, YouTube, and GA4, to provide a complete view of your social media impact. You can easily track how social engagement translates into website traffic and conversions.
All-in-one social media analytics dashboard
 Preview dashboard
All-in-one social media analytics dashboard
Preview dashboardWhat you can do with this dashboard:
- Visualize traffic and conversion data from GA4 to see how your social content drives purchases on your website.
- Track key performance metrics like impressions, reach, engagement, and views across all social platforms.
- Compare results between Facebook, Instagram, LinkedIn, and YouTube to identify your highest-performing channels and guide your marketing investments.
- Analyze month-over-month performance trends to spot what’s working and what needs improvement.
You can make a copy of this dashboard template for Coupler.io UI, Power BI, or Looker Studio. Simply choose the version you prefer (keeping in mind that the Coupler.io version is AI-enhanced) and connect your accounts. Syncing data from your favorite platforms only takes a few minutes:

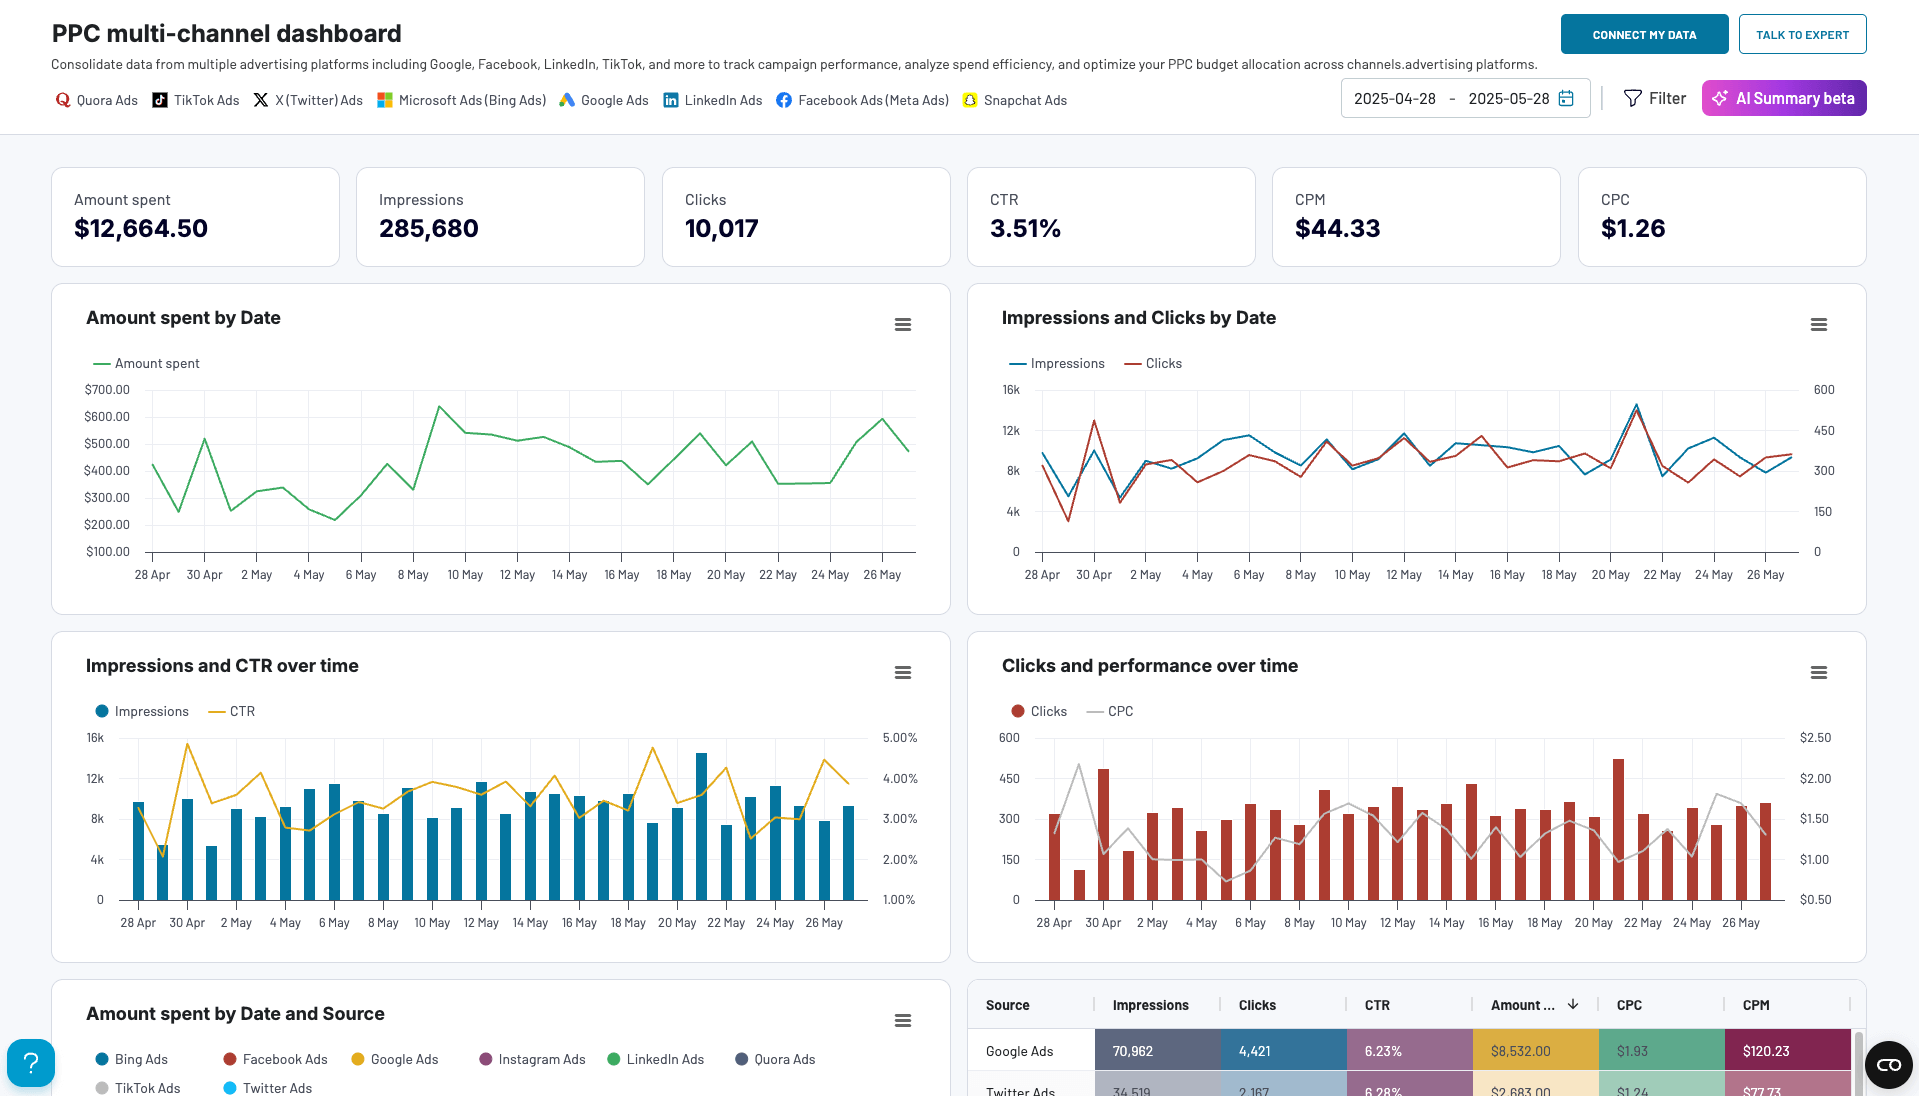
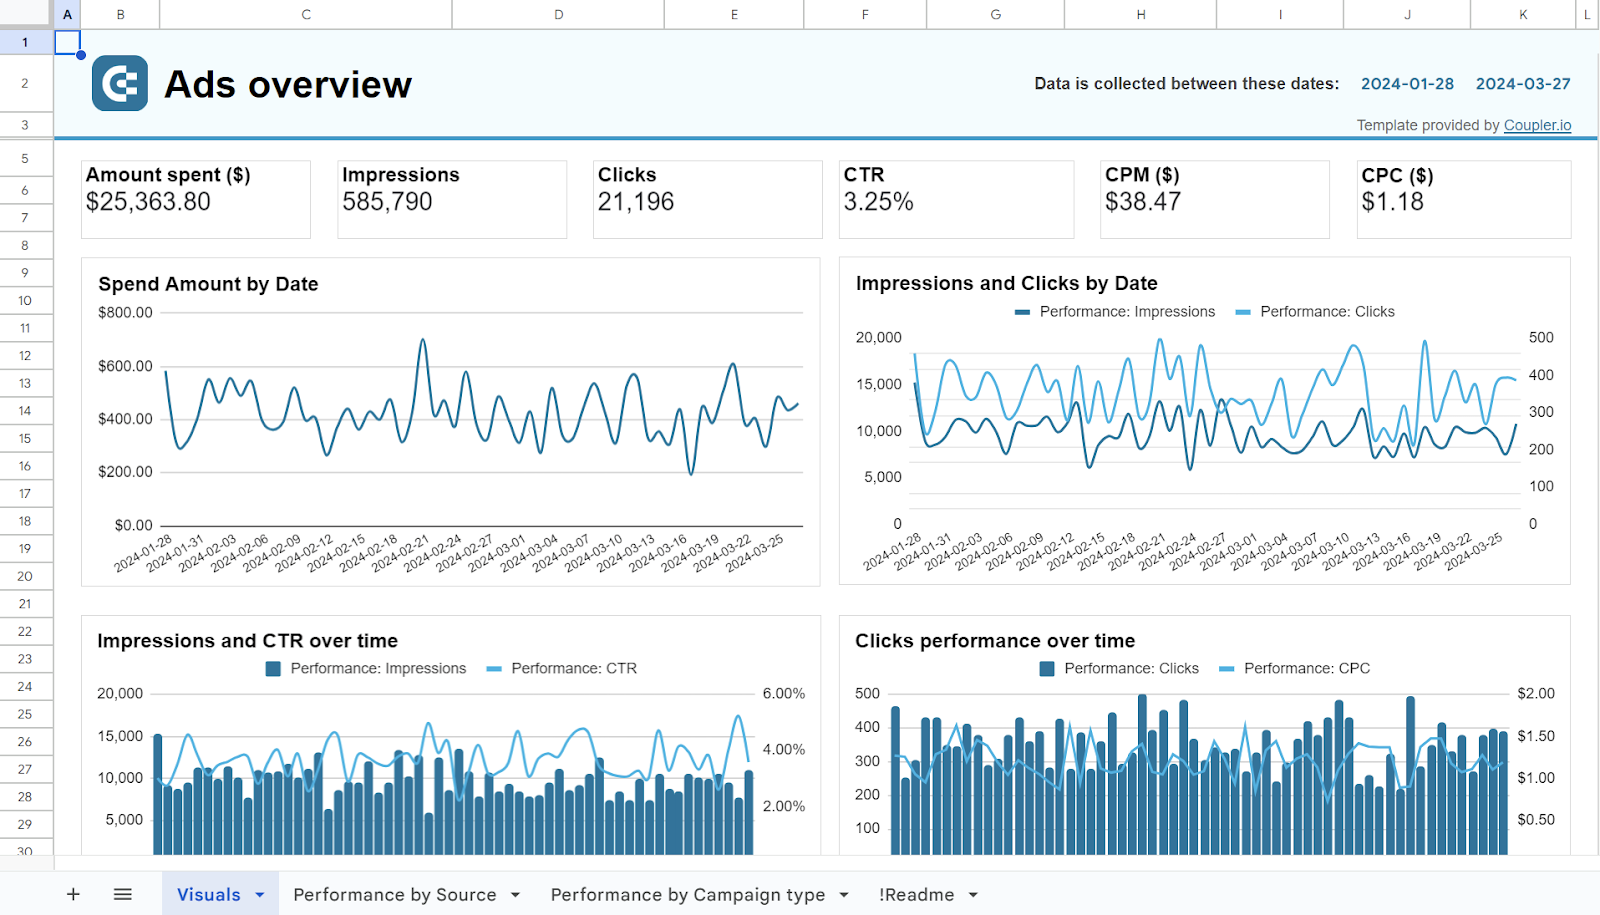
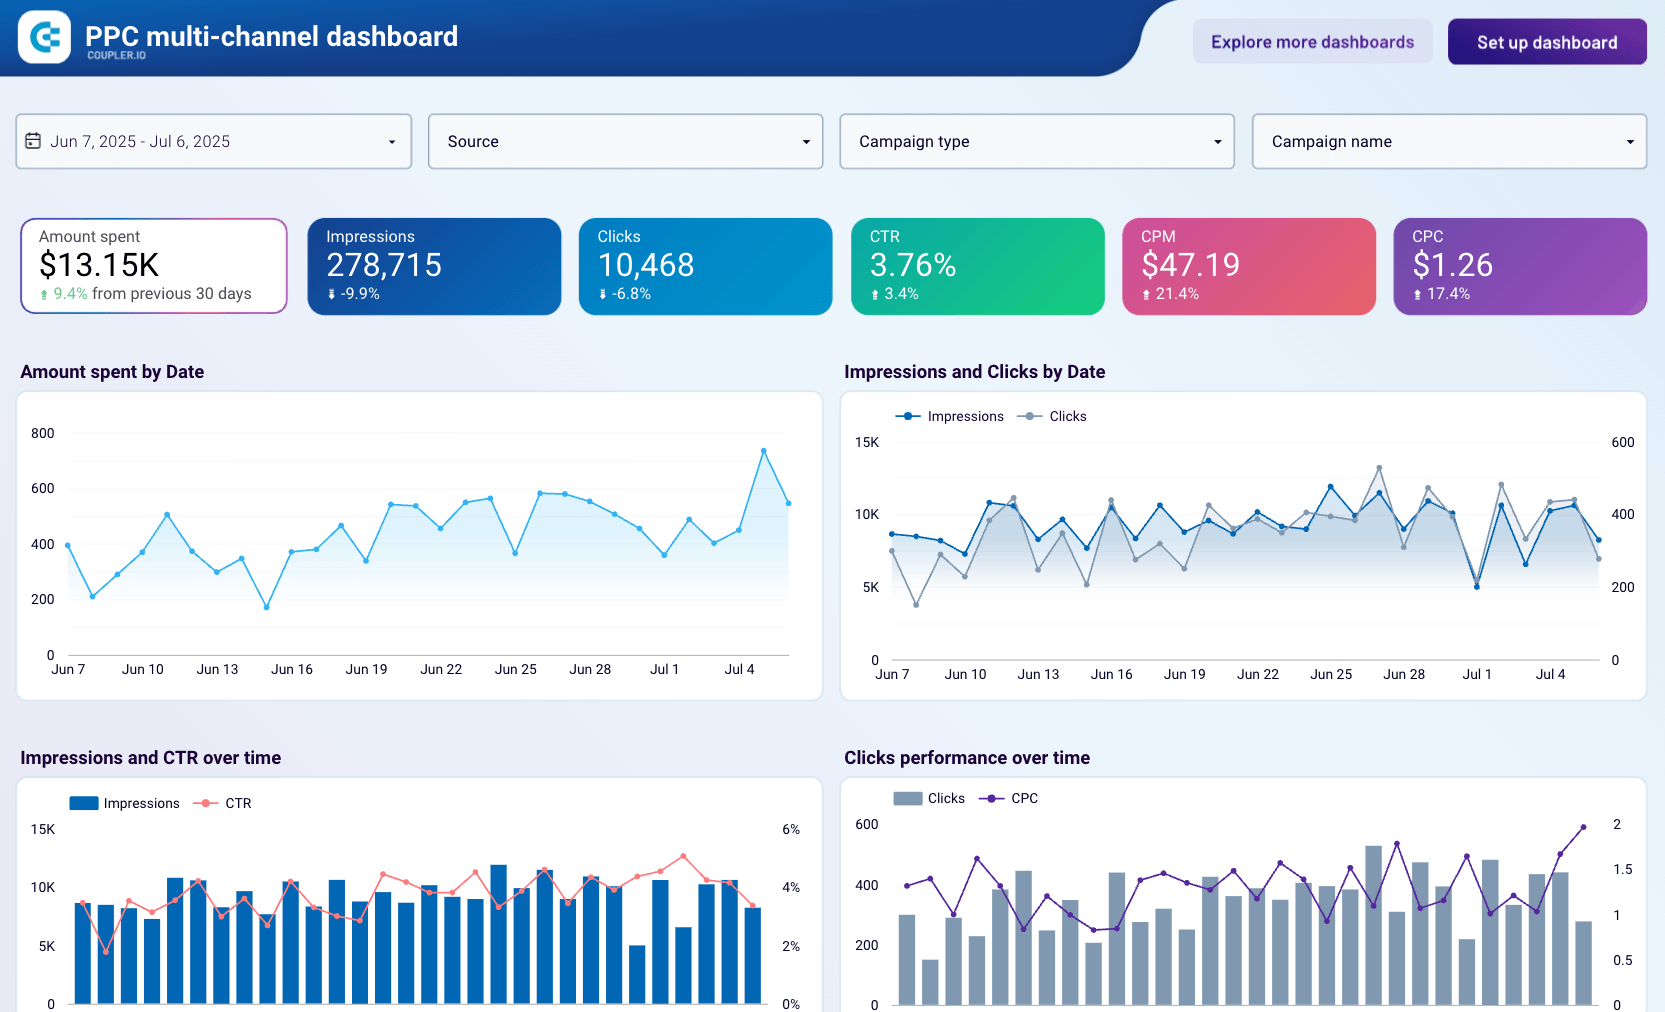
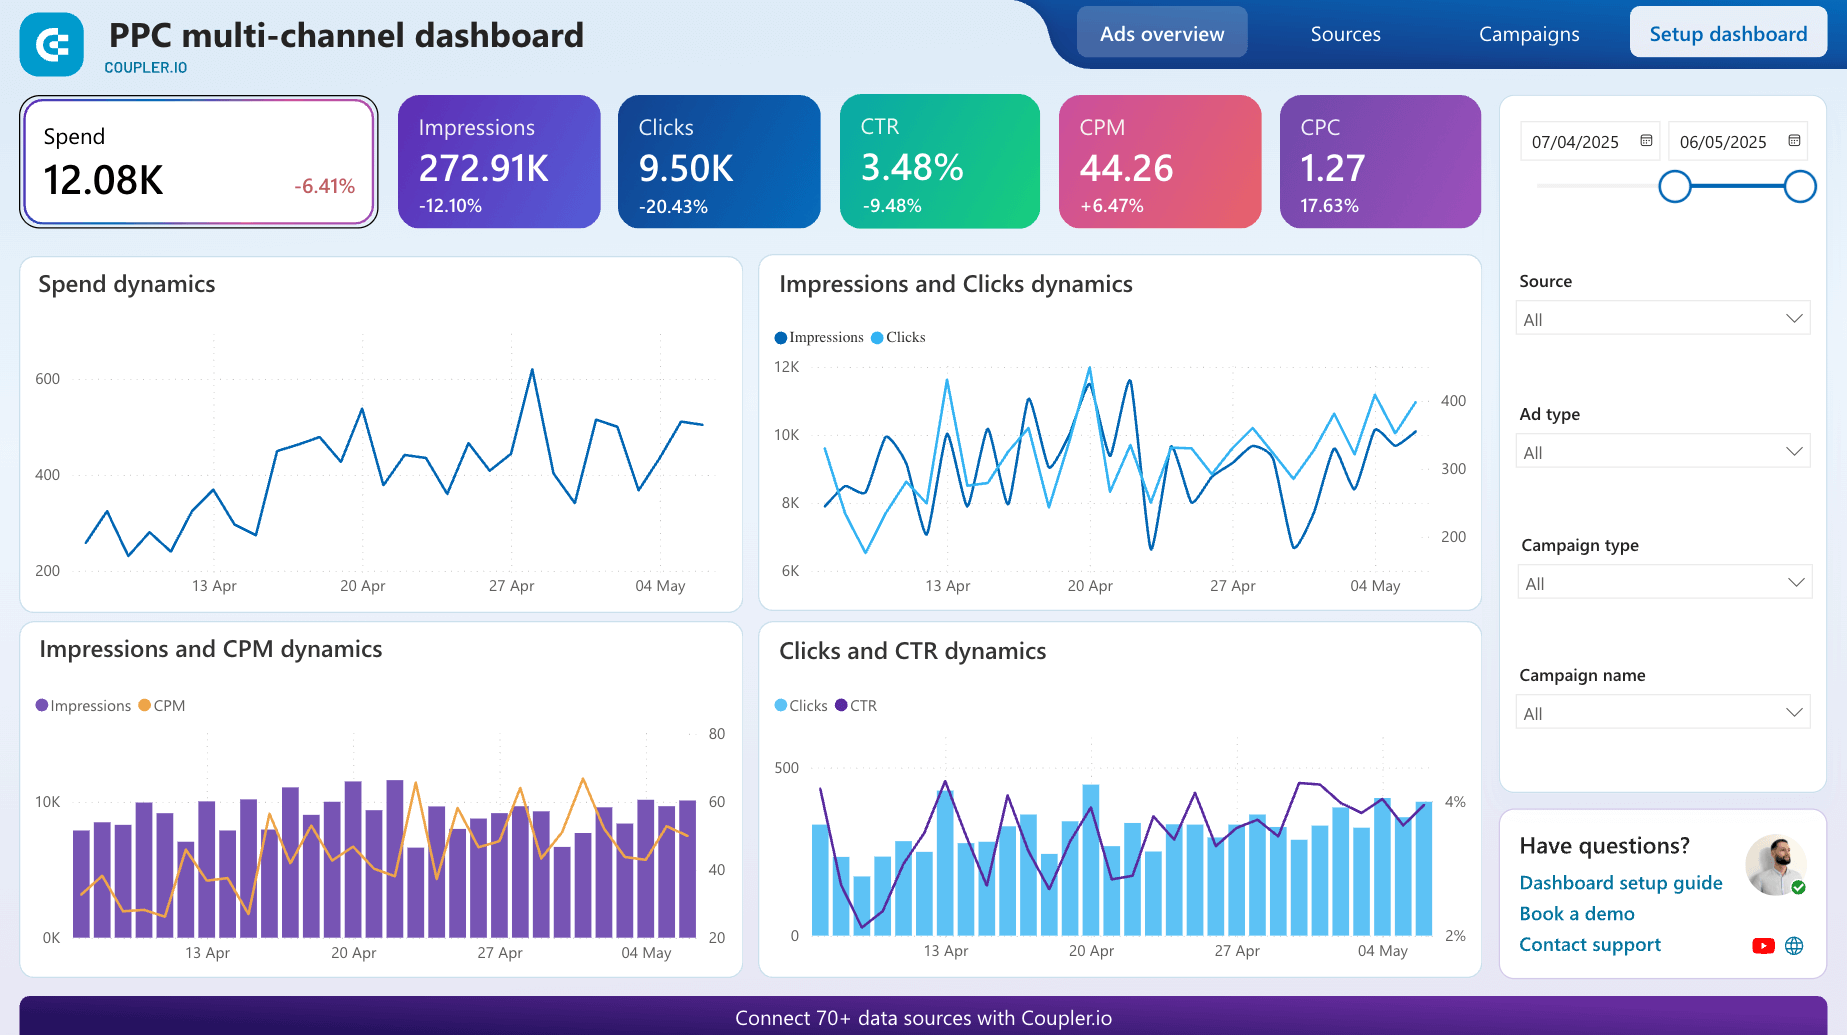
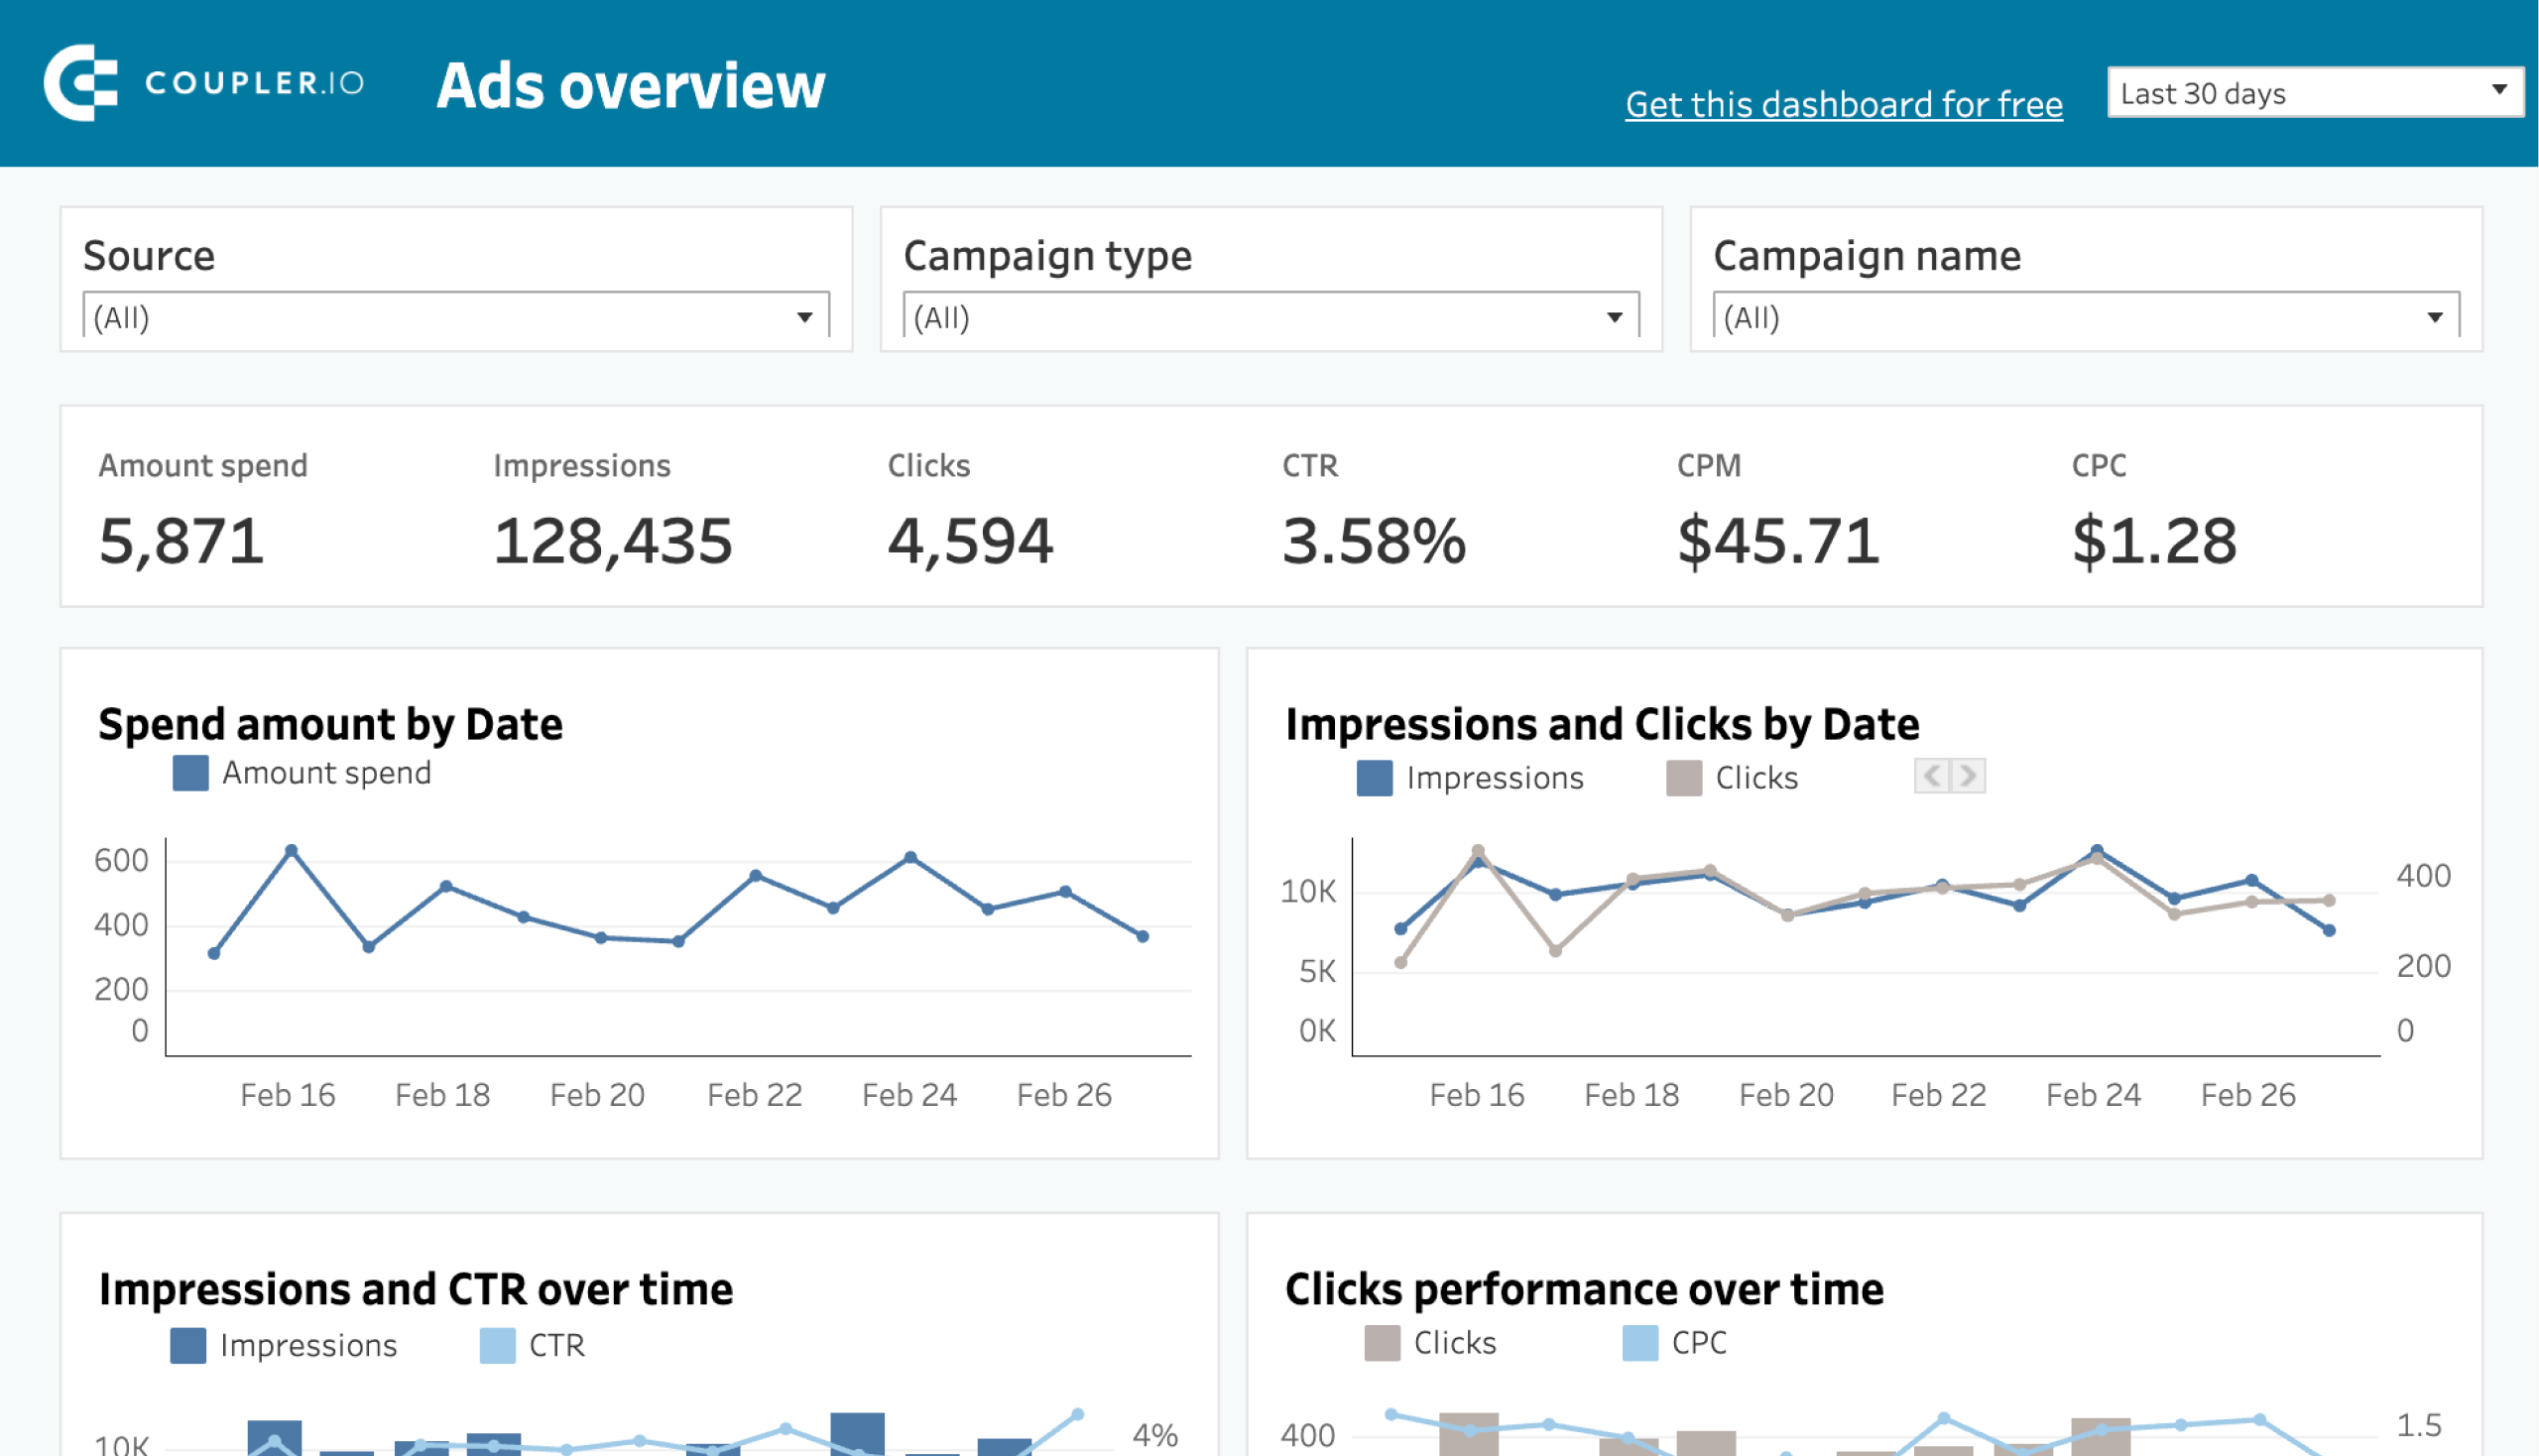
PPC multichannel dashboard template
Individual dashboards are great for diving deep into each PPC channel’s performance. But when you want to see how all of your campaigns are doing at a glance, this PPC multi-channel dashboard brings everything together in a consolidated view. You can easily track campaign progress and compare metrics like clicks, amount spent, CTR, CPC, and impressions across advertising platforms.
What you can do with this dashboard:
- Compare channel performance and ROI (Google Ads vs. Facebook Ads vs. TikTok Ads, etc.) without switching between platform tabs.
- Monitor spending through metrics like cost per click and cost per mille. Improve the distribution of your budget by tracking the cost efficiency of different platforms.
- Filter by date to understand seasonal patterns and industry trends that affect your campaign results.
- Compare campaigns side-by-side to assess how well they perform on different channels. Uncover opportunities to optimize ad creatives and boost the overall number of conversions.
The PPC multichannel marketing dashboard is available in the Coupler.io UI and as a template in Google Sheets, Looker Studio, Power BI, and Tableau.


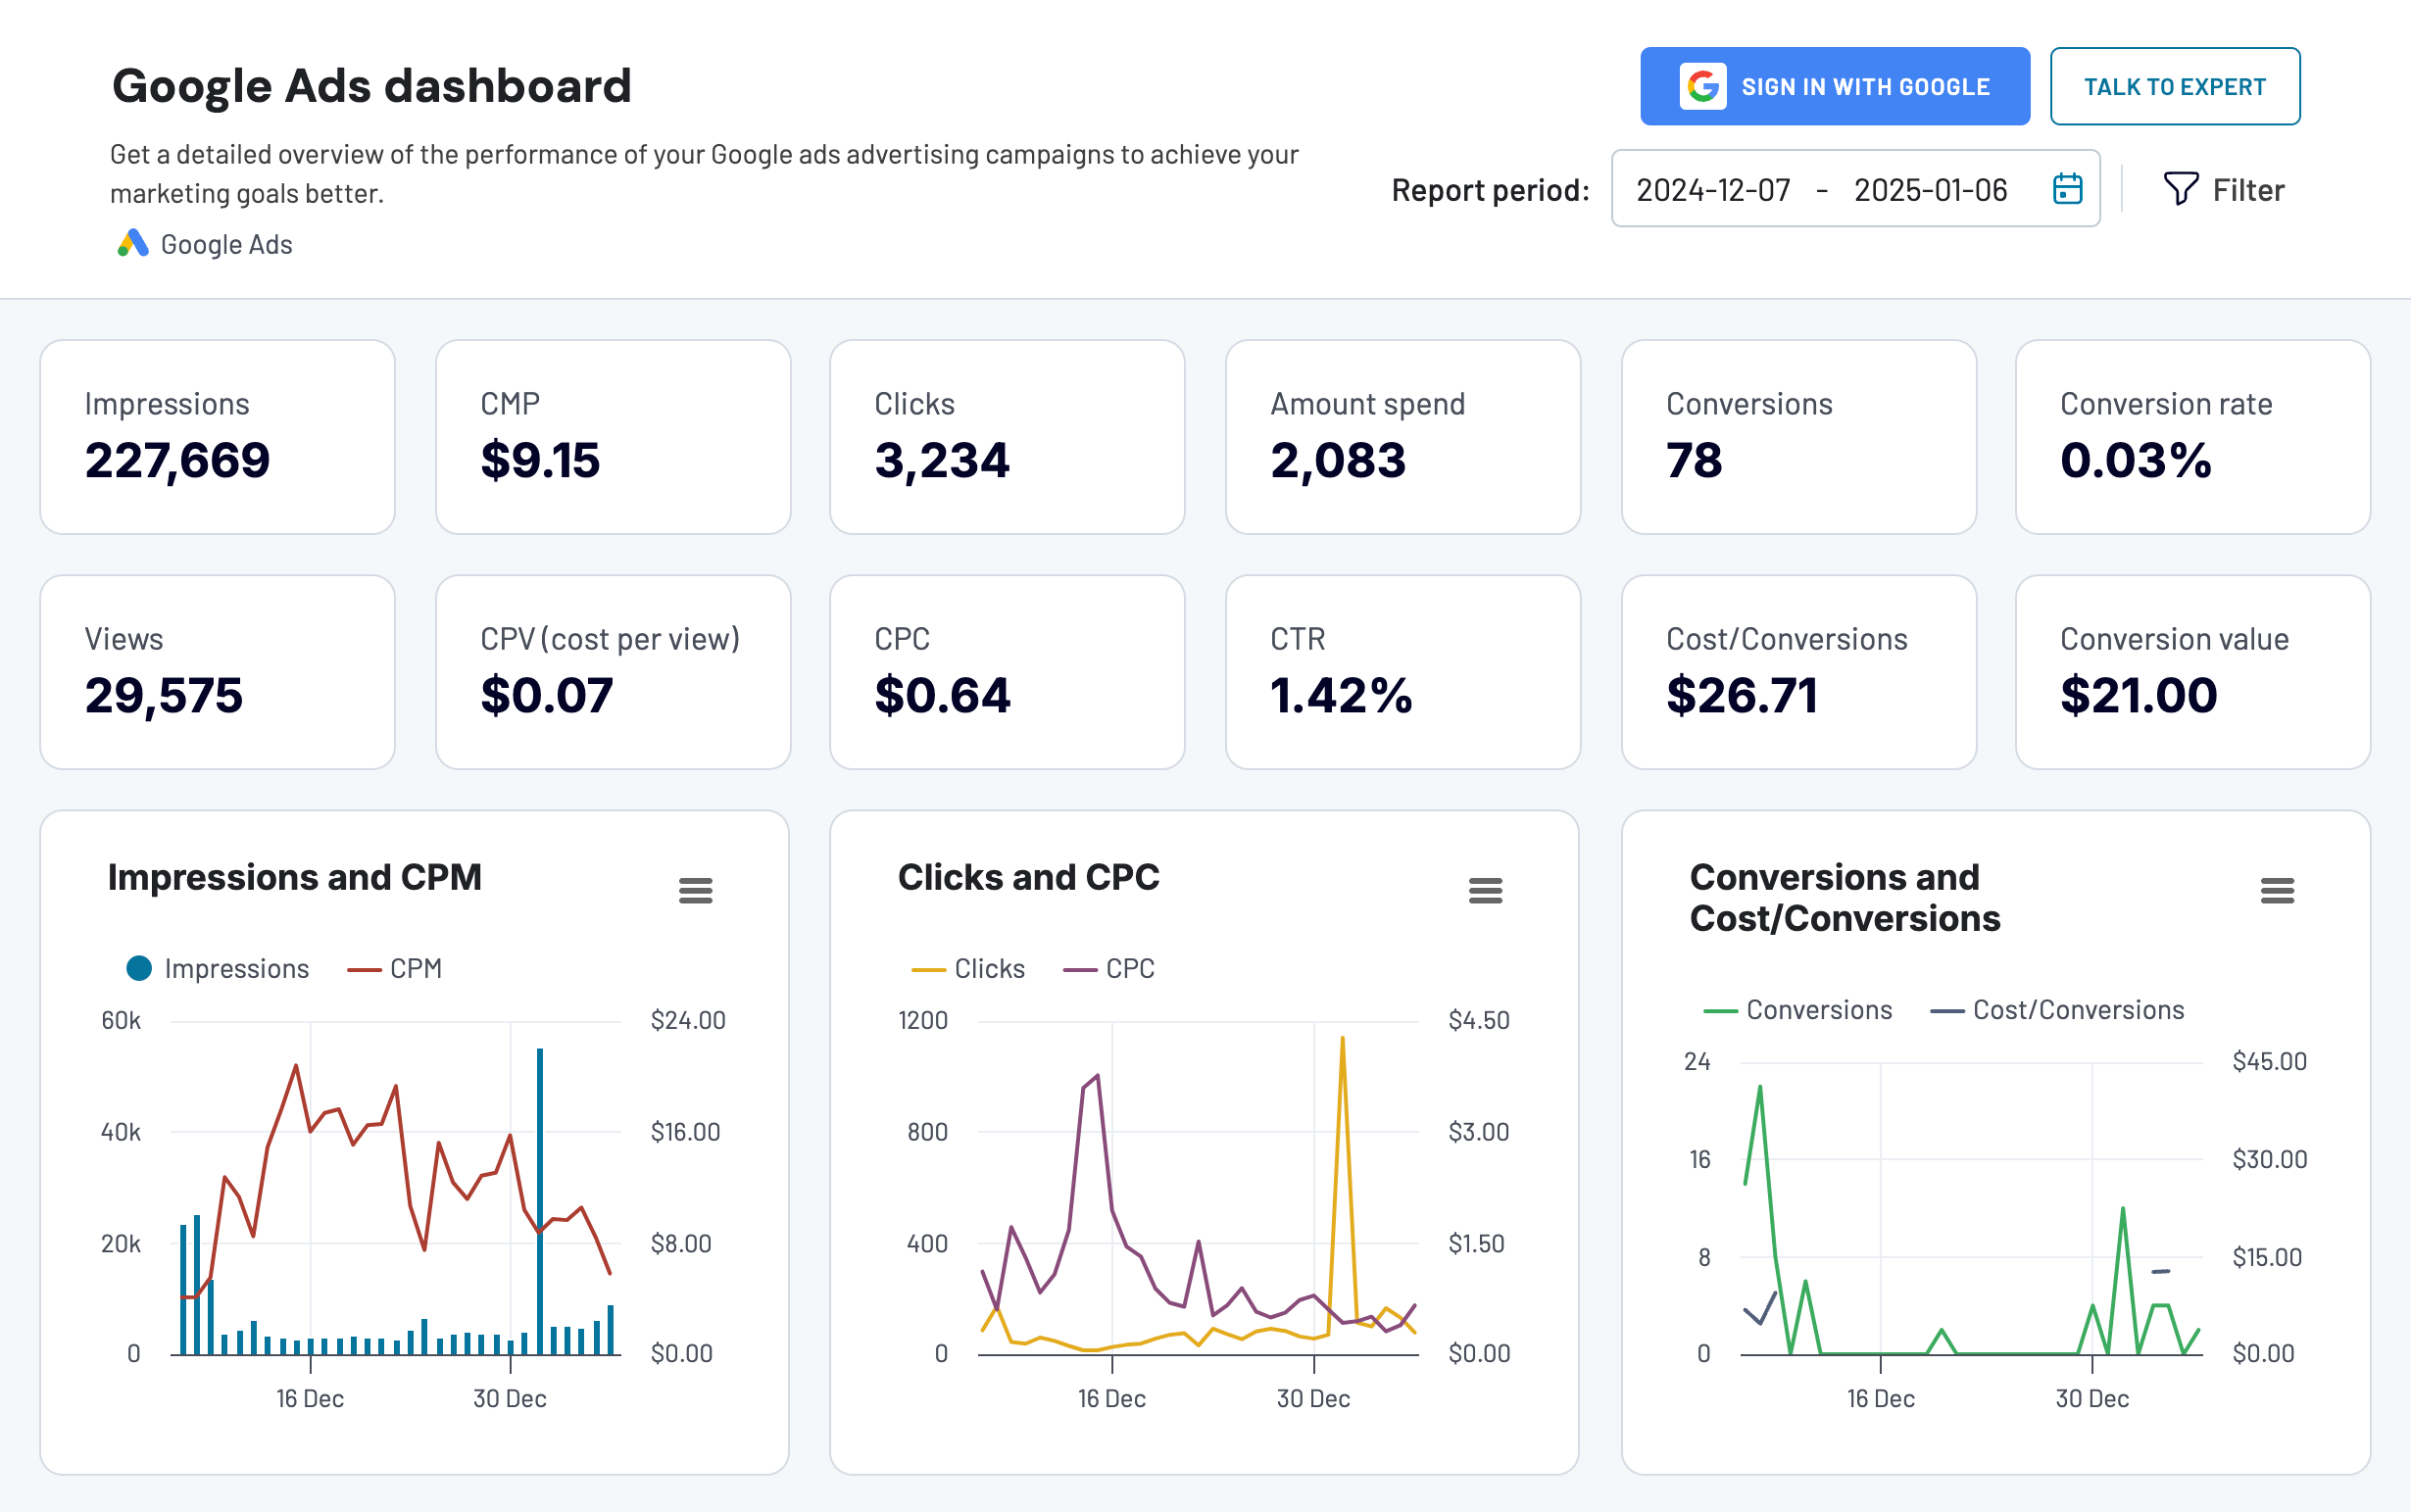
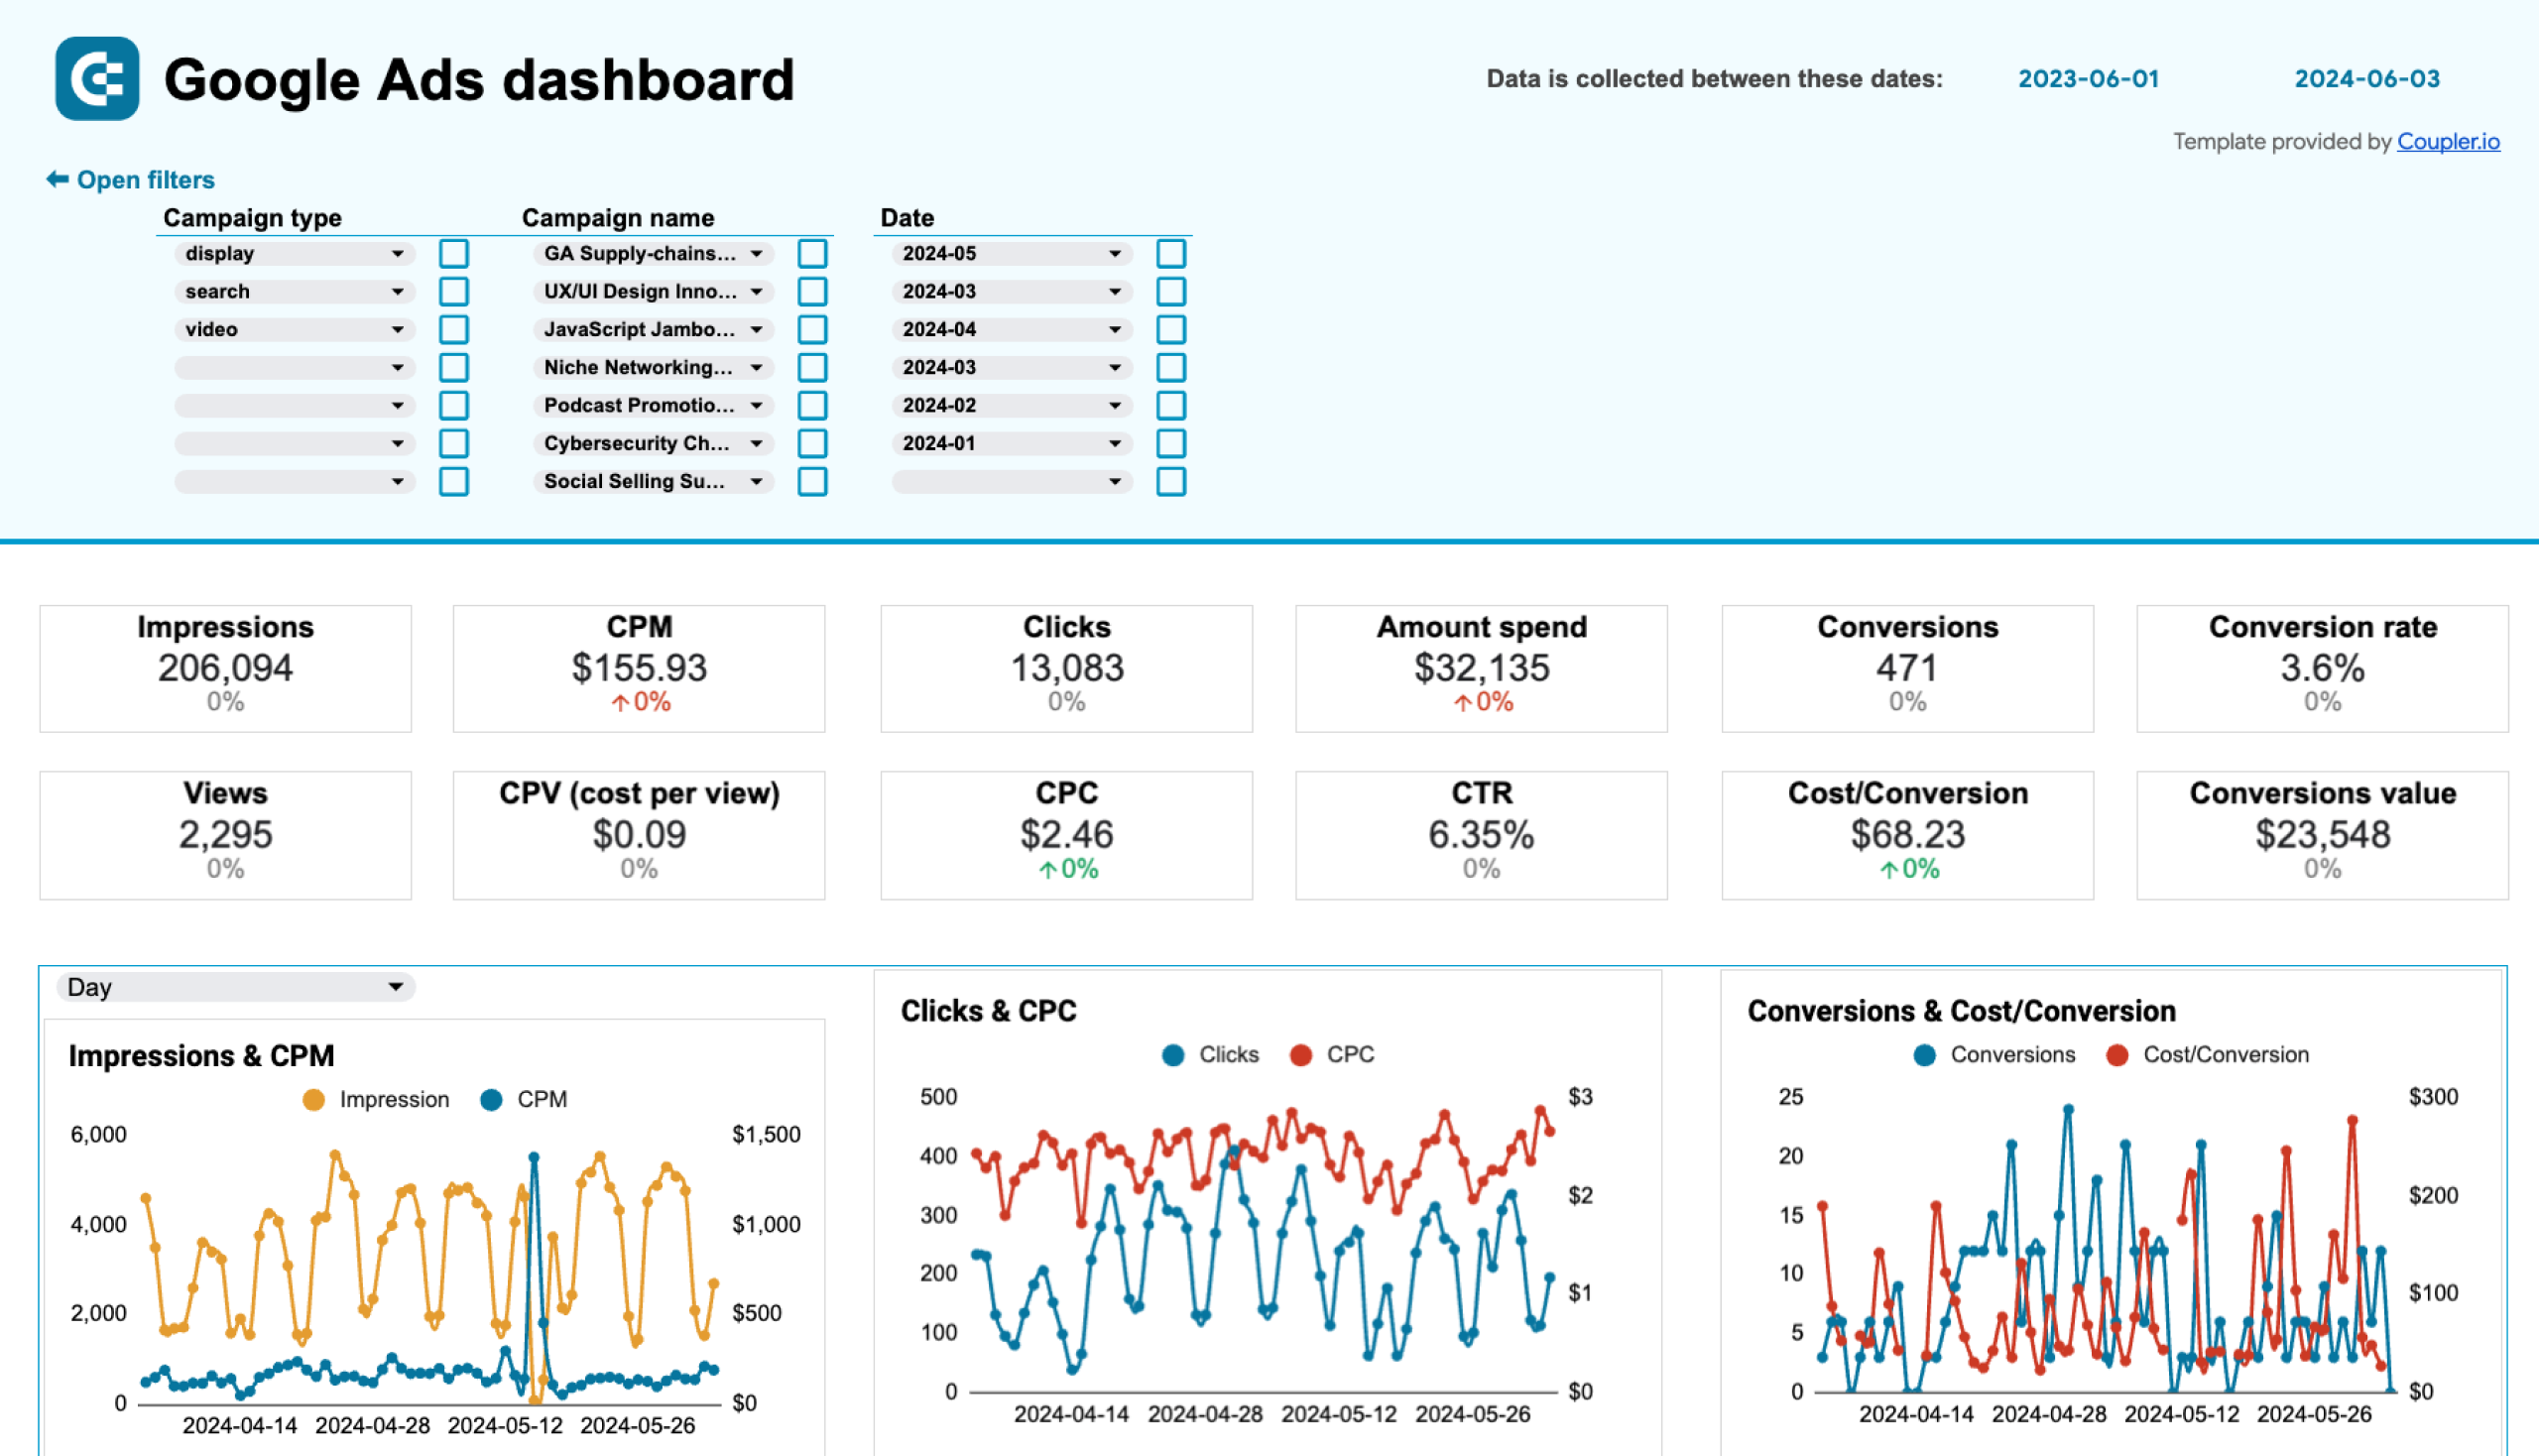
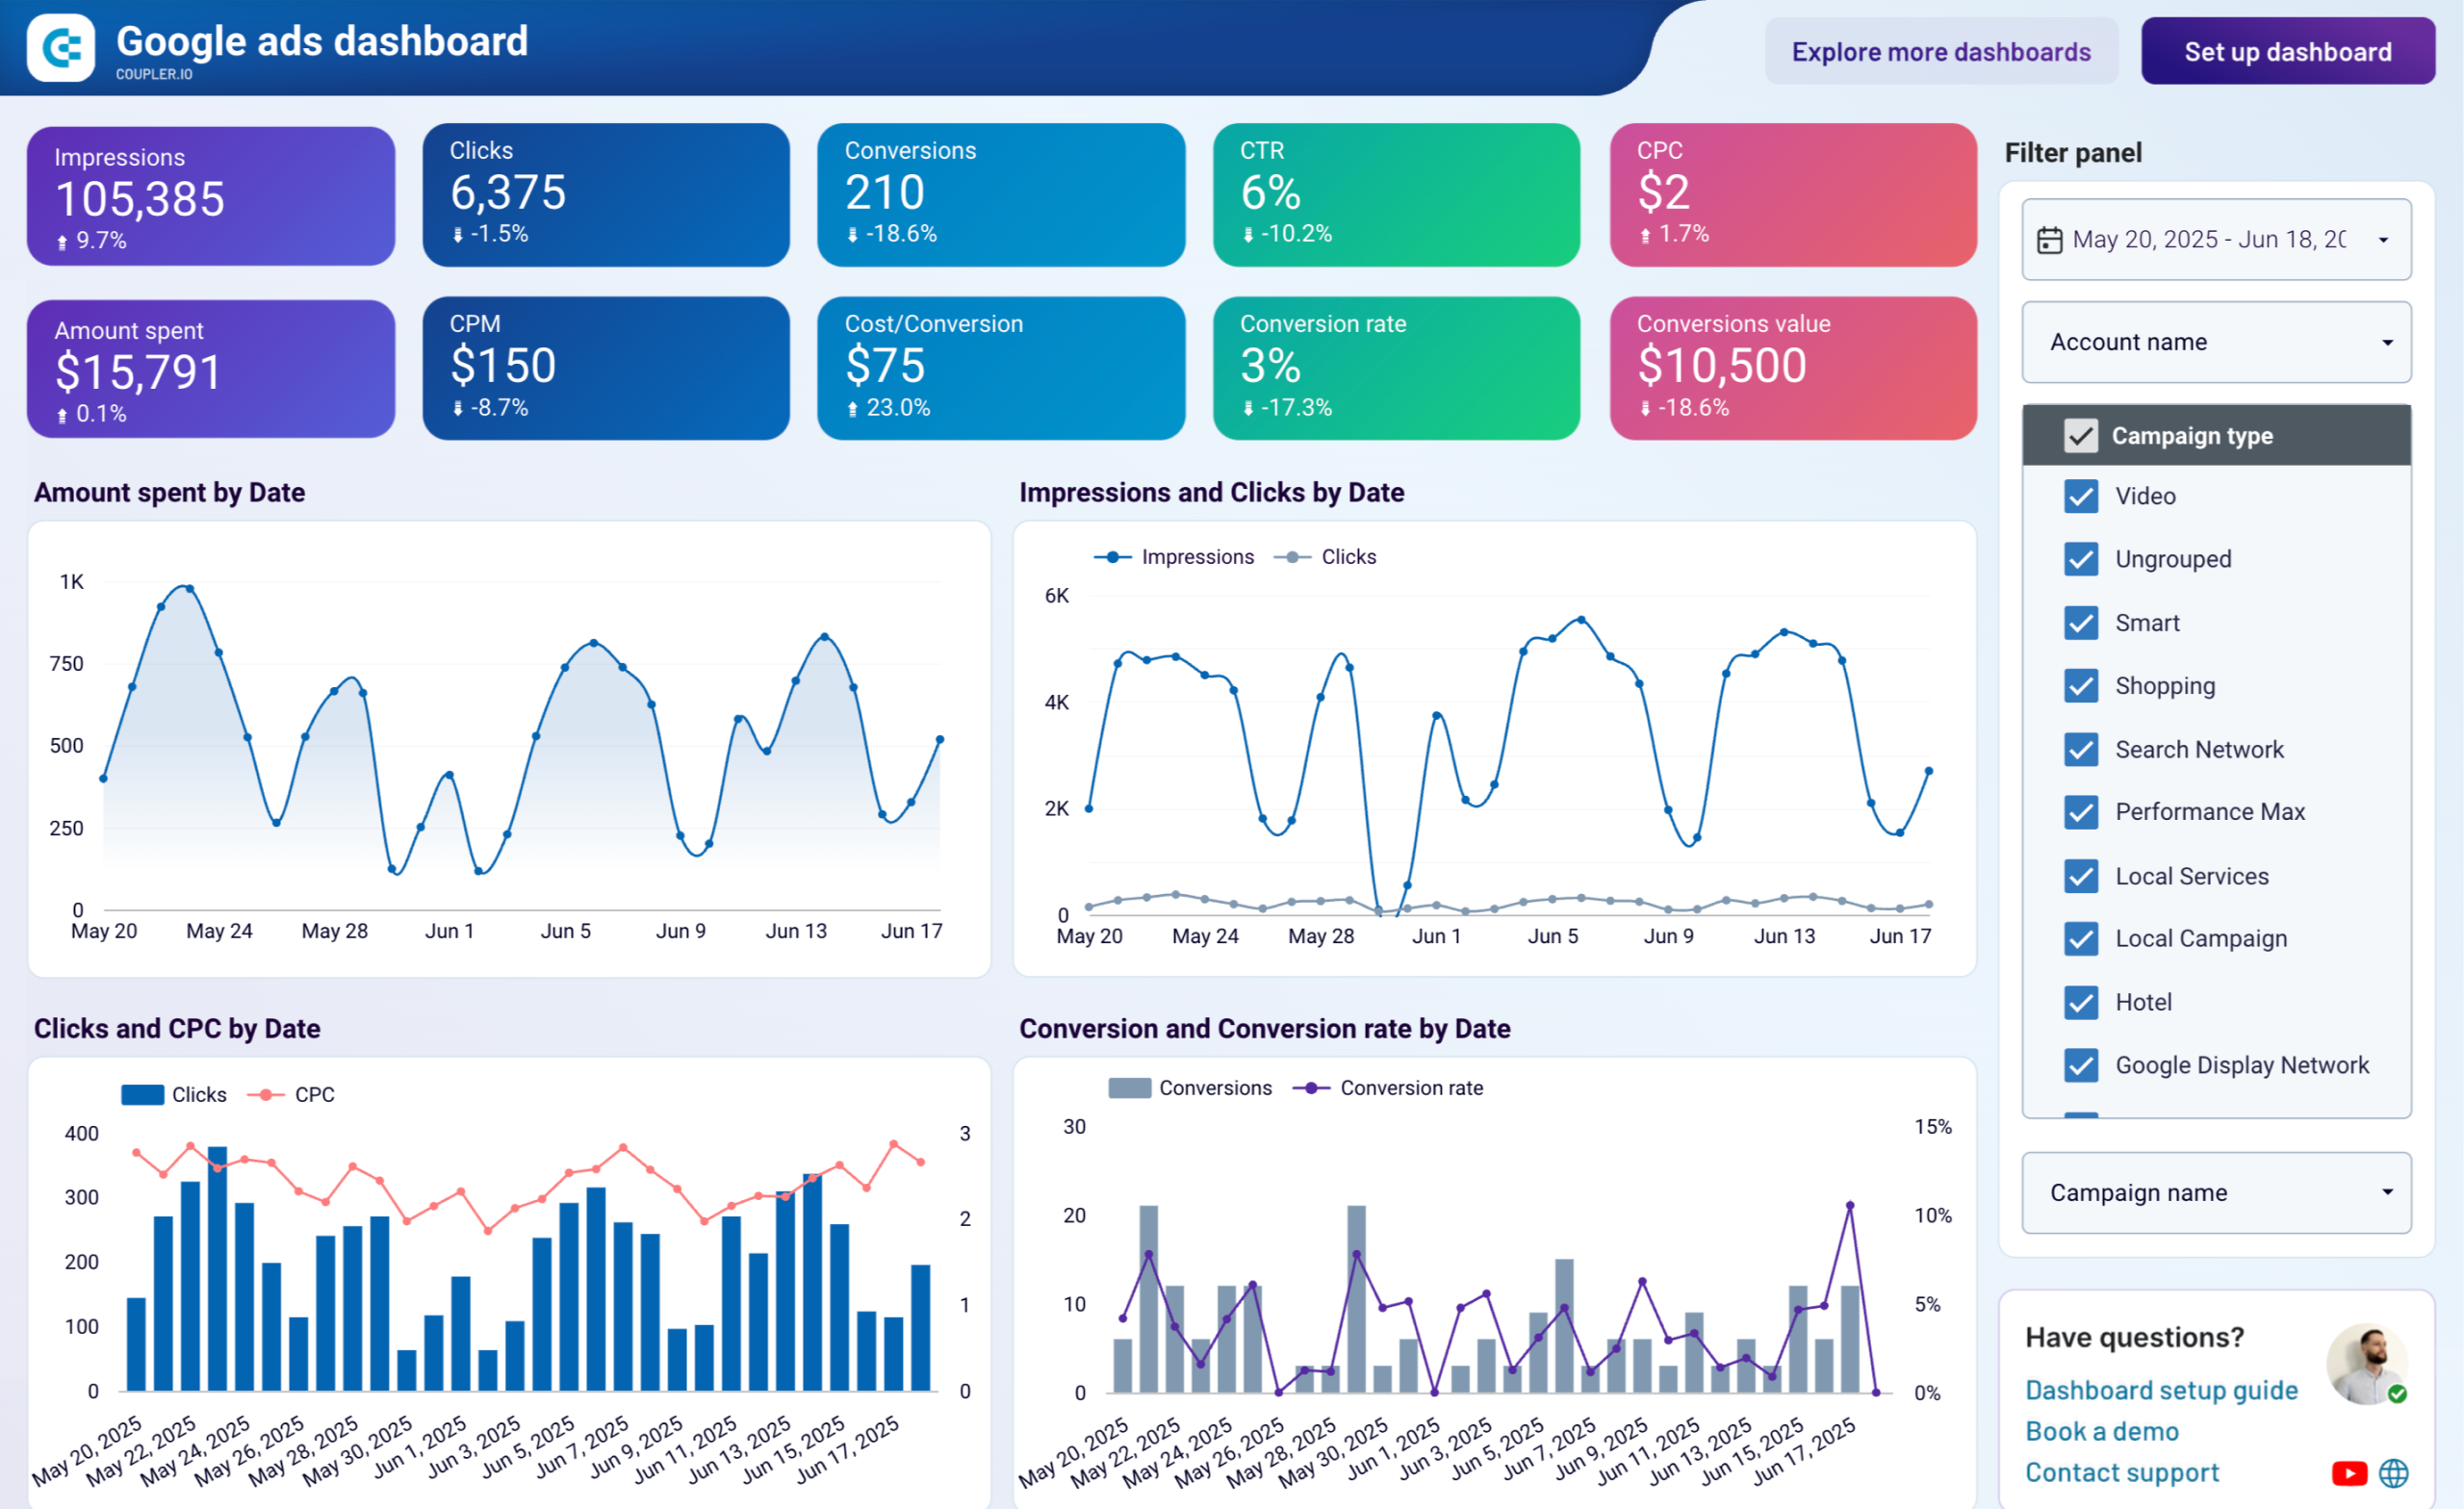
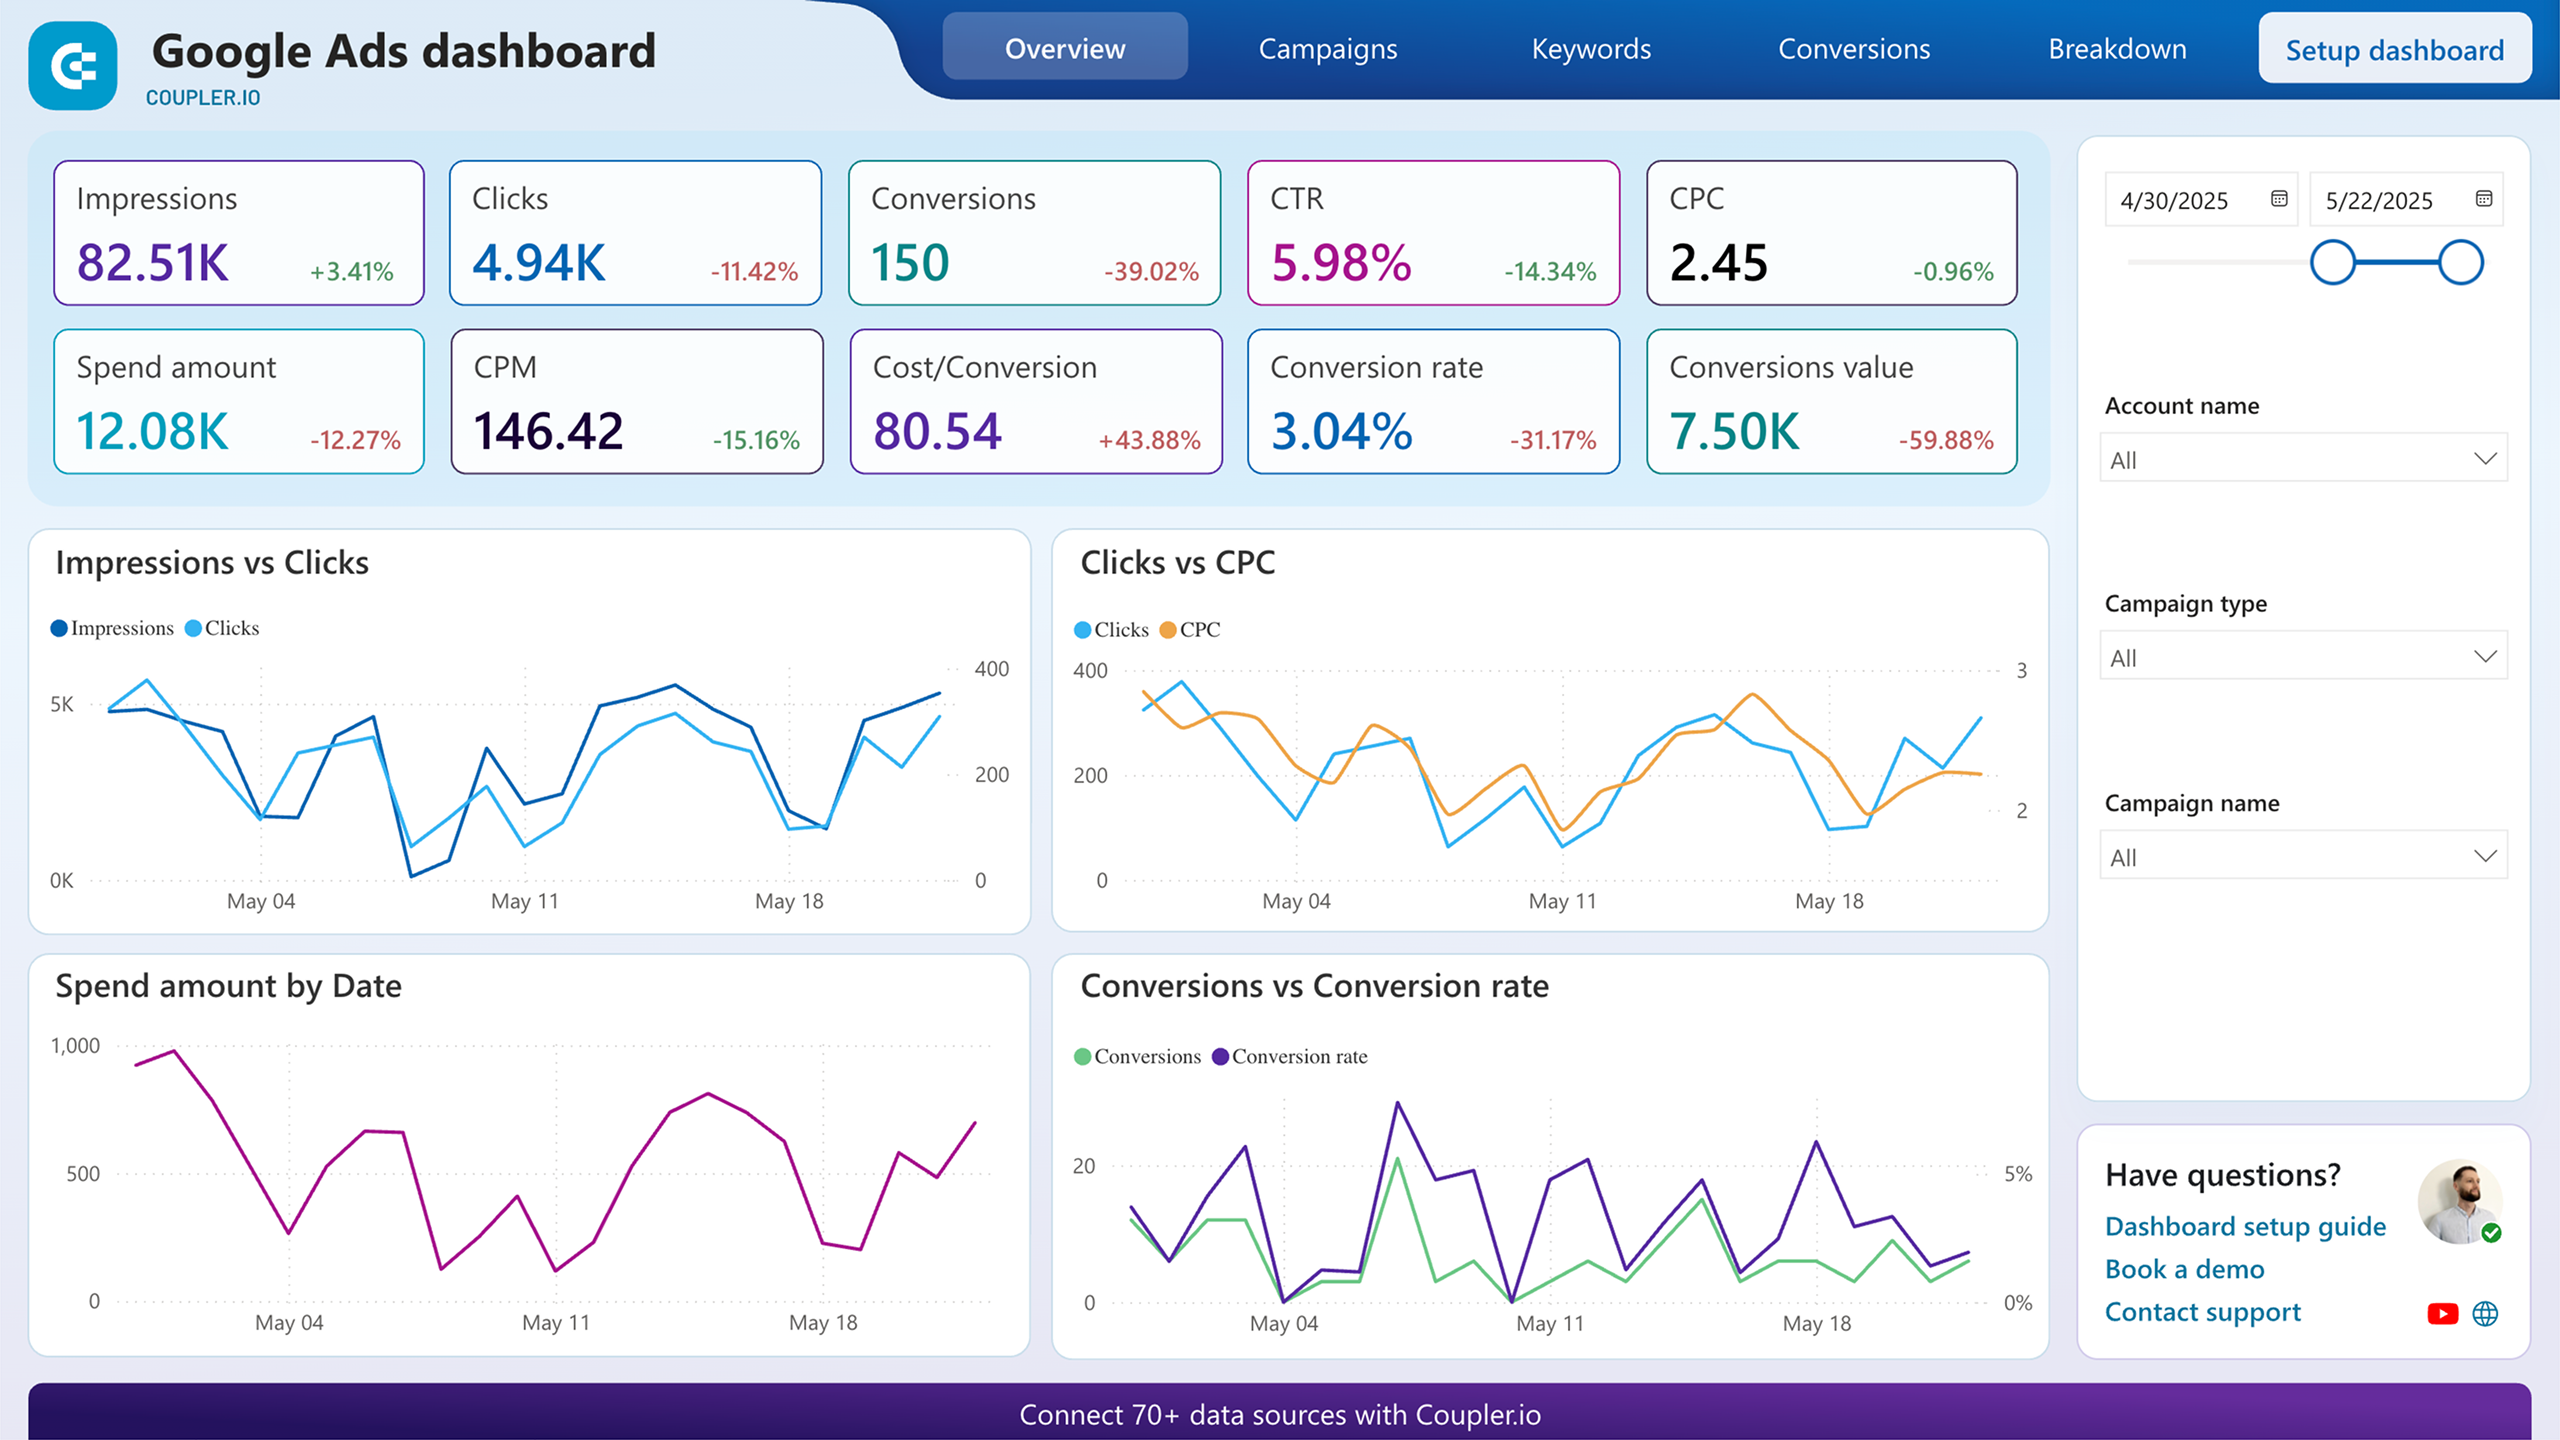
Google Ads dashboard template
The Google Ads dashboard is designed to help you track, measure, and maximise the effectiveness of your campaigns. It allows you to monitor key engagement and conversion metrics in a single screen and understand how your Google Ads strategy performs over time.
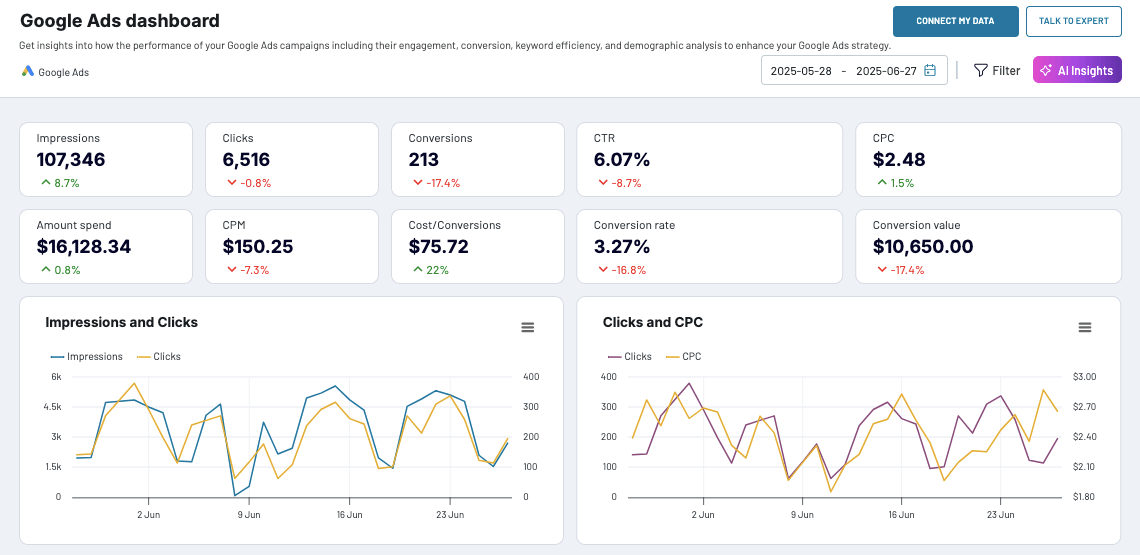
What you can do with this dashboard:
- Monitor correlations between impressions and clicks, clicks and CPC, etc., to better understand bidding efficiency and campaign dynamics.
- Identify your most profitable campaigns by their conversion rate, CPC, total number of conversions, and other key performance indicators. Use this information to double down on what’s working about your strategy.
- Get a detailed breakdown of conversion by age range, gender, device usage, and location to refine the characteristics of your target audience and increase the chances of engagement.
- Optimize budget allocation with scorecards and graphs for tracking the effectiveness of your campaign spending.
- Track keyword efficiency in a dedicated table graph to identify the keywords and campaign types worth further investment.
The dashboard template is available in the Coupler.io UI (with AI Insights) and in Google Sheets, Looker Studio, and Power BI. To make a copy for yourself, simply sign up for a free Coupler.io account and connect your data in minutes.
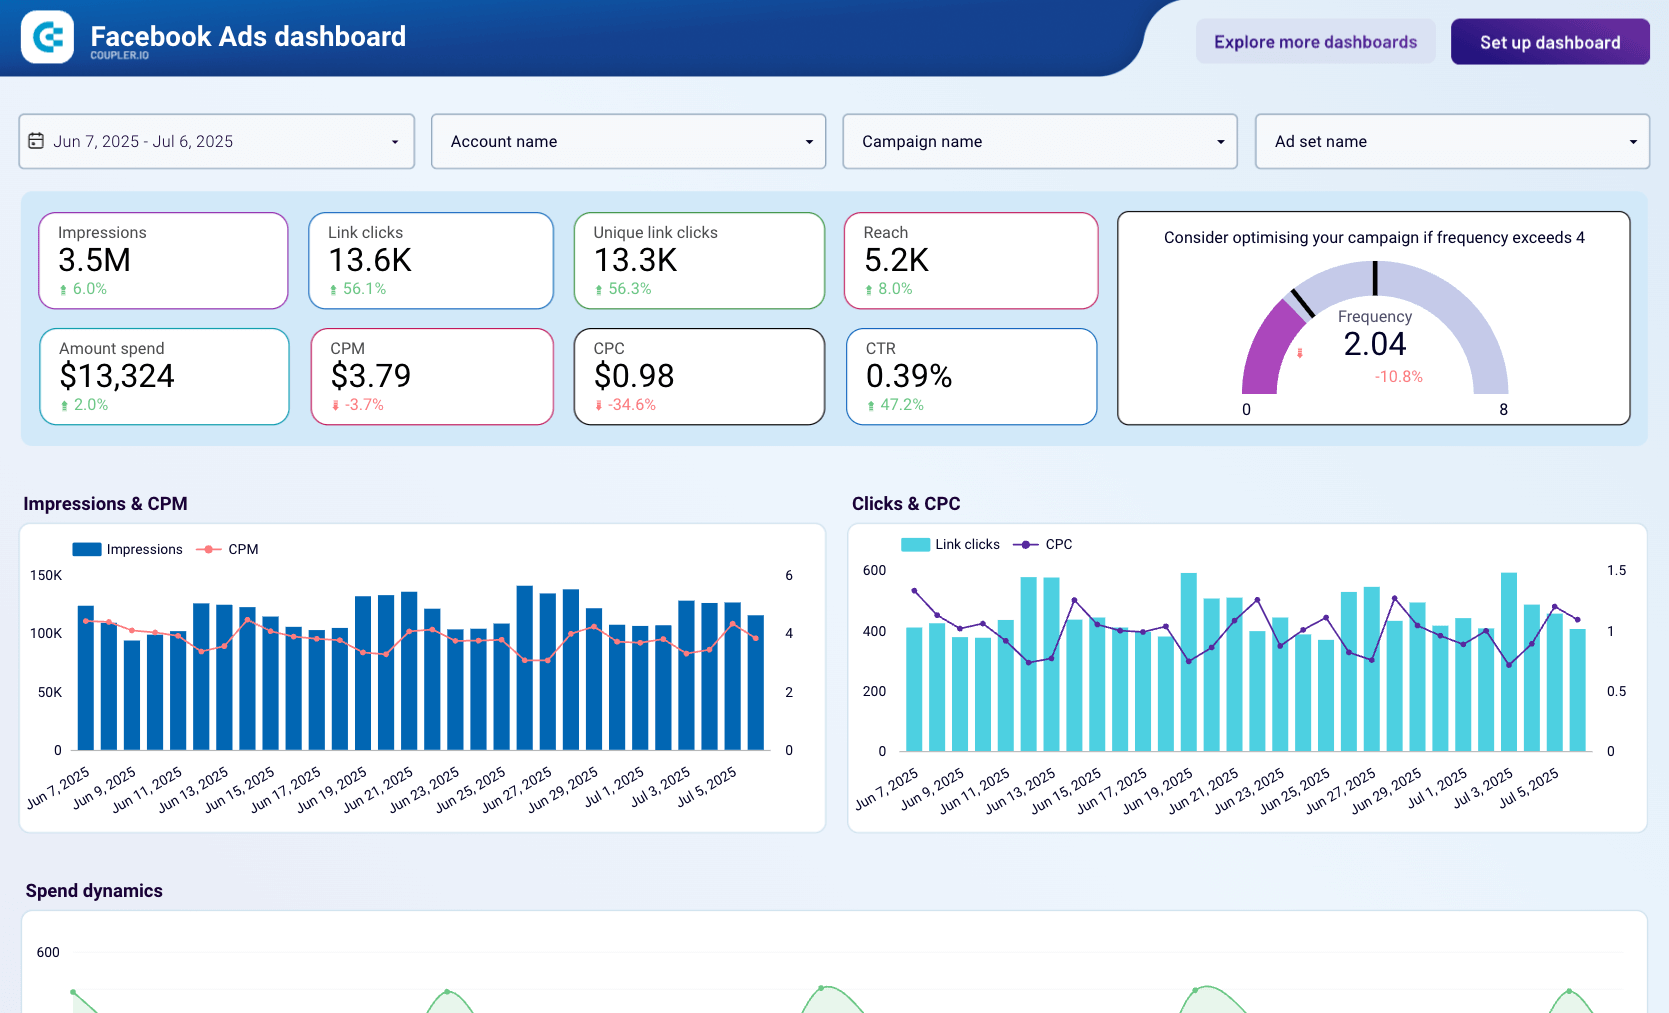
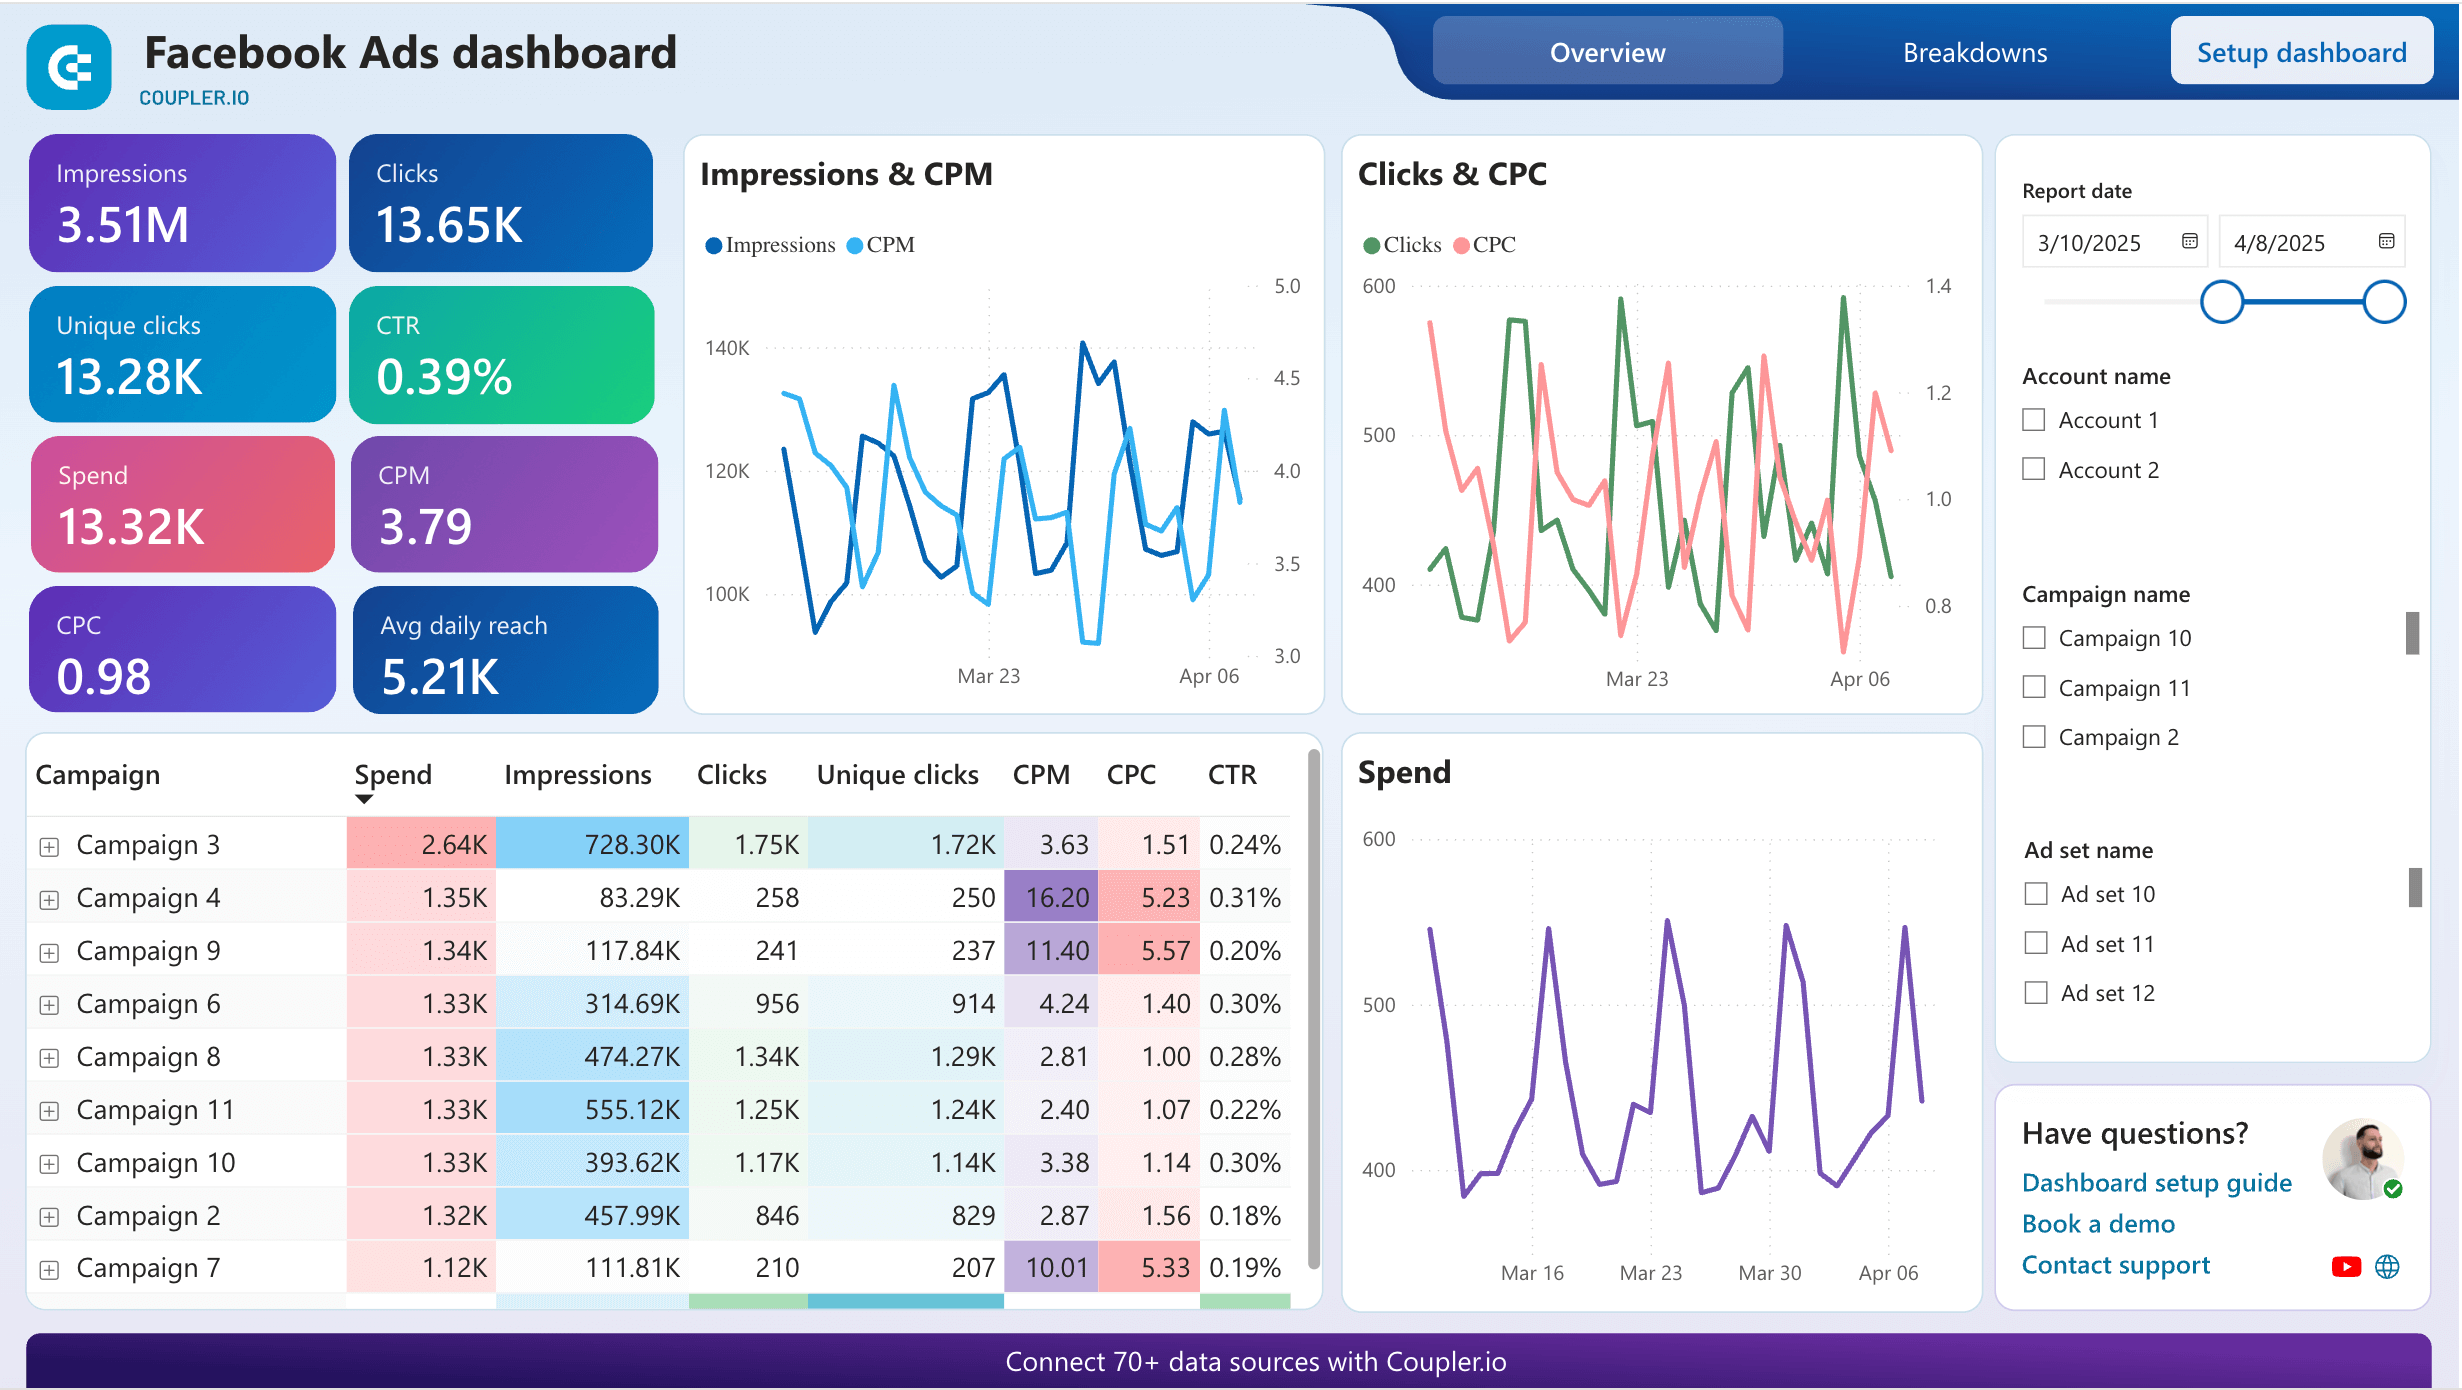
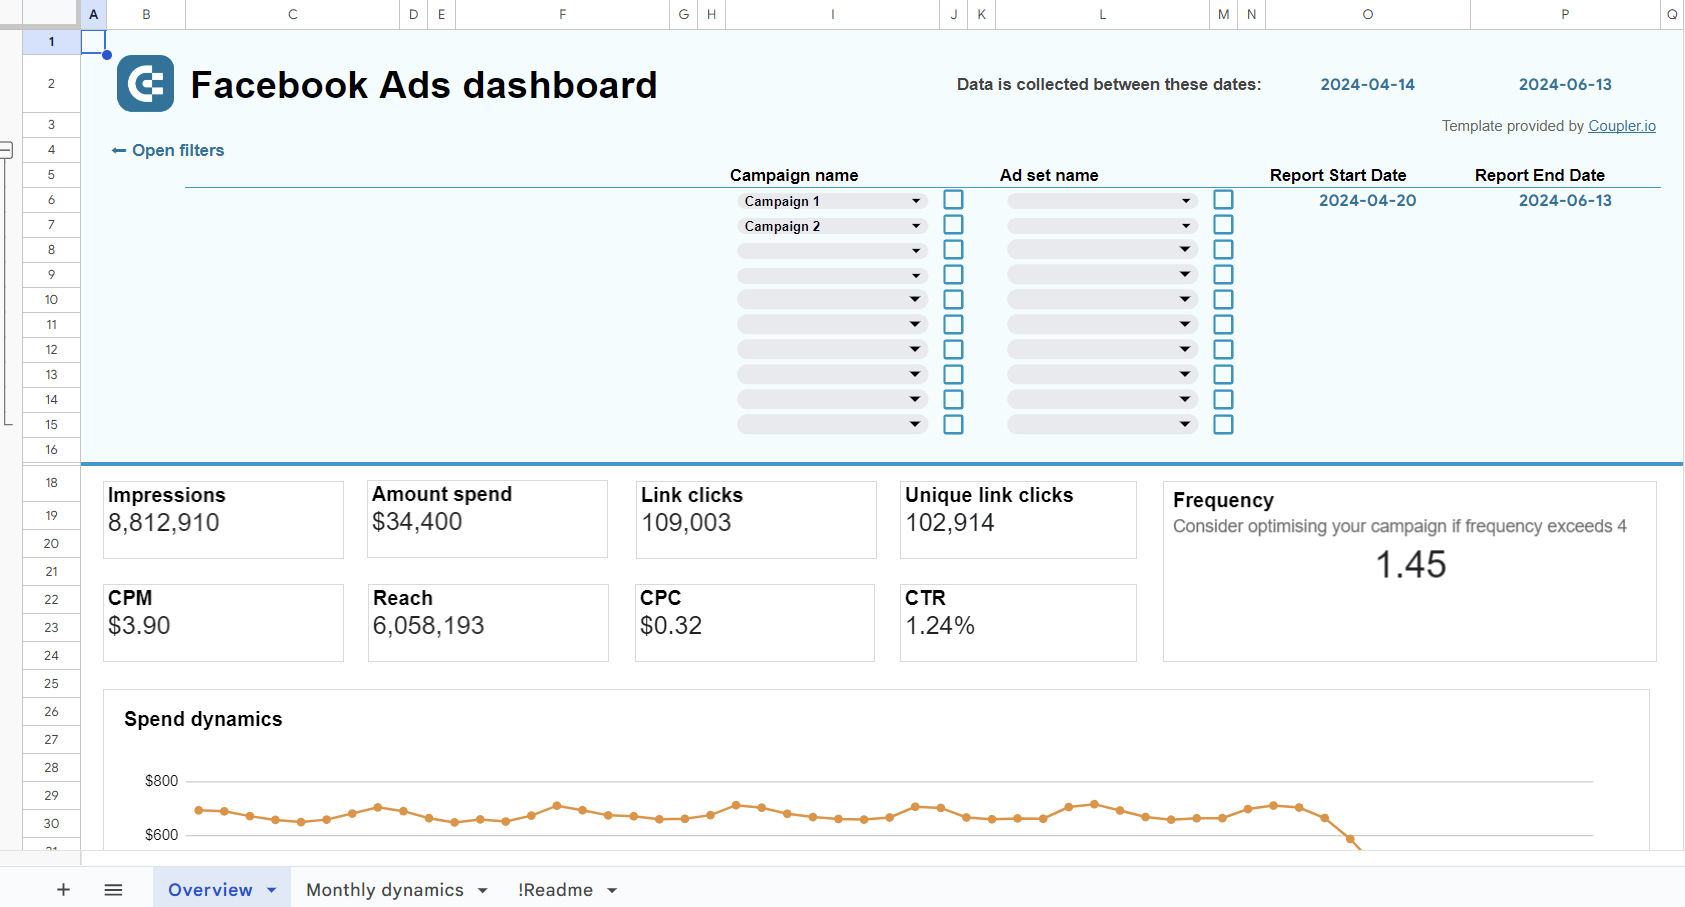
Facebook Ads dashboard template
This dashboard provides a detailed overview of your Facebook Ads campaigns’ performance. You can track key metrics such as impressions and link clicks, filter the data by time period, monitor spend dynamics, and much more – all without having to poke around in the Meta Ads manager interface.
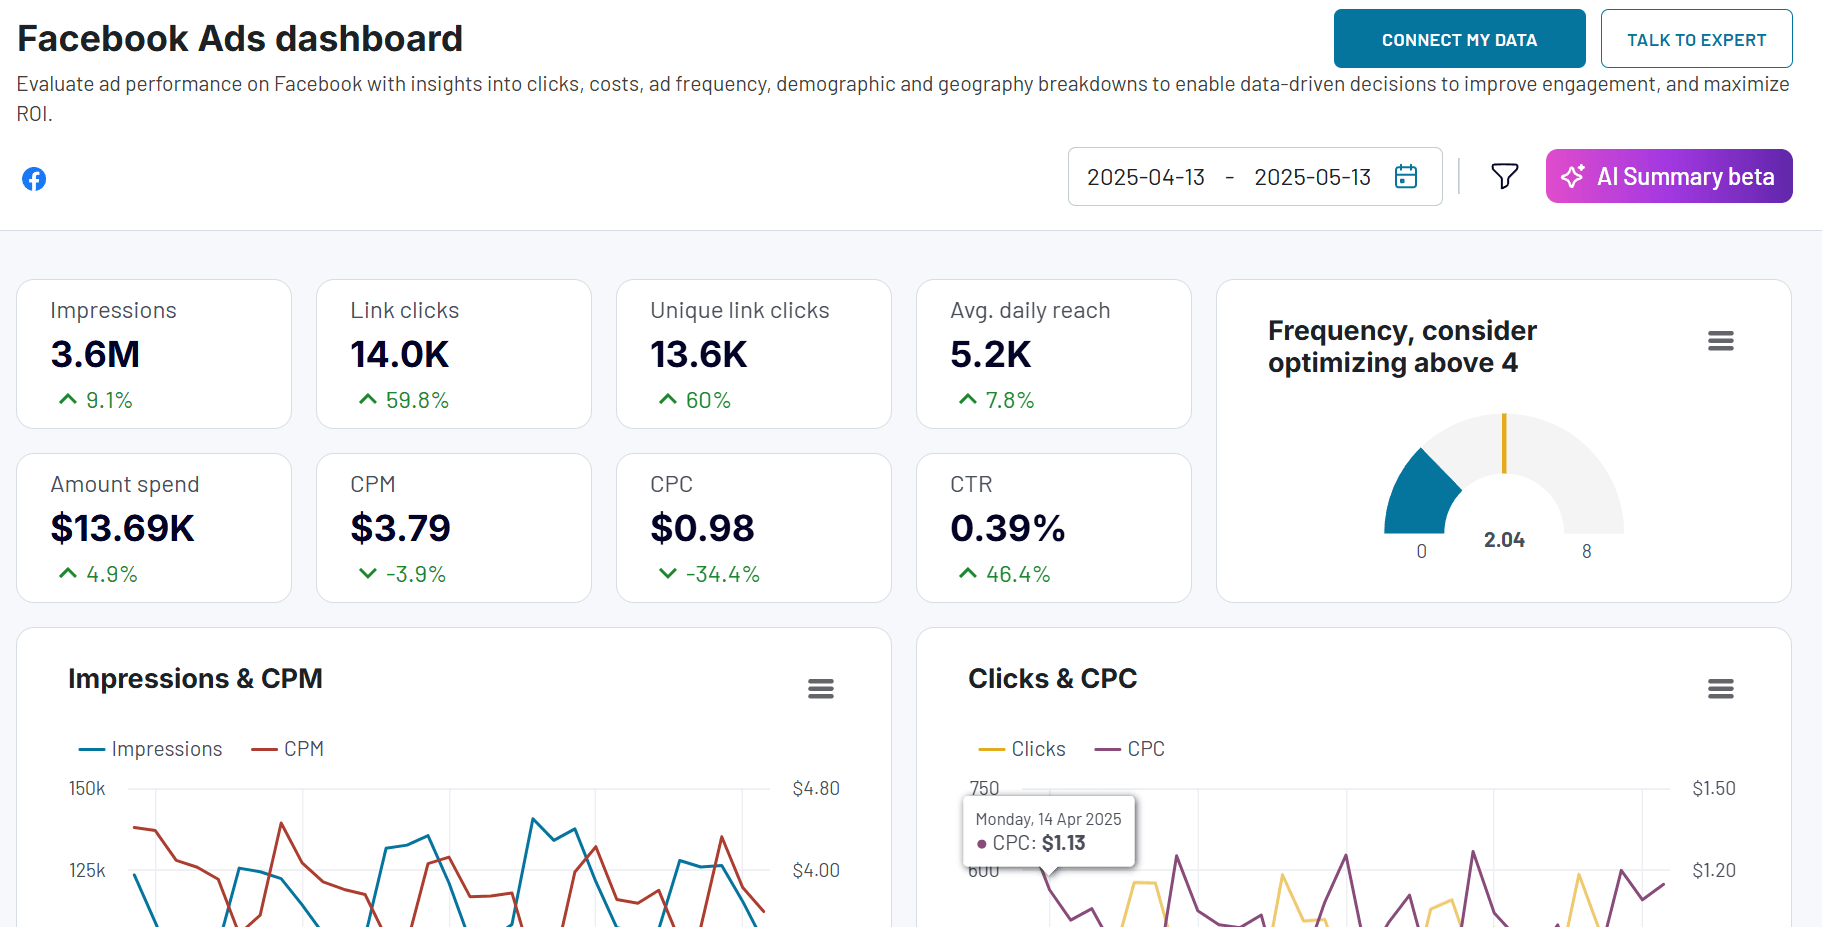
What you can do with this dashboard:
- Track ad frequency to avoid ad fatigue and ensure users see your ads the right number of times, i.e., no more than 4.
- Review monthly trends for key metrics like impressions, clicks, and CPC in simple scorecards, charts, and graphs.
- Analyze demographics (gender, device, country) to understand which audience segments drive the most engagement with your campaigns.
- Identify your highest-traffic countries and discover opportunities to localize ad creatives or refine your audience targeting strategies.
- Optimize budget allocation by quickly spotting which campaigns generate the best return on investment.
You can find a version of this template available in the Coupler.io UI or in your preferred BI tool: Google Sheets, Looker Studio, and Power BI. It takes less than 5 minutes to sign up for a Coupler.io account, create a copy of the template, and automate the flow of Facebook Ads data on a schedule.
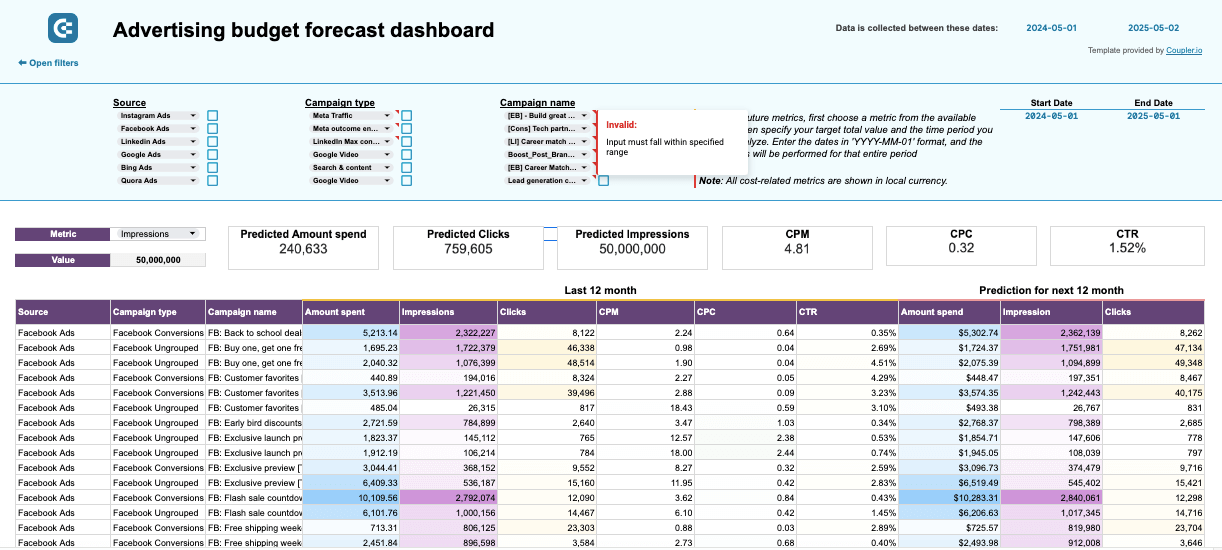
Advertising budget forecast dashboard template
This dashboard provides deeper insights into the health and dynamics of your PPC campaigns. It consolidates data from multiple channels to help you forecast ad engagement and spending for the next 12 months.
Advertising budget forecast dashboard
 Preview dashboard
Advertising budget forecast dashboard
Preview dashboardWhat you can do with this dashboard:
- Get a detailed performance breakdown of campaigns run across all platforms (e.g., Facebook, Google, TikTok, etc.) for the past 12 months. Access spending, impression, and clicks predictions for individual campaigns as well as combined totals.
- Uncover budgeting predictions to shape your annual PPC marketing strategy and make informed spending decisions.
- Compare planned spending to actual spending to see how well you’re staying on track with your budget allocations.
- Track the dynamics of key metrics, such as impressions, clicks, CPC, and amount spent in a seamless, structured interface.
This dashboard template is available for free in Google Sheets with a Coupler.io account.
Learn about advertising funnels and how to create one for analysis. If you regularly run campaigns on LinkedIn, check out the dedicated guide to LinkedIn Ads analytics.
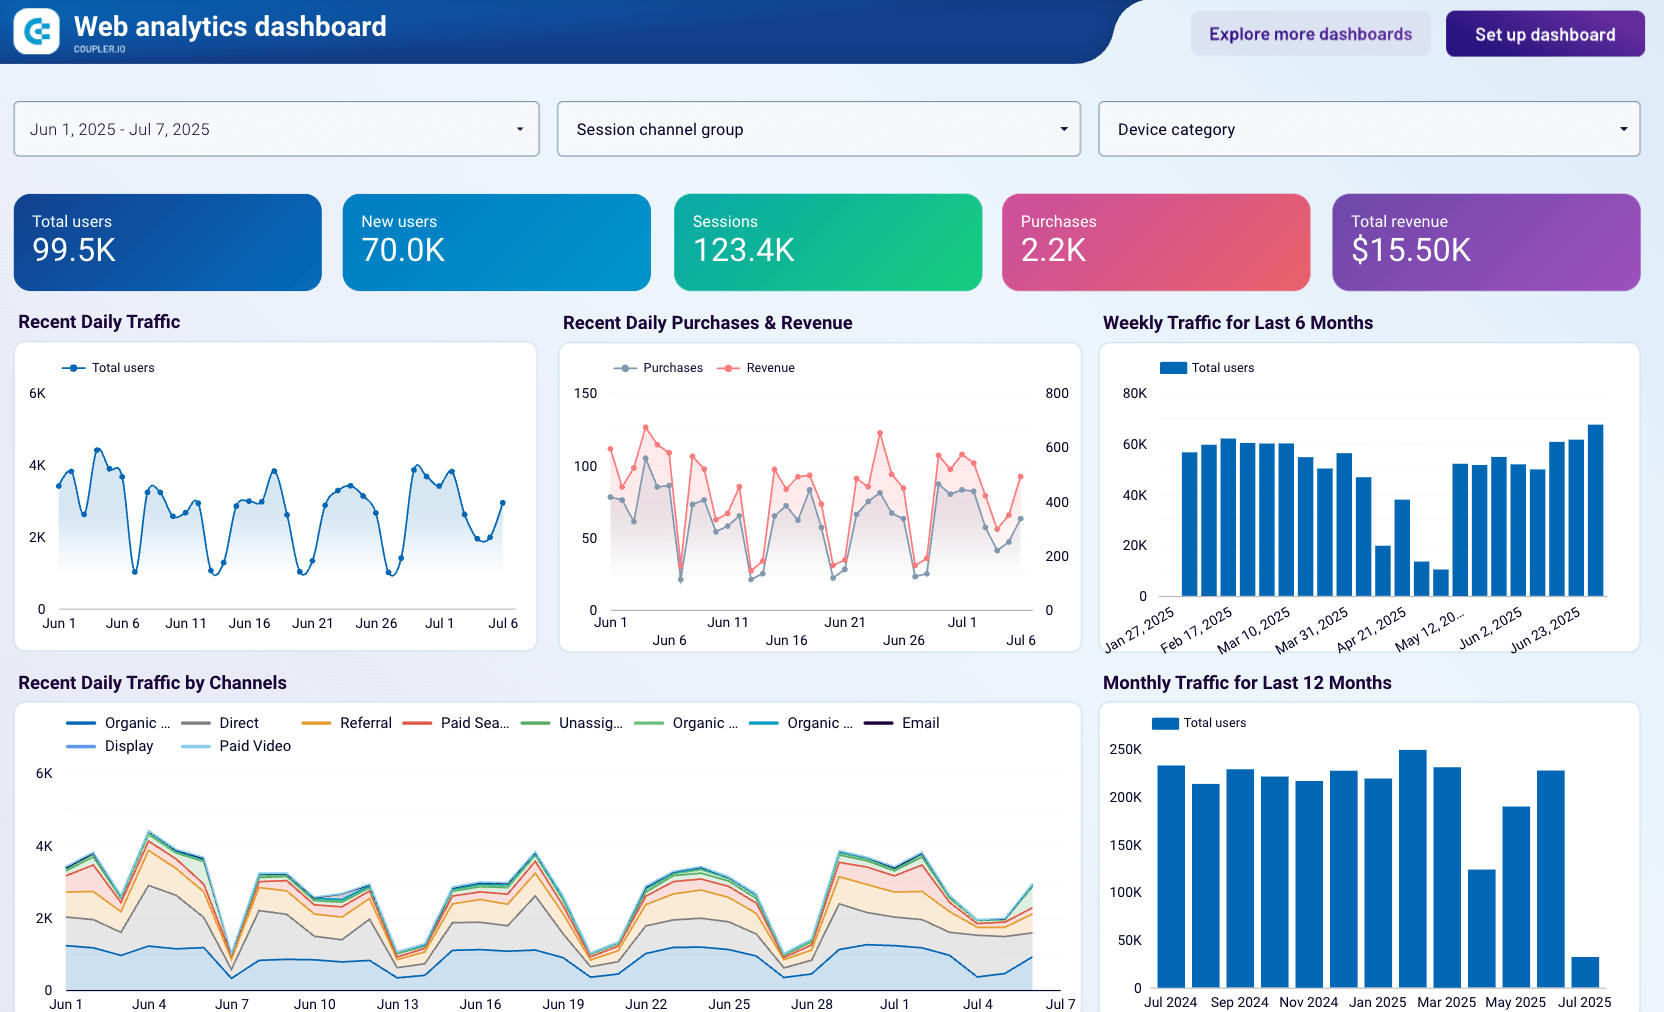
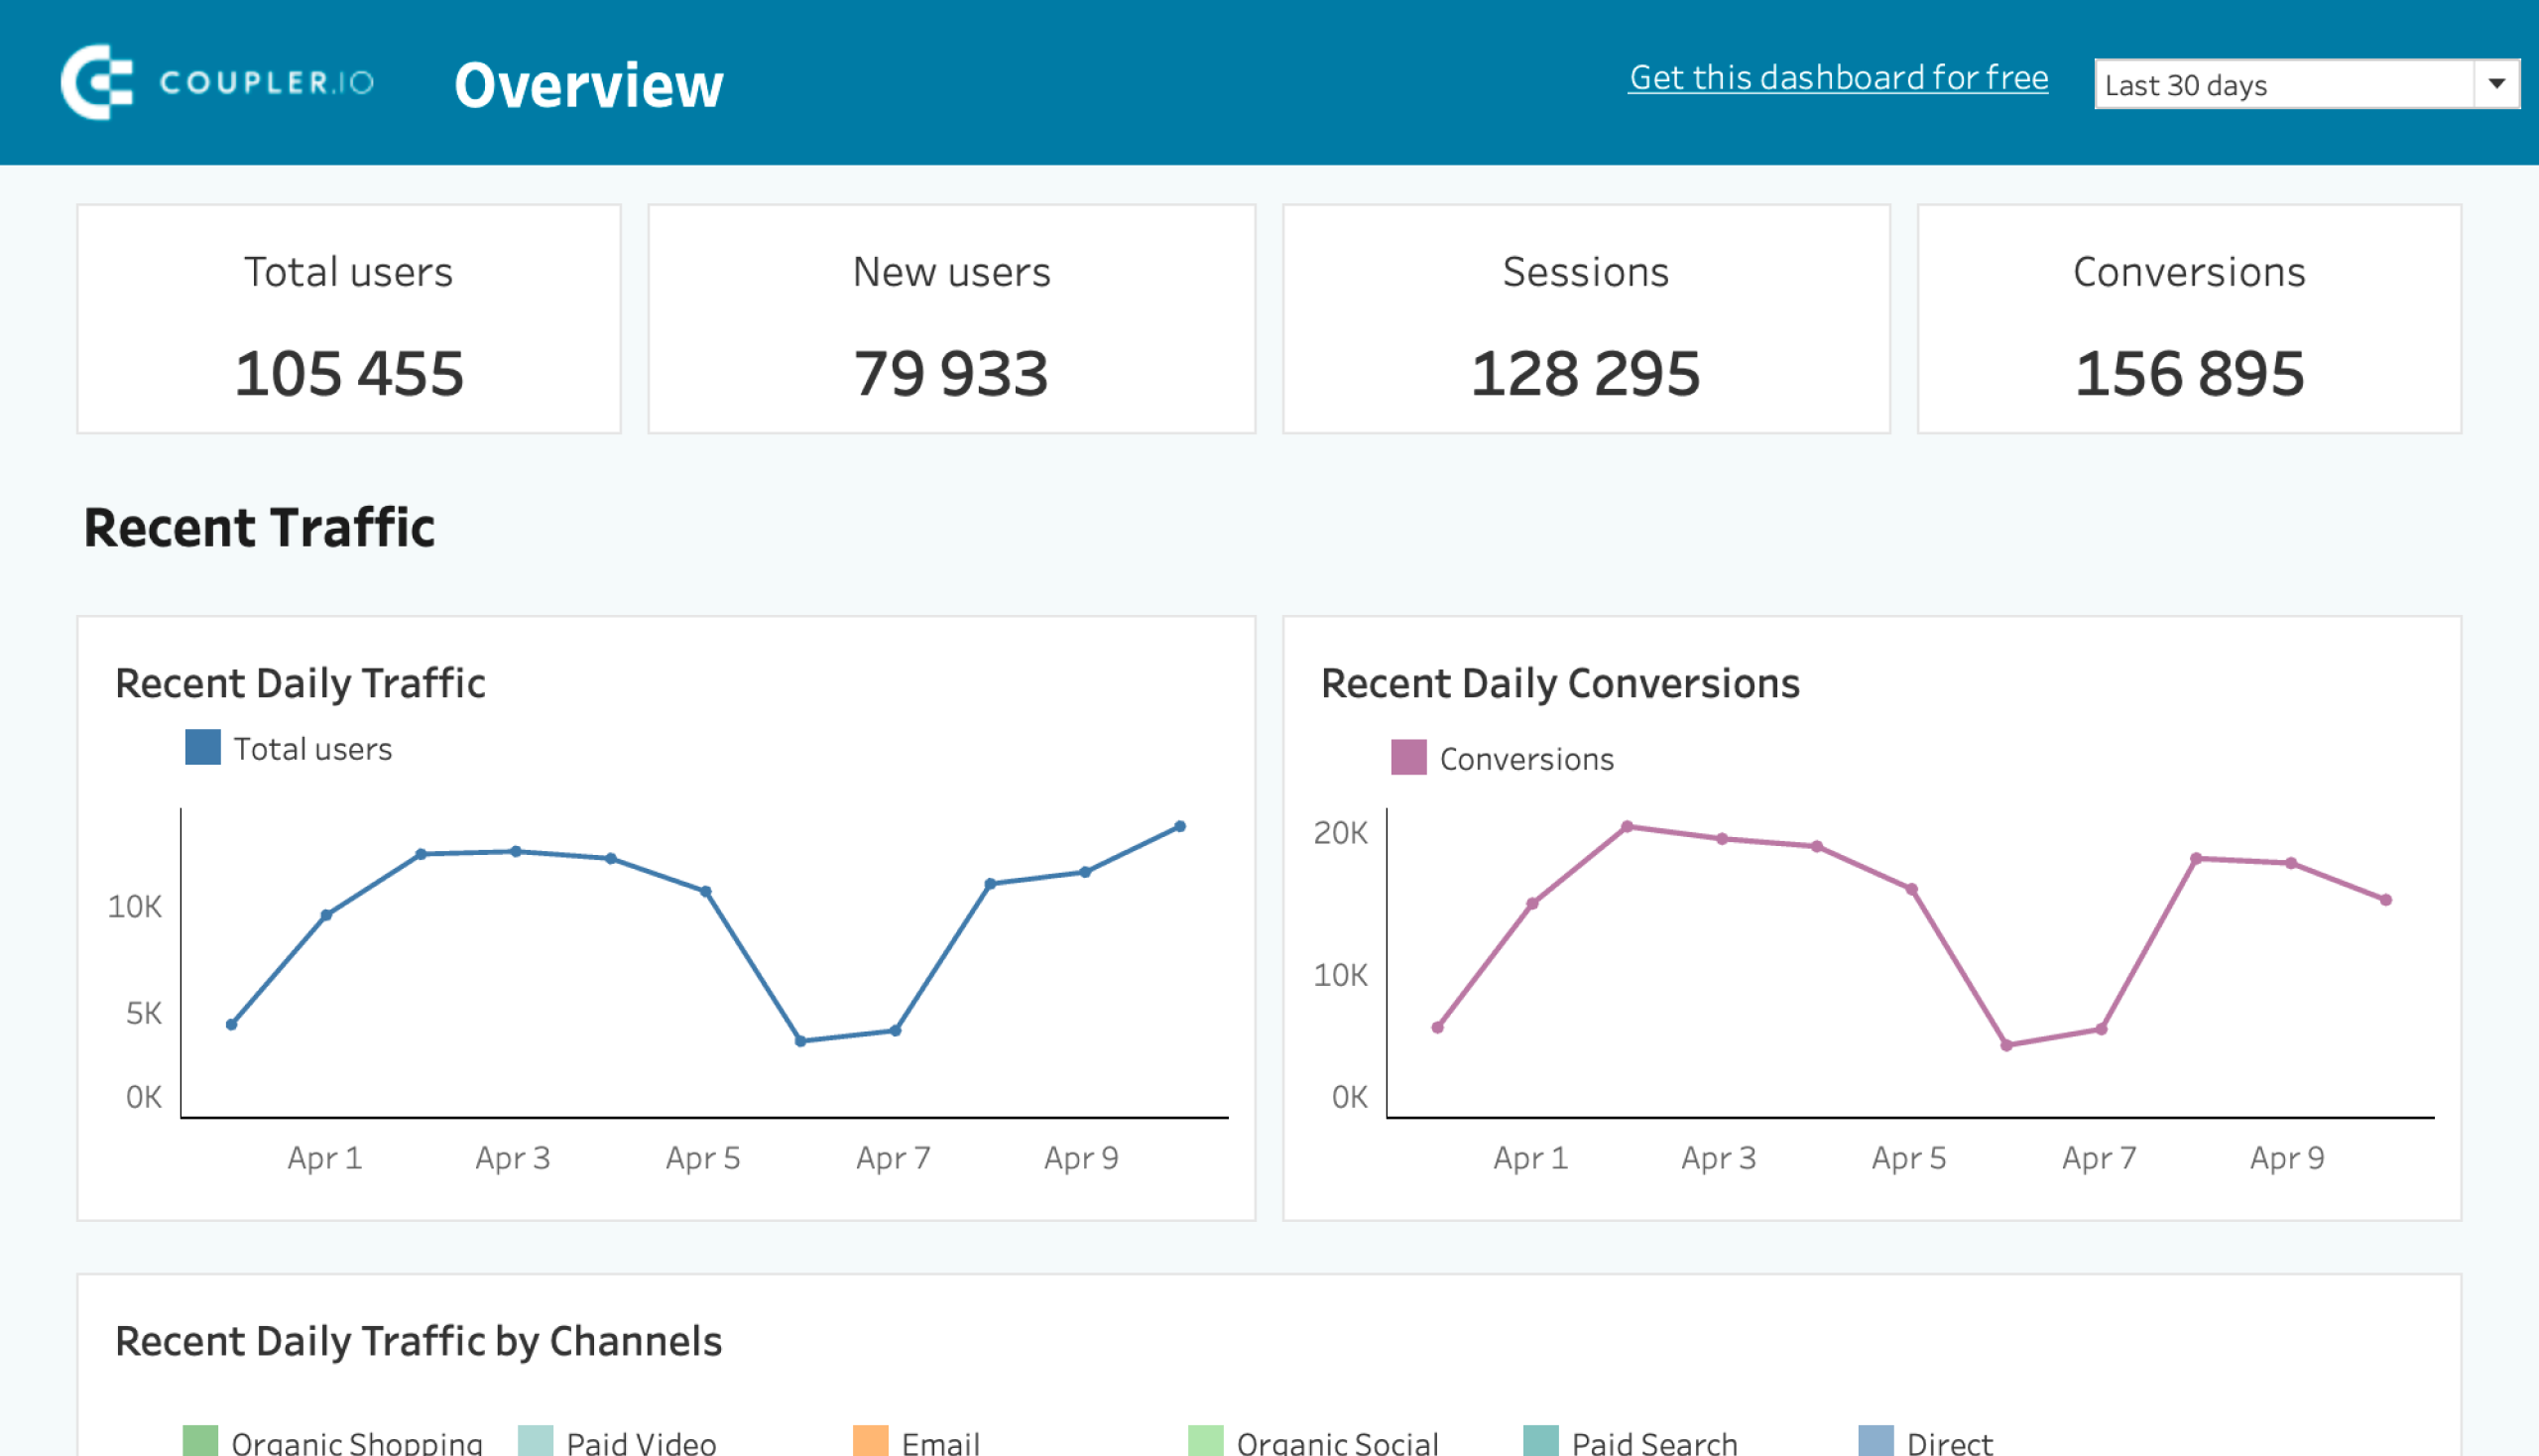
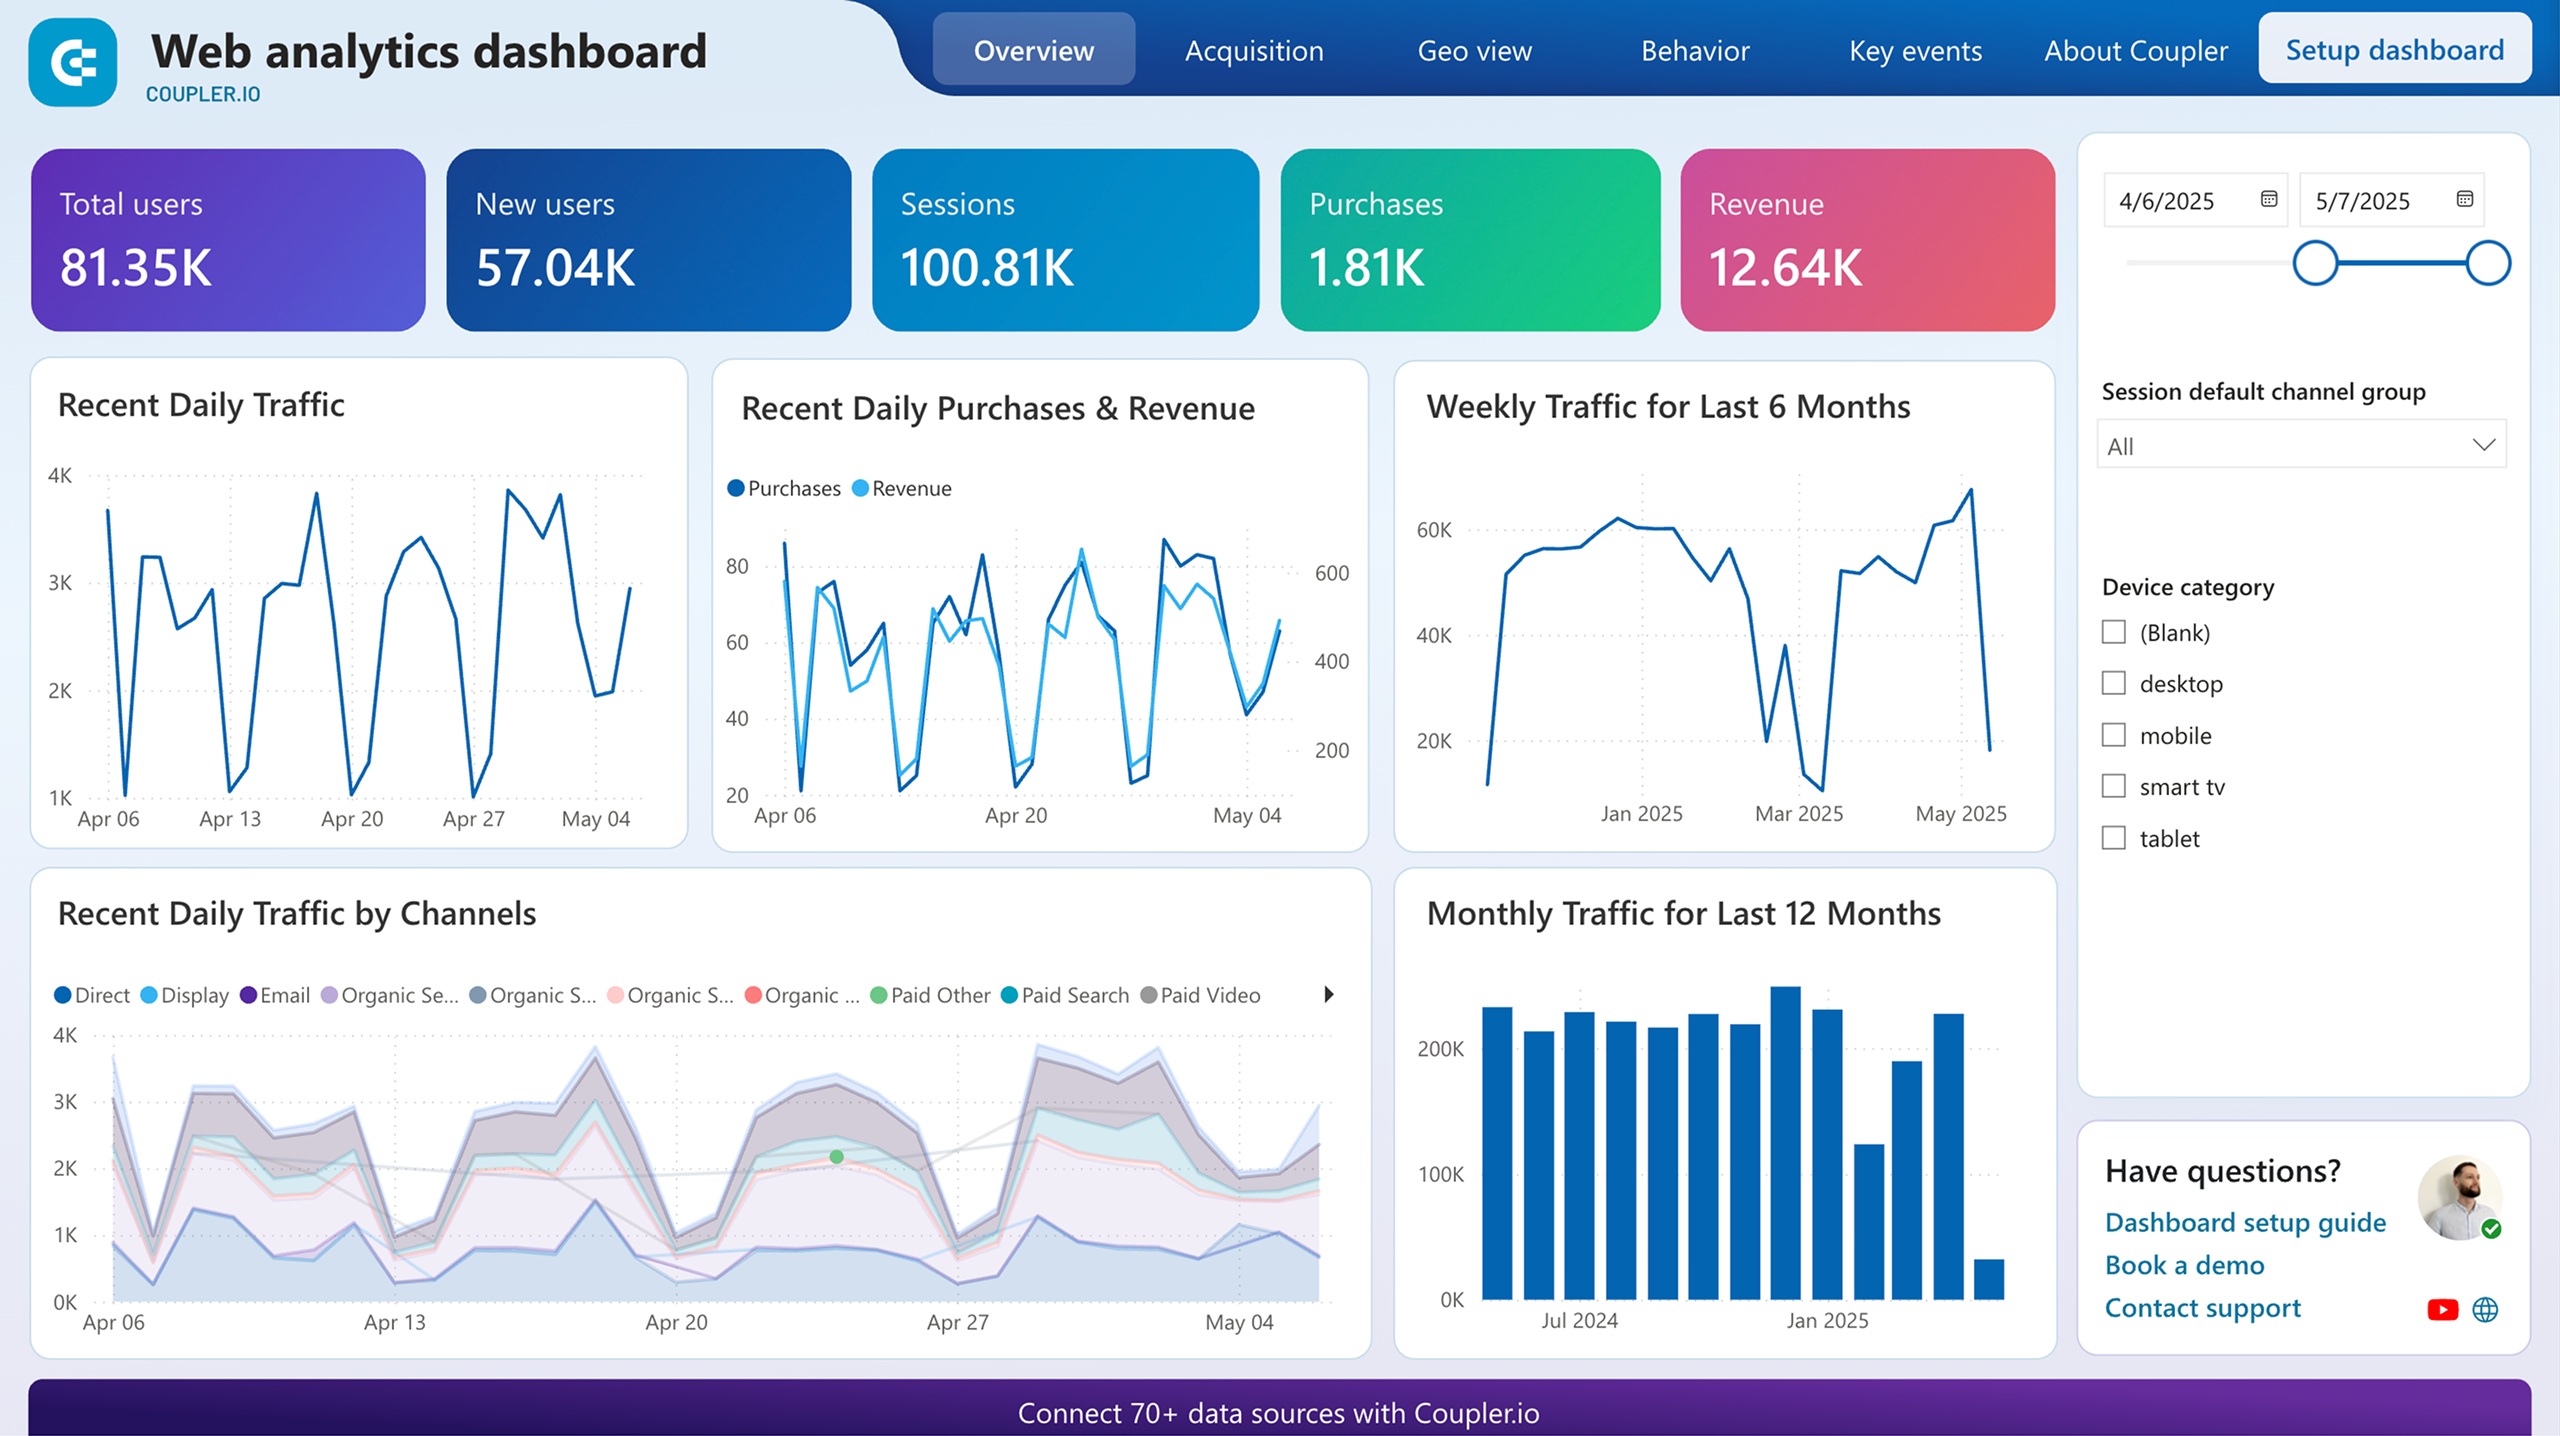
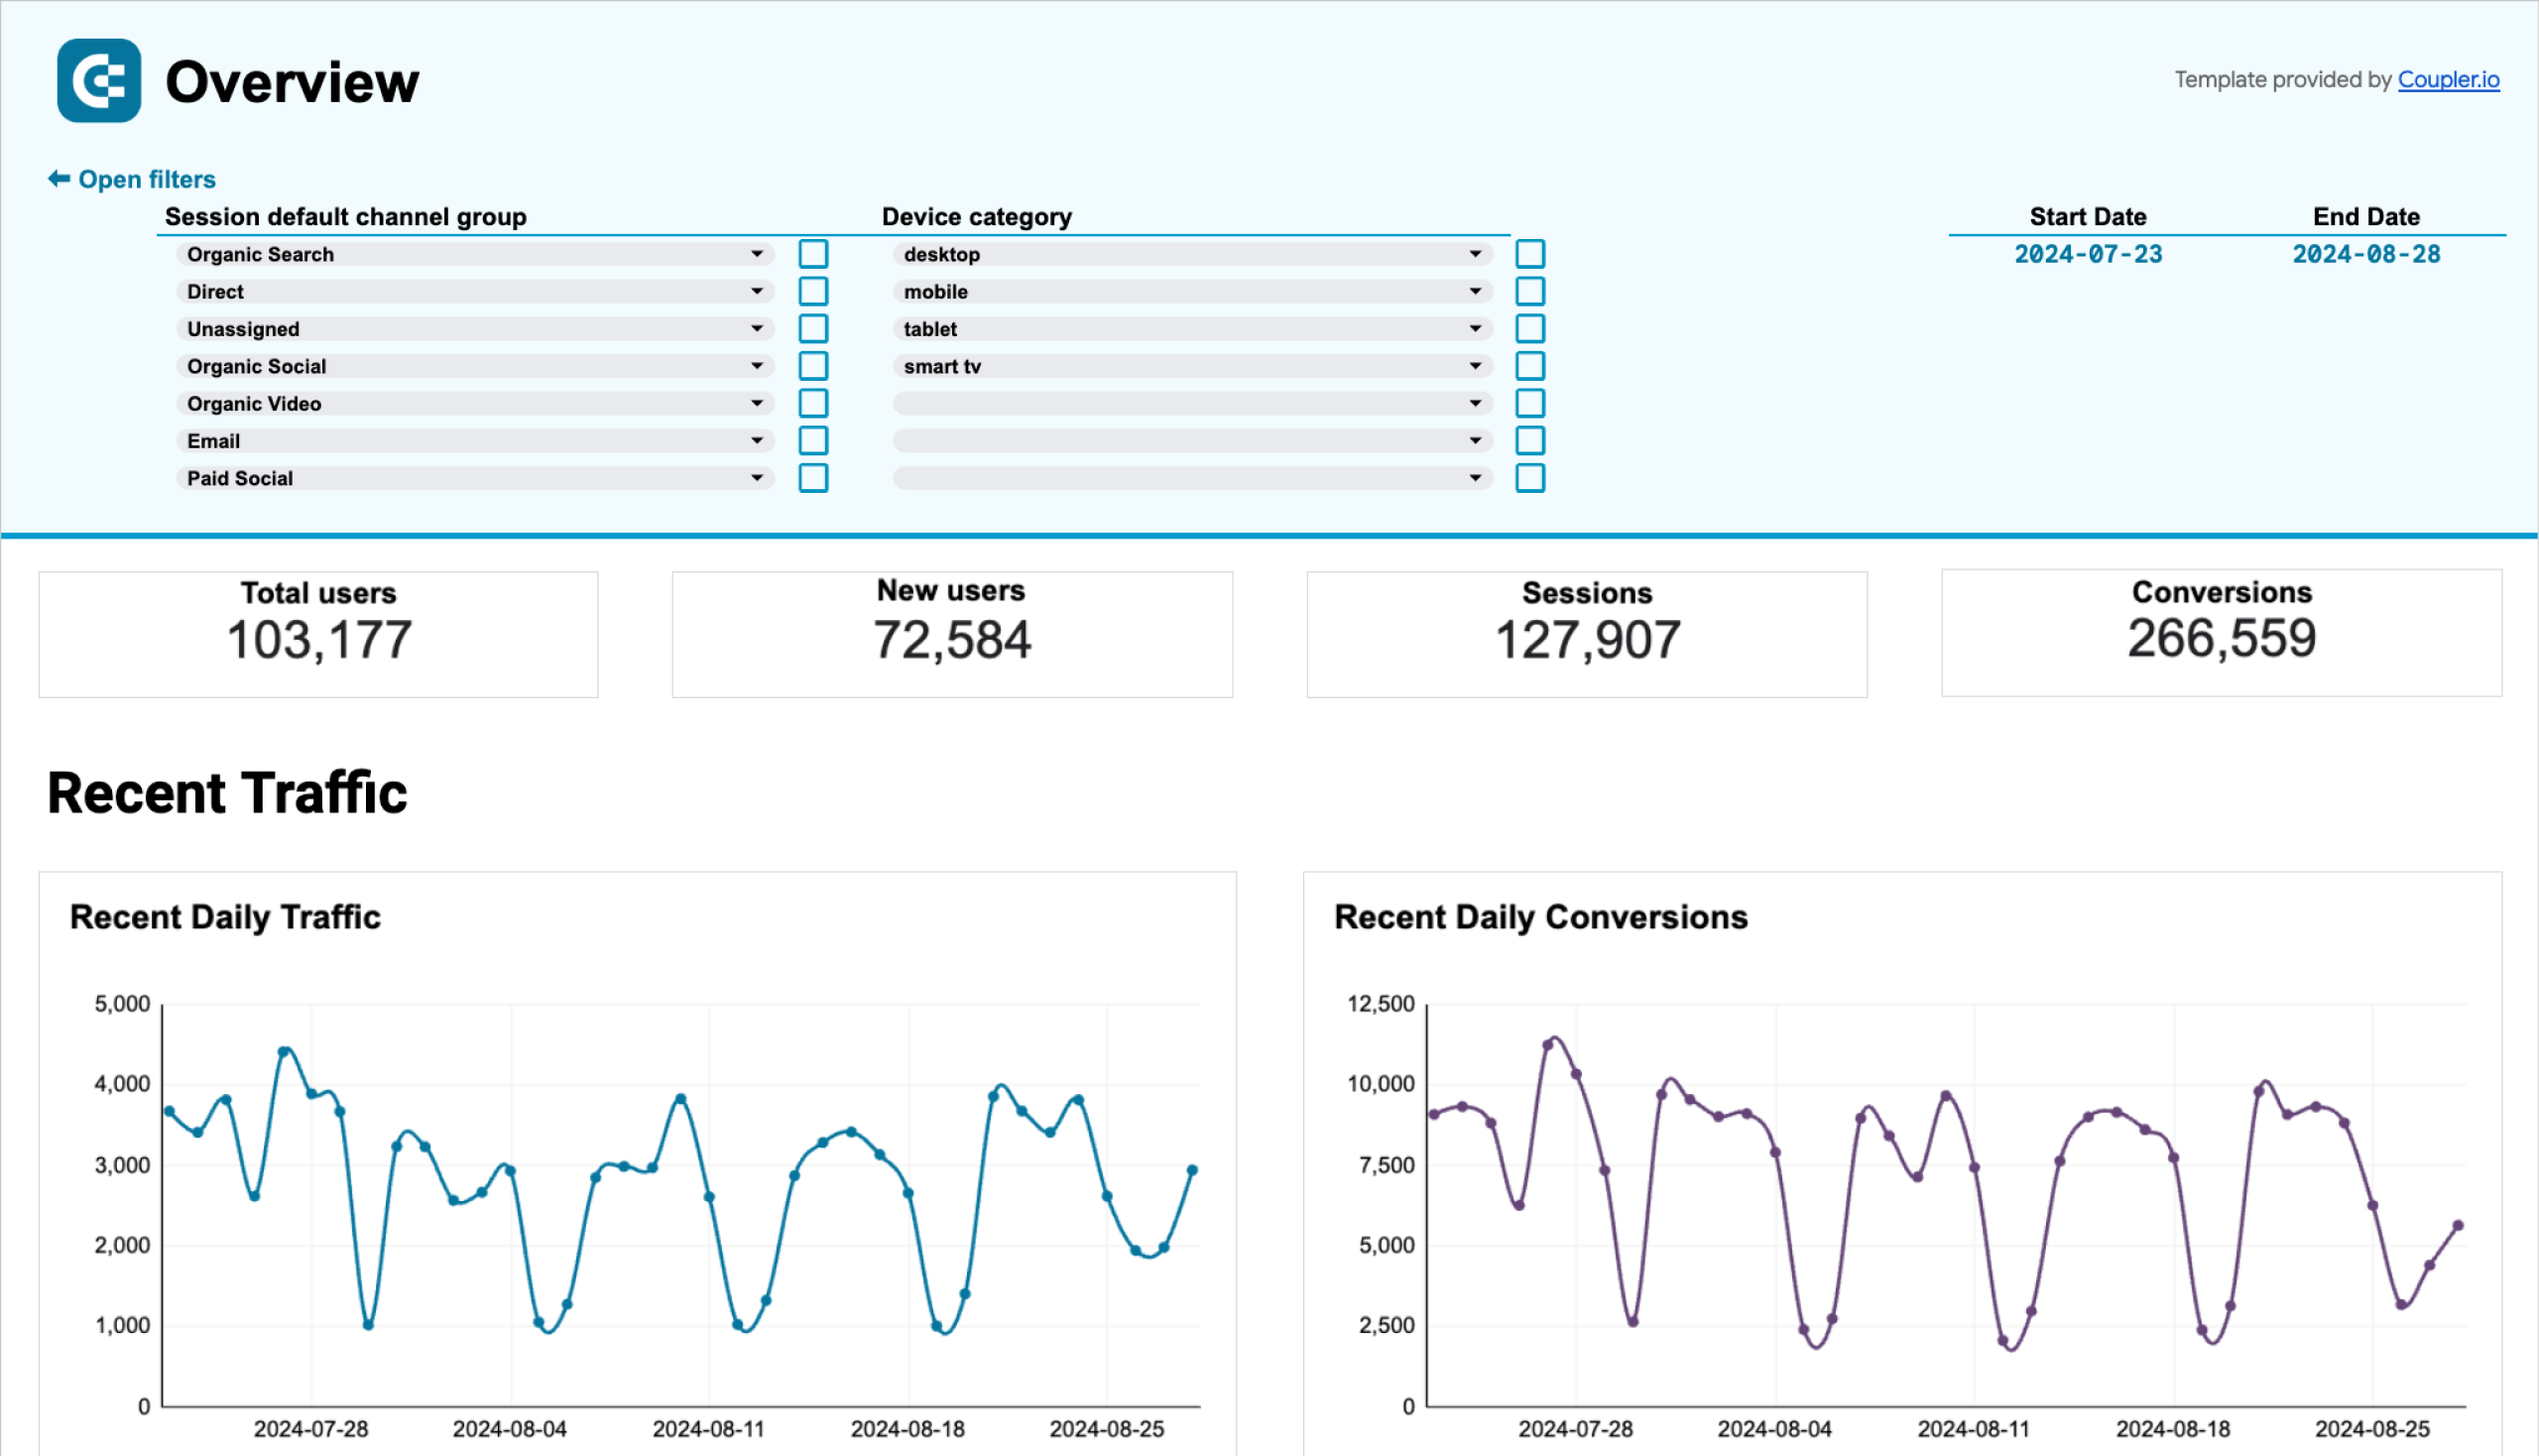
Web analytics dashboard template
The web analytics dashboard gives you a clear view of how visitors interact with your website, from their behavior patterns to their demographics. It pulls data from GA4, allowing you to easily track performance metrics (e.g., new users, purchases, etc.), weekly and monthly traffic dynamics, and key events triggered in your account.
What you can do with this dashboard:
- Track total users, new users, sessions, conversions, revenue, and other critical metrics on one screen. Filter by date, device category, or traffic source to uncover user behavior patterns and seasonal trends.
- Analyze traffic sources and understand which countries and channels are driving your audience growth.
- Monitor conversion rates, purchase data, and revenue performance over time to measure the success of your website content.
- Use the dedicated pages for acquisition, behavior & audience, and conversion to analyze different aspects of your website performance and unlock deeper insights about your target audience.
A version of this template is available in Looker Studio, Tableau, Power BI, and Google Sheets. Sign up for a free Coupler.io account, connect your GA4 data, and schedule automatic data refreshes in a couple of clicks:
YouTube analytics dashboard template
The YouTube analytics dashboard provides an overview of your video performance, showing which content resonates with viewers and drives results. You can track key metrics like views, shares, subscribers, and clicks to identify potential issues, refine your video content strategy, and boost your channel’s overall engagement.
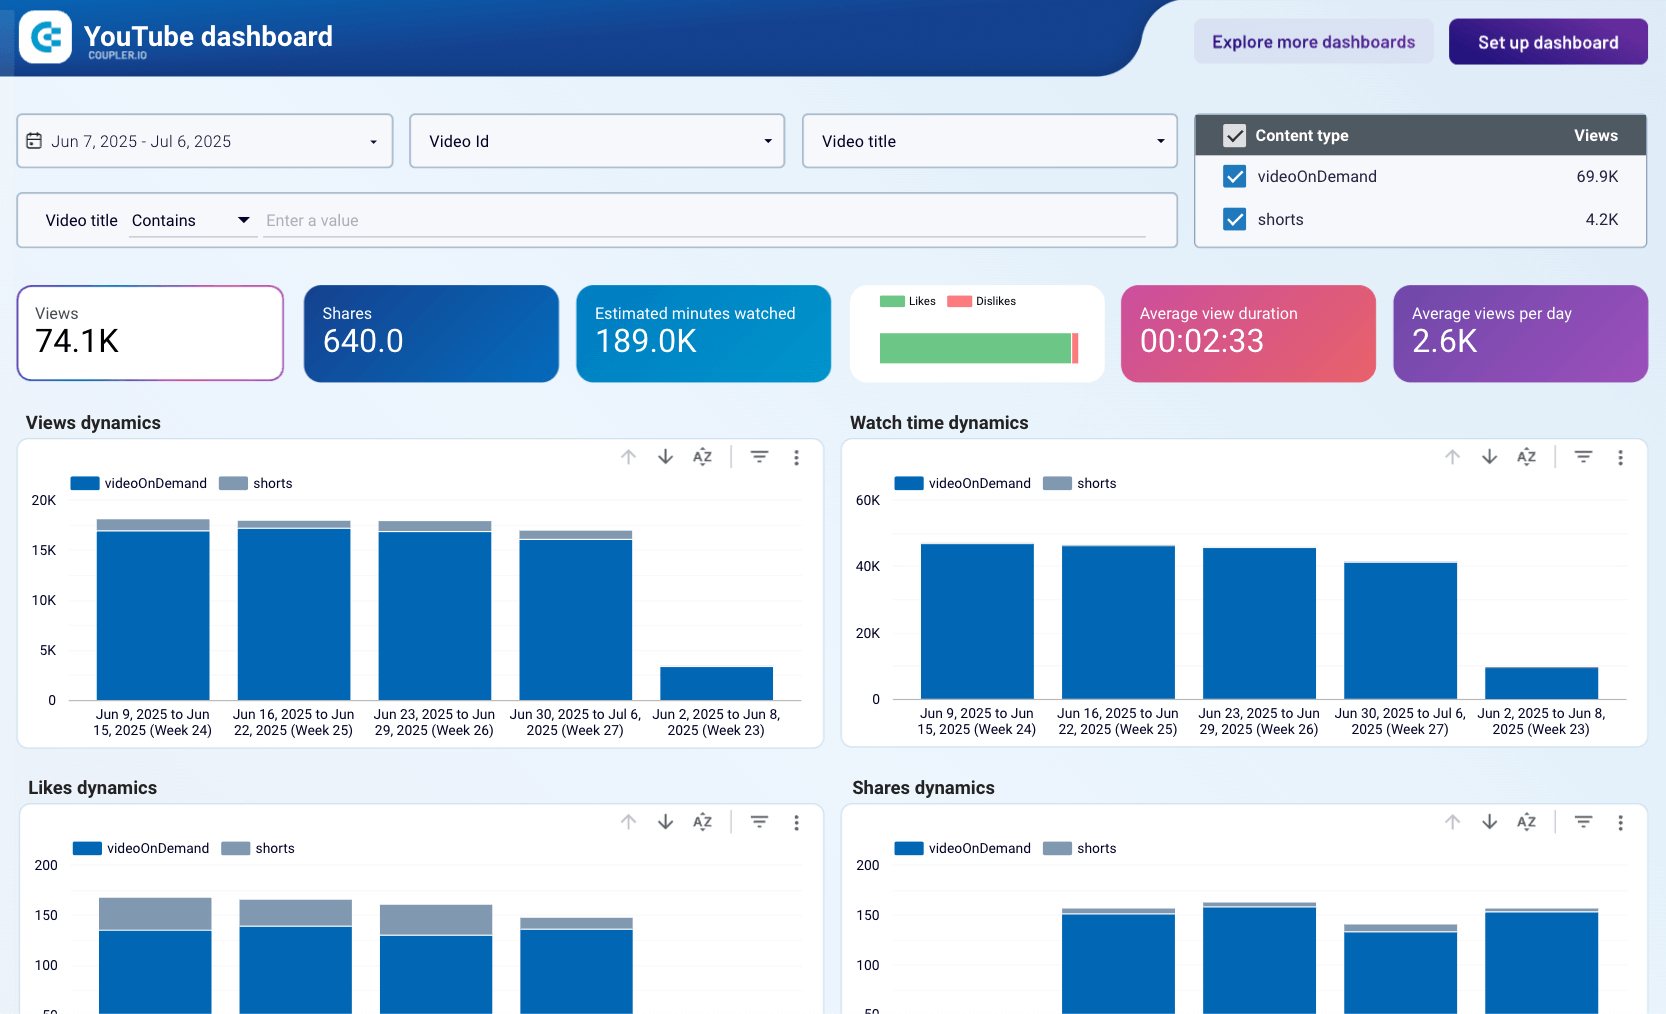
What you can do with this dashboard:
- Filter and group videos by type or title to analyze performance patterns and compare YouTube shorts against traditional video content.
- Track key viewing metrics like estimated minutes watched, average view duration, and daily views in one table to identify your best-performing content.
- Monitor subscriber growth by seeing which videos attract or lose subscribers, helping you create more engaging content.
- Measure engagement across views, impressions, and click-through rates to understand which content motivates viewers to take action.
- Discover where your traffic comes from, including top YouTube search keywords, so you can create more targeted content for your audience.
- Identify external sites linking to your videos through referral traffic data, uncovering new collaboration and outreach opportunities.
A template of this YouTube dashboard is available in Looker Studio. To preview it and make a copy, hit the button below and sign up for a free Coupler.io account.
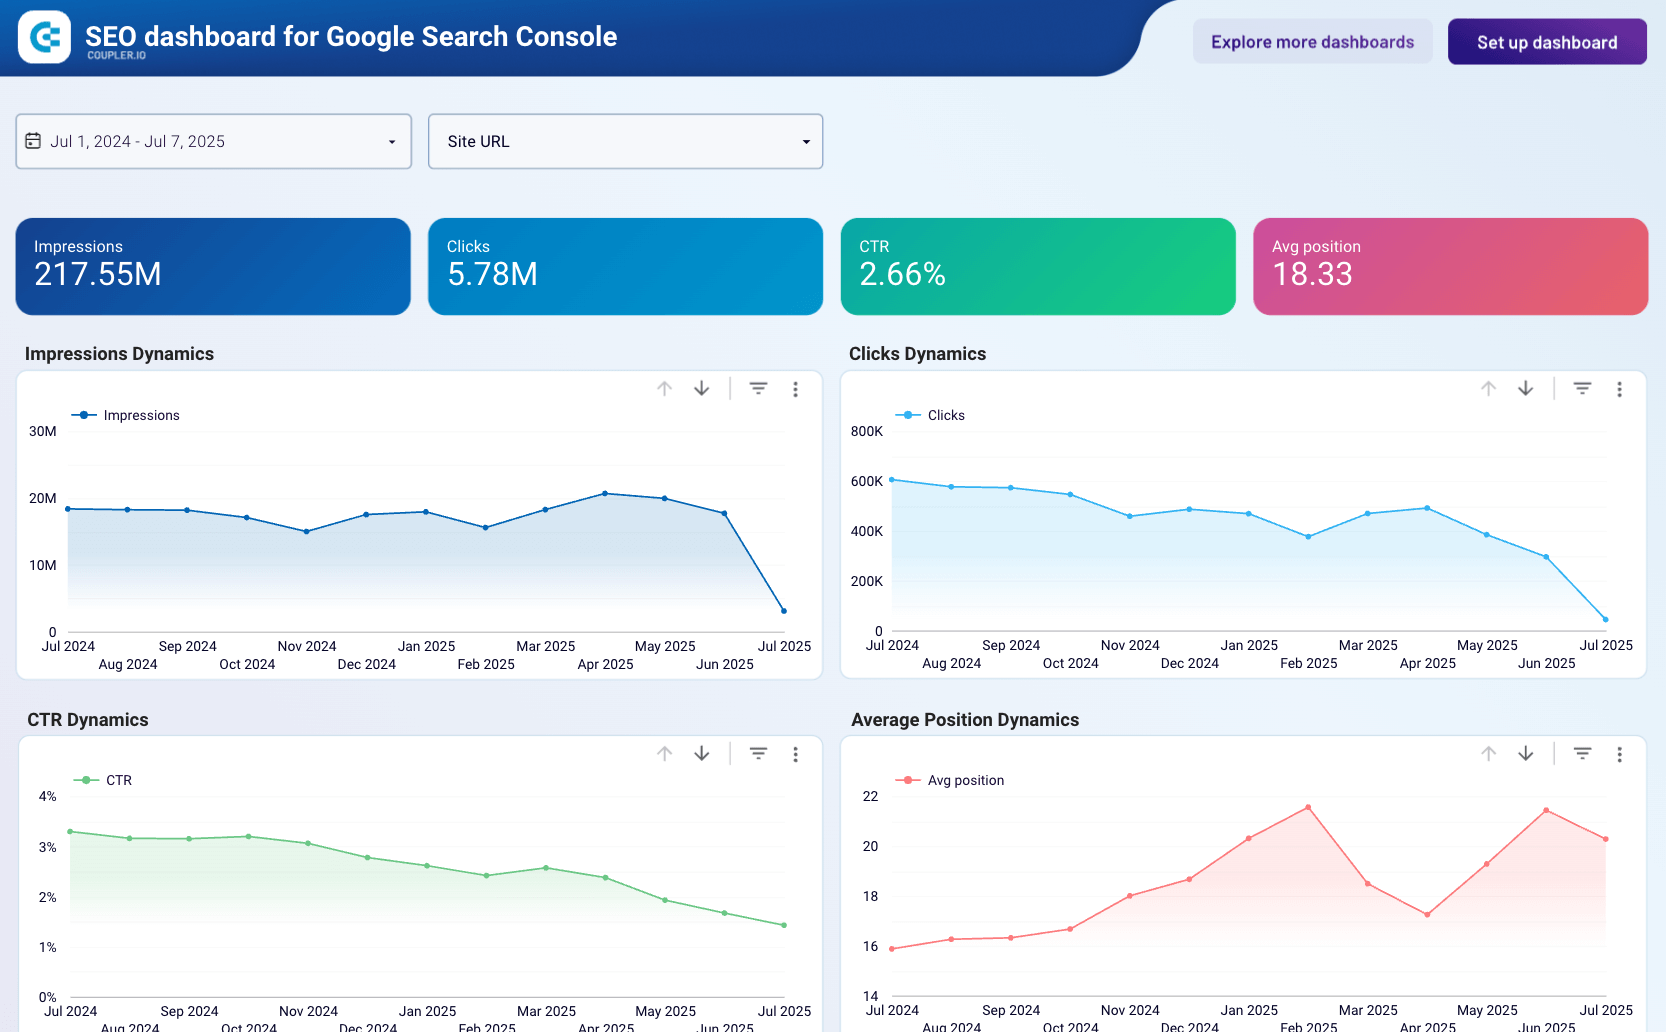
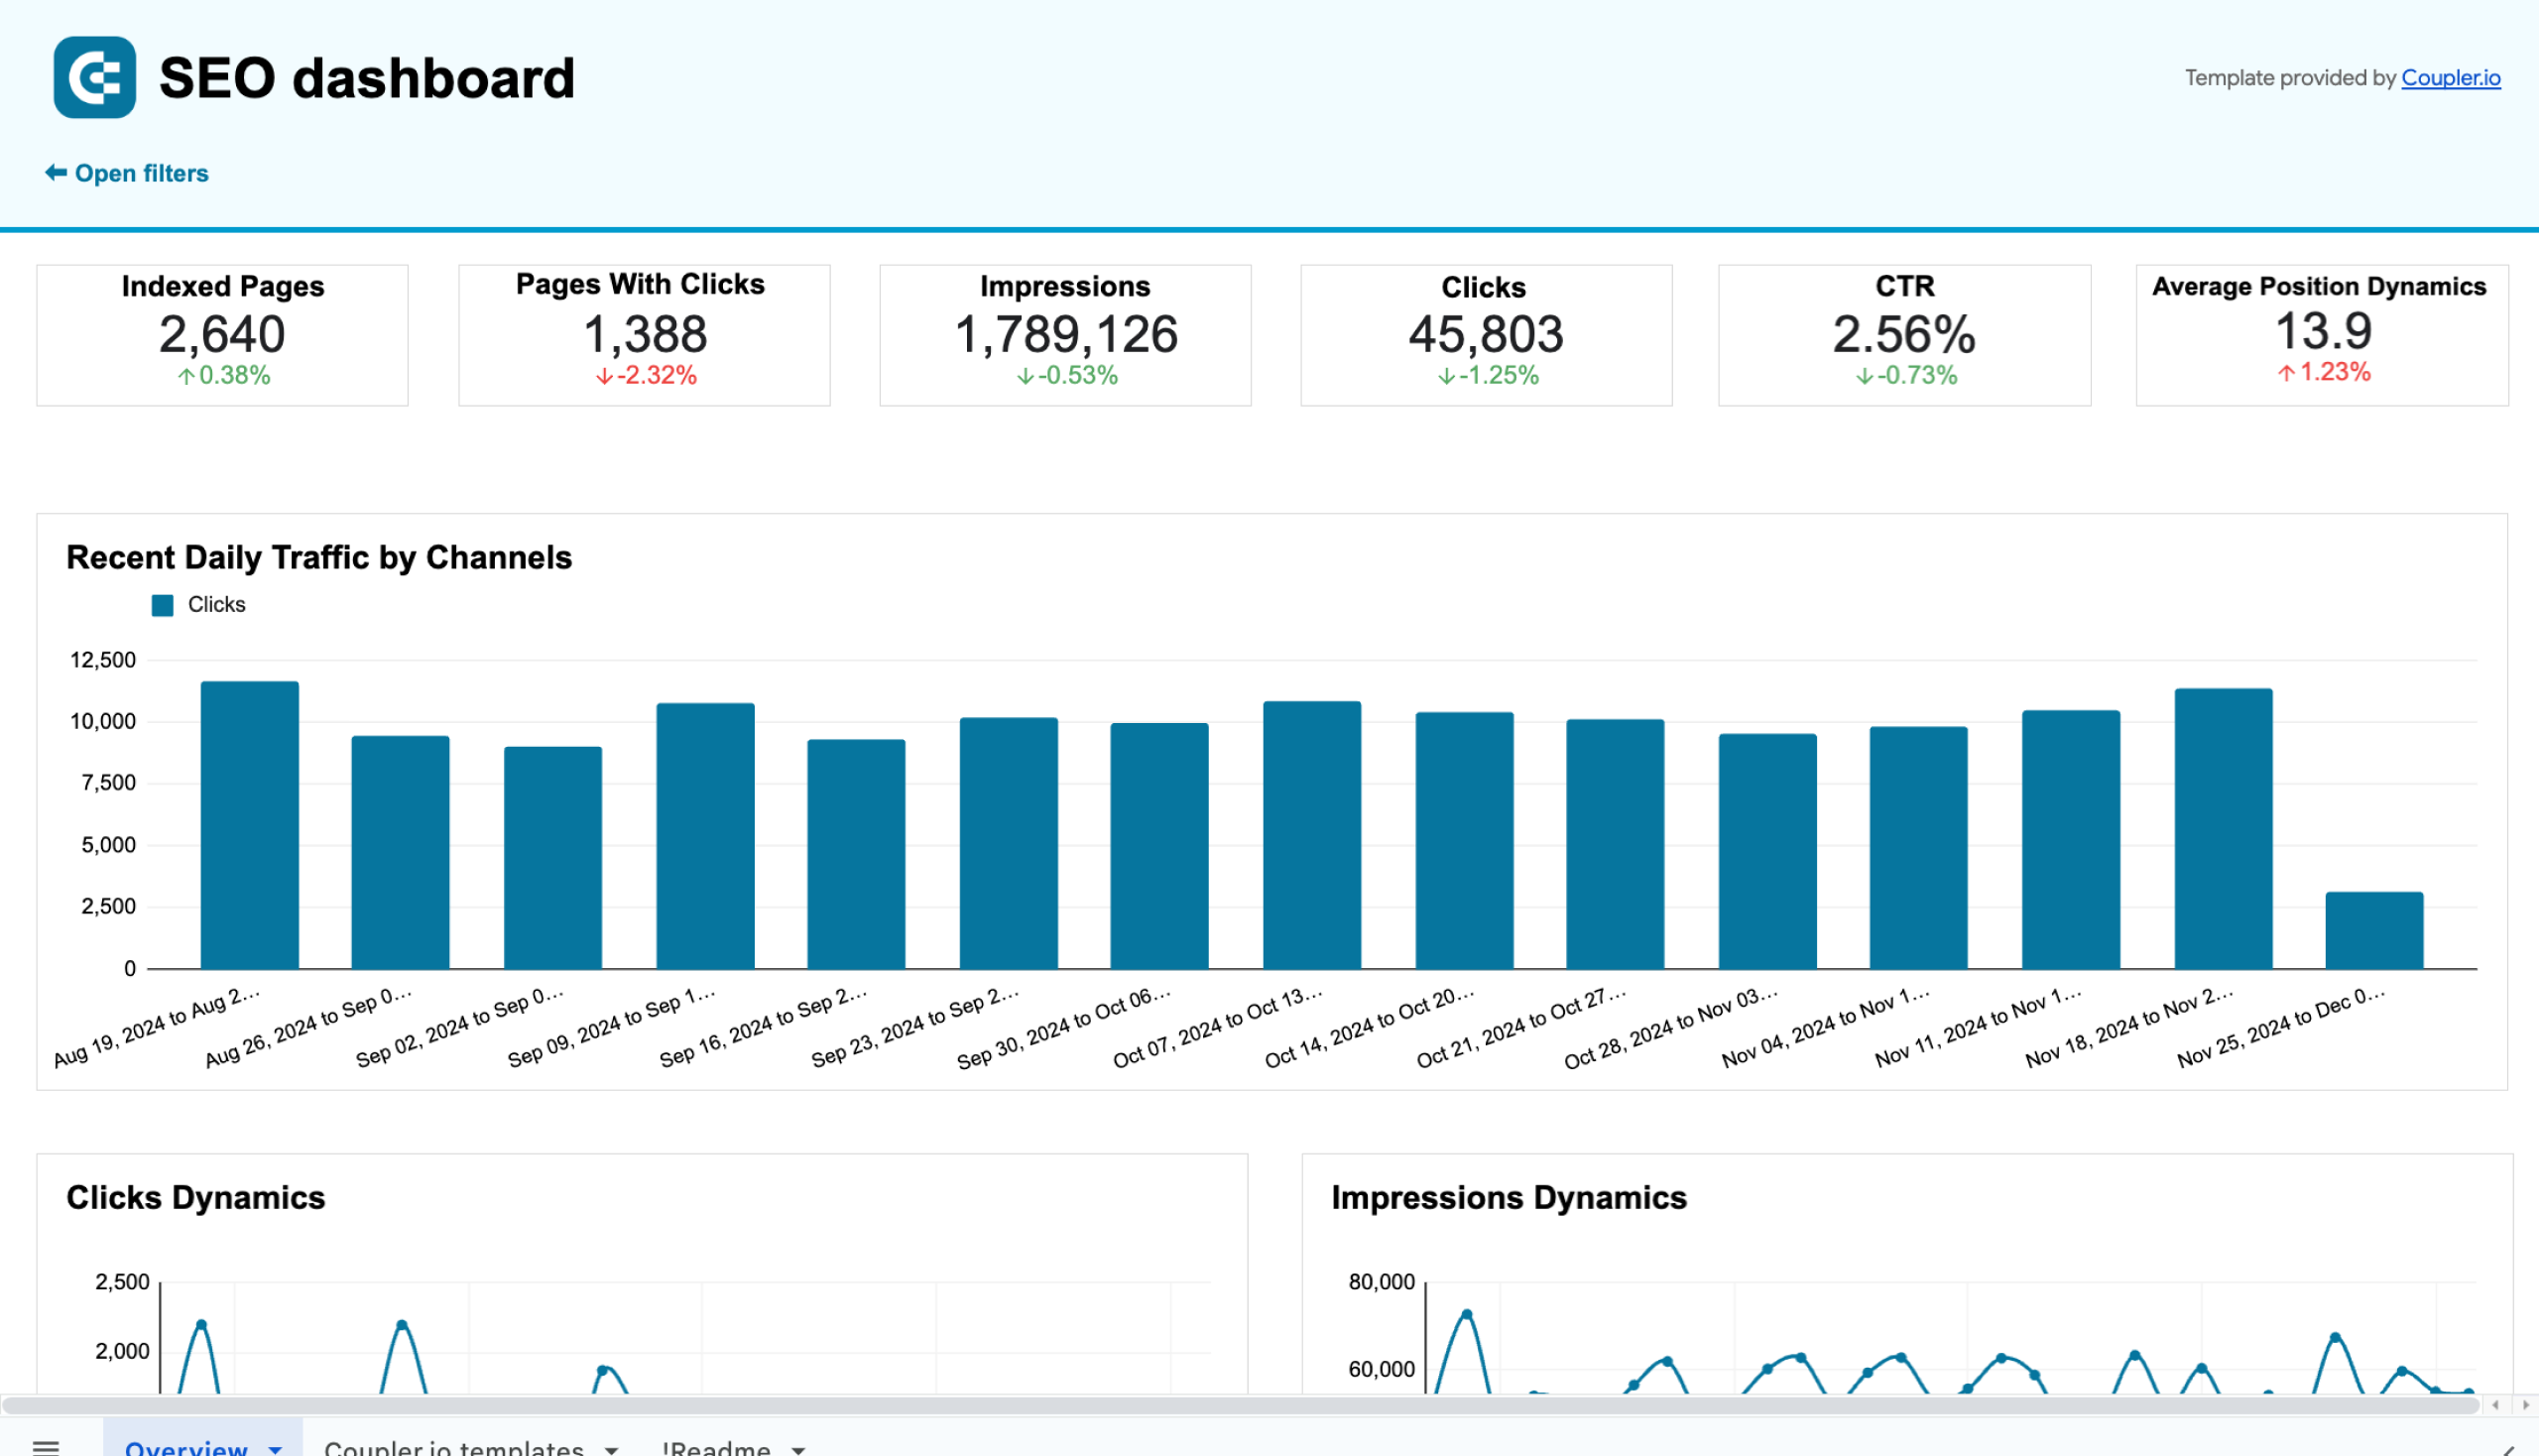
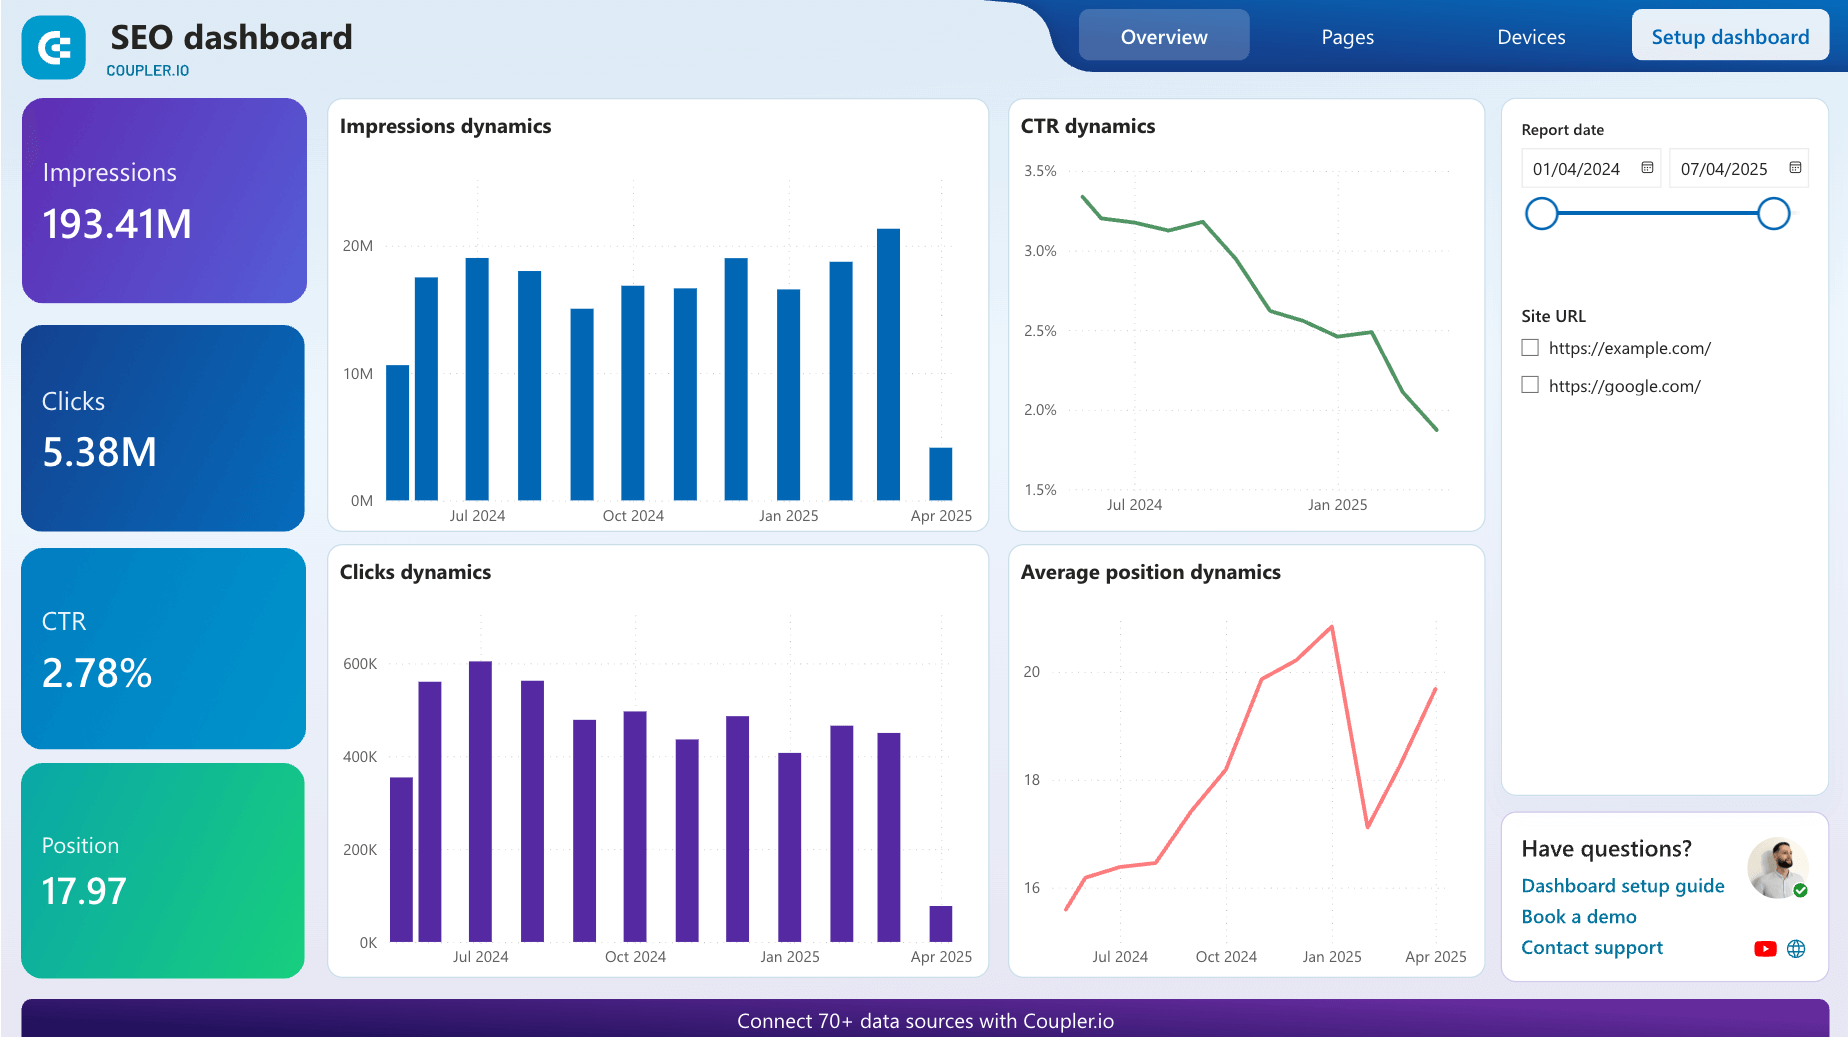
SEO dashboard for Google Search Console template
This SEO dashboard pulls raw data from your Google Search Console and organizes it in a simplified, analysis-ready interface. You can track your website’s overall search engine performance and monitor the dynamics of key metrics like impressions, clicks, and CTR across pages.
SEO dashboard for Google Search Console
 Preview dashboard
SEO dashboard for Google Search Console
Preview dashboardWhat you can do with this dashboard:
- View key SEO performance indicators and trends clearly on one page instead of navigating through Google Search Console’s cluttered interface.
- Analyze data by month and week rather than being stuck with GSC’s daily-only breakdowns for better trend insights.
- Apply advanced filters for device type, pages, and custom values that go far beyond Google Search Console’s limited options.
- Quickly identify your best and worst-performing pages to spot issues and adjust your SEO strategy faster.
You can create a copy of this dashboard template for your GSC data in either Google Sheets, Looker Studio, or Power BI:
Alternatively, you can get help from Coupler.io’s data analytics experts to streamline your analytics process to analyze your marketing data better.
Check our article on 16 best marketing reporting templates to learn what else you can do to streamline your marketing analytics.
Tools used in marketing data analytics
Marketing funnel analytics is a complex process. However, it can be made easier with the right tools and technology. They can make your life easier and more efficient including:
- Better understand your data
- Automate tasks
- Segment and target your audience
- Provide real-time and more accurate insights
- Enhance collaboration
Now, let’s take a look at a few of the most popular (and useful) marketing analytics tools to build your martech stack. We have broken them down into categories for you:
- Website analytics tools
- You can use web analytics tools to capture and track a variety of website metrics, such as total page views, unique visitors, and time on site.
- Some popular web analytics tools are Google Analytics, Adobe Analytics, and Mixpanel.
- Business Intelligence (BI) and data visualization tools
- BI tools help you extract raw data from multiple data sources, transform it, and load it to a destination. The destination is often in the form of a dashboard or other data visualizations.
- Visual data representations (charts and graphs) are used to gain insights.
- BI tools typically include data visualization tools. Some of the popular ones are Tableau, Microsoft Power BI, Looker Studio, Oracle Business Intelligence, and SAP Business Objects.
- Cohort analysis tools
- The goal of Cohort analysis is to see how metrics change over time. The result can be used for better customer retention and precise lifetime value estimates.
- Tools used for Cohort analysis include BI tools mentioned above, KISSmetrics, Heap, and others.
- Social media analytics tools
- Tools that fall into this category can be used to track a variety of social media metrics, including engagement, reach, and impressions.
- Some of the most popular social media analytics tools include Sprout Social and Hootsuite.
- Marketing automation tools
- Marketing automation software helps companies automate and measure marketing tasks and workflows.
- Their common features include lead management, email marketing, campaign management, and analytics.
- Marketing automation tool examples: HubSpot, Marketo, Pardot, AWeber, and MailChimp.
- Search Engine Optimization (SEO) tools
- There are a variety of SEO tools that help marketers improve their website’s ranking in search engine results pages (SERPs).
- Some common ones include keyword research tools and link-building tools.
- Popular SEO tool examples: Ahrefs, SEMRush, Google Search Console, and Moz.
- Marketing attribution tools
- Marketing attribution software collects data on how your audience interacts with your brand and organizes it to reveal the effectiveness of your marketing materials.
- Examples include Amplitude and Twilio Segment.
Check our guide on PPC vs SEO.
The list above is just the iceberg when it comes to cross-channel marketing analytics. How can you choose the right tools? Well, you should start by first knowing what you want from the tools. Then, do some research on the potential options and compare their features, at the same time prioritizing ease of use. Lastly, review them against price points as well, and then you should be in a position to make the right decision for you.
Beyond traditional analytics tools, emerging technologies like MCP servers for marketers are revolutionizing how marketing teams interact with their data and tools. They allow AI assistants to query databases, generate reports, and execute campaigns through natural language commands.
Explore more about the AI-driven marketing strategy.
The challenges of marketing data analysis
Creating an analytics process that measures and tracks meaningful things is sometimes complicated for most companies. The challenges to building an effective analytics process are broad in scope. Let’s take a look at some of the significant challenges below.
- The volume and variety of marketing data.
The modern marketing landscape is diverse and complex. Most channels are digital, and campaigns produce content people consume across many devices. While this sheer volume of data is good, marketers find themselves overwhelmed in a data overload situation.
- Lack of resources.
Another common challenge is that businesses need more resources to utilize data analytics properly. Staffing up employees who are trained in analytics will take priority. In addition, marketing data analytics requires time and money, but many businesses do not have the budget or staff to dedicate to data analytics, which can limit its usefulness. To address these resource constraints, emerging AI-powered solutions like the Coupler.io MCP server enable marketing teams to interact with their data through natural language conversations. Conversational analytics eliminates the need for specialized analytics training while making insights accessible to everyone.
- Lack of knowledge and skills.
Marketing data analytics requires a specific set of skills, including statistical analysis, data visualization, and technical skills. It’s also vital to have a solid understanding of your customers and products. While it can take time to learn these skills and acquire product knowledge, access to new technologies has begun to bridge this gap.
Over the past couple of years, the impact of AI on data analytics has been profound. AI-enhanced platforms and assistants are already helping non-technical marketers automate complex data processes, generate actionable insights in minutes, and make decisions 10x faster.
- Difficult to identify and track meaningful analytics.
This is one of the toughest challenges for marketers. The metric identification process usually begins with looking at whatever metrics are available or just following existing marketing processes. Instead, it must start with understanding the strategic objectives marketing is pursuing.
Marketers often find themselves juggling different sets of data, blending and calculating numbers to arrive at something that truly indicates how a process is performing. There is usually no easy, direct path to getting the best metrics for an analytics process. Except if you use interactive dashboard templates to create custom marketing reports in minutes. The latter can greatly simplify this task, whether it’s preparing a weekly performance report or building a comprehensive CMO dashboard.
Despite all these challenges, if the data is tracked, analyzed, and visualized in the right way, marketing data analytics can help you improve your overall marketing strategy.
FAQ on marketing analytics
What is marketing data analytics?
Marketing data analytics involves analyzing and interpreting data from marketing campaigns to understand their effectiveness. It helps in identifying what strategies are working and which aren’t. Without this analysis, you’re essentially guessing about the success of your efforts. Analytics provide concrete evidence of performance, making your marketing more efficient and targeted. While some organizations may succeed without it, they often can’t pinpoint why. Analytics take luck out of the equation, offering insights into successes and failures, and guiding better decision-making for future campaigns.
Learn more about the difference between marketing vs. sales funnel.
What is the role of data analytics in marketing?
Data analytics in marketing plays a crucial role in understanding customer behavior, preferences, and trends. It helps in making informed decisions by analyzing customer data, market trends, and campaign performance. By leveraging analytics, marketers can tailor their strategies to better target their audience, optimize marketing spend, and enhance the overall effectiveness of their campaigns. Analytics also enable businesses to predict future trends, measure the ROI of marketing activities, and continuously improve their marketing tactics based on real-time data insights. In short, data analytics is essential for creating more personalized, efficient, and successful marketing strategies.
What is the importance of data analytics in marketing?
Data-driven marketing is one of the key trends in marketing analytics. Therefore, analytics in marketing is crucial for driving smarter, data-driven decisions. It offers insights into how products are used, helping to tailor them more closely to customer needs. Analyzing customer trends and preferences enables more effective segmentation and personalization of marketing campaigns. It also improves customer support by identifying common issues. By understanding the impact of different messages and media, marketers can optimize their communications. Analytics also provide a competitive edge by monitoring market trends and competitor strategies. Predictive analytics help forecast future market behaviors, leading to more efficient budget allocation and higher chances of capturing new customers.
Read more about predictive analytics in this separate article on marketing forecasting.
What are the benefits of data analytics in marketing?
Data analytics is becoming increasingly important in today’s business world. Here are some reasons why:
- Enhanced Customer Insights: Gains a deeper understanding of customer behavior and preferences.
- Optimized Marketing Strategies: Improves campaign targeting and effectiveness.
- Increased ROI: Helps allocate resources more efficiently, maximizing returns.
- Competitive Advantage: Provides insights into market trends and competitor strategies.
How to analyze marketing data?
Analyzing marketing data can be simplified into three key steps:
- Collect data: Gather data from various marketing sources, using platforms like Coupler.io to consolidate it in one place. For example, you can collect data from GA4 to track and analyze AI traffic.
- Organize and transform data: Clean and organize this data, managing columns and creating calculated metrics like Clickthrough Rate (CTR).
- Visualize and automate reporting: Use BI tools like Looker Studio or Google Sheets to visualize the data. Automate the data refresh for up-to-date reporting, aiding in timely, data-driven decisions.
We’ve blogged about how to design action oriented marketing dashboard, so check it out!
How to interpret marketing data insights?
Interpreting marketing data insights involves a few key steps:
- Clarify Goals: Start by aligning your analysis with specific marketing objectives.
- Focus on Key Metrics: Zero in on relevant metrics that directly relate to your goals, such as engagement rates for brand awareness campaigns.
Learn more about brand marketing vs. performance marketing.
- Spot Trends and Patterns: Identify consistent behaviors or changes in data, like a spike in referral traffic.
- Decision Making: Use these insights to inform strategic decisions and refine marketing tactics.
- Continuous Monitoring: Regularly review data to stay adaptive and responsive to market changes.
Data analytics for marketing decisions – final words
Marketing data analytics is vital to making informed business decisions. By understanding what marketing data analytics is and how to use it, you can make better decisions that lead to increased revenue.
While there are challenges to collecting and analyzing marketing data, Coupler.io can help you easily overcome them. As it supports various marketing apps, it becomes easy to combine and transform data into a single report.

Automate marketing reporting with Coupler.io
Get started for free