How to Monitor Landing Page Performance Using GA4 and Search Console Data

Understanding your landing page performance requires more than just looking at traffic numbers from Google Analytics. Although it’s an essential source of information, you can enhance its value by combining GA4 with Search Console data. As a result, you get the complete picture that reveals not just how many visitors you’re getting, but how they’re finding you and what they’re doing once they arrive.
In Coupler.io, we see this combined view in the form of a data set or a table where GSC metrics are to the left and GA4 metrics – to the right:

When you merge search visibility data with user behavior analytics, you can identify high-opportunity pages, spot content-traffic misalignment issues, and calculate the true ROI of your SEO efforts.
Key insights the landing page performance report can offer
Combining GA4 and Search Console data reveals powerful insights that remain hidden when you analyze each platform separately. Here are the most valuable discoveries you can make with this integrated approach.
1. Identify high-opportunity pages with search visibility issues
Some of your pages have strong search visibility but weak click-through rates? This insight is helpful to prioritize quick wins that can dramatically increase traffic without improving rankings. These pages already have Google’s trust and visibility. All you need to do is better present them in search results.
Example: The page /electrical-systems-in-private-homes shows massive search impressions (75,249) but ranks at an average position 6 with 8.83% CTR. While the CTR isn’t terrible, the high impression volume suggests significant untapped potential – even small ranking improvements could yield substantial traffic gains.

What you can do: For pages with high impressions but average positions (5-10), focus first on improving rankings through content optimization, internal linking, and technical SEO. For pages already ranking in the top 3 positions with low CTR, you can optimize title tags and meta descriptions to make them more compelling and action-oriented.
2. Analyze performance by page categories and content types
You can group pages by category or content type to reveal which areas of your website drive the most value. The filter functionality shown allows you to analyze specific page categories, like filtering for pages containing “power-bi” to see all Power BI-related content performance at once.

What you can do: Create filters for different content categories like commercial pages (/product/, /pricing/), blog content (/blog/), resource pages (/dashboard/, /template/), or localized content (/en/, /de/). Compare performance metrics across categories to understand which content types drive awareness versus conversions. For example, you might find that blog posts generate high traffic and engagement but low conversions, while product pages have lower traffic but higher conversion rates. Use these insights to set appropriate KPIs for each content type – optimize blog content for engagement and awareness, while focusing commercial pages on conversion optimization.
3. Detect content-traffic misalignment problems
Some pages may attract search traffic but fail to convert. These misalignments often indicate that your content doesn’t match what searchers actually want. As a result, you get wasted traffic and missed opportunities.
Example: The /basement-for-storing-products page shows excellent search metrics:
- 14.91% CTR
- 3.97 average position
- 2,336 clicks
At the same time, it converts poorly with only 10 ecommerce purchases. This suggests either a content-intent mismatch or user experience issues.

What you can do: Analyze the search queries driving traffic to this page and compare them with your content. Use Google Search Console’s query data to understand user intent. If you notice short session durations and high bounce rates alongside poor conversions, this often indicates intent misalignment – users expected different information than what your page provides. Either optimize the content to better match search intent or create new pages that specifically target the converting queries. Also, audit the user experience: check page load speed, mobile responsiveness, and call-to-action placement.
4. Calculate SEO ROI and budget allocation
Understanding the revenue value of search traffic allows you to make data-driven decisions about where to invest SEO resources. This financial perspective transforms SEO from a cost center into a measurable revenue driver. The combined data allows marketers to calculate the true value of search traffic.
Example: The page /solar-power-systems-for-private-homes generates $62,538 from 3,062 clicks, giving a revenue-per-click of about $20.
The page /electrical-systems-in-private-homes has 2x clicks, 6,644, but only generates $20,538, which is about $3 revenue per click.

What you can do: Use these revenue-per-click calculations to prioritize your SEO efforts and budget allocation. Focus more resources on improving rankings for high-value pages. Create detailed ROI projections for SEO campaigns by estimating traffic increases and multiplying by revenue-per-click. This data also helps set realistic expectations and justify SEO investments to stakeholders by showing concrete revenue potential.
5. Track landing page performance trends and seasonal patterns
Monitor how individual pages perform over time to identify trending content, spot seasonal opportunities, and catch performance issues before they become major problems. Weekly and monthly data views reveal patterns that single snapshots miss entirely.
Example: The dataset structure shown allows you to track pages like /blog/excel-send-email over time, seeing it jump from 75 new users in the week of 2025-04-28 to 359 new users by 2025-05-05. This 379% week-over-week growth indicates either viral content, successful promotion, or seasonal demand that deserves immediate attention.

What you can do: Set up regular monitoring of your top-performing pages to identify trends early. When you spot sudden growth like this example, investigate the cause – was it featured somewhere, did you publish related content, or is there growing search demand? For declining pages, dig into whether it’s seasonal, competitive pressure, or technical issues. Use these insights to inform your content calendar, doubling down on trending topics and refreshing declining content. You can also identify the best times to launch campaigns or optimize specific pages based on their historical performance patterns.
Pro tip: Weekly data is particularly valuable for catching algorithm updates or technical issues that might take weeks to show up in monthly reports, allowing you to respond much faster to both opportunities and problems.
Ready-to-use solutions for page performance analytics
Getting started with landing page performance monitoring doesn’t have to be complicated. Here are two plug-and-play solutions, Coupler.io offers.
Landing page performance dashboard by Coupler.io
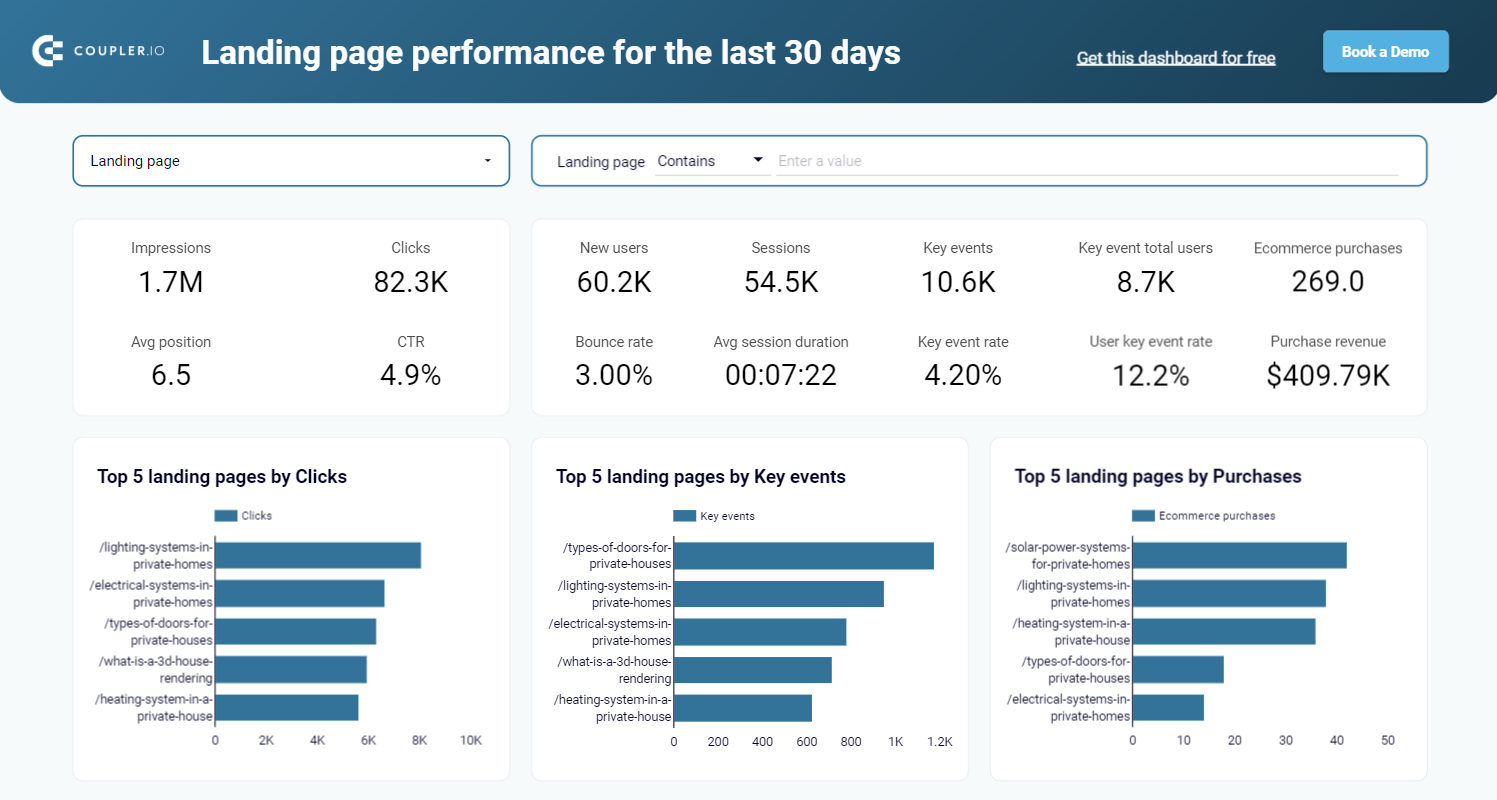
The fastest path to comprehensive monitoring is using a pre-built dashboard that automatically combines Google Search Console and GA4 metrics. Coupler.io’s landing page performance dashboard pulls together the following metrics:
| Metrics from GSC | Metrics from GA4 |
| – Clicks – Impressions – Position | – CTR – New users – Sessions – Average session duration – Bounce rate – Key events – Ecommerce purchases – Purchase revenue |
The dashboard includes intuitive filters for manual page selection, making it easy to focus on specific pages or groups of pages.

You’ll also get automated insights with the top 5 performers by clicks, key events, and purchases. These bar charts help you quickly identify your best and worst-performing pages.

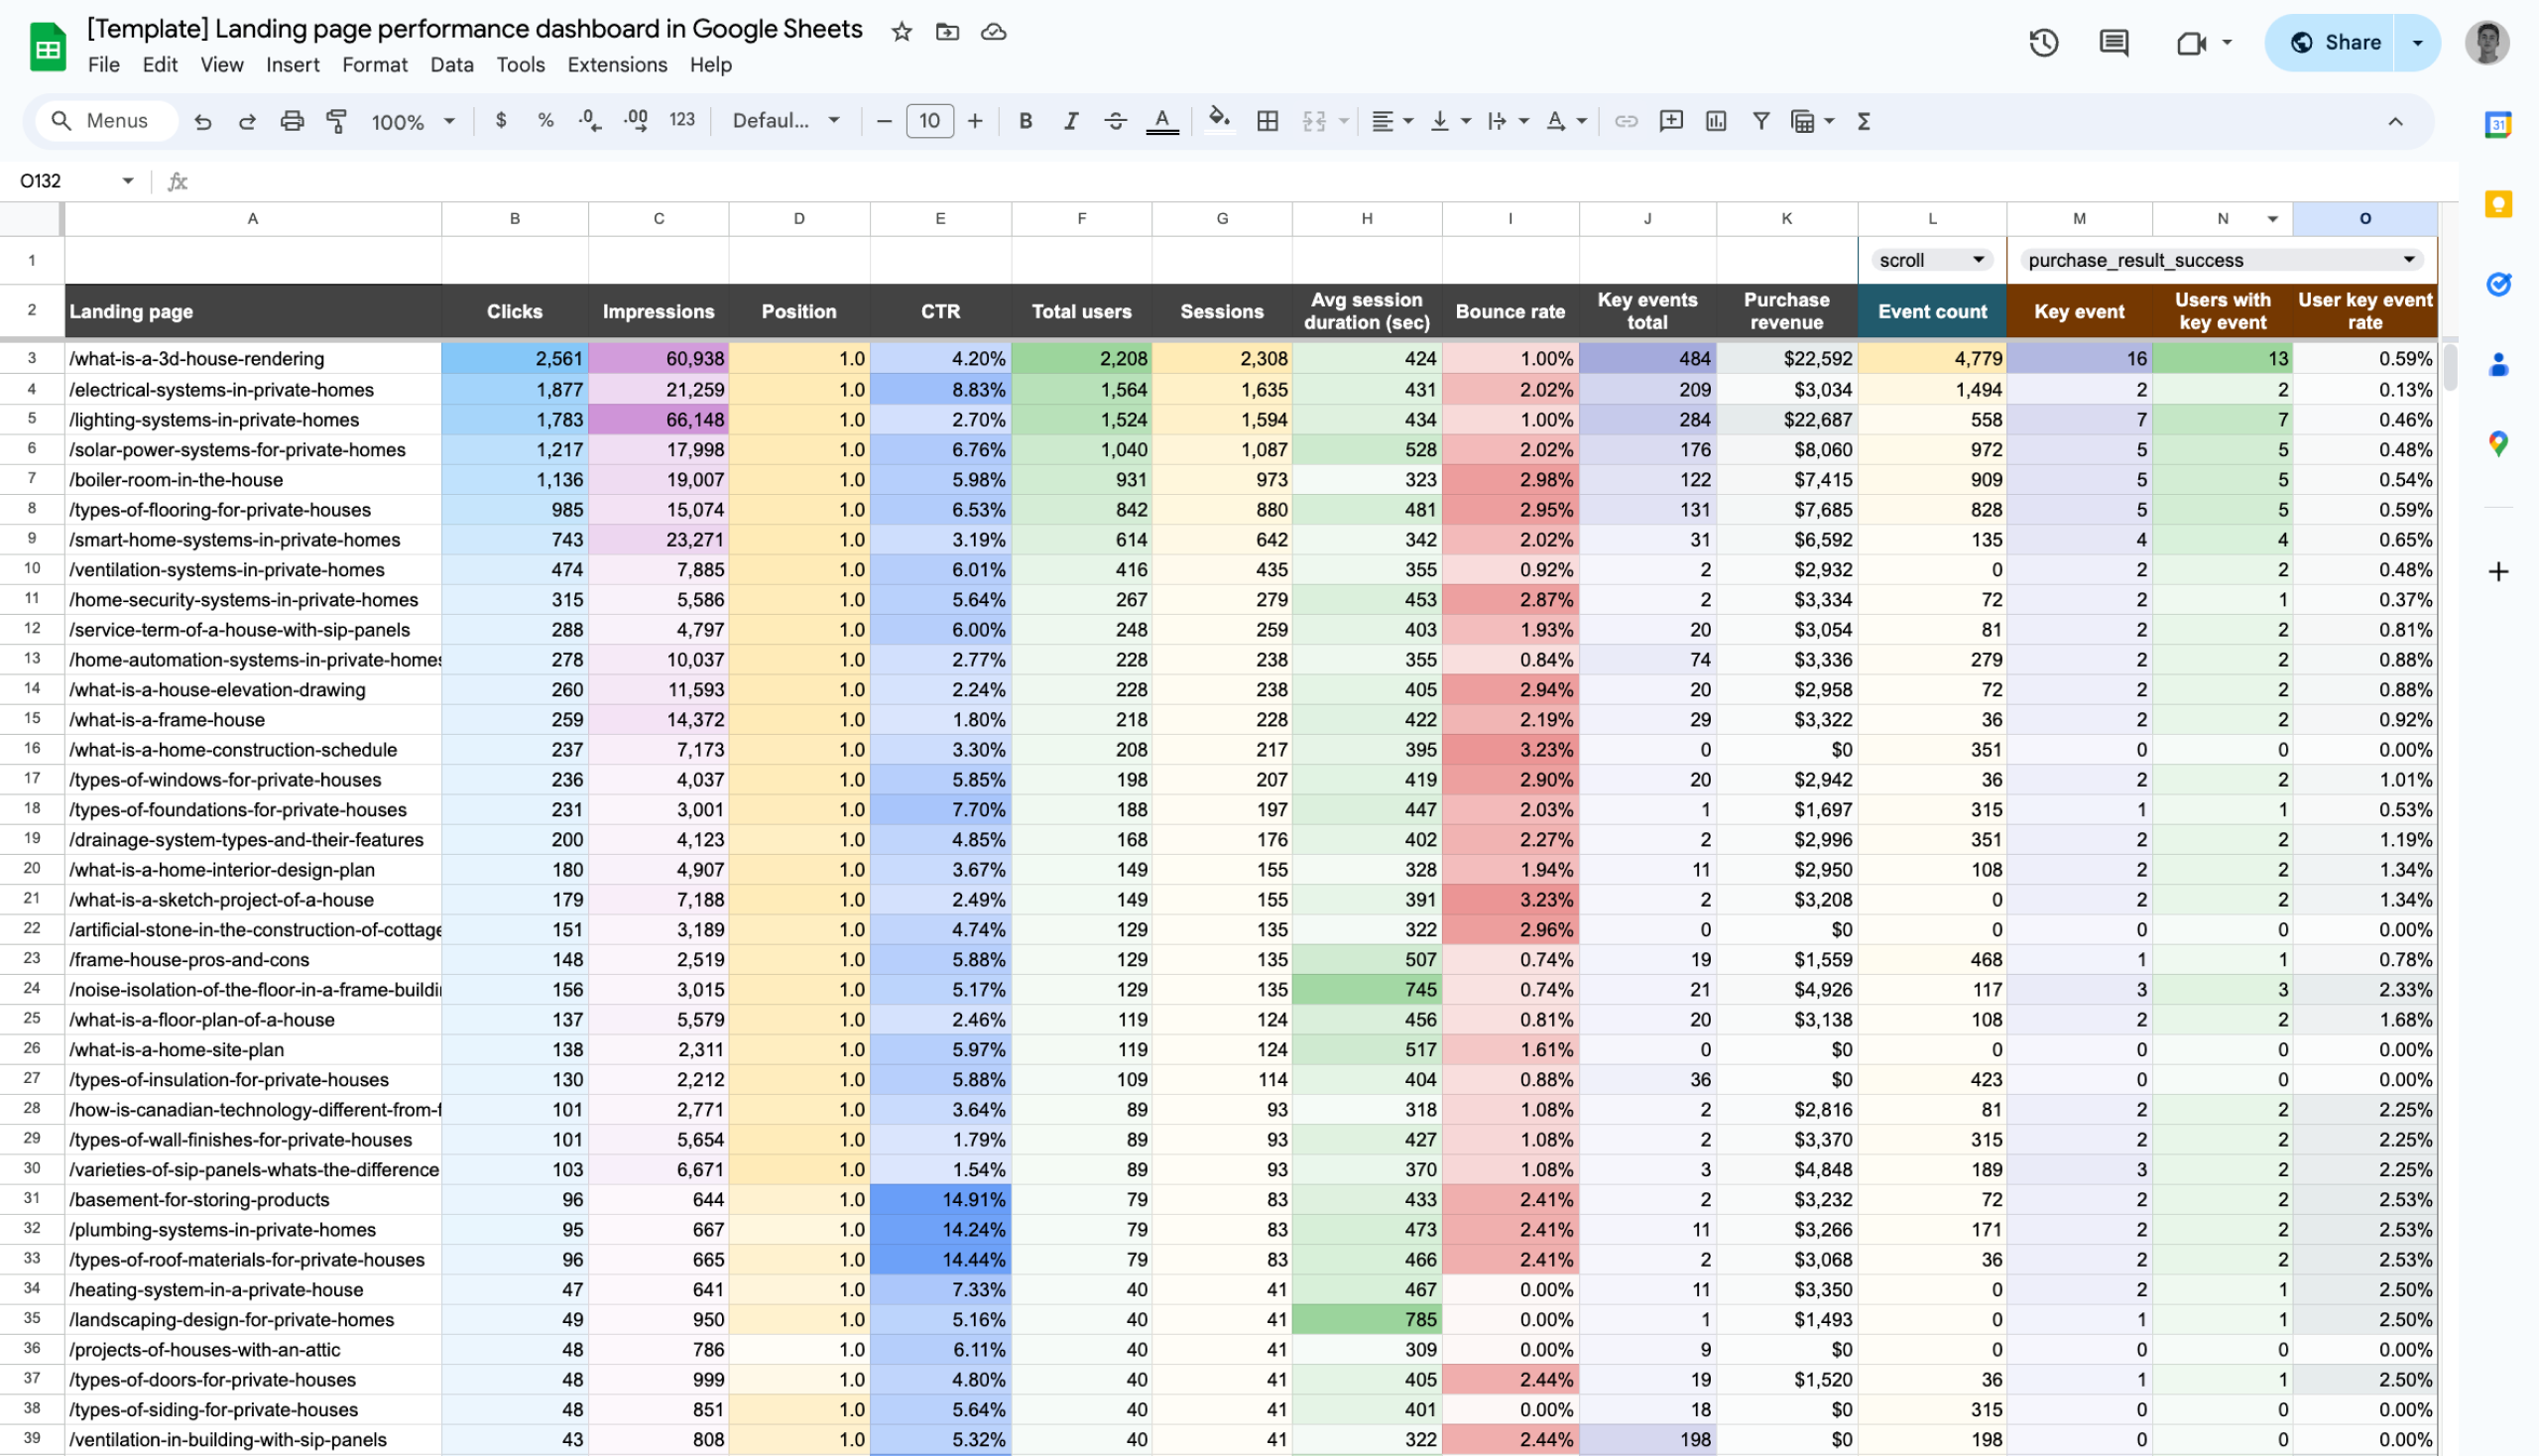
And of course, the main data table provides an overview of all your pages with both search and analytics metrics side by side.
The dashboard is available in Looker Studio and Google Sheets. And the spreadsheet version offers you a dropdown selector for different key events, making it easy to analyze various conversion actions.

How to get started
Each dashboard template is equipped with Coupler.io connector to load data from GA4 and GSC. So, you just need to follow the instructions in the Readme file to connect the dashboard to your data sources.
Landing page performance dashboard in Google Sheets
Analyze the effectiveness of your landing pages, from traffic and engagement to conversions, using data from GA4 and Search Console.


Landing page performance dashboard in Looker Studio
Evaluate the effectiveness of your landing pages such as traffic, clicks, bounce rate, and other metrics collected from GSC and GA4 in one dashboard.

Dataset template
Dashboards by Coupler.io are white-label, meaning you can customize them. However, for some of our users, the dashboard format is not an option. In this case, Coupler.io offers data set templates – out-of-the-box configurations of data. You only need to connect your source apps, GA4, and GSC, to get a ready-for-analysis dataset.
At the same time, to monitor the performance of your landing pages, you’ll need to use this data set – Landing Page Performance from Search to Conversion. It consolidates metrics from GSC and GA4 in a unified table view. You also get aggregation views for weekly and monthly performance.
Additionally, you can use separate datasets:
- Top pages performance for Google Search Console – This data set includes impressions, clicks, CTR, and average position data organized by page. You also get aggregation views for weekly and monthly performance.
- GA4 landing page performance – This data set provides a detailed view of how much traffic each page attracts, how often it initiates sessions, and how well it retains visitor attention through metrics like bounce rate and session duration. You also get aggregation views for weekly and monthly performance.
You can use these datasets independently for focused analysis in your preferred analytics tools. To use data set templates, sign up for Coupler.io for free and use them.
DIY: Build your custom landing page performance report
I tell you one secret – there is no magic behind each dataset template in Coupler.io. It’s just a few data transformations implemented to optimize our users’ experience. This means you can easily create such a landing page performance report on your own in three steps:
Step 1: Connect Search Console and GA4
Create a data flow in Coupler.io and connect your Search Console and Google Analytics accounts.
For Google Search Console, you’ll need to select sites for analysis, and report type – Search results performance.
Then specify the report period (start and end dates), and optionally, you can modify dimensions. In our case, we selected Date and Page.

For Google Analytics 4, select the GA4 property, specify the report period, and choose the metrics for your report. In our case, we use the following ones: New users, Total users, Views, Key events, and Event count.
Also, make sure that the dimensions selected in GSC and GA4 settings are the same. In our case, we need to select Date and Landing page as the dimensions for GA4.

Now you can move to actually organizing our SEO report – click Transformations.

Step 2: Join data from GSC and GA4 and organize
Coupler.io preloads two datasets: from GSC and GA4. To combine them into one, we need to use the Join option that allows users to unify two datasets by a common field. In our case, this is a column showing page URLs. However, there is one issue:
- Landing page column in the GA4 data set shows the page URL without the
https://index like the page column in the GSC data set.

Due to this, the Join operation won’t be correct since the values in the columns must correspond ot each other. To fix this, there is a simple solution. Click Formula in the Google Search Console dataset to create a new column. Name it, for example, page (new) and add the following string:
"/"&TRIM(REPLACE({page},{siteURL},"/"),"/")

This will create a new column with values that correspond to the values in the Landing page column in the GA4 data set.

Now you can use this new column as a key column to join datasets. Click Join in the toolbar.

Choose the key columns to join the data sets side by side and click Join:
- Landing page for GA4
- page (new) for GSC

Two datasets will be joined together, and you’ll get a consolidated overview of your landing page performance:

Additionally, you can:
- Aggregate data by page or date to export hundreds of rows instead of dozens of thousands. We’ve described this in our data aggregation blog post.
- Hide unnecessary columns and reorder the needed ones
- Update namings, change format, etc. Keep in mind that you can edit columns in the tabs of the respective sources.
- Filter and sort data
Step 3: Load data and schedule refresh
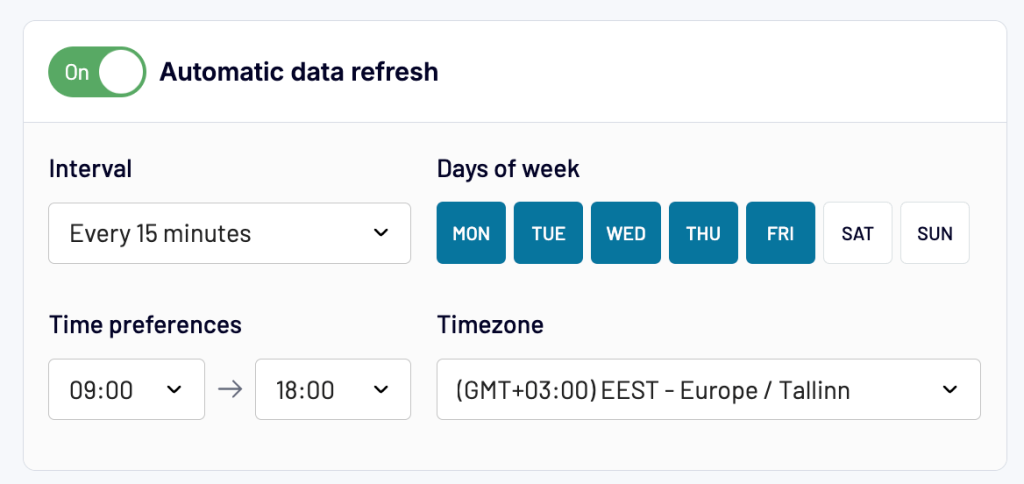
Now, you can load it to Google Sheets or another destination to your liking. The last thing to do is to automate it. Toggle on the Automatic data refresh and customize the desired schedule to keep your data up to date.
Ask AI about your landing page performance
Creating landing page performance reports is just the first step. The real value comes from asking the right questions and uncovering actionable insights. You can do this with the help of the Coupler.io MCP server. It acts as a bridge between your datasets in Coupler.io and AI models like Claude.
Think of it as giving AI the ability to “read” your landing page performance data directly from Coupler.io. The AI can process your GSC and GA4 metrics, understand the relationships between different data points, and provide contextual insights based on your actual performance numbers. No need to create pivot tables or build complex queries. Just use natural conversations with AI about your landing page performance data, like:
- “Which pages have high impressions but low conversion rates?”
- “Show me the revenue per click for my top 10 landing pages”
- “What’s causing the traffic drop on my product pages this month?”
- “Which pages should I prioritize for SEO investment based on ROI?”
The AI will analyze your landing page performance data and provide specific, actionable answers based on your actual metrics, not generic advice.
Real-world example: Getting insights in seconds
Let’s say you’ve set up the landing page performance report we discussed earlier. With the MCP server, you could ask:
"Show me the worst performing pages by clicks and recommend what can I do to improve them."
The AI would analyze your actual landing page performance data and respond with something like:
Based on your GSC and GA4 data, here are your worst performing pages by clicks and specific improvement recommendations:
? WORST PERFORMING PAGES ANALYSIS
1. /ai-for-marketers
- Performance: 0 clicks, 174 impressions (0% CTR), 4 new users
- Problem: Zero clicks despite decent impression volume – complete visibility failure
- Recommendation: This page is invisible in search results. Rewrite title tag and meta description entirely. Current content likely doesn’t match search intent for “AI for marketers” queries.
2. /asana-backup
- Performance: 0 clicks, 644 impressions (0% CTR), 12 new users
- Problem: High impression volume but zero organic clicks
- Recommendation: Major disconnect between what searchers expect and what Google shows. Research top-ranking pages for “asana backup” and completely rebuild your title/meta to match user intent.
3. /ai-impact-on-seo
- Performance: 7 clicks, 7,287 impressions (0.06% CTR), position 35.36
- Problem: Massive impression waste – getting shown but never clicked
- Recommendation: You’re ranking too low (position 35) for valuable keywords. Focus on content depth, add more recent examples of AI impact on SEO, and build relevant backlinks.
Priority Actions:
- Emergency fix: Audit
/ai-for-marketersand/asana-backupfor title/meta misalignment (could add 50+ monthly clicks) - Content upgrade: Expand
/ai-impact-on-seowith 2024/2025 examples to improve rankings - Technical check: Verify these pages aren’t being penalized by algorithm updates
This level of detailed, data-driven analysis would typically take hours of manual work. With the MCP server, you get it in seconds. Read how to get started with Coupler.io MCP server or check out this video guide.
The future of landing page optimization
The combination of comprehensive data collection (through Coupler.io) and intelligent analysis (through the MCP server) represents the future of landing page optimization. You’re not just collecting data – you’re having conversations with it.
Whether you’re a marketing manager trying to understand why certain pages aren’t converting, a content creator looking for optimization opportunities, or an executive needing quick performance summaries, the Coupler.io MCP server makes your landing page data accessible and actionable.
This is data analysis reimagined – where insights come from conversations, not complex queries. And it’s available today for your landing page performance optimization workflow.
Monitor landing page performance with Coupler.io
Get started for free


