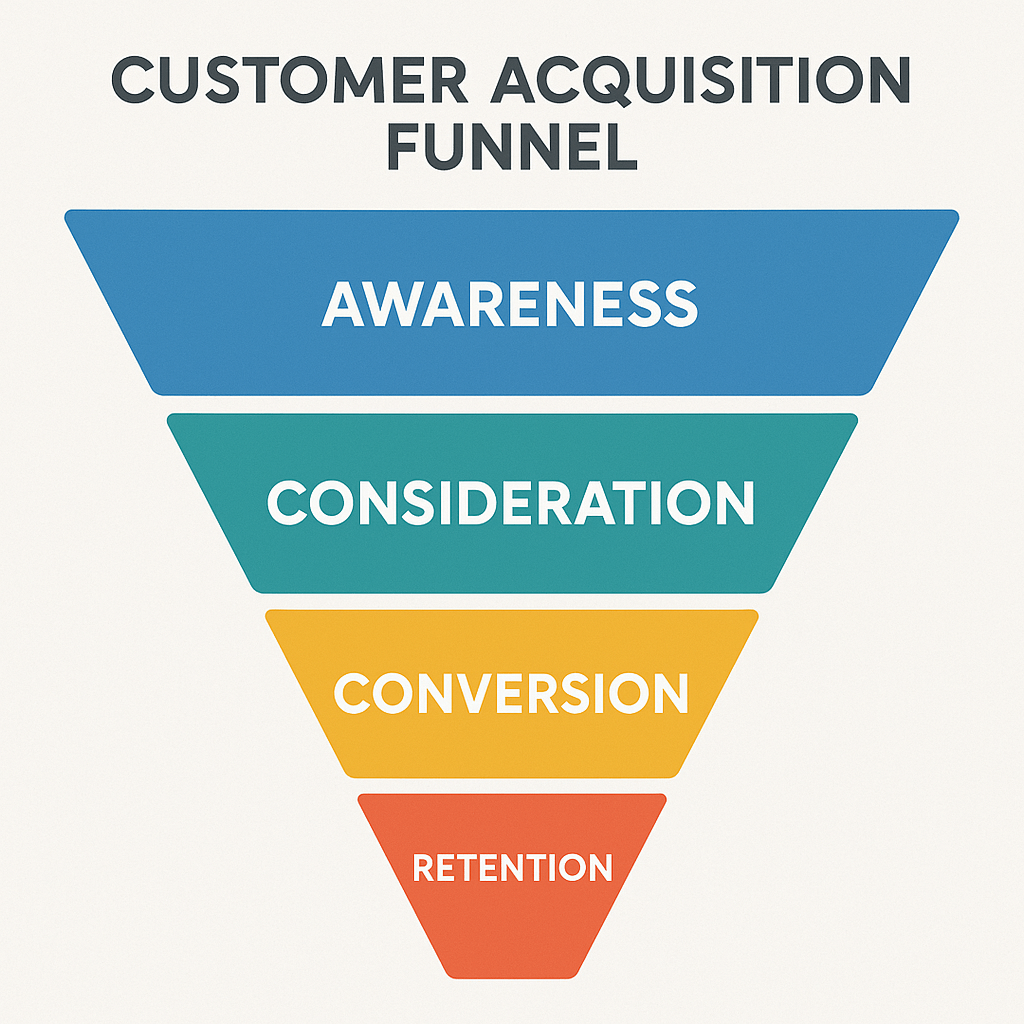
What is a customer acquisition funnel?
A customer acquisition funnel represents the path potential customers take from first discovering your product to becoming a regular user. It’s a cone-shaped framework used by cross-functional teams to analyze and optimize the buyer journey.
Tracking the acquisition funnel allows you to measure how efficiently your business converts target customers into paying customers. This helps you craft marketing and sales activities to attract the right audience, capture the interest of people considering your solution, and turn trial users into customers.
Although it shares characteristics with marketing and sales funnels, a B2B customer acquisition funnel has a broader focus. Here’s a quick overview of the key differences:
| Customer acquisition funnel | Marketing funnel | Sales funnel | |
| Goal | To guide prospects through the journey from initial brand engagement to long-term customer retention. | To create awareness among the target audience, attract leads, and turn them into paying customers. | To convert B2B sales prospects into product buyers. |
| Key stages | 1. Awareness 2. Consideration 3. Conversion 4. Retention | 1. Awareness 2. Interest 3. Consideration 4. Intent 5. Evaluation 6. Buy | 1. Prospecting 2. Lead qualification 3. Negotiation 4. Demo 5. Close (deal lost or won) |
| Who owns it? | Cross-functional team (product management, marketing, sales, customer success, etc.) | Marketing team | Sales team |
Customer acquisition funnel stages
Let’s explore each stage of the multi-step customer acquisition funnel and the associated activities. We’ll mainly focus on B2B examples, but you can adapt this framework to fit your specific market and purchasing flow.
1. Awareness
Potential customers discover your business and realize – on a surface level – that it can benefit them in some way. They may find you through one (or a combination of) the following touchpoints:
- Paid ads that you run on Google Search, social media apps, YouTube, etc.
- Blog posts promoting your product that appear in search results.
- Organic or influencer campaigns that you run on social media platforms like LinkedIn, TikTok, etc.
- Word-of-mouth recommendations from co-workers or friends.
- Industry publications, podcasts, or offline events where your product gets featured.
2. Consideration
The prospect is interested in your product and seriously considers it as a solution to their problem. They engage with sales and marketing materials to learn more about how you can help them and how you compare to market alternatives. They might:
- Explore various pages on your website to find answers to their questions.
- Request a demo or consultation through your website.
- Compare plans on your pricing page and against competitor offerings.
- Read case studies and reviews about your product on Google, online forums (e.g., Reddit), or comparison sites like Capterra.
- Download gated content (e.g., an ebook) and/or subscribe to your newsletter, attend a webinar, etc.
3. Conversion
The prospect chooses your solution and transitions to ‘customer.’ This typically involves them making a purchase, but it can also mean signing up for a free trial or actively engaging with your sales team. Conversion is the turning point – it’s the main goal of all the marketing and sales efforts that came before.
4. Retention
The work doesn’t end when a customer makes a purchase. To prevent them from abandoning your product or switching to another solution, you need to continuously deliver value and provide ongoing support. This can include:
- Optimizing the onboarding experience with the right educational content and training.
- Providing high-quality customer service through email, chatbots, conversational AI platforms, phone, etc.
- Creating additional value with the release of new features and services.
Customer acquisition metrics you need to track
To measure funnel performance, you need to track metrics that reveal how prospects behave at each stage of their journey. This will also help you spot problem areas, identify engagement patterns, and make informed decisions about where to focus your improvement efforts.
Top of the funnel metrics: Awareness
Reach is the number of unique users who saw your marketing/advertising campaign on LinkedIn, Google, YouTube, etc. It gives you a clear picture of your marketing audience size and the scope of your brand’s visibility.
Impressions refers to the total number of times your ad, video, or social media post was shown to users on a specific platform. Campaigns with a high amount of impressions suggest that your content is making an impact on the target audience.
Clicks measure how many users clicked on a call-to-action in your ad campaign or organic post. It shows that people are actively engaging with your content and want to learn more about your offering.
Click-through-rate (CTR), calculated as clicks/impressions, is the percentage of users who clicked on your post after seeing it one or more times. A high CTR (e.g., >5% for B2B search ads) indicates that your messaging resonates with the target audience and is motivating people to take action.
Branded search volume tracks how often people search for your brand name, product, or branded terms. Higher search volume means that your audience is aware of your business and are interested in learning more about your product offering.
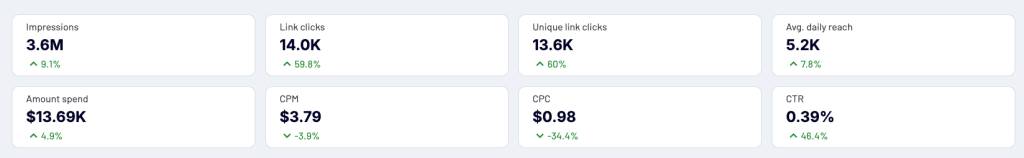
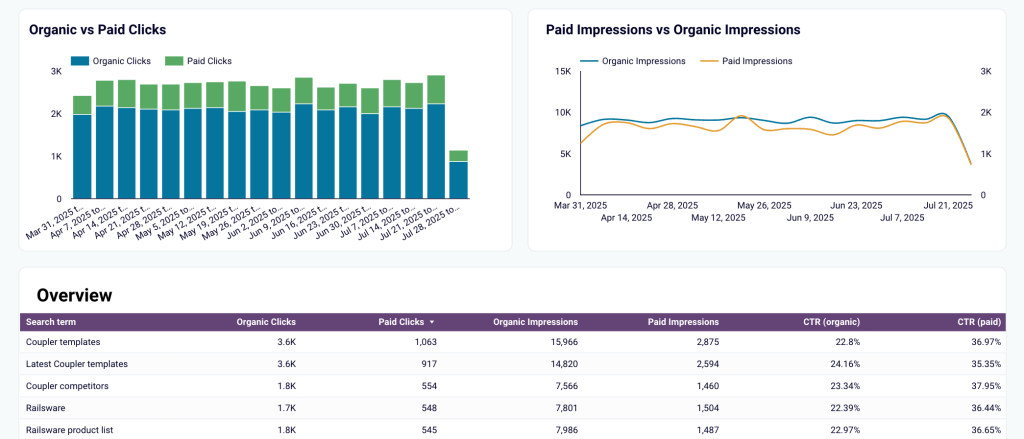
You can use specific dashboards to track brand awareness generated from organic and paid campaigns, such as this one for Google:
Here are a few other dashboards you may find useful:
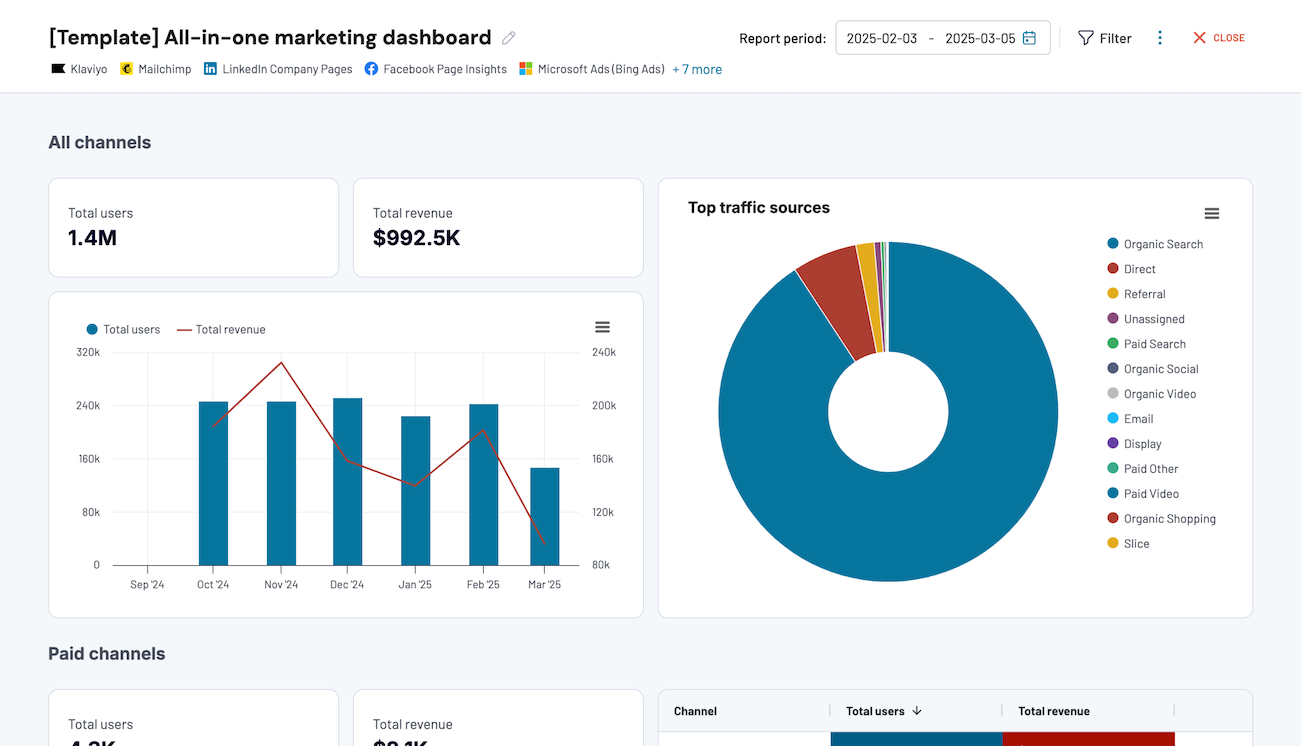
All-in-one marketing dashboard
Track performance across multiple marketing channels in one interface, comparing data from Google Analytics, Search Console, advertising platforms, social media, email, and YouTube to optimize your marketing strategy and maximize ROI.


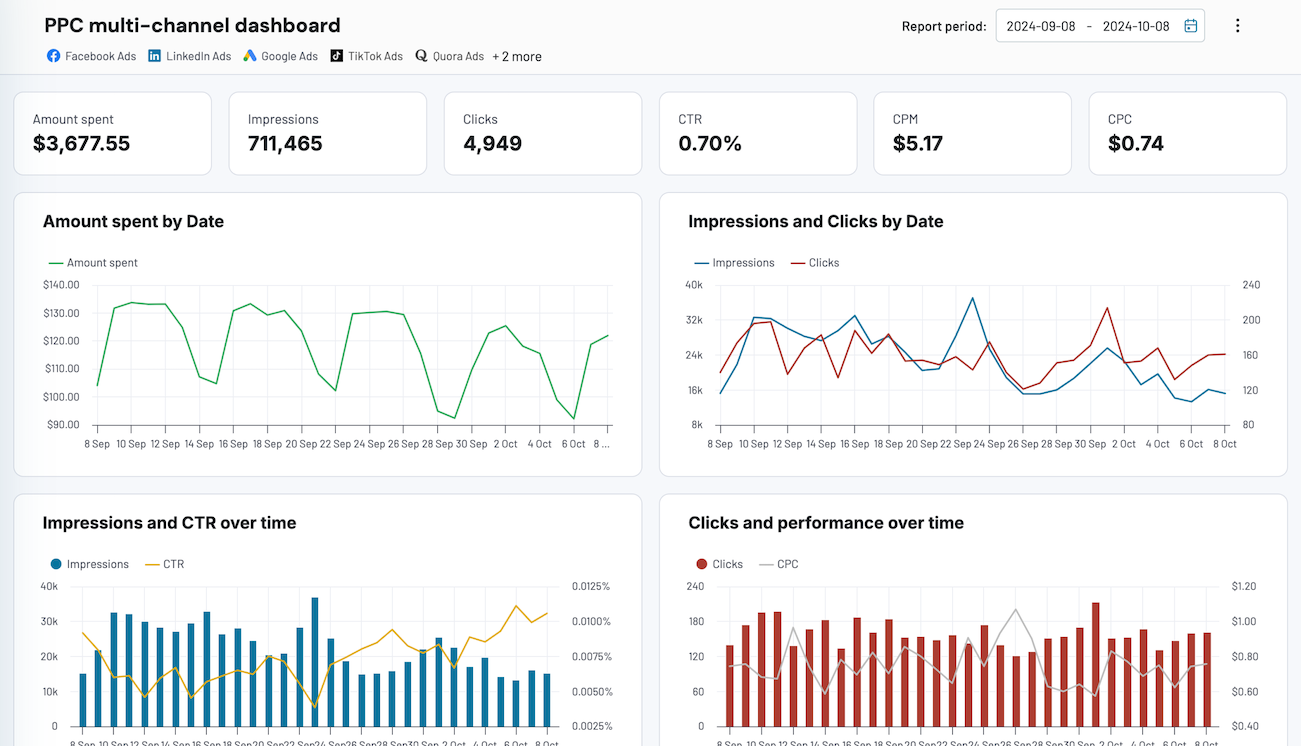
PPC multi-channel dashboard
Consolidate data from multiple advertising platforms including Google, Facebook, LinkedIn, TikTok, and more to track campaign performance, analyze spend efficiency, and optimize your PPC budget allocation across channels.


You can also design funnels for specific campaigns or advertising activities, such as a Google Ads funnel or Facebook Ads funnel. This gives you deeper insight into how your awareness-driven channels are converting prospects into leads.
Middle of the funnel metrics: Consideration
Website traffic is the total number of visitors your site receives from search engines, social media platforms, AI chatbots, and other sources. A high amount of traffic proves that your top-of-funnel activities are making an impact, i.e. your content marketing efforts are driving potential customers to explore if your solution fits their specific needs.
Session duration measures how long users spend on your site during a single visit. The longer the better – it indicates that your content (landing pages, blog posts, etc.) is valuable and engaging for the target audience. According to Databox research, a good average session duration for B2B companies is around 1 minute 20 seconds.
Sales qualified leads are the number of prospects who have shown genuine interest in your solution by submitting contact forms, requesting a product demo, downloading an ebook, etc.
Cost-per-lead (CPL) quantifies how much you spend on promotional activities to generate a new lead. It’s calculated by total campaign cost/number of leads generated. A lower cost means better return on investment and a more efficient marketing budget. In 2025, B2B SaaS companies can expect to spend around $237 per lead, compared to $91 for e-commerce businesses.
You can use dedicated advertising funnel dashboards to track how your marketing efforts drive lead generation across channels:
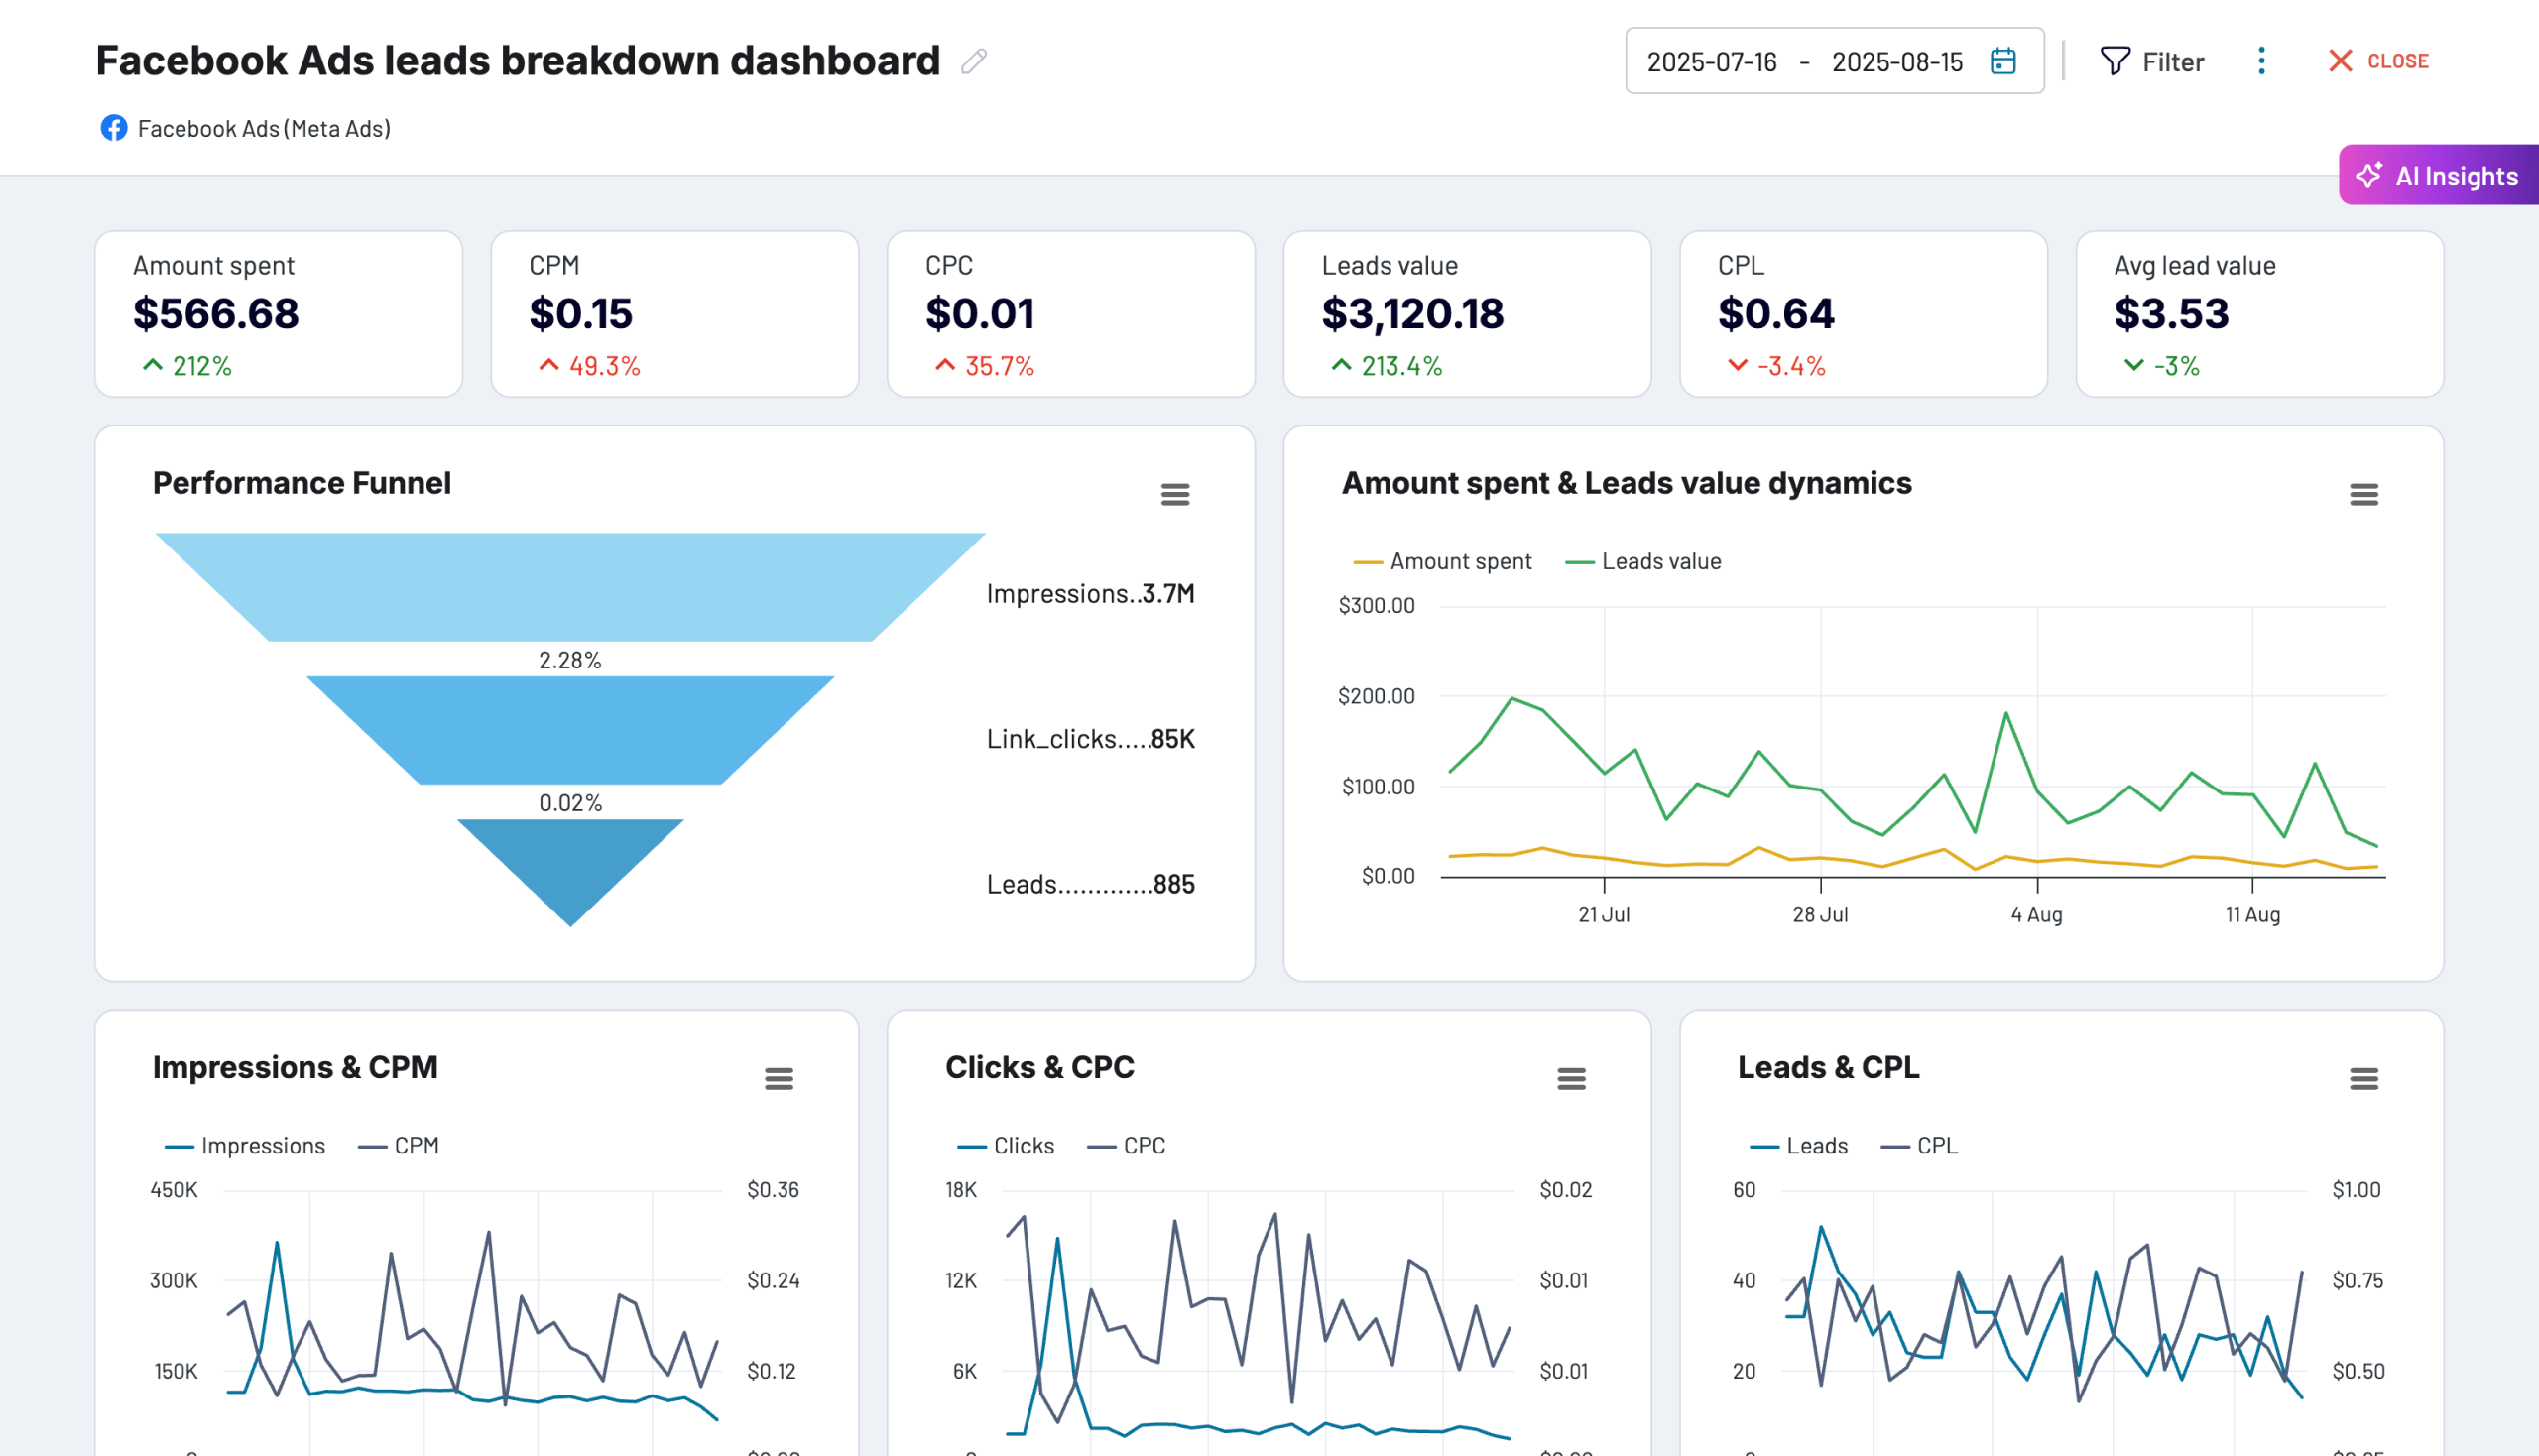
Facebook Ads leads breakdown dashboard
Analyze the complete lead generation funnel from your Facebook lead ads. Track how impressions convert to leads with detailed cost analysis, lead value tracking, and demographic performance insights.
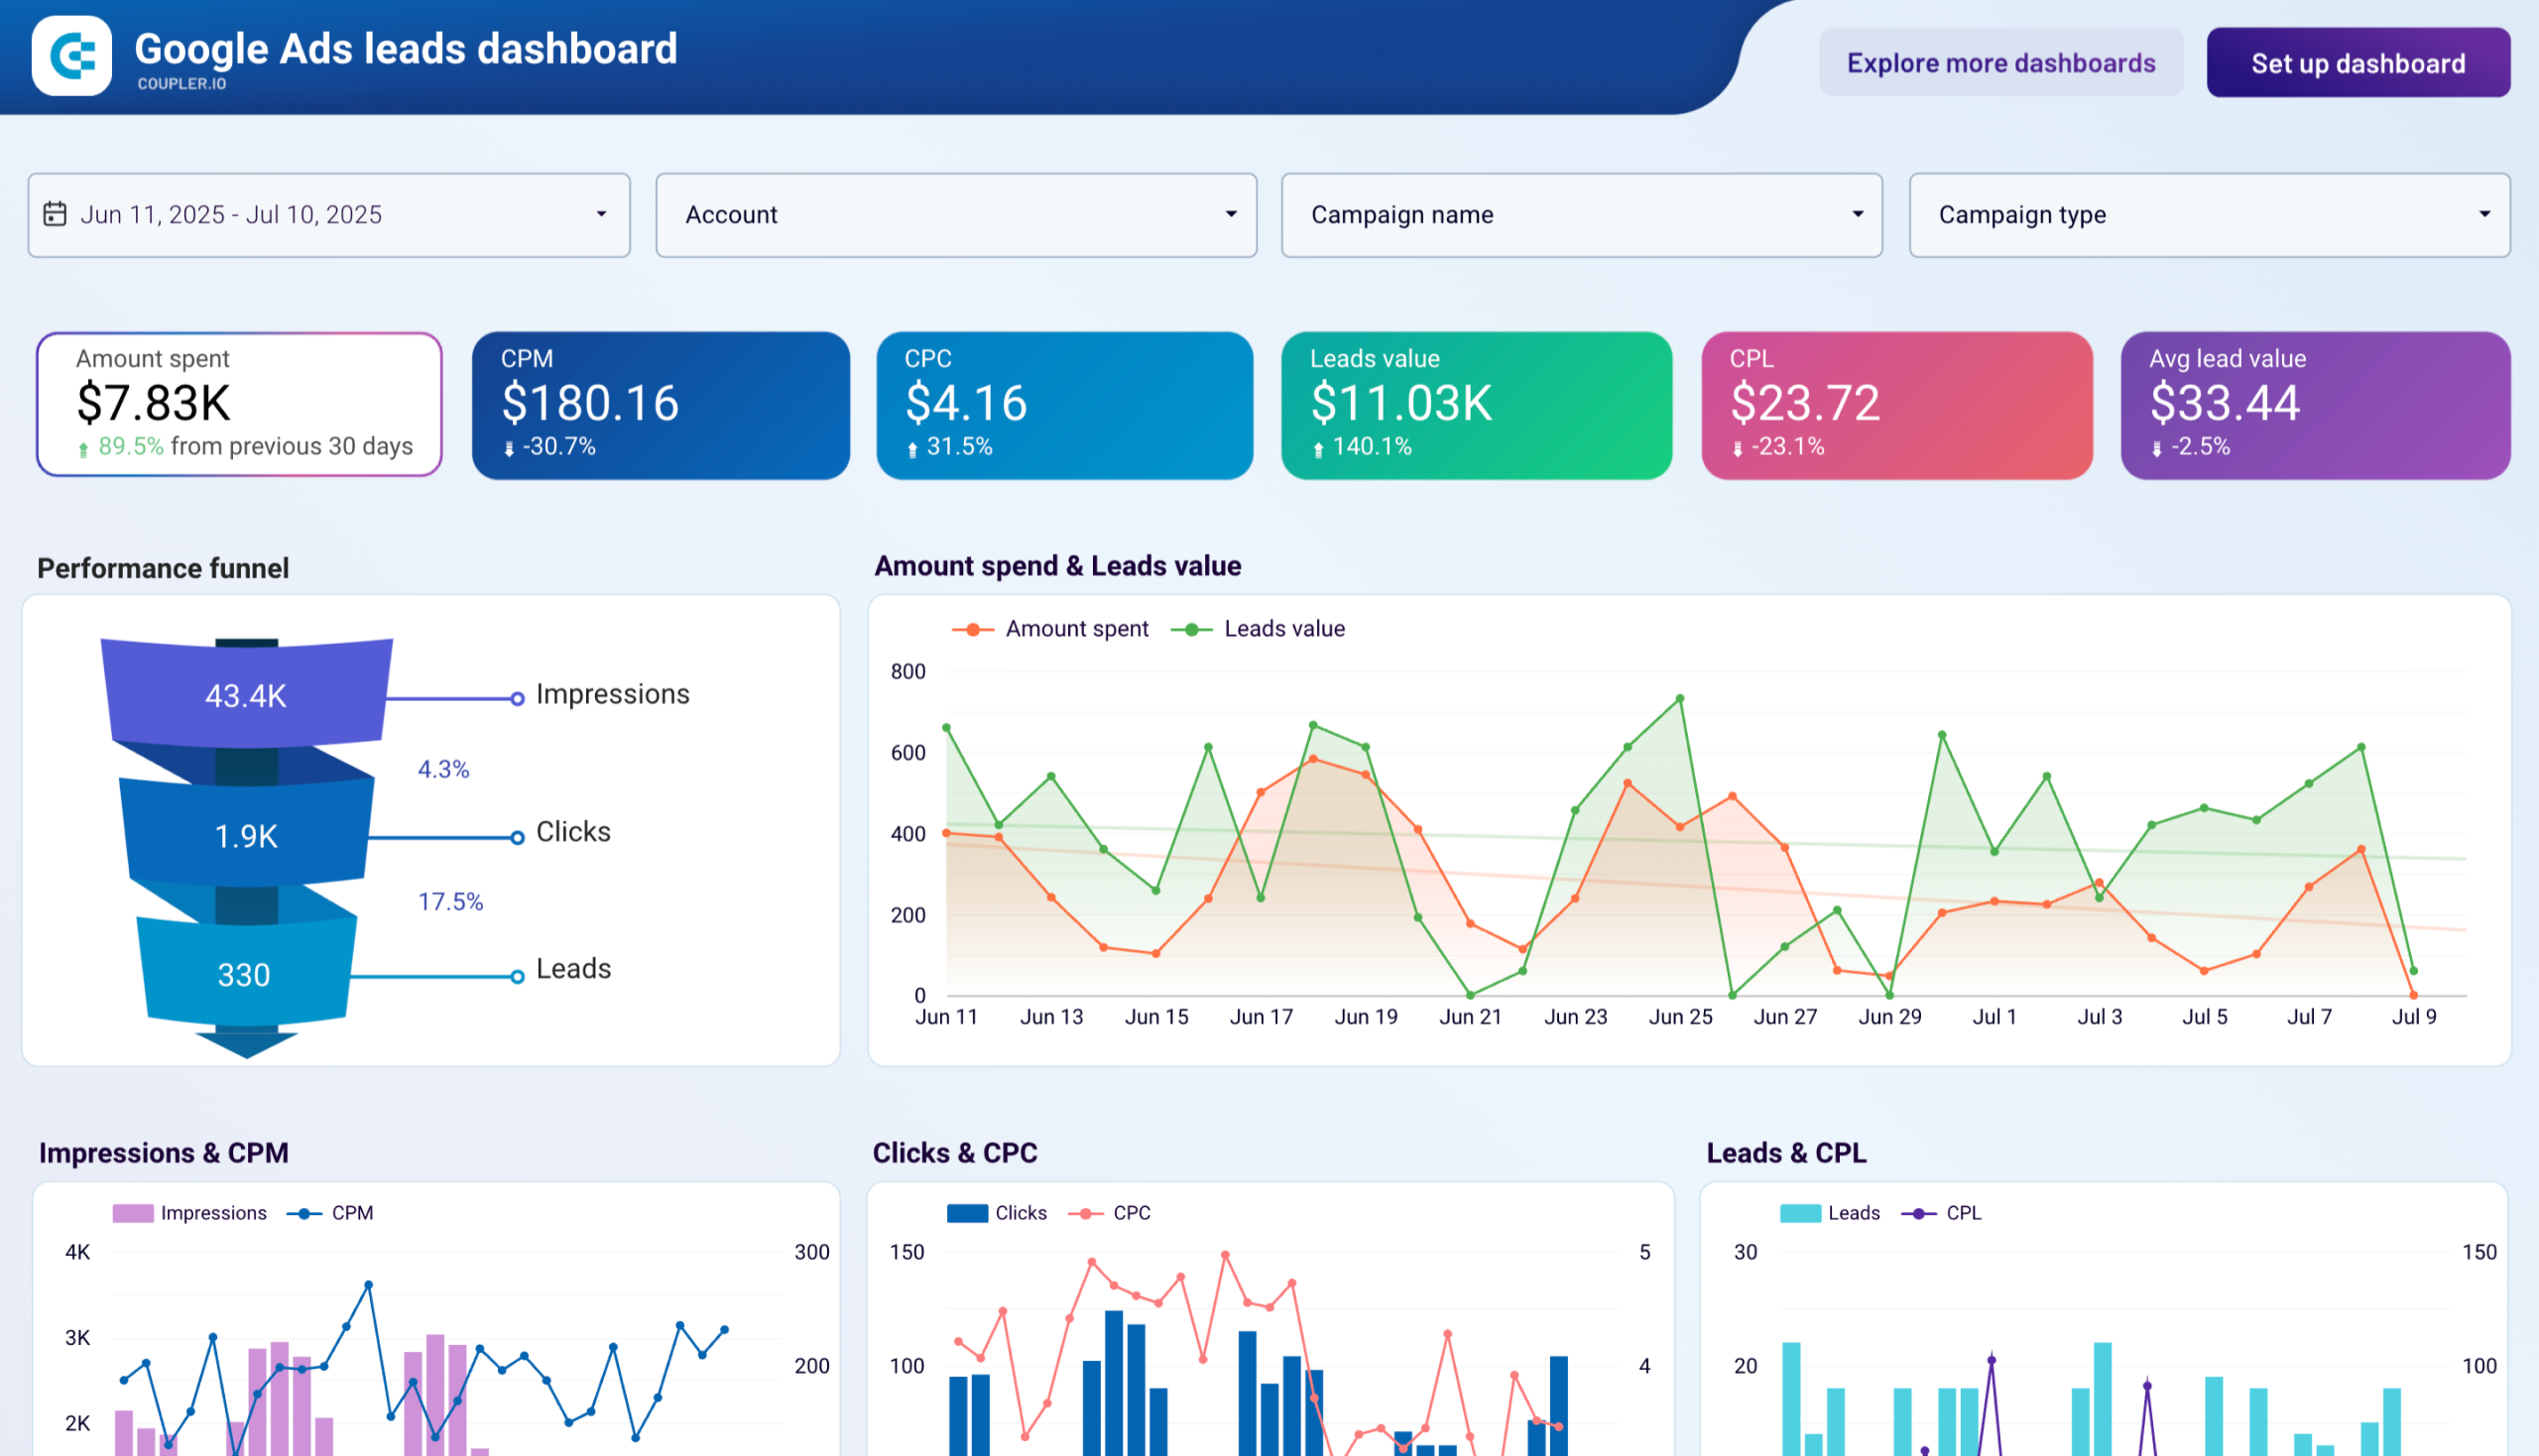
Google Ads leads dashboard in Looker Studio
Track lead generation effectiveness across your Google Ads campaigns with a comprehensive analysis of lead quality, acquisition costs, and conversion pathways to generate more qualified leads.

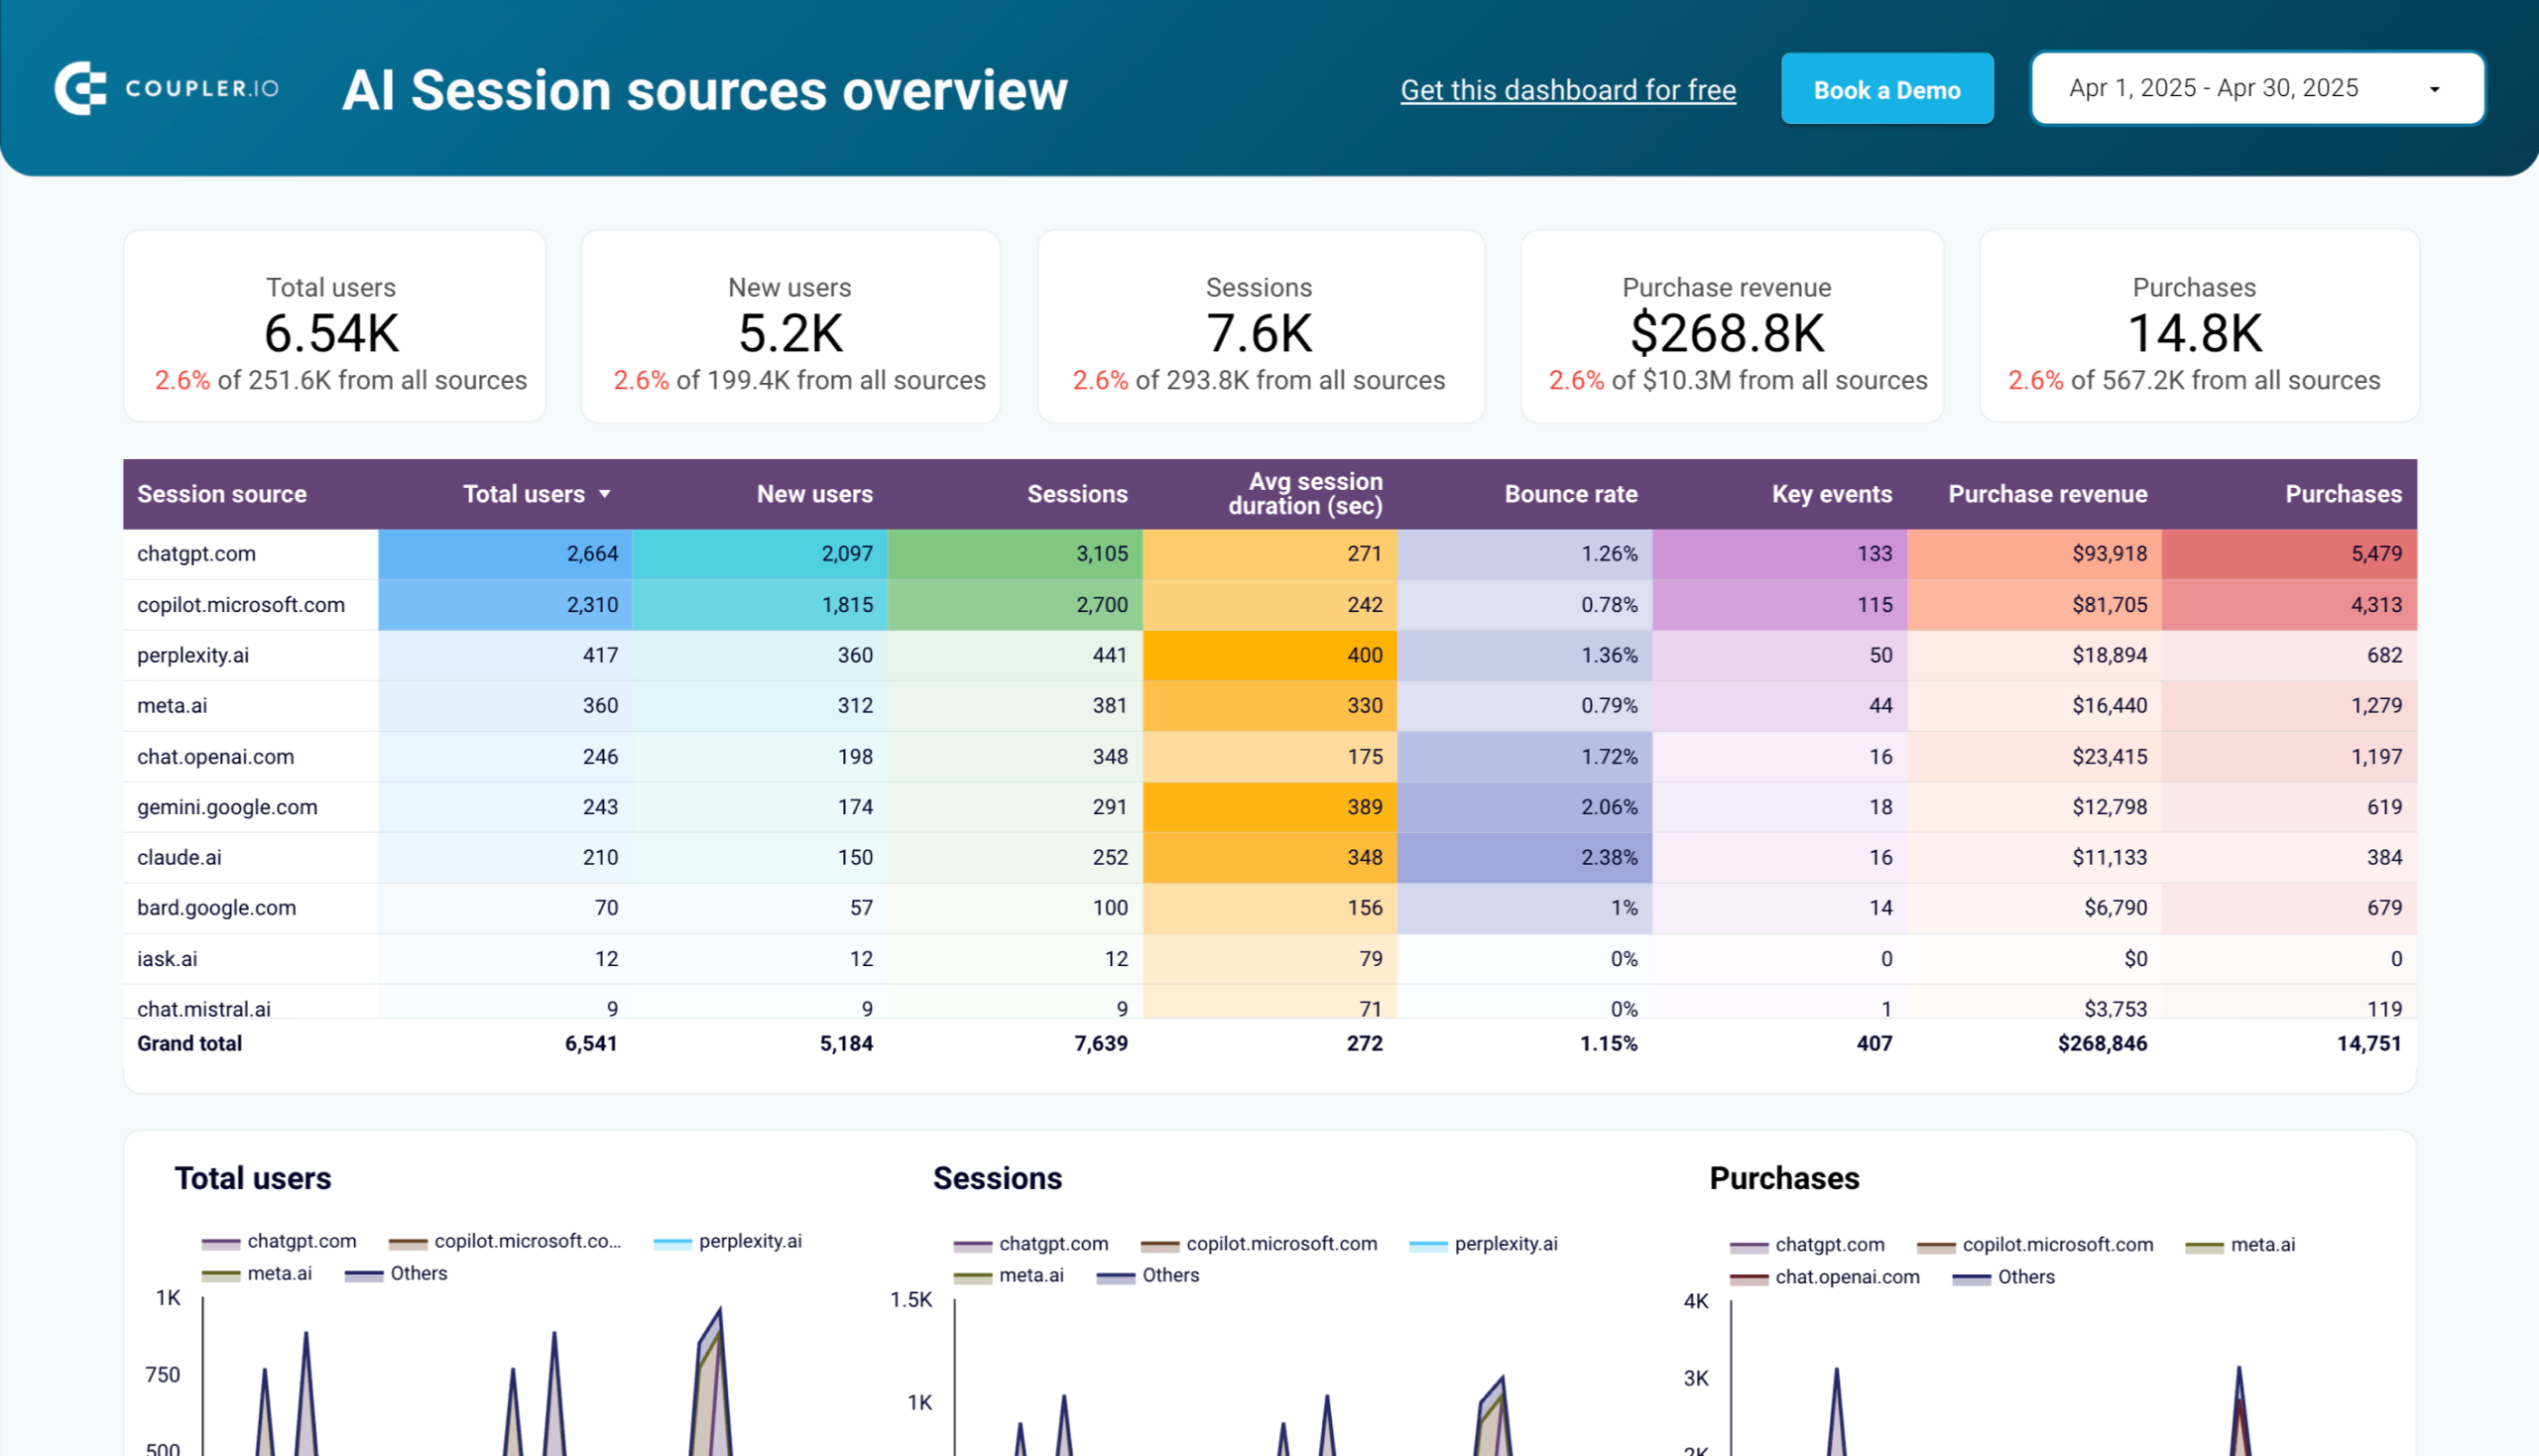
AI traffic analytics dashboard in Looker Studio
Visualize and analyze visitor behavior from AI tools like ChatGPT, Claude, and Gemini with actionable insights on engagement, conversions, and content performance. This dashboard helps you understand the emerging AI referral channel and its impact on your business goals.
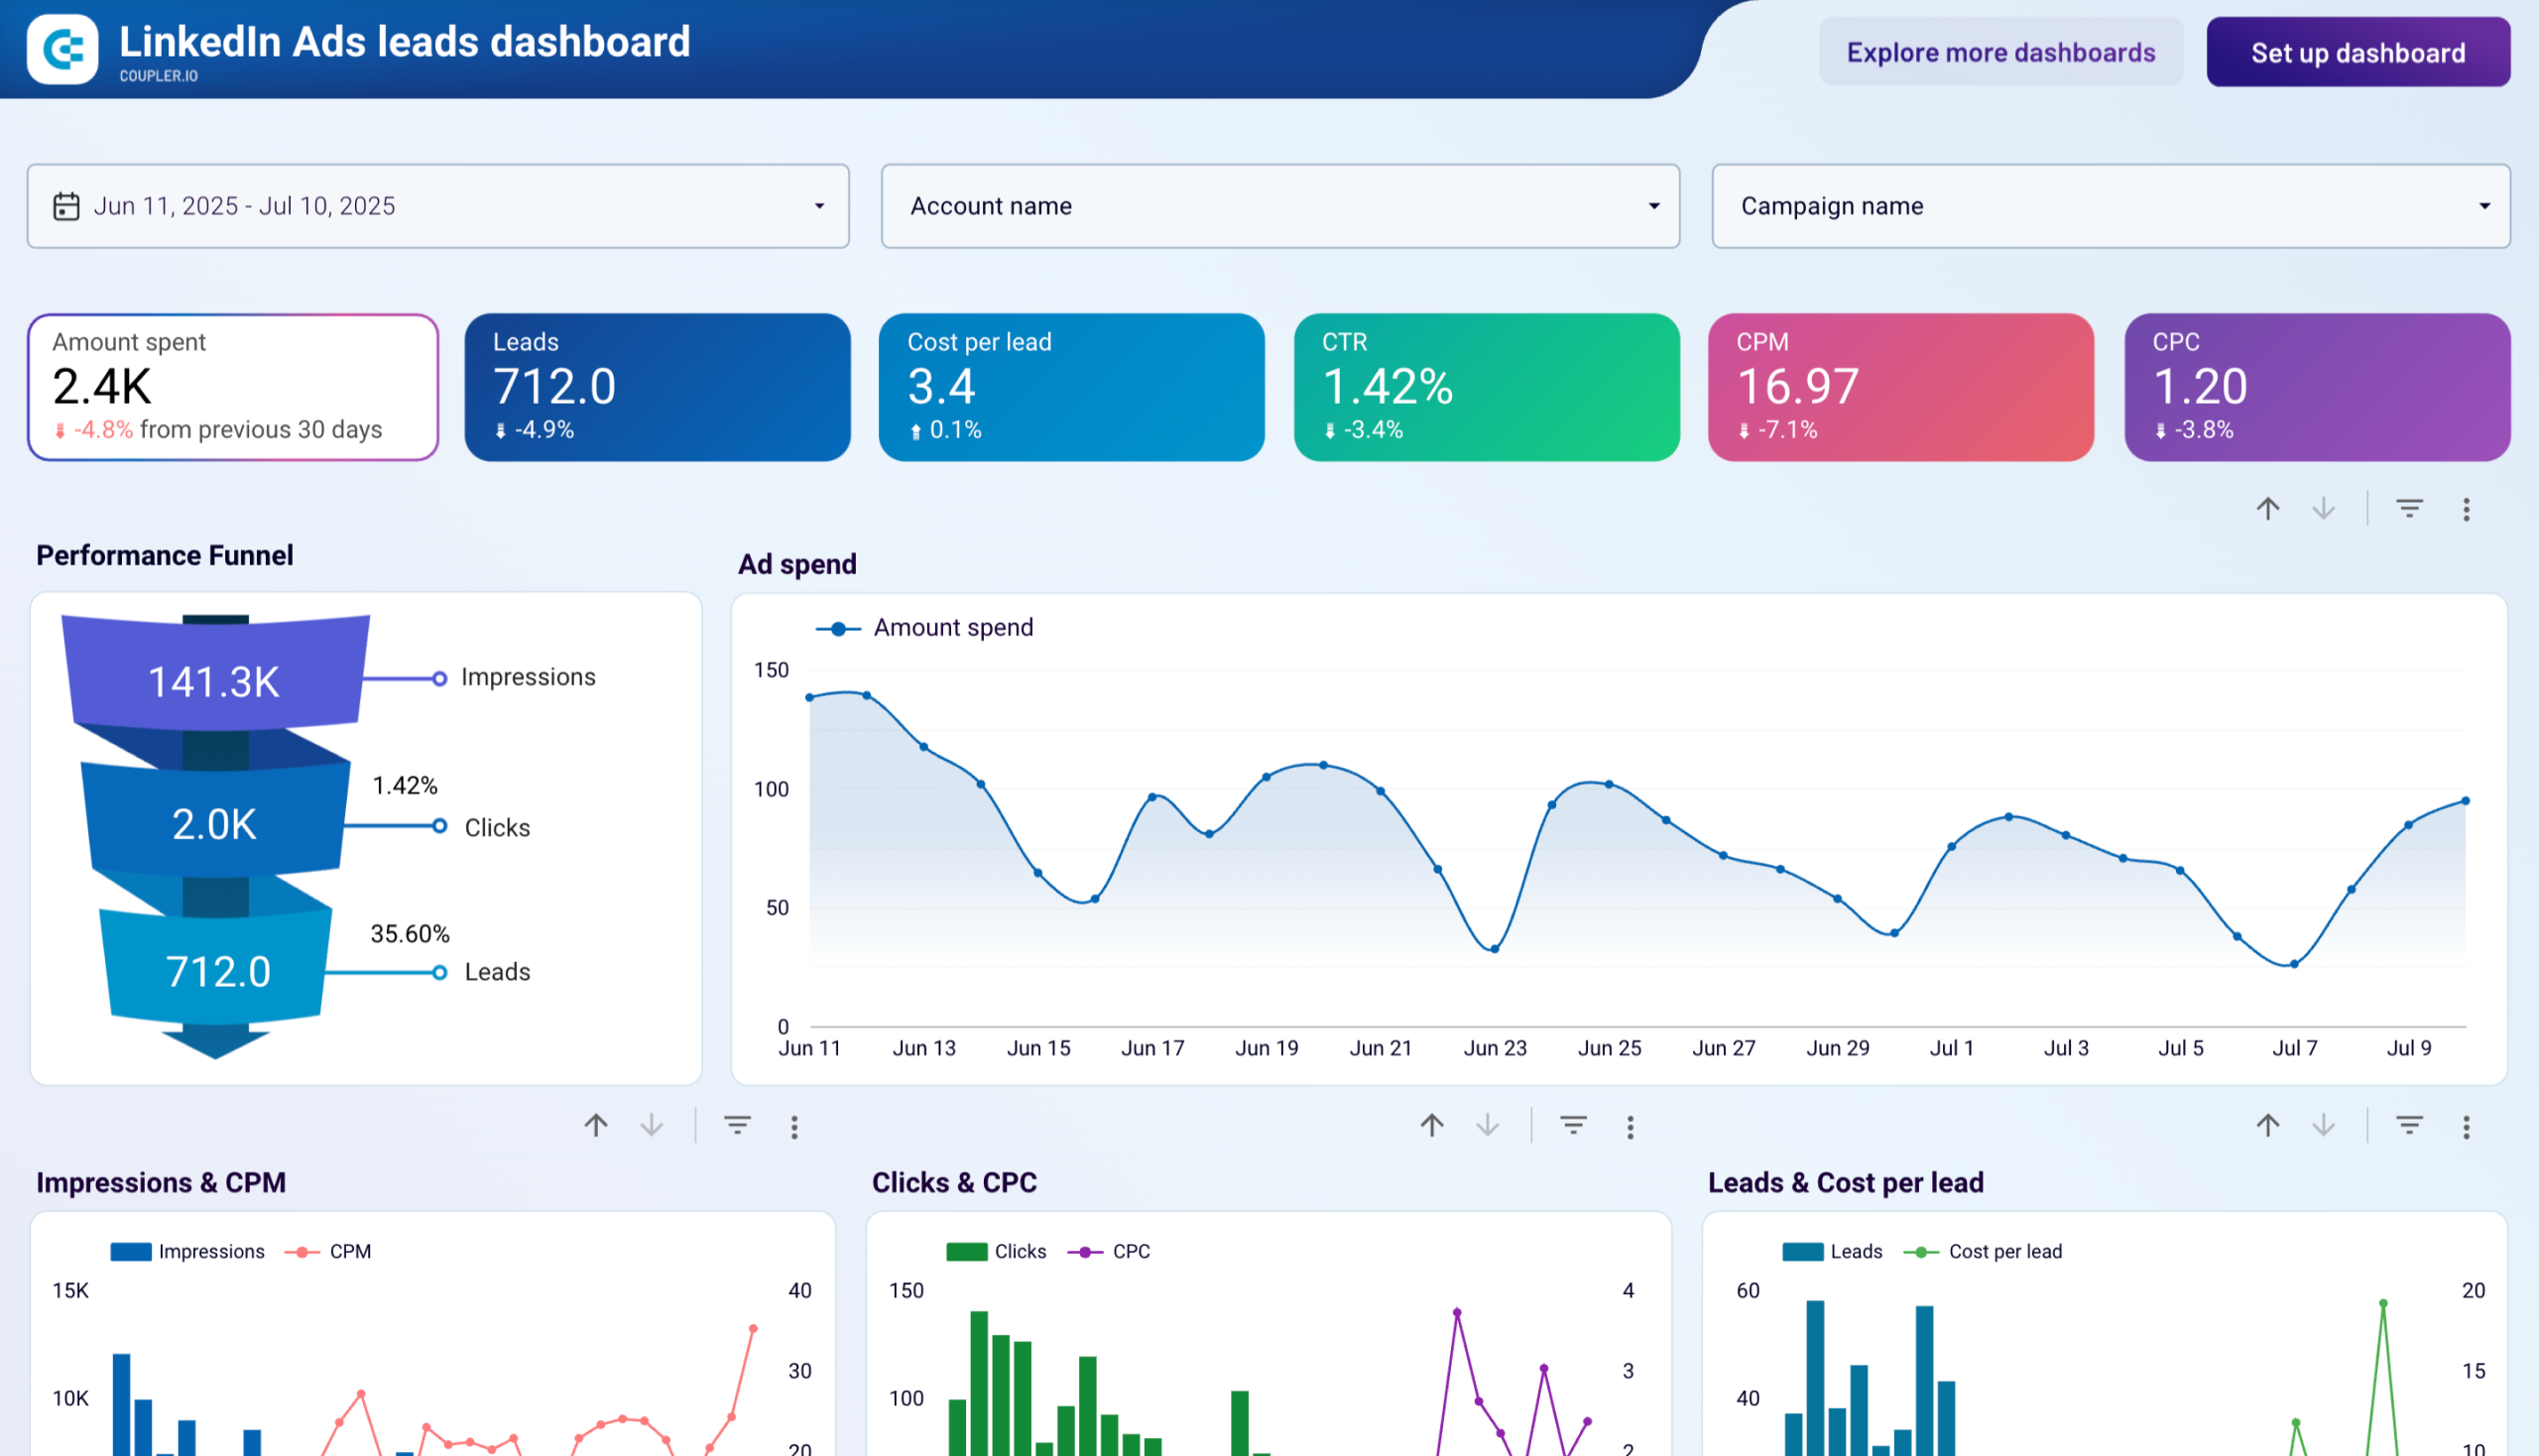
LinkedIn Ads leads dashboard in Looker Studio
Analyze lead generation performance from your LinkedIn advertising campaigns with detailed metrics on lead quality, conversion costs, and campaign effectiveness to optimize your B2B strategy.
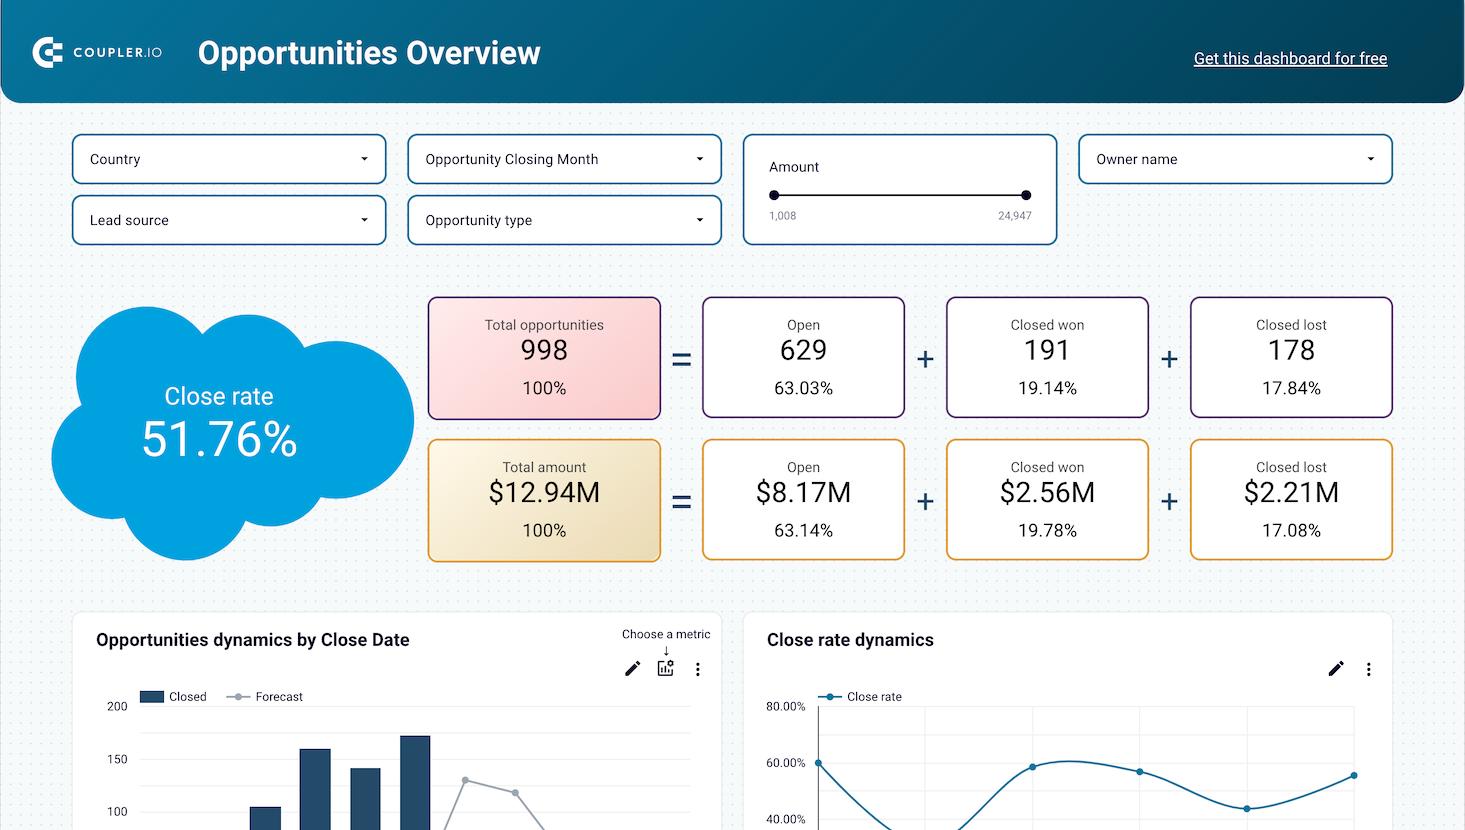
Salesforce sales analytics dashboard in Looker Studio
Analyze your sales funnel performance with the insights collected from Salesforce, Google Analytics, and the ad platforms you use for lead generation.

Bottom of the funnel metrics: Conversion
Sign-ups/free trial subscriptions represent new customers who have decided to test and start using your product. A high number of sign-ups indicates that your funnel is effectively moving prospects from the consideration stage to action.
Conversion rate is the percentage of visitors who become leads, and leads who convert into customers. When your business sees high conversion rates (typically between 4-10% at the later stages), it means your funnel is well-optimized and your marketing and sales efforts are working.
Purchases count the total number of completed sales where leads convert into buyers. This is your ultimate conversion metric, as it demonstrates that your product solves real problems people are willing to pay for.
Customer acquisition cost (CAC) is the total amount you invest to acquire each new customer across all sales and marketing activities. Tracking CAC helps you determine which acquisition strategies deliver the highest return on investment. The average CAC for B2B SaaS businesses stands at $239 in 2025.
Dashboards that track the customer journey from first touch to acquisition are handy for monitoring conversion metrics:
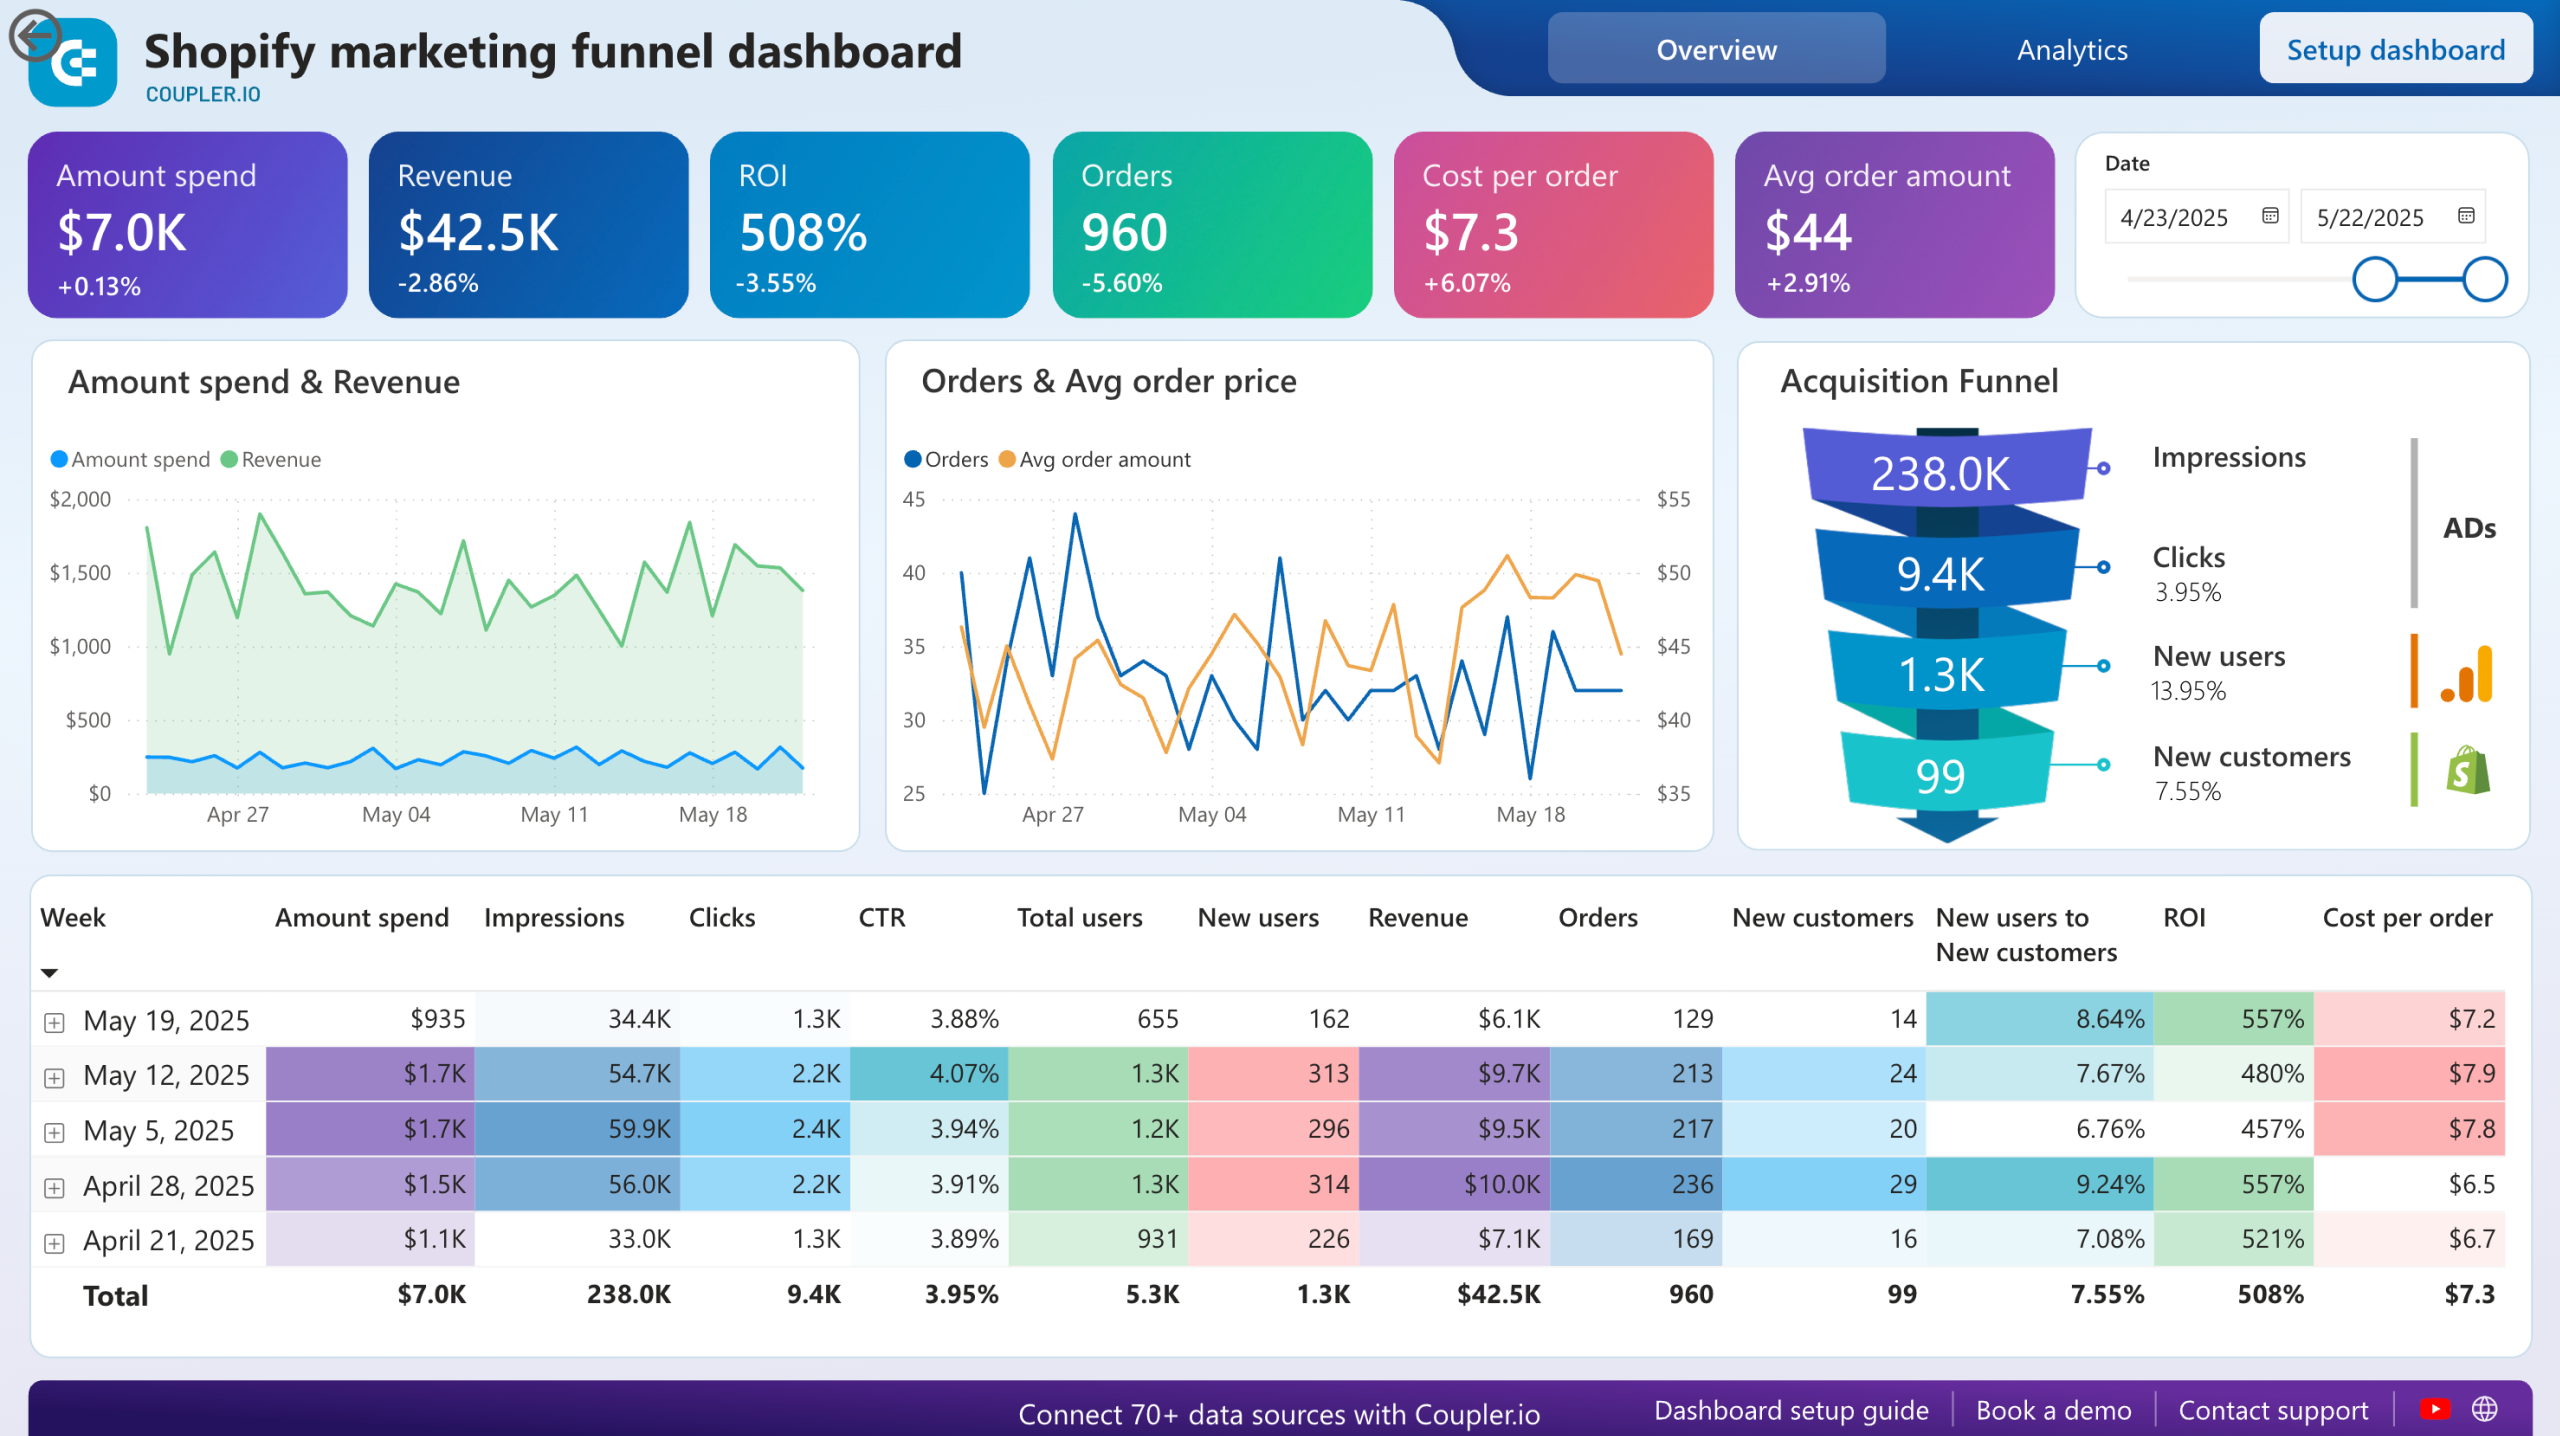
Shopify marketing funnel dashboard in Power BI
Examine the customer journey from advertising exposure to purchase completion with integrated data from your Shopify store, advertising platforms, and analytics tools.


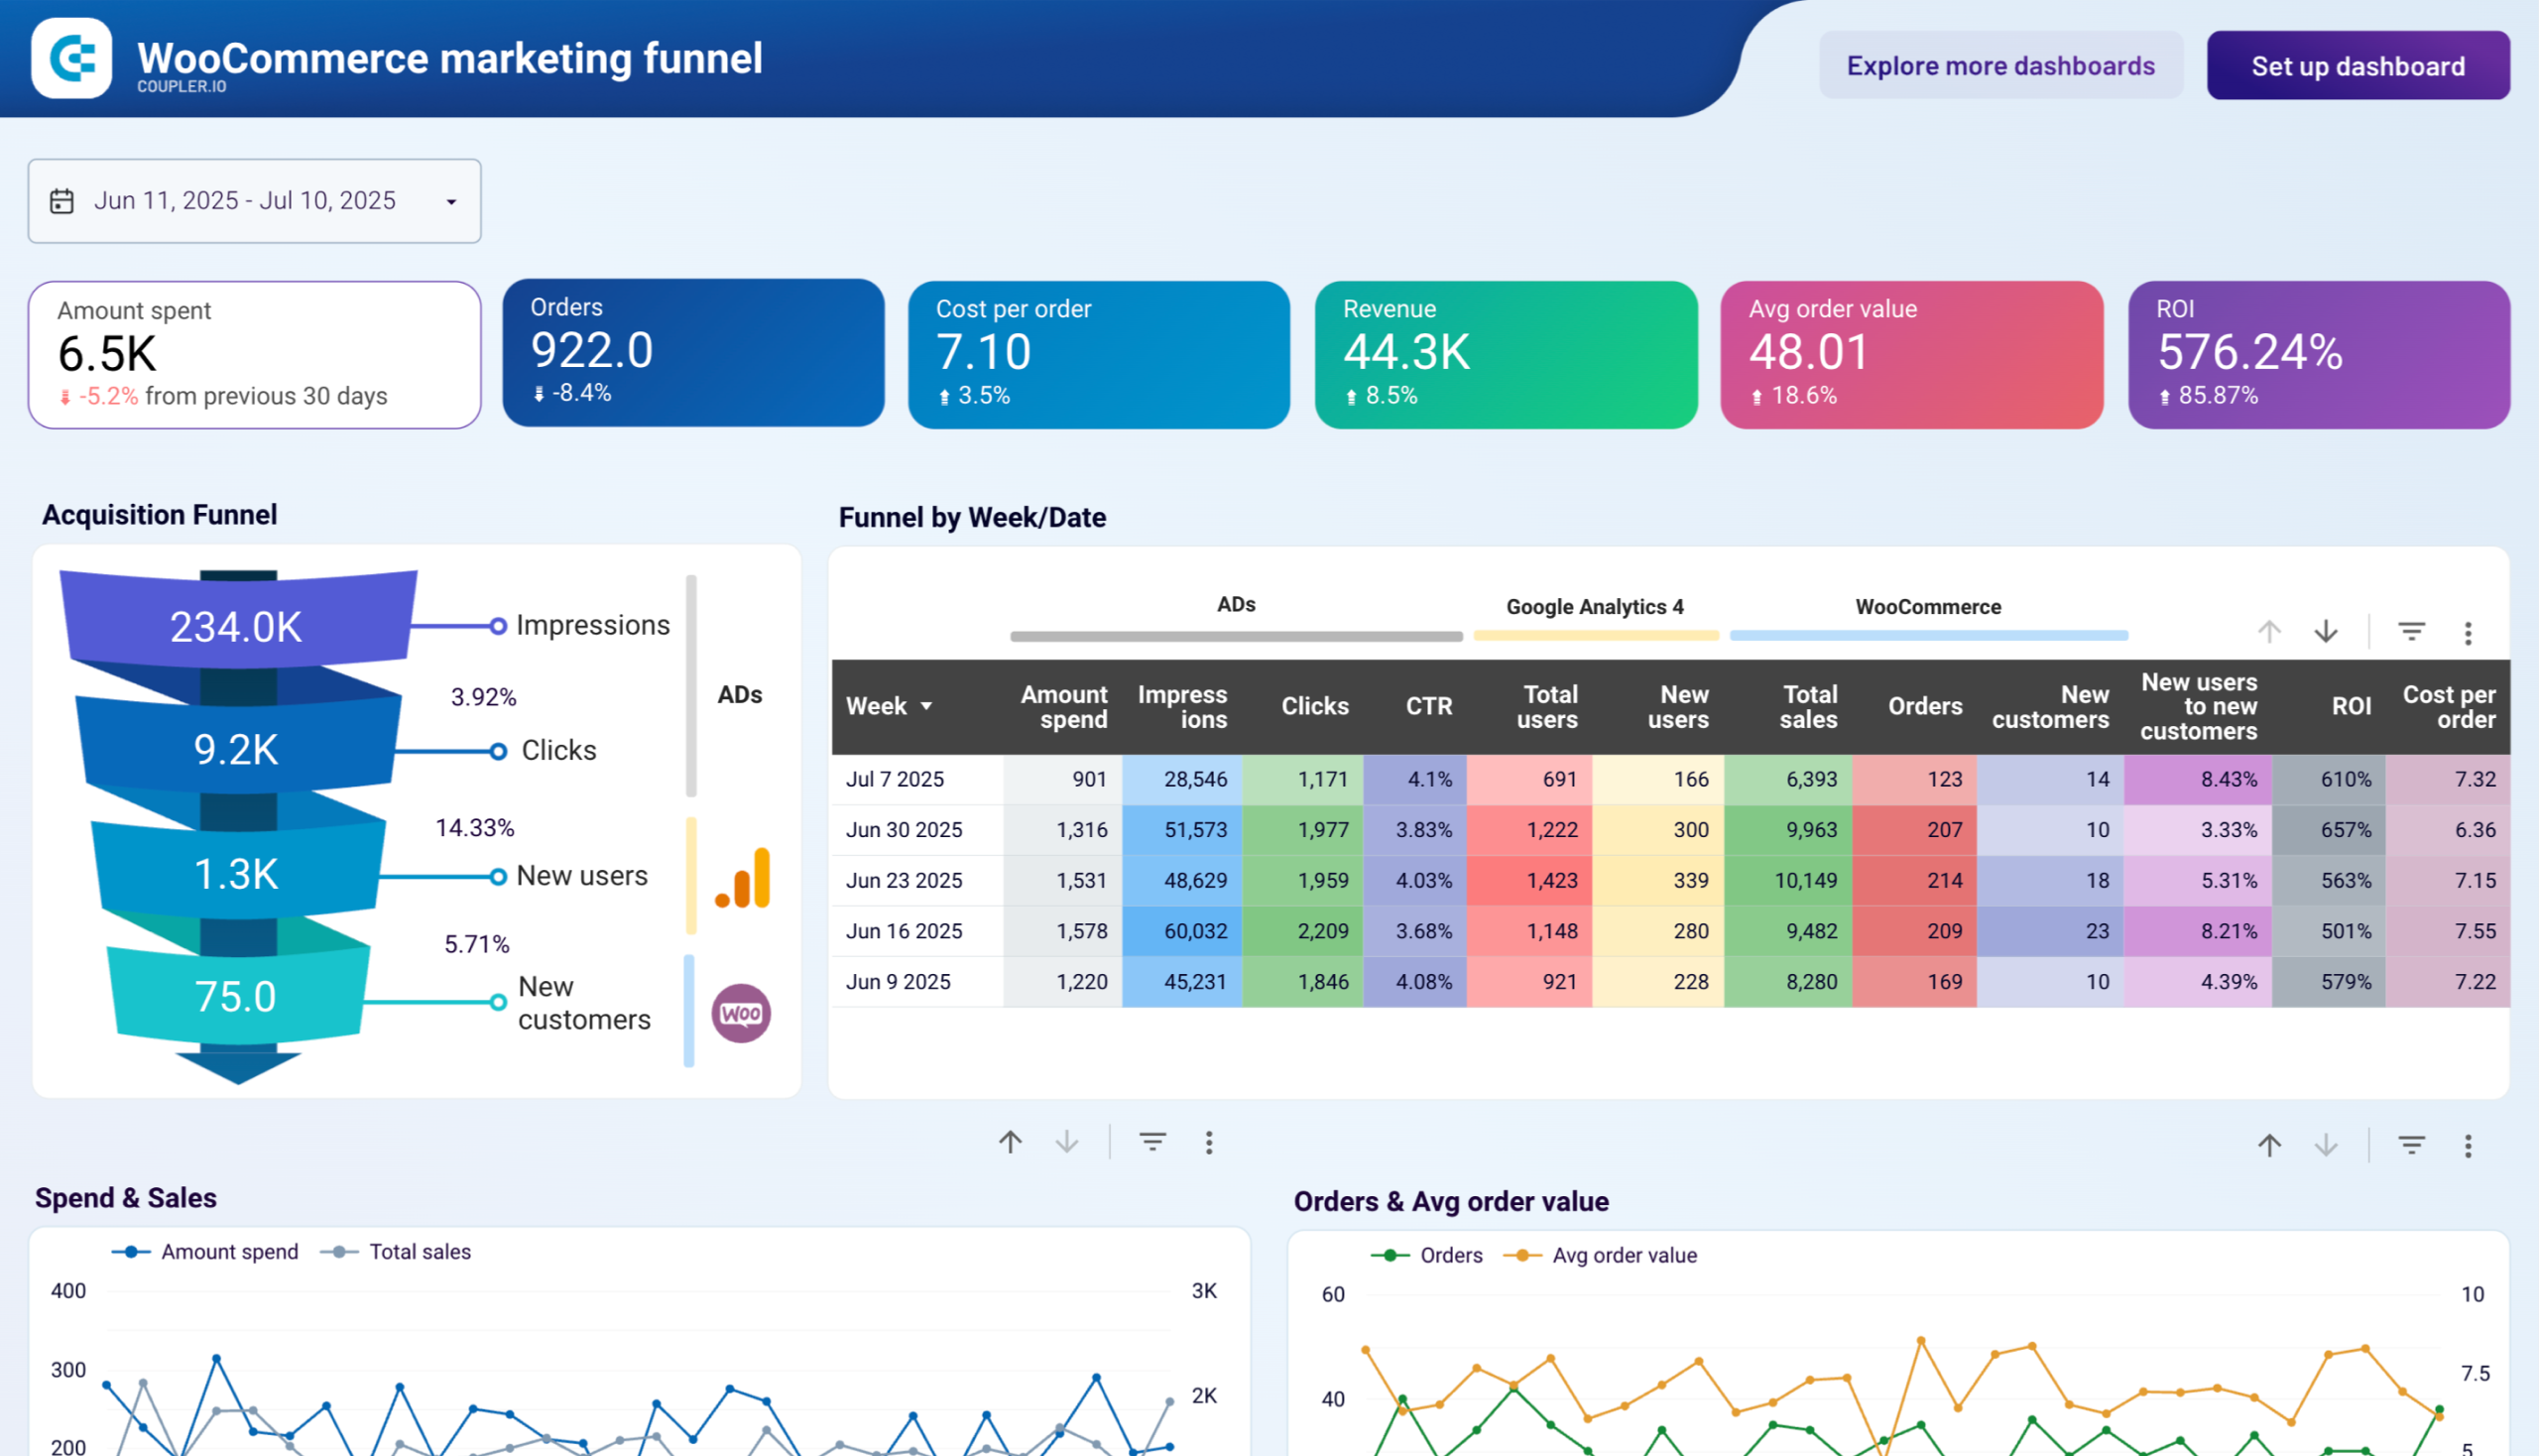
WooCommerce marketing funnel in Looker Studio
Track the complete customer journey from website visit to purchase completion with detailed funnel analysis to identify conversion bottlenecks and improve sales performance.


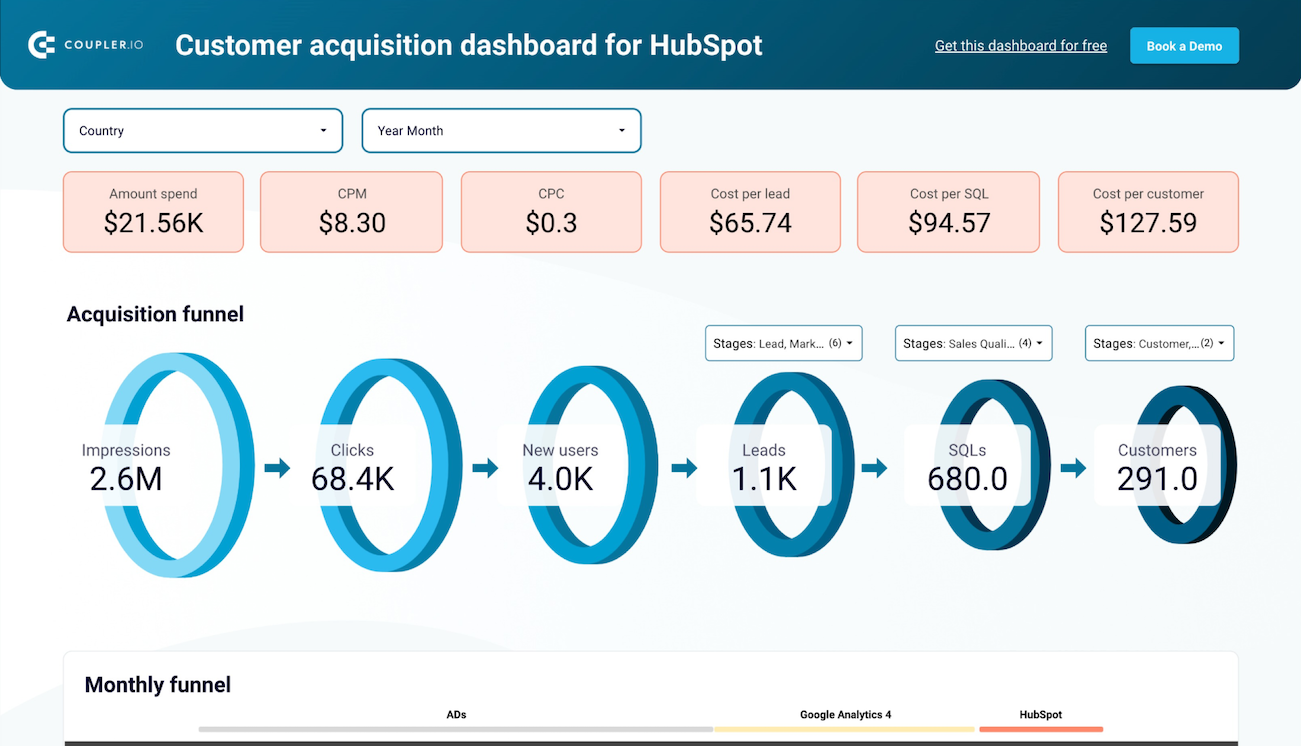
Customer acquisition dashboard for HubSpot in Looker Studio
Monitor your acquisition funnel and analyze its effectiveness using the insights from HubSpot CRM, advertising platforms, and Google Analytics 4.

Bottom of the funnel metrics: Retention
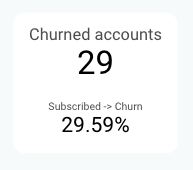
Churn rate tracks the percentage of users who stop using your product and/or unsubscribe from your service within a specific time period (e.g., month, quarter, year). A high churn rate (>5% for B2B) signals problems with customer satisfaction and product value, while low churn indicates that users are happy with your solution.
Customer lifetime value (CLV/LTV) predicts the total revenue you can expect from a single customer throughout their relationship with your business. It helps you determine how much you can afford to spend on customer acquisition while staying profitable. According to B2B industry benchmarks, you should aim for a CLV at least 3 times your CAC.
Metrics can vary depending on the structure of your acquisition funnel and your business goals. However, it’s crucial to track key performance indicators for each stage. Here’s how Tomilola Boyinde, Founder and CMO at Bulbling 247, organizes his analytics approach:
I break (the funnel) down into key stages: awareness, interest, consideration, and conversion. Each stage has its own specific goals and performance indicators.
For example, I track reach, impressions, and clicks during the awareness phase, while the conversion stage focuses on metrics like sign-ups or purchases. I use Google Tag Manager, Google Analytics, HubSpot, and other tools, depending on the project, to tag and monitor every step of the journey.

Strategies for analyzing your customer acquisition funnel
Every leak in your customer acquisition funnel costs you revenue. Here are some key strategies – and advice from industry experts – on how to assess funnel performance and identify weaknesses before they snowball.
Monitor trends and anomalies in key performance metrics
Visualize your funnel data in real-time dashboards and set up alerts for when sudden changes occur. For example, you can look out for unusual drops in session duration that can indicate a website performance issue, or unexplained dips in traffic that may signal SEO problems, broken links in your ad campaigns, or poorly performing content.
Conversion rate fluctuations can also point to issues with your product messaging, recent pricing changes, or seasonal shifts that influence customer behavior (e.g., Christmas shopping, summer vacations, etc.).
Here’s how Sasha Berson, Chief Growth Executive at Grow Law, interprets and addresses these types of anomalies:
If we see low time-on-page or high bounce rates on a service page, that signals weak messaging or UX friction. If people click the CTA but don’t fill out the form, we’re probably facing a trust issue, poor mobile optimization, or too many form fields.
Solving it starts with mapping the full funnel, setting up clear stage-by-stage KPIs, and optimizing one step at a time – starting with the one that bleeds the most users.
Identify your biggest drop-off points
Funnel leaks can be a silent sales killer, so it’s critical to identify them early. Check conversion rates between each funnel stage to pinpoint where you’re losing the most prospects, then use funnel visualization tools (i.e. dashboards) to see the volume and percentage of users exiting at each step. This way, you can prioritize which leaks to fix based on their conversion impact.
Try to look beyond obvious drop-offs like abandoned carts to spot subtler leaks, such as users who engage with multiple landing pages but never request a demo, or prospects who download resources but don’t progress to sales calls. Jorge Cunha, Consultant and Data-Driven Marketing & Senior Manager at IT Tech Buz, offered advice on how to detect funnel drop-offs that often fly under the radar:
To identify less obvious leaks, export GA4 events to BigQuery, link them with CRM IDs, and monitor cohort tables. If a high-intent segment never converts into a customer, you’ve likely found an attribution or remarketing mismatch.

Look for patterns in high-converting prospects
Analyze the demographics, behaviors, and characteristics of leads who convert into customers. What do they have in common, and how can you target those segments in your marketing and sales efforts? For instance, look for patterns in:
- Traffic sources – which channels bring the most paying customers (organic search, advertising, influencer marketing, etc.) and the specific platforms (e.g., TikTok Ads) that are worth investing in further.
- Geography – regions and countries that deliver high volumes of qualified leads. You might discover untapped markets and opportunities for content localization.
- Content engagement – specific landing pages, blog posts, videos, social media posts, or other types of content your ideal customers consumed before converting. This reveals what materials and messaging influence buying decisions.
- Age and gender (if available) – helps narrow down your audience and improve the targeting accuracy (and cost efficiency) of your ads.
Tip: Most of this information can be found in web analytics, SEO, and heat mapping tools like GA4, Google Search Console, and Hotjar.
Common customer acquisition funnel bottlenecks (and how to fix them)
Let’s discuss a few of the most common funnel blockers you might face and how to tackle them.
1. Unclear value proposition
Generic phrasing like ‘We help businesses grow’ or ‘Leading provider in X services’ rarely motivates prospects to convert. It comes down to this: If potential customers don’t understand how you can benefit them, they won’t buy from you.
As Leury Pichardo, Director of Digital Marketing at Digital Ceuticals points out:
The most common bottleneck isn’t on your landing page or at checkout; it’s the invisible gap between a customer being solution aware and product aware. This is when a visitor understands solutions to their problem exist, but they have not mentally connected your specific product as the superior option.
2. Complicated sign-up process
Nobody wants to fill out endless forms and navigate complex tutorials just to test your solution. Instead of a time-consuming chore, your sign-up process should be straightforward, speedy, and demonstrate how easy your product is to use. For instance, you could:
- Offer single sign-on options with Google, LinkedIn etc.
- Skip credit card requirements for free trial sign-ups.
- Limit the amount of fields in your sign-up forms (say, 8 instead of 15).
- Let users explore your product before prompting them with tours and pop-ups.
3. Lack of lead nurturing across stages
What’s the point of spending thousands on ads, receiving hundreds of relevant leads, only to lose them due to poor follow up processes? If you don’t engage with prospects considering your solution, you hand them over to competitors who will.
However, there’s a fine line between nurturing leads and being too pushy. Don’t be afraid to reach out with personalized offers, trial reminders, relevant upsells, or helpful resources (e.g. onboarding guidance, knowledge base links) when appropriate. You can use session tracking tools like GA4 and Microsoft Clarity to provide the right level of support to the right audience segment.
It also makes sense to speak to people who didn’t end up buying from you. Fergal Glynn, Chief Marketing Officer at Mindgard, explains why it’s so critical:
Complex lead generation forms asking for excessive information, unclear call-to-actions, and poor marketing-to-sales handoff can create problems when there’s no clear follow-up process. Understand the buyer’s journey first, then talk to customers who stalled before converting and ask what confused them. This will allow you to optimize content, streamline forms, and ensure quick sales follow-up.
4. Weak lead magnets
Prospects seek out resources that will help them solve a specific problem. They don’t want to read a whitepaper about your product’s features, take a free course that repeats generic advice from ChatGPT, or sign up for your newsletter just because you have one.
Any materials or freebies you offer should be solution-focused. Provide potential customers with resources (ebooks, webinars, etc.) that address their pain points. You can also offer practical tools – such as free reporting templates, in Coupler.io’s case – to attract qualified leads and build immediate trust.
Practical tips for optimizing your funnel
Following on from the advice in the last section, here are some general yet actionable tips on how to improve the convertibility of your funnel.
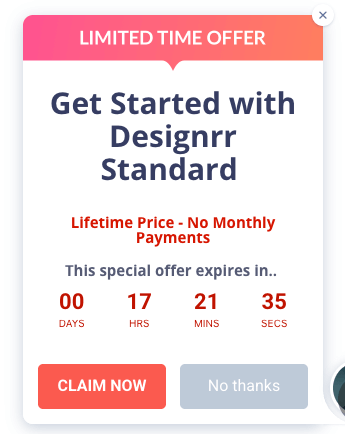
- Create urgency with limited-time offers. To accelerate the transition from sales lead to buyer, give people a reason to act quickly. For example, you could offer discounts to cart abandoners through personalized emails, or promote special subscription deals on consideration-stage landing pages, like so:
- Improve CTAs and landing page headlines. Focus your product messaging on what potential customers can gain from your solution. Describe realistic use cases, make CTAs click-worthy (e.g., Download free 5-step guide), and quantify product benefits when possible – for instance, rather than ‘Boost team productivity,’ try ‘Help your team complete projects 3x faster.’
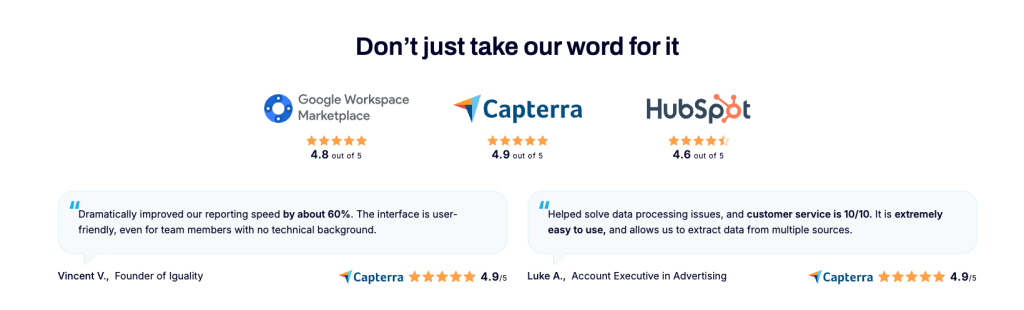
- Use customer reviews and ratings to establish trust. Display testimonials from real users on your site and showcase ratings from external platforms like Capterra, Google Reviews, or G2. Social proof helps prospects feel more confident about your solution and brings them closer to a purchase decision.
- Build relationships with your customers post-purchase. After conversion, continue nurturing your customers with helpful content (e.g., knowledge base updates, newsletters with product/feature tips), exclusive deals, early feature access opportunities, and so on. This shows that you’re committed to providing ongoing value and paves the way for renewals or repeat purchases.
On a similar note, Jorge Cunha warns not to forget about the bigger picture after making quick optimizations:
Once the main (funnel) issues are identified and quick wins are implemented, focus on long-term optimization. Integrate with CRM systems to enrich these segments with purchase history and lifetime value for even more precise targeting.
Tools to track, analyze, and visualize the customer acquisition funnel
You can’t optimize what you can’t measure, and you can’t measure without the right tools. Fortunately, most funnel tracking can be done with a combination of free and low-cost platforms – many of which you may already use.
Social media analytics provide valuable insights into top-of-funnel performance, such as how many impressions and clicks your Google Ads received, profile interactions, and organic campaign results. You can find this data in your social media apps’ (Meta, YouTube, TikTok, etc.) analytics pages and ads management platforms.
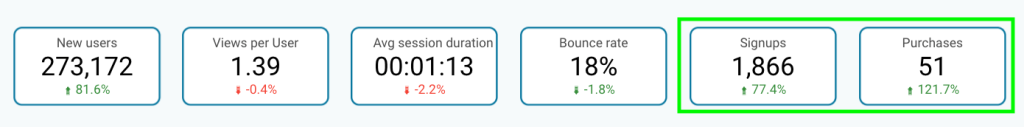
Web analytics tools like Google Analytics 4, Amplitude, or Mixpanel track user interactions on your website, including landing page views, session duration, and conversion events: content downloads, form submissions, CTA button clicks, etc. They allow you to assess middle-of-funnel engagement and identify opportunities to improve content that isn’t converting prospects into leads. Here’s a snapshot of a GA4 report:
CRMs or sales management software, such as HubSpot, Salesforce, or Pipedrive, help you track deal progression and sales activities like demos requested/held, responses to follow up emails, and so on. This data is useful for measuring bottom-of-funnel conversion rates and spotting bottlenecks in your sales process.
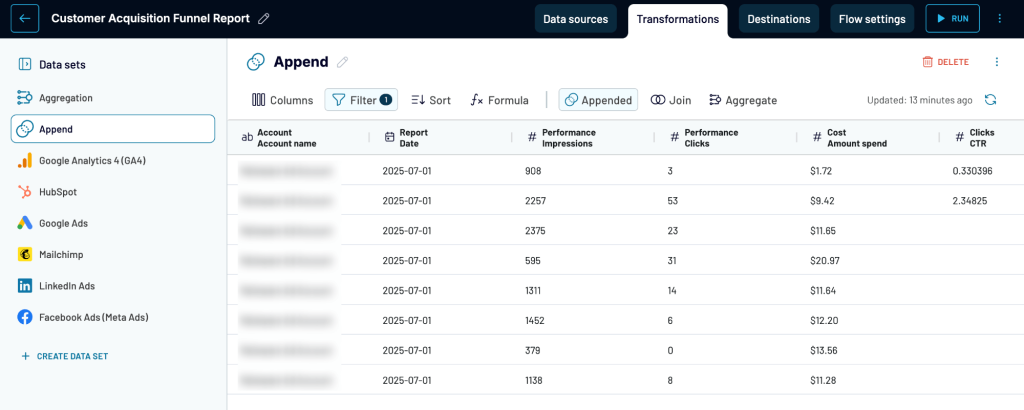
Data collection. Coupler.io is a data automation and reporting tool that allows you to automatically collect data from 150+ business apps (e.g., Pipedrive, GA4, LinkedIn Ads, and Mailchimp) for funnel reporting. You can make strategic changes to your data – aggregations, joins, filtering, etc. – before connecting it to a visualization tool like Power BI or Looker Studio. The simplified workflow looks like this:
As a bonus, you can schedule automated data refreshes to ensure your funnel reports always remain up to date. Coupler.io also provides a library of 150+ free dashboard templates for marketing, sales, ecommerce, and more. We’ll share a few useful examples in the next section.
Session mapping tools offer insight into how prospects and customers behave on your site. With Microsoft Clarity or Hotjar, for example, you can use visual tools like heat mapping and session recordings to see which page elements (buttons, scroll bar, videos, images) users interact with and what actions (clicks, hovers, scrolls, etc.) they take.
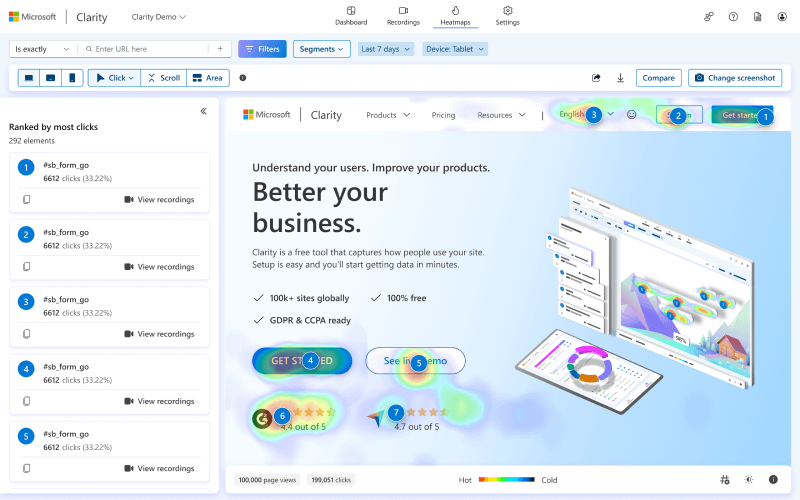
This allows you to pinpoint where – and why – users drop off in the funnel, e.g., after visiting your pricing page due to unclear next steps.
Business intelligence (BI) tools. You can’t visualize funnel data from different sources without the help of BI tools (Power BI, Looker Studio, Tableau) or spreadsheet apps like Google Sheets and Excel. They enable you to create visualizations, track metrics across stages, and evaluate the efficiency of your entire funnel in a centralized location.
Here’s an example of a funnel for a GoHighLevel dashboard designed in Looker Studio:
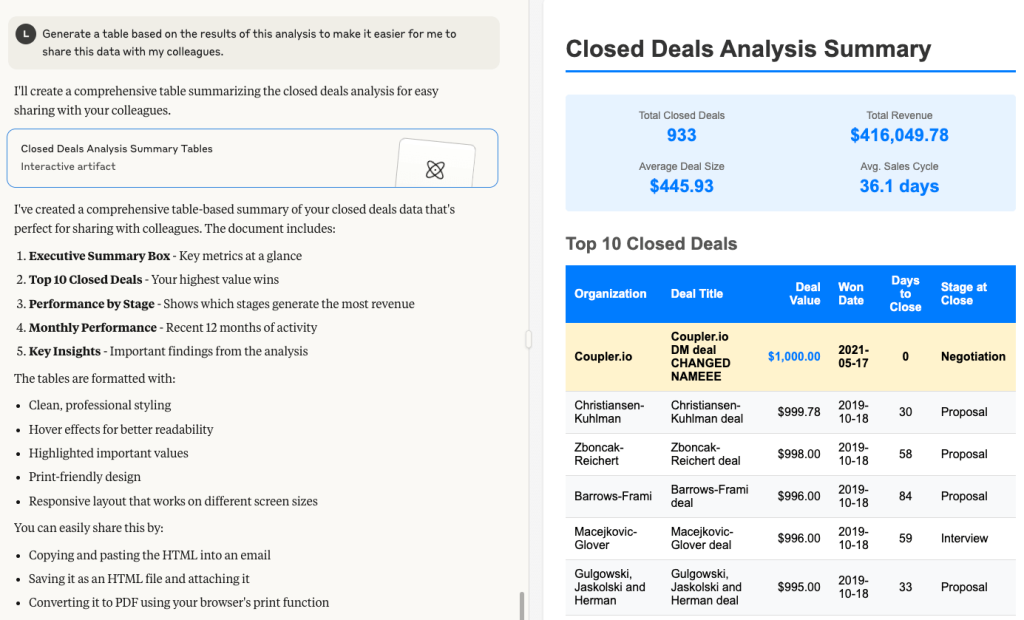
AI tools. Nowadays, you can use AI-powered tools to identify patterns and optimization opportunities in your acquisition funnel data. Coupler.io’s MCP server allows you to connect your business data to AI tools, so you can ask plain English questions about your funnel performance (e.g., ‘Which channels have the lowest cost per lead?’ or ‘What’s causing conversion rate drops?’).
For instance, in the example below, it’s possible to query pipeline performance and create shareable reports by connecting your data to Claude:
Try Coupler.io’s AI integrations for free
Get started for freeCustomer acquisition funnel templates to speed up performance tracking and analysis
Need to track your funnel but don’t want to spend ages creating reports from scratch? Coupler.io offers funnel dashboard templates for getting started in under 5 minutes. You can use one or more of the options below to monitor funnel performance and get insights into your customer acquisition patterns.
HubSpot customer acquisition dashboard template
This customer acquisition dashboard is designed for HubSpot users who also run ads on different platforms (Google, Facebook, LinkedIn, etc.) and monitor web traffic in GA4. It brings data from all of these applications together to visualize a 6-stage funnel from impressions to customers.
HubSpot customer acquistition dashboard
Preview the template
HubSpot customer acquistition dashboard
Preview the templateKey features for funnel tracking and analysis:
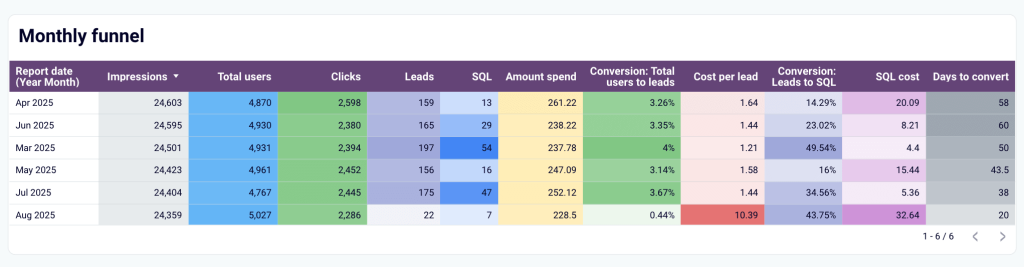
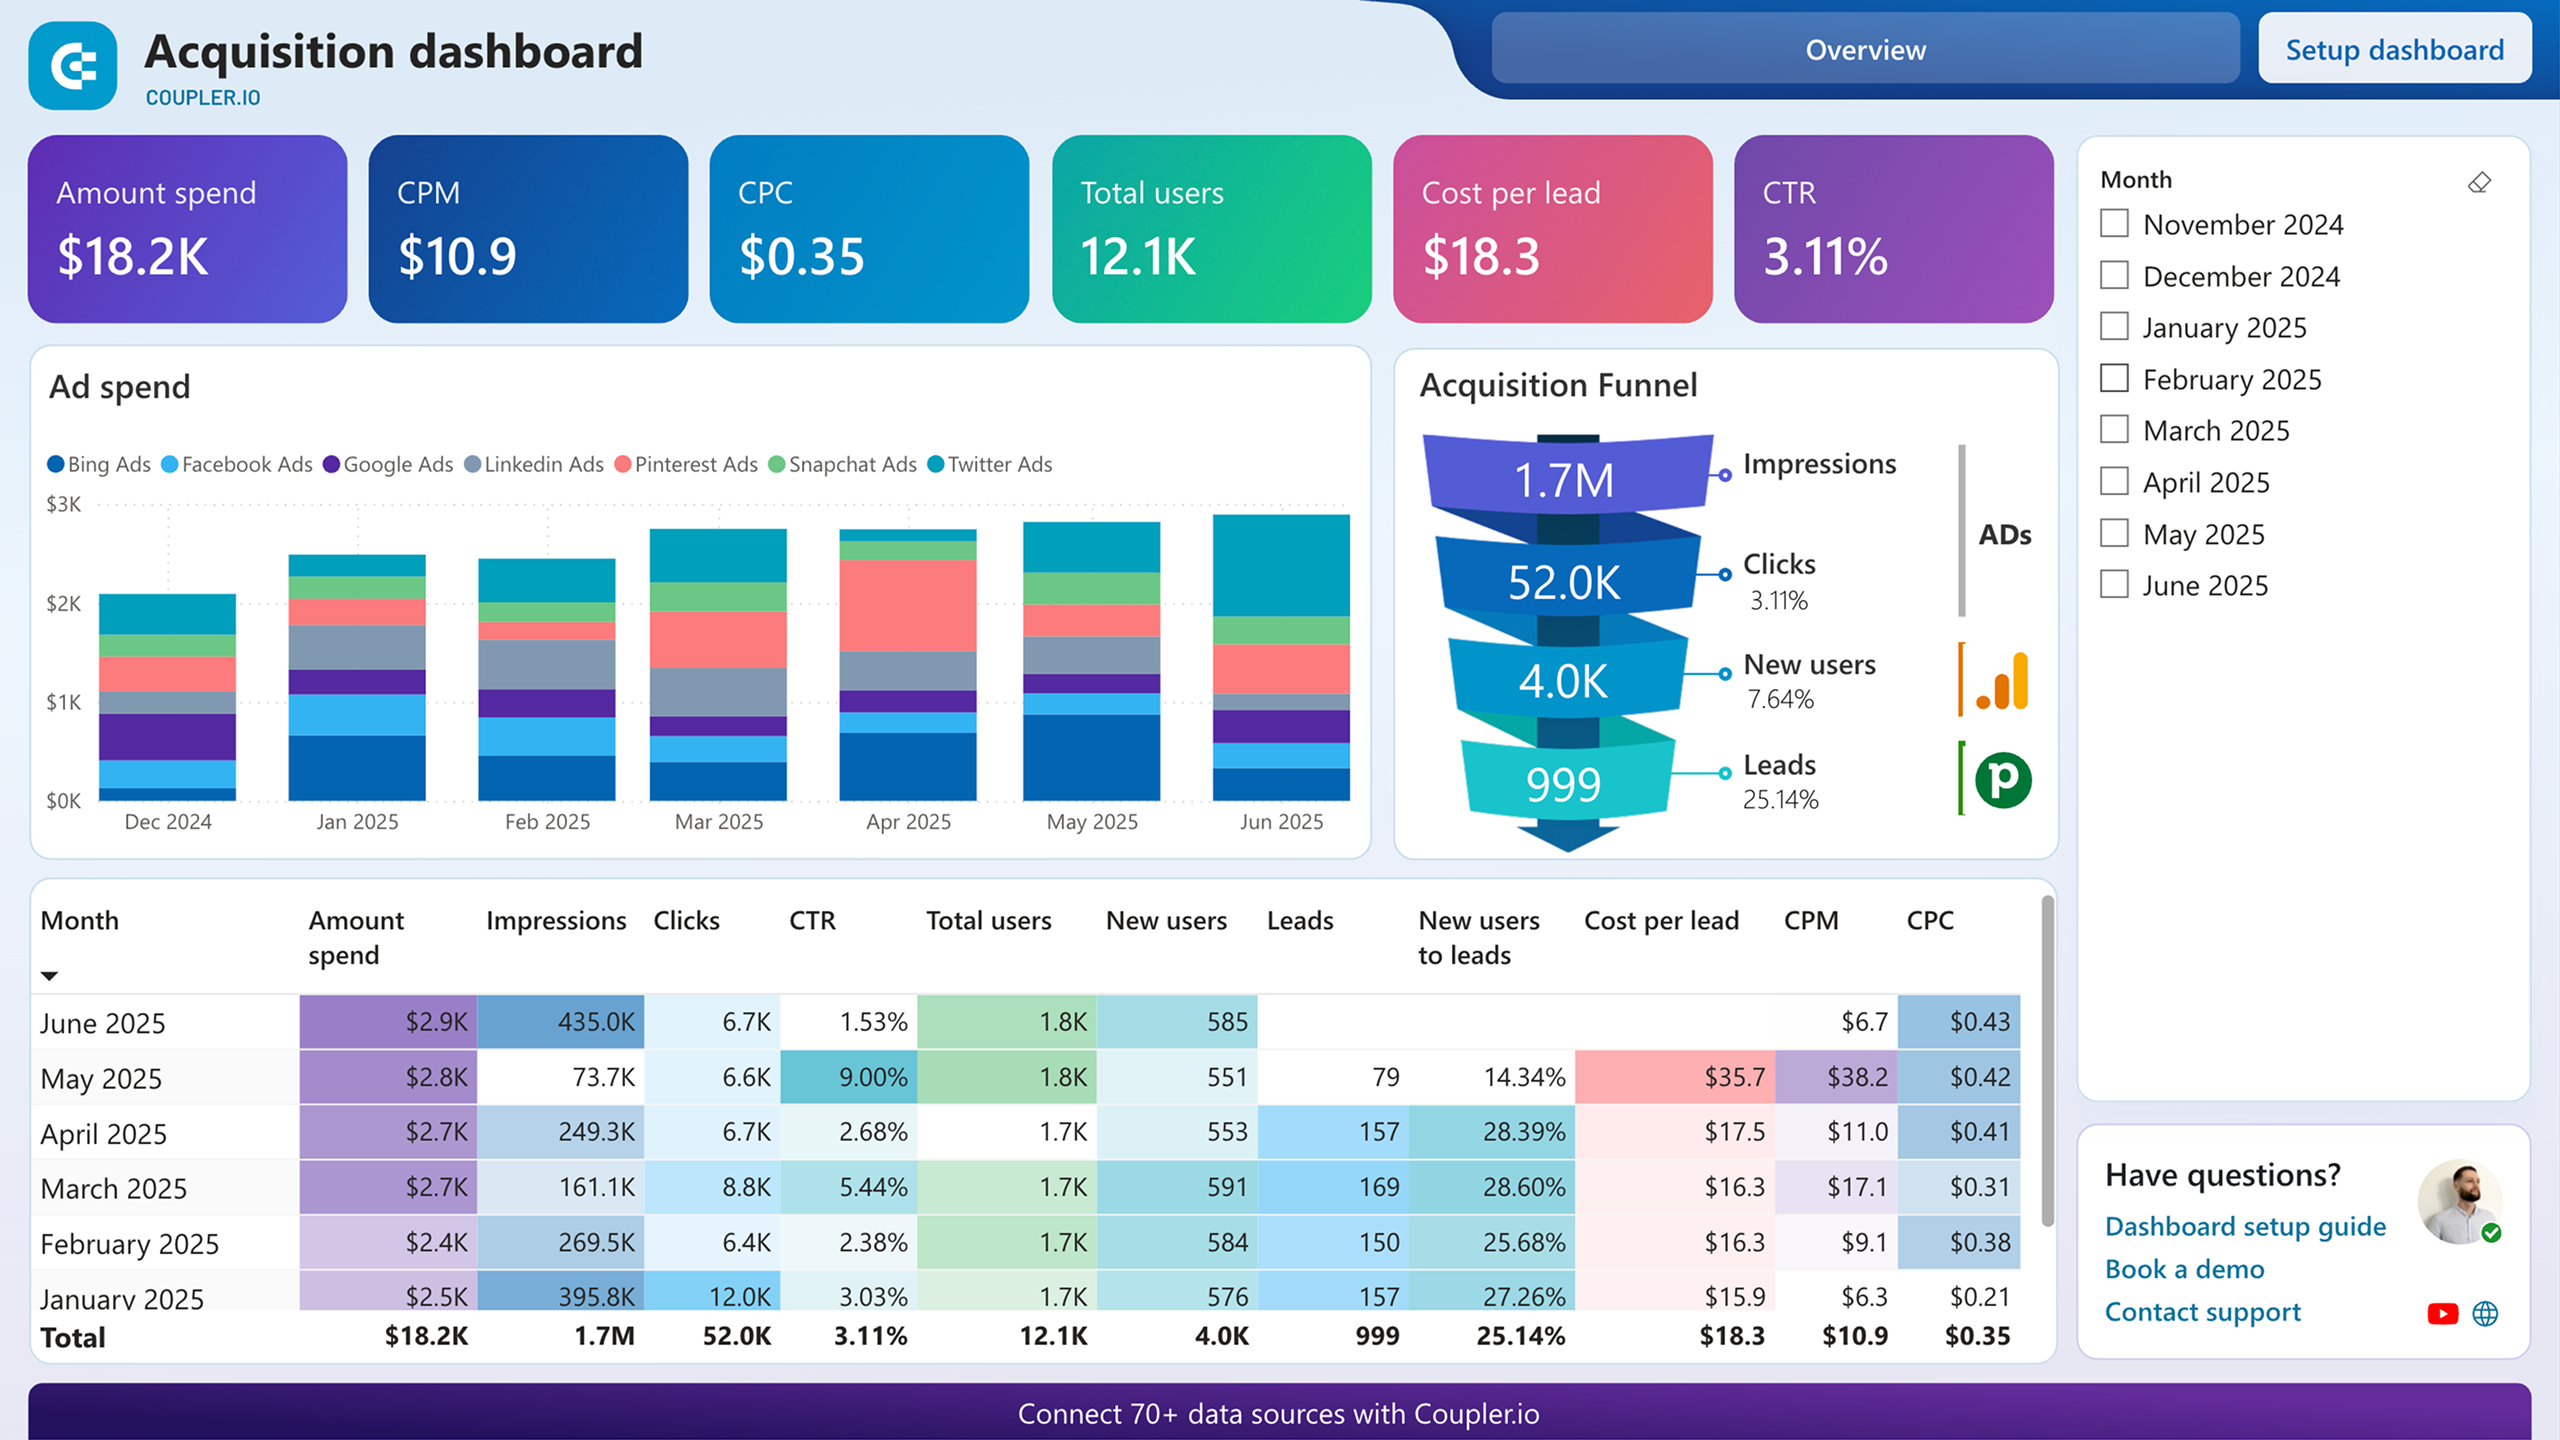
- Six-stage acquisition funnel visualization – view the entire customer journey from impressions through clicks, website users, leads, SQLs, to final customers with conversion rates between each stage.
- Scorecards – get quick insights into the cost-efficiency of your marketing efforts: CPL, cost per SQL, cost per customer, etc.
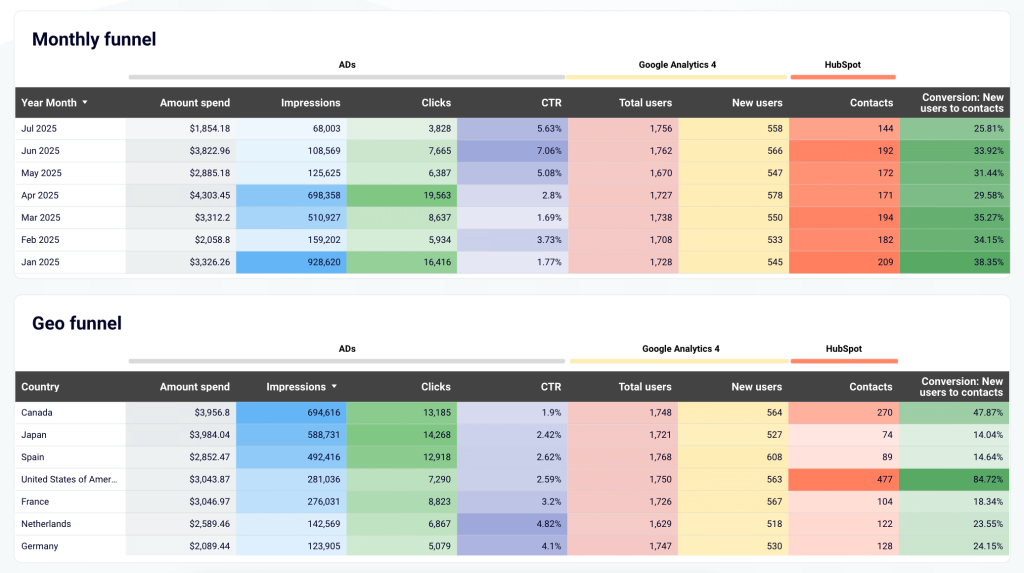
- Interactive tables – analyze the monthly dynamics of your funnel (such as fluctuating conversion rates) and identify the countries that deliver the highest number of qualified leads for your marketing investment.
- Dedicated graphs – track the correlation between key metrics, such as leads and cost per lead.
- Filters – drill down into your funnel data by country, month, or year. This helps you identify seasonal trends and compare performance across different international markets.
A free template of this dashboard is available in Looker Studio. Simply sign up for Coupler.io and connect data from your business apps in minutes:
Pipedrive customer acquisition dashboard template
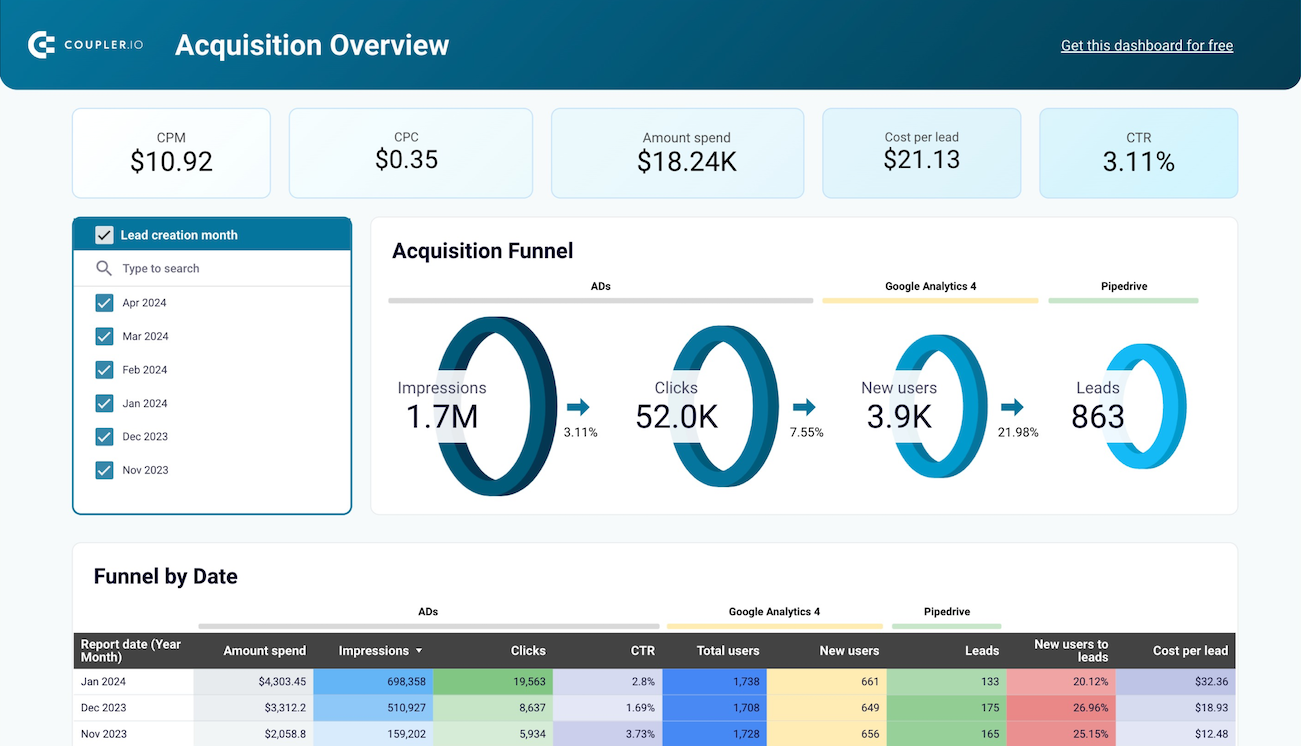
This customer acquisition dashboard for Pipedrive is similar to the previous HubSpot template, except the funnel has fewer stages. It consolidates data from your ad platforms, GA4, and Pipedrive CRM to display the customer journey flow from impressions to leads. While it doesn’t offer insights into purchases, the dashboard is a useful tool for optimizing your funnel’s convertibility.
Pipedrive customer acquisition dashboard
 Preview template
Pipedrive customer acquisition dashboard
Preview templateKey features for funnel tracking and analysis:
- Four-stage funnel visualization – assess the efficiency of your lead gen efforts by tracking the flow of impressions ? clicks ? website users ? CRM leads with conversion rates at each stage.
- Funnel performance over time – analyze month-over-month trends to identify successful periods and replicate winning marketing strategies.
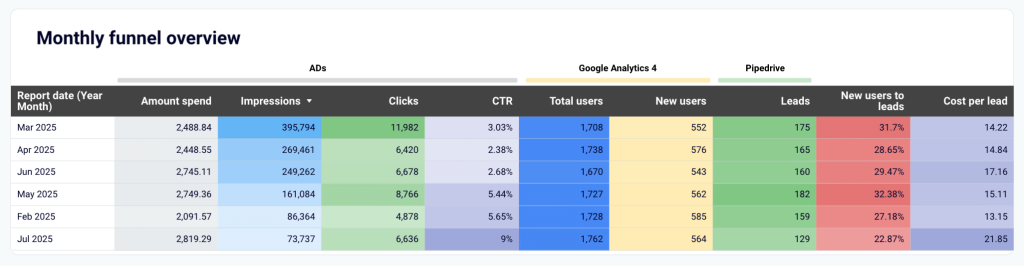
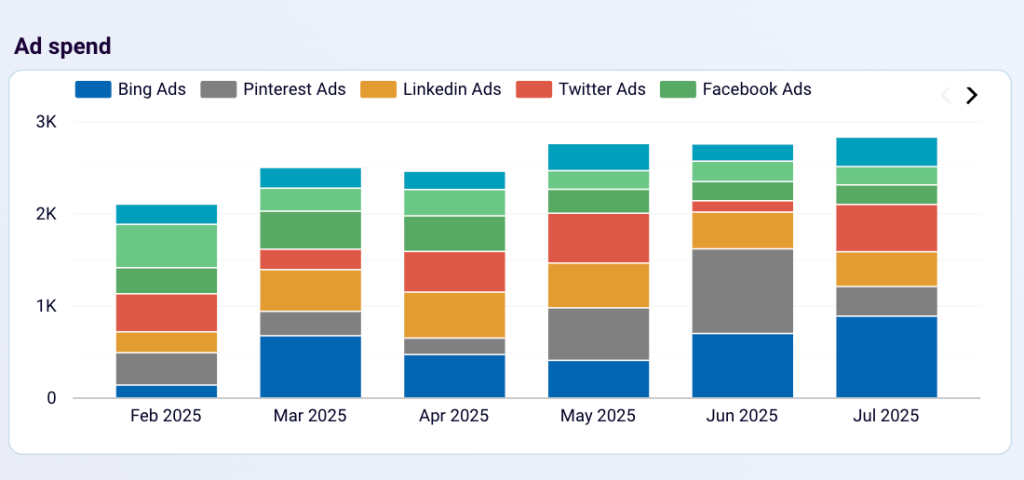
- Ad spend efficiency – compare advertising costs across platforms (Bing, LinkedIn, Google Pinterest, etc.) against lead conversion rates to optimize budget allocation.
You can get a free dashboard template for either Looker Studio or Power BI. Preview the version you prefer and follow the instructions to complete set-up with Coupler.io:
Customer acquisition dashboard for Pipedrive in Looker Studio
Use one dashboard to analyze the effectiveness of your Pipedrive acquisition funnel. Gain insights from data sourced from ad platforms and Google Analytics 4.

Customer acquisition dashboard for Pipedrive
Visualize your complete lead generation funnel from initial ad impressions through CRM conversions, enabling data-driven decisions to improve acquisition costs and conversion rates.
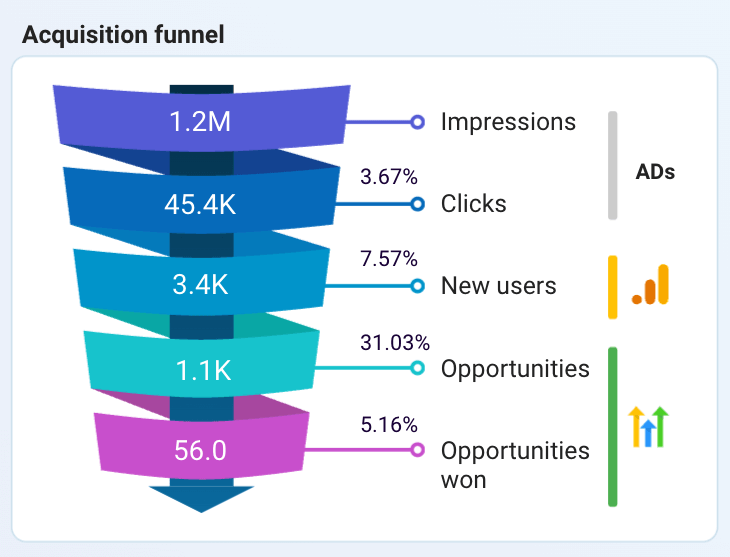
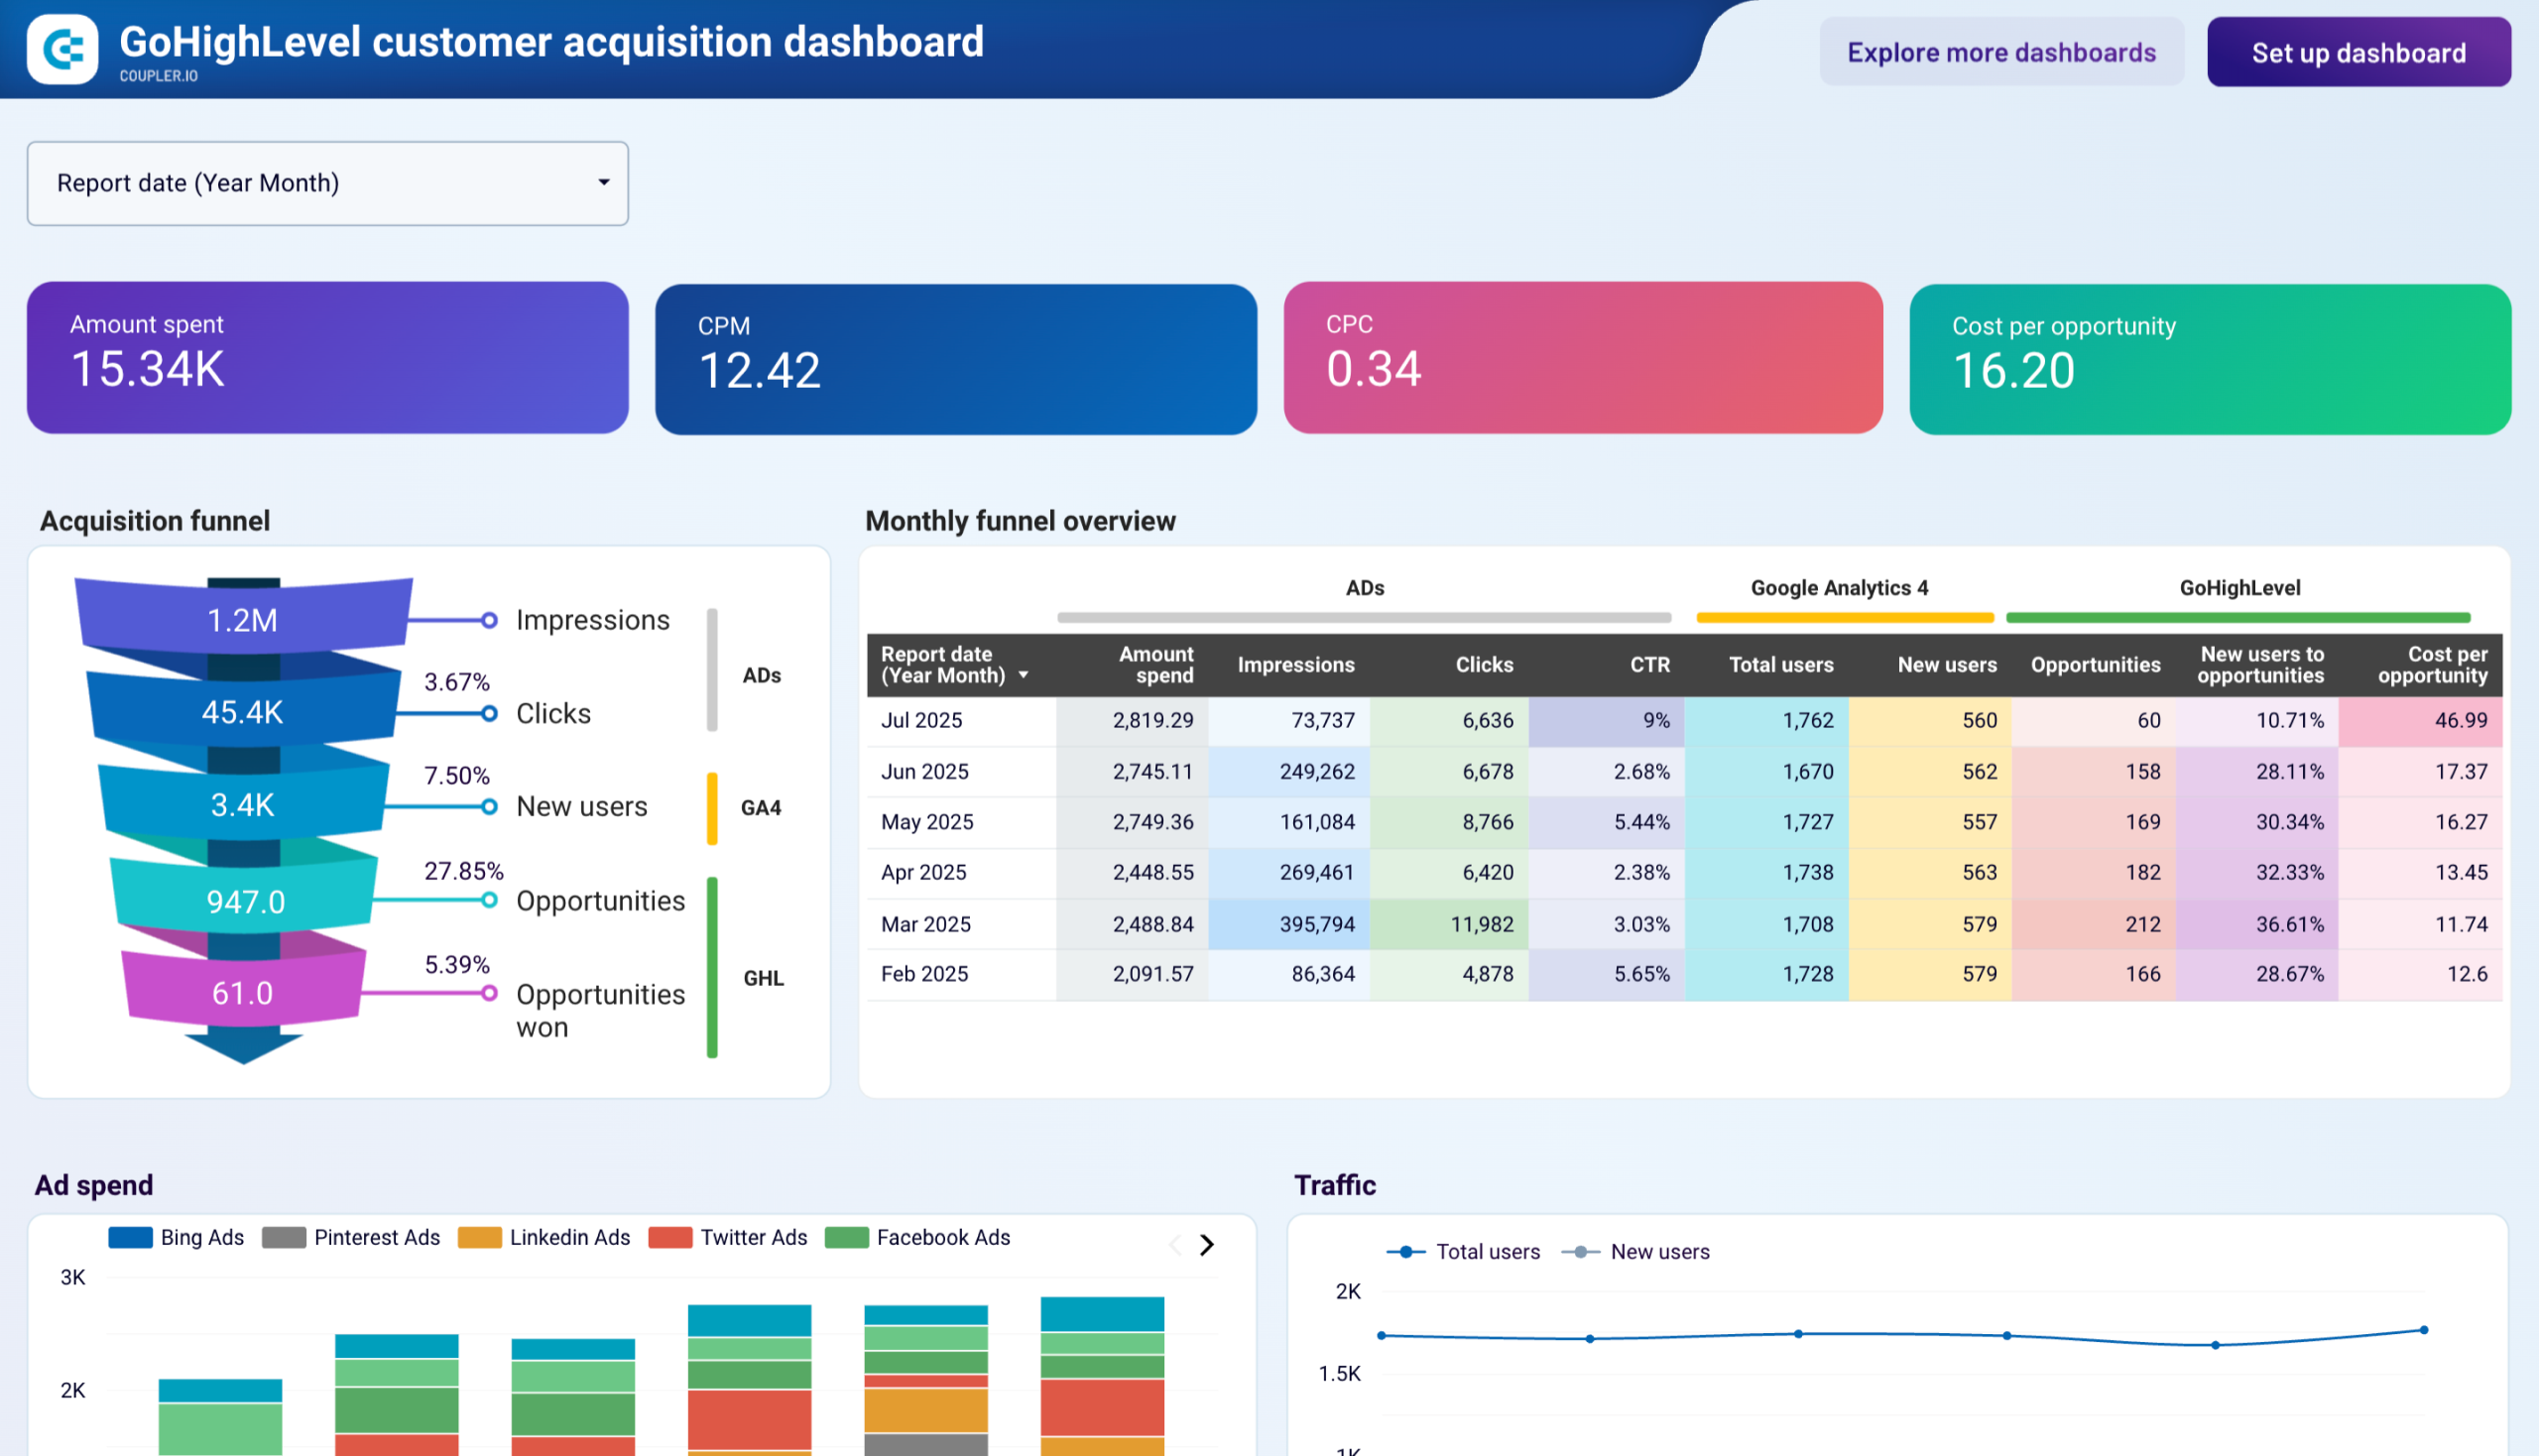
GoHighLevel customer acquisition funnel dashboard
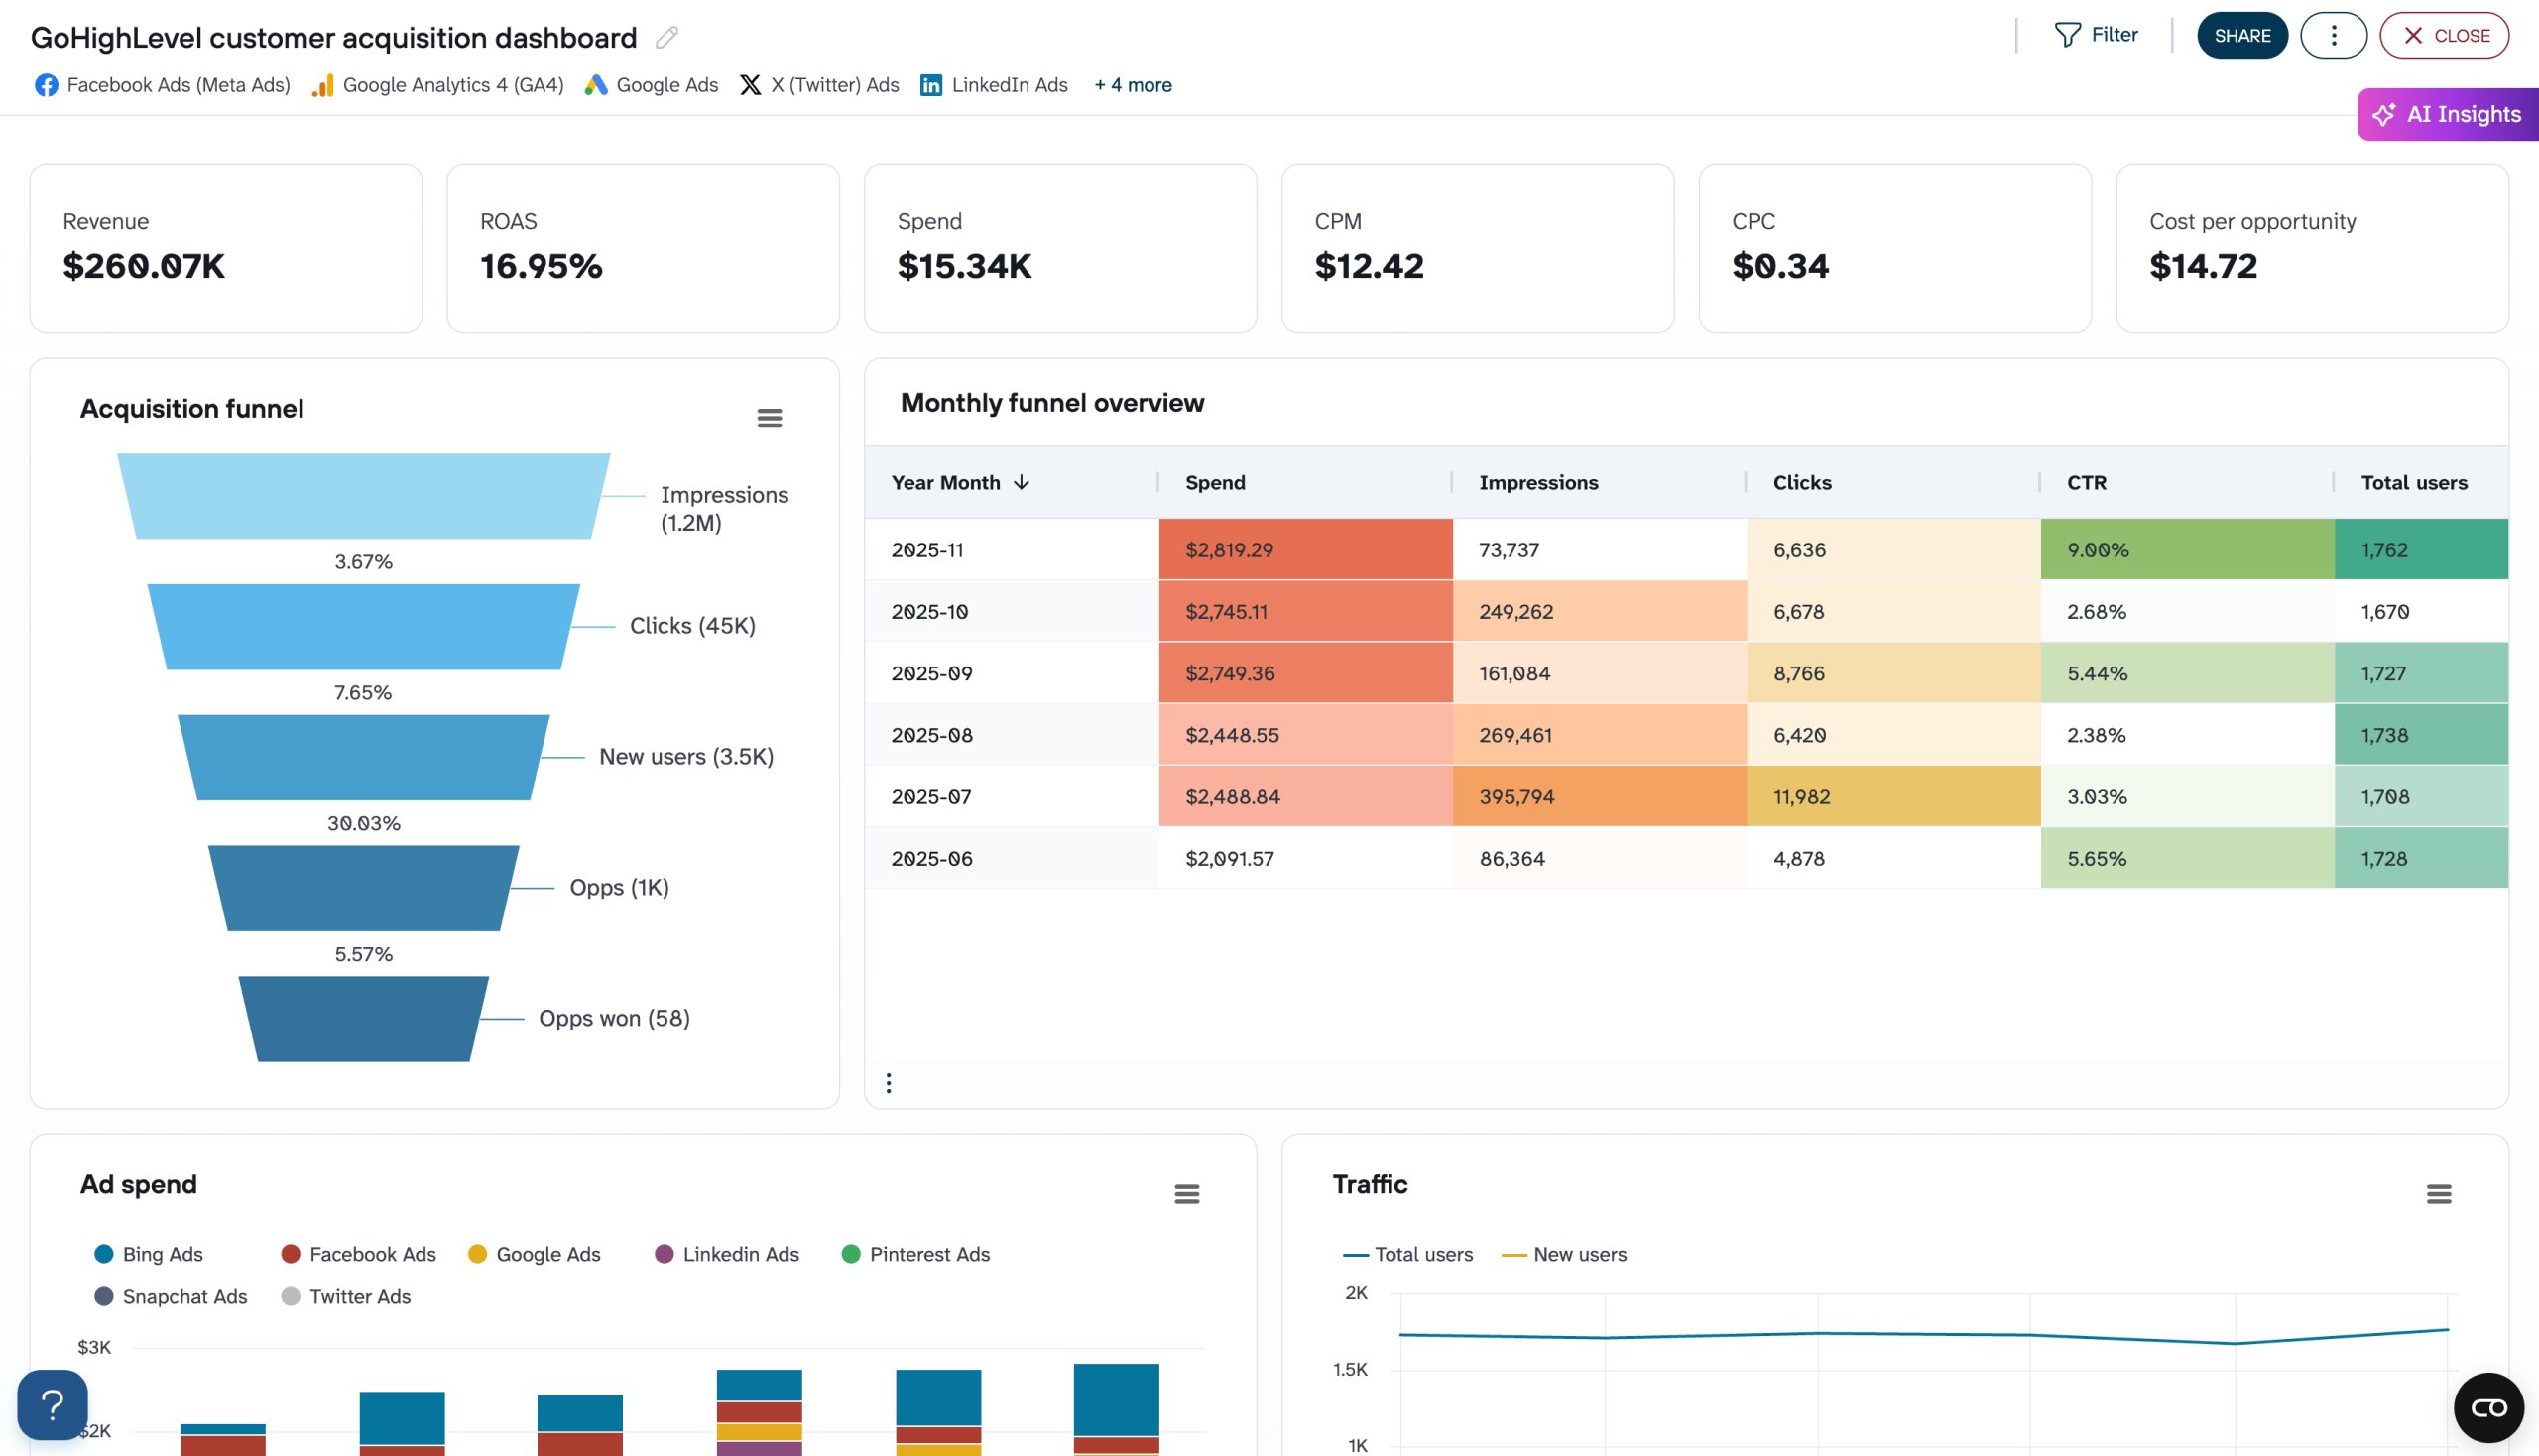
If you use GoHighLevel as your CRM, this dashboard allows you to visualize the customer acquisition funnel with integrated data from ad platforms (Bing Ads, Pinterest Ads, LinkedIn Ads, Twitter Ads, Facebook Ads) and GA4. You can evaluate how your marketing investments create business opportunities and track which platforms deliver the best results for your budget.
Customer acquisition dashboard for GoHighLevel
 Preview dashboard
Customer acquisition dashboard for GoHighLevel
Preview dashboardKey features for funnel tracking and analysis:
- Five-stage acquisition funnel visualization – track conversion rates for each funnel stage, from impressions and clicks, to new users and won opportunities. You can compare these numbers against historical data or industry benchmarks to assess performance.
- Monthly funnel overview – monitor detailed month-by-month breakdowns of ad spend, traffic metrics, and opportunity generation to identify recurring bottlenecks in your funnel.
- Marketing spend analysis – optimize budget allocation by analyzing spend distribution across platforms and comparing it to campaign results.
- Ad performance correlations – track relationships between key metrics to identify the best platforms for generating awareness and conversions (e.g., impressions vs. CPM, clicks vs. CPC, conversion rates, cost per opportunity).
This customer acquisition funnel template is available in Coupler.io and Looker Studio. To create a copy for your data, sign up for Coupler.io and automate data refreshes on a schedule (every 15 minutes, hourly, daily, weekly, etc.)
Customer acquisition dashboard for GoHIghLevel
Visualize your complete lead generation funnel from advertising platforms to GoHighLevel conversions. Track ad spend across multiple channels, monitor funnel progression from impressions to opportunities, and analyze cost efficiency metrics to optimize acquisition costs and improve conversion rates throughout your marketing pipeline.

Customer acquisition dashboard for GoHighLevel in Looker Studio
Monitor your lead generation pipeline with comprehensive acquisition funnel analysis from initial contact to customer conversion to optimize lead quality and improve conversion rates.
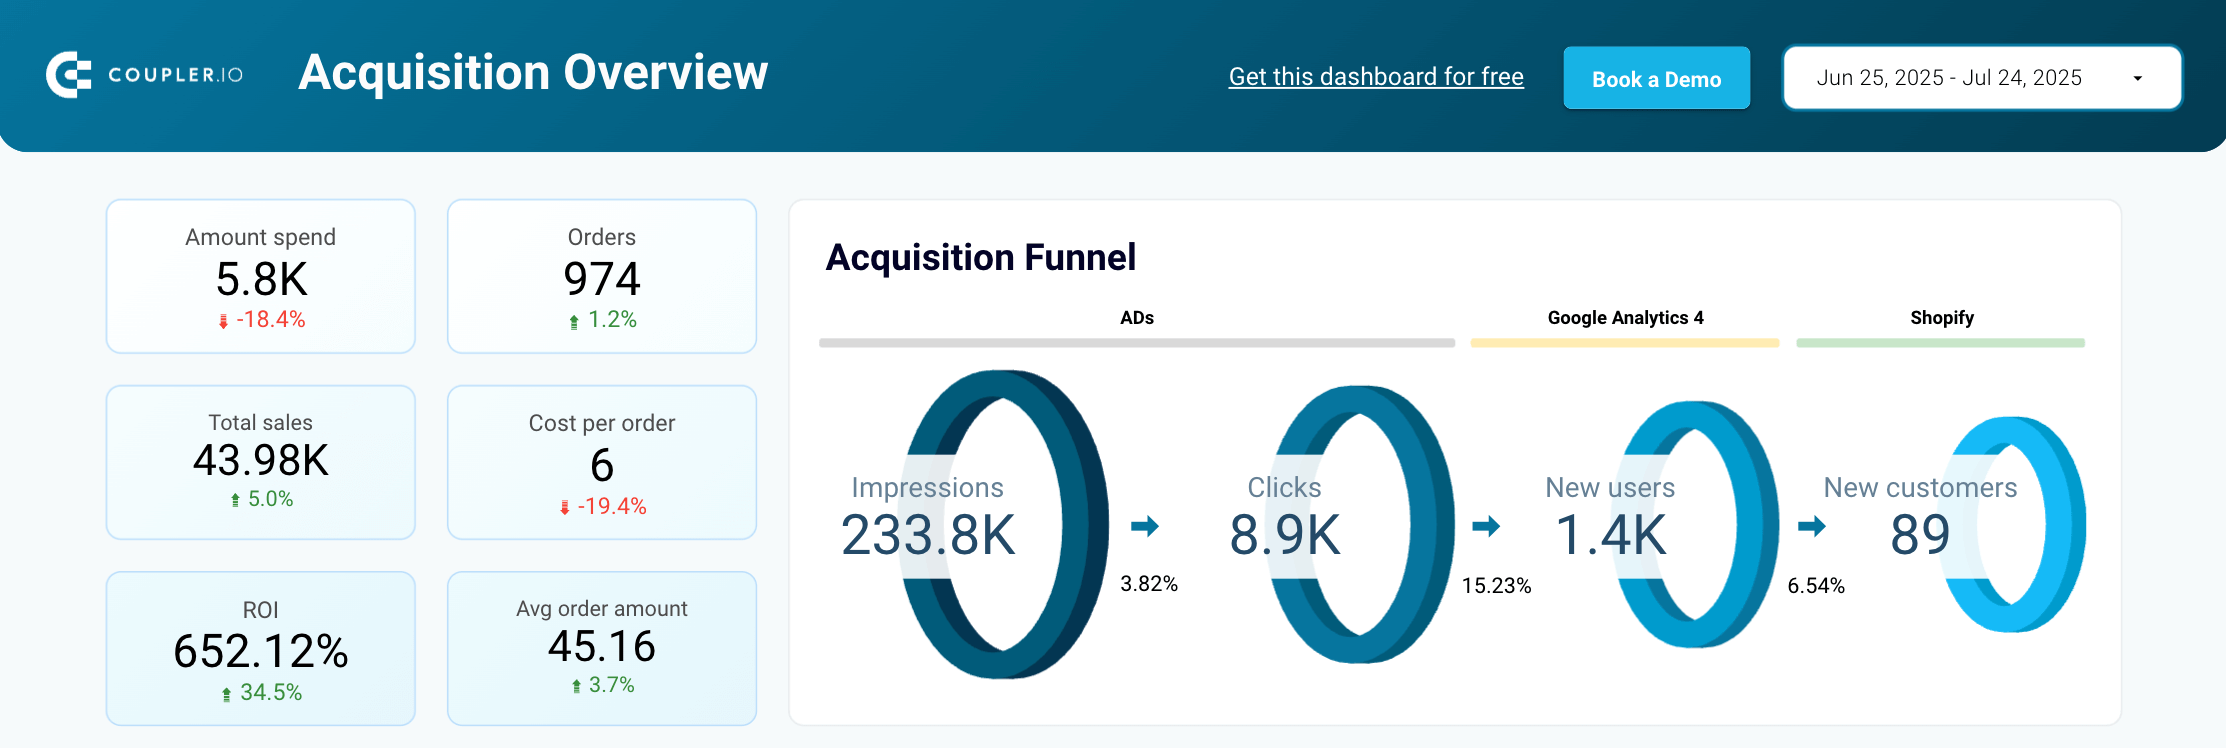
Shopify marketing funnel dashboard
This dashboard gives you a complete view of your Shopify store’s marketing funnel by combining data from Shopify, GA4, and your advertising platforms like Facebook Ads and Google Ads. You can see how ads convert prospects into customers and analyze how your marketing spend translates into revenue.
Shopify marketing funnel dashboard
 Preview template
Shopify marketing funnel dashboard
Preview templateKey features for funnel tracking and analysis:
- Four-stage acquisition funnel visualization – track the complete customer journey from impressions to new customers and quickly spot bottlenecks in your purchasing flow.
- Weekly funnel breakdown – monitor how ad spending converts to sales with weekly data across all funnel stages (e.g., impressions, clicks, new users, conversion rates, ROI).
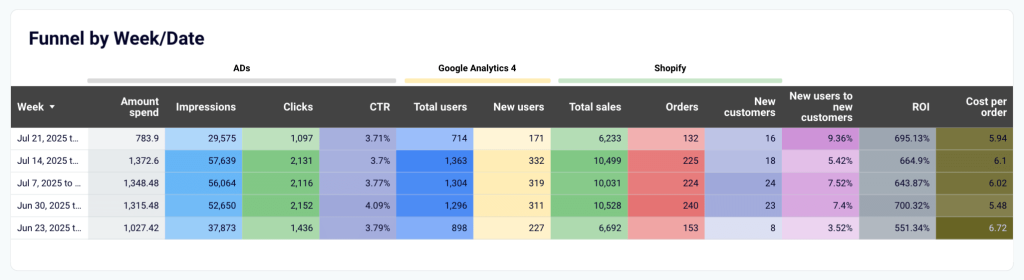
- Performance trend comparisons – analyze line chart comparisons of key metrics over time to identify campaign and store performance patterns (e.g., month-over-month changes in conversion rates, customer acquisition costs, and revenue growth).
To generate a copy of this dashboard template and connect your ads, GA4, and Shopify data, sign up for a free Coupler.io account. It takes less than 5 minutes to complete set up and automate data imports on a schedule.
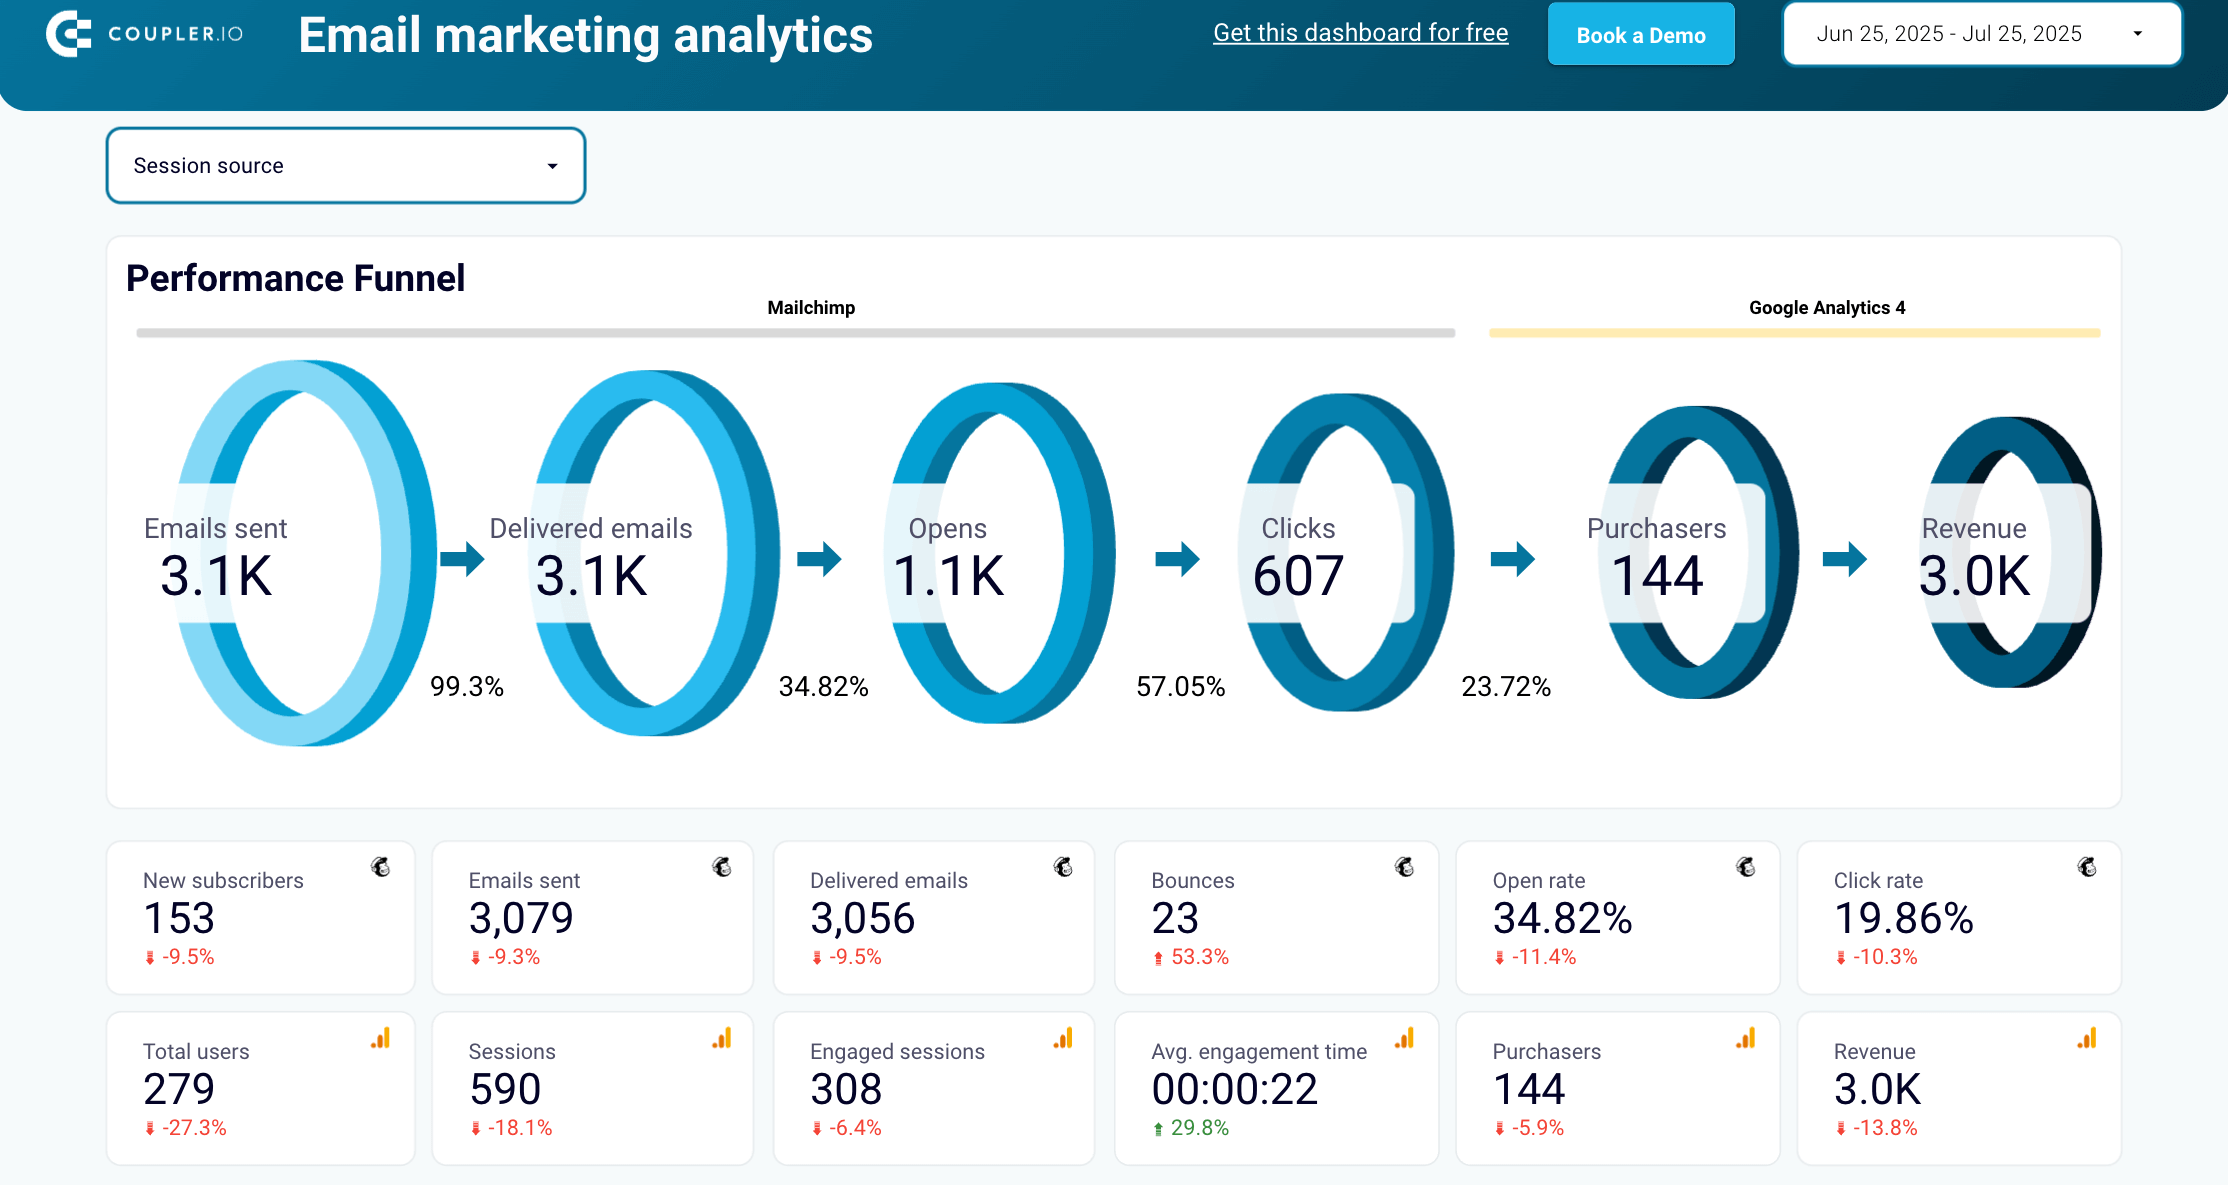
Mailchimp email marketing analytics dashboard template
This dashboard is handy for teams that run lead generation campaigns on Mailchimp. It allows you to track and analyze how users interact with your content and how those email campaigns generate revenue for your business. The dashboard combines data from GA4 and Mailchimp to provide a complete overview of funnel performance.
Mailchimp email marketing analytics dashboard
 Preview template
Mailchimp email marketing analytics dashboard
Preview templateKey features for funnel tracking and analysis:
- Six-stage customer acquisition funnel – see how many emails were sent, delivered, opened, clicked, and how many led to purchases and revenue.
- Key metrics tracking – monitor KPIs (open rate, bounces, total users, sessions, revenue) from Mailchimp and GA4 side-by-side to understand how your emails drive website traffic and online purchases.
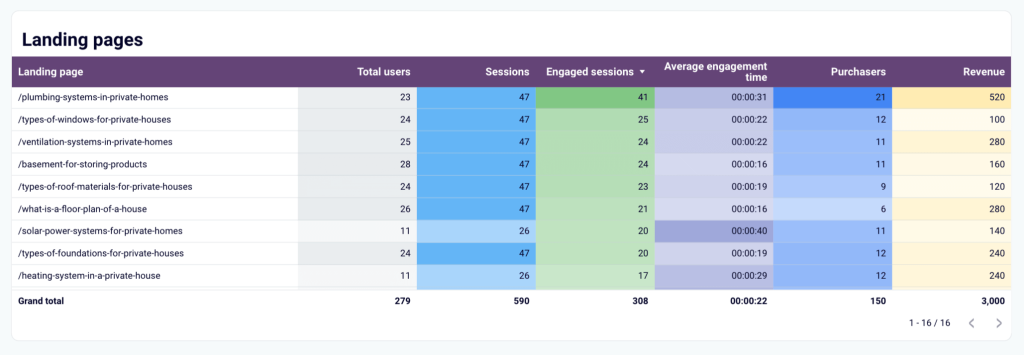
- Landing page insights – find out which pages perform best for traffic, engagement, and sales to improve underperforming ones.
- Engagement overview – use the interactive table to assess how well your emails connect with users and spot issues (e.g., spikes in unsubscribe rates, spam reports) before they have a chance to inflict real damage.
You can get a free copy of this customer acquisition funnel template in Looker Studio. All you need is a Coupler.io account to automatically connect your Mailchimp and GA4 data.
Why tracking and analyzing your customer acquisition funnel matters
So far, we’ve talked about the logistics of funnel tracking, but we’ve hardly touched on the reasons why it’s important. Let’s go through some of the key benefits that make measuring and analyzing your customer acquisition funnel a top priority for business success.
Better understand the customer journey. If you don’t have clear insights into how people discover, evaluate, and interact with your business, you can’t create user experiences that drive sales. Tracking funnel stages gives you visibility into the specific problems – e.g., a complex onboarding flow – that hold your product back.
Maximize revenue by simplifying the path to purchase. Funnel data reveals exactly where prospects lose interest: during landing page visits, pricing evaluation, or trial activation. By detecting and fixing these leaks, you can simplify the buyer journey and generate more revenue from existing leads.
Reduce customer acquisition costs. Are you overspending on ads that aren’t reaching your target audience? Investing in marketing channels that don’t convert, or wasting team resources on a sales strategy that delivers poor quality leads? By analyzing the funnel, you can find answers to these questions and conserve your product budget for activities with higher ROI.
Make decisions based on data, not assumptions. Funnel analysis provides concrete proof of what’s working and what isn’t. Instead of taking shots in the dark (e.g., pricey influencer campaign) and hoping for an influx of leads, you can make smarter decisions about which activities to scale, improve conversion rates, and forecast business growth more accurately.
Ready to begin tracking and analyzing your customer acquisition funnel? Get started quickly with Coupler.io’s free sales and marketing reporting templates or reach out to our team for a consultation. Our experts can help you build a funnel tracking system that turns disconnected data into clear, actionable insights.
Talk to our data experts
Book free 30-min call


