Let’s start with the definition: What is SUMMARIZE in Power BI?
The SUMMARIZE DAX function performs a GROUP BY operation. It allows you to specify one or more columns for grouping, then it applies the aggregate function before populating a new table with the calculated results. The function can use any given criteria to summarize datasets with a large number of rows into one table.
What is the function’s syntax and parameters?
Here’s the syntax for Power BI SUMMARIZE:
SUMMARIZE (<table>, <groupBy_columnName>[, <groupBy_columnName>]...[, <name>, <expression>]...)
The parameters in this formula are:
table– Any DAX expression that returns a table of data.groupBy_columnName– The name of any existing column that is used to create summary groups based on the values in each row.name– The name assigned to an aggregated column (in double quotes).expression– Any DAX expression to be evaluated for the column you named.
Return Value
The SUMMARIZE formula returns a table containing the specified columns for the groupBy_columnName arguments and the summarized columns with the aggregated values.
Parameter Rules
- When you define a
namefor each column, remember to add a correspondingexpression. The first argument is thename, while the second argument is theexpressionto be evaluated for each row in that column.
- Each
nameshould be enclosed in double quotation marks.
groupBy_columnNamemust be in thetableor a related table totable.
- The function groups any selected rows of a
tablebased on the value of one or more columns specified in thegroupBy_columnNameparameter.
- When operating in DirectQuery mode, you won’t be able to use the function in calculated columns or row-level security (RLS) rules.
An example use case
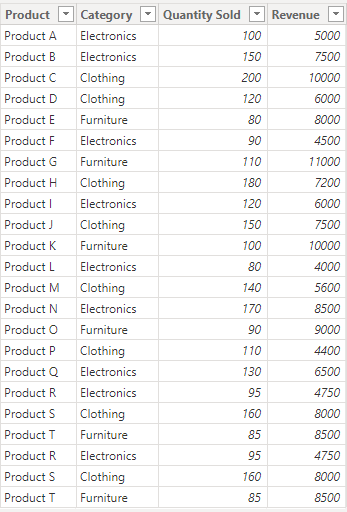
Here’s a sales table with columns for product, category, quantity sold, and revenue. You can aggregate your data to pay closer attention to each data point and extract detailed metrics.
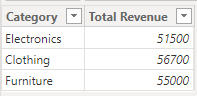
To summarize the total revenue by category, apply:
SUMMARY TABLE = SUMMARIZE(Sales_data, Sales_data[Category], "Total Revenue", SUM(Sales_data[Revenue])))
The resulting table:
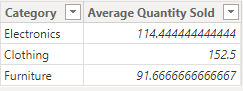
To calculate the average quantity sold for each category, use this function:
Summary_Table2 = SUMMARIZE(Sales_data, Sales_data[Category], "Average Quantity Sold", AVERAGE(Sales_data[Quantity Sold]))
The resulting table:
In the above examples, you see the name of our result tables before the actual SUMMARIZE function itself. This should help you remember that Power BI requires users to specify the name of the summary table before they start writing the DAX function.
What does the SUMMARIZE function do in Power BI?
It helps you reorganize datasets for more effective analysis. Here are things you can achieve by using this function.
- Summary tables: You can group data from one or more columns and add them to a summary table. It allows you to aggregate and organize your dataset.
- Aggregating data by dimension: This makes it easier for you to aggregate data across different dimensions. e.g. to analyze sales amount by product category or by each region.
- Data modeling: You can use this function to define relationships between tables. It allows you to have a robust data model and a solid foundation for visualization.
- Cross-table analysis: The SUMMARIZE function in Power BI can combine data from tables with related columns. You can integrate or blend data from separate sources.
- Custom metrics: This function allows you to perform calculations or pull complex metrics from your data, e.g. Total churn rate, average order value, discount, total sales, etc.
How to group and summarize data with this function?
Step 1. Get your data into Power BI
First, you need to extract data from your sources. You can import a data table manually, upload a CSV or XLSX file, or pull data from the supported services in Microsoft Power BI.
If you work with large datasets, it’s more convenient to use Coupler.io. It is a no-code connector to pull data from over 60 sources like QuickBooks, Salesforce, Facebook Ads, etc. It’s data refresh functionality also ensures that your datasets and charts are always updated.
To add data to Power BI, select your data source, and click the Proceed button below:
- If you’re new to the tool, create a Coupler.io account for free. After that, connect your source account and specify what data to extract.
- Preview your dataset and edit it, if needed. You can rearrange columns, filter and sort data, and use formulas to add new calculated columns.
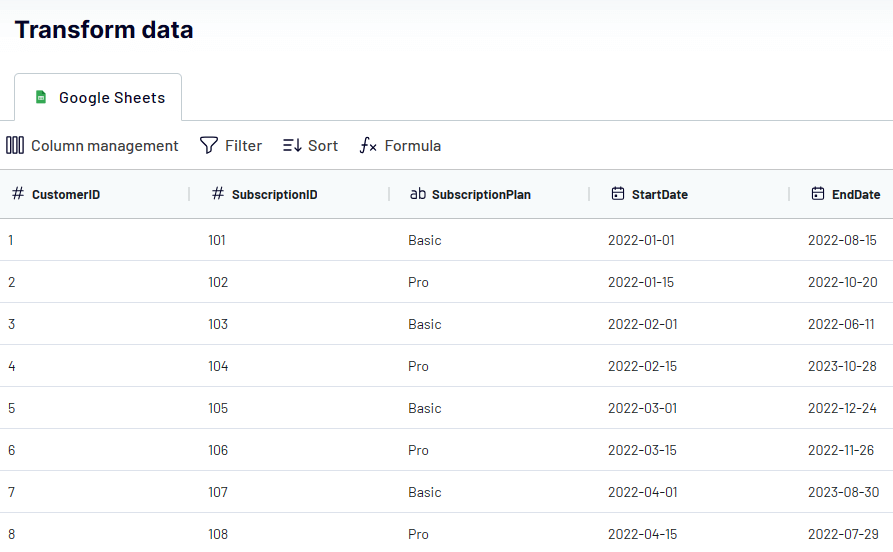
- Copy the integration URL and click Finish and Proceed. Navigate to Power BI Desktop, choose Get data from Web and paste your link. Once your data has been added, you can preview it in the Power Query editor or directly in the report.
Step 2. Apply the SUMMARIZE function
Let’s see how you can apply the function when working in Power BI Desktop:
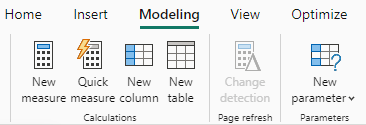
- Select New table from the menu bar.
In Report View, go to the Modeling tab and choose New Table.
Or switch to Table View, and choose New Table from the Home tab.

- Enter the name for your summary table and write the Power BI SUMMARIZE function.
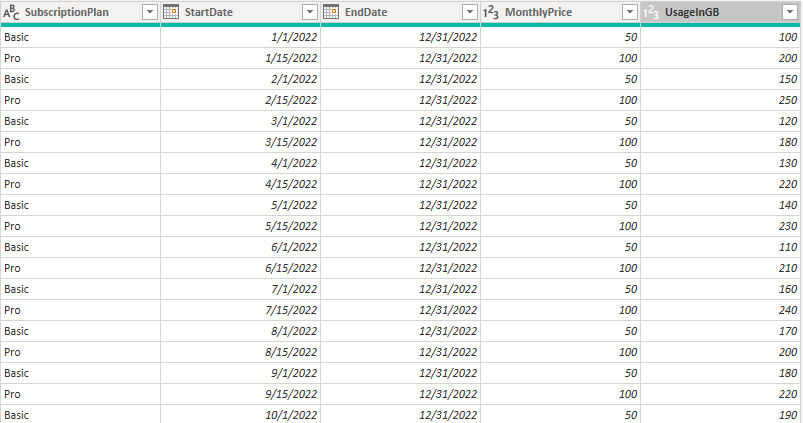
Below, there are some example functions for our SaaS Sales dataset.
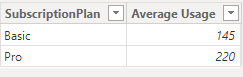
To calculate average usage per subscription plan:
Summary Table = SUMMARIZE(SAAS_Sales, SAAS_Sales[SubscriptionPlan], "Average Usage", AVERAGE(SAAS_Sales[UsageInGB]))
The output table:
To calculate customer lifetime value:
Metrics = SUMMARIZE(SAAS_Sales, SAAS_Sales[CustomerID], "CLV", SUMX(SAAS_Sales, SAAS_Sales[MonthlyPrice]))
The resulting table:

Best practices for using SUMMARIZE in Power BI
These tips can help you make the most out of the function:
- Make sure to use the correct syntax and check if you’re grouping the right columns. You should also double-check your calculations because a wrong expression can also result in erroneous values in your aggregated columns.
- Combine the SUMMARIZE function in Power BI with other DAX functions such as FILTER, CALCULATE, ROLLUP, ISSUBTOTAL, ADDCOLUMNS, SELECTCOLUMNS, ALLSELECTED, CALCULATETABLE, ALL EXCEPT in Power BI, etc.
- In your DAX expression, you can use various types of aggregation functions to calculate the preferred summarization. Some of these functions include COUNT, SUM, AVERAGE, MEDIAN, COUNTROWS, PRODUCT, MAX, MIN, and more.
Recap: Aggregating your data for visualization purposes
The Power BI SUMMARIZE function is important for summarizing values in your columns. It also helps to aggregate data for more efficient analysis and visualization. You can use the function for calculated columns or to add complex metrics, create summary tables and combine columns from related tables.
If you need to analyze large datasets often, then you should consider an automated option for importing data to Power BI. With Coupler.io, you can connect your app sources to Power BI and create self-updating reports and dashboards.
Connect your data source to Power BI with Coupler.io
Get started for free