Reliable forecasting gives businesses the visibility they need to allocate resources, plan investments, and manage risk. When forecasts miss, the consequences ripple through every department, from missed revenue targets to hiring freezes and damaged investor confidence. That’s why building a strong, data-driven process to forecast sales is one of the highest-impact moves a company can make.
Importance of sales forecasting
At its core, sales forecasting allows businesses to predict future revenue with greater confidence. This foresight empowers leaders to make better decisions around hiring, budgeting, inventory planning, and capital investments. Companies with accurate forecasts are 7% more likely to hit quota and 10% more likely to grow revenue year-over-year.
Reliable forecasts enable organizations to shift from reactive firefighting to proactive planning and:
- Align departmental plans and budgets around realistic revenue projections
- Optimize hiring and avoid overstaffing or disruptive last-minute recruitments
- Reduce costly last-minute operational decisions like expedited production or logistics
- Respond swiftly to market changes through agile adjustments supported by rolling forecasts—some firms update 4× faster than peers using static models.
Businesses that invest in better forecasting often see impressive results:
- AI-driven forecasting can reduce forecasting errors by 20–50%, cut lost sales by up to 65%, and lower warehouse costs by 5–10% and admin costs by 25–40%.
- More accurate demand forecasts from promotional levers account for 70% of service-level improvements across companies.
What’s the ROI of forecasting accuracy?
Accurate forecasting in sales drives significant financial return:
- A 15% improvement in forecast accuracy can yield at least 3% incremental pre-tax profit—for a $100?M company, that’s a $3?M boost.
- Firms typically save 5–20% on logistics costs and reduce 5–30% inventory levels, directly impacting working capital and cash flow
It isn’t just a numbers game to forecast sales – it’s a strategic revenue lever.
The cost of poor forecasting
Now we know that accurate sales forecasting has a great impact on ROI. However, what’s the impact when sales forecasting is not accurate?
- Overstocking ties up capital and increases storage costs; understocking leads to lost sales and damaged customer relationships.
- In retail, up to 43% of shoppers encountering stockouts may switch brands or retailers, leading to approximately 4% annual sales loss per retailer. This equates to tens of millions for large chains.
- Budget shortfalls from poor forecasting disrupt hiring and cause reactive decision-making, eroding investor confidence and long-term growth
Investing in forecasting accuracy is one of the most cost-effective strategic moves a business can make, enhancing cash flow, operational efficiency, and profitability across the board.
Accurate sales forecasting: Essential data to collect and tools to use
What data should you include in your sales forecast?
Reliable forecasting depends on more than just a few CRM fields. To build accurate, trustworthy projections, sales organizations need to monitor a complete set of variables that capture both sales process health and market dynamics. Below is a deeper look into the categories of data that matter most:
1. Deal-level data
This is the core of most pipeline forecasts and tells you the value, timing, and probability of each sale.
- Deal size / Annual contract value (ACV): Indicates potential revenue, helping weight forecast contribution.
- Deal stage: Provides a close probability when tied to historical conversion rates.
- Expected close date: Anchors the forecast in time, critical for cash flow planning.
- Rep activity (calls, emails, meetings): Signals deal engagement and momentum.
2. Historical and trend data
This category powers time-series and hybrid models to forecast sales by providing context for patterns and seasonality.
- Monthly/quarterly sales revenue: Offers trendlines and growth rates.
- Win/loss rates: Reveals performance by rep, team, or product.
- Sales cycle length: Helps estimate deal timing more precisely.
- Marketing campaign attribution: Shows which efforts drive conversions, useful for aligning forecasts with marketing strategies.
3. Segmentation and contextual data
These inputs allow forecasts to reflect differences between product lines, buyer personas, or markets.
- Lead source: Highlights high-performing acquisition channels.
- Product/region/segment: Enables more granular forecasting by vertical or geography.
- Customer type (new vs. returning): Helps separate expansion revenue from new business.
- External factors: Incorporate macroeconomic conditions, seasonal effects, or market trends that may impact sales outcomes.
Modern sales forecasting requires data from far beyond your CRM. Consider a B2B SaaS company that needs to factor in website traffic from Google Analytics, lead scoring from marketing automation, product usage data from their app, and payment timing from billing systems.
With Coupler.io AI integrations, you can now interact with all this data using natural language. Instead of manually exporting, cleaning, and combining datasets, you can simply ask: ‘Show me pipeline data filtered by deals over $10K from last quarter’ or ‘What’s the correlation between marketing spend and qualified leads this month?’ The MCP server automatically pulls fresh, pre-aggregated data from all your connected sources. This ensures your forecasting models always work with the most up-to-date information.

Connect your data to AI tools with Coupler.io
Get started for freeWhat are the recommended forecasting tools depending on business size?
Choosing the right forecasting tools ensures that all essential data inputs are collected, centralized, and analyzed effectively. The right tool should match your company’s size, sales structure, and sales reporting needs. Here’s a closer look at tools by company type:
Freelancers / Micro teams
These users typically work with limited datasets and simple sales cycles. Flexibility and affordability are key.
- Google Sheets: Great for manual forecasting and early-stage experimentation
- HubSpot Starter CRM: Offers a clean, user-friendly interface with basic pipeline visibility
Small businesses (<50 employees)
Growing teams often need more automation and visibility across multiple reps or products.
- Pipedrive: Offers customizable deal stages, automation features, and simple forecasting dashboards
- Zoho CRM: Good for businesses seeking affordability with reporting depth
- Monday Sales CRM: Integrates with task/project workflows for better collaboration
- Salesflare: Great CRM software for startups and small teams to automate data entry and simplify sales forecasting
Growing companies (50–200 employees)
As companies scale, they need more robust data modeling and cross-department visibility.
- HubSpot Pro: Adds deeper pipeline analytics and forecasting modules
- InsightSquared: Offers sales analytics and forecasting tailored for RevOps
- Looker Studio: Enables custom visualizations with advanced filtering and sharing features
Mid-market companies (200–1,000 employees)
These firms need scalable platforms that support multiple teams and complex reporting structures.
- Salesforce: Highly customizable CRM and forecasting platform
- Power BI / Tableau: Best for building advanced dashboards and reports
Enterprise (1,000+ employees)
Enterprises require cross-functional forecasting, global visibility, and automation at scale.
- Clari: Enterprise-grade forecasting platform with AI-powered insights
- Anaplan: Supports financial, sales, and operational planning
- SAP IBP: Ideal for integrated business planning across departments
For efficient and accurate forecasting, data must be unified. Many businesses rely on multiple tools, CRMs, marketing platforms, finance software, and spreadsheets, but lack a consistent pipeline into one source of truth. Coupler.io automates data collection from disconnected sources and can sync them into a centralized, real-time data set or even a sales analytics & KPI dashboard. This enables:
- Continuous visibility into live pipeline health, sales targets, and historical performance
- Reduced manual work and fewer errors in data entry
- Seamless collaboration across teams working in different tools
Whether you use Salesforce, HubSpot, Google Analytics, Facebook Ads, or another data base, Coupler.io ensures your forecasts are always based on fresh data. This not only boosts forecasting accuracy but also gives sales managers and executives the insights for informed decisions. Check out what it looks like to automate a data flow in Coupler.io in this interactive form.
Types of sales forecasting: Which one is best for your business
Before building your forecast, it’s essential to understand the most common forecasting models and how they work. Each approach offers distinct advantages depending on the type of business, sales structure, and available data. Below is a comprehensive overview of the most widely used forecasting methodologies.
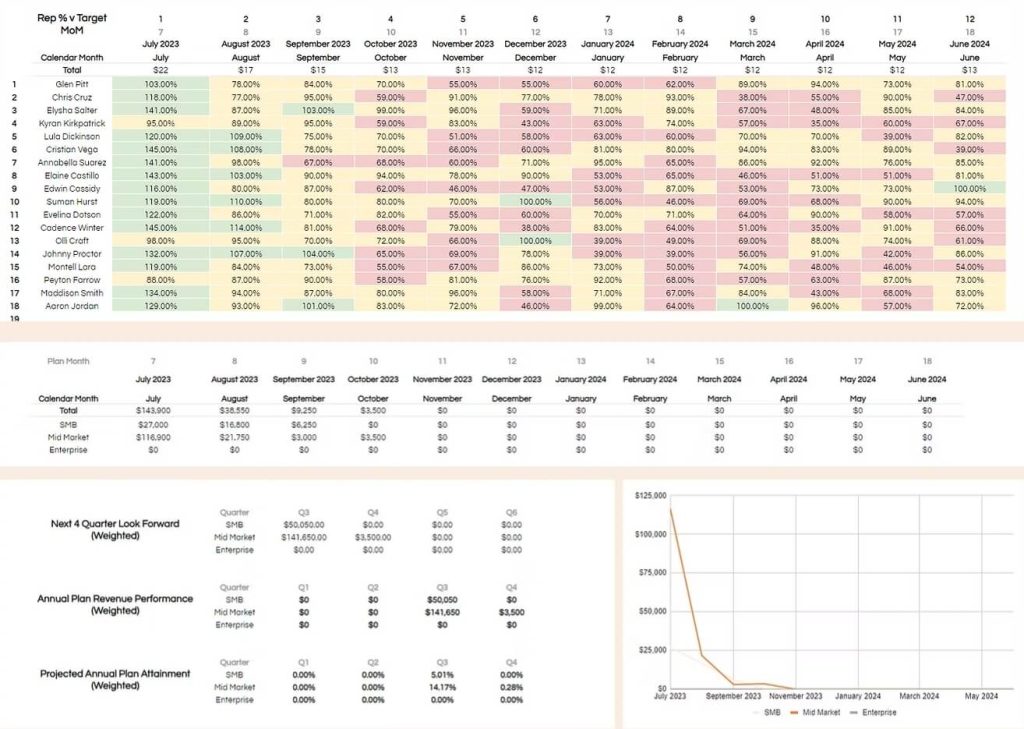
Pipeline forecasting
Pipeline forecasting, also known as opportunity stage forecasting, assigns a close probability to each deal based on its current stage in the sales process. For example, if a deal in the ‘Proposal Sent’ stage typically closes 60% of the time, that deal’s expected value in the forecast is 60% of its total size.
Source: Clevenue
Ideal for: Businesses with short sales cycles, high-velocity deal flow, or limited historical data
Strengths:
- Delivers real-time visibility into potential revenue
- Simple to implement using standard CRM fields
Weaknesses:
- Highly reliant on sales reps updating deals accurately
- Prone to forecast volatility if pipeline hygiene is weak
A SaaS startup might forecast its monthly revenue using weighted pipeline totals across deal stages—Proposal (60%), Demo (40%), Qualified (20%).
Historical forecasting (time-series models)
Historical forecasting leverages past sales performance to project future outcomes. It uses statistical techniques like simple moving averages, exponential smoothing, or ARIMA models to detect patterns in sales data over time.
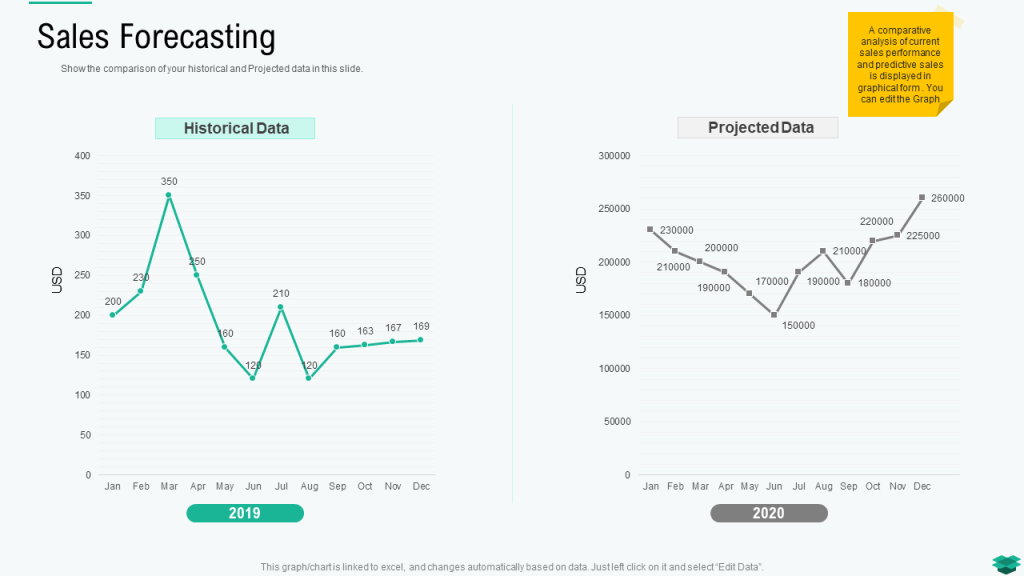
Source: SlideTeam
Ideal for: Businesses with stable revenue streams or subscription models
Strengths:
- Great for long-term planning, budgeting, and target-setting
- Provides seasonality and trend awareness
Weaknesses:
- Struggles to adapt to sudden shifts in customer demand or market conditions
- Ignores current pipeline and sales rep activity
A retail company with five years of seasonal data might use a 12-month rolling average to estimate Q4 sales based on trends from previous years.
Hybrid forecasting
Hybrid forecasting blends pipeline and historical data to provide a holistic view of both immediate deal activity and long-term patterns. It is particularly useful for companies with some historical data but a fast-changing market.
Ideal for: Mid-market or scaling companies, teams operating across multiple products or segments
Strengths:
- Captures real-time shifts in buying behavior
- Enables rolling forecasts and scenario planning
Weaknesses:
- Requires reliable integration of multiple data sources
- More complex to manage than standalone models
A B2B SaaS company might forecast next quarter’s revenue by weighting pipeline projections with the prior year’s quarter-over-quarter growth rate to account for seasonality.
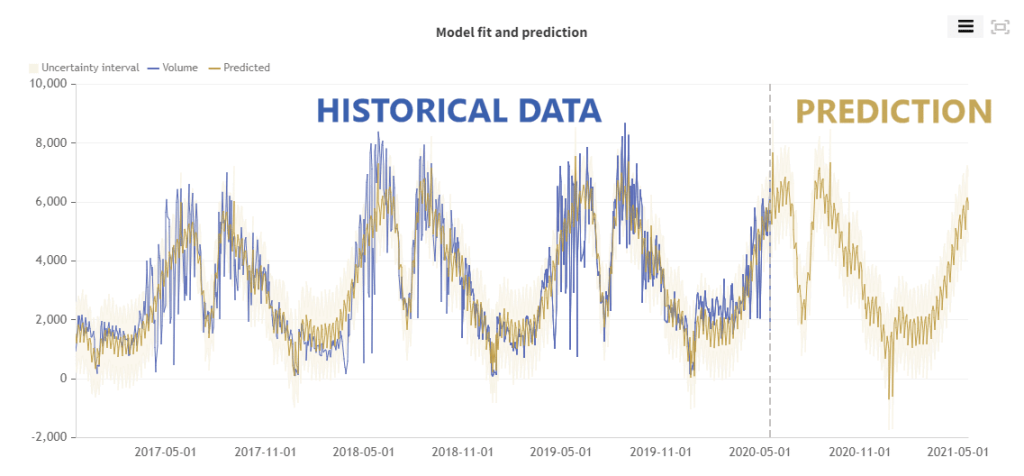
Predictive and machine learning forecasting
This approach uses AI/ML algorithms to find complex relationships in large datasets. These models can evaluate variables like sales rep activity, lead source, industry vertical, pricing changes, and marketing engagement to create highly accurate forecasts.
Ideal for: Large enterprises with access to extensive structured and unstructured data
Strengths:
- Learns and improves over time
- Factors in more variables than traditional methods
Weaknesses:
- Requires advanced analytics infrastructure
- Time-consuming to develop and maintain
An enterprise medical device manufacturer might use ML models to forecast regional sales by incorporating economic indicators, previous win rates, CRM signals, and hospital procurement data.
The future of sales forecasting: AI-powered data interaction
Traditional forecasting workflows involve hours of manual data preparation before any analysis can begin. Sales managers spend valuable time exporting CRM data, cleaning spreadsheets, and creating pivot tables just to understand their pipeline health.
Coupler.io’s AI integrations changes this entirely. Instead of wrestling with data exports, you can connect your data to AI tools using the Coupler.io MCP server and have natural conversations about your sales data:
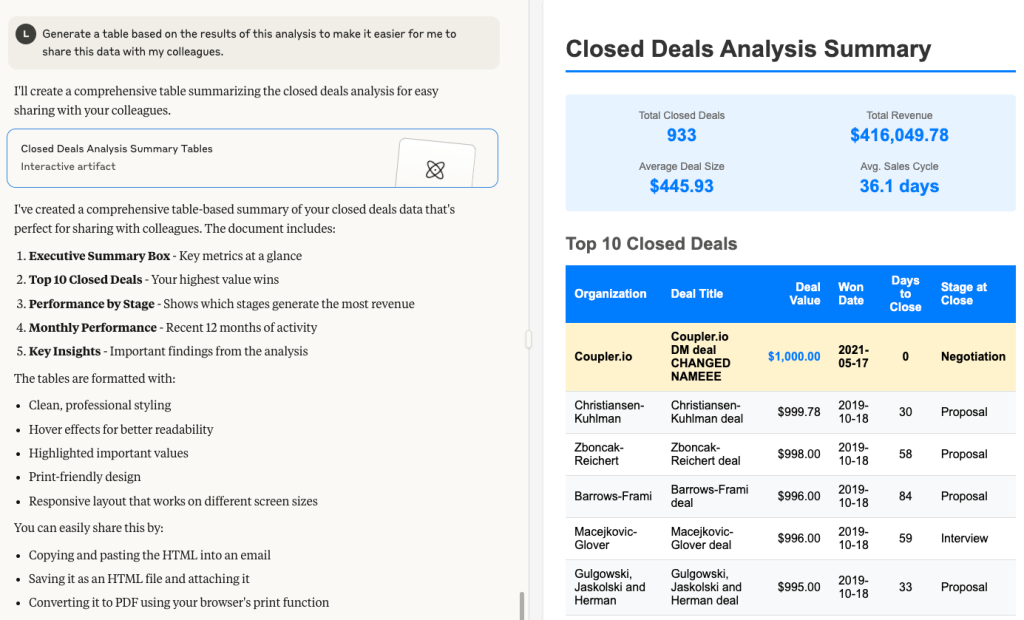
- “What are the top 10 deals likely to close this quarter based on historical patterns?”
- “Show me revenue trends for enterprise accounts over the past 6 months”
- “Which sales reps are consistently exceeding their pipeline targets?”
The AI agent, be it Claude or ChatGPT, doesn’t just answer these questions—it provides the underlying data in a format ready for deeper analysis. This means your forecasting models can be fed with fresh, properly structured data automatically, eliminating the risk of stale or incorrectly formatted inputs that often derail forecasting accuracy.
Try the AI integrations by Coupler.io right away
Get started for freeHow to forecast sales: Choose your approach by business stage
One-size-fits-all doesn’t apply to sales forecasting. The right method to forecast sales depends on your company’s maturity, data availability, and business complexity. A startup running on founder-led sales will need a different approach than an enterprise juggling thousands of deals across multiple geographies.
Below is a breakdown of how to choose the best sales forecasting method based on your business stage, with real-world logic to guide the decision.
Startup / Early-stage companies
Early-stage companies typically lack enough historical sales data to support statistical models. In this context, forecasting should be rooted in current opportunities and realistic assumptions.
Pipeline-based forecasting
This method estimates revenue by assigning probabilities to each deal in the pipeline based on its stage in the sales cycle. For example, if a deal is at the proposal stage with a 60% close rate and is worth $10,000, you’d project $6,000 from that deal.
Startups can customize probabilities based on early patterns or industry benchmarks. Over time, as win rates stabilize, these probabilities become more predictive.
Simple moving averages (SMA)
If you’ve recorded even a few months of sales data, SMA can provide a basic projection by averaging those numbers. For example, averaging sales from the past 3 months to predict the next.
This method adds value when combined with pipeline forecasts, providing a reality check between expected future revenue and recent historical performance.
Pro Tip: Use moving averages to set a “baseline,” and use pipeline forecasting to layer in upside potential.
Growing companies (Scale-up / Mid-market)
Best-fit method:
- Hybrid forecasting combining pipeline and historical data
Now you’ve built a customer base, have at least 12–24 months of sales data, and your CRM is more reliable. A hybrid approach balances forward-looking pipeline visibility with past performance trends.
How to use hybrid forecasting?
Combine time-series data (e.g., seasonality, booking trends, growth rates) with live pipeline insights (deal stages, rep activity, close probabilities).
This layered approach gives you both strategic depth and short-term responsiveness.
Since hybrid forecasting requires you to collect data from multiple sources, which is exactly why you should add Coupler.io to your toolbox. This reporting automation platform lets you pull sales pipeline data from tools like HubSpot, Pipedrive, or Salesforce, and blend it with historical revenue from your databases. This enables growing businesses to:
- Build dynamic hybrid forecasting models
- Create custom dashboards in Looker Studio, Tableau, or Power BI
- Refresh forecast data automatically (hourly, daily, or weekly)
- Share up-to-date forecasts across departments without manual exports
Established businesses (Enterprise / Multi-region)
Primary method:
- Multi-method forecasting using statistical and machine learning models
Established companies typically have years of structured data, multiple revenue streams, and larger, more complex sales teams. These organizations benefit from models that can analyze dozens (or hundreds) of variables at scale.
Forecasts may be generated using:
- ARIMA models (Auto regressive integrated moving average)
- Holt-Winters exponential smoothing
- Linear regression or segmented regression
These methods are excellent for modeling stable, repeatable revenue streams. For example, product lines with clear seasonality or high historical volume.
Machine learning forecasting
ML models analyze structured and unstructured data from CRM, marketing, finance, and external sources. They can identify non-obvious patterns and improve accuracy by weighting the most predictive variables, such as deal age, rep activity, pricing fluctuations, or lead source.
Decision tree: choose the right forecasting approach
Here’s a simplified guide to forecast sales based on your current state:
| If this sounds like you… | Use this method |
| You have < 12 months of sales data, and your pipeline is inconsistent | Weighted pipeline + simple moving average |
| You have 1–3 years of sales history and a fairly structured pipeline | Hybrid method (historical trends + real-time pipeline) |
| You have >3 years of clean data, segmented markets, or large sales teams | Multi-method forecasting (statistical + ML + pipeline) |
| You’re launching a new product with no prior data | Reference class forecasting + industry benchmarks + sales rep judgment |
| You’re selling to repeat customers with a stable cycle | Time-series model (seasonal smoothing or ARIMA) |
Sales forecasting process: an implementation roadmap
Implementing a reliable sales forecasting process isn’t just about picking the right model—it’s about building a system that consistently produces accurate, trusted insights. That means aligning people, processes, and tools across the entire sales cycle.
Here’s a step-by-step roadmap to help you do just that.
Step 1: Data audit & baseline establishment
Before you build a forecast, assess your current data and define a clean baseline.
What to do:
- Audit your CRM for missing or outdated fields (e.g., close dates, deal stage, expected value)
- Ensure pipeline stages are clearly defined and used consistently across your team
- Reconcile sales records with finance or billing data to identify discrepancies
- Define a historical sales baseline: 12–36 months of monthly revenue by product, team, or segment
Forecasting accuracy depends heavily on input quality. Inconsistent close dates, incorrect deal values, or broken formulas can skew predictions from the start.
Step 2: Process implementation & team training
Once your data foundation is solid, it’s time to operationalize your forecasting model across the team.
What to do:
- Select your forecasting method(s) based on your business stage and data structure
- Build your initial forecast model
- Document the forecasting process: inputs, ownership, timelines, reporting cadence
- Train your sales team on CRM hygiene, deal stage accuracy, and updating forecast fields consistently
- Set expectations for weekly or bi-weekly forecast reviews at both team and leadership levels
Even the best model fails without buy-in and consistency. Sales reps need to know how their activity affects the forecast, and leadership needs a regular pulse on performance versus plan.
Step 3: Refinement and accuracy improvement
Forecasting isn’t a “set-it-and-forget-it” process. You’ll need to review, test, and improve continuously.
What to do:
- Track forecast vs. actual variance monthly
- Identify common sources of inaccuracy (reps inflating deals, stale opportunities)
- Use reference class forecasting or historical deal-type analysis to correct stage probabilities
- Integrate additional signals (marketing engagement, seasonality, rep activity scores)
- Use tools like Coupler.io to blend these data layers and push updates to dashboards automatically
The key to continuous improvement is working with dynamic, up-to-date data. Coupler.io’s AI integrations enable you to refine your forecasting models using conversational queries that automatically pull fresh data from all connected sources. You can ask:
‘How has our Q4 pipeline velocity changed compared to last year?’ or ‘What’s the impact of our new lead scoring on forecast accuracy?‘
The AI tools analyze your sales data connected via Coupler.io and provide instant, accurate responses. This allows you to iterate and improve your models faster than ever before.
Connect your sales data to AI and make forecasts
Try Coupler.io for freeTop-performing companies don’t just forecast—they benchmark their forecast accuracy. Tightening your forecast tolerance even by 5–10% can improve operational confidence, cash flow decisions, and investor communication.
Step 4: Success metrics & review cycles
To maintain momentum and credibility, you need clear KPIs and a regular review cadence.
Metrics to track:
- Forecast accuracy (% error): How close was your forecast to actuals?
- Forecast bias: Are you consistently over- or under-forecasting?
- Win rate by stage: Used to update deal-weighting logic
- Pipeline coverage ratio: Pipeline vs. quota (e.g., 3x coverage for new business)
- Sales cycle velocity: To predict timing with greater precision
Review cadence:
- Weekly forecast meetings (sales leaders + reps)
- Monthly performance reviews (revops, finance, leadership)
- Quarterly model evaluation (refinement, re-training if using ML)
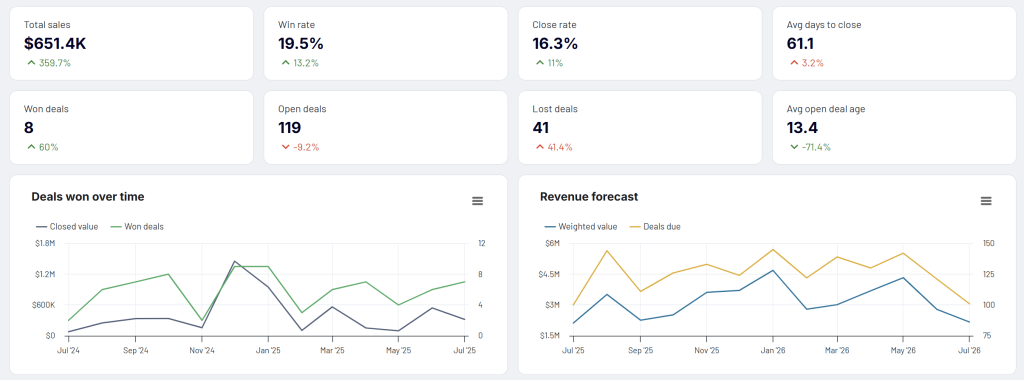
The most successful forecasting teams don’t just review numbers weekly—they monitor their metrics continuously. Rather than spending hours each week manually updating forecast dashboards, Coupler.io can refresh your visualizations automatically. This means your Monday morning forecast review starts with up-to-date pipeline health, not Friday’s stale data, just like in this CRM dashboard for Pipedrive.
How to improve sales forecasting accuracy?
Even the most sophisticated forecasting model can be undone by human bias, data gaps, or process breakdowns. Improving accuracy is about building a feedback loop that constantly refines your assumptions and inputs.
Let’s explore how to spot what’s holding your forecast back and what to do about it:
Common pitfalls that affect forecast accuracy
Dirty or incomplete CRM data
- Deals missing close dates or stage values
- Inaccurate opportunity amounts or contact roles
- Outdated opportunities clogging the pipeline
Rep optimism or sandbagging
- Some reps overestimate; others hold back deals to “look good” later
- Subjectivity skews reality
Pipeline stage inflation
- Deals move forward in CRM without real buyer commitment
- Causes inflated forecasts that collapse late in the cycle
Static forecasting models
- Models built once and never adjusted for seasonal, economic, or sales team changes
- Misses shifts in buyer behavior or sales velocity
Siloed data sources
- Sales, marketing, and finance all work from separate sheets or systems
- Creates misalignment between forecast and actuals
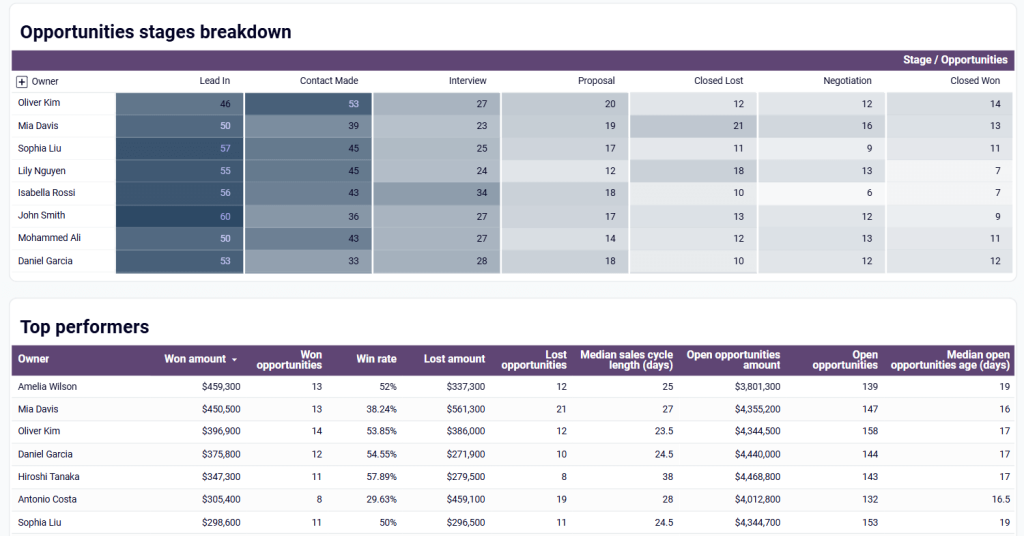
One of the biggest accuracy killers is inconsistent data across teams. Sales reps updating deals in the CRM, marketing tracking leads in automation platforms, and finance recording actual revenue in separate systems create disconnects. Coupler.io bridges these gaps by automatically syncing data across all platforms. This ensures your forecast reviews are based on a single source of truth rather than conflicting spreadsheets or databases. And it’s easy for managers to evaluate the performance of each team member in one place, like in this Sales team performance dashboard for Salesforce.
The biggest breakthrough in forecast accuracy comes from eliminating data lag and human error in data preparation. Coupler.io’s MCP server ensures your forecasting models are always fed with fresh, properly formatted data. You can build dynamic forecasting workflows that automatically incorporate new deal updates, marketing attribution data, and external market signals without manual intervention. This means your forecasts improve continuously as new data flows in, rather than becoming stale between manual update cycles.
Strategies for mitigating forecasting biases and errors
- Define and enforce sales stage criteria
Create crystal-clear rules for when a deal can move stages. For example: “Proposal stage requires a scheduled meeting and a named stakeholder.” - Use historical conversion rates per stage
Instead of rep intuition, base deal probabilities on actual historical win rates by product, deal size, or territory. - Implement reference class forecasting
Compare deals to past opportunities of similar size and type—this grounds the forecast in precedent, not wishful thinking. - Apply deal health scoring
Include indicators like number of meetings, email response rates, or marketing engagement to gauge true deal progress. - Run dual forecasts
Use one rep-submitted forecast and one data-driven model. Track the variance between the two to improve accountability.
Importance of regular forecast reviews & iteration
Forecasts should never be static. Weekly or bi-weekly review cycles give teams time to adjust based on:
- New pipeline activity
- Lost or delayed deals
- Macro shifts (seasonality, market shocks)
- Changes in sales strategy or product focus
These reviews also create coaching opportunities. If a rep has multiple high-value deals in the “proposal” stage for months, that’s a signal to dive deeper.
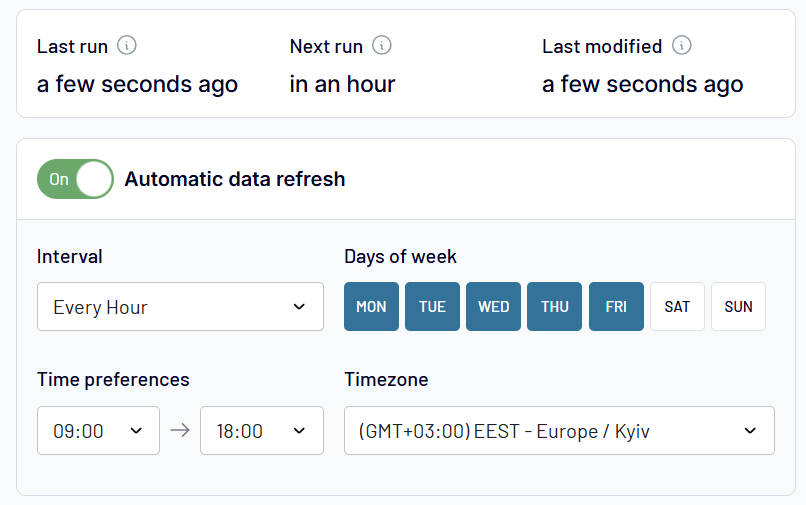
With Coupler.io, you can auto-refresh forecast dashboards every day or week, ensuring your review meetings always reflect the latest pipeline reality.
Make your sales dashboards self-updating
 Try Coupler.io for free
Make your sales dashboards self-updating
Try Coupler.io for freeRed flags that indicate your forecast is unreliable
- Forecast swings more than ±10% month over month
- More than 15–20% of pipeline lacks a next step or last contact date
- Deals sit in late-stage for 30+ days with no movement
- Close dates frequently pushed to end of quarter
- Reps forecast “gut-feel” numbers with no supporting activity or data
If any of these are showing up consistently, your forecast likely needs urgent review—and possibly a process overhaul.
Quick diagnostic questions to test forecast quality
Use this checklist to gauge your forecast’s health:
- Are deal stage definitions consistent and enforced across the team?
- Is your forecast based on both pipeline and historical data?
- Do you update your forecast weekly or bi-weekly?
- Is CRM hygiene monitored and enforced?
- Are you tracking forecast accuracy over time (e.g., % variance)?
- Is the forecast used by multiple teams (sales, finance, execs), or siloed?
If you answered “no” to 2 or more of these, your forecast may be more guesswork than strategy.
By addressing biases, enforcing data discipline, and reviewing forecasts regularly, you can turn your projections into a true strategic advantage.
Whether you’re tracking sales in spreadsheets or using advanced BI tools, the most important ingredient is consistency.
Transform your forecasting with conversational data intelligence
The traditional approach to sales forecasting—downloading data, cleaning it, building models, and creating reports—is becoming obsolete. Modern sales teams need forecasting systems that adapt as quickly as their business moves.
Coupler.io AI integrations represent the next evolution in sales forecasting technology. Instead of static dashboards that require manual updates, you get a dynamic AI assistant that can:
- Automatically refresh forecast models with the latest data from all your business systems
- Provide instant answers to complex forecasting questions using natural language
- Generate custom reports on demand without requiring technical expertise
- Monitor forecast accuracy continuously and alert you to significant changes
This isn’t just about saving time—it’s about making forecasting a living, breathing part of your sales process rather than a monthly administrative task.
Integrate your sales data with Claude. ChatGPT and other AI tools using Coupler.io
Get started for freeThe advantages of sales forecasting: how to build a lasting competitive edge
When used strategically, forecasting helps businesses anticipate the future, align internal operations, and outpace slower-moving competitors. It’s not just about knowing what’s coming; it’s about being ready for it.
Companies that consistently forecast with high accuracy operate with greater clarity and agility. They know when to scale up or pull back, when to hire, when to launch, and when to hold.
According to McKinsey, top-performing companies use forecasting not just to predict revenue, but to shape decisions across the organization. These firms often:
- Adjust investments and hiring faster
- Launch campaigns aligned with sales momentum
- Minimize inventory risk and capital waste
- Reduce reliance on emergency budget corrections
This kind of agility leads to real outcomes: faster time to market, fewer missed opportunities, and improved investor confidence.
High-impact forecasting isn’t siloed. It integrates with:
| Function | How forecasting helps |
| Finance | Aligns revenue projections with cash flow planning, funding rounds, and budget allocations |
| Marketing | Helps time campaigns based on sales cycle momentum or seasonal spikes |
| Product | Informs demand planning for launches, stock levels, and development priorities |
| Operations | Aligns supply chain and staffing needs with forecasted demand |
By centralizing this information, your forecast becomes a company-wide intelligence asset, not just a sales spreadsheet.
Sales forecasting, when institutionalized, supports long-term growth and resilience. Over time, it enables:
- Better capital allocation – Know where to invest and where to conserve
- More confident growth planning – Expand into new markets based on trend-backed assumptions
- Improved leadership visibility – Boards, investors, and executive teams get clearer signals
- Stronger company culture – When forecasts are trusted, cross-team collaboration improves
What is the purpose of sales forecasting?
Sales forecasting is more than projecting numbers—it’s about helping sales organizations make informed decisions and align cross-functional efforts. Accurate forecasts give teams the visibility they need to meet sales targets, support financial planning, and shape a long-term business plan.
Predict future sales performance
Forecasts create realistic sales projections based on pipeline data, sales figures, and trend models. When grounded in real-time data, forecasts empower leaders to move beyond guesswork and make business decisions confidently.
Support goal-setting and strategic planning
Sales forecasting supports sales managers in setting achievable sales quotas and aligning team performance with broader company objectives. Whether planning new territory coverage or optimizing marketing efforts, reliable forecasts ensure each initiative supports the bottom line.
Anticipate market changes and demand
By incorporating external factors like economic indicators, seasonality, or competitive shifts, forecasting helps teams stay ahead of changing market conditions and customer demand.
In volatile periods like the COVID-19 pandemic, companies that used AI-enhanced “demand sensing” saw forecasting errors drop by up to 33%, allowing them to adapt faster than competitors.
Optimize inventory and operational efficiency
Sales forecasting improves inventory management and resource allocation by predicting volume fluctuations before they hit operations. This enables companies to avoid overstocking and production delays. For example, retailers leveraging real-time demand models report safety stock reductions of up to 30%.
Cash flow management and investment decisions
Revenue projections drive cash flow forecasting: how much capital will be available and when. This enables better investment timing in hiring, marketing campaigns, or technology upgrades, and helps avoid reactive decisions in periods of shortfall or surplus.
Risk mitigation and opportunity identification
Trends in win rate, pipeline velocity, or product-specific drops help identify risk areas. Strong forecasts also uncover hidden growth potential, especially when paired with market research and insights from salespeople and sales representatives.
The longer you commit to data-informed forecasting, the more precise your strategic planning becomes. And the more your competitors rely on instinct or outdated models, the bigger your lead becomes.
Sales forecasting isn’t just about hitting numbers; it’s about seeing further, acting sooner, and building smarter. In a business landscape defined by volatility, the companies that can predict and adapt fastest are the ones that win.
Whether you’re just starting or scaling up, the path to long-term strategic advantage starts with an accurate, integrated, and trusted sales forecasting process. Start now by asking yourself: How reliable is our forecast, and what would we do differently if we knew it was wrong?