Summarize this blog post with:
What is marketing ETL?
Marketing ETL (extract, transform, load) is a process for collecting data from multiple marketing channels, cleaning and restructuring it, then loading it into a system where you can actually analyze it. The goal is to turn scattered numbers from ad platforms, analytics tools, CRMs, and social media into a single, reliable dataset you can report on and make decisions with.
The process has three steps:
Extract data from marketing sources. Pull raw records from analytics tools, ad platforms, social media, email tools, and CRMs. This covers everything from GA4 session logs to Facebook Ads spend data to Klaviyo email metrics.
Transform data into a usable format. Clean duplicates, standardize naming conventions (so “facebook” and “Facebook Ads” become one source), calculate derived metrics like ROAS or CPA, filter out irrelevant rows, and merge records from different platforms into a common structure.
Load data into a destination. Move the processed data into a spreadsheet, BI tool, database, data warehouse, or AI tool where your team can build dashboards, run queries, or ask questions in natural language.
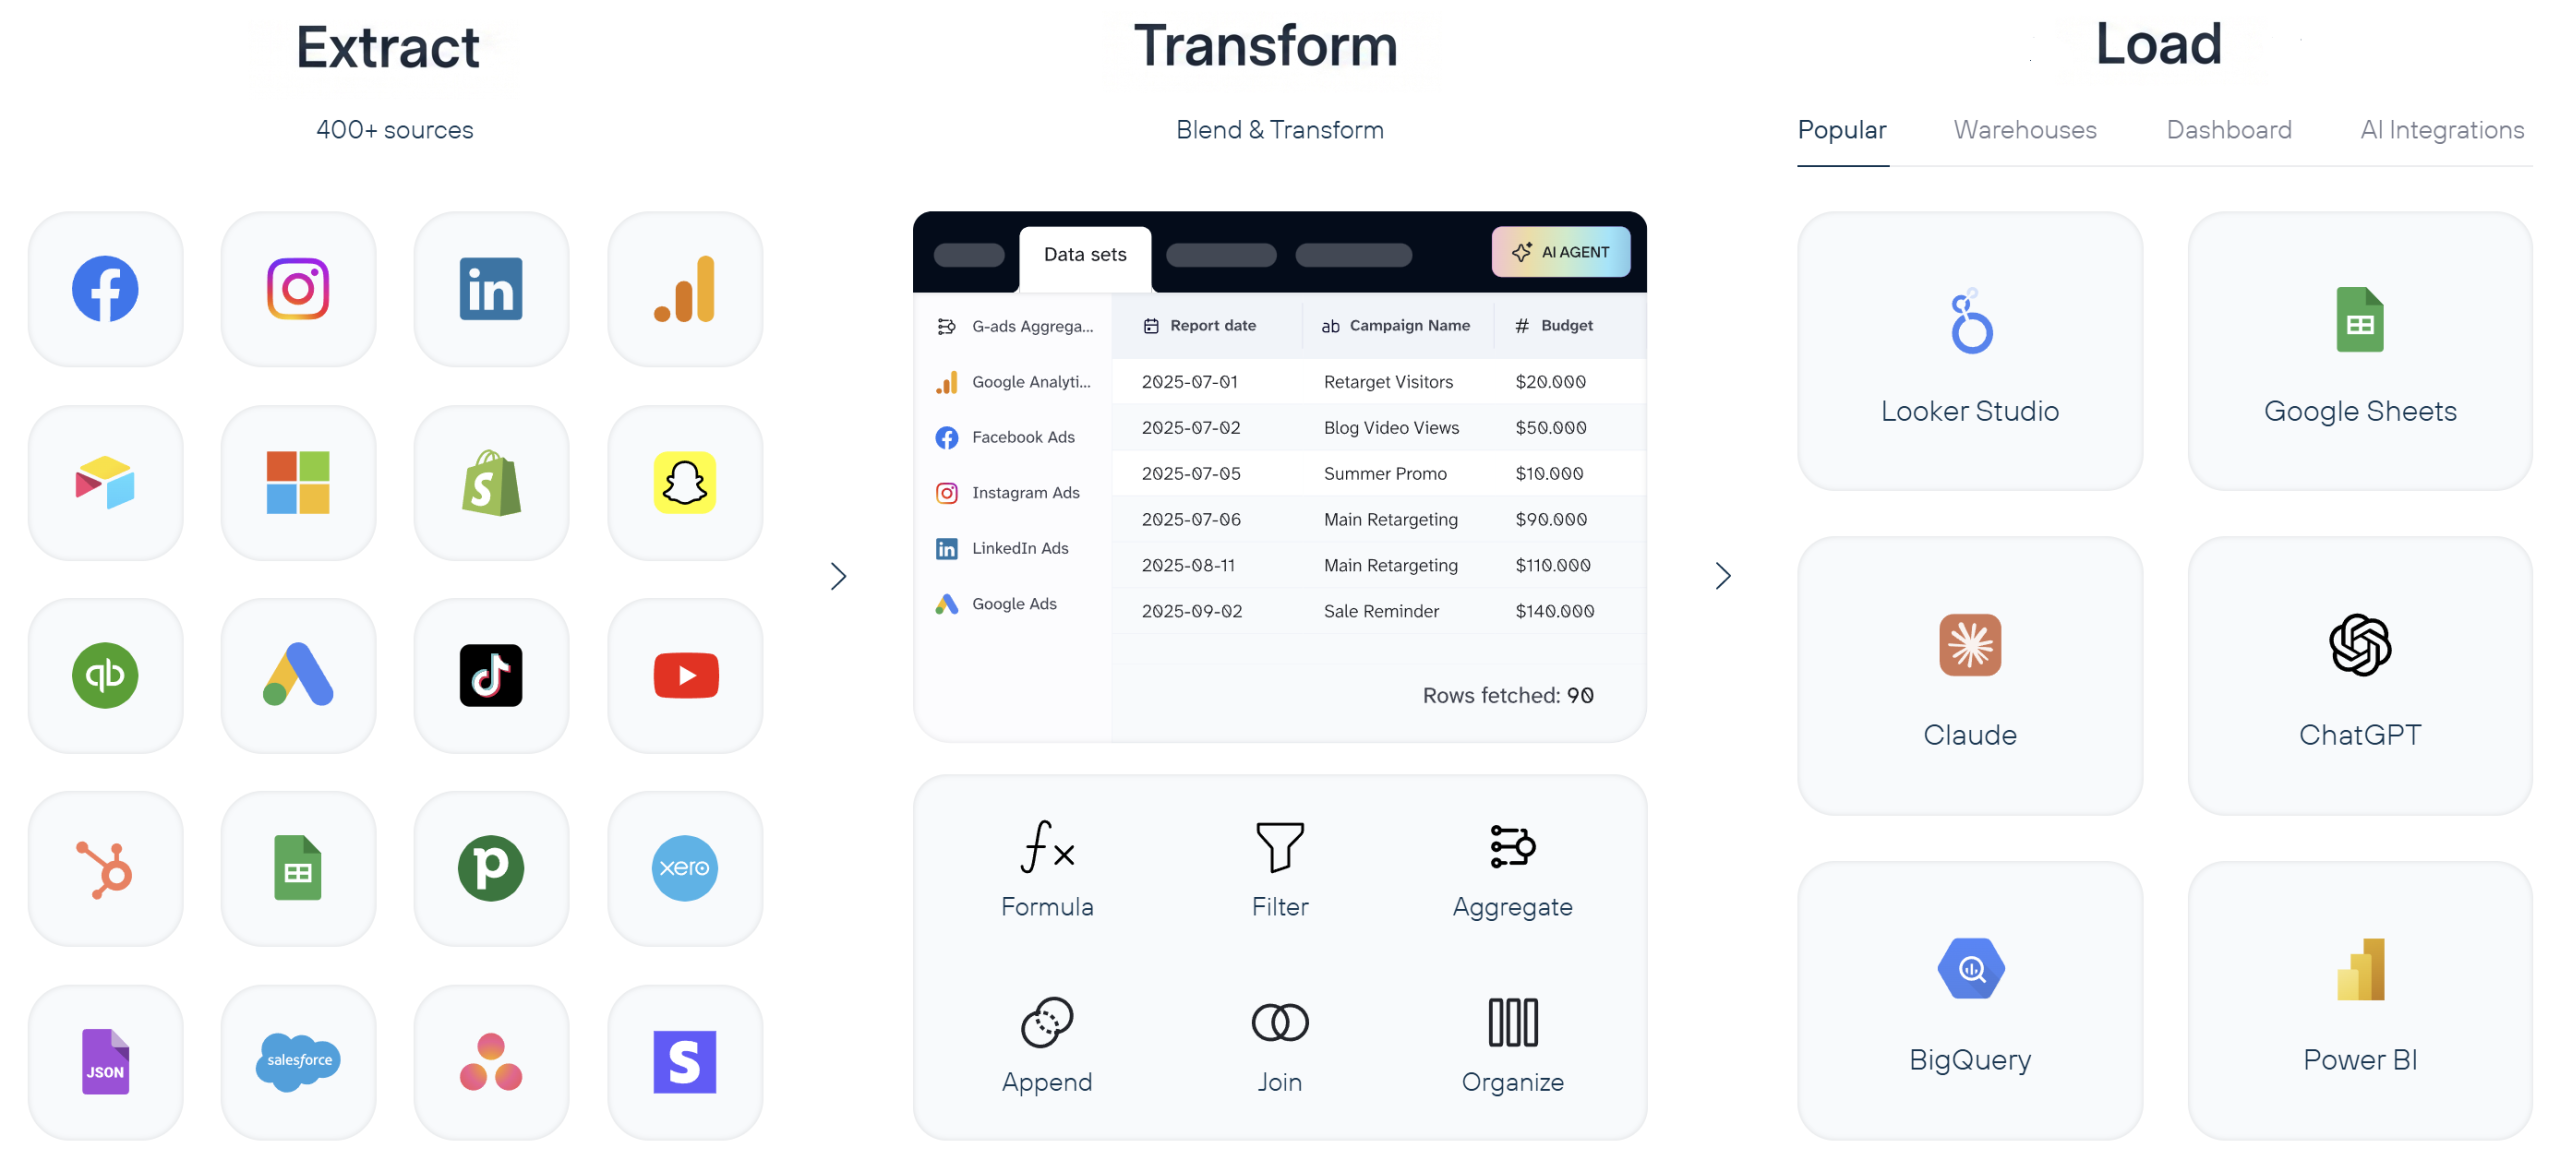
When these three steps run on a schedule, you get a pipeline. And a pipeline means your Monday morning dashboard updates itself instead of requiring two hours of manual exports.
Who needs marketing ETL (and who doesn’t)
Not every marketing team needs a dedicated ETL pipeline. If you run ads on a single platform and your native reports give you enough detail, the overhead of setting up data pipelines probably is not worth it.
Marketing ETL starts earning its cost when:
- You run campaigns on three or more platforms and need a combined view of spend, conversions, and ROAS across all of them.
- Manual reporting takes your team more than a few hours per week. If someone on your team is copy-pasting CSVs from Google Ads into a spreadsheet every Monday, that is ETL work being done by a human.
- You need to blend marketing data with revenue data from a CRM, ecommerce platform, or accounting tool to calculate true customer acquisition costs.
- Multiple people or teams need access to the same numbers, and version conflicts between spreadsheets are causing problems.
- You want to feed marketing data into an AI tool (Claude, ChatGPT, or a custom model) for analysis, forecasting, or creative optimization.
If you are a solo marketer running one or two channels and checking results directly in the platform UI, native reports are probably enough for now. You can revisit ETL when your stack grows.
If any of the scenarios above sound familiar, Coupler.io lets you set up your first marketing ETL pipeline in minutes. Just connect your sources, blend and transform the data set, pick a destination where to load data, and schedule automatic refresh. No coding or data engineering ticket is needed.

Create ETL pipelines from over 400 sources with Coupler.io
Get started for freeMarketing ETL vs. ETL vs. ELT vs. reverse ETL
These four terms get mixed up constantly. Here is how they differ and when each one applies.
Traditional ETL
Traditional ETL was designed for structured, predictable data: financial records, ERP systems, inventory databases. The transformation happens on a separate processing server before data reaches the warehouse. This works well for IT-managed pipelines where the schema is defined in advance and rarely changes.
Marketing data is different. Ad platforms change their APIs, add new fields, deprecate old metrics, and rename dimensions without much notice. A rigid ETL pipeline built for Facebook Ads in January can break by March when Meta changes its reporting structure. That is why marketing-specific ETL tools exist: they handle the messiness of ad platform APIs so your pipeline does not break every time a vendor ships an update.
ELT (extract, load, transform)
ELT flips the last two steps. You extract data, load it raw into a cloud warehouse (BigQuery, Snowflake, Redshift), and transform it there using SQL or a tool like dbt.
ELT became popular because cloud warehouses can handle massive data volumes cheaply, and loading raw data first means you always have the original records to re-transform later. If you realize three months from now that you need a metric you did not calculate originally, the raw data is still there.
For marketing teams, ELT makes sense when:
- You already have a data warehouse and a team comfortable writing SQL.
- You want to store raw data long-term for historical analysis or attribution modeling.
- Your data volume is large enough that pre-transforming on a separate server would create bottlenecks.
The downside: ELT puts the transformation burden on whoever manages the warehouse. If your marketing team does not have SQL skills or access to a data engineer, the “transform” step becomes a bottleneck in a different way.
Marketing ETL
Marketing ETL sits between the two. Tools in this category are built specifically for marketing data sources. They handle connector maintenance, API changes, and field mapping automatically. In addition, they offer transformation features that do not require writing code.
The practical difference:
With an ETL tool, you are building and maintaining the pipeline yourself.
With a marketing ETL tool, the connector layer is managed for you. You pick a source, pick a destination, set a schedule, and optionally add transformations like filters, formulas, or aggregations in a visual interface.
Coupler.io is an example of this approach. It connects to 400+ marketing data sources, handles API changes automatically, and lets you build transformation logic visually instead of writing SQL. You can load the results into Google Sheets, a BI tool, a warehouse, or an AI tool like Claude. If you need both ETL (data into spreadsheets for the marketing team) and ELT (raw data into BigQuery for the analytics team), you can run both from the same platform.
Reverse ETL
Reverse ETL moves data in the opposite direction: from a warehouse or analytics system back into operational tools like a CRM, ad platform, or email tool. For example, you might push a “high-value customer” segment from BigQuery back into Facebook Ads as a custom audience, or sync lead scores from your analytics warehouse into HubSpot.
Marketing teams increasingly use reverse ETL for:
- Activating audience segments in ad platforms based on warehouse-computed scores.
- Syncing offline conversion data back to Google Ads or Meta for better algorithmic optimization.
- Keeping CRM records enriched with analytics data without manual updates.
Reverse ETL is not a replacement for ETL. It is the return trip. You still need ETL (or ELT) to get data into your warehouse in the first place.
When to use which
| Scenario | Best approach |
| Small team, spreadsheet destinations, no warehouse | Marketing ETL |
| Data warehouse in place, SQL-capable team | ELT |
| Legacy systems, strict pre-load compliance needs | Traditional ETL |
| Pushing analytics data back into ad platforms or CRM | Reverse ETL |
| Most marketing teams (practical starting point) | Marketing ETL, then add ELT or reverse ETL as needs grow |
How a marketing ETL stack works
A marketing ETL pipeline has four layers. Understanding them helps you evaluate tools and spot gaps in your current setup.
1. Collect data from sources
Marketing data lives in dozens of places. A mid-size marketing team might pull from:
- Analytics tools: GA4, Google Search Console, Amplitude, Piwik PRO, Plausible
- Ad platforms: Google Ads, Meta Ads (Facebook, Instagram), LinkedIn Ads, TikTok Ads, Microsoft Ads, Amazon Ads, Pinterest Ads, X Ads
- Social media: Facebook Pages, Instagram, LinkedIn, YouTube, TikTok
- Marketing automation and email: Klaviyo, Mailchimp, Lemlist, MailerLite, SendGrid, Campaign Monitor
- CRM and sales: HubSpot, Salesforce, Pipedrive
Each source has its own API, data format, rate limits, and schedule for deprecating fields or changing authentication methods. A major part of the value of a marketing ETL tool is that it maintains these connectors for you.
Coupler.io covers all five categories above with 400+ pre-built connectors. When a platform like Meta deprecates an API version, or LinkedIn API changes a field name, the Coupler.io team updates the connector so your pipeline keeps running.
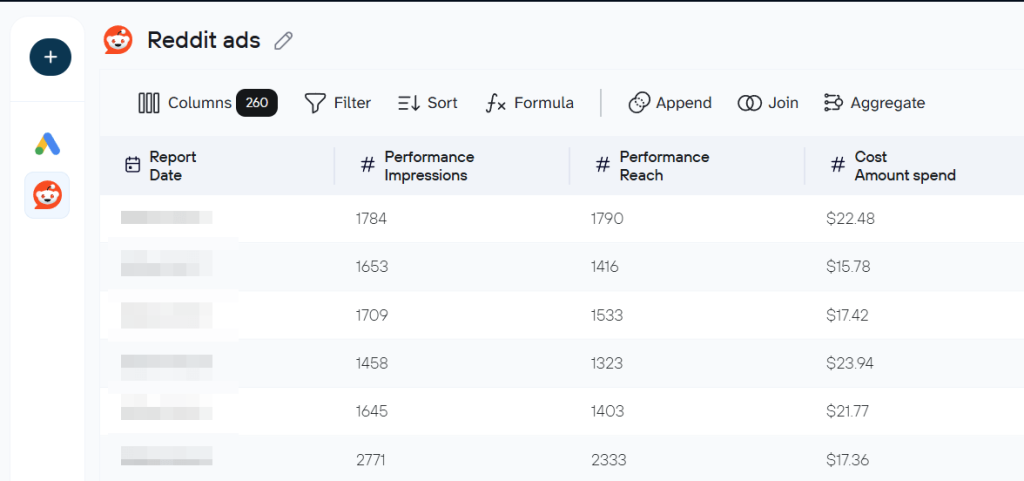
2. Blend and transform data to make it clean and structured
Raw marketing data is rarely analysis-ready. Common transformations include:
- Deduplication: Removing duplicate rows that appear when a platform reports the same event twice.
- Normalization: Making “facebook” from one source and “Facebook Ads” from another resolves to the same value.
- Calculated fields: Deriving ROAS, CPA, CTR, or conversion rate from raw spend, revenue, clicks, and conversion numbers.
- Filtering: Removing internal traffic, test campaigns, or irrelevant records.
- Aggregation: Rolling daily data into weekly or monthly summaries.
- Joining: Combining records from different sources (e.g., matching GA4 session data with Google Ads cost data by campaign ID).
The complexity of your transformations depends on what you are trying to analyze. A basic cross-channel spend report needs normalization and aggregation. A multi-touch attribution model needs event-level joins across multiple sources.
In Coupler.io, you handle all of this in a visual data flow builder. You can filter rows, add formula-based columns, join tables from different sources, and aggregate data, all without writing SQL. For common setups, Coupler.io also offers data set templates. These are pre-built transformation logic that takes raw source data and organizes it into analysis-ready tables, so you skip the configuration work entirely. Here is an example of GA4 referral traffic data set template to get aggregated data from Google Analytics without manual data transformations.
3. Load data to destinations
The destination shapes your analytics workflow. Common options:
- Spreadsheets (Google Sheets, Excel): Good for small teams, ad-hoc analysis, and sharing data with non-technical stakeholders. Limited by row counts and performance with large datasets.
- BI tools (Looker Studio, Power BI, Tableau): Better for dashboards, visualizations, and scheduled reports. They connect to data sources or warehouses and update automatically.
- Data warehouses (BigQuery, Snowflake, Redshift, PostgreSQL): Best for large data volumes, complex queries, historical analysis, and feeding data to multiple downstream tools. Require SQL skills or a BI tool on top.
- AI tools (Claude, ChatGPT, Cursor): A newer category. You load structured marketing data into an AI tool and ask questions in natural language: “Which campaigns had the highest CPA increase last week?” or “What creative patterns correlate with higher conversion rates?” This works best when the data is already clean and well-structured, which is exactly what ETL provides.
The right destination depends on your team’s skills, data volume, and how many people need access. Many teams use more than one: a warehouse for long-term storage and complex queries, plus a BI tool or spreadsheet for day-to-day dashboards.
Coupler.io supports all four destination types. You can send the same dataset to multiple destinations from a single pipeline, so your marketing team gets a Google Sheets dashboard while your analytics team gets the same data in BigQuery.
Load data to spreadsheets, dashboards, DWHs, and AI tools
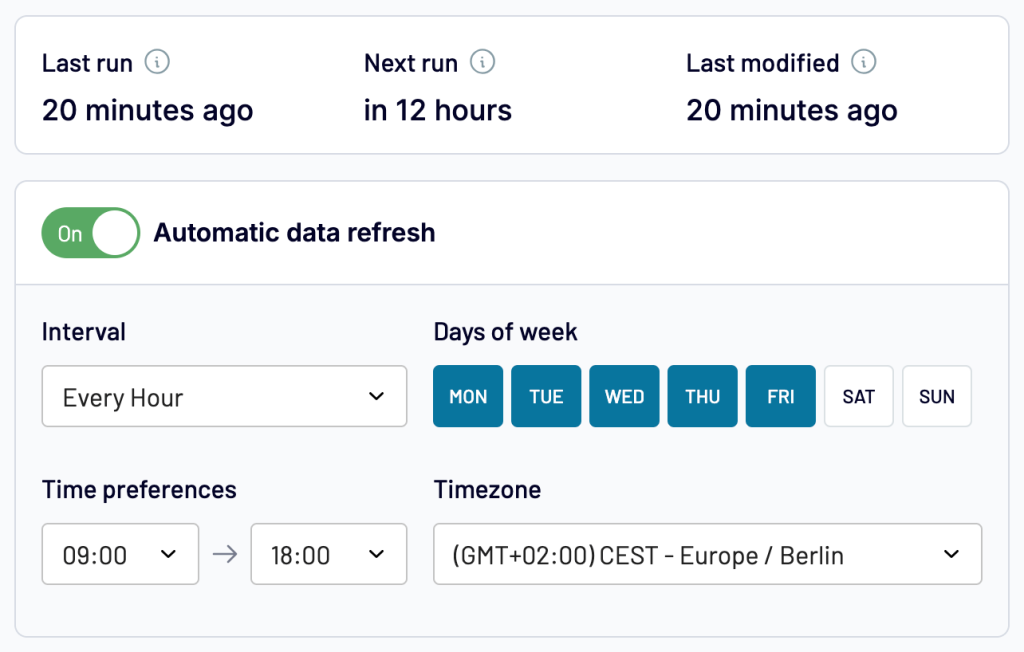
Try Coupler.io for free4. Schedule refresh of pipelines and monitor their health
A pipeline that runs once is a script. A pipeline that runs reliably on a schedule is infrastructure. Consider the following for your marketing ETL workflows:
- Refresh frequency: How often data updates. Hourly for live dashboards, daily for most reporting, weekly for summaries.
- Error handling: What happens when a source API is down, rate-limited, or returns unexpected data. Good ETL tools retry automatically and alert you when something fails.
- Data quality checks: Automated validation to catch anomalies, like a sudden drop to zero rows or a metric that spikes 10x, before they reach your dashboard.
Coupler.io handles scheduling with hourly, daily, or custom refresh intervals. If a source API is temporarily down, the system retries automatically and notifies you, so your dashboard shows the last successful data instead of breaking.
Top use cases of ETL for marketing
Here are four ways marketing teams put ETL pipelines to work. I’ve demonstrated them using a different Coupler.io tool for the analysis layer.
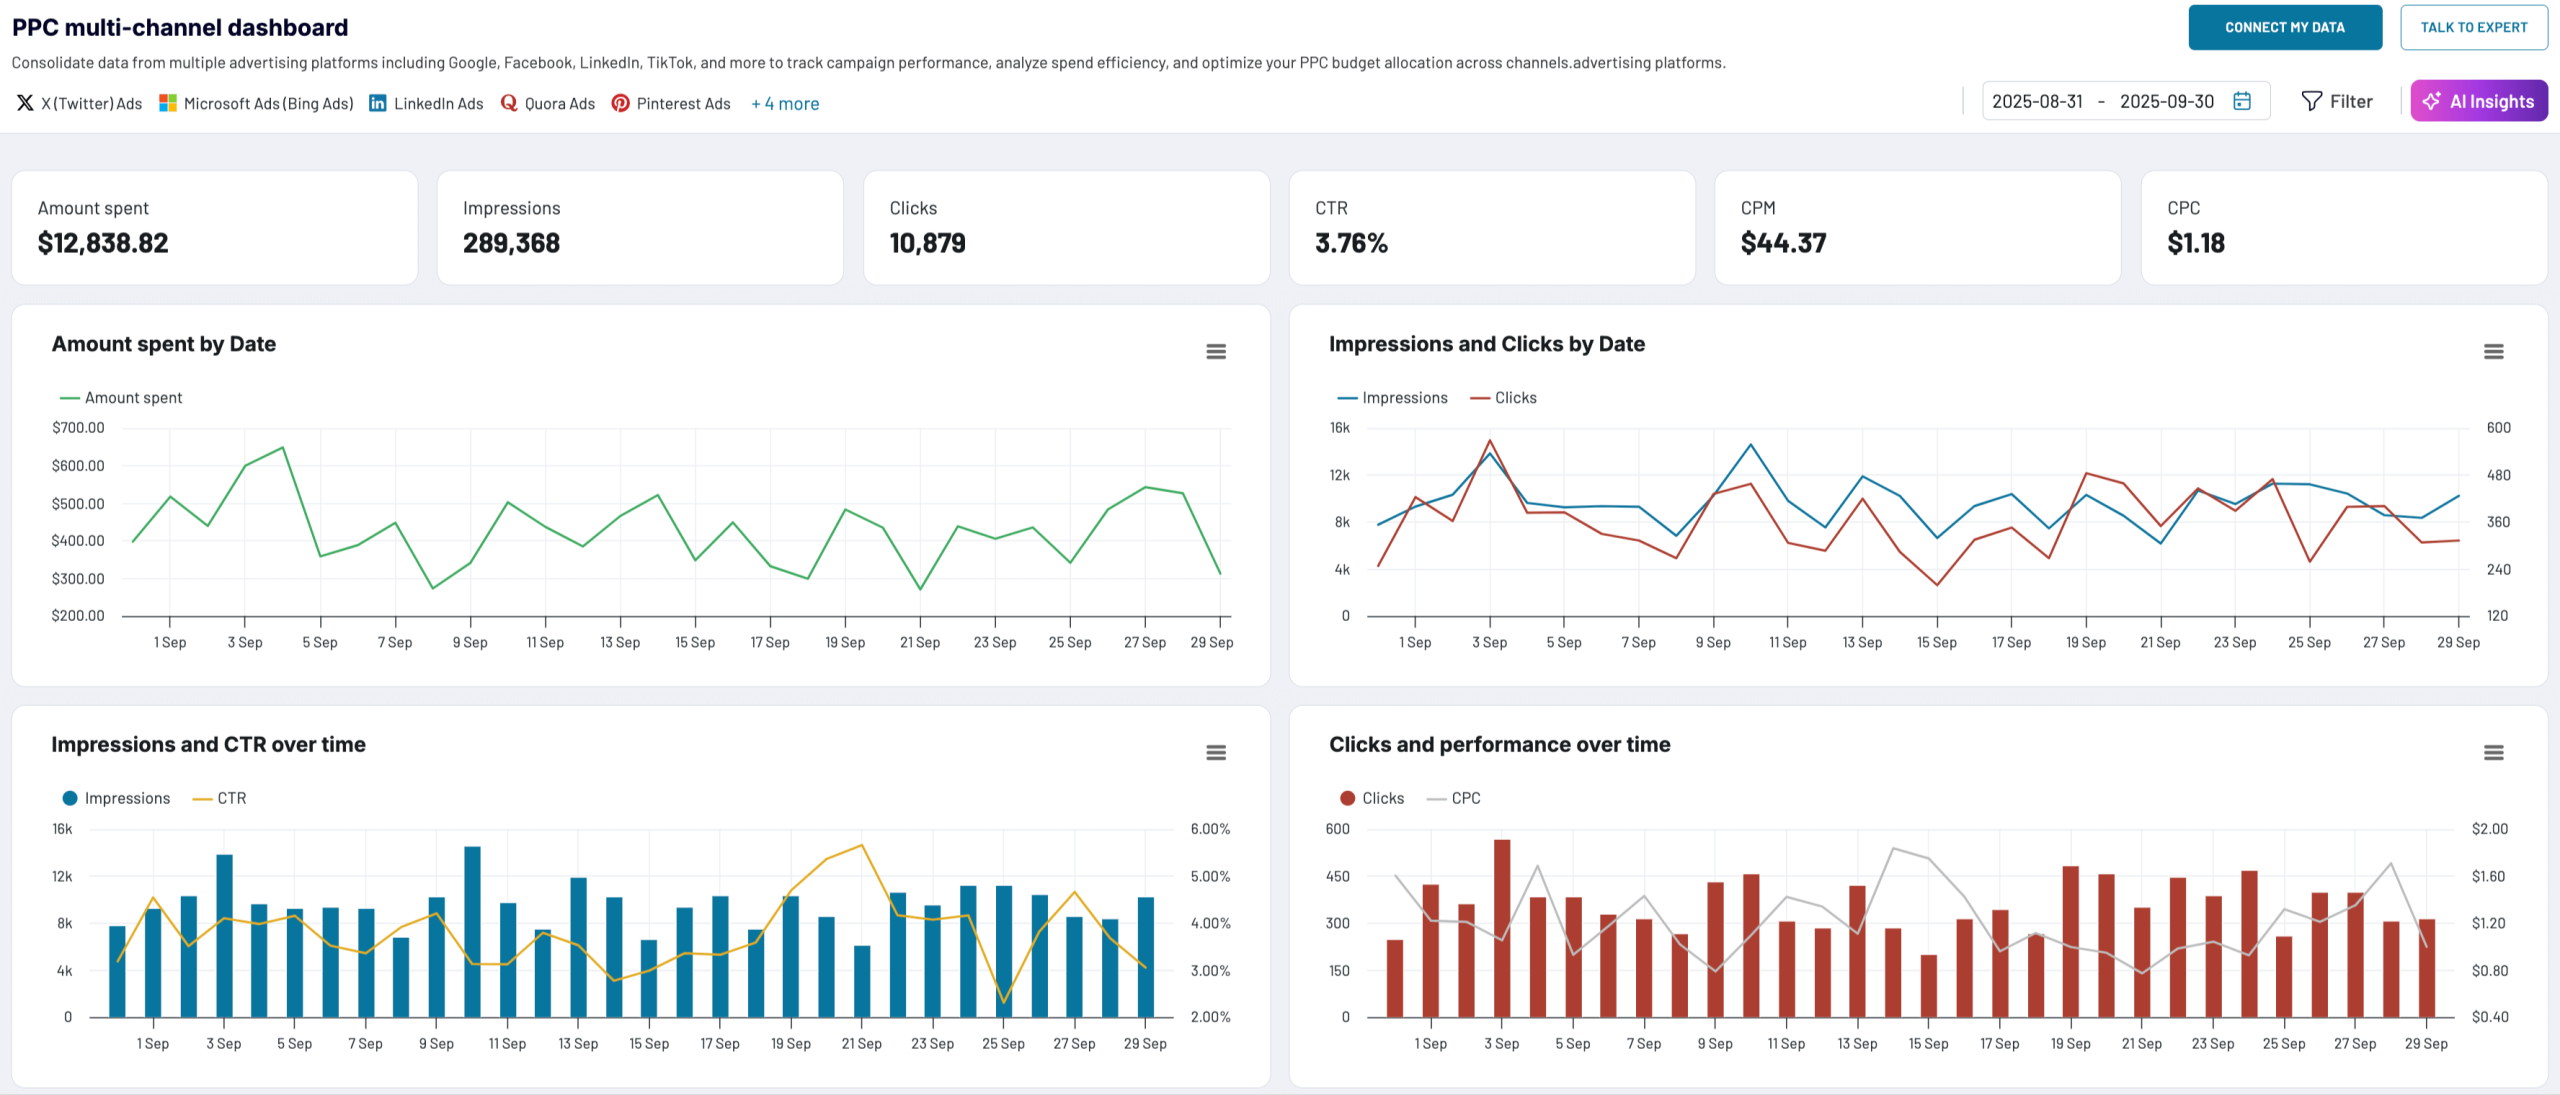
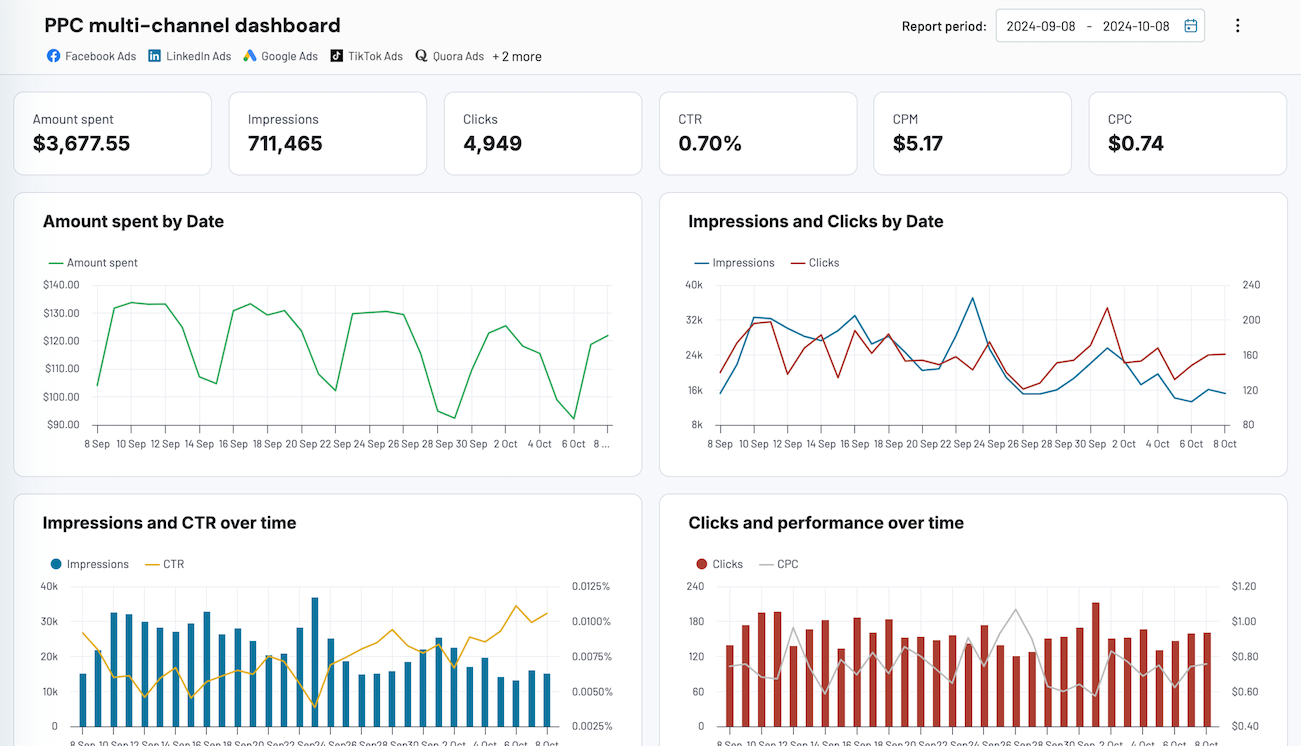
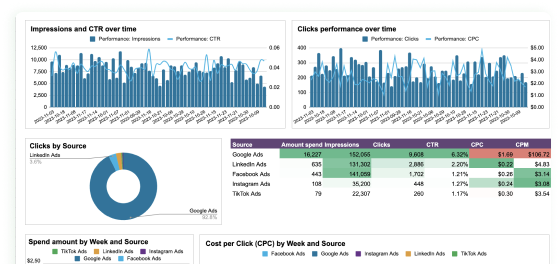
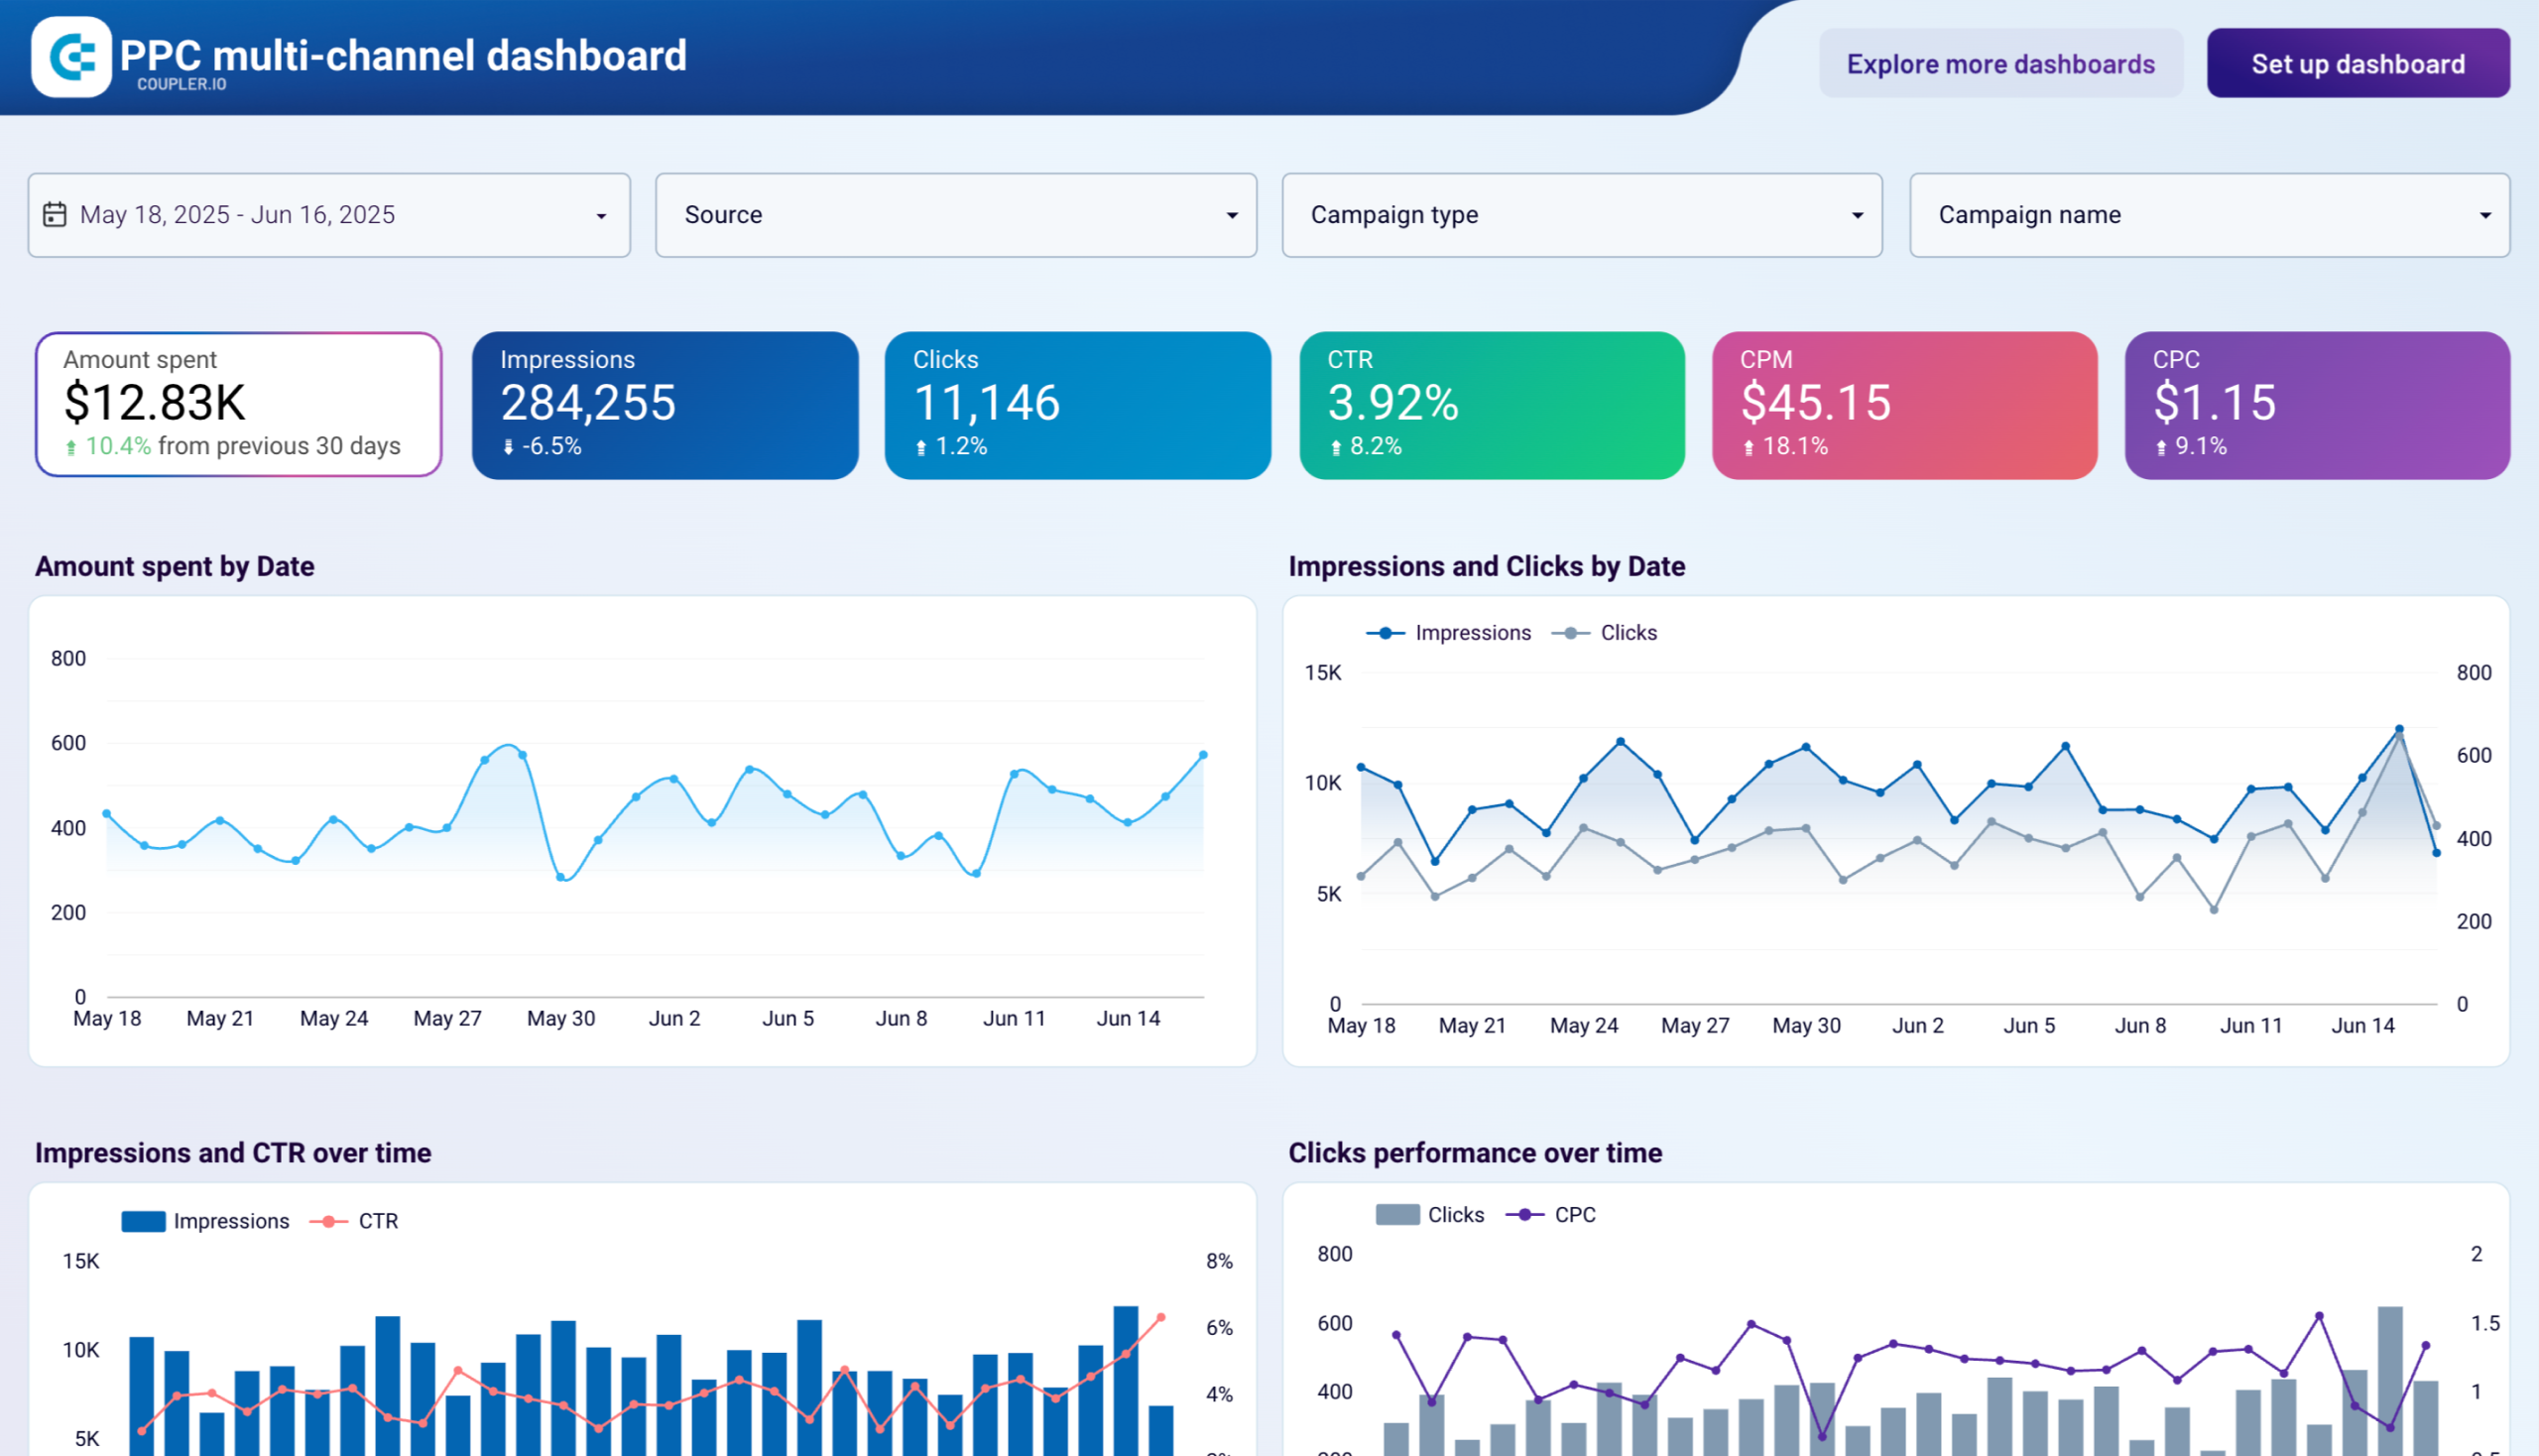
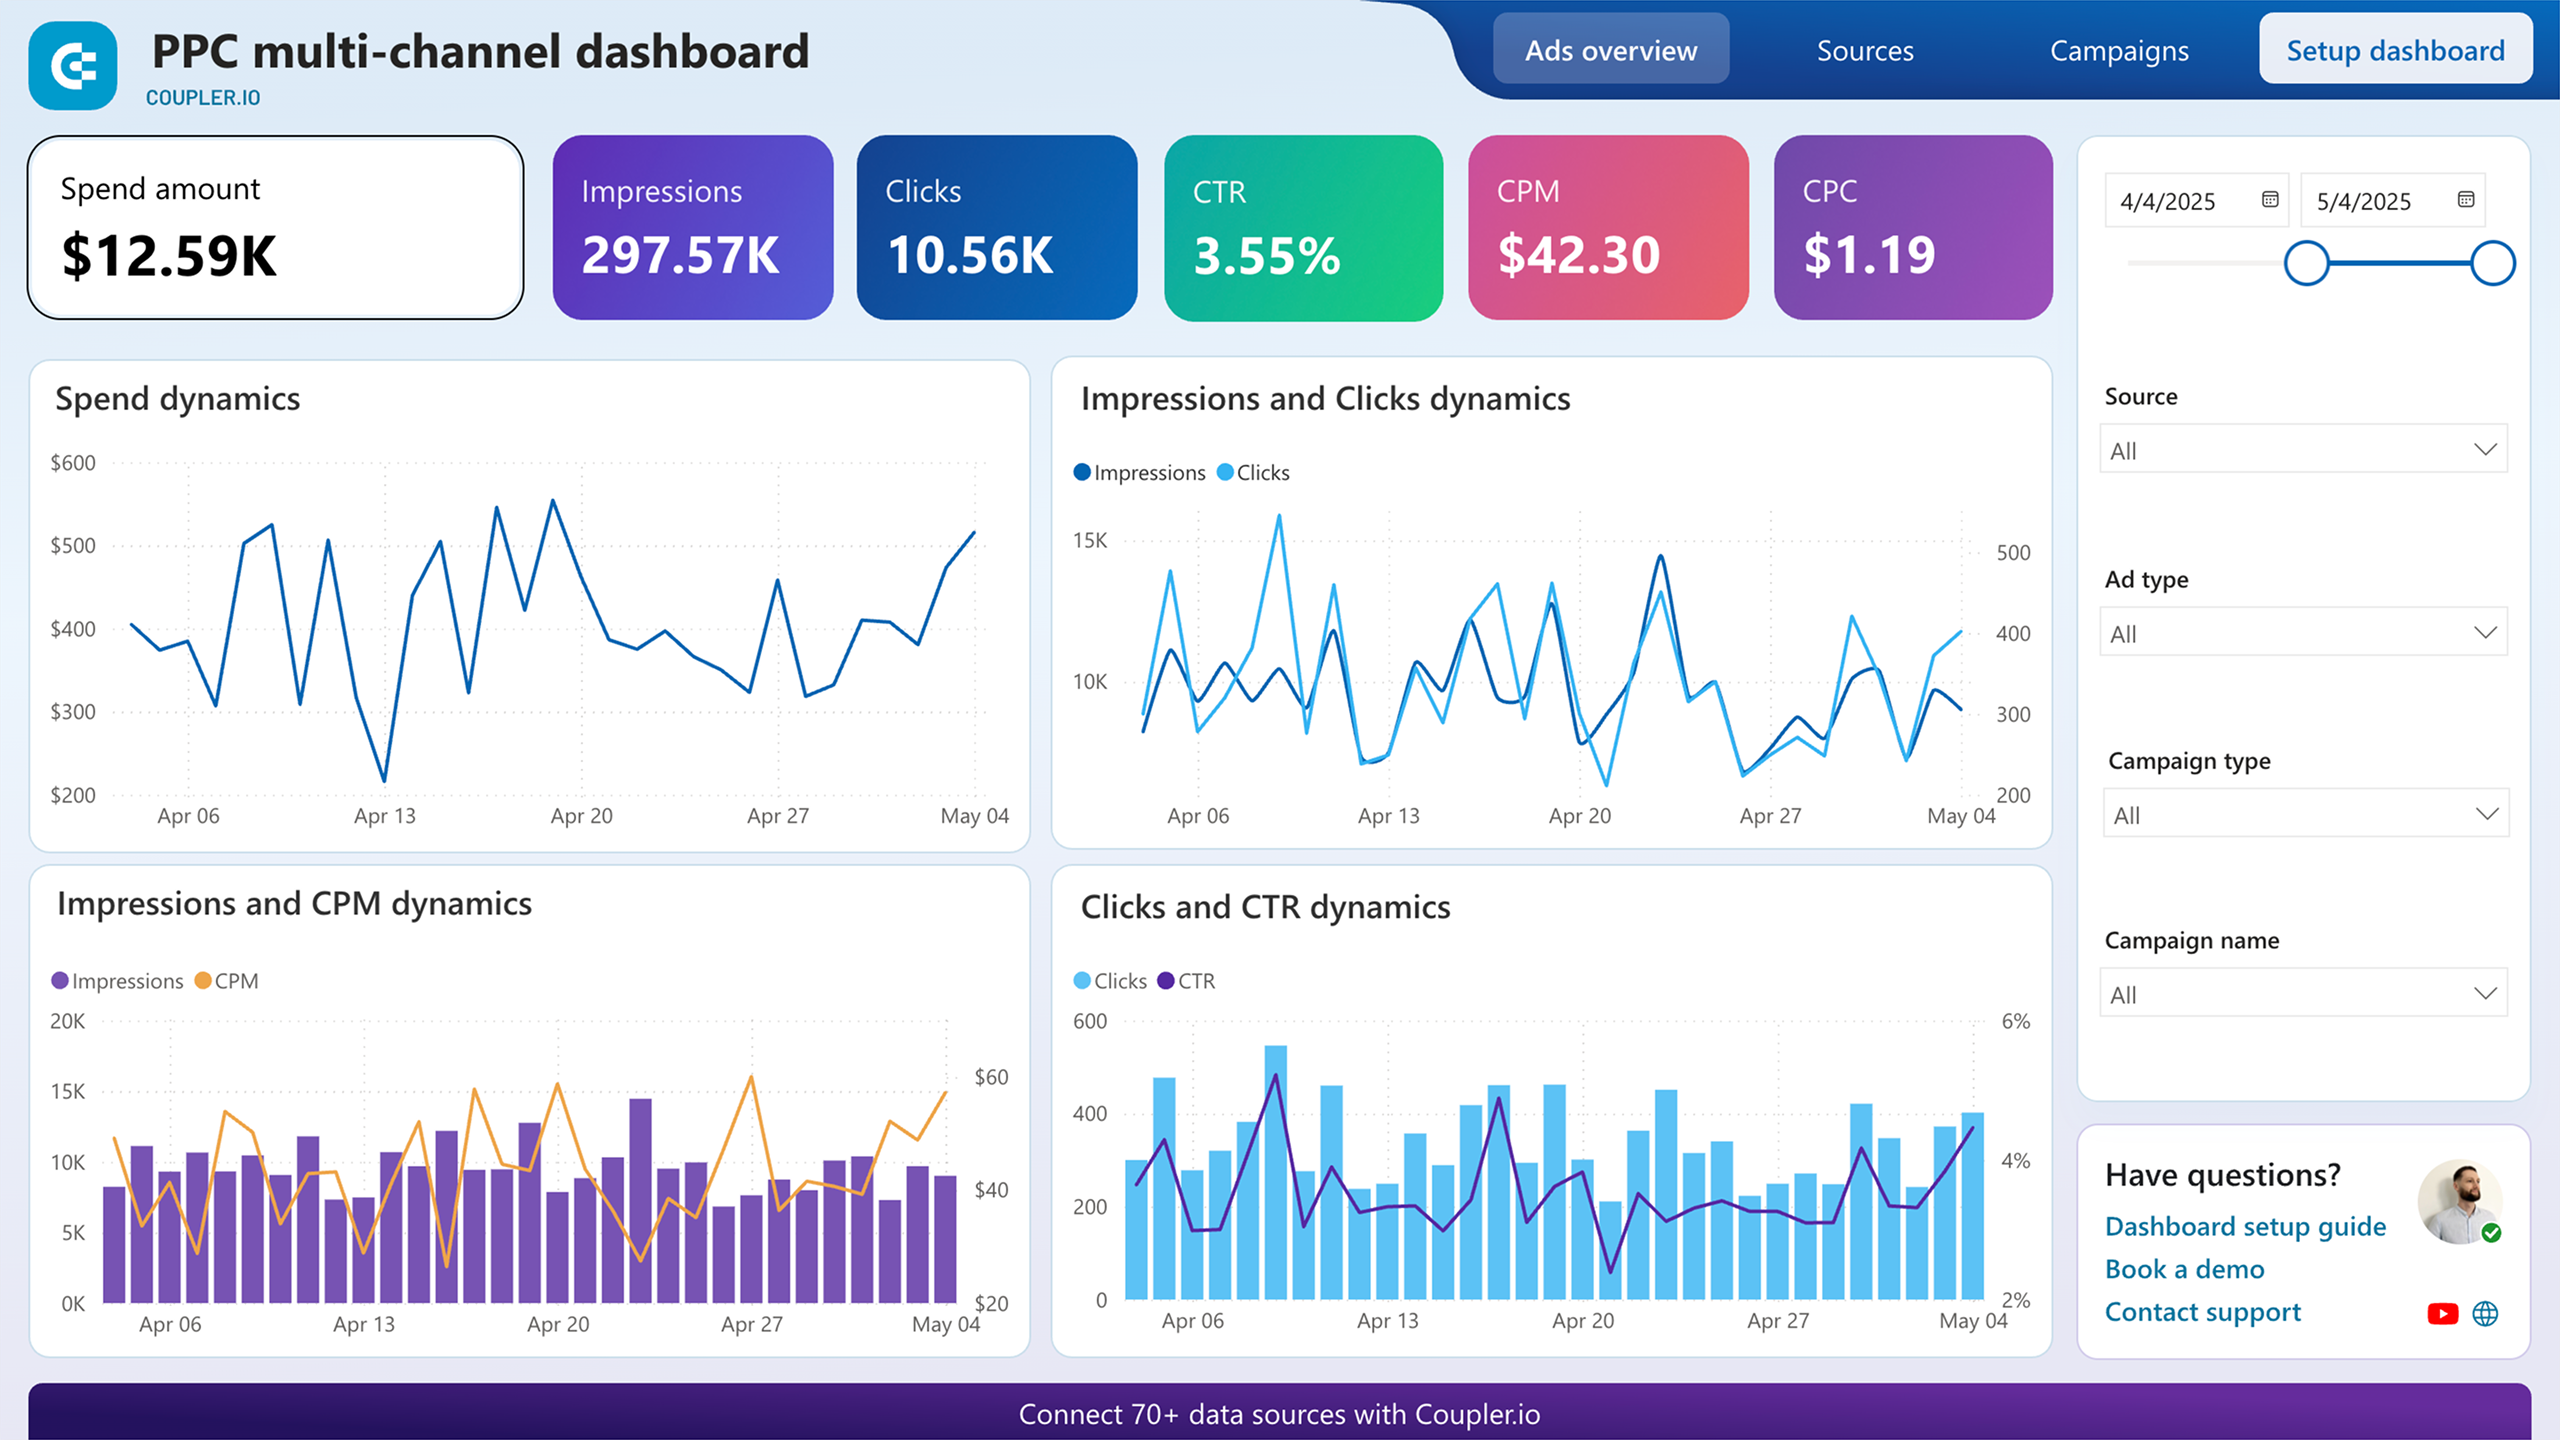
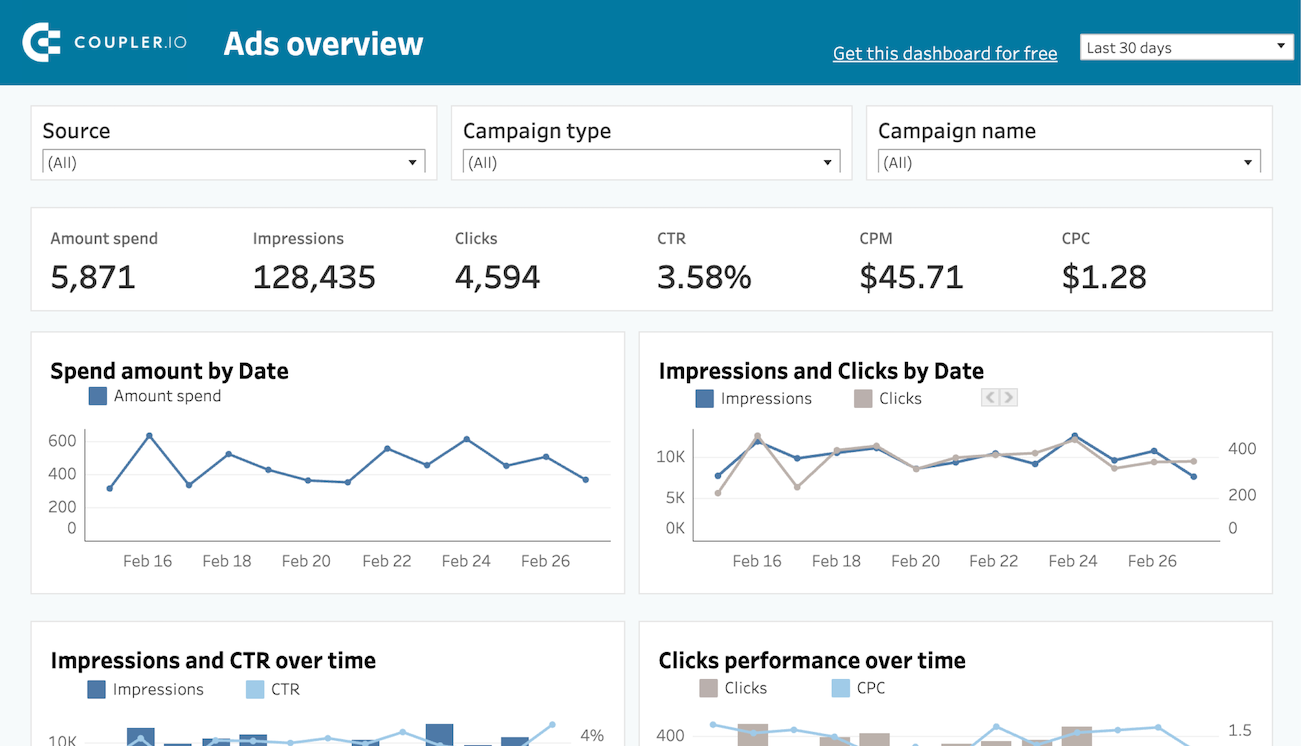
Cross-channel campaign reporting (dashboard template)
The core use case. You run ads on Google, Meta, LinkedIn, and maybe TikTok. Each platform has its own dashboard with its own metrics and its own definition of a “conversion.” Without ETL, comparing performance across channels means opening four tabs and mentally converting between different metric definitions.
With a marketing ETL pipeline, you pull spend, impressions, clicks, and conversions from all platforms into one destination, normalize the metrics, and build a single dashboard that answers: “Where is my budget producing the best results?“
Data sources: Google Ads, Meta Ads, LinkedIn Ads, TikTok Ads, etc.
Key transformations: Normalize campaign naming, standardize currency, calculate blended CPA and ROAS
Best for: Performance marketers, PPC managers, marketing directors reporting to leadership
How to set this up with Coupler.io: Use the PPC dashboard templates. Pick the ad platforms you run, connect them as sources, and Coupler.io pulls spend, clicks, impressions, and conversions into one place. The templates calculate blended CPA and ROAS automatically and display the results in Google Sheets, Looker Studio, or Power BI. Setup takes a couple of minutes, and the data refreshes on the schedule you set.


Track AI-driven traffic to your website (dataset template)
ChatGPT, Gemini, and Perplexity now send measurable traffic to websites, but GA4 does not make it easy to see which AI platforms contribute most to sessions, conversions, and revenue. The data is there, buried in session source reports, but extracting and structuring it takes manual work.
This is a good fit for a data set template. Coupler.io’s data set templates are pre-built transformation logic that takes raw source data and organizes it into analysis-ready tables. Instead of configuring every filter and aggregation yourself, you pick the template, connect your GA4 account, and the template structures the data for you.
The GA4 AI traffic data set template pulls session sources, users, key events, and purchase revenue, then rolls daily performance into weekly and monthly summaries. You can view results by property, by traffic source, or as totals in a separate overview. The output lands in your chosen destination (Google Sheets, Looker Studio, or another) and refreshes on your schedule.
Data source: Google Analytics 4
Key transformations: Filter AI-sourced traffic, aggregate daily data into weekly and monthly summaries by property and source, compile totals in a separate view
Best for: Digital marketers, AI marketing specialists, content teams tracking how AI platforms drive engagement and conversions
How to set this up with Coupler.io: Create a data flow using a GA4 AI traffic template, connect your GA4 account, and choose a destination. The template handles the transformation logic. Your data flow starts refreshing automatically, and you get a structured table you can freely sort, filter, and combine with records from other systems.
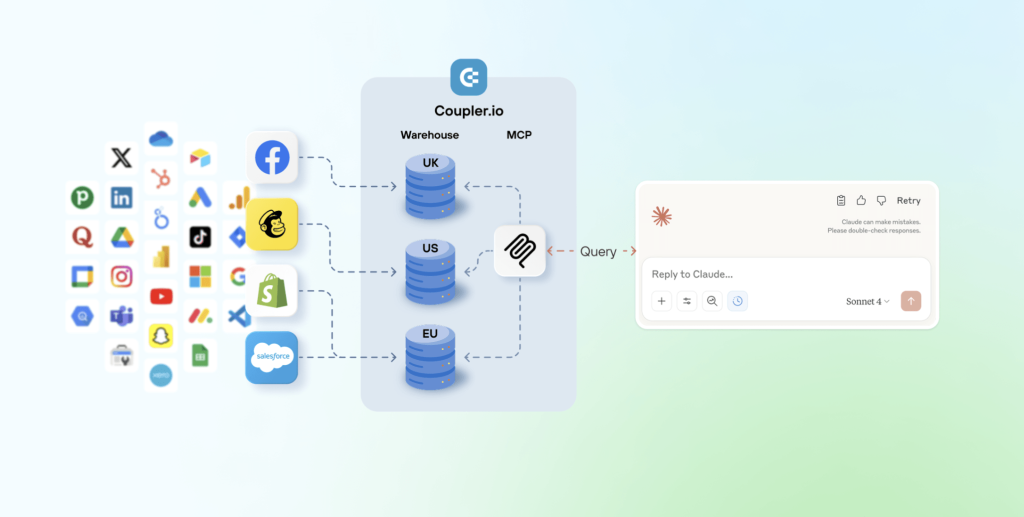
PPC analysis with Claude (AI integration via MCP)
Dashboards show you what happened. An AI tool helps you understand why and what to do next. When you manage campaigns across multiple ad platforms with significant daily spend, the questions you need answered change constantly: “Which creatives are showing fatigue?” on Monday, “Why did CPL spike on this campaign?” on Wednesday, “What is my forecasted end-of-month spend at current pace?” on Friday. Building a separate dashboard for each question is not practical.
By connecting your ad platform data to Claude through Coupler.io’s MCP integration, you can ask these questions in plain language and get answers grounded in your actual numbers. You type a question inside Claude, Claude generates a query, and Coupler.io’s Analytical Engine runs the actual calculation, validates the result, and returns verified numbers. Claude then presents the answer conversationally, with charts and tables where they help. The AI does not guess at the math. It interprets and explains what the Analytical Engine computed.
This workflow is especially useful for tasks that are hard to pre-build in a dashboard: rolling fatigue analysis on creatives, ad-hoc comparisons between test and control groups, CPL trend detection across a 3-day or 7-day window, or end-of-month forecasting based on current spend pace. You ask the question once, get the answer, and move on. One of Coupler.io’s clients uses this exact workflow. After connecting Meta Ads data to Claude through Coupler.io, he cut PPC reporting time by 60% and now runs daily performance health checks in under 10 minutes.
Data sources: Meta Ads, Google Ads, LinkedIn Ads, or any ad platform connected through Coupler.io
Key transformations: Normalize column headers across platforms, sync to Claude on a daily schedule
Best for: Performance marketers managing high ad spend, analysts who need to iterate on questions rather than build static reports
How to set this up with Coupler.io: Create a data flow from your ad platform to Claude as the destination. Coupler.io’s MCP integration sends Claude your data structure (column names, types, sample rows) so the model understands what is available. You then ask questions in plain language inside Claude, and the Analytical Engine handles the math.
Quick performance checks (AI Agent)
Sometimes you do not need a full report or a Claude project. You need a fast answer: “Why did CPA spike on Tuesday?” or “Which campaign had the most impressions this week?” That is what Coupler.io’s AI Agent is for.
AI Agent is a conversational analytics assistant built directly inside Coupler.io. It works with any active data flow, regardless of destination. You type a question in plain language, and get an instant, verified answer. The Analytical Engine handles the query and validation under the hood, so you get accurate numbers rather than AI guesses.
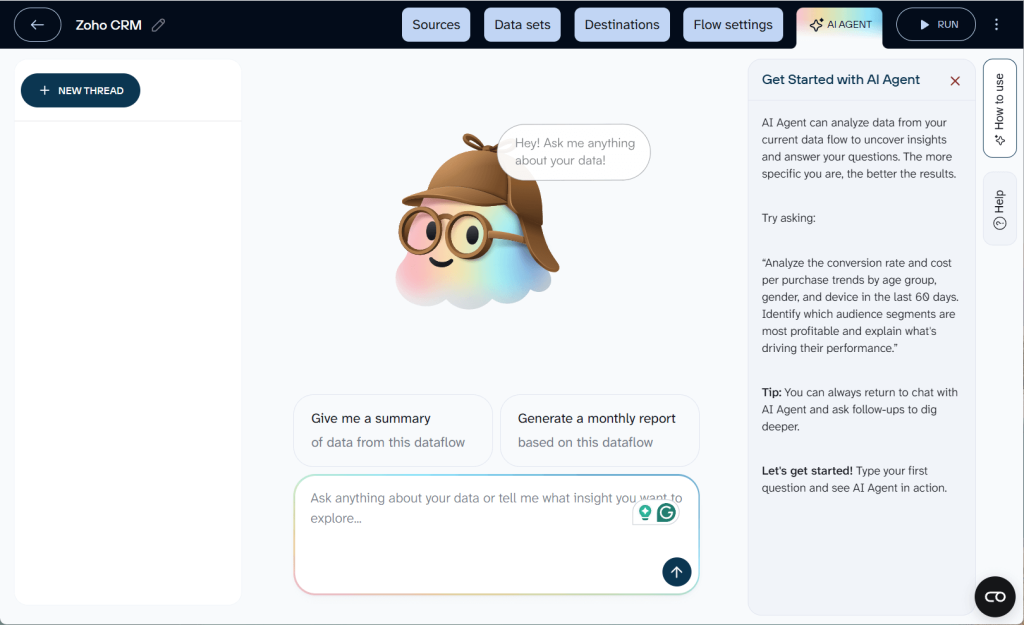
Say you run Facebook and Google Ads campaigns and your data flows refresh every morning. Before your 10 a.m. team standup, you open AI Agent and type: “Compare CPA across Facebook and Google campaigns for last week. Which campaigns got worse?” In seconds, you get a breakdown with the specific campaigns that saw CPA increases, how much they increased, and which ones stayed stable. No dashboard needed, no context switching to another tool.
Data sources: Any source connected through a Coupler.io data flow
Key transformations: Handled automatically by the Analytical Engine based on your question
Best for: Marketers who need quick answers during meetings, pre-call prep, or daily check-ins without building a dedicated report
How it works: Open any completed data flow in Coupler.io and click the AI Agent tab. Type your question. AI Agent translates it into a query, the Analytical Engine executes and validates the calculation, and you see the result in the chat. Each conversation is saved as a thread you can revisit later.
One platform for ETL pipelines and AI analytics
Try Coupler.io for freeHow to choose a marketing ETL tool
Not all ETL tools are built for the same audience. A tool designed for data engineers managing enterprise pipelines will look very different from one designed for a marketing team that needs a cross-channel dashboard by Friday. Here is what to evaluate:
Connector coverage
Count the sources you use today, then add the ones you will probably add in the next year. If your ETL tool does not have a connector for a platform, you are either building a custom integration or leaving that data out of your reports.
Check not just whether a connector exists, but how deep it goes. Some tools connect to Facebook Ads but only pull campaign-level data, not ad-level or creative-level metrics. If you need granular data for creative analysis, verify the connector supports it.
Transformation capabilities
Some tools only extract and load. They expect you to transform data elsewhere (in a warehouse with SQL, or in a BI tool). Others offer built-in transformations: filters, formulas, joins, aggregations, pivot tables.
For marketing teams without SQL skills, built-in transformations save significant time.
Destinations supported
Where does your data need to go? If your team lives in Google Sheets, make sure the tool supports it as a first-class destination, not an afterthought. If you are building toward a warehouse setup, check for BigQuery, Snowflake, or PostgreSQL support.
Also check whether the tool supports multiple destinations from a single pipeline. You might want the same dataset in both a Google Sheets dashboard for the marketing team and a BigQuery table for the data team.
Refresh frequency
How often can the tool pull new data? Daily is fine for weekly reporting. Hourly matters if you need near-real-time dashboards during a product launch or a high-spend campaign period.
Also check what the tool does when a refresh fails. Does it retry? Does it alert you? Does it fall back to the last successful data, or does it show a broken dashboard?
Handling of API changes
Marketing platforms change their APIs regularly. Meta, Google, and LinkedIn all push breaking changes at least a few times per year. When that happens, your ETL tool either handles it automatically (updating the connector before you even notice) or it breaks your pipeline until someone fixes it manually.
This is one of the biggest practical differences between marketing ETL tools and general-purpose ETL tools. Marketing-focused platforms like Coupler.io manage connector maintenance as part of the product.
Ease of use for non-technical teams
If only one person on your team can set up or modify pipelines, that person becomes a bottleneck. Look for tools where a marketing manager or analyst can create a new data flow without involving an engineer.
Pricing model
ETL tool pricing varies widely. Common models include per-row pricing, per-connector pricing, per-user pricing, and flat-rate plans based on features and refresh frequency.
Coupler.io’s pricing is based on the number of source accounts you connect, the destinations you use, and how often your data refreshes. The starting price is accessible for small teams, and the plan scales as your data needs grow.
Quick evaluation checklist
| Criterion | Questions to ask |
| Connectors | Does it cover my current sources? How granular is the data? |
| Transformations | Can I filter, join, and calculate without SQL? |
| Destinations | Does it support Google Sheets, my BI tool, and/or my warehouse? |
| Refresh frequency | Can it update hourly? Daily? What happens on failure? |
| API maintenance | Does the vendor handle connector updates, or is that my job? |
| Usability | Can my marketing team set up flows without engineering help? |
| Pricing | What drives the bill: rows, connectors, users, or accounts? |
| Templates | Does it offer ready-made dashboards I can start with? |
Why Coupler.io fits your ETL for marketing data
The earlier sections of this guide already show Coupler.io in action: 400+ connectors, a visual data flow builder, 210+ dashboard templates, and more. Here is what that looks like in practice for real teams.
What teams achieve with Coupler.io
The numbers below come from published case studies:
- ClaritySeed (consulting): Automated data flows from GA4 to Google Sheets. Their founder now delivers reports five hours earlier and saves over 40 hours per month on manual data work.
- SellThru (digital marketing agency): Reduced client onboarding from two weeks to two or three days while improving reporting accuracy to above 95%.
- United Way Northwest Indiana (nonprofit): Saved roughly 80 hours per month and cut reporting costs by about $20,000 per year using automated dashboard templates.
These outcomes are consistent with what the industry sees more broadly. Gartner estimates that poor data quality costs organizations an average of $12.9 million per year. A 2026 Truthset report found that 40% of every dollar spent in open CTV programmatic buying is wasted due to inaccurate identity and audience data. And a CaliberMind study found that 65.7% of marketers cite data integration as their top barrier to effective measurement.
ETL does not fix all of these problems, but it fixes the foundation: getting your data clean, consistent, and in one place so the analysis and decisions built on top of it are reliable. The teams above started with that foundation and turned it into measurable time and cost savings within weeks.
Automate marketing ETL pipelines with Coupler.io
Get started for freeFAQ
Do I need a data warehouse for marketing ETL?
No. Many marketing teams load data directly into Google Sheets, Excel, or a BI tool like Looker Studio or Power BI. A data warehouse (BigQuery, Snowflake) becomes useful when your data volume grows large, you need to run complex SQL queries, or you want to store raw data long-term for historical analysis. You can start without one and add a warehouse later.
Will AI replace ETL?
AI is changing how people analyze data, but it does not replace the need to collect and clean it first. You can ask Claude or ChatGPT to analyze your marketing performance, but the AI still needs structured, clean data as input. ETL is what prepares that input. What AI does change is the analysis layer: instead of building a dashboard for every question, you can ask an AI tool open-ended questions about your data. But the ETL pipeline underneath is still doing the heavy lifting of extraction, transformation, and loading.
How is marketing ETL different from regular ETL?
Regular ETL tools are built for general-purpose data integration: databases, ERP systems, file systems. Marketing ETL tools are built specifically for marketing data sources like ad platforms and analytics tools. The practical difference is connector maintenance (marketing APIs change frequently, and marketing ETL tools handle those changes for you), built-in marketing metrics (ROAS, CPA, CTR), and usability for non-technical users.
What is the difference between ETL and ELT?
In ETL, data is transformed before loading into the destination. In ELT, raw data is loaded first, then transformed inside the destination (usually a cloud data warehouse). ELT is better for teams with SQL skills and large data volumes. ETL (especially marketing ETL) is better for teams that want cleaned data delivered directly to spreadsheets or BI tools without writing code.
How much does a marketing ETL tool cost?
Pricing varies by tool and scales with usage. Factors that affect cost include the number of data sources connected, the destination types, refresh frequency, and data volume. Coupler.io starts at an accessible price point for small teams and scales as your needs grow. The cost should be weighed against the time saved: if manual reporting takes your team 10+ hours per week, even a modest ETL subscription pays for itself quickly.