You want a marketing dashboard in Claude Data, but your numbers live in Google Ads, Meta Ads, Google Analytics 4, and your CRM. Claude Data works best when it can query everything in one place, and setting up a data warehouse for one dashboard is more work than most teams want to take on.
You can skip the warehouse. Describe the data you need and sign in to your accounts, and Coupler AI brings everything into one Coupler.io dataset. From there, Claude Data builds the dashboard in a couple of minutes.
Key takeaways
- You can build a Claude Data marketing dashboard without a data warehouse. Coupler.io brings data from your apps into one dataset.
- Coupler.io’s AI Agent connects your data sources, blends the data, and sets how your metrics are calculated, based on one prompt.
- Claude Data turns that dataset into a dashboard you can edit by chat. Click any number to see how it was worked out.
- Coupler.io refreshes the data on a schedule, and live sharing lets colleagues see the dashboard without connecting their own accounts.
Why Claude Data usually needs a warehouse
Claude Data builds charts from data it can query through a connector. A warehouse like BigQuery or Snowflake puts everything in one place, but most marketing teams don’t have one.
Without it, your numbers sit in separate apps that don’t always agree. Google Ads and Meta Ads, for example, can count conversions differently, so side by side they can give you a CPA or ROAS that doesn’t add up.
Coupler.io is a reporting automation platform for business teams. It automatically collects and blends data from 400+ apps and keeps it up to date for your reports and AI. For this workflow, that gives Claude Data one dataset to query without you building or managing a warehouse.
What your Claude Data marketing dashboard will show
In this guide, I build the example with Google Ads, Meta Ads, Google Analytics 4, and HubSpot, and the same workflow works with other apps too. If your reporting lives in Data Studio, Power BI, or Google Sheets instead, here are other ways to build marketing dashboards with Claude.
By the end, you’ll have one dashboard that answers the question every marketing team hears on a Monday: which channel brings in key events and revenue for the least ad spend?
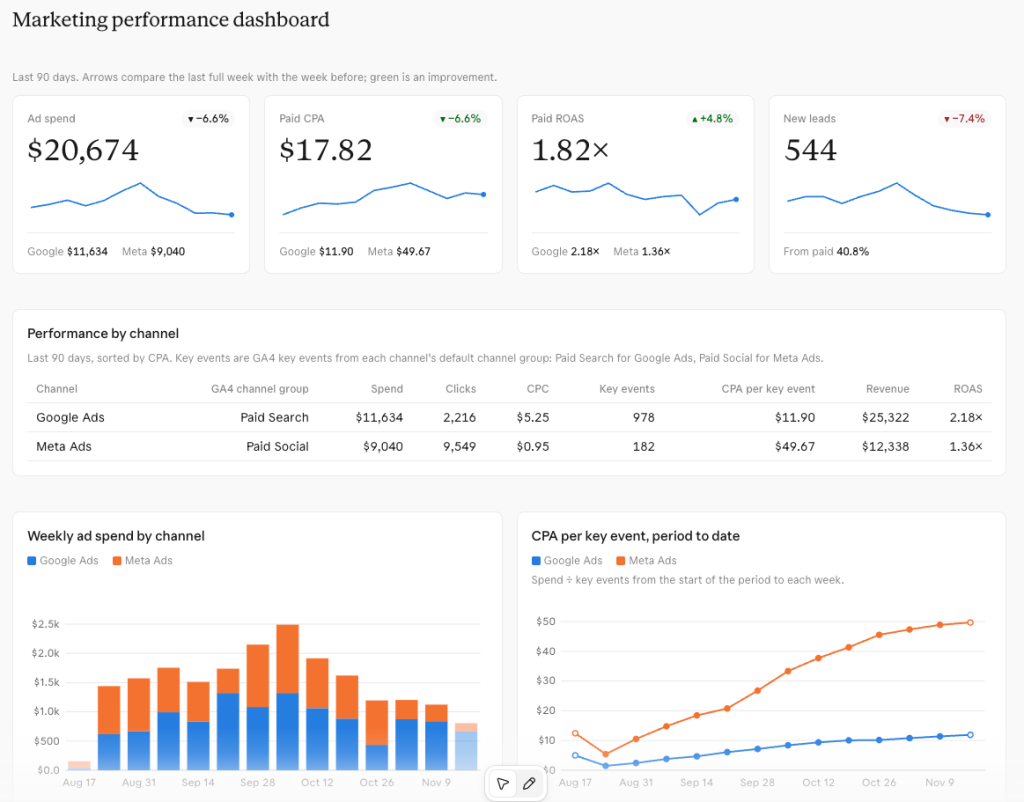
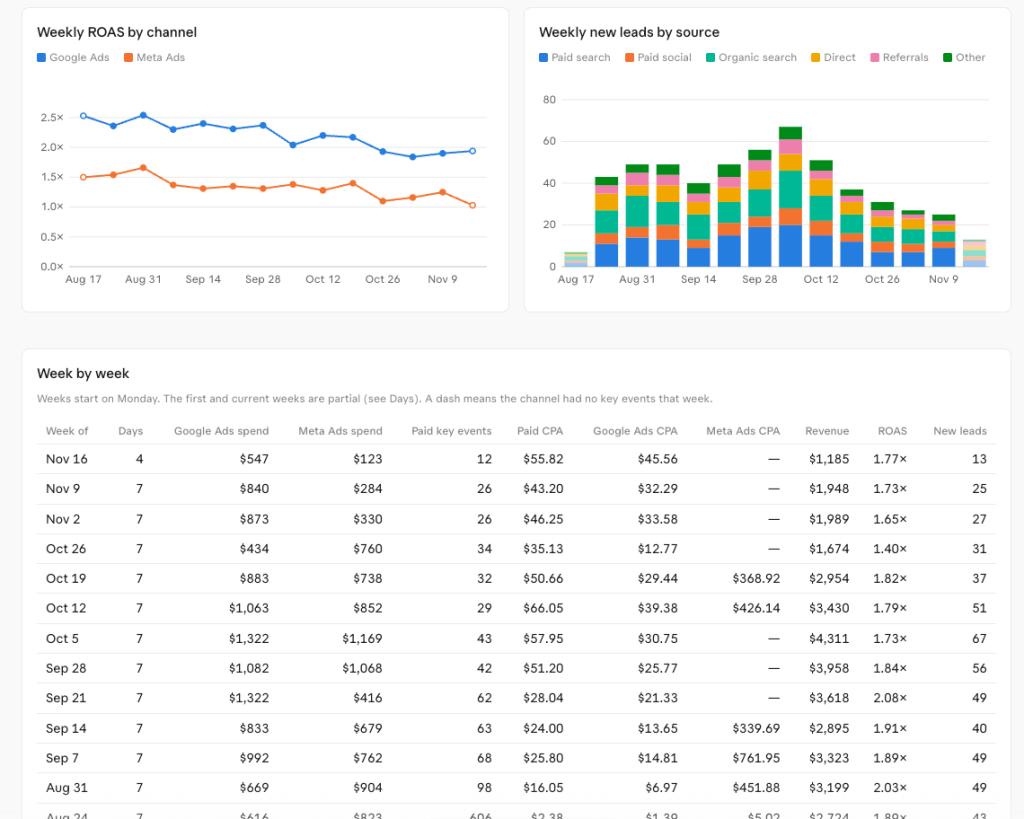
It covers the last 90 days and shows:
- Scorecards for ad spend, paid CPA, paid ROAS, and new leads, each compared with the week before
- A table by channel with spend, clicks, CPC, key events, CPA, revenue, and ROAS for Google Ads and Meta Ads
- Charts of ad spend, CPA, and ROAS by channel over time
- Weekly new leads by source, from HubSpot
- A week-by-week table of spend, CPA, revenue, ROAS, and new leads

Bring your marketing data into Claude Data without a warehouse
Start free trialWhat you need before you start
You don’t have to set anything up in Coupler.io yet. Just have these ready:
- A paid Claude plan. Pro, Max, Ultra, Team, or Enterprise all work. Dashboards count toward your plan’s usage limits.
- A Coupler.io account. Start the free 7-day trial to get full access while you build.
- Logins for the apps you want on the dashboard. You’ll sign in to each one once in Coupler.io. Claude can’t do this part for you.
- An organization Owner, if you’re on a Team or Enterprise plan. They add the Coupler.io connector for your organization. On Enterprise, they also need to turn on live sharing, which Team plans have on by default.
Step 1. Blend your marketing data with Coupler.io’s AI Agent
Coupler.io’s AI Agent builds the dataset for you, and it’s on the first screen you see after you sign up. Describe the data you want in plain language. The agent guides you through connecting each account. Then it builds a data flow that brings the numbers together and calculates metrics like CPA and ROAS the way you define them.
Prefer to set this up in Claude? Connect the Coupler.io connector to Claude (see Step 2), then send the prompt below in a Claude chat. Claude builds the same data flow in your Coupler.io account.
Your metrics may differ from mine. What matters is telling the agent which app each number comes from and how to calculate it. This is the prompt I used for the example dashboard:
Help me build a marketing performance dashboard for the last 90 days.

Sources (help me connect each one):
- Google Ads and Meta Ads: spend in account currency, clicks, conversions
- GA4: sessions, key events, and revenue by session default channel group
- HubSpot: new leads by original source

Dataset:
- Name it "Marketing performance by channel"
- Keep each app's numbers on their own rows, by date and channel

Data context:
- CPA = ad spend ÷ GA4 key events
- ROAS = GA4 revenue ÷ ad spend
- Calculate both from totals and match by channel: Google Ads to Paid Search, Meta Ads to Paid Social

Refresh the dataset daily and send it to Claude.
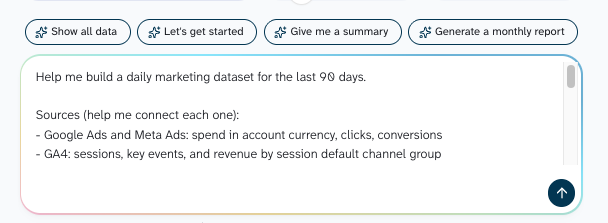
The Data context lines set how CPA and ROAS are calculated: spend from the ad platforms, key events and revenue from Google Analytics 4, and everything from totals so daily swings don’t skew the result. Channel matching is approximate, since tagging and attribution can shift some traffic.
Using different data sources? Keep the same structure and change the lines under Sources. Then rewrite the CPA and ROAS formulas with the conversions and revenue that matter to your business.
An online store, for example, might define ROAS as Shopify revenue ÷ ad spend. And if not every Google Analytics 4 key event is a lead or sale for you, name the one that is. If your apps report by different breakdowns, like campaign instead of channel, ask the agent how to match them.
When the agent finishes, you’ll have a data flow like this one, with a daily refresh and Claude as the destination.
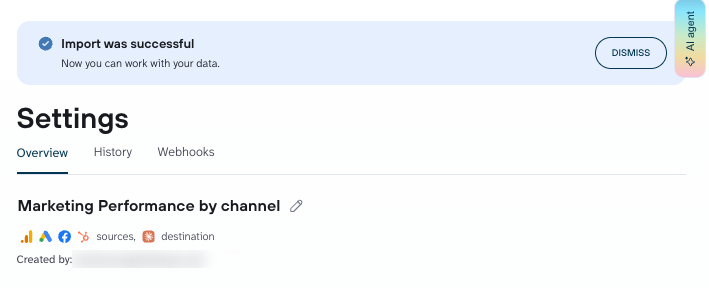
Check that every app is connected and the channel names match before you move on.
Step 2. Connect Coupler.io to Claude
Claude Data reads your dataset through the Coupler.io Claude integration. Add it once:
- Open the Coupler.io connector in Claude’s directory and click Connect.
- Sign in with the Coupler.io account you created in Step 1.
- To check that it worked, ask Claude: “List my Coupler.io datasets.” Your “Marketing performance by channel” dataset should be in the list.
Step 3. Build the dashboard in Claude Data
In Claude, open Artifacts, choose Data, and start with a business question. That gives Claude Data the context to pick metrics and charts that belong together. Name your dataset so Claude knows where to look:
Using my Coupler.io connector, open my "Marketing performance by channel" dataset. Which channel brings in key events at the lowest CPA, and how have spend, CPA, ROAS, and new leads changed week by week over the last 90 days?
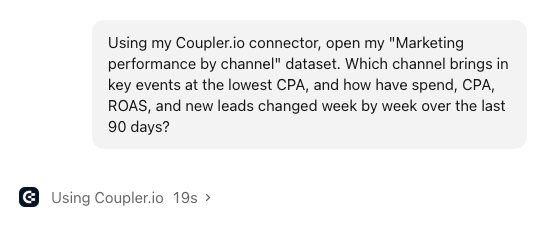
Claude Data may ask a few quick questions first, such as which color theme to use, and you can answer or skip them. It will also ask for permission to use your connectors. Allow both Claude Data and Coupler.io, or the dashboard can’t load your data.
Claude Data picks the charts, writes a query for each one, and builds the dashboard.
Treat the first version as a draft. To change anything:
- Ask in the chat, for example “Add a date filter so I can switch between the last 7, 30, and 90 days” or “Highlight any week where CPA rose more than 20%.”
- Click a title or caption to edit it directly.
- Click any number to see how it was worked out: the formula, the queries behind it, and when the data was last refreshed.
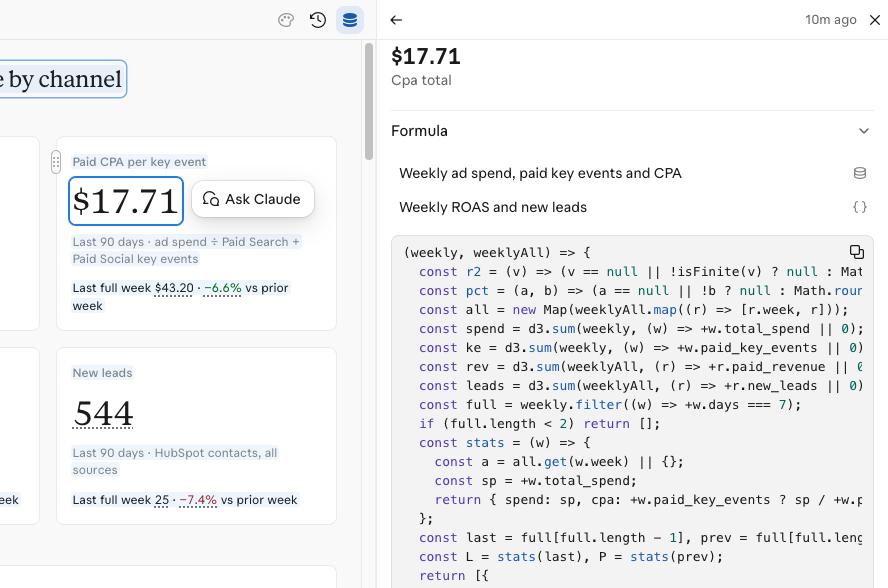
Before you share the dashboard, check a few key numbers. Click each one to see its formula and query, and compare the result with the same date range in the source app. If something looks off, ask Claude to look into it.
Optional: want your team to see which numbers are approved? Coupler.io already sets how metrics like CPA are calculated. Certifying the query behind a chart goes one step further: it marks that query as your team’s approved version, so Claude Data reuses it in new dashboards and shows a certified badge on its charts. On Enterprise, an organization Owner has to turn on certified queries first.
When you share a dashboard, each colleague needs their own access to its data sources. Without the Coupler.io connector, they’d see empty charts. Live sharing fixes that by running the dashboard’s queries with your access. It’s still in beta, so some labels may change.
Before you turn on live sharing: everyone you share with sees results run with your access. Share only with people who should see that data.
- Click the database icon at the top of the dashboard to open Sources. Next to Coupler.io, open the menu and choose Your access.
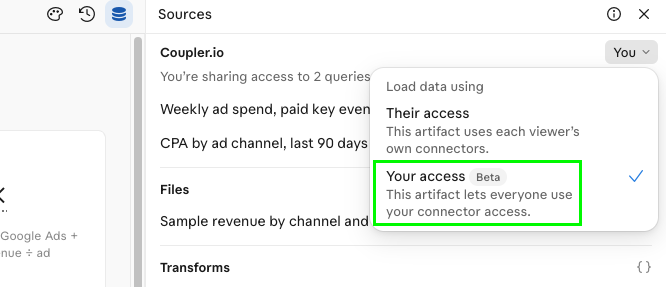
- Click Share, then invite colleagues or set access to everyone in your organization.
Want to show the dashboard to a client or an agency partner? You can share it outside your organization if an organization Owner allows it.
How to keep your Claude Data dashboard up to date
Your dashboard updates in two stages:
- Coupler.io refreshes the dataset. It pulls new numbers from your apps on your schedule. In this example, that’s once a day.
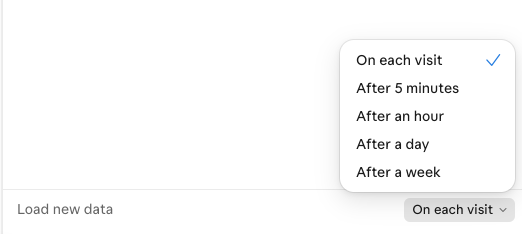
- Claude Data loads the dataset. By default, it checks for new results each time someone opens the dashboard. To load less often, change Load new data at the bottom of the Sources panel to every 5 minutes, hour, day, or week. In between, it reuses saved results.
Loading more often in Claude Data doesn’t make Coupler.io pull from your apps more often. For fresher source data, change the data flow’s schedule in Coupler.io.
Need the latest numbers right now? Use the refresh button in the top-left corner of the dashboard.
More marketing dashboards you can build in Claude Data
Each prompt below covers both parts: how to set up the data in Coupler.io and what the dashboard should show. Send one in Claude Data with the Coupler.io connector added, and swap in your own apps and metrics.
Paid ads across platforms
Using my Coupler.io connector, build a dashboard comparing my Google Ads, Meta Ads, and LinkedIn Ads for the last 30 days.

Set up the data first, in Coupler.io:
- One data flow named "Paid ads daily" with Google Ads, Meta Ads, and LinkedIn Ads as sources
- Blend them into one dataset with these columns: date, platform, campaign, spend, clicks, conversions
- Refresh it daily

Dashboard:
- Spend, CPC, and cost per conversion by platform
- A weekly trend showing which platform's costs are rising fastest
Website traffic and conversions
Using my Coupler.io connector, build a website traffic dashboard from GA4 for the last 90 days.

Set up the data first, in Coupler.io:
- One data flow named "Website traffic daily" with GA4 as the source
- Columns: date, session default channel group, sessions, key events, revenue
- Refresh it daily

Dashboard:
- Sessions, key events, and conversion rate by channel
- A week-by-week trend for each channel
Store sales and ROAS
Using my Coupler.io connector, build a weekly ROAS dashboard for my Shopify store, Google Ads, and Meta Ads for the last 90 days.

Set up the data first, in Coupler.io:
- One data flow named "Store sales and ad spend daily" with Shopify, Google Ads, and Meta Ads as sources
- Blend them into one dataset with these columns: date, source, orders, revenue, ad spend
- Calculate ROAS as Shopify revenue ÷ total ad spend, from totals
- Refresh it daily

Dashboard:
- Weekly revenue, orders, ad spend, and ROAS
- The weeks that brought in the most revenue per dollar of ad spend
If the dashboard isn’t quite right, change the prompt and send it again, for example by adding a column, adjusting the date range, or redefining a metric. Set the refresh schedule to match how often your team checks the numbers.
Common Claude Data issues and quick fixes
Most snags come from a setting, not the data.
| If you see this | Do this |
|---|---|
| Coupler.io isn’t in your connector list | On a Team or Enterprise plan, ask an organization Owner to add it |
| Claude can’t find your dataset | Check that you connected Claude with the same Coupler.io account you used to build the data flow |
| A colleague sees empty charts | Turn on live sharing for Coupler.io in the Sources panel. They’ll see results run with your access, so share only with people who should see that data |
| The numbers look out of date | Click the refresh button, then check the data flow’s schedule in Coupler.io |
| A metric looks too good to be true | Click the number and check its formula. If it uses the wrong figures, ask Claude to fix it |
| Ad spend doesn’t match the source app | Check the date range, account currency, and time zone. If it still differs, ask Claude to check the data flow through the Coupler.io connector |
| A channel is missing from the dashboard | Check that the dataset includes it and that its name is matched the same way across your apps, for example Meta Ads to Paid Social |
| You can’t share the dashboard with a client | Ask an organization Owner whether sharing outside your organization is turned on |
Try Claude Data on your own marketing numbers
You now have a marketing dashboard that brings your ad, website, and lead data together. You can check channel performance, spot rising acquisition costs, and ask Claude to change the dashboard as your reporting needs change. Weighing this against a BI tool or a client-reporting platform? Compare the main marketing reporting tools first.
Start with Coupler.io’s free 7-day trial. After that, plans start at $24/month, billed annually.
Get a Claude Data marketing dashboard with Coupler.io
Start free trialFAQ
Does Claude get direct access to my ad accounts?
No. Claude works with your data through Coupler.io and doesn’t connect to your apps directly. Coupler.io is SOC 2 Type II and ISO 27001 certified, and GDPR, HIPAA, and DORA compliant. Details are on its security page.
Can I ask Claude about this data outside a dashboard?
Yes. The Coupler.io connector also works in regular Claude chats on the web, desktop app, and Cowork. You can ask a quick question about last week’s spend without building anything.
How do I add another data source to the dataset later?
Ask Claude. With the Coupler.io connector, Claude can add the data source to your data flow, and then Claude Data can add the new numbers to your dashboard. You’ll still sign in to the new source once in Coupler.io.
Does this work with AI tools other than Claude?
Yes. Coupler.io also connects to ChatGPT, Gemini, Copilot, Cursor, and Perplexity, so the same dataset can feed whichever AI tool your team uses. You can also point an app builder at it and get a custom web dashboard out of Lovable.