QuickBooks captures everything about your business – every sale, expense, invoice, and payment. But that data becomes truly powerful when you can access it outside QuickBooks: in spreadsheets for analysis, dashboards for visualization, or AI tools for instant insights.
The challenge? Manual exports are time-consuming and limited. The solution? Automation that delivers your QuickBooks data wherever you need it, updated on your schedule. Companies like DE-YAN have transformed their financial operations by automating QuickBooks exports with Coupler.io, saving up to 15 hours per day and achieving real-time financial visibility. Learn how you can implement such automation and explore other ways to export QuickBooks data.
How to export data from QuickBooks Online with Coupler.io
Coupler.io is a data integration platform to set up finance automation by scheduling exports of data entities and reports from QuickBooks Online. However, it’s not only about exporting QuickBooks data and loading it into spreadsheets or data warehouses. Coupler.io also provides solutions to:
- Organize data using filters, column management, data blending, etc.
- Get analysis-ready QuickBooks data sets using templates
- Visualize financial information using dashboards
- Analyze your QuickBooks data with AI
It takes three simple steps to create a data flow from QuickBooks to your desired destination.
Step 1. Collect data
To get started, you can either create a Coupler.io account and set up a new QuickBooks data flow from scratch.
Or select the destination for your data in the form below and click Proceed. In both cases, you’ll be offered to create a Coupler.io account for free without any payment information required.
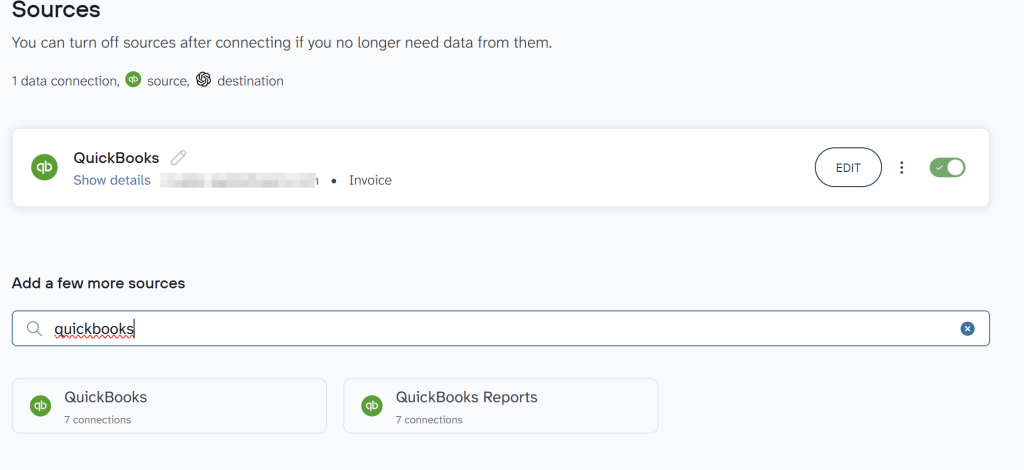
Note: In addition to raw data, you can export specific QuickBooks reports by selecting the source labeled QuickBooks Reports instead of just QuickBooks.
Then, connect your QuickBooks account and specify what data you’d like to export: Account, Invoice, Payment, and many more.
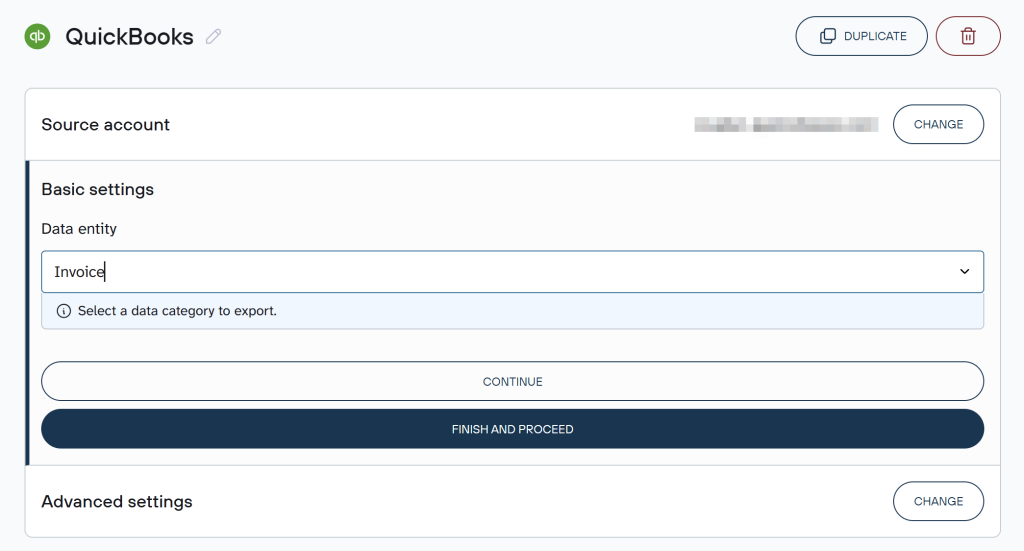
If you need to fetch more than one data entity, simply add QuickBooks as an extra source and follow the same steps. Once you’re done with your source settings, proceed to the next step.
Step 2. Organize data (OPTIONAL)
At the next step, you can optionally organize and adjust the data to make it analysis-ready:
- Rename, rearrange, or hide columns.
- Sort data in ascending or descending order.
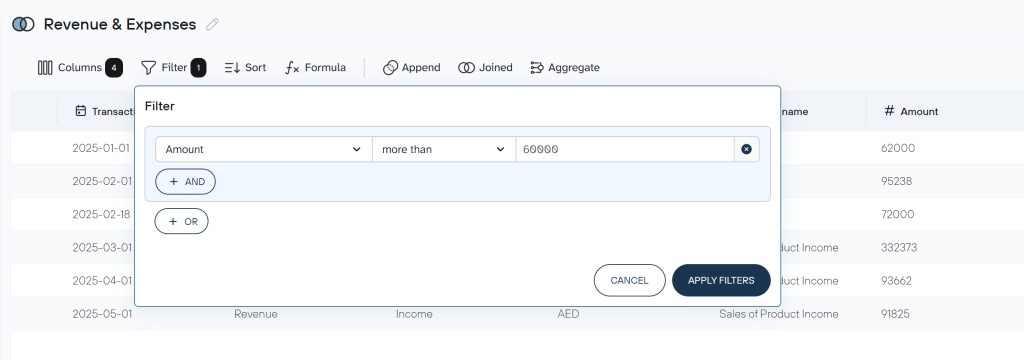
- Filter data to extract it based on required criteria. For instance, you can narrow it down by date, as shown in the example below.
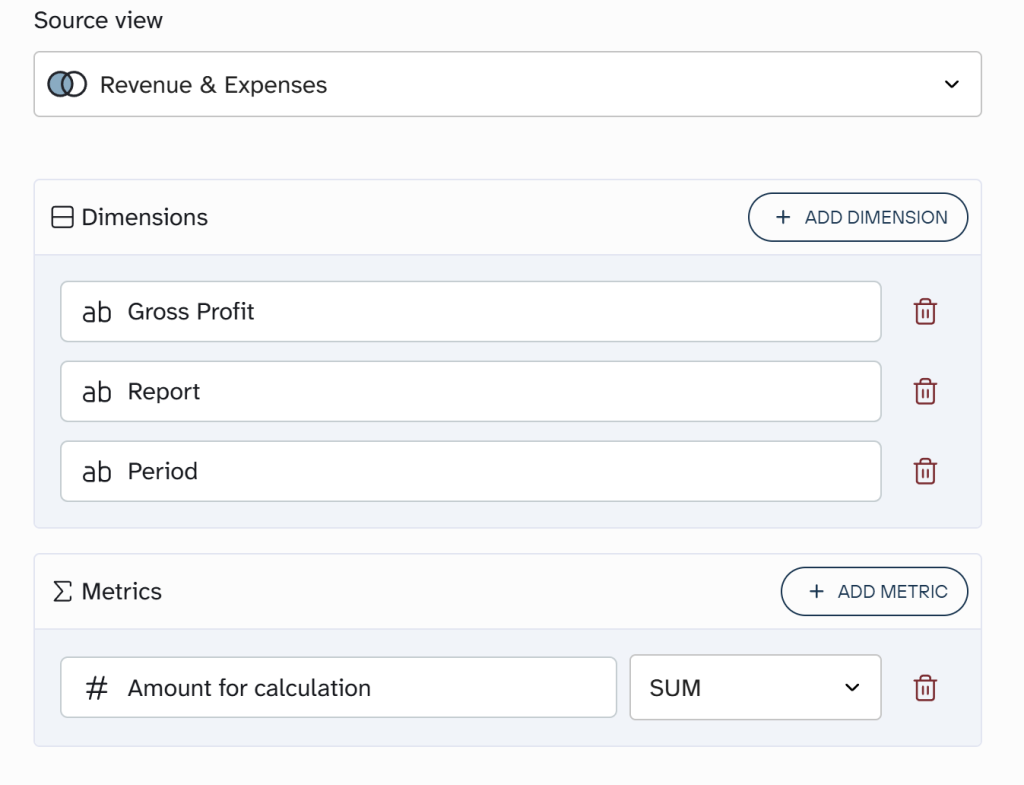
- Aggregate data using operations like sum, avg., count, min., or max. For example, you can sum up the payment amounts:
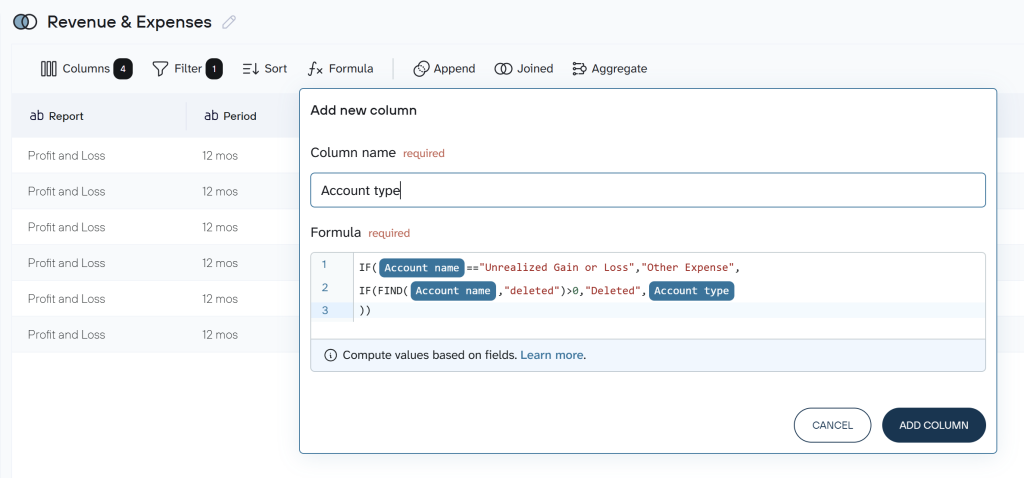
- Create customizable columns with formulas.
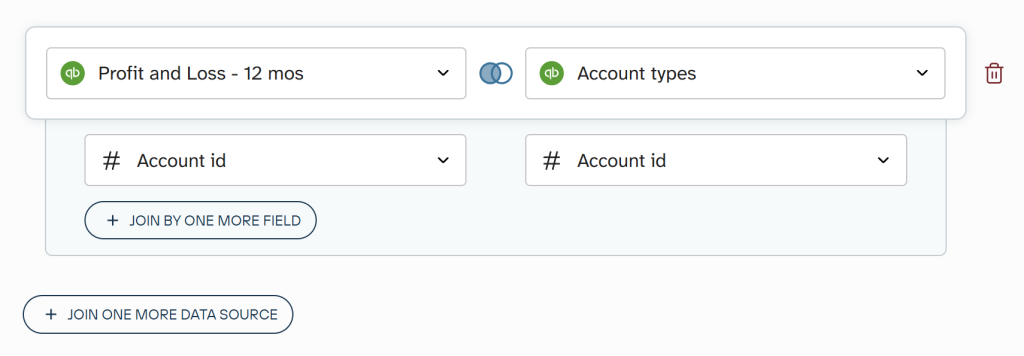
- If you’ve previously connected several sources, blend data in the chosen manner:
- Append – merge datasets with similar structures and columns matched by name.
- Join – combine datasets with different structures and at least one matching column.
Once the data is ready, go ahead and send it to the destination.
Step 3. Load data and schedule refresh
Connect your destination app account and follow Coupler.io’s instructions to load the data into spreadsheets, a BI tool, a database, or AI. For the latter, Coupler.io provides the QuickBooks MCP that integrates data with AI tools, so you can have conversations about your data.
Check out how you can analyze QuickBooks data using ChatGPT or Claude.
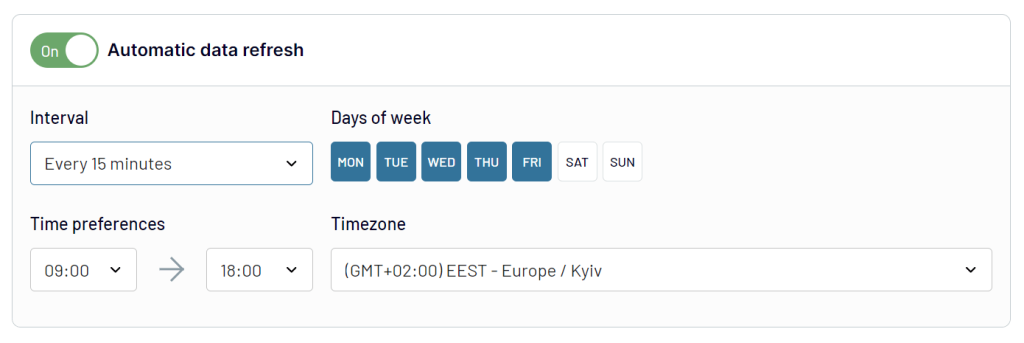
Next, turn on automatic data refresh. Specify the preferred interval, days of the week, hours, and time zone. By default, your report will be updated daily. So, if you need this done more frequently, choose from hourly to every 15 minutes, making it near real-time.
Finally, run the data export and have your QuickBooks records delivered to your destination on schedule with Coupler.io.
Use data set templates to quickly export data from QuickBooks
Coupler.io includes a range of data set templates in which the QuickBooks data is already formatted, aggregated, joined, and ready for analysis. Currently, there are over 20 data set templates for QuickBooks and the number keeps growing:
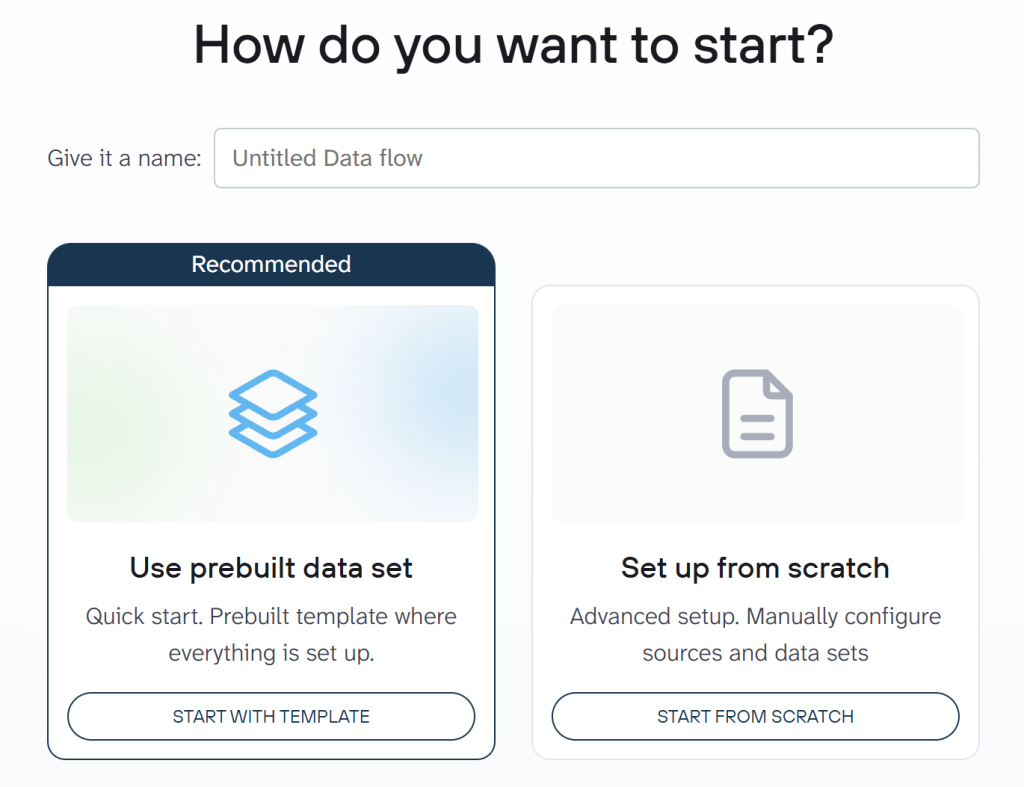
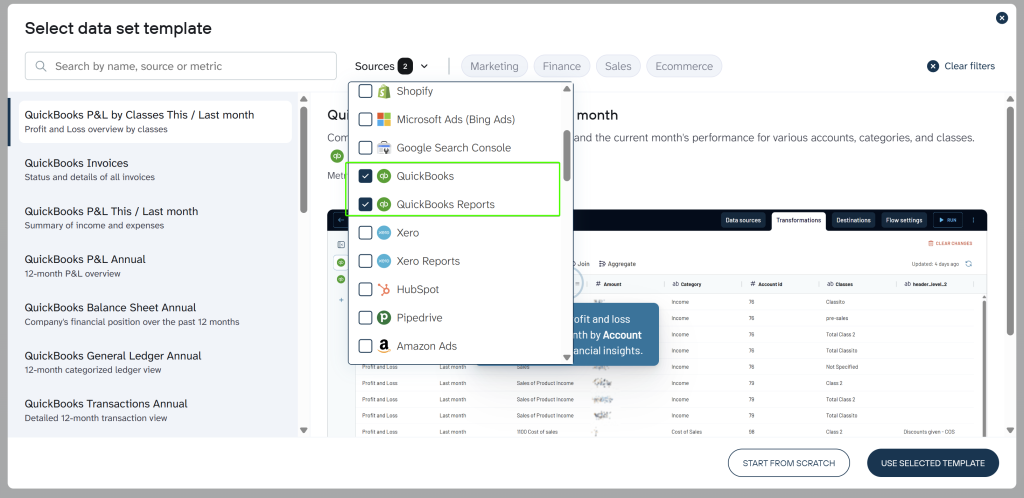
If you want to use a data set template, create a new data flow in Coupler.io and go with the Use prebuilt data set option.
Next, in the Sources drop-down list, select QuickBooks and/or QuickBooks Reports. You can then choose the appropriate template from the list generated on the left. Choose your template and click Use Selected Template.
Then, after you’ve connected your QuickBooks account, you’ll find yourself in the Data sets step with your data formatted and organized. You may also see multiple different data sets in the left panel depending on the selected data set template.
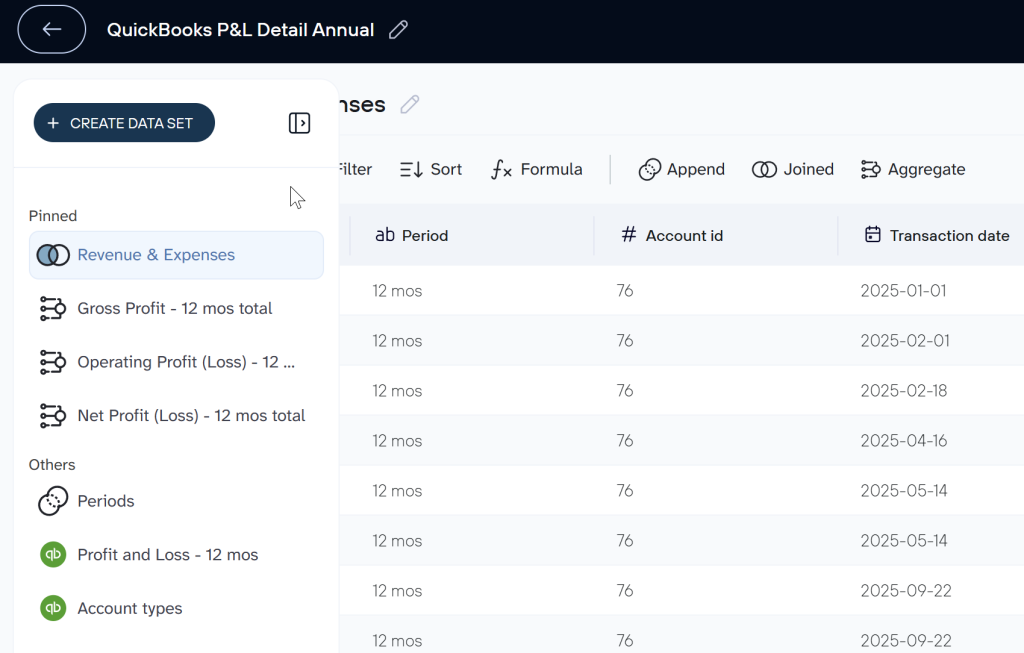
From here, you can follow the same steps as if you had manually configured the data. Choose a destination to load the data, and configure automatic data refresh rates.
Where you can export data from QuickBooks
Coupler.io lets you pull your data from QuickBooks to several destination categories, depending on your needs, including:
- Spreadsheets (import QuickBooks to Google Sheets or Microsoft Excel) – to make quick calculations, perform lightweight analysis, and handle small-scale data tasks. It is ideal for simple reports and high-level financial snapshots.
- BI tools (Looker Studio, Power BI, Tableau, and Qlik) – to transform larger, more advanced datasets into detailed, actionable insights by visualizing them through dynamic, interactive dashboards. For example, PlumbBooks converted bulky QuickBooks reports into interactive Looker Studio dashboards for clients, leading to 40% revenue growth and eliminating countless hours of manual work.
- Databases (connect QuickBooks to BigQuery, Redshift, and PostgreSQL) – to store all QuickBooks records in a centralized location, reduce data silos, as well as access complex queries and deeper financial analytics.
- AI tools (ChatGPT, Cursor, Perplexity, Claude) – to gain insights through natural language, summarizing complex data quickly.
What QuickBooks data you can export with Coupler.io
From invoices and customers to journal entries and tax codes, Coupler.io lets you export all essential QuickBooks data.
In addition to raw QuickBooks data, Coupler.io users can export over 20 different QuickBooks reports, from balance sheets and profit & loss statements to aging reports and transaction lists.
Use white-label report templates for QuickBooks Online
Coupler.io provides ready-to-use report templates for specific data sources, including QuickBooks. The templates can be available in Coupler.io and external tools like Google Sheets, Looker Studio, and Power BI. You only need to connect your QuickBooks Online account using the built-in QuickBooks connector, and the dashboard will be automatically populated with your data. Here are the templates available for QuickBooks dashboards.
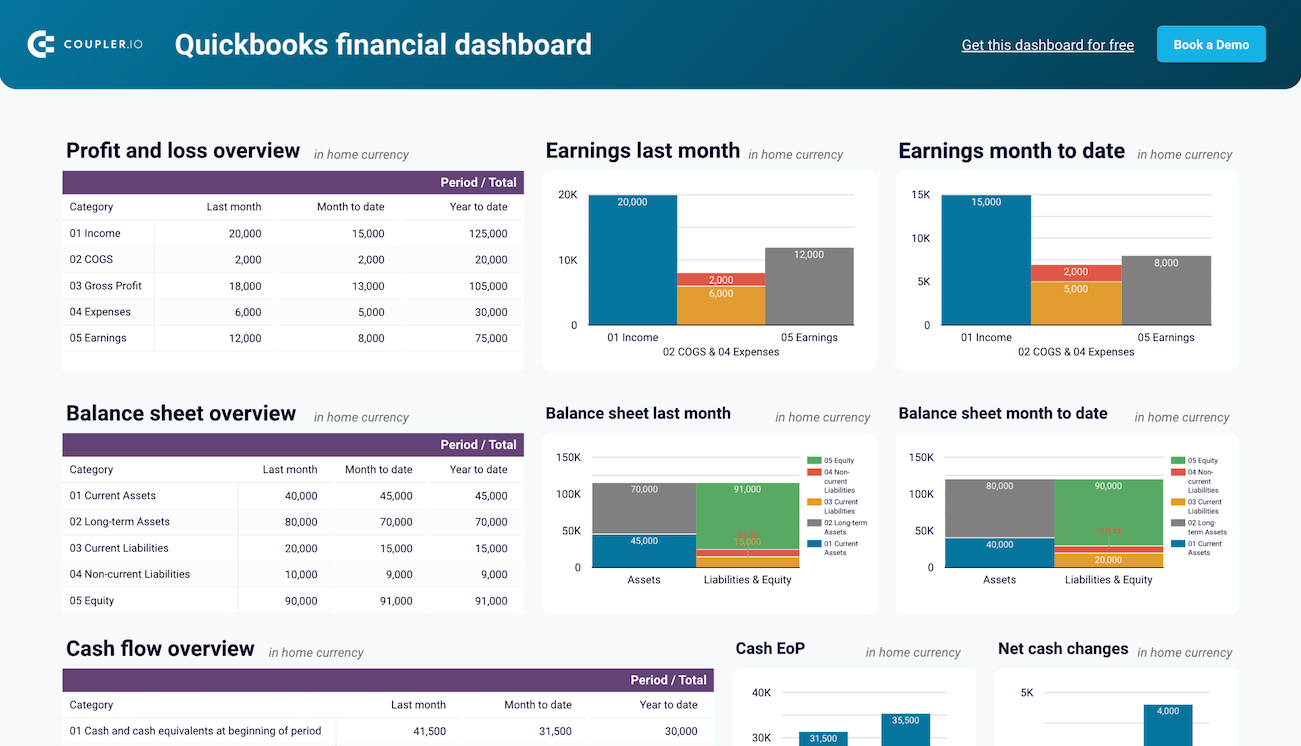
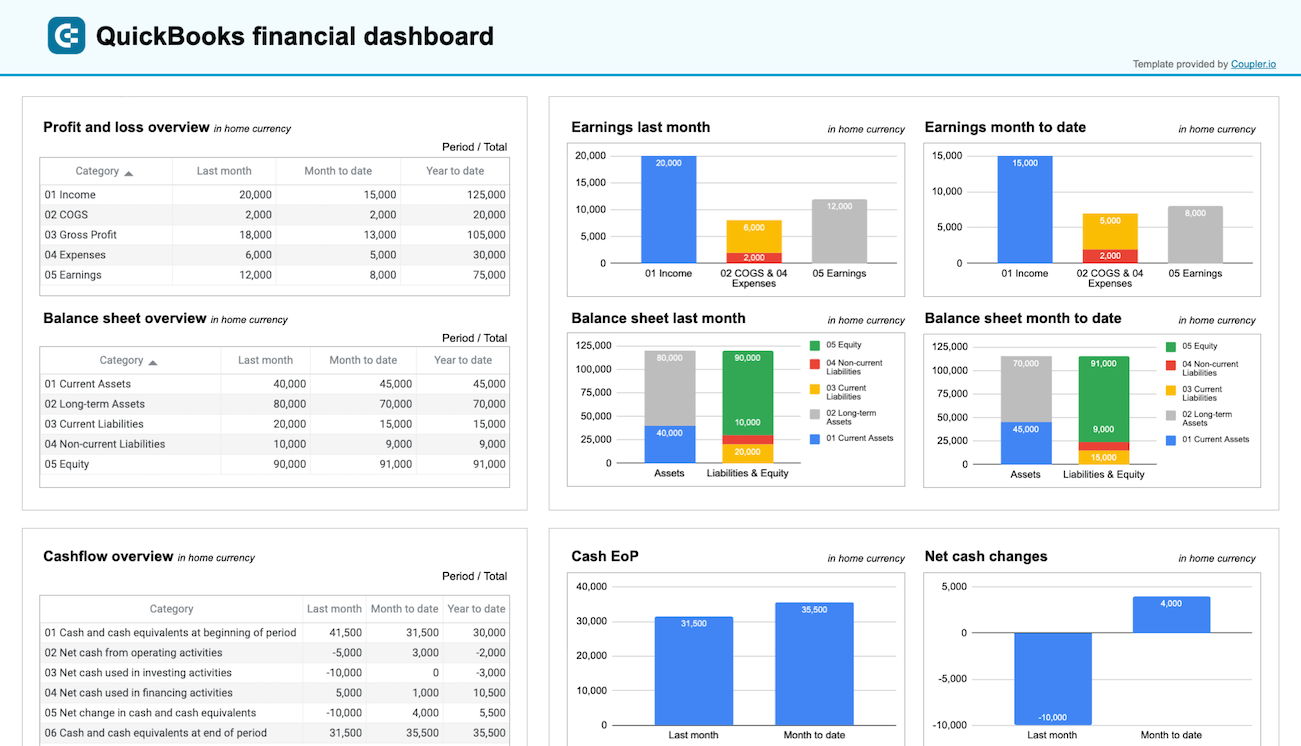
QuickBooks financial dashboard
The QuickBooks financial dashboard provides a real-time view of key financial reports – profit and loss, balance sheet, cash flow, and bank & cash accounts.
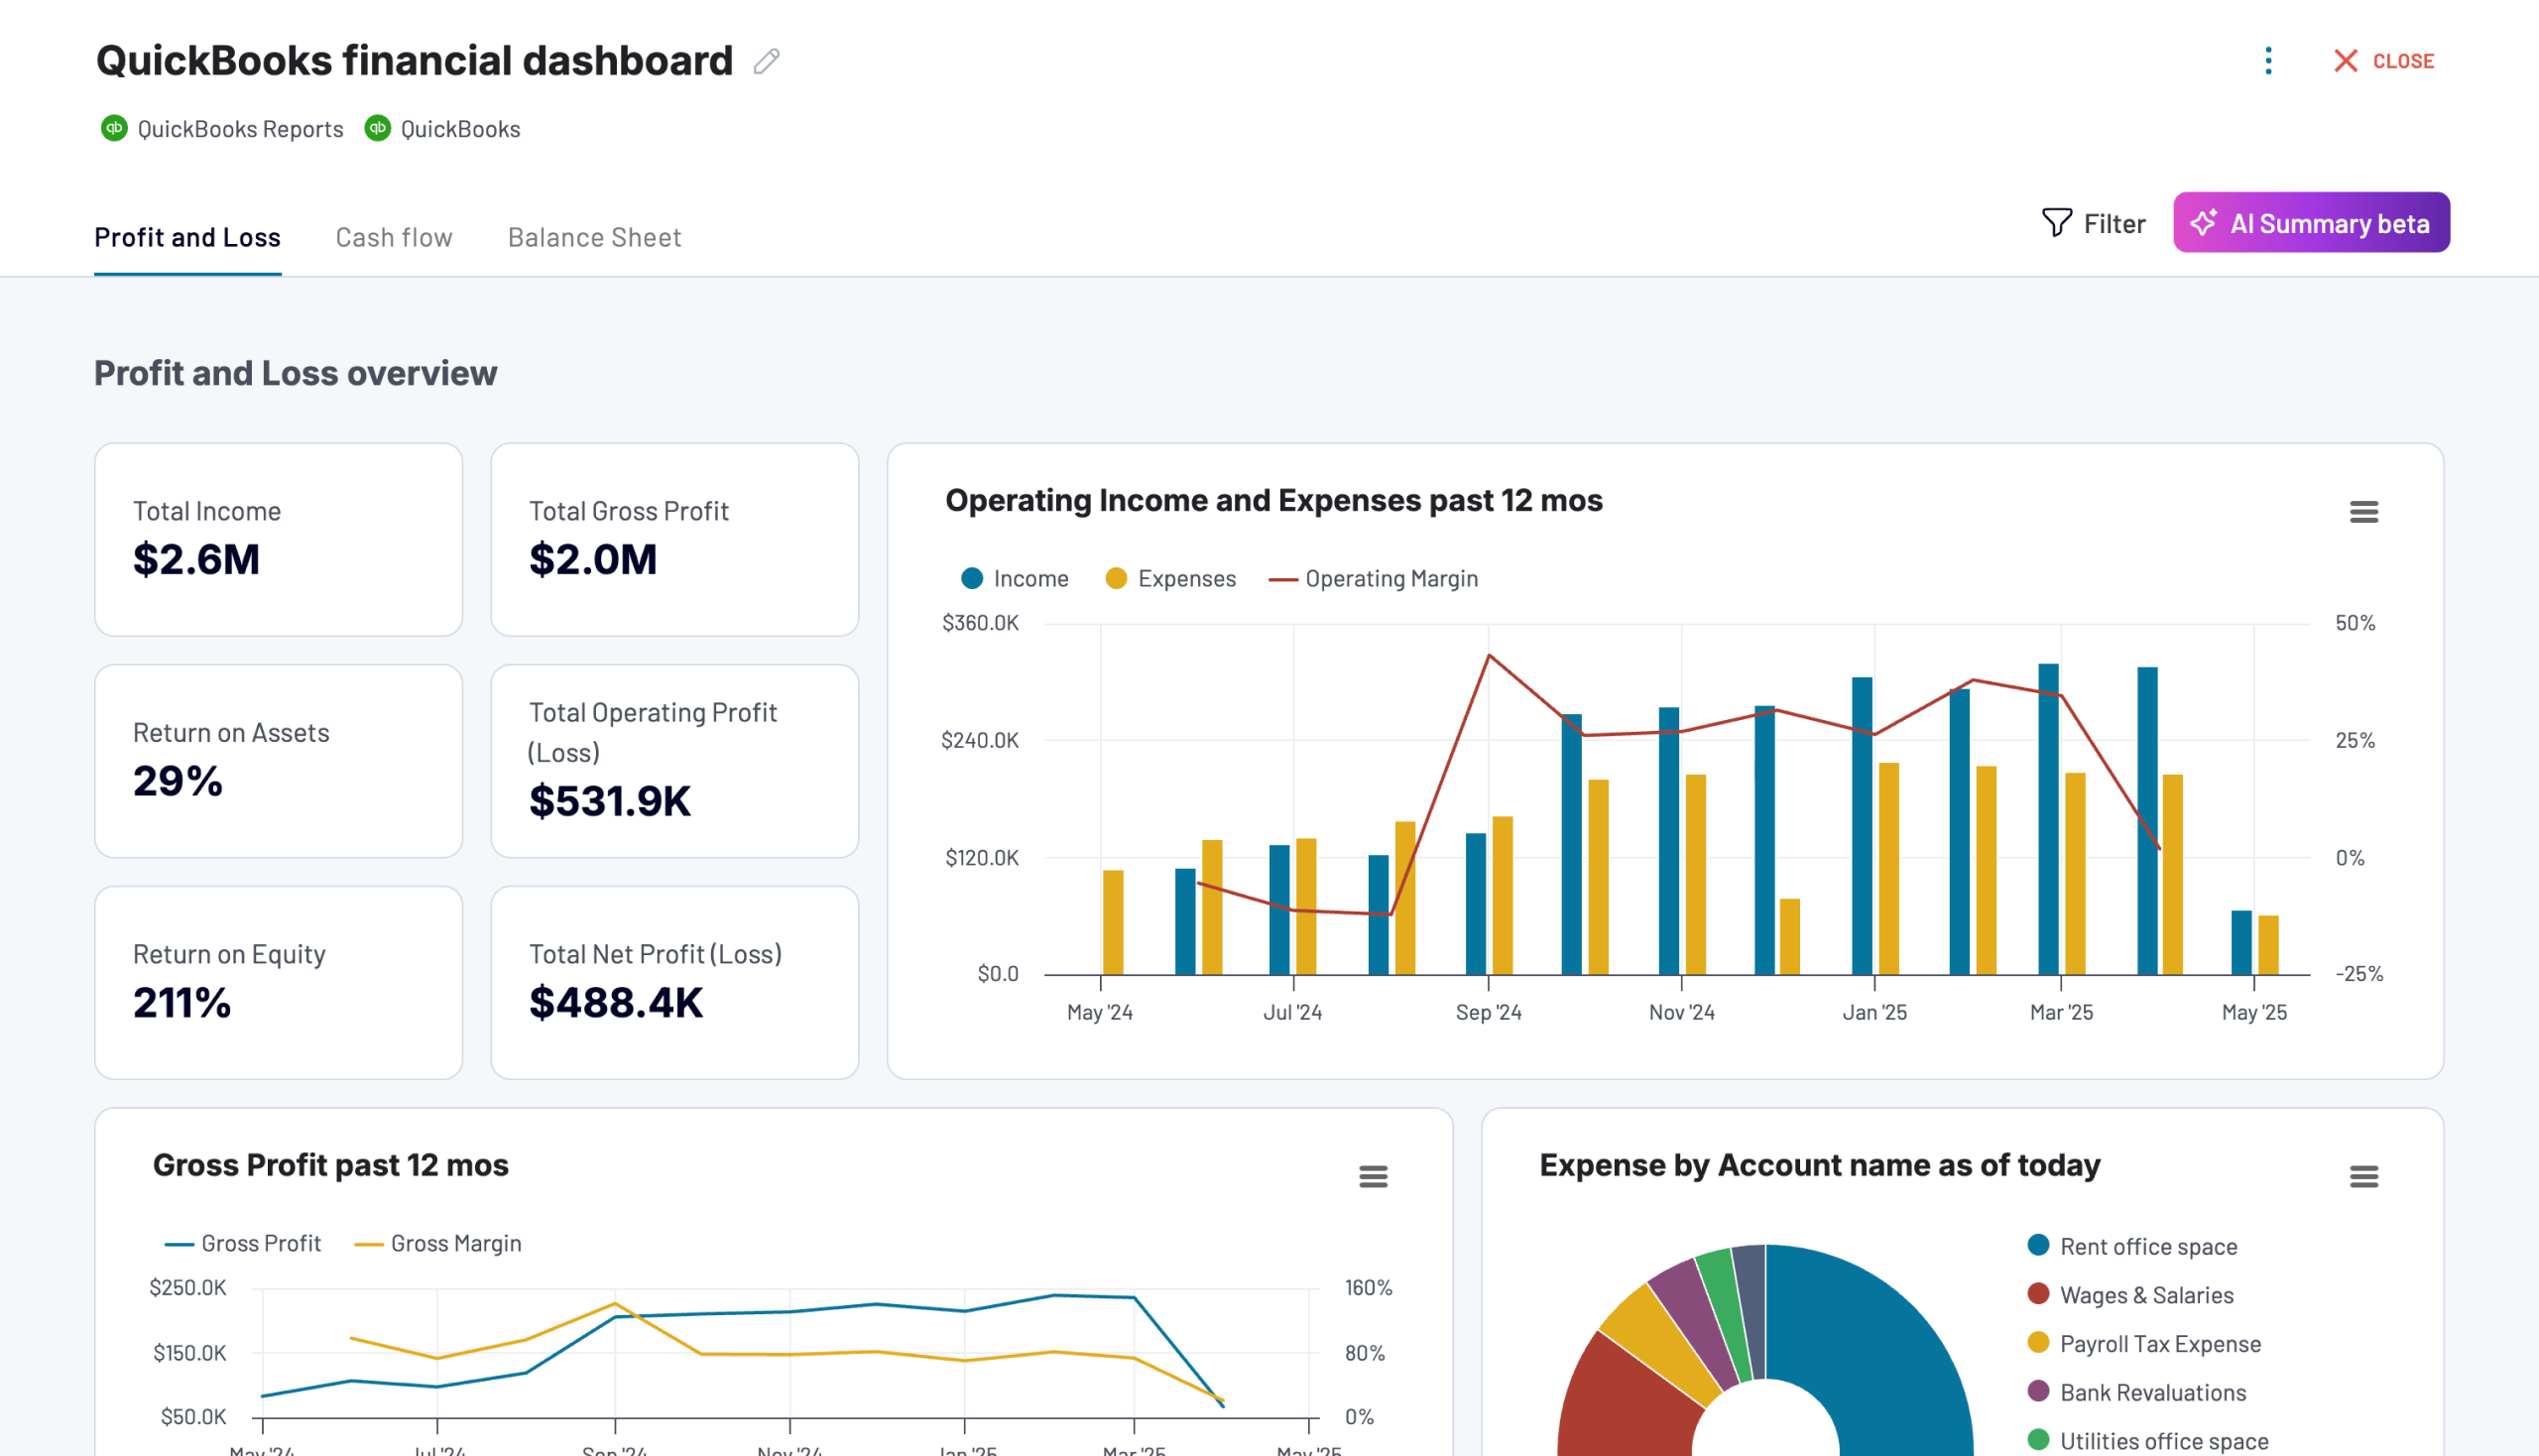
Use this dashboard to gain the following insights:
- Profit and loss overview: Get a summary of your revenue, expenses, and net income for the last month, month to date, and year to date to monitor profitability and control your costs. Compare your earning trends to spot growth patterns or areas needing improvement.
- Balance sheet overview: Take a snapshot of your assets, liabilities, and equity to understand your financial position, liquidity, and business health. Place your balance sheet assets alongside liabilities and equity for the last and current month.
- Cash flow overview: Look at net cash changes over the reporting period to see how your position evolves and ensure effective liquidity management. Explore the cash position at the end of the period and net changes to check your financial stability.
- Bank and cash accounts overview: Go over your available funds and list balances for all linked bank and cash accounts to help you verify all are reconciled. If you’re handling multi-currency transactions, view balances by currency to simplify the tracking and monitoring of foreign accounts.
This dashboard is designed in Coupler.io with AI insights available. Also, you can use it as a Looker Studio and Google Sheets template. Set it up with your own data by following the step-by-step guide in the Readme tab.


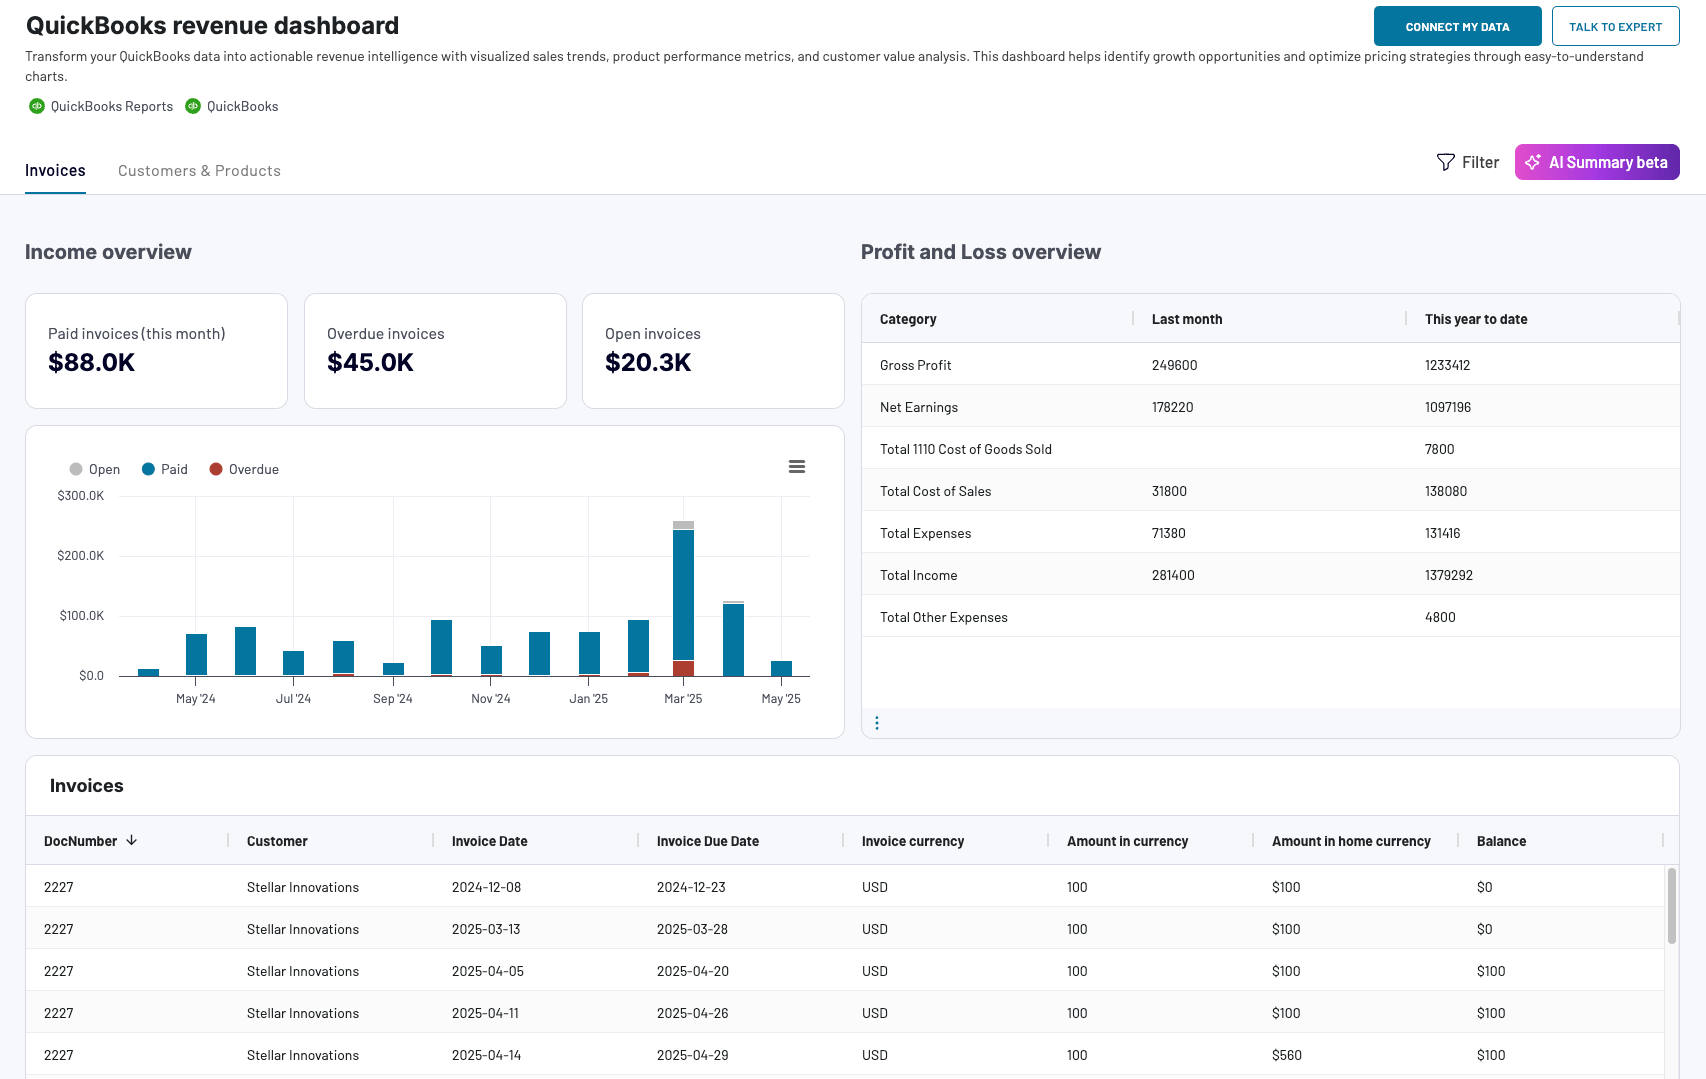
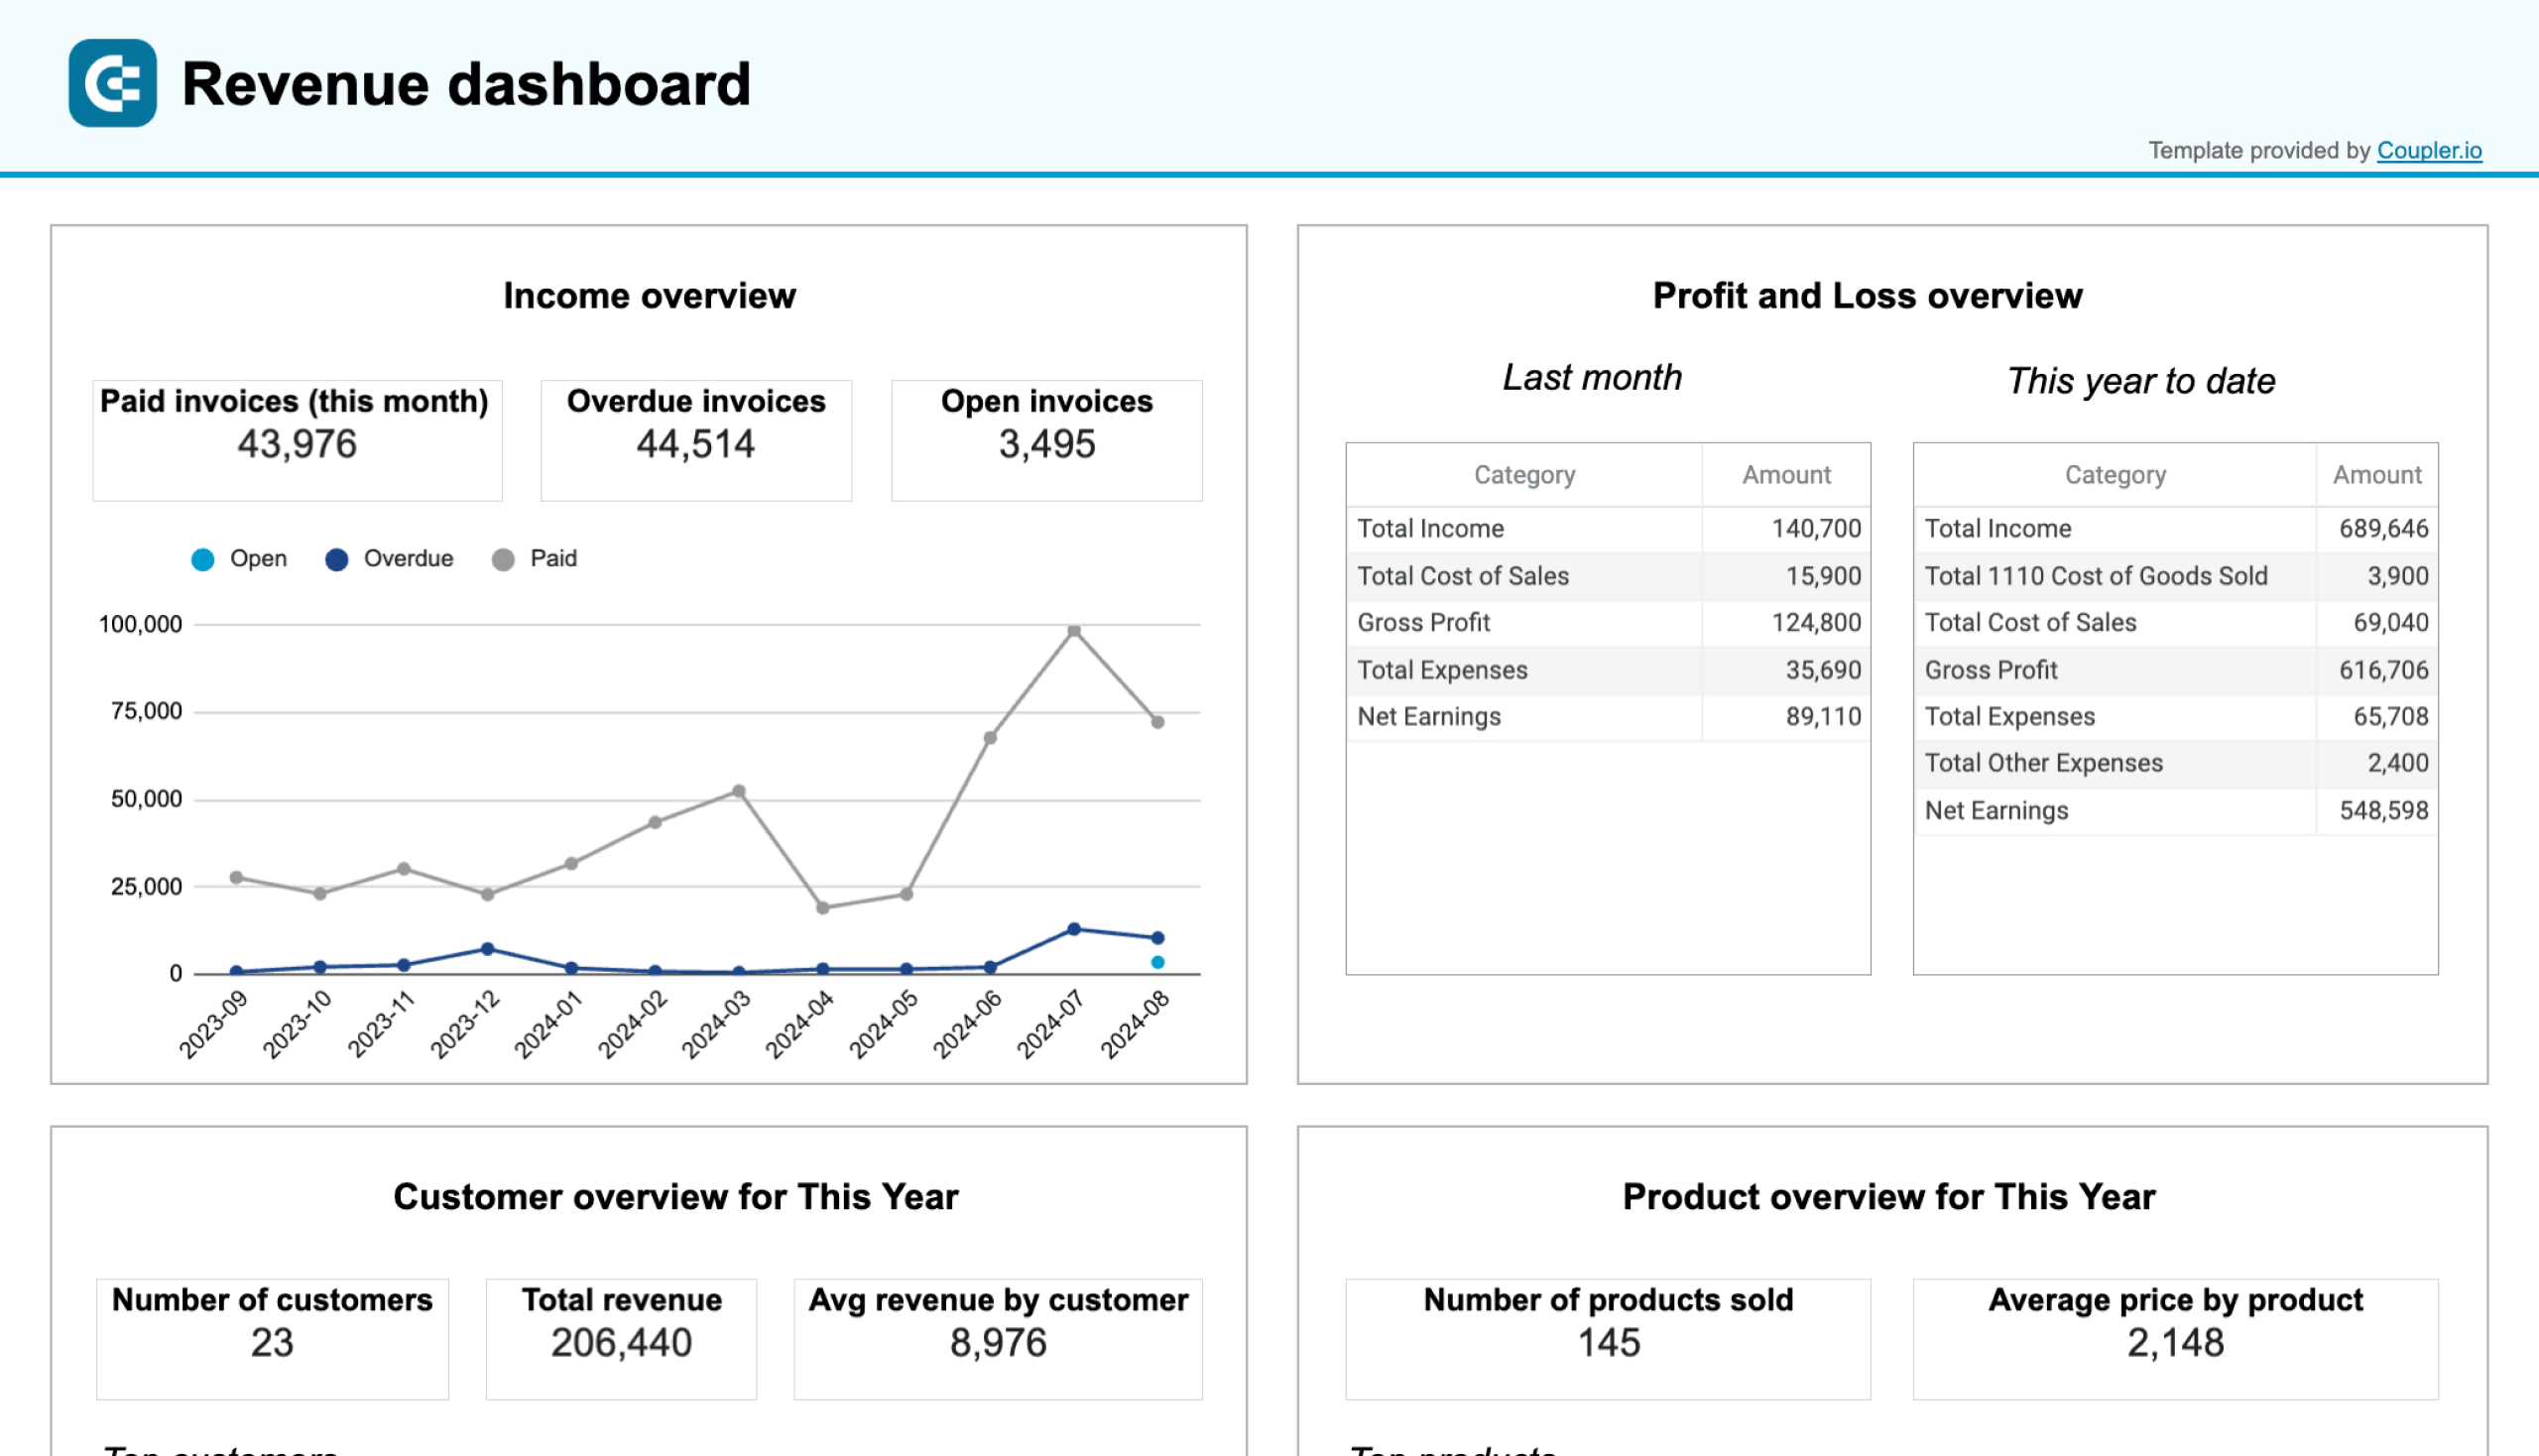
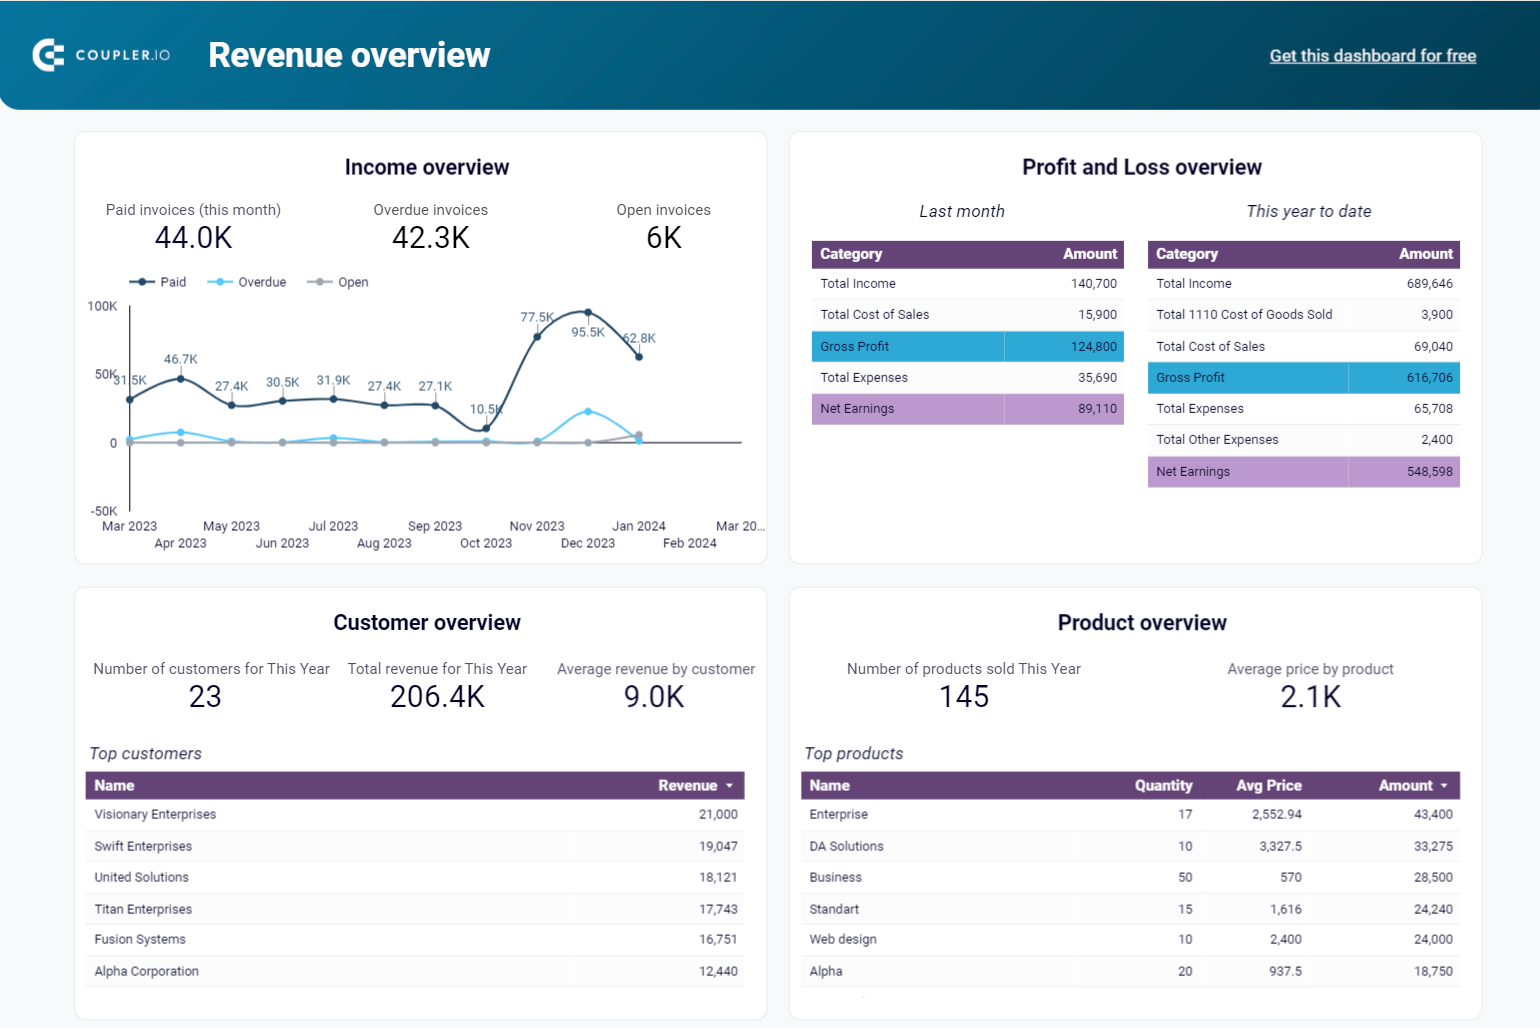
QuickBooks revenue dashboard
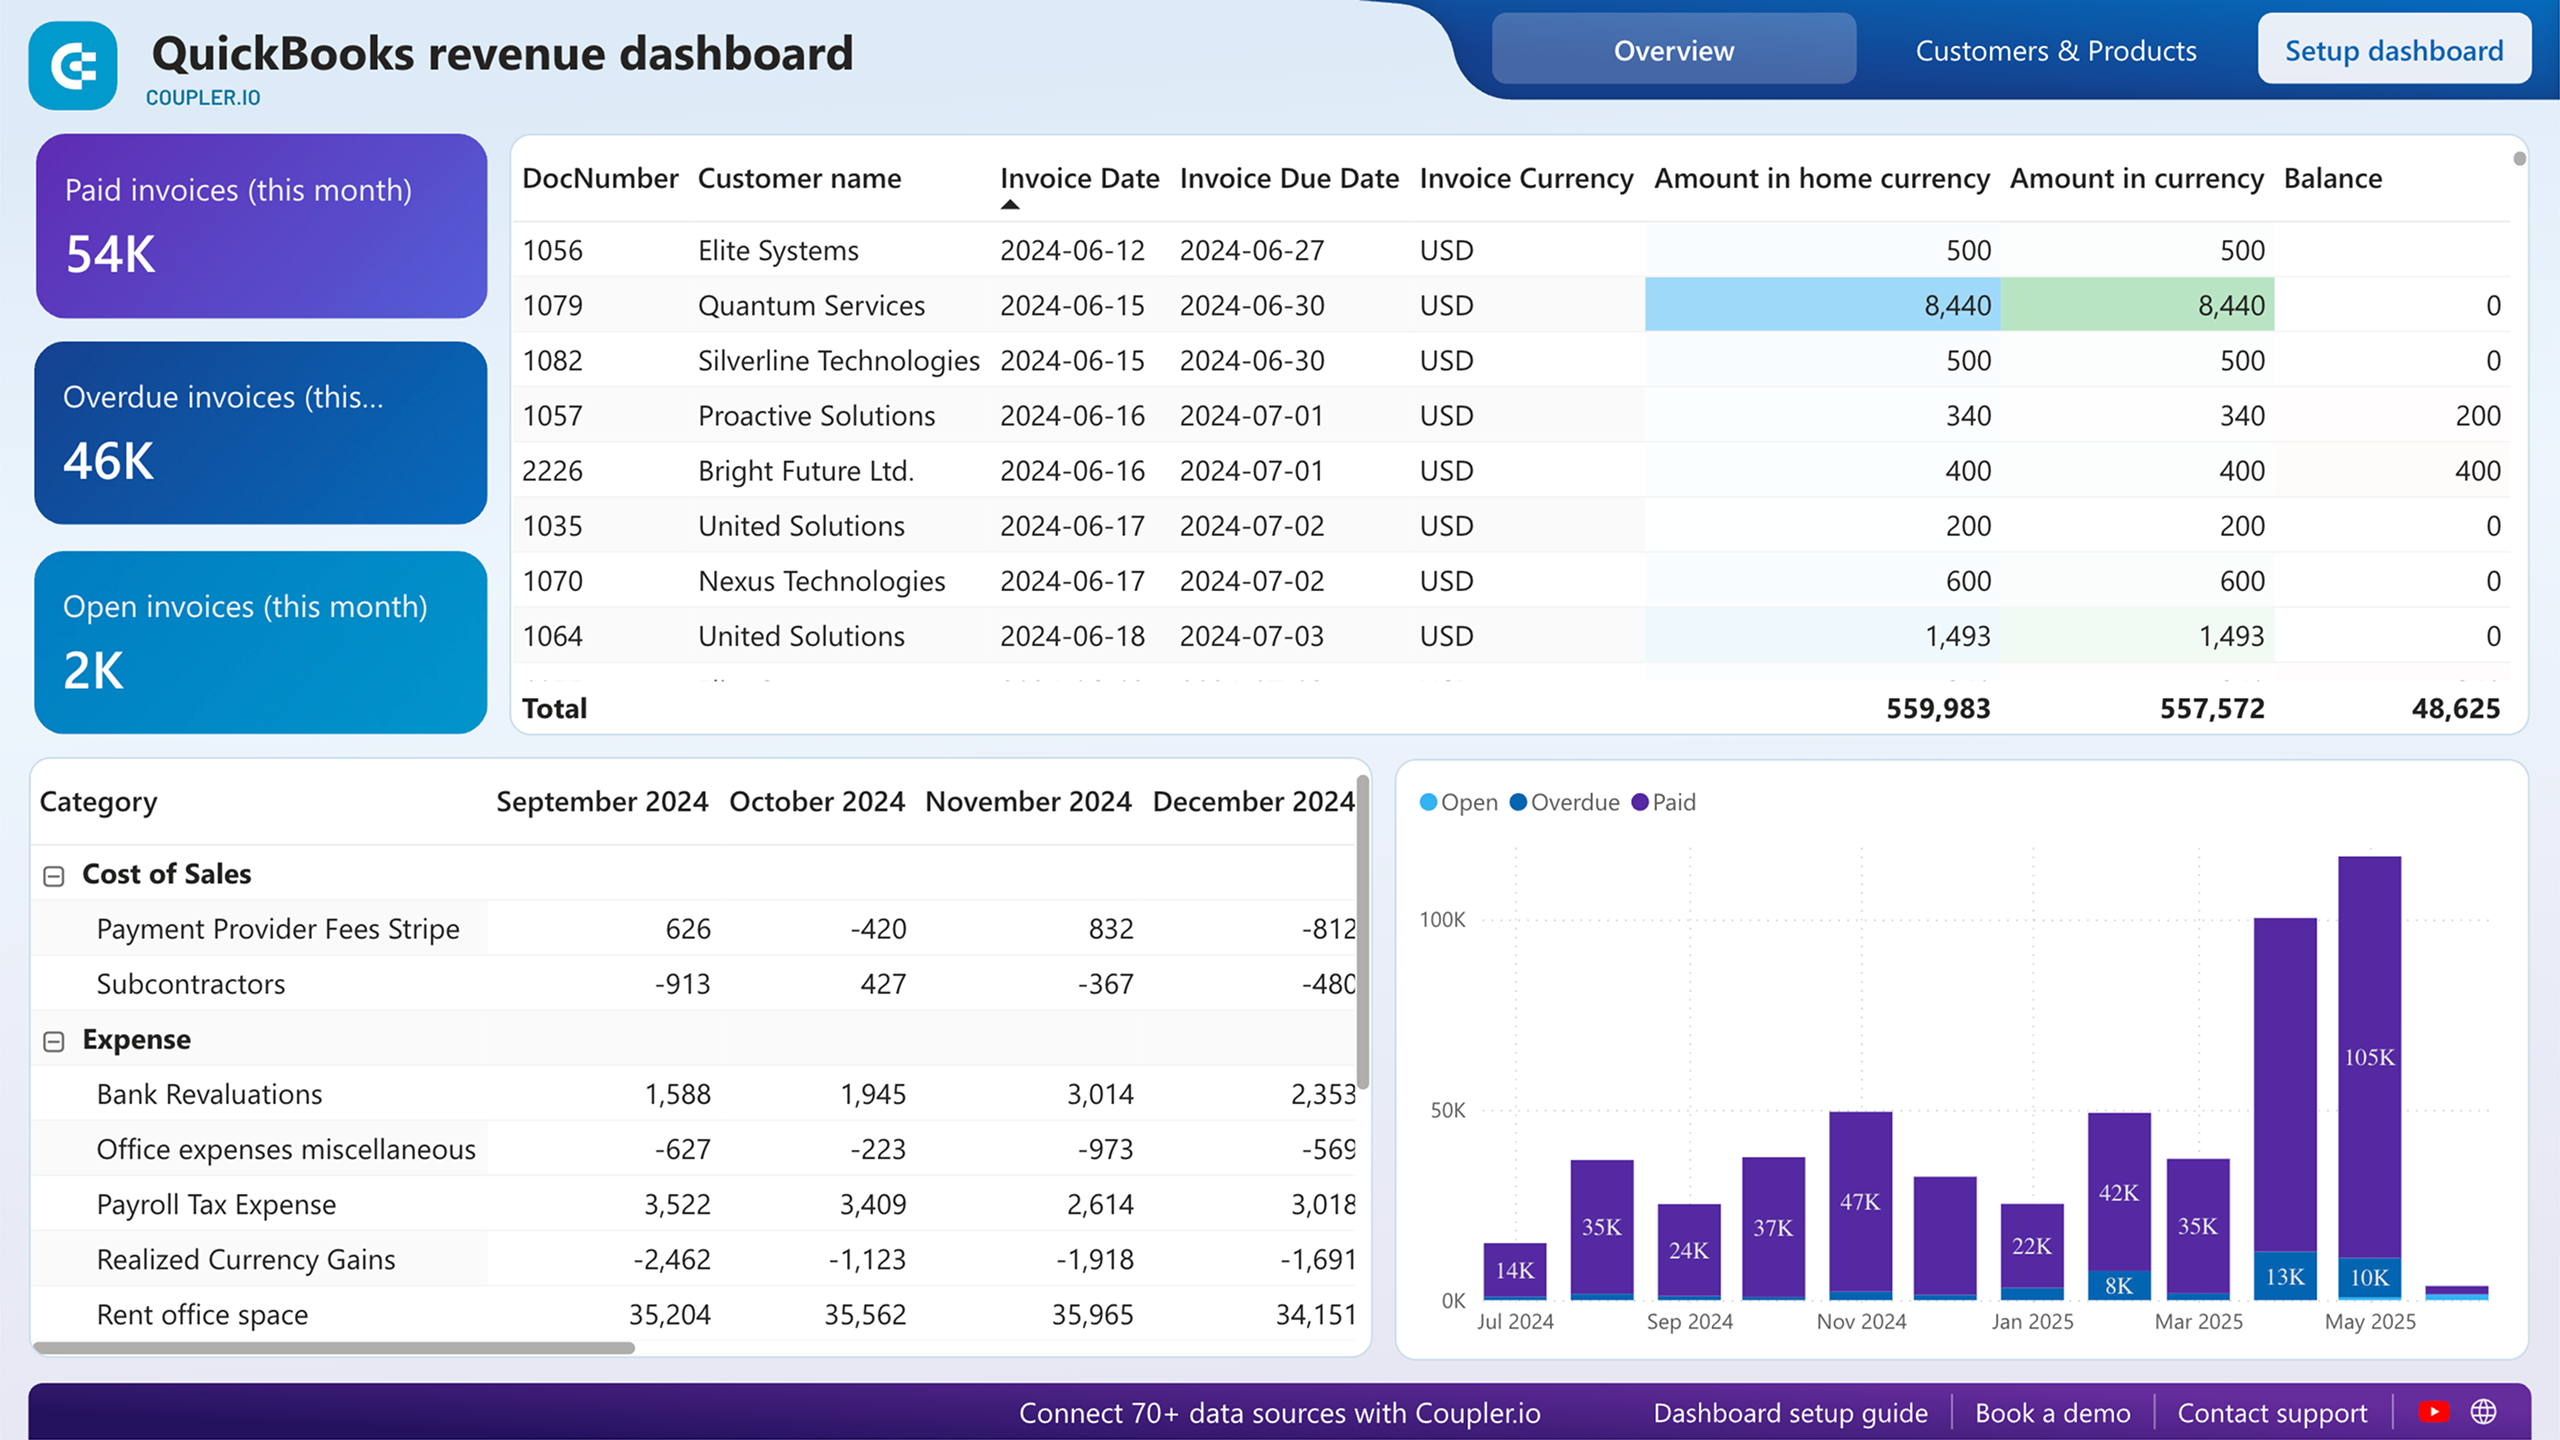
The revenue dashboard helps you monitor your income and expenses. It shows the revenue distribution by the customer, aggregates key metrics and displays your business’s top customers.
QuickBooks revenue dashboard + AI insights
 Preview dashboard
QuickBooks revenue dashboard + AI insights
Preview dashboardWhat reports the dashboard provides:
- Income overview: Track overall revenue trends for the last 12 months. Identify seasonal fluctuations, peak revenue periods, and any unexpected dips.
- Profit and loss overview: Compare revenue and expenses to gain insights into net income. Assess how well your business manages costs relative to income to support your budgeting and financial planning.
- Customer overview: See your most valuable customers by their revenue contribution for targeted marketing efforts and retention strategies. For example, you can offer loyalty incentives to high-value customers.
- Product overview: Figure out which products generate the most revenue. Using this information, you can adjust your sales strategies based on the results of high- or low-performing products.
The dashboard is available in Coupler.io with the built-in AI insights feature. At the same time, you can also use it as a template in Google Sheets, Looker Studio, and Power BI. Navigate to the Readme tab inside the chosen template to set up the dashboard according to the instructions provided.

Expenses dashboard for QuickBooks
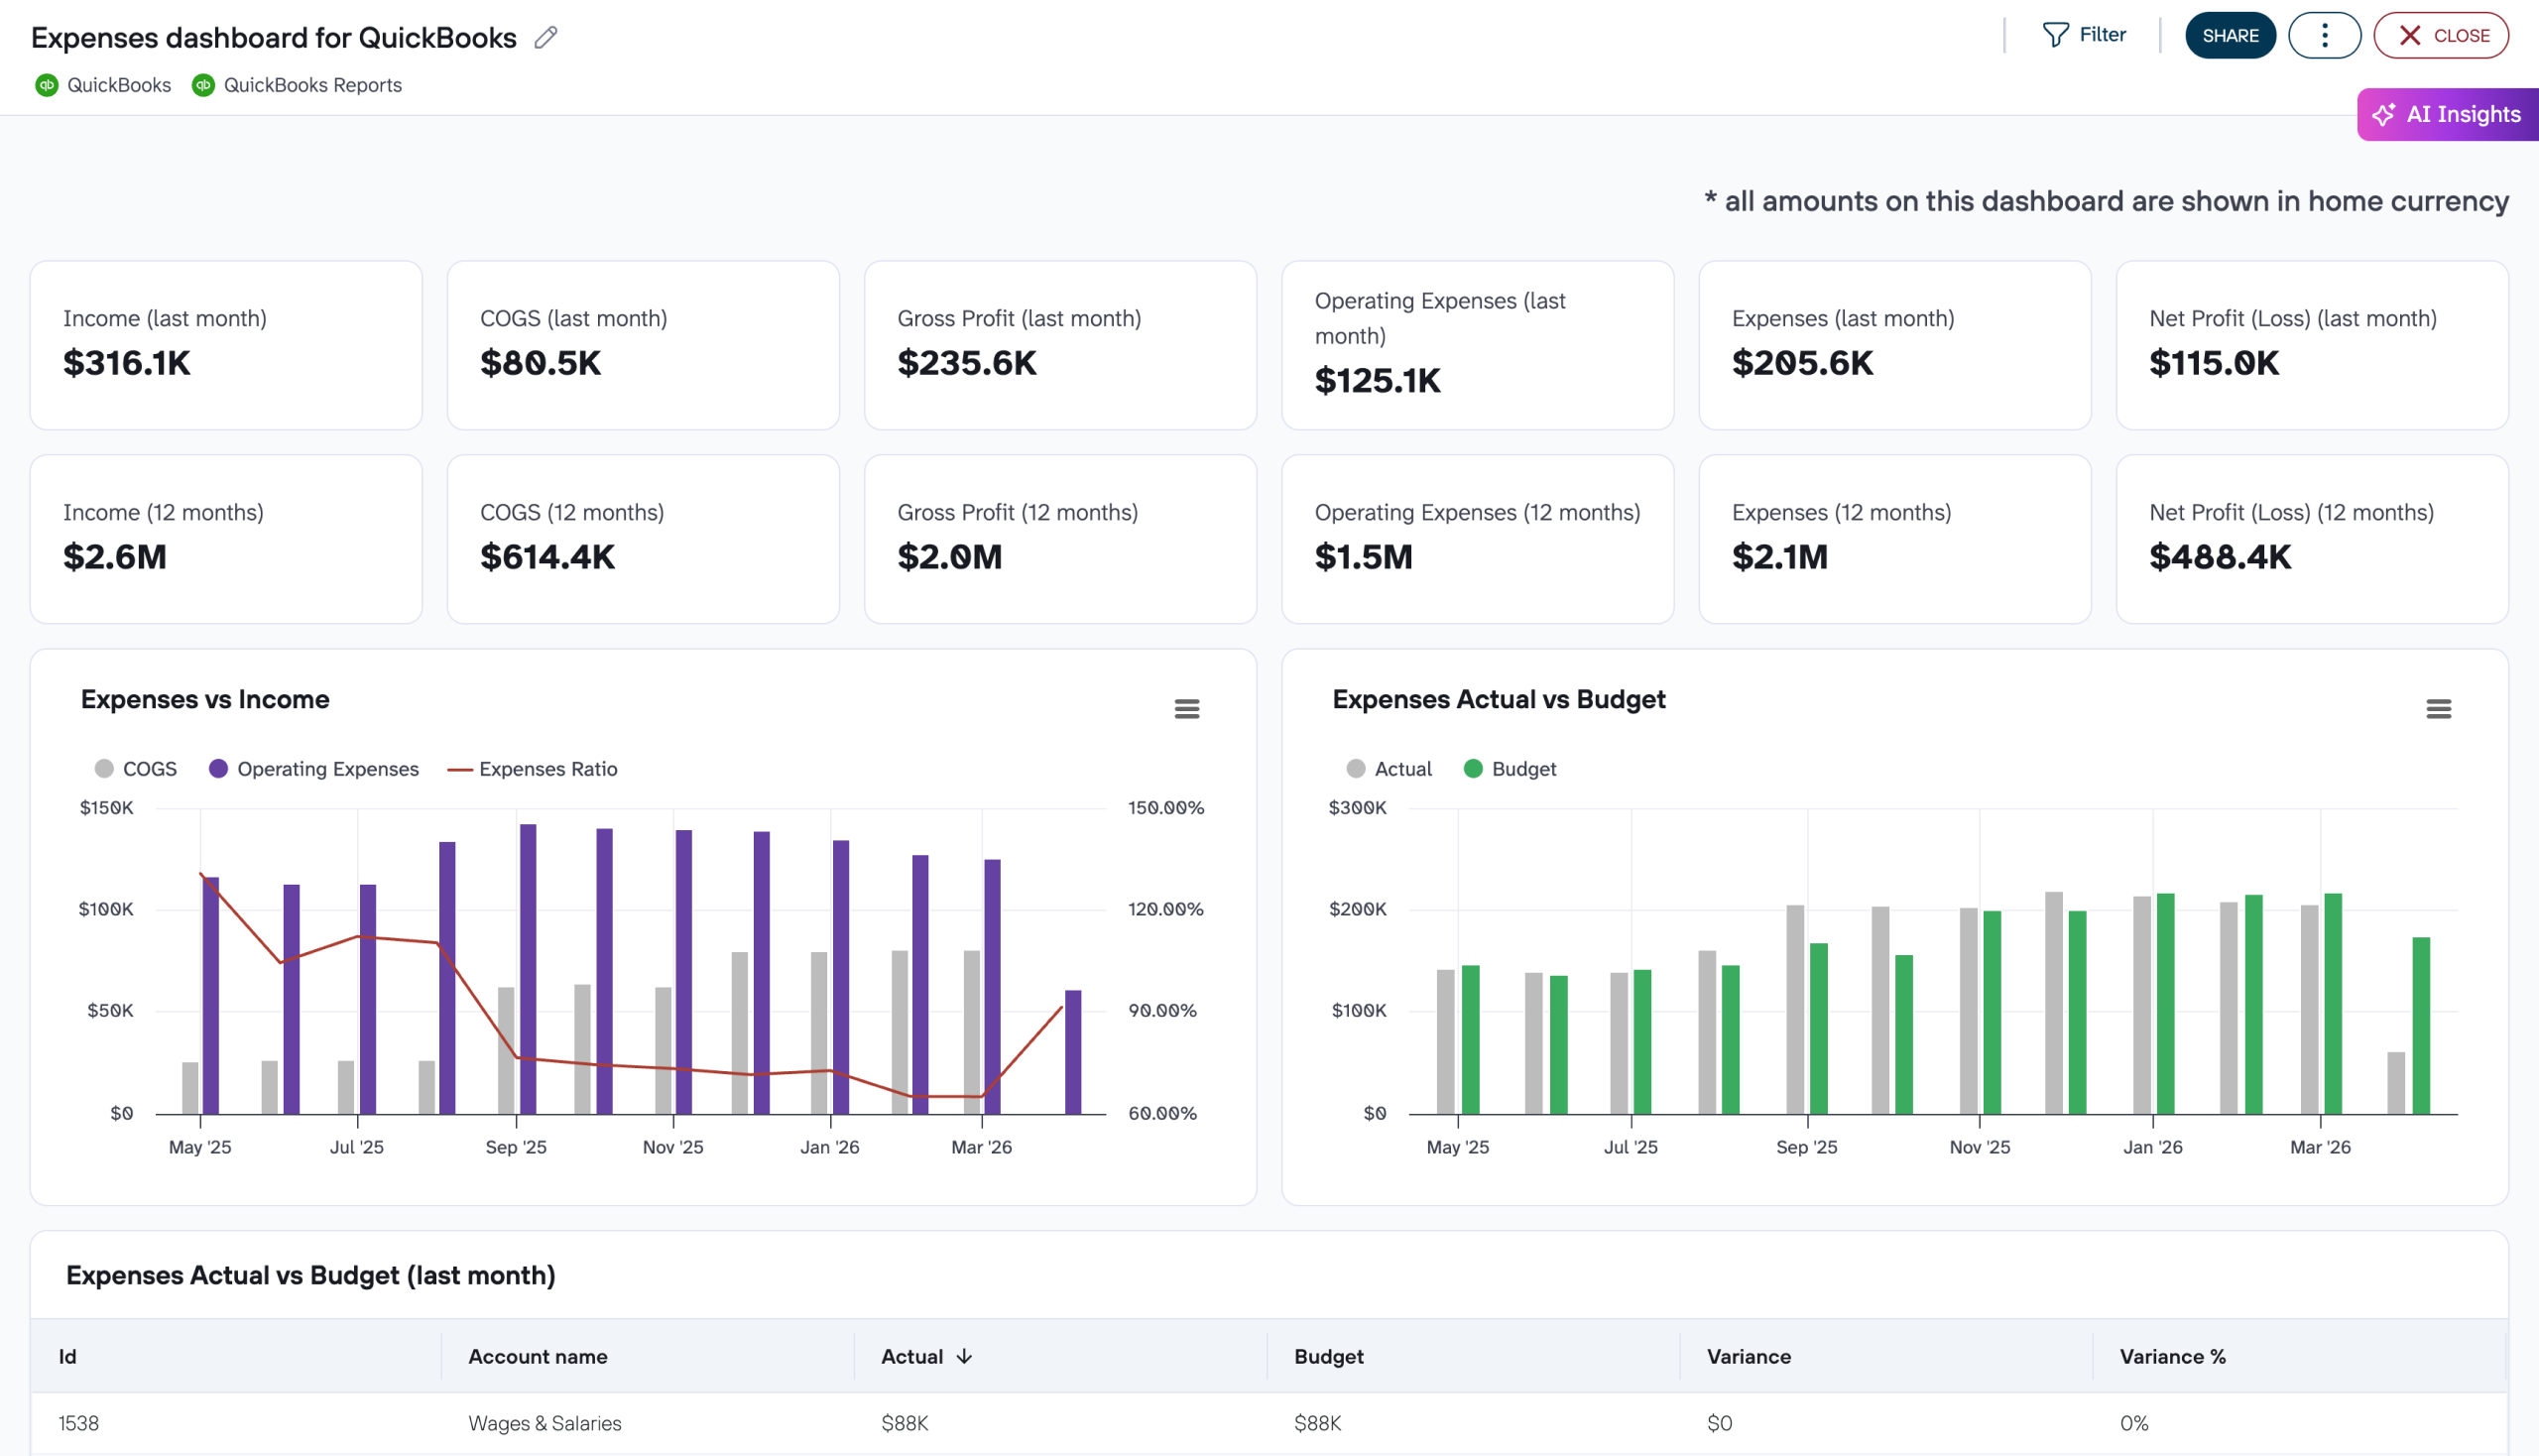
Most QuickBooks exports tell you what was spent. The Expenses dashboard for QuickBooks by Coupler.io adds the layer that makes that data useful for planning: it shows how actual costs compare to budgeted targets, account by account and month by month.
Expenses dashboard for QuickBooks
 Preview dashboard
Expenses dashboard for QuickBooks
Preview dashboardHere’s what you’ll learn using this dashboard:
- Actual vs. budget by month: See whether the business is running over or under plan in each period, and whether variances are isolated or part of a widening trend.
- Account-level variance breakdown: The Expenses by Account name table shows actual spend, budget, and both the absolute and percentage variance for each account.
- Expense composition by category: Donut charts show how spend is distributed across cost types, making it easy to spot shifts in cost structure before they show up in the P&L.
- Top vendors by paid bills: A ranked table covers the current month, last month, and trailing 12-month spend per supplier (useful for identifying concentration risk and preparing for contract reviews).
- Cash balance, burn rate, and runway: KPI cards show how sustainable current spending is relative to available reserves.
The Expenses dashboard for QuickBooks is available in Coupler.io and as a Looker Studio template. Connect your QuickBooks account and follow the setup instructions to populate it with your data.
Billing dashboard for QuickBooks
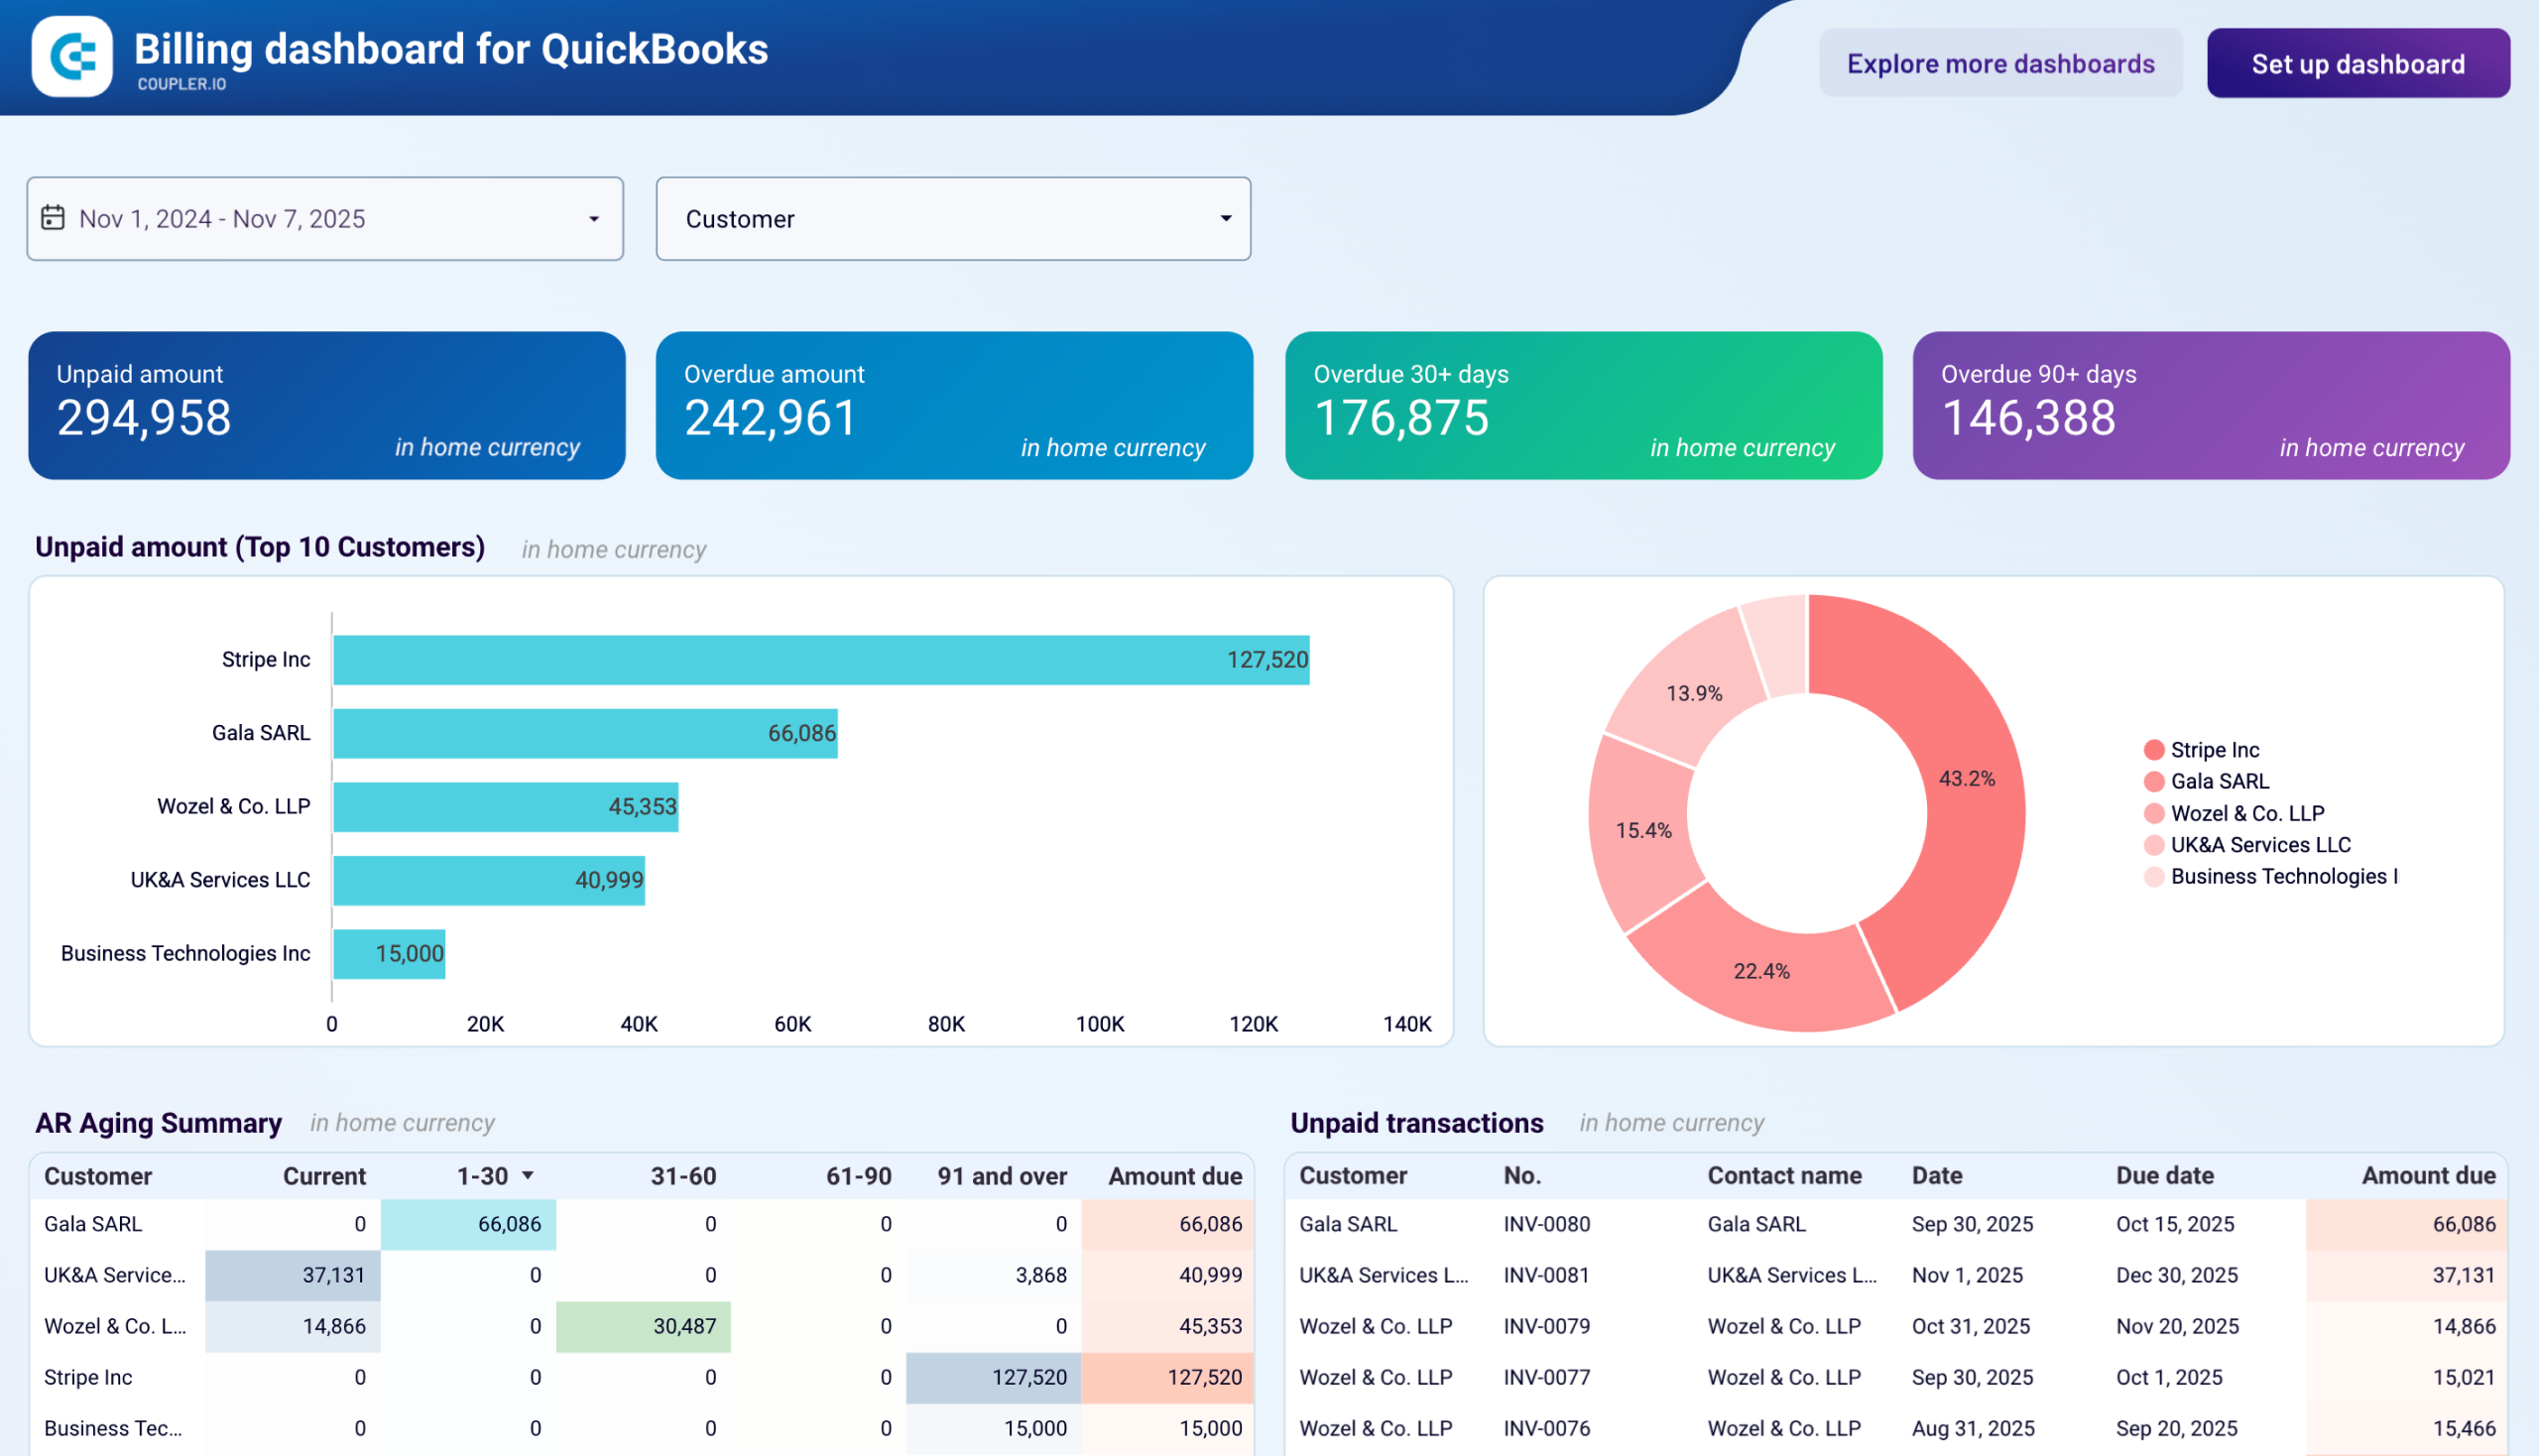
The billing dashboard provides small business owners and accounting teams with consolidated visibility into both receivables and payables within a single interface. It helps you maintain healthy cash flow, optimize payment timing, and make informed decisions about collections and disbursements without navigating through multiple QuickBooks reports.
Billing dashboard for QuickBooks
 Preview dashboard
Billing dashboard for QuickBooks
Preview dashboardThe QuickBooks dashboard reveals the following:
- Vendor bills: View the details of all vendor bills, paid and unpaid, for the last 12 months in all currencies.
- Unpaid bills overview + filter by creditors: Check the amount of unpaid and overdue bills, with values displayed in the home currency. For unpaid bills, look at the top 10 vendors by credit debt. Additionally, see all the vendors and their share in your accounts payable, identify your major creditors, and prioritize payments to your vendors.
- Paid bills by vendor: Get a summary of bills from your vendors that were previously paid. Based on this data, evaluate your vendors by the size of the amounts you have paid to them to decide on payment prioritization for specific creditors.
- Bank and cash: Easily track your balance by accounts and currency to distribute your money correctly and prioritize payments.
- Aging of accounts payable: Explore the distribution of overdue amounts by vendor and period: current, up to 30 days, 30 to 60 days, 60 to 90 days, and 90+ days. Look at the vendors’ overdue bills that constitute your accounts payable.
The billing dashboard is available as a Looker Studio template equipped with the Coupler.io connector. Follow the instructions to connect your QuickBooks Online account and set up the dashboard with your data.
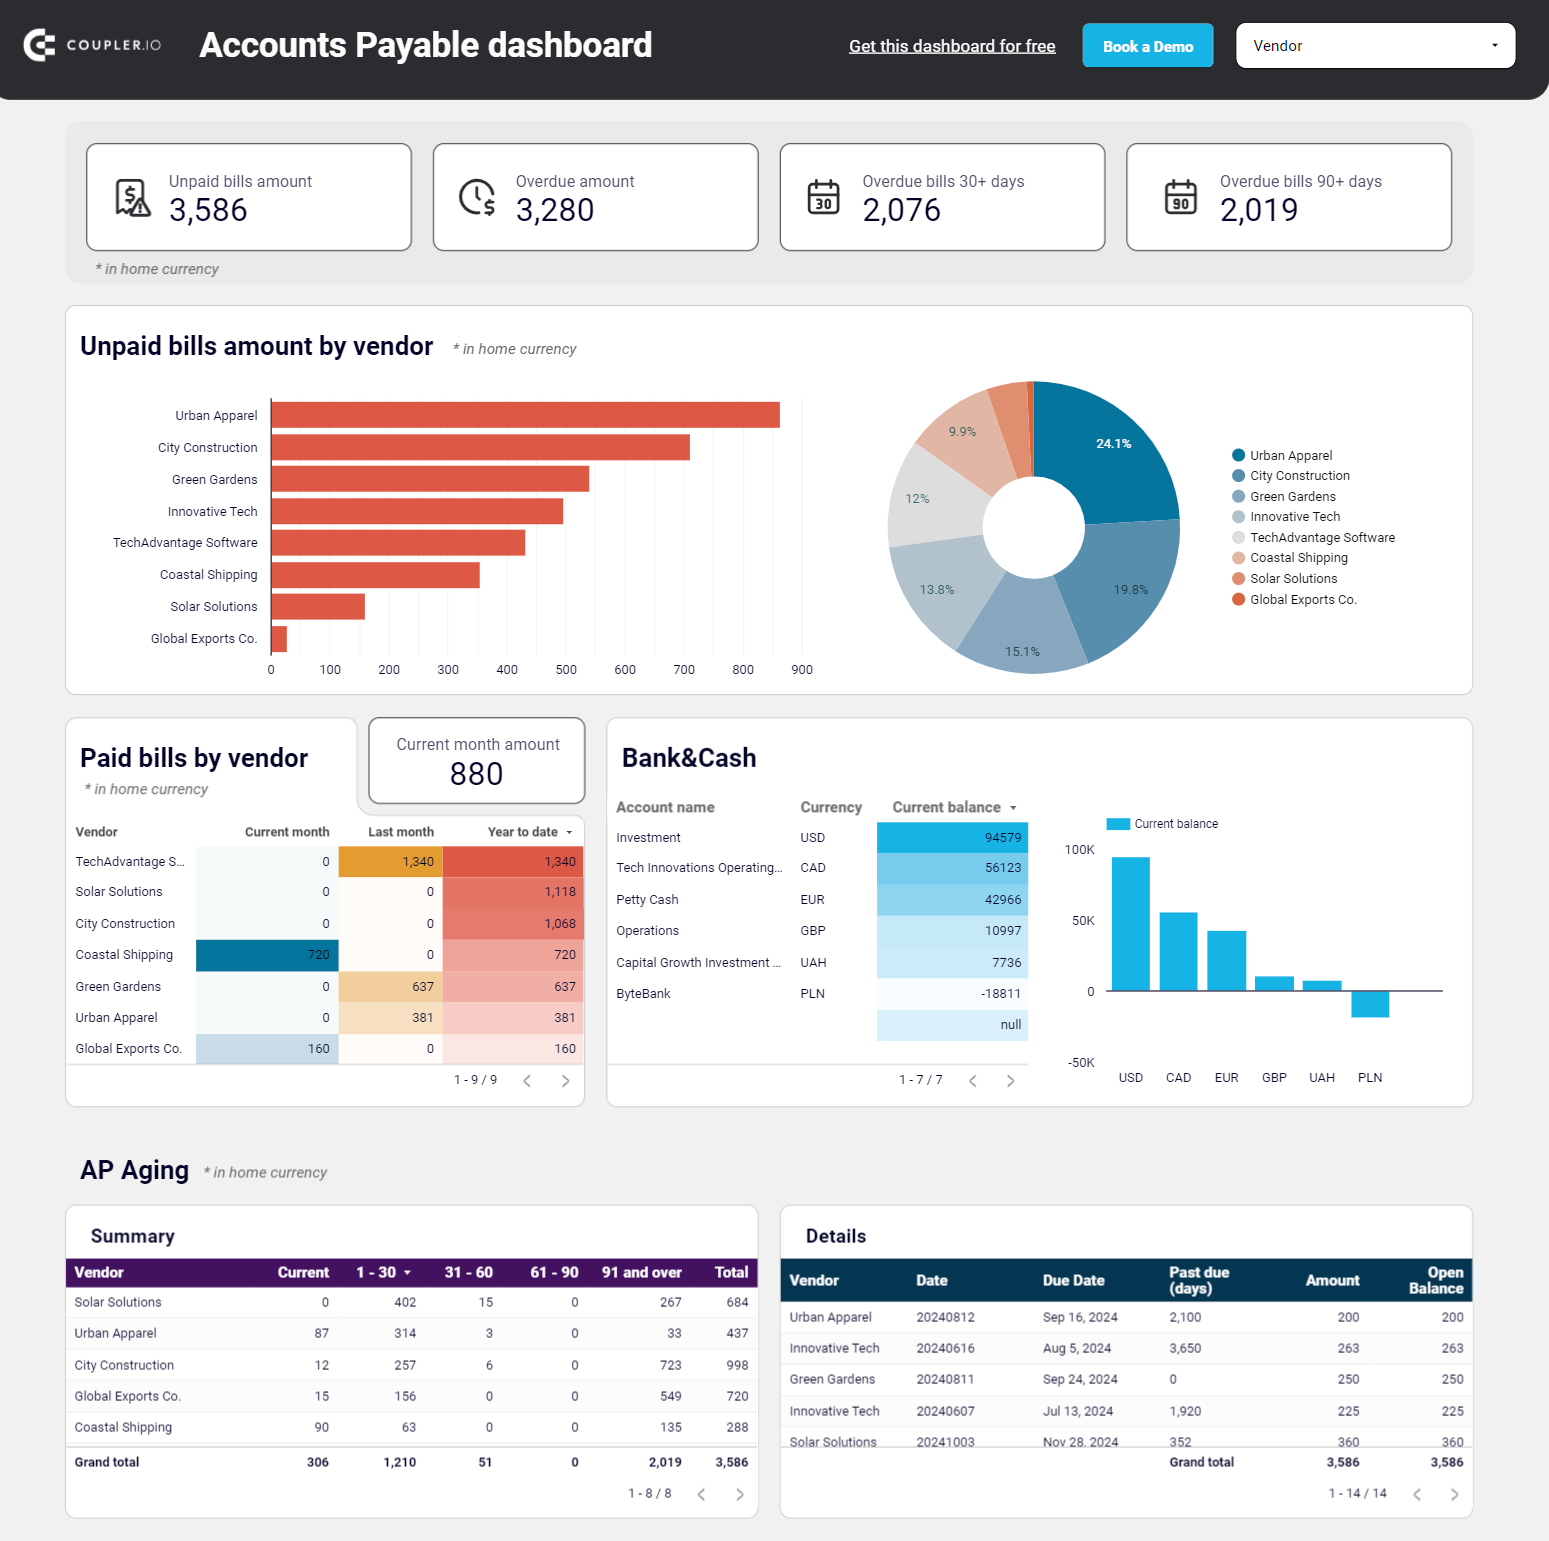
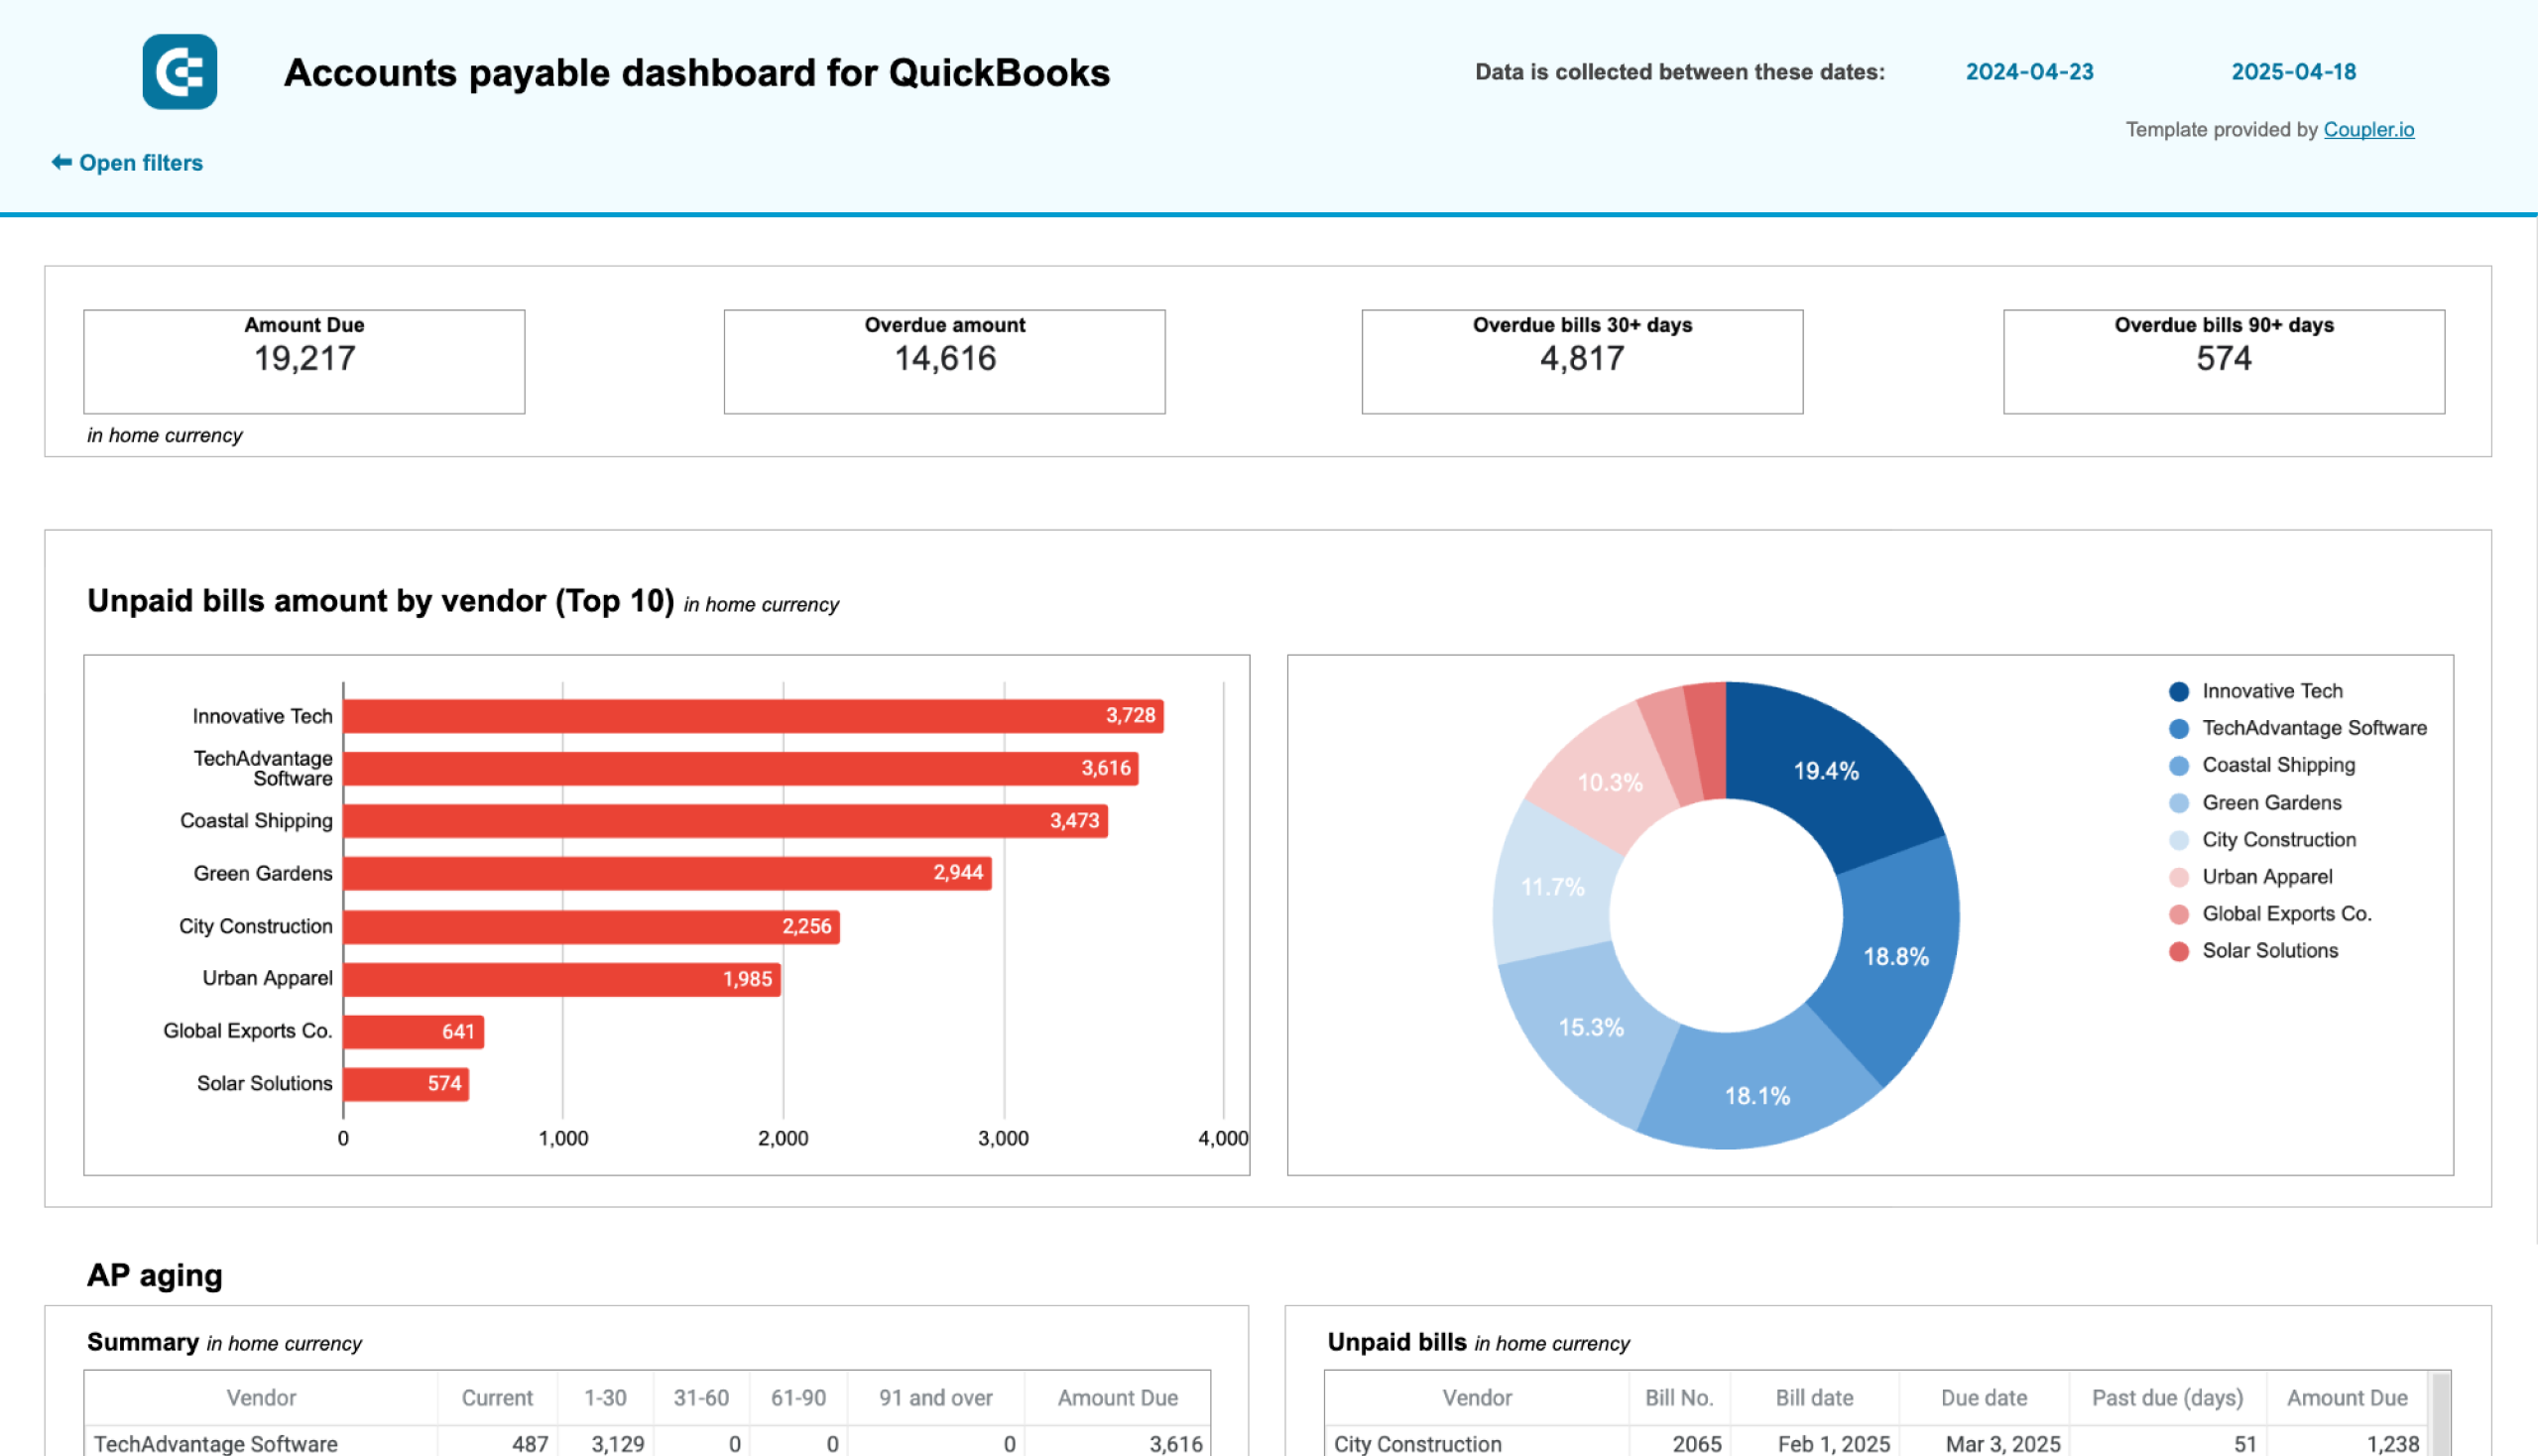
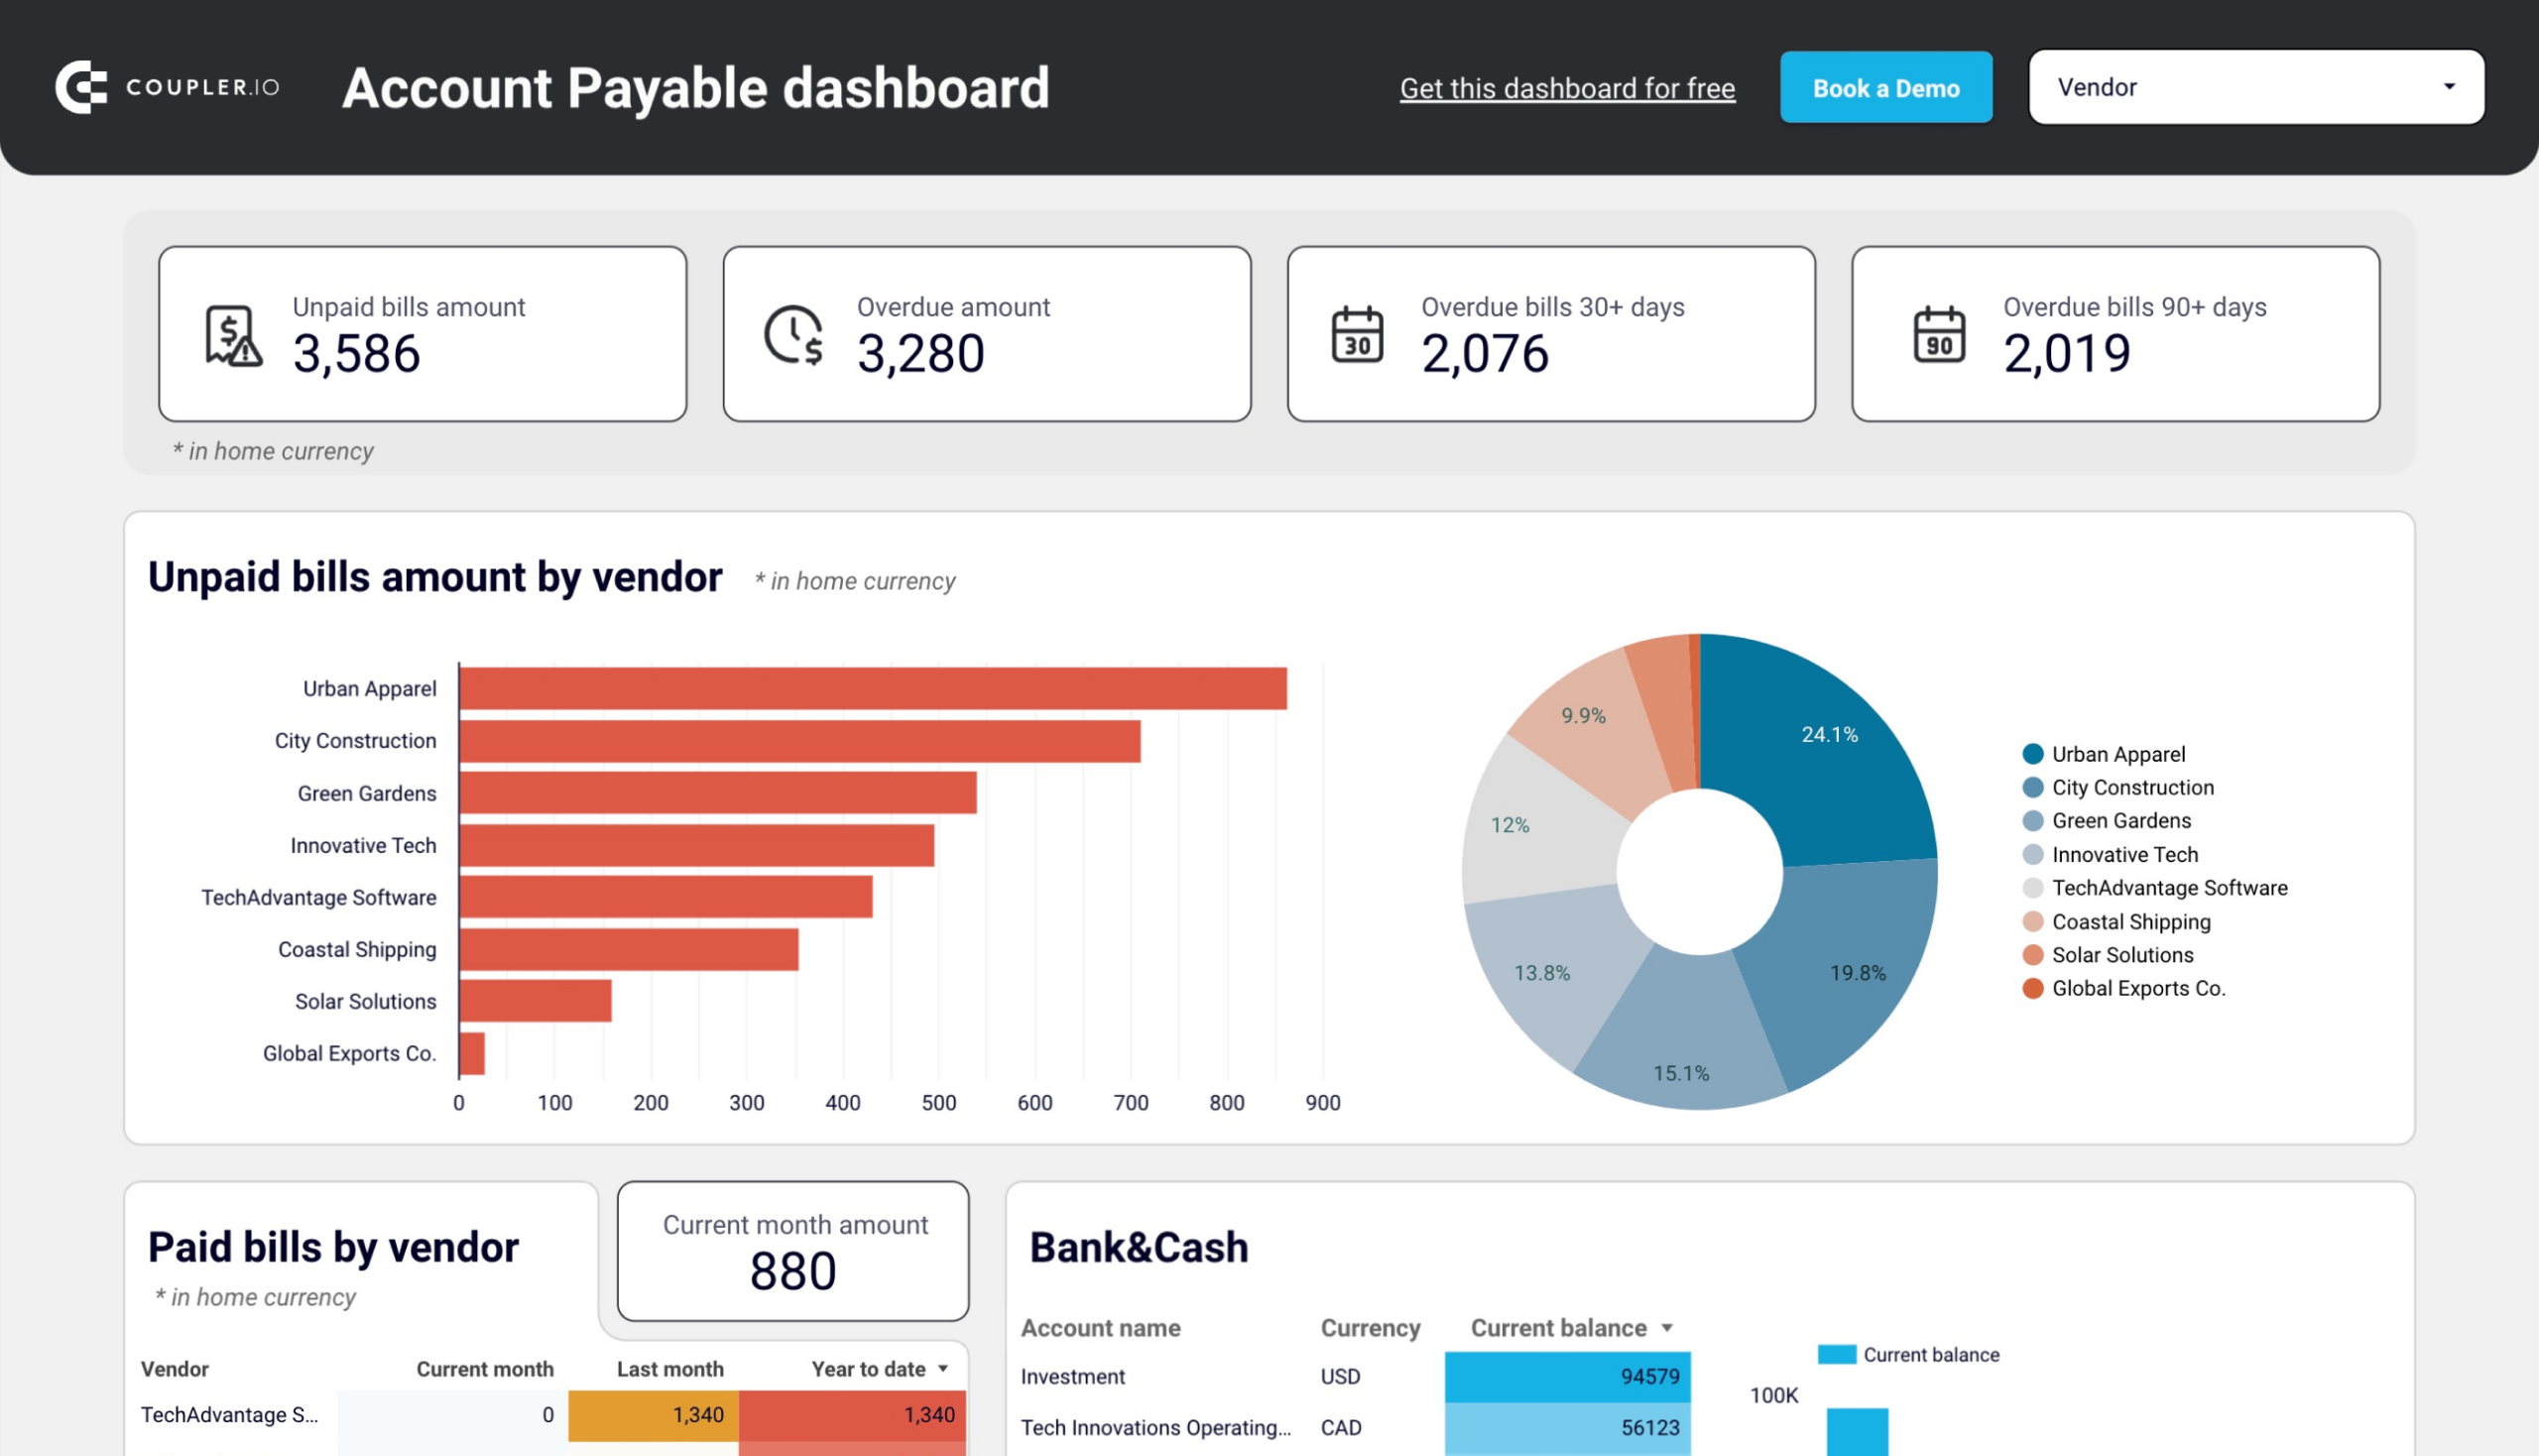
Accounts payable dashboard for QuickBooks
With this accounts payable dashboard, you can monitor your outgoing payments and manage your bills effectively. As a result, it lets you understand your payment obligations to avoid late fees.
Accounts payable dashboard for QuickBooks
 Preview dashboard
Accounts payable dashboard for QuickBooks
Preview dashboardThe QuickBooks dashboard reveals the following:
- Unpaid bills overview + filter by creditors: Check the amount of unpaid and overdue bills, with values displayed in the home currency. For unpaid bills, look at the top 10 vendors by credit debt. Additionally, see all the vendors and their share in your accounts payable, identify your major creditors, and prioritize payments to your vendors.
- Paid bills by vendor: Get a summary of bills from your vendors that were previously paid. Based on this data, evaluate your vendors by the size of the amounts you have paid to them to decide on payment prioritization for specific creditors.
- Bank and cash: Easily track your balance by accounts and currency to distribute your money correctly and prioritize payments.
- Aging of accounts payable: Explore the distribution of overdue amounts by vendor and period: current, up to 30 days, 30 to 60 days, 60 to 90 days, and 90+ days. Look at the vendors’ overdue bills that constitute your accounts payable.
- Vendor bills: View the details of all vendor bills, paid and unpaid, for the last 12 months in all currencies.
The dashboard is available in Google Sheets and Looker Studio. To start using it, click the template’s Readme tab and follow the straightforward setup guide.
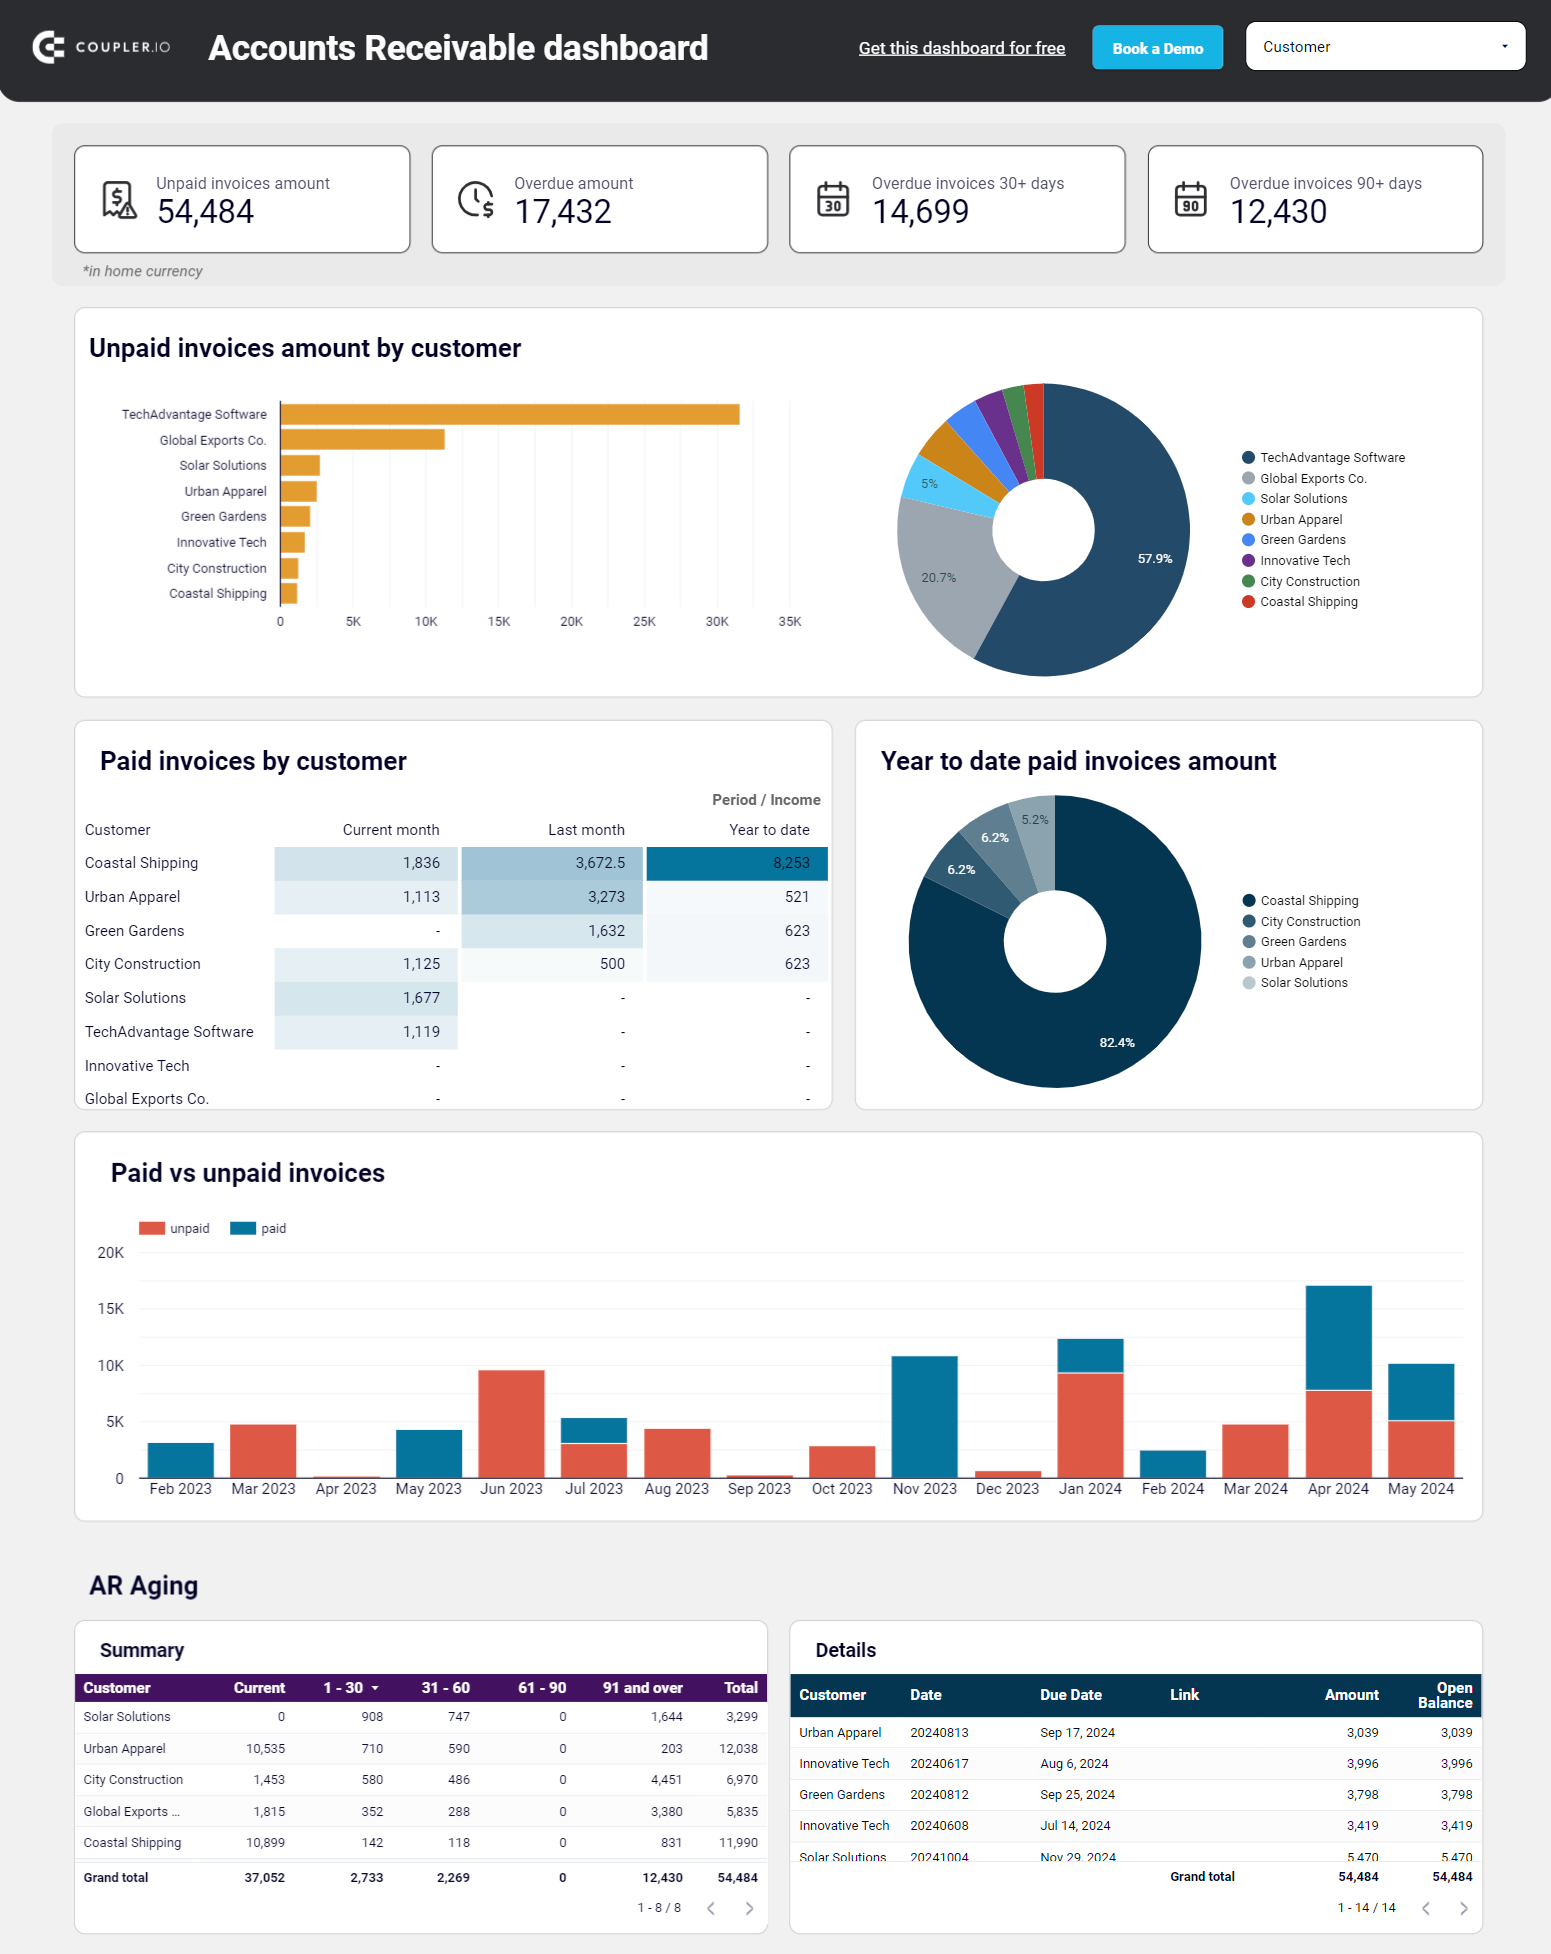
Accounts receivable dashboard for QuickBooks
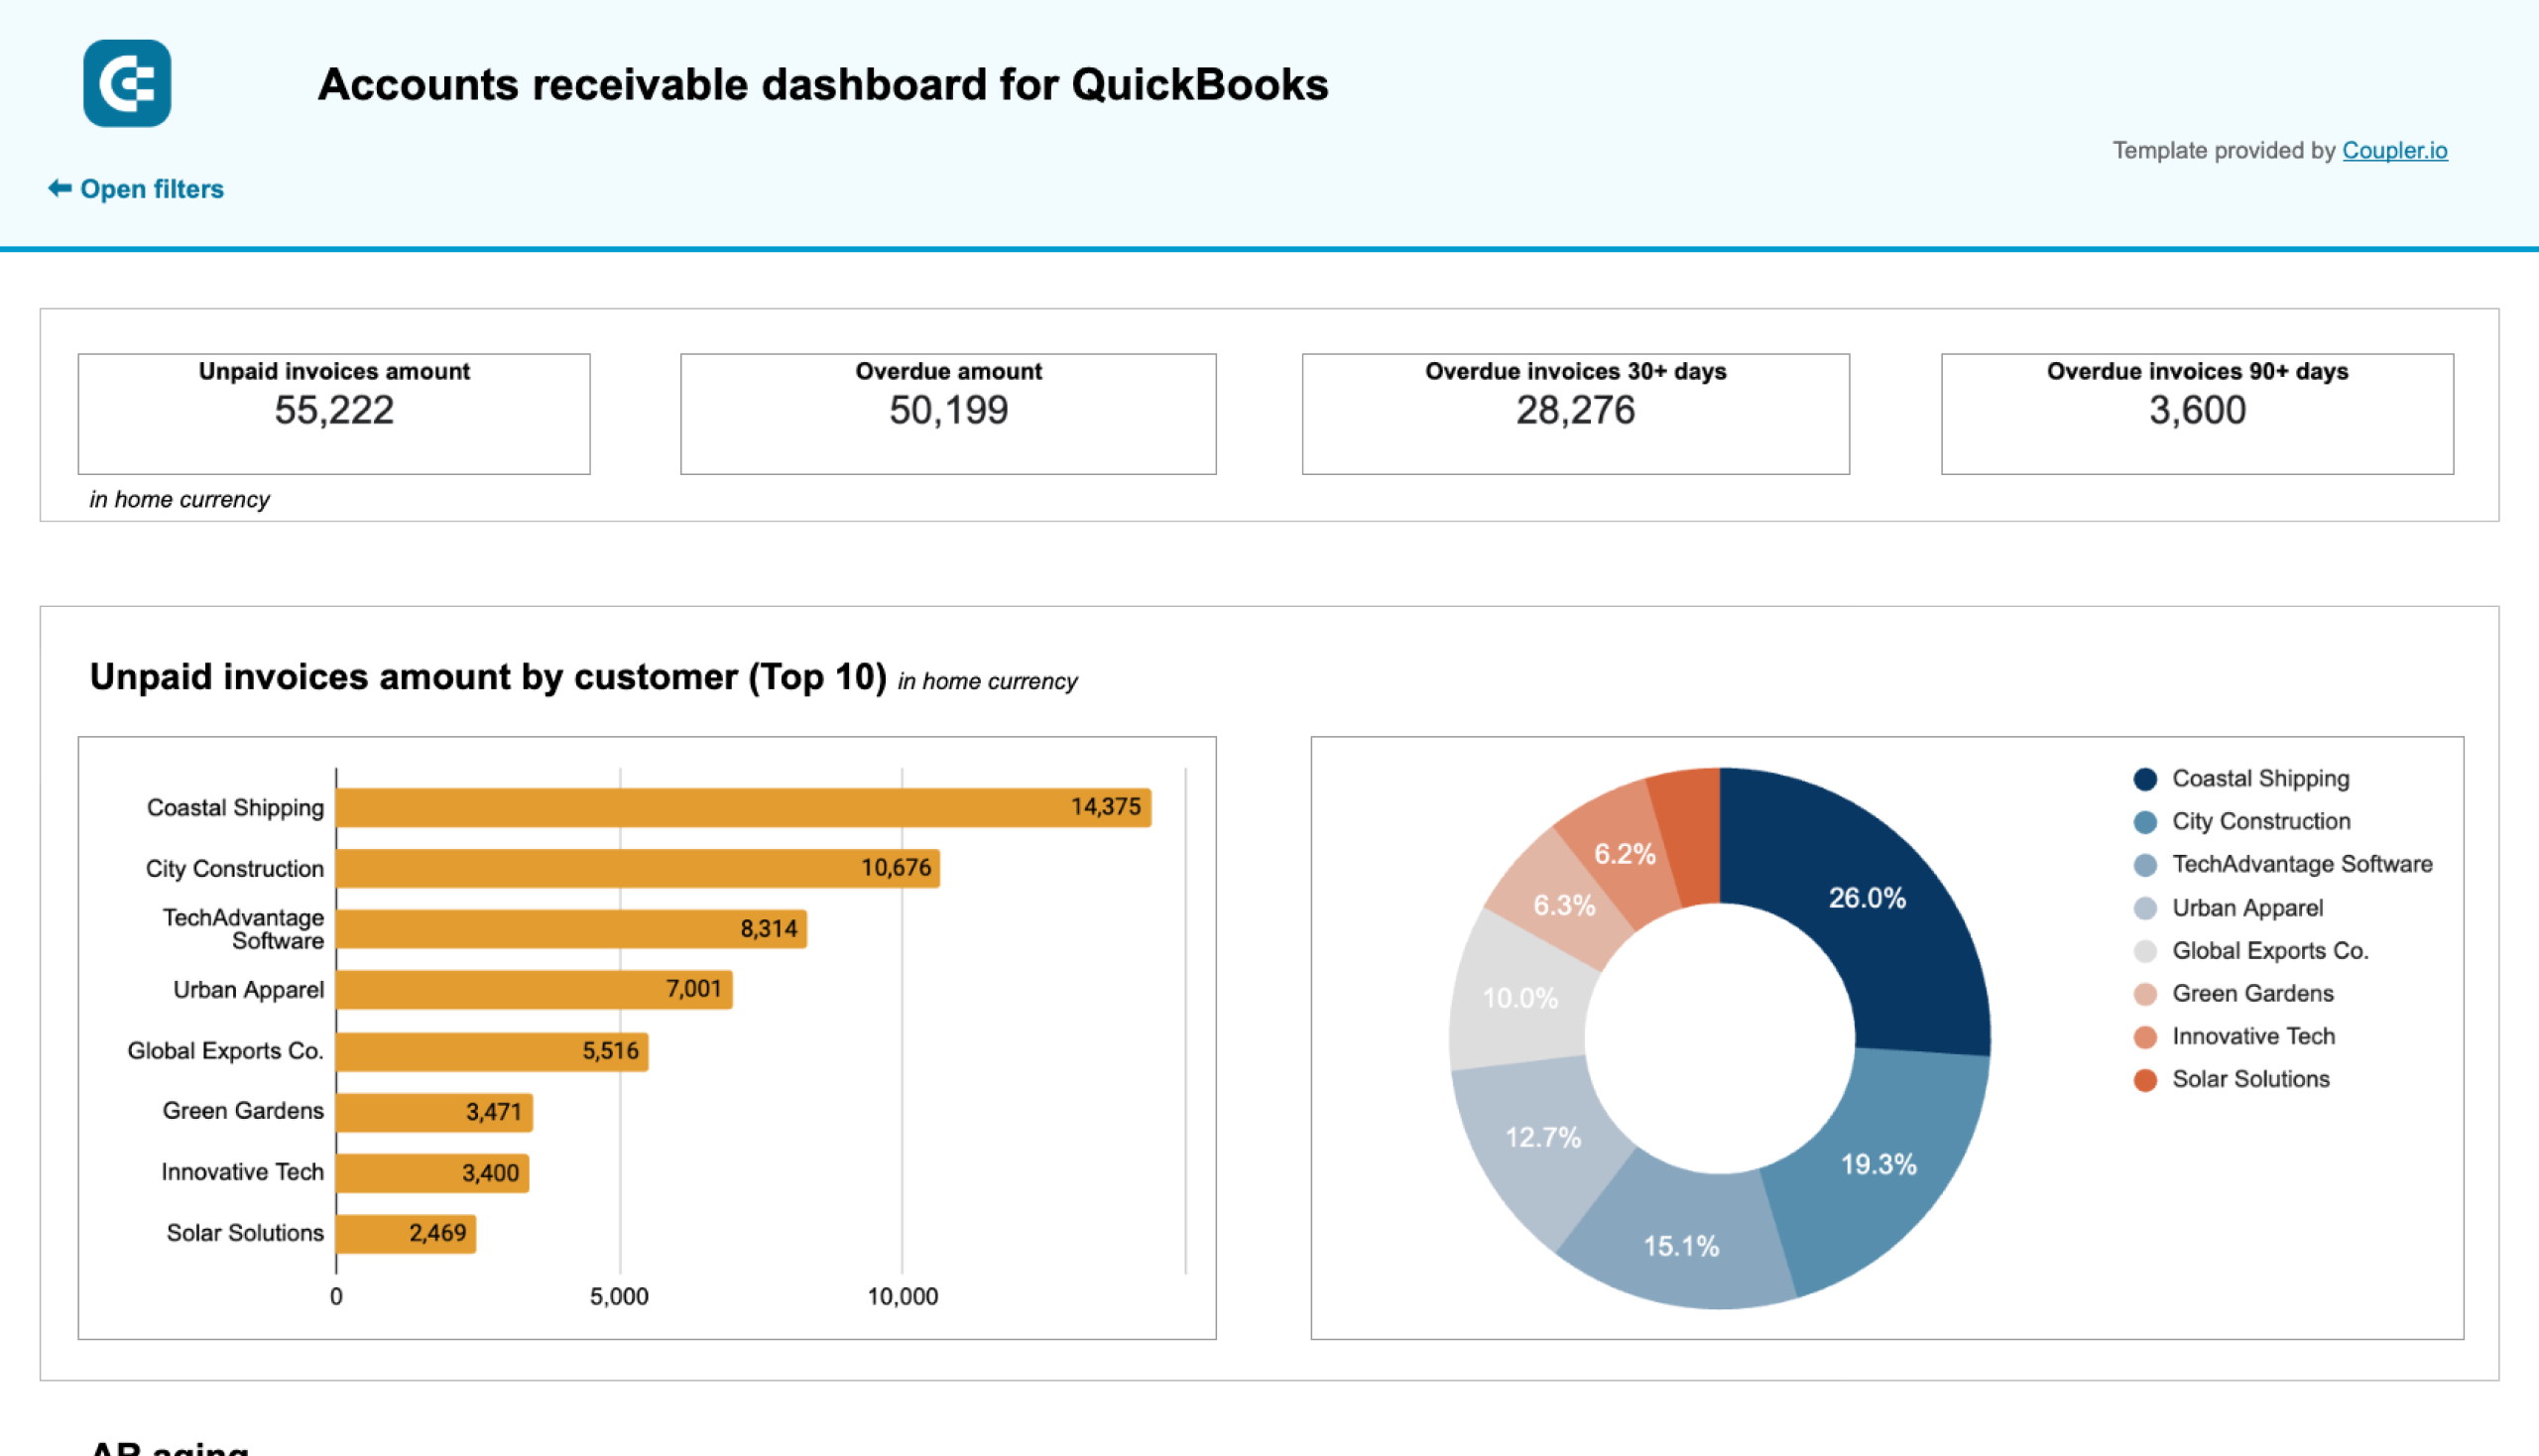
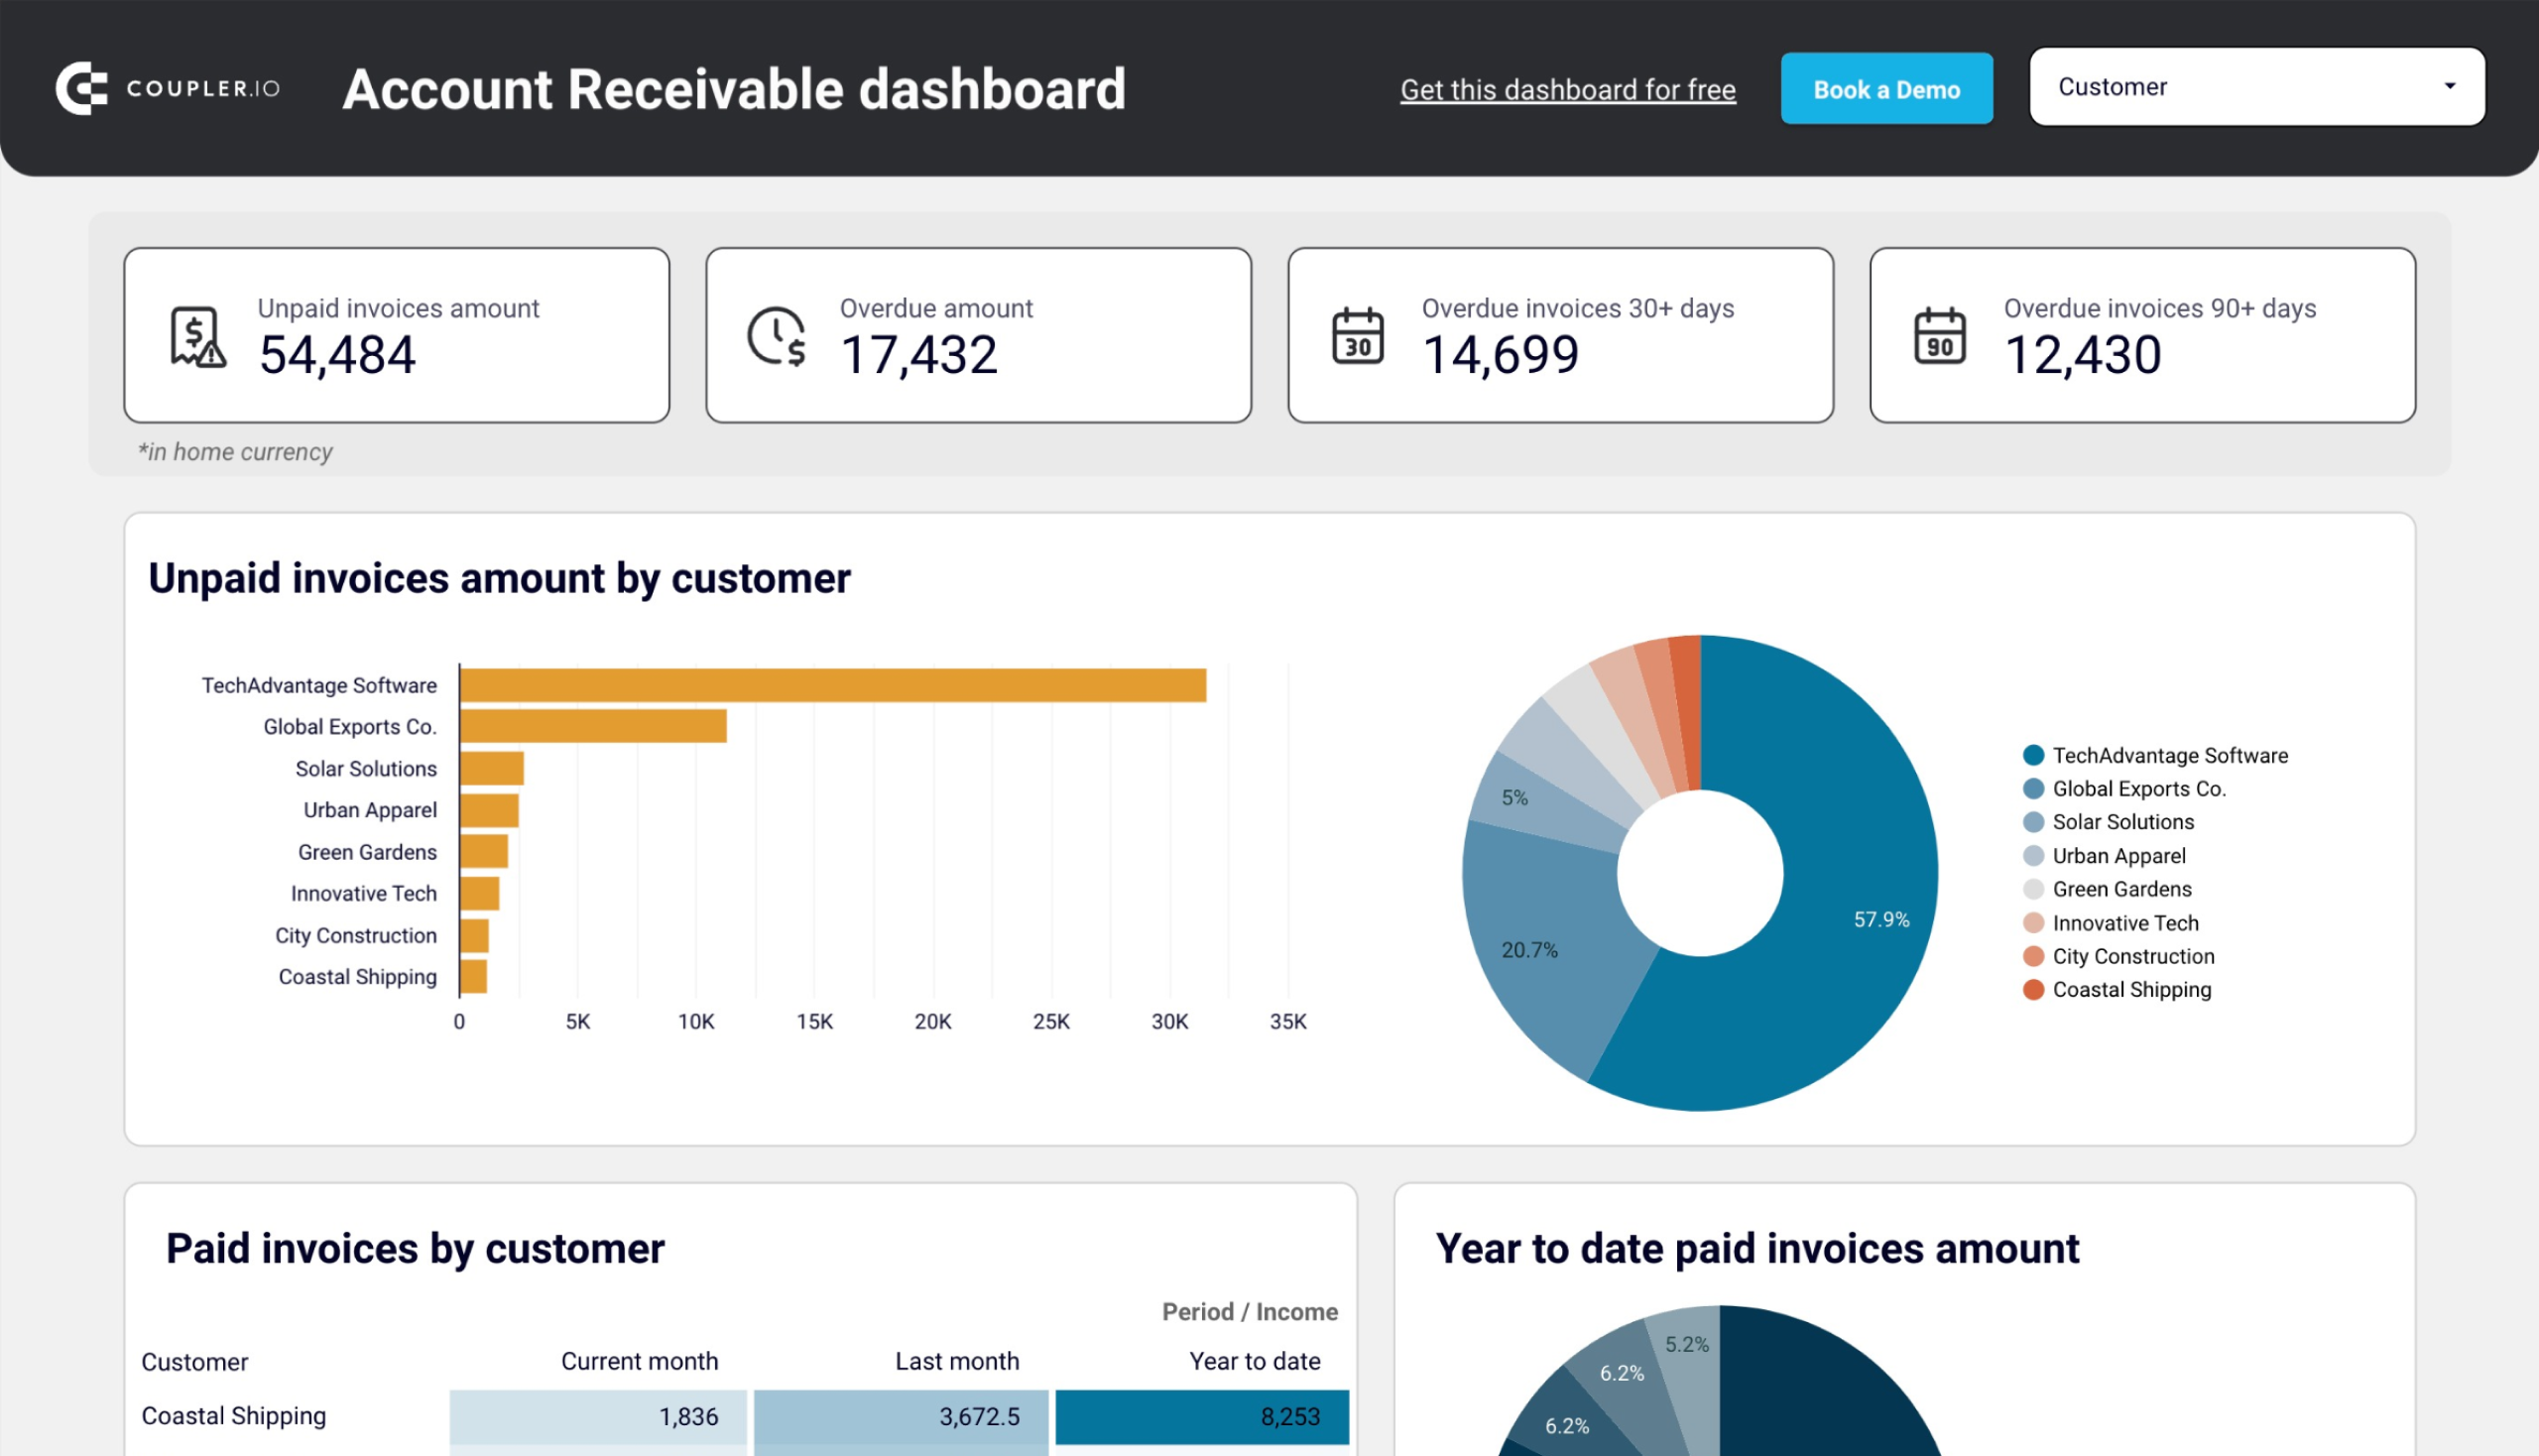
The accounts receivable dashboard enables you to track your incoming payments and ensure timely collections. This allows you to make decisions on communication with customers and activities to settle indebtedness and prevent a cash gap.
Accounts receivable dashboard for QuickBooks
 Preview dashboard
Accounts receivable dashboard for QuickBooks
Preview dashboardHere’s what you’ll learn using this dashboard:
- Unpaid invoices overview + filter by customers: Check the amount of unpaid and overdue invoices in the home currency. For unpaid invoices, see a selection of the top 10 customers by debit debt. Besides, view all the customers and their share of your accounts receivable. Based on this information, identify your major debtors and prioritize your activities to settle indebtedness.
- Paid invoices by customer + year-to-date amount: Gain insights into invoices previously paid by your customers. Evaluate your customers based on the amount of paid invoices and decide activities for debts to be paid off.
- Month-to-month invoice trends: Track the dynamics of paid and unpaid invoices from the monthly perspective.
- Aging of accounts receivable: Monitor the distribution of the overdue amounts by debtor and period: current, up to 30 days, 30 to 60 days, 60 to 90 days, and 90+ days. Discover the customer’s overdue invoices that constitute your accounts receivable.
- Customer invoices: Unpack the details of all customer invoices for the last 12 months, both paid and unpaid, for all currencies.
You can set up this dashboard in Google Sheets and Looker Studio. To get started, follow the instructions in the Readme tab to have your data visualized in the dashboard.
BONUS: Connect QuickBooks data to AI for conversational analysis
Dashboards show you the story at a glance. Traffic is up. Conversions shifted. Revenue grew 15%. They’re essential for monitoring performance and spotting trends quickly. But when you’re preparing for a meeting or making a decision, you often need to go deeper: Why did traffic spike on Tuesday? Which campaign drove those conversions? What changed compared to last month?
That’s when the clicking begins. You start filtering reports, comparing segments, cross-referencing date ranges, and jumping between views. What should take 30 seconds stretches into hours of manual exploration.
AI changes this completely. Instead of clicking through dashboards, you simply ask questions in natural language and get instant answers. “Which products had the highest return rate last quarter?” Done. “Calculate our monthly burn rate for the last 6 months.” Done. No manual filtering, no spreadsheet formulas, no waiting.
Coupler.io offers two ways to unlock AI-powered analytics for your QuickBooks data:
AI Integrations: Connect your data to external AI tools
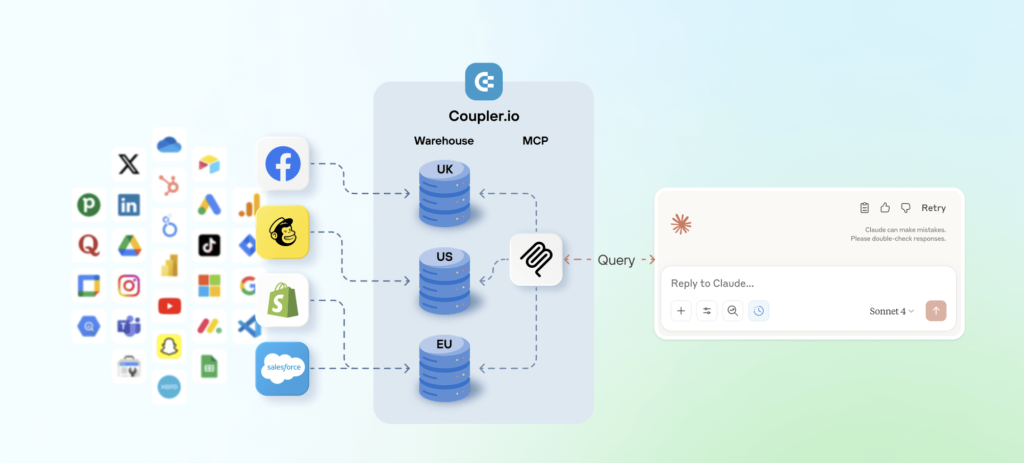
AI Integrations enable you to integrate your QuickBooks data flows with AI tools like ChatGPT, Claude, Cursor, and Perplexity. As a result, you can ask questions about your financial data through natural language and get instant, accurate answers powered by Coupler.io’s Analytical Engine.
When using AI Integrations, Coupler.io acts as the secure intermediary between your data and the AI tool. The AI never accesses your raw QuickBooks data. It can only query the processed, verified results from Coupler.io’s Analytical Engine.
Key benefits:
- Choose your preferred AI tool (ChatGPT, Claude, Cursor, Perplexity)
- Ask questions naturally: “What’s our customer acquisition cost by traffic source?”
- Get verified calculations and validated results—not AI guesswork
- Maintain full control over what data the AI can access
- Continue conversations with follow-up questions to dig deeper
Learn more about how to analyze QuickBooks data with AI.
AI Agent: Analyze data directly inside Coupler.io
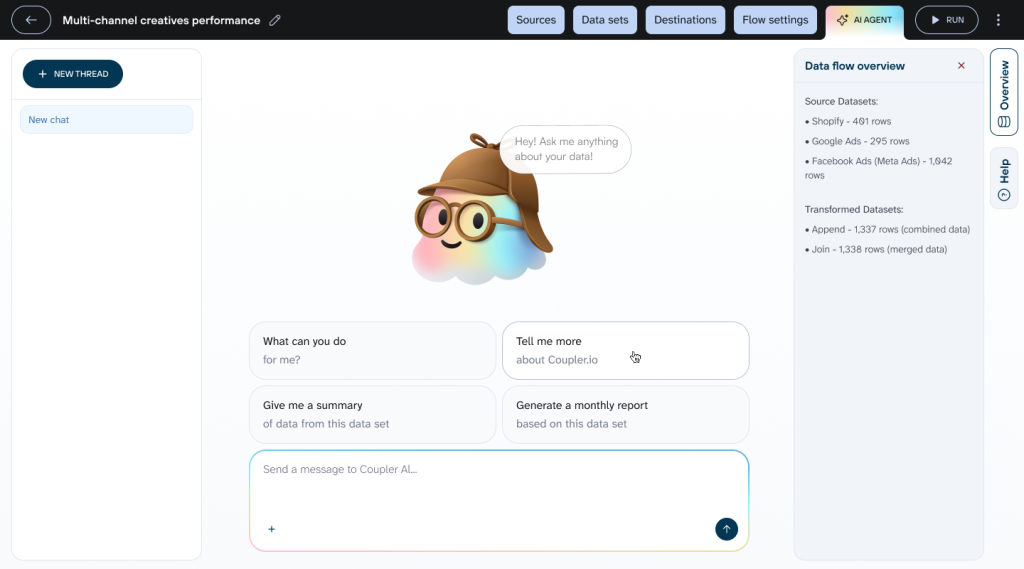
For users who prefer to keep everything in one place, Coupler.io provides an AI Agent for conversational analytics inside the platform without external AI tools. This means you can analyze your QuickBooks financial data in the same interface where you manage your data flows.
Coupler.io AI Agent is like having a data analyst on standby. It is ready to answer questions about your QuickBooks financials the moment you have them, right where you’re already working with your data.
Key benefits:
- Works immediately with your QuickBooks data flows—zero setup required
- Ask questions like “Which vendors account for 80% of our expenses?” without leaving Coupler.io
- Get accurate financial calculations powered by the same Analytical Engine
- Automatically refines unclear questions and suggests relevant follow-up queries
- Perfect for quick QuickBooks analysis during your workflow
Whether you choose AI Integrations for flexibility with your preferred AI tool or AI Agent for convenience within Coupler.io, both approaches transform how quickly you can move from questions to insights.

Integrate QuickBooks data with AI
Try Coupler.io for freeHow to export data from QuickBooks Online the native way
While Coupler.io provides data export automation, QuickBooks Online only enables you to perform occasional, one-time data exports.
These built-in methods are straightforward and don’t require any third-party tools. However, they’re best suited for manual, ad-hoc reporting rather than ongoing data analysis or automation. Let’s explore what’s available.
QuickBooks Export Data tool
QuickBooks Online features a native method for exporting various types of data into an Excel file. To find it, click on the gear icon in the top-right corner of your screen and select Export data.
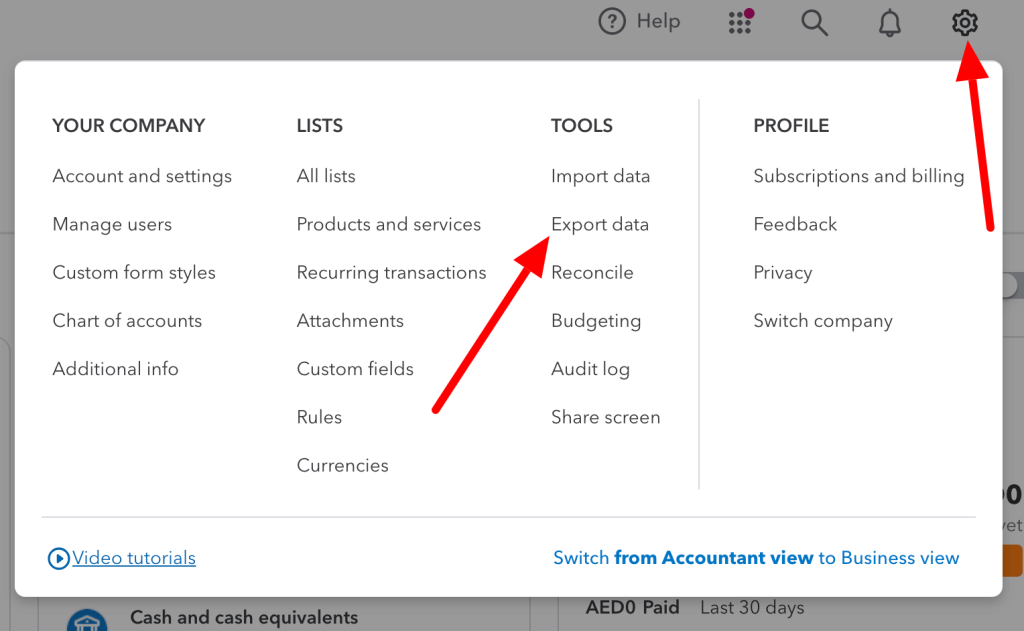
From here, you can export the following reports:
- General ledger
- Profit and loss
- Balance sheet
- Trial balance
- Journal
Read our blog post to learn how to export check register from QuickBooks.
There are also three lists available for download: Customers, Employees, and Suppliers.
Toggle on and off the reports you wish to fetch, and then press the Export to Excel button.
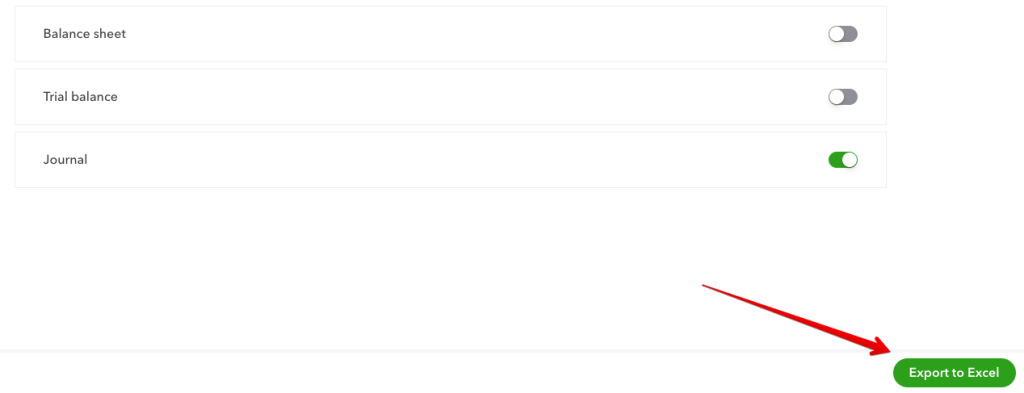
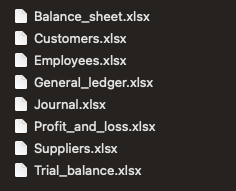
A .zip file will download, containing separate .xlsx files for each report that you picked.
Fetch QuickBooks reports manually
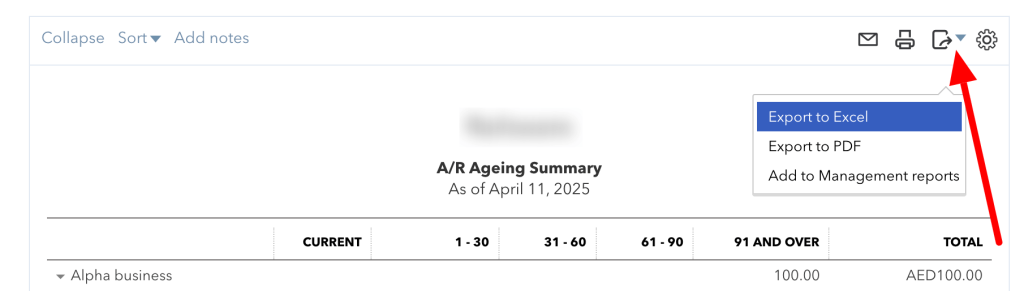
Another place where you can export QuickBooks data is the Reports tab. There, you’ll find dozens of standard QuickBooks Online reports, as well as an option to create custom reports.
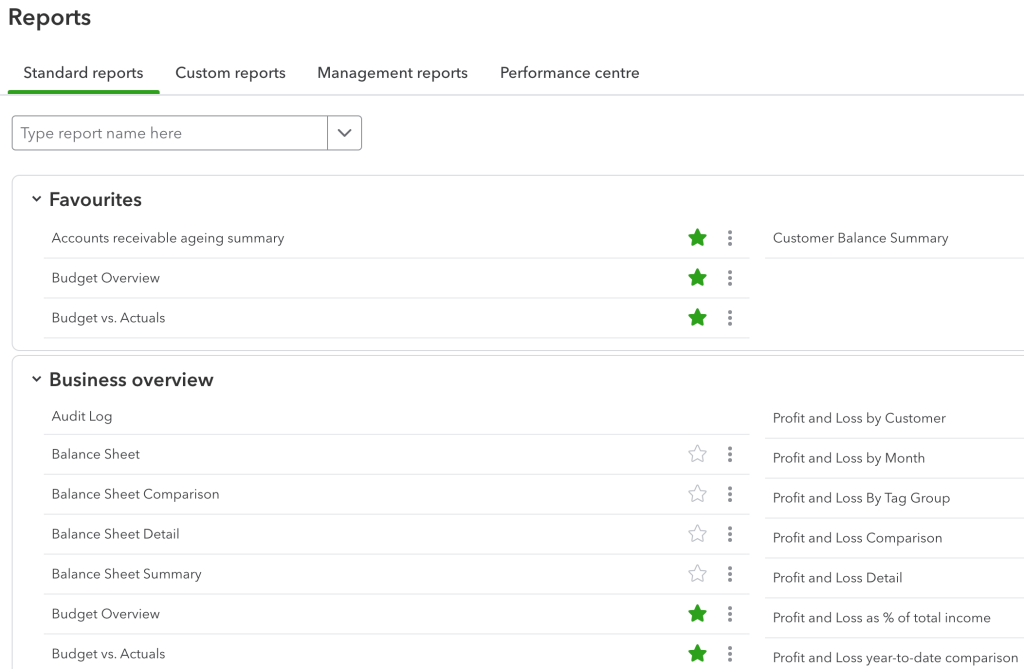
Click on any to view it. Click on the icon above to export QuickBooks to Excel file. A PDF download is also available now.
Limitations of manual data exports from QuickBooks
As you can see, it’s simple to export data from QuickBooks online using the native method. However, easy doesn’t always mean convenient or sufficient. These exports are problematic for several reasons:
- You have to export manually each time you need a report. It’s suitable if you only need a few reports but for weekly or monthly reporting on different things. Then, it can become overwhelming.
- You can only export QuickBooks to Excel and PDF files (for the more detailed reports). If you’re more accustomed to, e.g., Google products, you’ll have to import each file into a spreadsheet and hope it formats as expected.
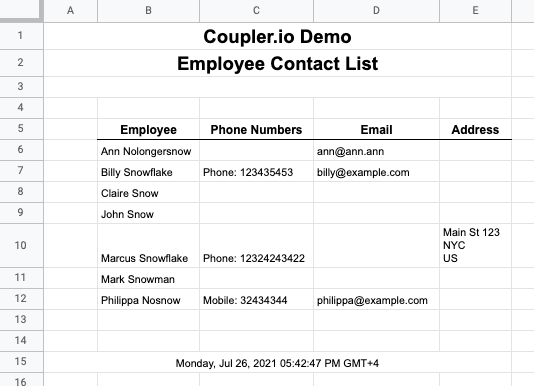
- Most reports show only the basic data. For example, the report we generated for our sample employees contained only the four basic data fields. If you need to fetch, for example, their hire data or hourly wage, you’ll have to resort to other methods.
Terminal 1 faced these same challenges and solved them by automating daily reports that combine data from different QuickBooks entities with Coupler.io. The result is significant time savings and zero manual errors. Jennifer Chan, their Head of Admin & IT, notes:
Coupler.io is really useful for automating our processes and merging data from different apps. I don’t have a technical background, yet I found it easy to set up and use.
FAQ on exporting data from QuickBooks Online
How to export employee data from QuickBooks
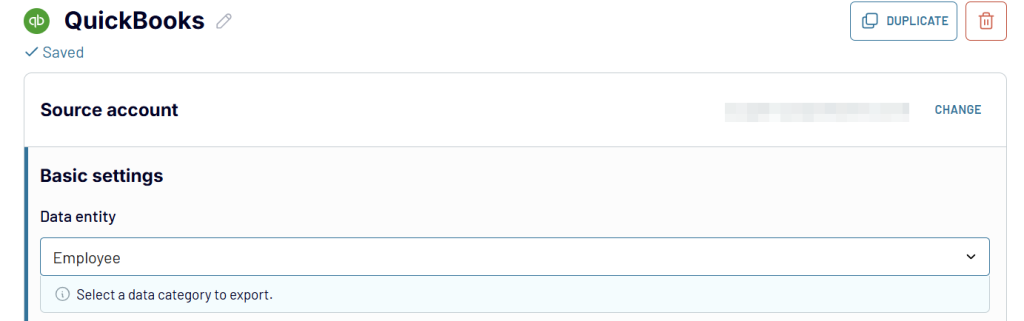
You can export the list of employees directly from QuickBooks Online. But, as we mentioned earlier, the file will be limited. For that reason, it’s better to set up Coupler.io so it can fetch the list of employees for you – for example, once a week.
While configuring the source, pick Employee from the Data entity list. Proceed as previously and import to the chosen destination.
The advantage of having this data in a spreadsheet is that you can manipulate it how you want. For example, you could sort the list of employees by seniority, build a pivot table based on locations, or feed the list of birthdays or anniversaries into another tool and make this a special day for your people.
We’re doing exactly that at Coupler.io. We export details such as the hire date or an employee’s birthday into Google Sheets. Then, we feed this data to a Slack bot.
Both operations happen automatically, and the data will refresh when people join or leave. The result is some pretty nice notifications pushed in our Slack channel by the most reliable kitchen bot.

How to export customer data with QuickBooks
Customer reports are available in the Export data menu, just like the employee reports. But they are limited. For that reason, you may want to incorporate Coupler.io same as we did for the earlier data entity.
The only difference will be the Data entity – in this instance, it should be Customers.
How to export customer data with notes from QuickBooks
When you export QuickBooks data directly from the QuickBooks Online dashboard, customer export comes without notes (and plenty of other vital details). Of course, this is something you want to have easy access to, without the need to open each customer’s tab in QuickBooks.
Coupler.io addresses the lack of notes when you use the tool to export the customer data, the same as we described above. Notes are one of the data fields you’ll see in your spreadsheet.
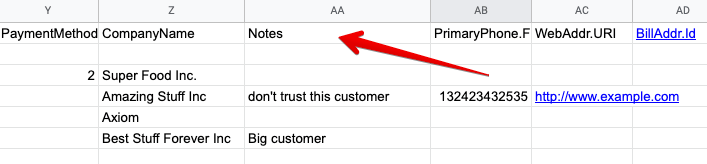
Please note: If no notes are available for any customers, this field won’t be imported.Bill – Bill data encompasses all vendor bills, including details about the vendor, amounts, due dates, and payment statuses. This information allows you to manage payables, track expenses, and ensure timely payments to vendors.
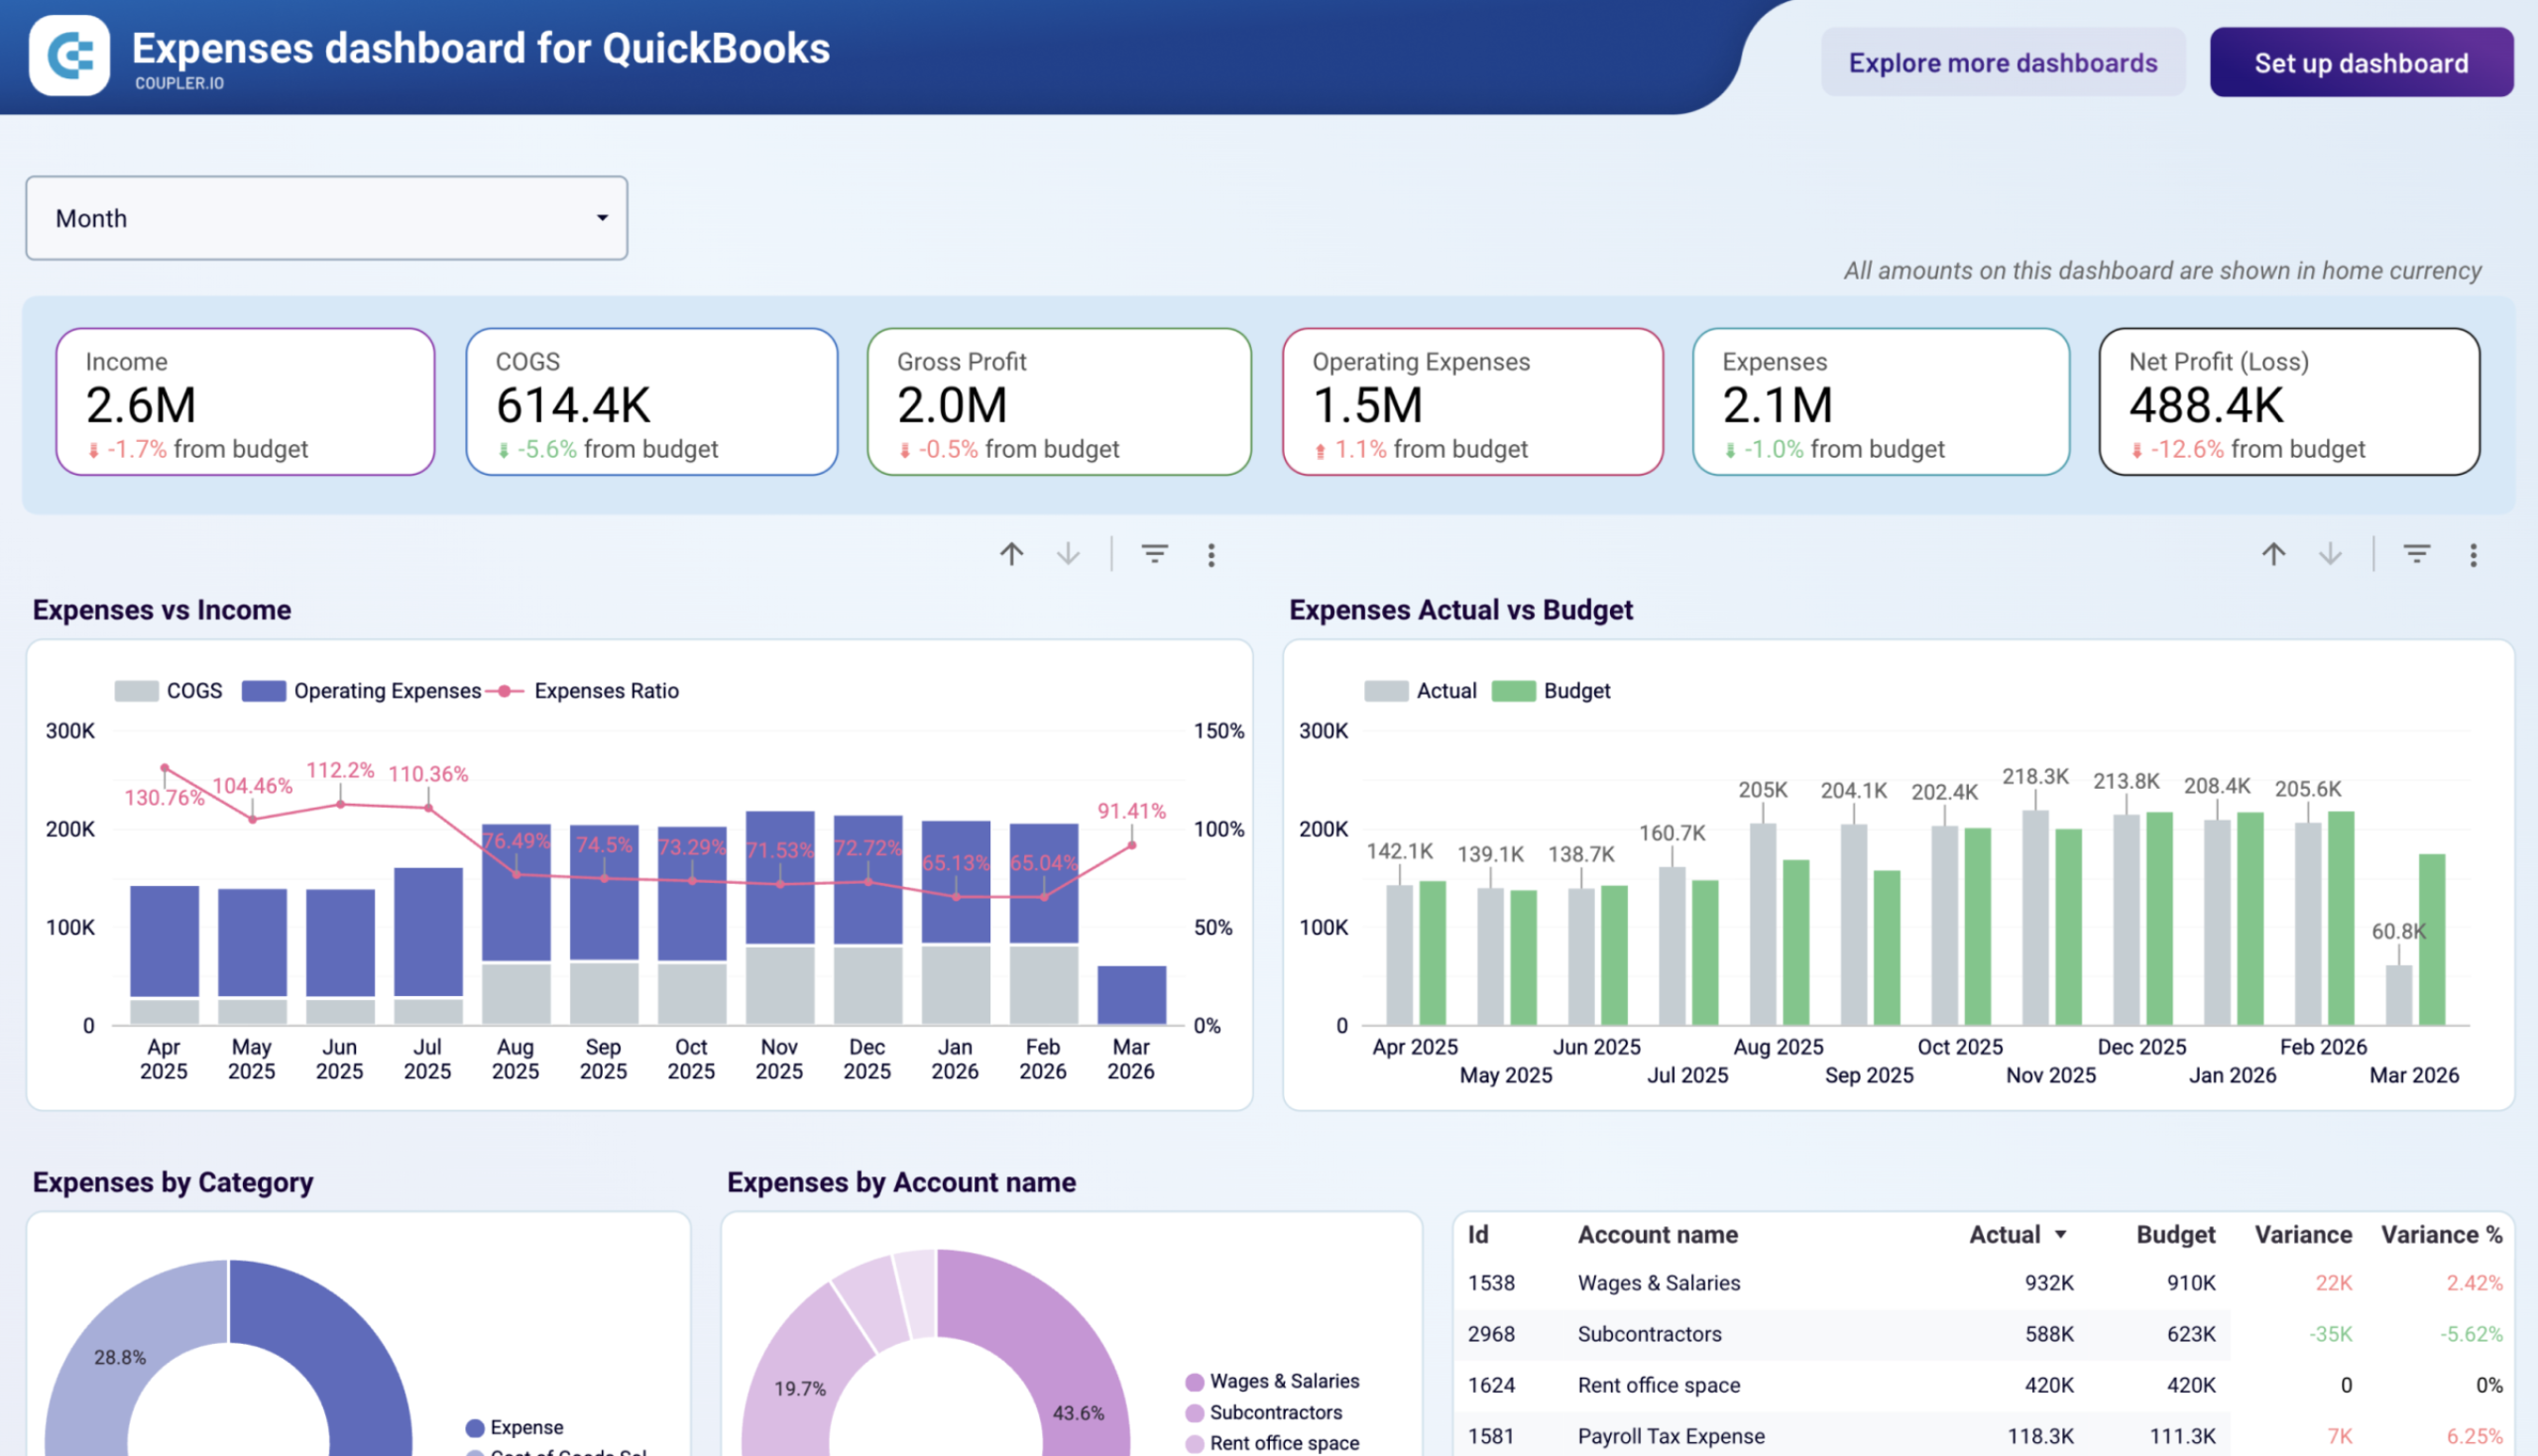
Here’s what you’ll learn using this dashboard:
- Actual vs. budget by month: See whether the business is running over or under plan in each period, and whether variances are isolated or part of a widening trend.
- Account-level variance breakdown: The Expenses by Account name table shows actual spend, budget, and both the absolute and percentage variance for each account — the detail you need to explain an overrun line by line.
- Expense composition by category: Donut charts show how spend is distributed across cost types, making it easy to spot shifts in cost structure before they show up in the P&L.
- Top vendors by paid bills: A ranked table covers current month, last month, and trailing 12-month spend per supplier — useful for identifying concentration risk and preparing for contract reviews.
- Cash balance, burn rate, and runway: KPI cards show how sustainable current spending is relative to available reserves.
The Expenses dashboard for QuickBooks is available as a Looker Studio template with a built-in Coupler.io connector. Connect your QuickBooks account and follow the setup instructions to populate it with your data.
How to export enterprise data from QuickBooks
Whether you are on an Enterprise or any other plan, exporting data looks exactly the same. You can export many different data entities with Coupler.io in the same way as we described in the earlier chapter.
It also lets you schedule exports of numerous QuickBooks reports, as outlined in our article on exporting QuickBooks reports.
Please note that any custom reports you create with Enterprise’s Advanced Reporting won’t be, at this point, available for automatic export with Coupler.io. You can still export it manually, as we explained earlier.
How to export estimate data from QuickBooks?
If you wish to fetch the estimates, all you need to do is swap the data entity in Coupler.io. Follow the earlier steps to export QuickBooks data automatically. When picking the entity, choose Estimate and run the data export.
The latest estimate data will be quickly fetched into your spreadsheet and updated automatically according to a chosen schedule.
How to export time data from QuickBooks
Exporting time entries from QuickBooks works in the same fashion. Set up a Coupler.io data flow and pick the TimeActivity data entity.
How to export sales data from QuickBooks
The best way to retrieve sales data is to import QuickBooks reports with Coupler.io. Follow the earlier steps. In the form below, we preselected QuickBooks Reports as an application (instead of just QuickBooks). Choose the desired destination app and click Proceed.
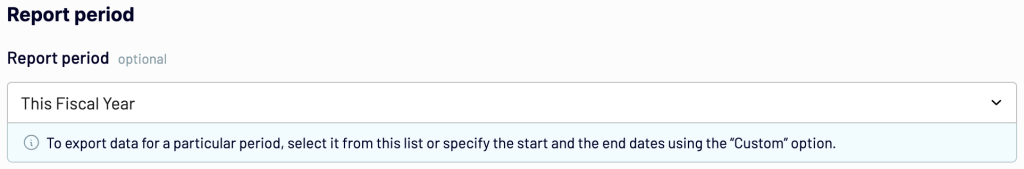
Then, pick from one of the four available sales reports. You can also choose the period for which you want to generate the report. As well as generate more detailed columns.
How to export invoice data without tax from QuickBooks?
You can pull the list of invoices from QuickBooks in the same way we pulled estimates, time entries, customers, and a few other entities. When setting up the source, be sure to pick Invoice this time.
Note that each invoice will take a few lines of your spreadsheet. There will be one line for each of the products or services mentioned on an invoice. Plus, a separate line summarizing what’s on the invoice (even if there’s just one item).
You may need to fetch the invoice data without tax. The imported file is quite detailed and contains all the information you need. Look at the following columns:
- GlobalTaxCalculation states whether tax is included in the price, excluded, or not applicable.
- TxnTaxDetail.TaxLine.0.TaxLineDetail.NetAmountTaxable shows the net taxable amount.
- TxnTaxDetail.TotalTax displays the total amount of tax that was charged.
- TotalAmt is about the total amount on an invoice
Depending on your taxation policy, find the most applicable column and apply it to your calculations.
Benefits of exporting data from QuickBooks
Regular, automated data exports from QuickBooks can be beneficial both for you and your business.
Working with QuickBooks data, you frequently need to look up different numbers, check reports, or generate them yourself. Pulling the data that matters to you directly into a spreadsheet makes it so much simpler – not only to access it but also to manipulate it or feed it to other services.
If you can automate QuickBooks data export, it’s even better. You’ll get rid of the mundane tasks of exporting reports and, perhaps, also converting them into the desired output. You’ll make better use of your time.
Analyzing data from a spreadsheet becomes more manageable when using tools such as Tableau or Looker Studio. You’ll have a better overview of the state of your finances and will have a QuickBooks backup available with barely any effort on your side.
Automate QuickBooks data export with Coupler.io
Get started for free