Ads Manager shows what a lead cost you this week. But the more useful question is whether that number is creeping up, and which campaign is pushing it. With Coupler.io, you get a cost-per-lead trend that answers both and stays up to date. Here’s how to set it up in a few minutes.
Step 1: Connect your Facebook Ads to Coupler.io
The quickest start is right inside Coupler.io. Sign up for free and open the AI Agent to ask about your data on the spot.
Prefer to work in Claude or ChatGPT? Add the Coupler.io connector to your AI tool once.
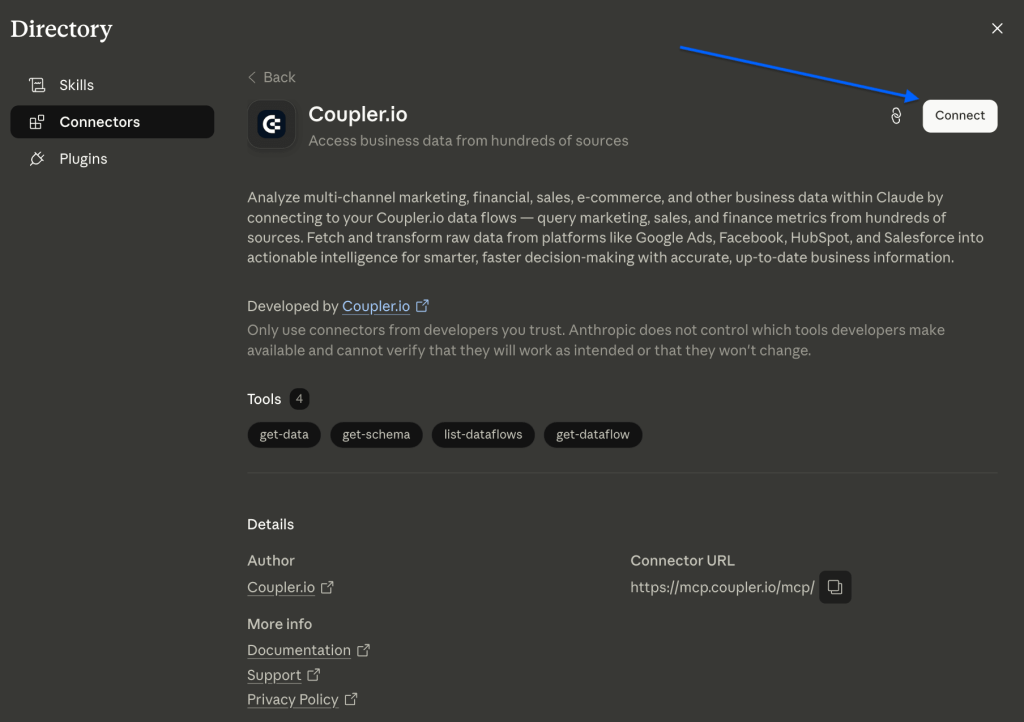
After that, just ask AI to set up the Facebook Ads data flow for you. If it’s your first time, AI will ask you to authorize the accounts you connect.

Know what every Facebook lead costs, week by week
Try Coupler.io for freeStep 2: Ask for your cost per lead trend
Describe the report in one sentence, for example: “Show my Facebook Ads cost per lead by week for the last 90 days, split by campaign.”
Cost per lead is ad spend divided by the number of leads. The AI pulls both for the period you named, groups them by week, and returns a table or chart showing how CPL moved for each campaign.
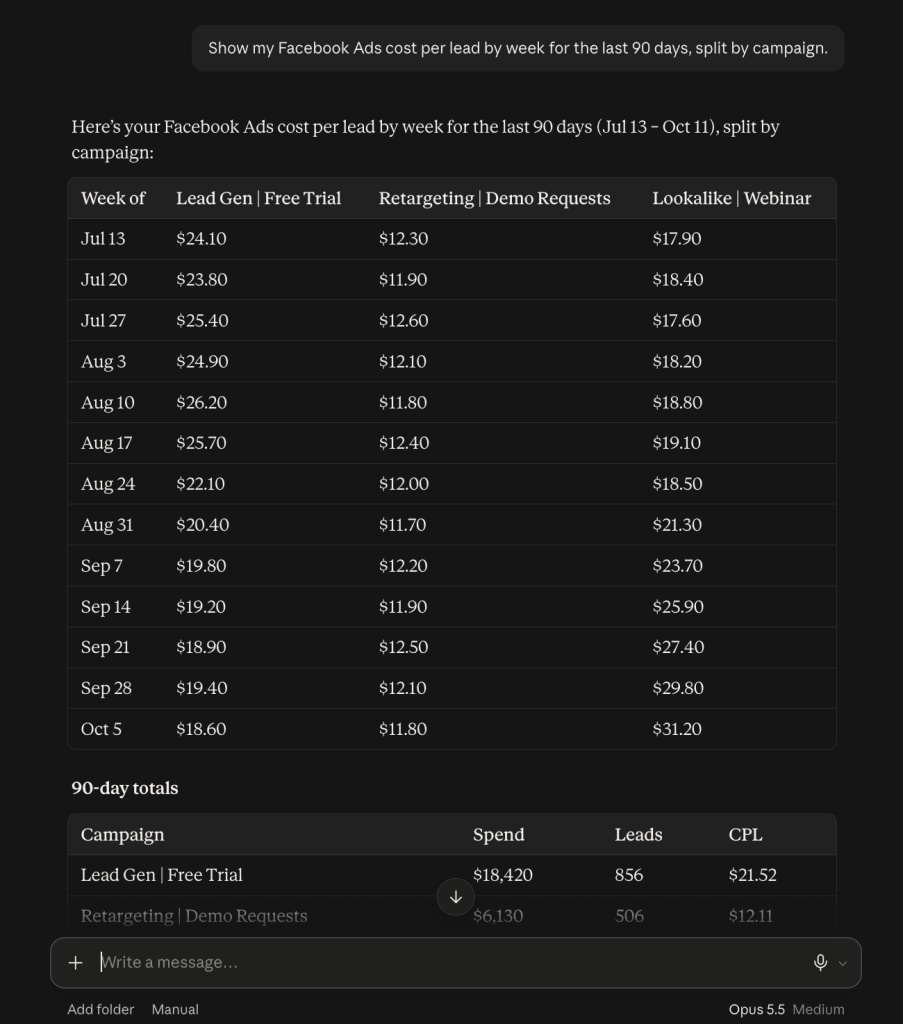
Two small choices make the trend more reliable:
- Weekly over daily. Daily CPL jumps around when a campaign gets only a few leads a day. Weekly numbers show the real direction.
- Name the lead type. Meta reports leads from its lead forms and leads from your website as separate metrics. Say which one you mean, so each week compares like with like.
| Why not plug Facebook Ads straight into your AI tool? A pasted export is a static snapshot that the model reads as text. It can miscount rows or get the division wrong, and it’s out of date by tomorrow. Coupler.io gives your AI tool structured data that refreshes on a schedule, and its Analytical Engine runs the calculations against your actual data. The engine calculates your CPL from live numbers, and the model explains what changed. |
Get CPL analysis on live data with Coupler.io
Get started for freeStep 3: Keep the trend updating on its own
Ask the AI to refresh your Facebook Ads data daily. Each time you come back, the trend already includes the latest week.
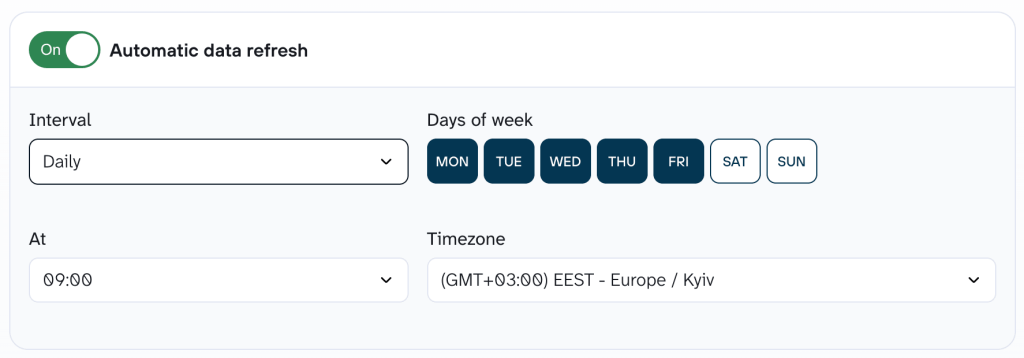
Need to share the numbers with a teammate or match them against your CRM? Ask it to send the same data to Google Sheets and other tools you’re using, on the same schedule.
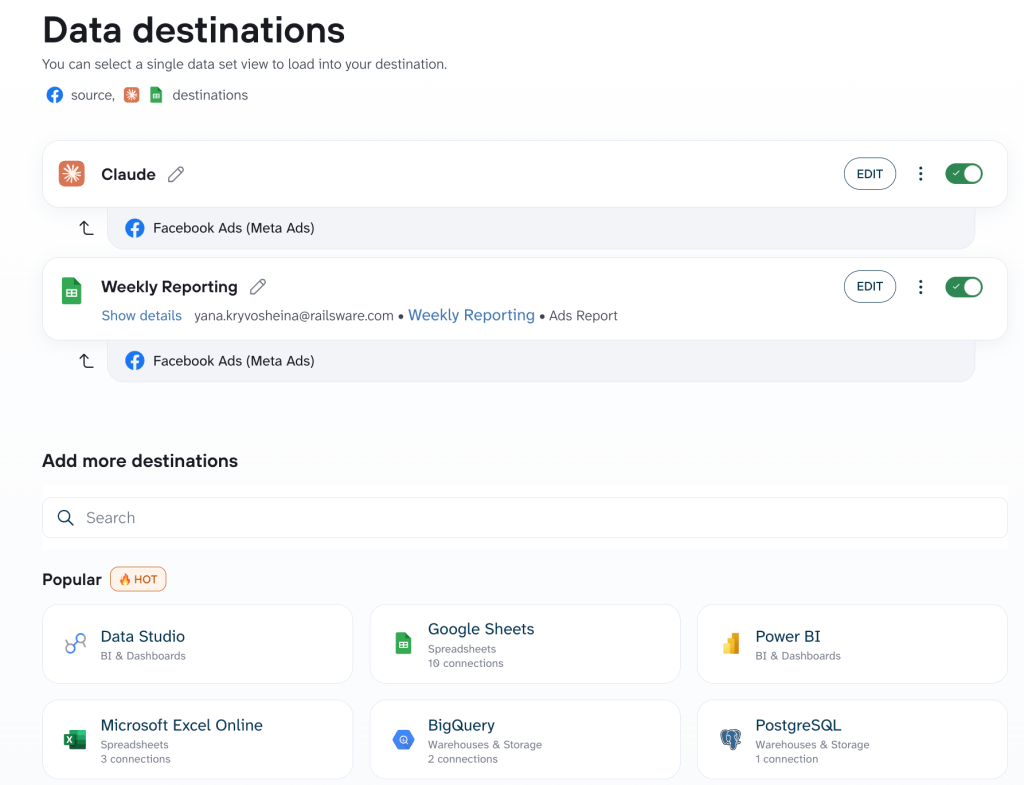
Step 4: Find out what’s moving your CPL
With the trend in place, follow-up questions take seconds:
- “Which campaign’s cost per lead rose the most over the last four weeks?”
- “Did CPL change after I raised the budget on [campaign]?”
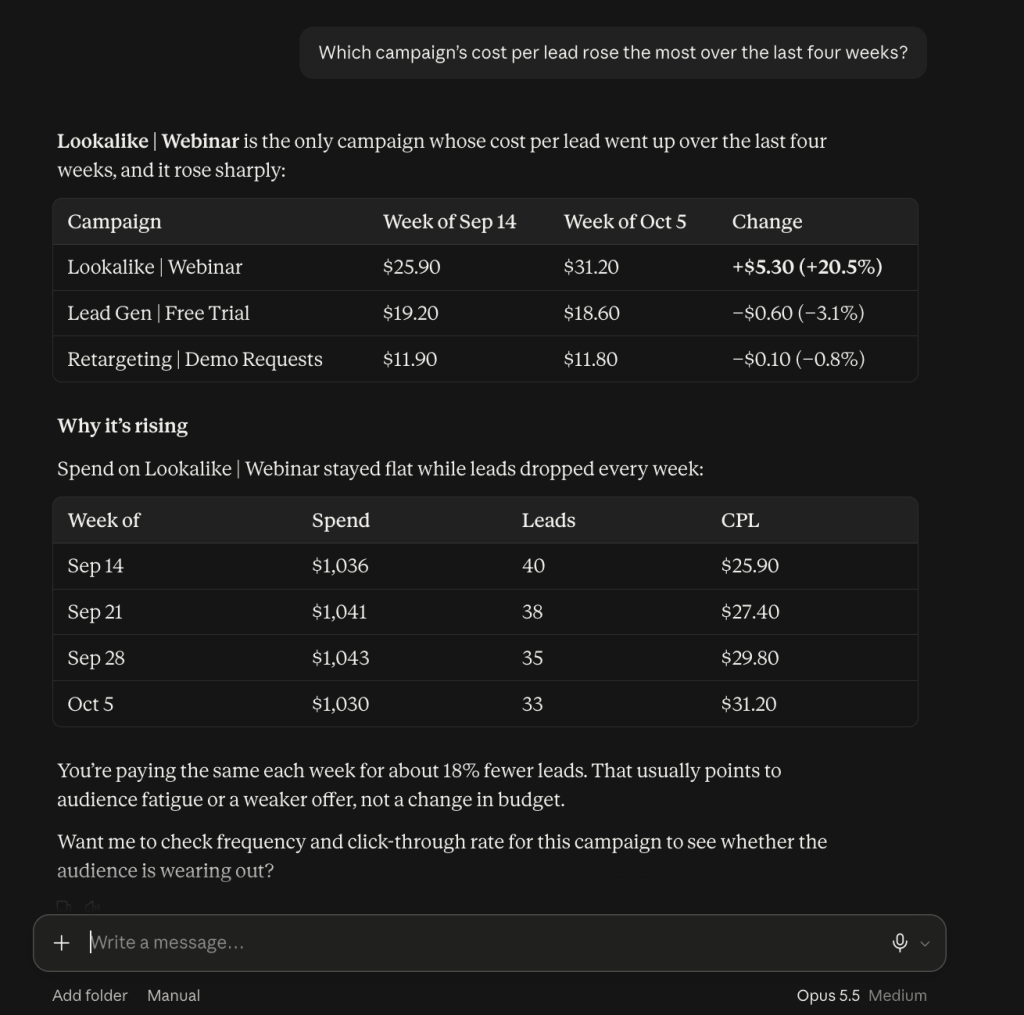
For a deeper answer, run one of Coupler.io’s ready-made AI Agent Skills. The Facebook Ads performance report skill breaks down why cost per result moved and which campaigns drove it. If one campaign keeps getting pricier, Facebook Ads creative fatigue shows which ads are wearing out and which to refresh first.
Build lead cost reporting across ad platforms with Coupler.io
Book a demoWant a visual view instead? The Facebook Ads leads dashboard template puts CPL and lead trends next to your spend.
Set it up once, and your cost per lead is updated whenever you check it. Every change is one question away.