Let’s say you’re analyzing a product sales report. Drawing sensible insights from it could be challenging if you’re only using Table or Matrix visualizations. It can be eye-straining to look up the numerical figure for each row. Now imagine the same report but with different background colors (green to red) for revenue figures from high to low. Much better, isn’t it? Well, this can be achieved by using conditional formatting in Power BI.
It allows you to dynamically set formatting (like background color, text color, etc.) to table cells and other visualizations based on conditions. Power BI conditional formatting helps highlight specific values or data and it makes Power BI reports easy to read. In this blog post, we’ll learn how to use Power BI conditional formatting for different visualizations, along with some expert tips at the end.
How to apply conditional formatting to Table/Matrix in Power BI?
In Microsoft Power BI, conditional formatting is primarily used for tables and matrices. You can dynamically set the following types of formatting to table columns or matrix values based on specific conditions, data, or values:
- Background color: Change the background color of the cell
- Font color: Change the text/font color of the values
- Data bars: Show bars for the values in the cells
- Icons: Show icons based on the values in the cell
- Web URL: Convert field value to web URL (clickable link)
Now, let’s see how to apply conditional formatting to a table or matrix in Power BI through an example tutorial.
Suppose you have a product sales table containing columns for product name, price, number of orders, and total revenue. And you want to change the background color of the revenue column depending on its value.
Connect data sources to Power BI
First, you’ll need to add a data source to your report. You can pick an existing dataset available in your organization or connect new data sources. Power BI supports native connectors for multiple types of data sources. You can go to Home > Get data and configure the data sources you want to connect.
However, the list of native Power BI connectors is quite limited. To enhance it, use Coupler.io which supports over 50 applications to connect to Power BI. You can blend data from multiple sources, transform the data on the go, and automate data refresh in one interface.
Try it yourself! Select the needed source application in the form below and click Proceed. Start by creating a free Coupler.io account.
Create visualization & apply conditional formatting in Power BI
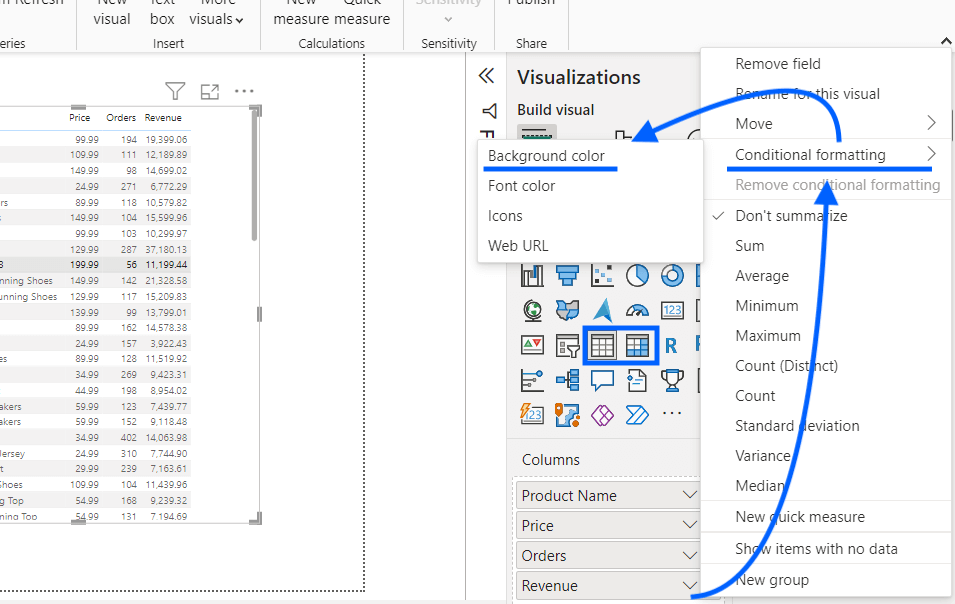
Once your data is available in Power BI, select the table/matrix to which you want to apply conditional formatting. Go to the Visualizations pane and click the drop-down menu icon against the value. Select Conditional formatting and then choose the type of formatting you want to apply.
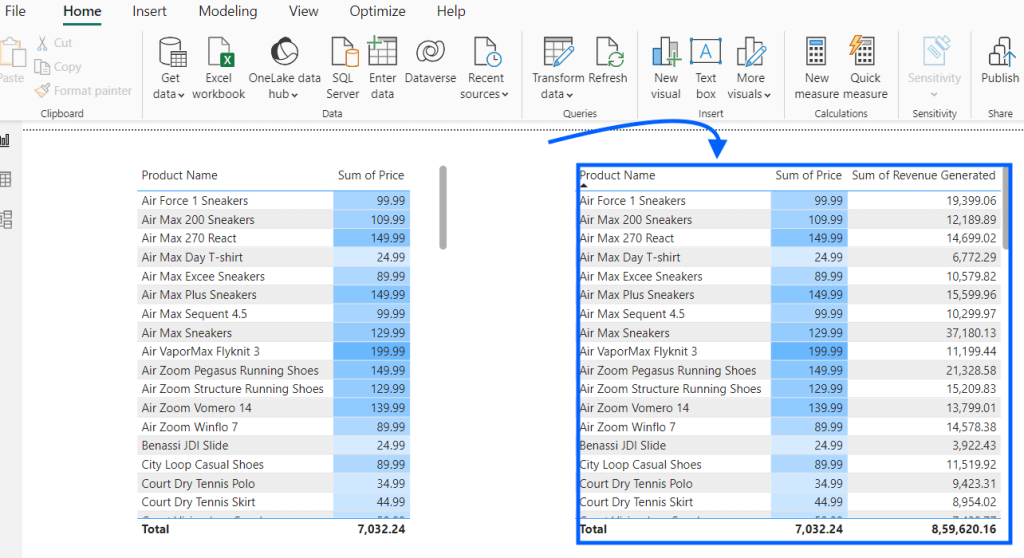
In this example, we’re applying “Background color” formatting to the Revenue column.
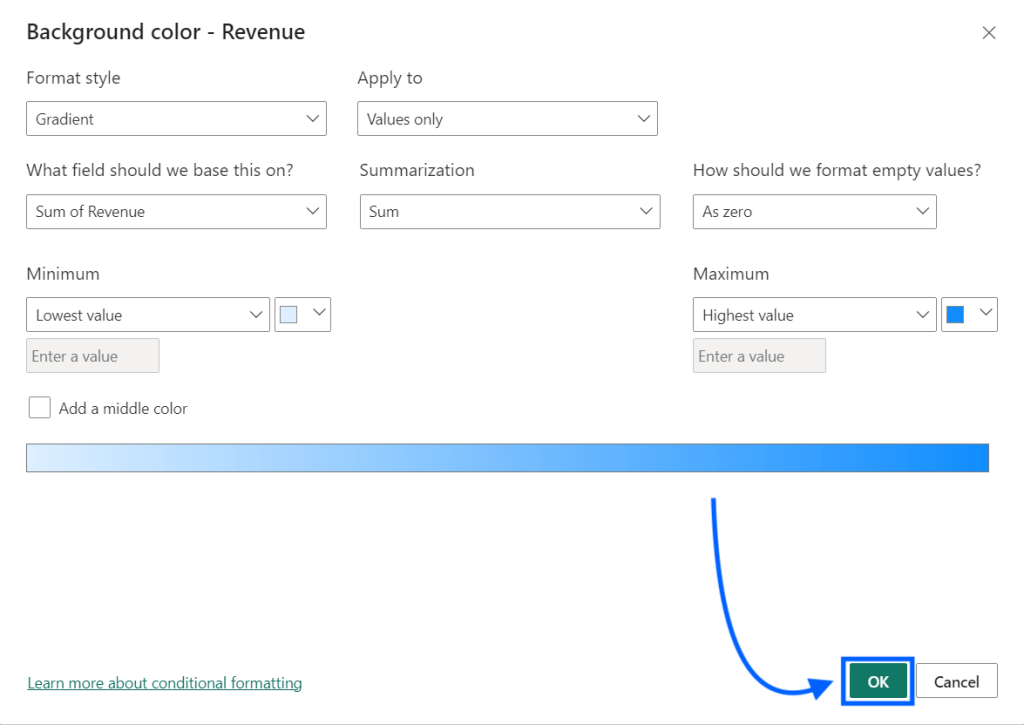
Next, a background color configuration box will appear. Here, you can set the format style, basis of formatting, colors, etc.
In this example, we’re applying a white-to-blue color scale to the cell’s backgrounds. This means the cells’ backgrounds will be colored from white to blue depending on their values in increasing order. For this type of formatting, you can also define the highest or lowest values.
Click “Ok” to apply conditional formatting in the Power BI table.
Here’s the result:
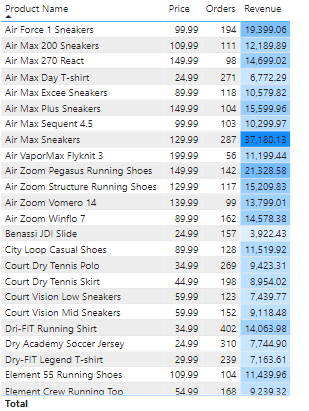
You can now see each cell’s background colored according to its value in the revenue column.
Similarly, you can also apply conditional color formatting in Power BI tables/matrixes based on custom rules or specific field values.
Note: Applying conditional formatting to Power BI visuals will override any custom background or font color applied to the cell.
How to apply conditional formatting to other visuals in Power BI?
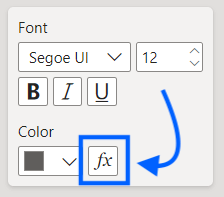
Power BI conditional formatting can be applied to other visualizations as well. You can define one by clicking the “fx” button against the applicable visual properties.
Let’s see how to apply Power BI conditional formatting to Cards and Bar Charts.
Power BI Card conditional formatting
You can apply conditional formatting to a Power BI Card to change the color for text, background, border, and shadow.
For example, you have a Card that tracks total revenue. And you want to change its background color based on its value. You can achieve this by defining multiple rules for background color in the Power BI conditional formatting.
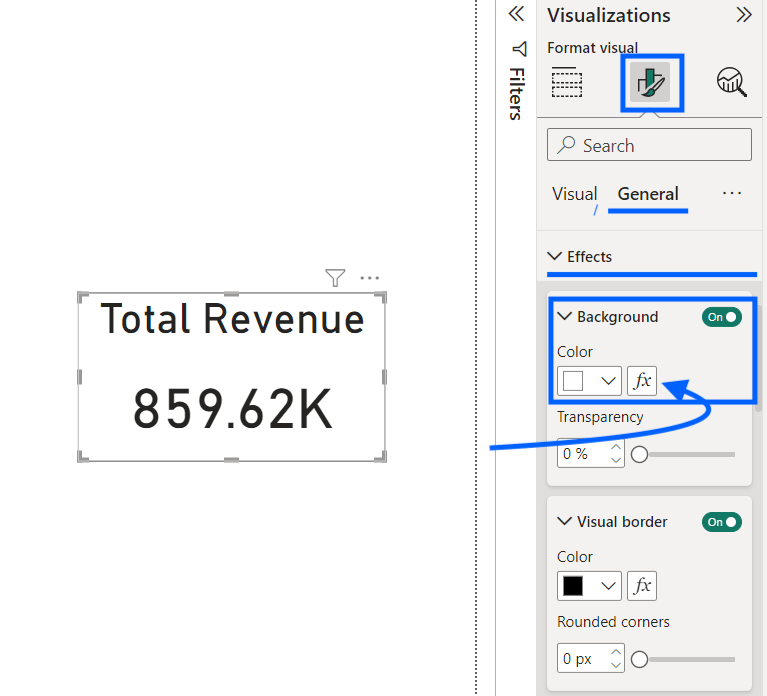
Select the Card to apply conditional formatting in Power BI. Move to the Format visual pane, select General > Effects > Background, and enable it. Click the “fx” button next to the color picker option.
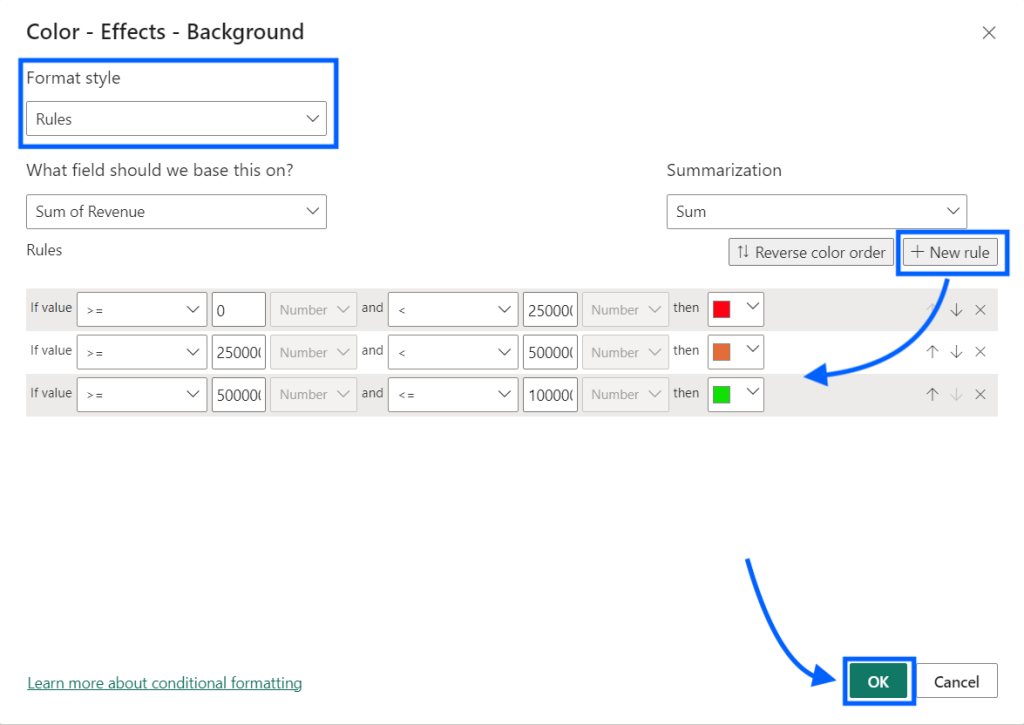
In the formatting pane, select the format style as “Rules” and create conditions and set colors. (You can add new rules by clicking the “Add Rule” button on the left.)
For example, we’ve set the color to:
- Red if the value is 0 – 250K
- Orange if the value is 250K – 500K
- Green if the value is 500K – 1000K
Click “Ok” to apply the conditional formatting.
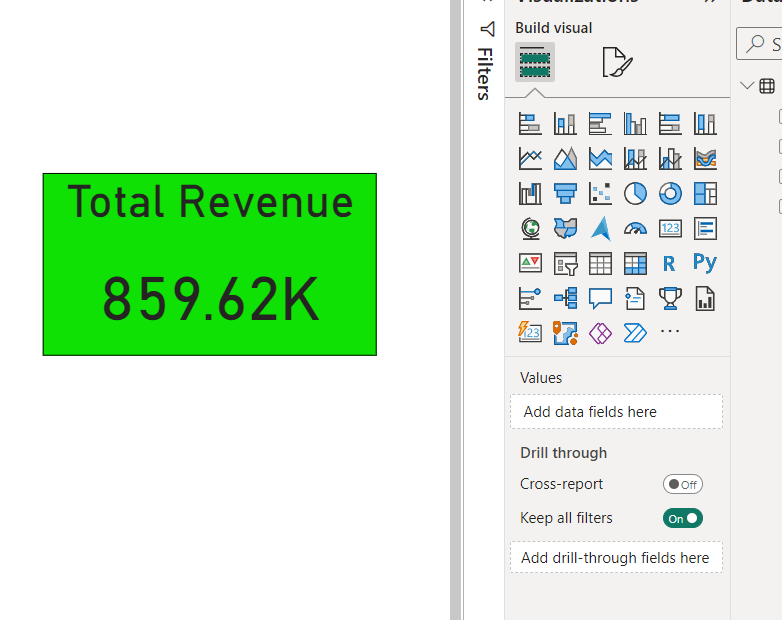
Once applied, the Card will be formatted as per the set conditions. In this example, the Card’s background color has been changed to green since the value is more than 500K.
Power BI Bar Chart conditional formatting
Power BI bar chart conditional formatting allows you to change the colors of the bars, text, border, gridlines, etc.
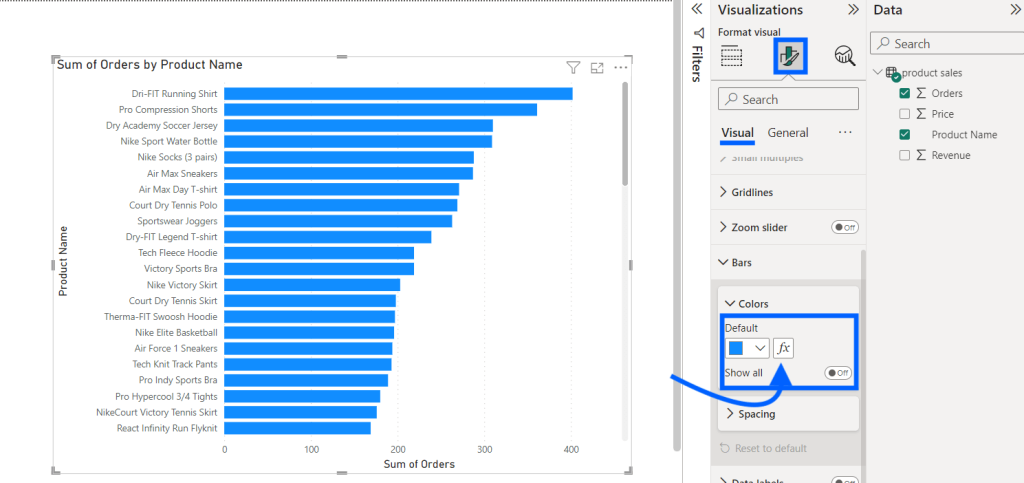
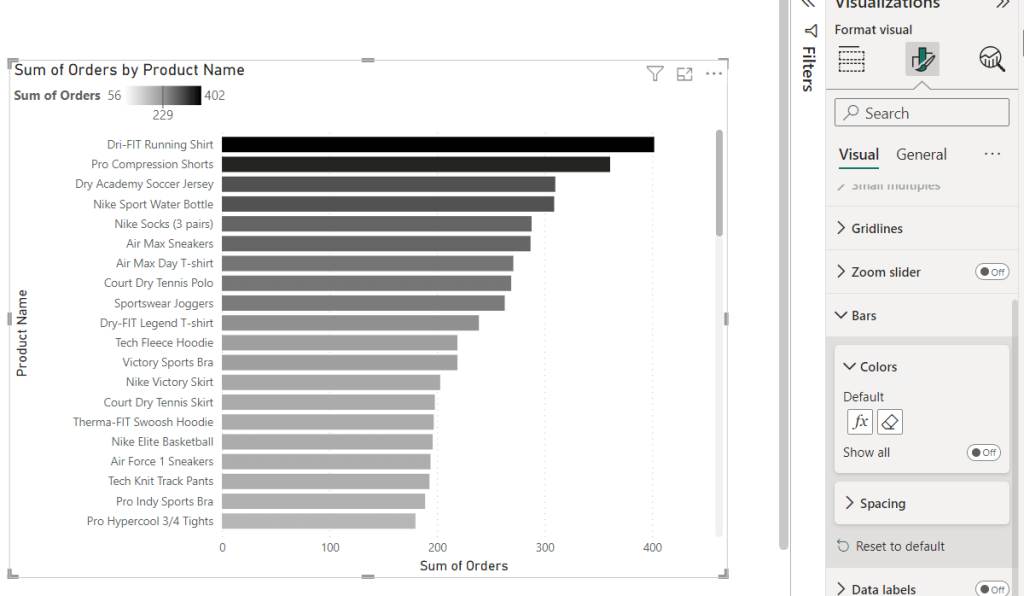
For example, we have a bar chart displaying the number of orders by product name. And we want to apply color to bars based on their values.
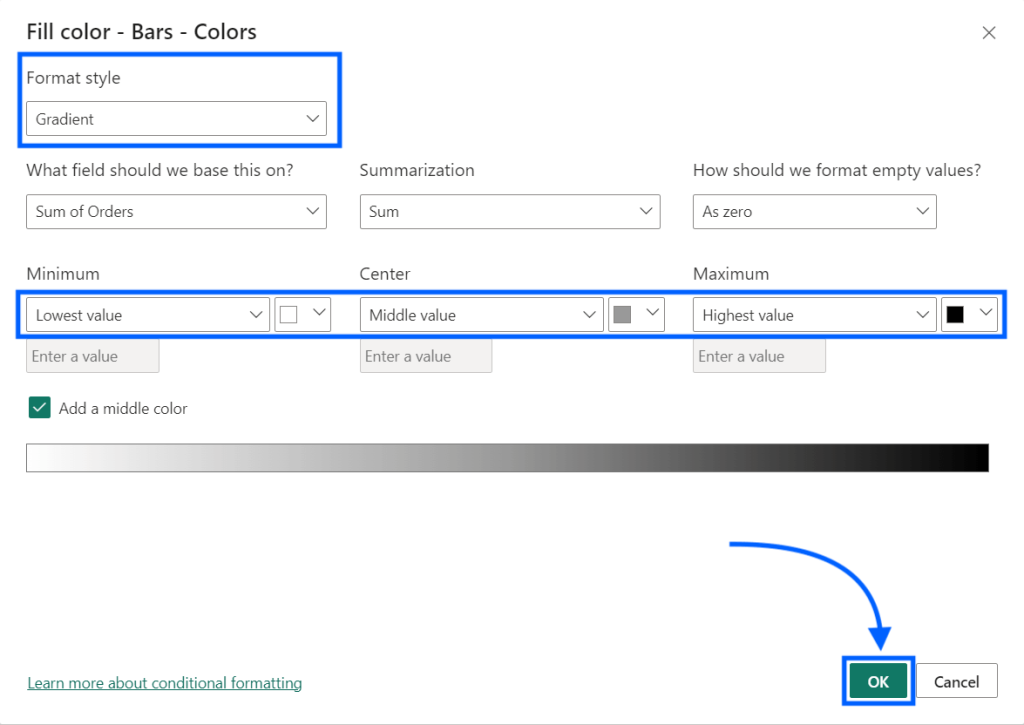
Select the bar chart you want to add conditional formatting to, move to Format visual > Visual > Bars > Colors, and click “fx” next to the color picker option.
Set the Format style as gradient and select the colors you want to apply. You can also set a middle color for the gradient, as shown below.
Click “Ok” to apply the Power BI conditional formatting to the Bar chart.
It will apply gradient-based colors to bars based on value as shown below.
In the same way, you can apply Power BI conditional formatting to all other visualizations.
Example #1: Power BI conditional formatting based on field value
The most commonly used type of Power BI conditional formatting is based on field values. Here, you need to keep the same field selected in the “What field should we base this on?” formatting option.
For example, let’s say you want to format background color for fields based on their values. Keep the same field selected for formatting basis and define the conditional formatting rules based on definite values or ranges.
Then click “Ok.”
The conditional formatting will be applied to the fields based on their values.
Example #2: Power BI conditional formatting based on another value
Power BI conditional formatting can also be applied based on another field. It can also be from other datasets available in the report.
To apply conditional formatting based on another value, select the field in the formatting.
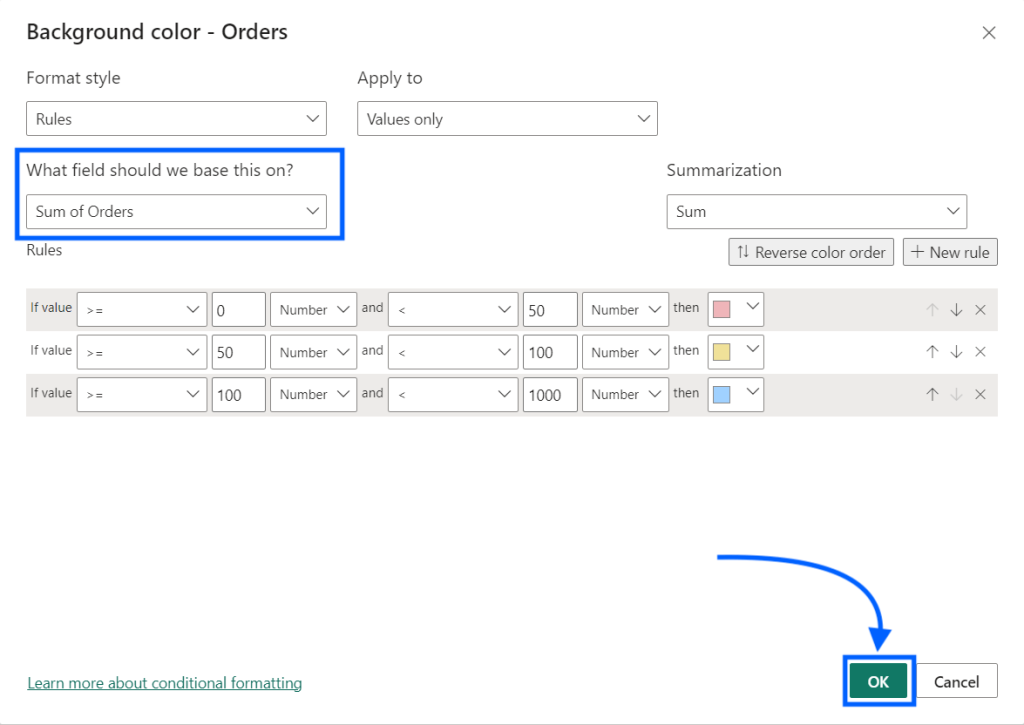
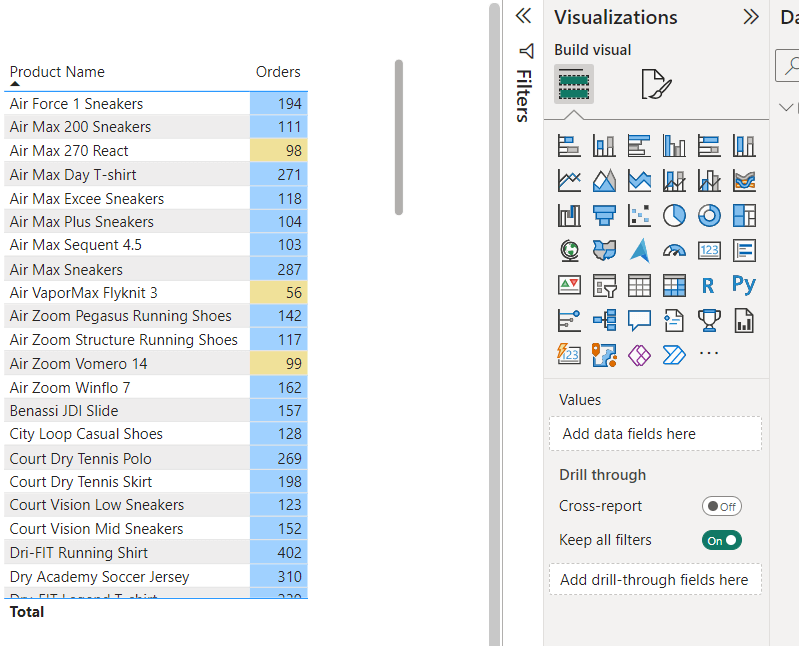
For example, you want to change the background color of the Orders column if the Product Name contains specific terms. Select the field based on which you want to apply conditional formatting, create rules, and click “Ok.”
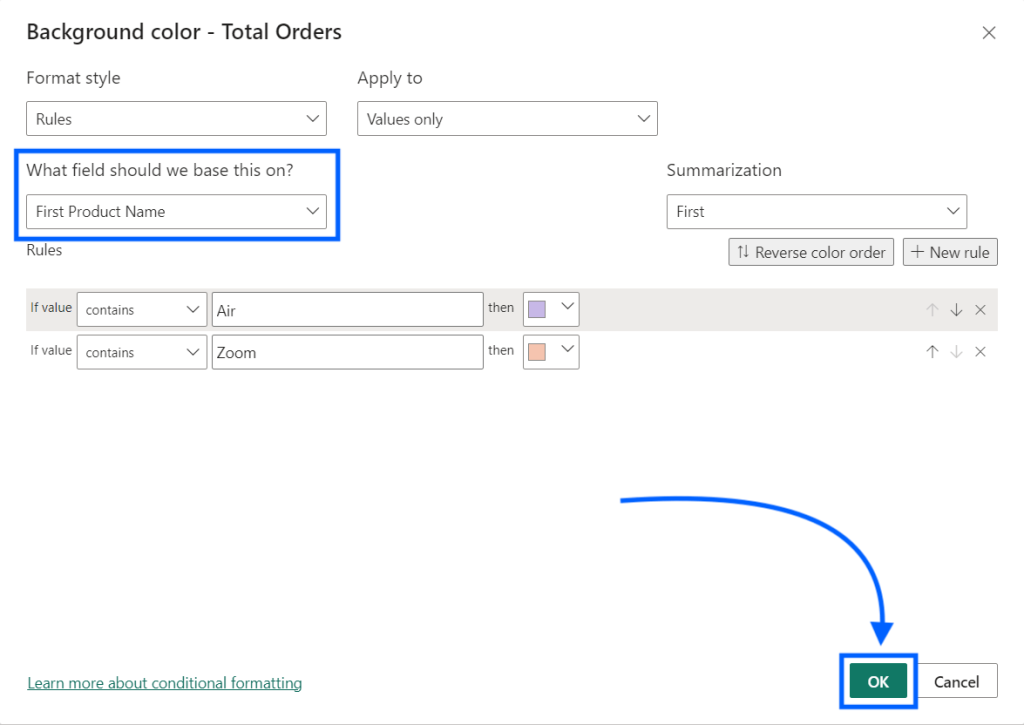
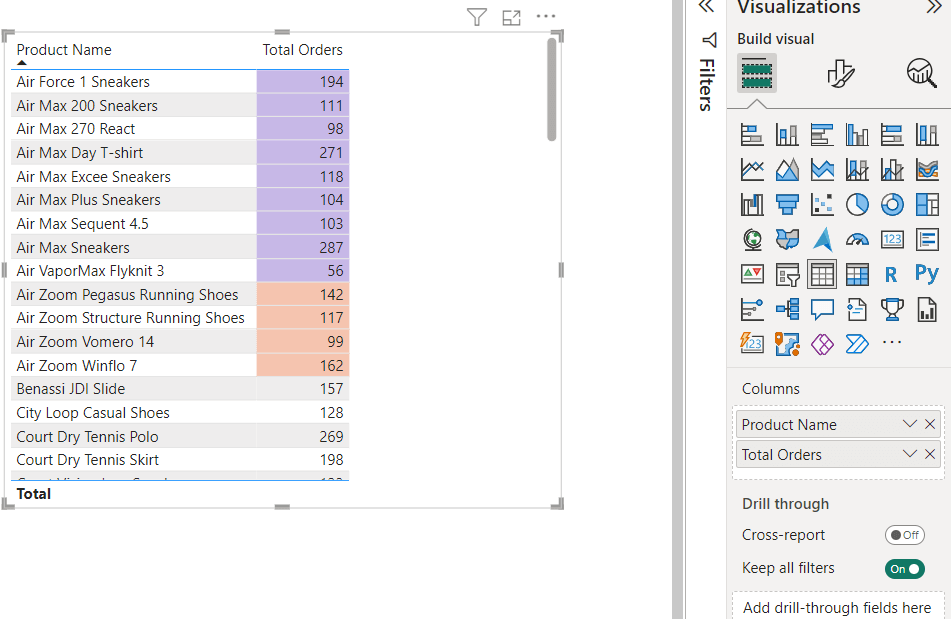
The Power BI conditional formation based on another field will be applied as shown below.
Example #3: Power BI conditional formatting based on text
You can use Power BI conditional formatting to apply visual changes based on text values. You can create rules based on the various options, like if the value starts with or contains specific terms.
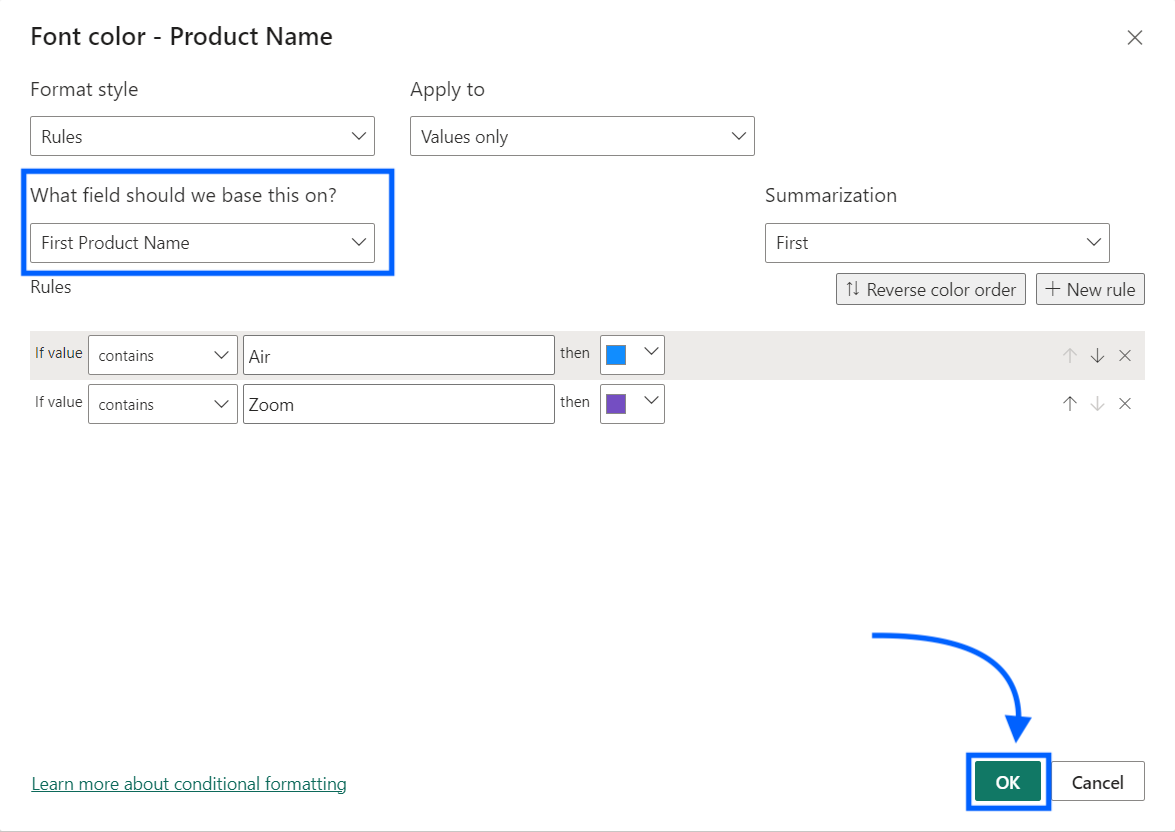
Let’s say you want to change font colors dynamically based on the terms a text field contains. Select the field you want to format and apply rules, as shown below. (You can of course use other conditional formatting options with text fields as per your needs.)
Click “Ok.”
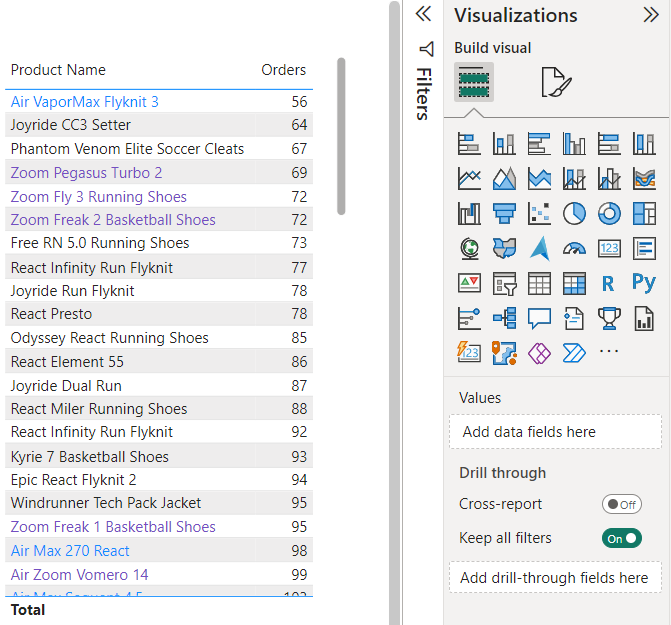
This will apply Power BI conditional formatting based on text field values. You can see cell values containing specific terms like “Air” and “Zoom” have been formatted with distinct colors.
Example #4: Power BI conditional formatting based on measure/formula
Power BI conditional formatting can also be based on the measure values or formulas. This means you can implement complex logic for conditional formatting.
For example, you can create a new measure in Power BI that calculates the color based on existing fields. And then, you can use this measure as a base to apply conditional formatting. (You can also directly use color codes like RBG or Hex.)
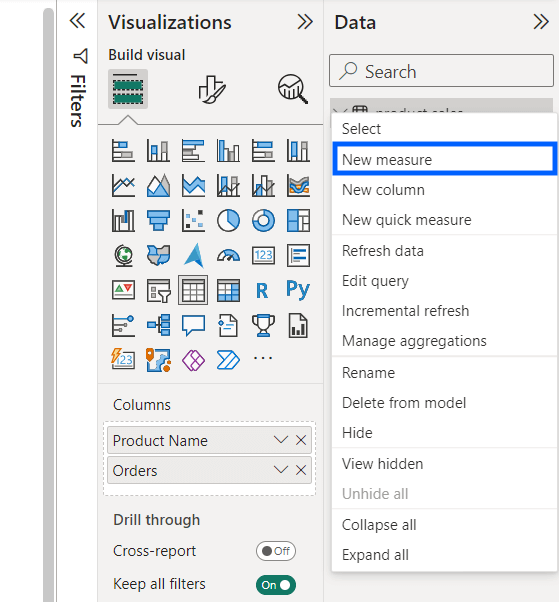
To create a new measure in Power BI, click the three dots on the data model and select “New measure.”
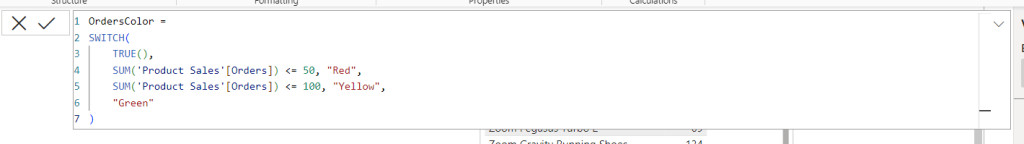
Enter a custom Data Analysis Expressions (DAX) formula in the field and save it.
For example, the below formula will assign different color values based on the number of orders.
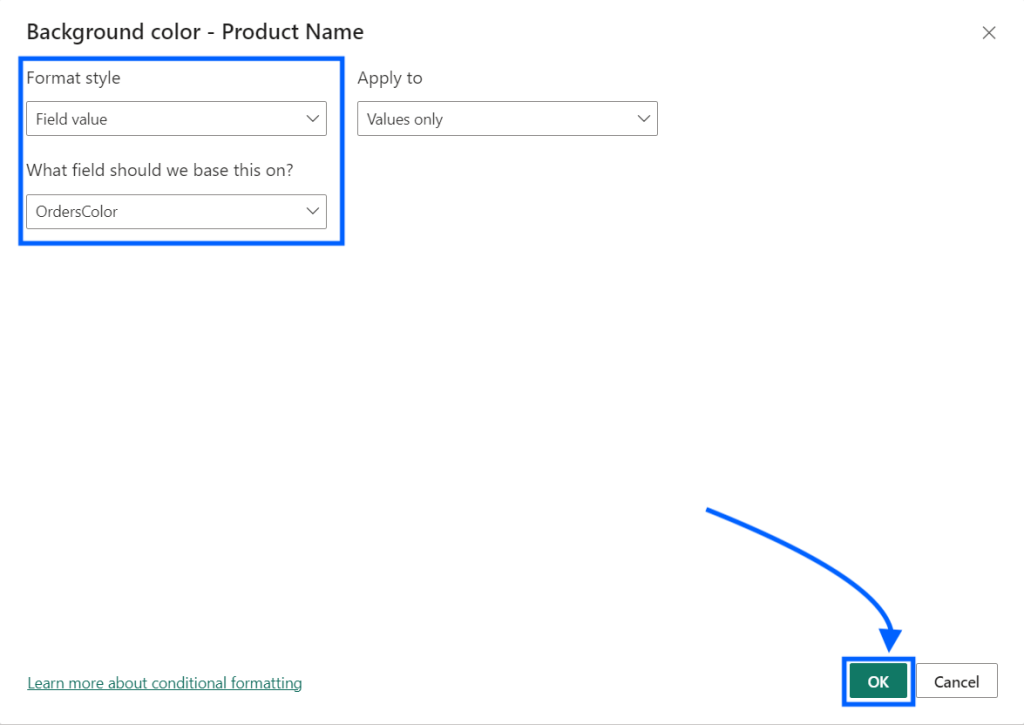
Now, create new conditional formatting for any field with Format style as “Field value” and select the custom metric as a base for calculation.
Click “Ok” to apply conditional formatting in Power BI based on the formula.
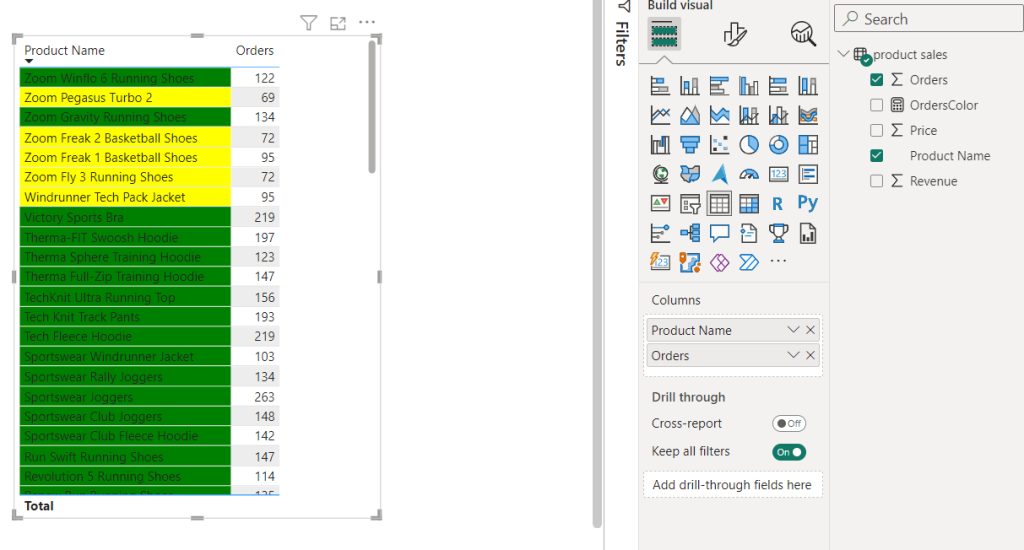
It will format the field based on the output of the custom formula we set for the measure.
Example #5: Power BI conditional formatting based on date
Power BI conditional formatting allows date values. But they’re processed like other numerical fields. And therefore, working with them direclty can be challenging.
The best way to apply Power BI conditional formatting based on date is via measure or formula. You can create a new measure based on the date field and use it as a field value to implement conditional formatting in a Power BI date table.
For example, you have a table containing date and revenue data. And you want to mark past dates with green and today’s date with yellow color. Here’s how you can achieve this.
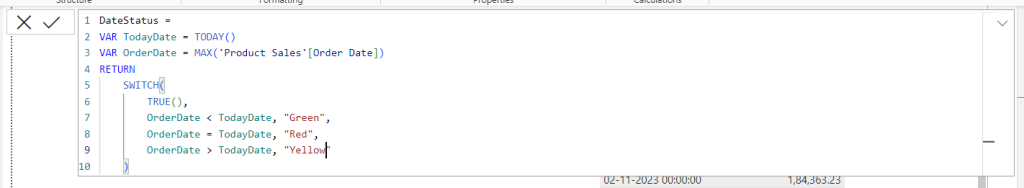
Create a new measure that compares the date with today’s date and returns color as shown below.
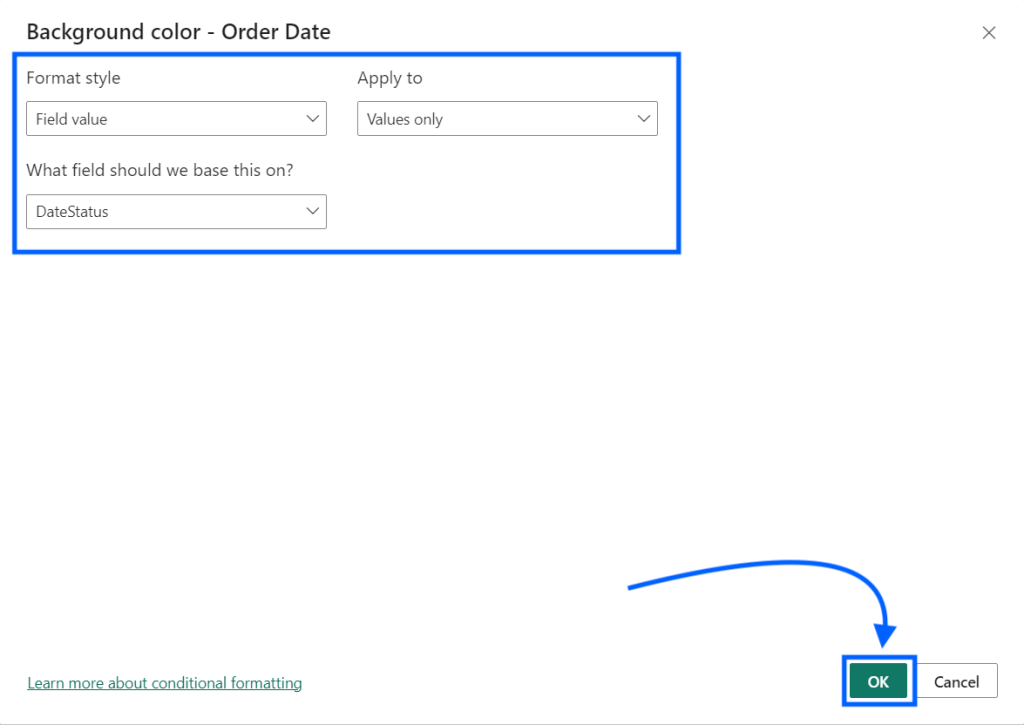
Select the field to apply conditional formatting to, select “Field value” as the format style, and then the created measure as the base field.
Click “Ok” to apply the Power BI conditional formatting.
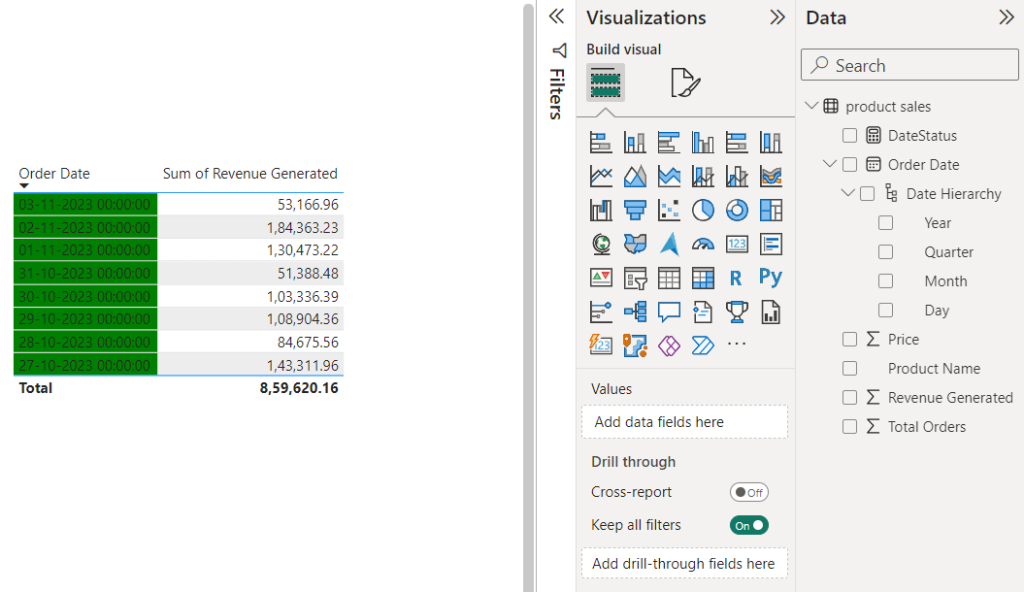
You can see Power BI conditional formatting has been applied to the field background color based on the date values. (The background color has changed to green for all fields since they are past entries, i.e., dates before today.)
In the same way, you can implement your own logic using the DAX formula to apply conditional formatting based on the date in Power BI.
Power BI conditional formatting: FAQs
How to copy Power BI conditional formatting?
You can copy conditional formatting in Power BI from one table or visual to another using the format painter.
You can copy conditional formatting in Power BI using the Format Painter tool.
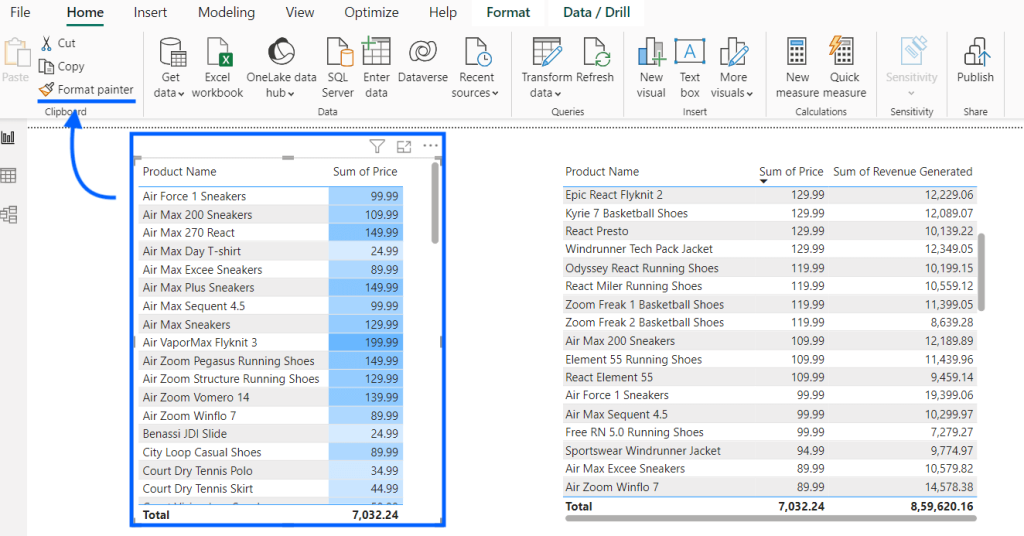
Let’s say you want to copy conditional formatting from one table to another. Select the table from which you want to copy conditional formatting and click “Format Painter” on the top-left corner, as shown below.
Now, click the table where you want to paste the formatting. And the same conditional formatting will be applied to it.
How to remove conditional formatting in Power BI?
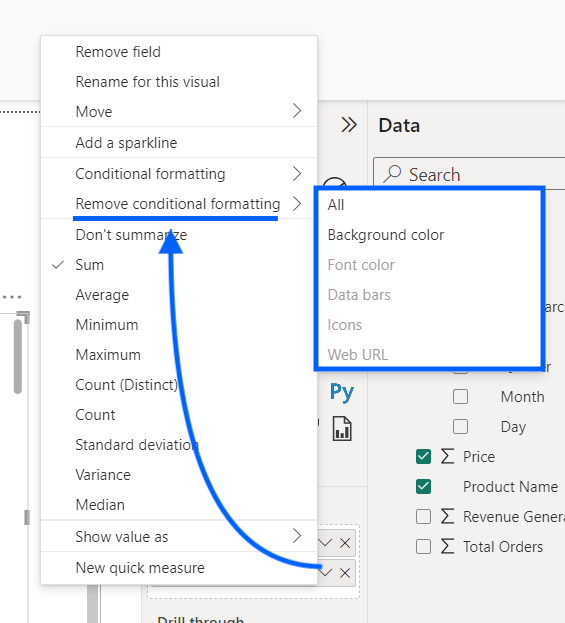
To remove conditional formatting from a field in Power BI, click the drop-down icon and select “Remove conditional formatting.”
Click on the appropriate types of conditional formatting to remove.
Why is Power BI conditional formatting not working?
There are several possible reasons why Power BI conditional formatting may not be working. Here are some of the common ones:
- The data contains NaN values. Gradient formatting with automatic minimum/maximum values is not supported for non-numerical data.
- You’re using the wrong data type for formatting. Double-check the type of data you’re using with your objective.
- You’ve defined incorrect conditional formatting rules in Power BI. Look for any errors in the formatting pane.
- The “Discourage Implicit Measure” option is enabled in your Power BI account. You can find it under the “Options.” Change it to false if it’s set to true.
Is it possible to conditionally format an entire row in Power BI?
No, it is not possible to conditionally format an entire row in Power BI.
Bonus: Power BI conditional formatting tips
Conditional formatting in Power BI is a great way to make your reports visually appealing and easy to read. Here are some helpful tips to use while working with Power BI conditional formatting:
- Highlight important data points, new trends, and interesting patterns in your data.
- Pick high-contrast colors to make your reports more accessible to everyone, including users with disabilities.
- In the case of multi-rule conditional formatting, put the rules with the highest priority first, and so on.
- Use custom DAX expressions to build logic for advanced-level conditional formatting in Power BI.
Lastly, the most important thing to make sure of is data freshness while working with conditional formatting in Power BI. For this, you can get help from data automation tools like Coupler.io to keep your reports updated with the latest data through automated refreshes. Sign up for free now!

Connect your data source to Power BI with Coupler.io
Get started for freeCurious to learn more about working with Power BI? Take a look at our Power BI tutorial and the articles on Power BI LOOKUPVALUE, and RANKX Power B.