Are dashboards becoming obsolete now that we can simply ask LLMs our data questions? Not quite.
While LLMs have made data access more conversational, business intelligence is evolving rather than being replaced. Companies still rely on dashboards for consistent metrics, governed data, and visual pattern recognition. LLMs simply make it easier for people to explore those same systems.
As Forrester’s April 2025 analysis confirms: “GenAI is not replacing business intelligence; it is leveling the playing field” by improving how users interact with existing data products.
This article explores why LLMs and BI tools complement rather than replace each other, and how to leverage both for better decision-making.
Key takeaways:
- Dashboards ensure governance, consistency, and visual clarity
- LLMs provide conversational access and contextual explanation
- Both are necessary: dashboards govern truth, LLMs democratize access
- The future is integration, not replacement
Why dashboards still matter in business intelligence
Dashboards play a foundational role in how businesses monitor performance and make decisions. Their value comes from three areas: governance, human cognition, and organizational alignment. LLMs improve access to insights, but they do not replace these core functions.
Data governance and trust
- Standardized KPIs and metric definitions: Dashboards rely on a semantic layer and a shared schema, so every stakeholder sees the same metrics calculated consistently. This prevents debates about “which number is correct” and keeps teams grounded in a single source of truth.
- Governed, validated data pipelines: Traditional BI tools connect to controlled data sources with versioning and clear data lineage. This creates audit-ready reporting and reduces the risk of errors that can appear in ad-hoc or conversational analysis.
Human cognition and visual clarity
- Fast visual pattern recognition: Dashboards make trends, anomalies, correlations, and seasonality easy to spot through charts and graphs. Humans process visual patterns much faster than text, which speeds up decision-making and reduces cognitive load.
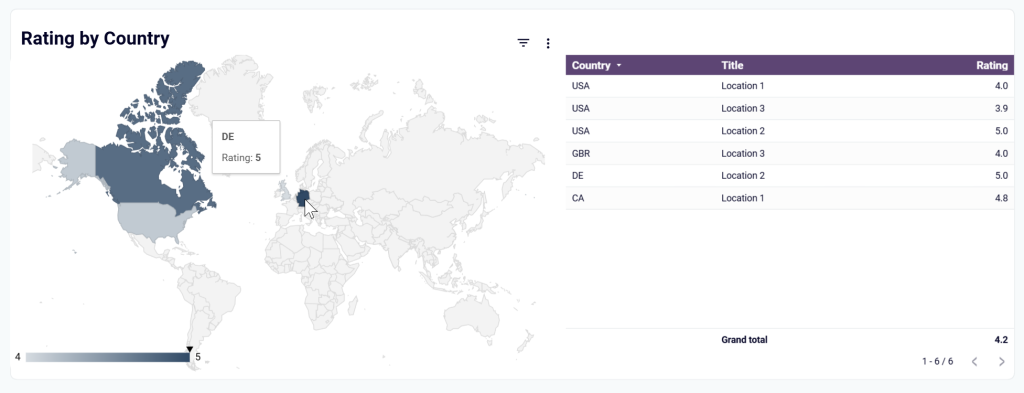
- Spatial context for multi-dimensional data: Heatmaps, maps, and comparison charts let users understand regions, segments, or time periods side by side. LLMs would need several paragraphs to communicate the same relationships.
- A single shared view of performance: Dashboards give everyone the same dataset, the same KPIs, and the same visual context. Instead of each person generating their own interpretation through an LLM, teams stay aligned on how the business is performing.
- Reduced reconciliation and communication friction: When teams rely on dashboards, they spend less time matching numbers across spreadsheets, screenshots, or AI chats. This cuts down on rework and speeds up cross-functional decisions.
To see this in practice, imagine a company’s sales leadership team reviewing its Pipedrive performance dashboard by Coupler.io.
Sales KPI dashboard for Pipedrive
 Preview dashboard
Sales KPI dashboard for Pipedrive
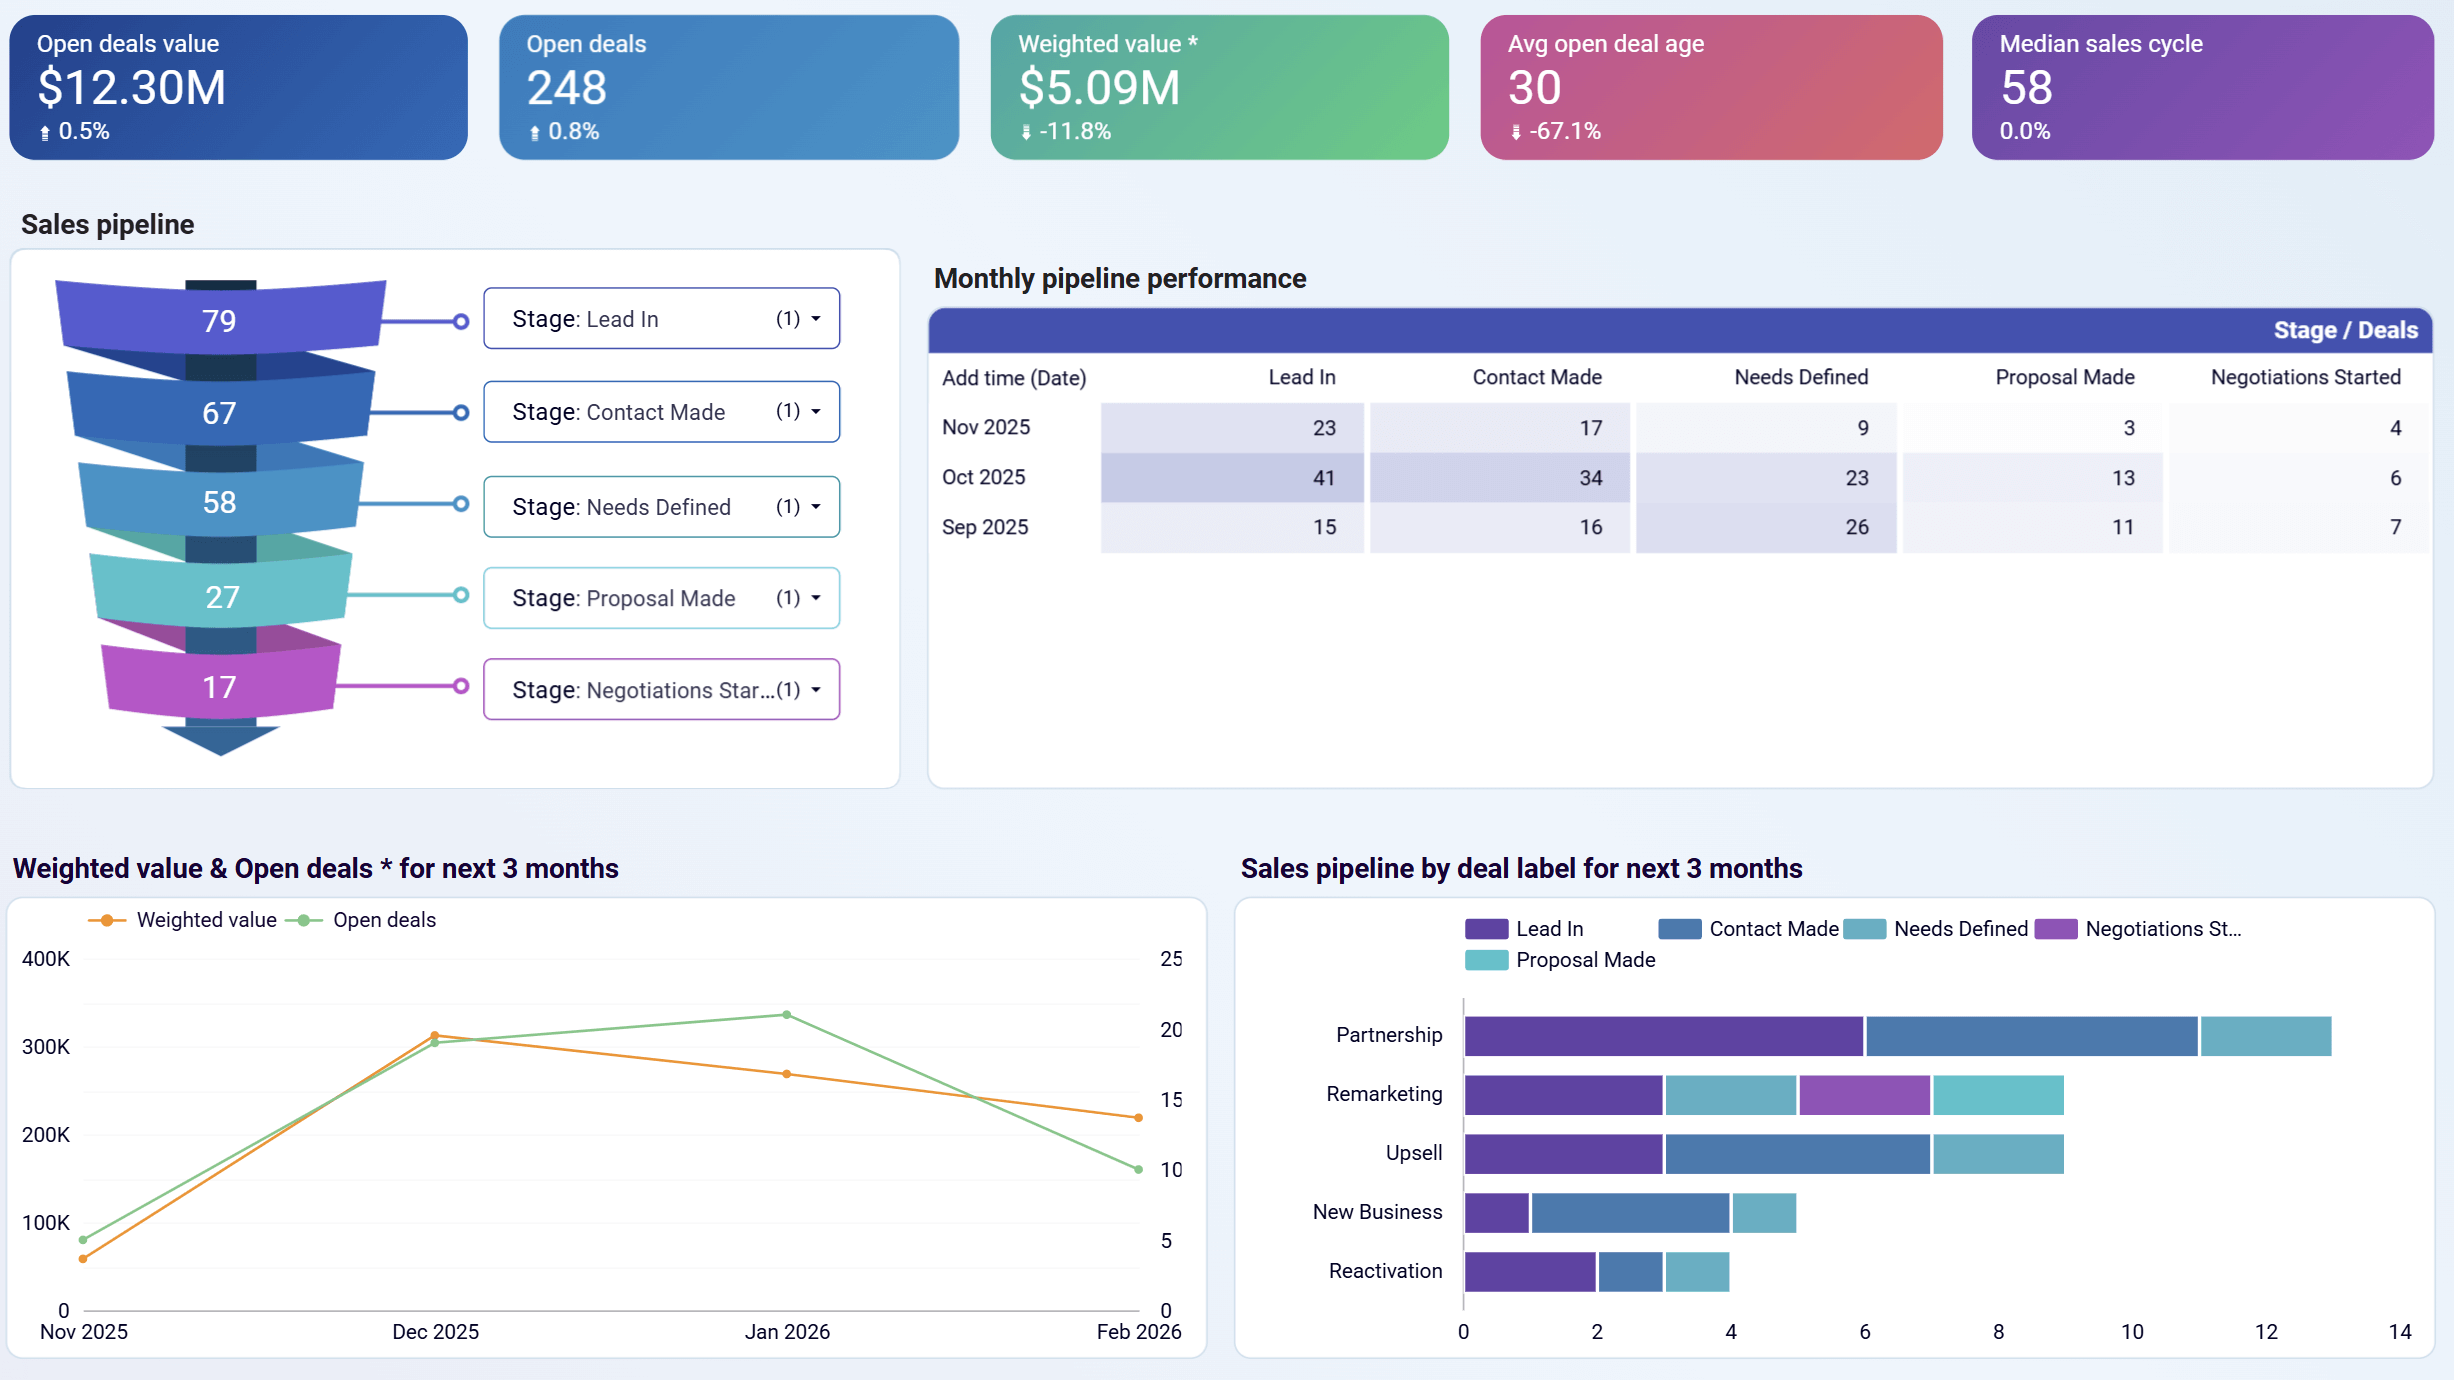
Preview dashboardThe dashboard gives them a single, governed set of KPIs, so they’re not debating whose numbers are correct. The visuals make it obvious where attention is needed: a sales funnel shows exactly how deals are distributed across stages, a trend line reveals pipeline movement over recent months, and deal-level breakdowns highlight which opportunities may be stalling. Because every team in the company uses this same dashboard, the discussion stays focused on what changed and what action to take next.
Learn more about how to create a dashboard in our comprehensive guide.
This kind of shared, structured visibility is why dashboards remain the backbone of business intelligence and why generative AI does not make them obsolete.
What LLMs actually bring to analytics
LLMs add something traditional BI wasn’t designed for: natural, conversational access to insights. Instead of navigating dashboards or learning SQL, business users can explore data the same way they ask colleagues questions.
Here’s what LLMs bring to the table:
- Natural-language instead of SQL queries: Users can ask questions in plain English and get clear explanations without navigating traditional BI tools. For example, a marketing manager can simply ask, How is AI traffic growth MoM in Q3 compared to Q1 and Q2? without needing to understand database schemas or analytical functions.
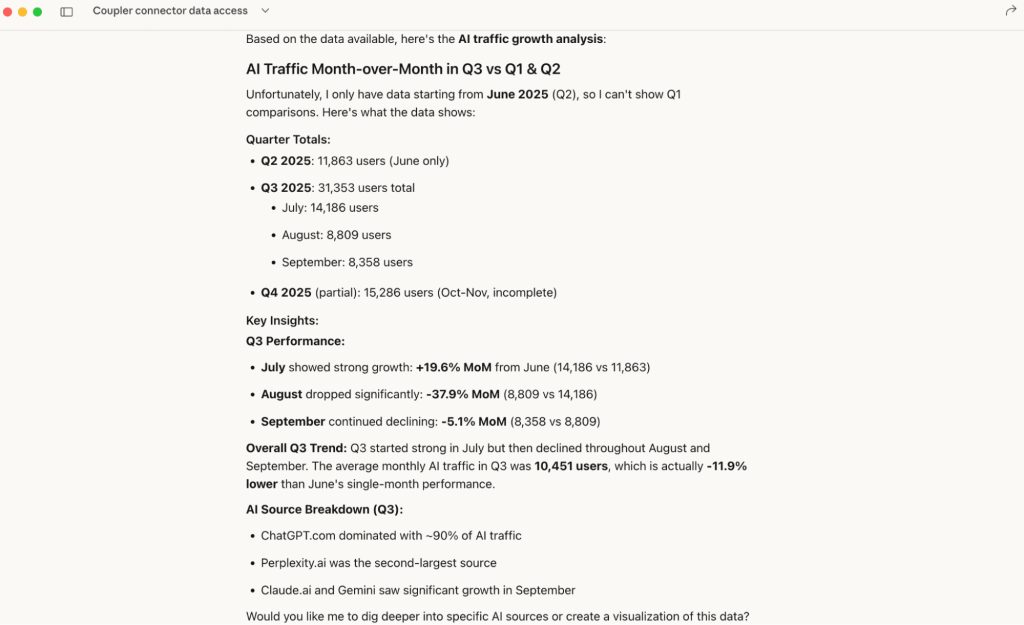
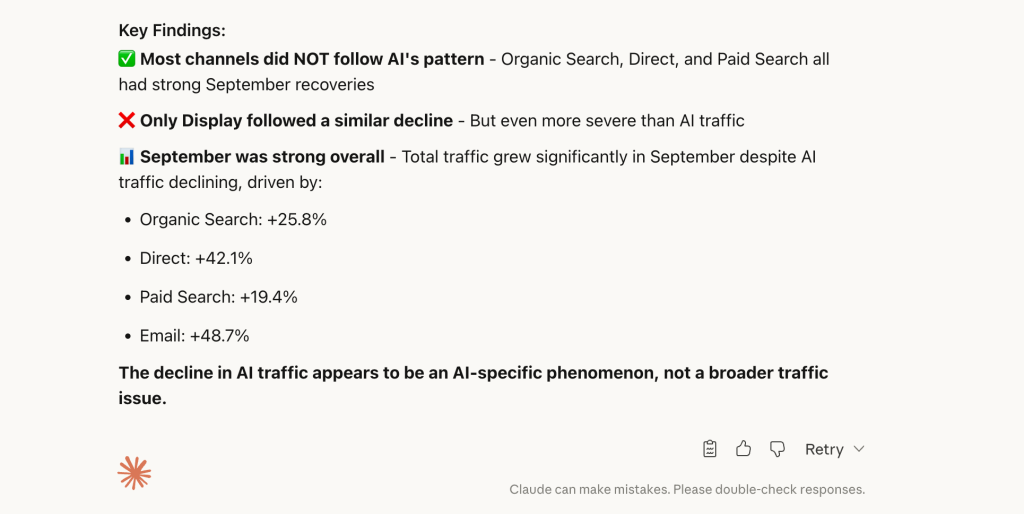
- Iterative analysis using conversational interfaces: LLMs support follow-up questions, “what-if” scenarios, and deeper drilling, turning static dashboards into dynamic, AI-driven conversations. For example, when spotting some trends in AI traffic drops and spikes, you can ask a follow-up question to understand if this pattern shows on other channels too:
Did other traffic channels (organic search, social, email, etc.) follow similar patterns in Q3?
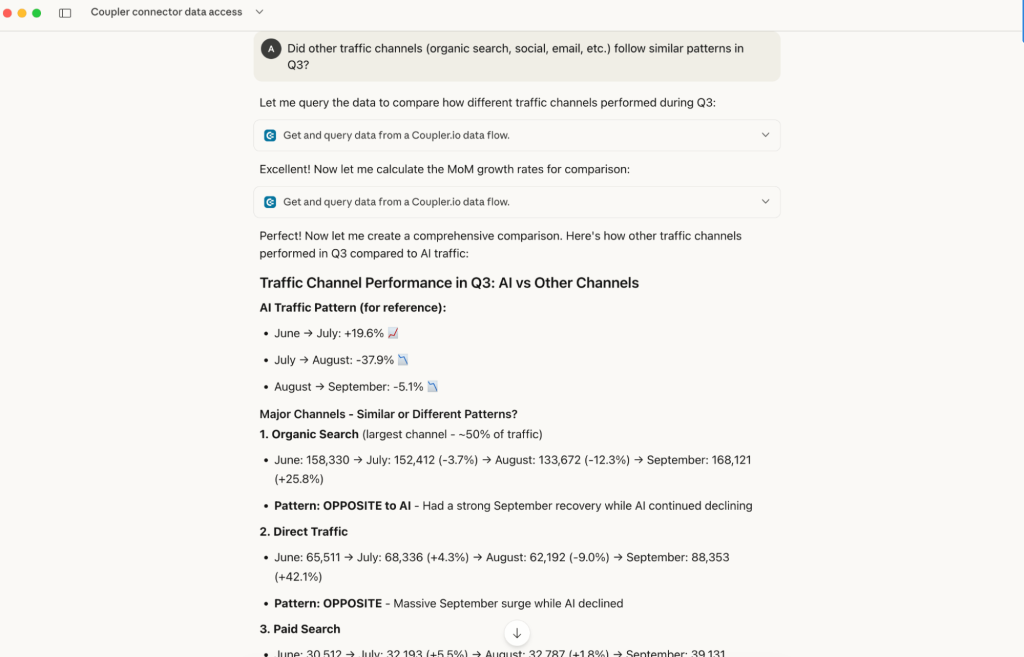
And get some valuable findings in seconds.
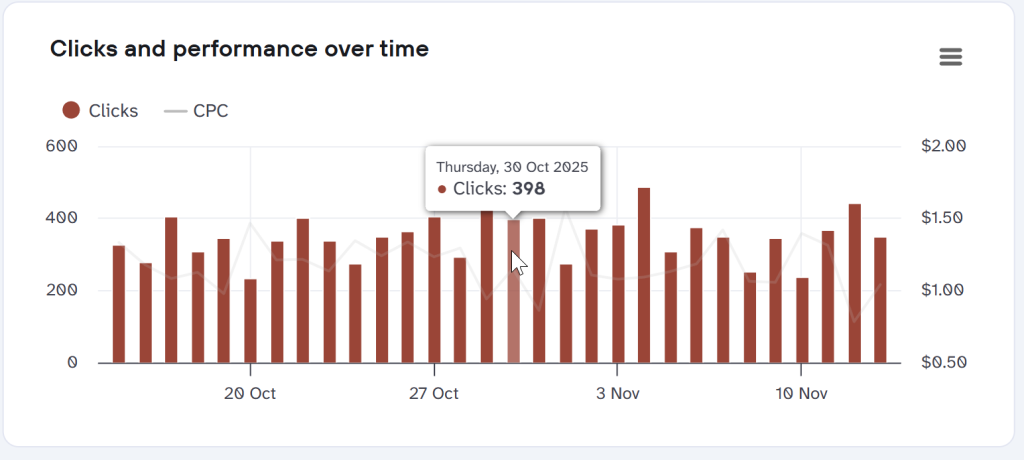
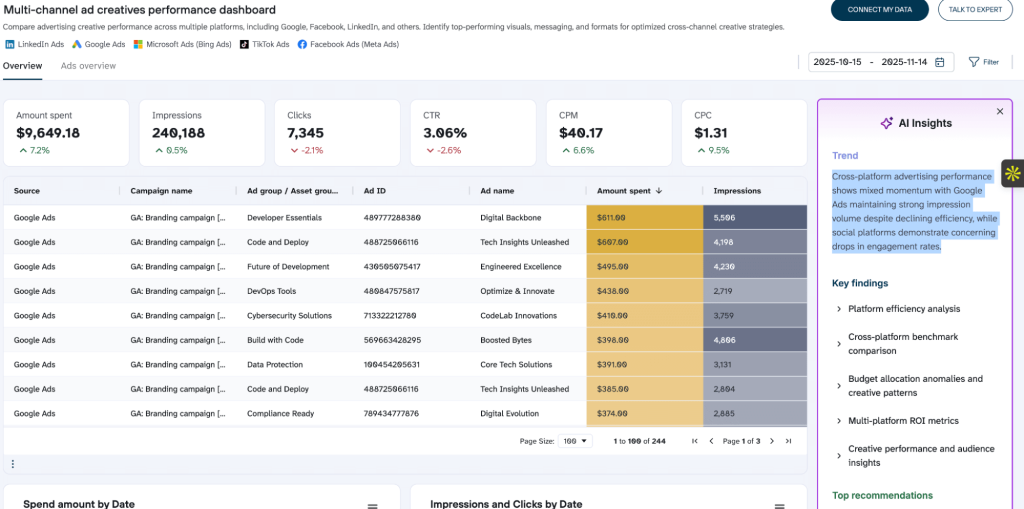
- Contextual analysis: Large language models can explain KPIs, summarize trends, and add narrative clarity. This transform outputs into insights that business users can act on. A multi-channel ad performance dashboard showing declining numbers can be enhanced by an AI assistant explaining, Cross-platform advertising performance shows mixed momentum with Google Ads maintaining strong impression volume despite declining efficiency, while social platforms demonstrate concerning drops in engagement rates.
- Context across data sources through integration: LLMs can analyze information from CRMs, marketing platforms, finance systems, and real-world events, helping users understand the full picture behind a metric.
This makes analytics more inclusive. Business teams, executives, data experts, and product managers can all explore data instantly without waiting for a BI team to build a new report.
Core limitations of LLMs in data analysis
LLMs bring advances to how we explore and interpret data. But they also come with real constraints that make them unsuitable as a replacement for traditional dashboards.
These limitations aren’t small edge cases; they’re structural to how large language models work:
- Computational reliability: LLMs aren’t built to perform exact calculations or run statistical models. Because they generate text rather than execute algorithms, they can miscalculate values or produce results that don’t match the underlying data. For finance, operations, or performance reporting, this kind of uncertainty isn’t acceptable.
- Inability to process large datasets directly: LLMs have strict context window limits. They can process only a few thousand tokens at a time, far short of what’s needed to analyze comprehensive data sets from a data warehouse or BI platform. They can summarize small samples or aggregated data, but they can’t load your full CRM, marketing, or financial data into a prompt and run real analysis on it.
- Dependence on prompt phrasing and model context: Because LLMs respond to the exact wording and order of a question, small changes in phrasing can lead to different outputs. A user asking “What were Q3 sales in EMEA?” may get a different answer than “How did we perform in Europe last quarter?” The model’s training data and session history can influence the output. This inconsistency makes the model hard to rely on as a single source of truth.
- Lack of built-in business context or KPI definitions: LLMs don’t naturally understand your organization’s schema, metrics or workflows. They don’t know how you define revenue, active users, qualified leads, or churn unless that structure is provided to them. Without a semantic layer or standardized metric definitions, they frequently misinterpret business terminology or apply inconsistent logic across questions.
- Limited visual and pattern detection: LLMs operate on text, which makes them poor at detecting multi-dimensional patterns, outliers, or correlations that are easier to spot in visual form. Because they can’t “see” data the way humans do in charts or heatmaps, they often miss structural relationships unless those patterns are explicitly described or pre-aggregated. This limits their usefulness for exploratory analysis, where visual cues normally reveal the story faster than words.
Here’s what these limitations look like in practice:
A product director analyzing their template usage funnel needs to understand how new users progress through different stages. They need precise conversion rates at each stage, accurate traffic trends across multiple sources and destinations, and detailed template-level performance metrics with exact click counts and activation rates.
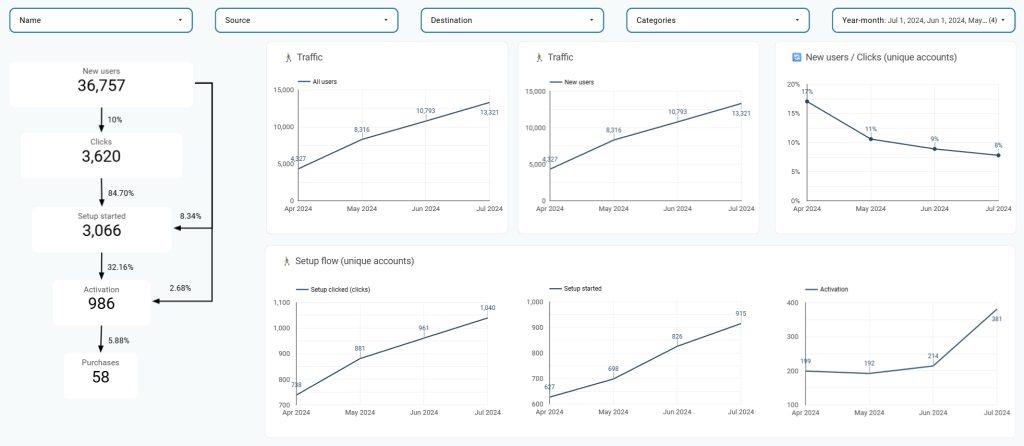
An LLM-only approach would fail since it might:
- Miscalculate conversion percentages across funnel stages
- Struggle to process the detailed template performance table with dozens of rows and columns
- Provide inconsistent comparisons when asked about the same metrics in different ways.
A BI dashboard delivers the visual funnel, trend analysis, and granular data tables with the precision this analysis demands.
LLMs are powerful assistants for exploration and explanation, but they cannot serve as a standalone analytics system. They work best when paired with dashboards, reliable data pipelines, and a clear semantic framework that keeps metrics consistent and trustworthy.
Why LLMs won’t replace dashboards
Dashboards and LLMs operate differently.
Dashboards provide governed truth, visual clarity, and consistent decision-making frameworks, while LLMs provide flexibility, speed, and conversational access. The unique value dashboards provide cannot be replicated by generative AI alone.
Governance and trust
Dashboards run on validated pipelines, controlled data sources, and a semantic layer that defines every KPI. You always know where a number came from and how it was calculated.
By contrast, LLM outputs can be opaque. There’s no clear path showing how a specific insight was generated, and the “black box” nature of many LLM implementations limits transparency. Without transparent calculation logic, LLM outputs can not serve as official metrics for reporting or compliance.
Consistency and repeatability
A BI dashboard shows the same result every time, no matter who opens it.
LLMs don’t work that way. Small changes in phrasing, model updates, or prompt history can shift the output. That variability makes LLMs great for exploration, but not for the stable dashboard reporting workflows teams depend on.
When business outcomes depend on consistent KPI measurement for data-driven decision-making, this variability poses a significant risk. A dashboard showing Q3 revenue will display the same number whether accessed today or six months from now—LLM responses offer no such guarantee.
Visualization and pattern recognition
Dashboards turn complex data into visual patterns that the human brain catches instantly. For example, trends, correlations, outliers, seasonality, and regional differences.
LLMs are primarily text-generating systems. While they can describe patterns, they cannot leverage our visual cognitive systems to reveal patterns. A complex performance matrix comparing regions, products, and time periods is instantly comprehensible as a visualization but requires extensive text to describe.
Tools like Tableau and Power BI have spent years optimizing data visualization for human cognition. These are capabilities that generative AI struggles to replicate at the same speed and clarity.
Regulatory and compliance needs
Regulated industries—healthcare, finance, government—require analytics systems that provide audit trails, version control, and reproducible outputs for compliance with HIPAA, GDPR, SOX, and similar frameworks.
Traditional BI platforms incorporate these compliance features as core capabilities. The result is dashboards that provide controlled, auditable environments for regulated reporting that satisfy legal and governance requirements.
LLMs, on their own, don’t provide any of that. Their answers aren’t traceable or repeatable, which makes them unsuitable as the primary tool for workflows that demand absolute accuracy.
Collaboration and decision-making
Dashboards create a common view of the business. Everyone sees the same KPIs and trends, which keeps teams aligned.
LLM answers are individualized. They live in private chats, change across users, and don’t automatically create shared understanding.
Even with emerging shared AI interfaces, LLM conversations lack the visual anchoring and consistent framing that dashboards provide. When a team reviews a dashboard together, everyone sees the same charts, time periods, and comparisons simultaneously. This creates instant alignment. LLM-based collaboration requires participants to read through conversational threads and mentally reconstruct context, which is less efficient for group decision-making.
While tools like Microsoft Copilot are beginning to bridge this gap, dashboards remain the primary collaborative analytics tool for teams.
Cost and infrastructure
LLM-powered analysis is far more expensive to run at scale than serving dashboard views. Each query consumes compute, API credits, or model tokens, and costs escalate quickly when multiple stakeholders rely on conversational analysis throughout the day.
Dashboards, by contrast, are computationally efficient: once the data is processed, thousands of users can view the same metrics at minimal incremental cost.
For most organizations, this makes dashboards the financially sustainable foundation, with LLMs layered on top for selective use cases.
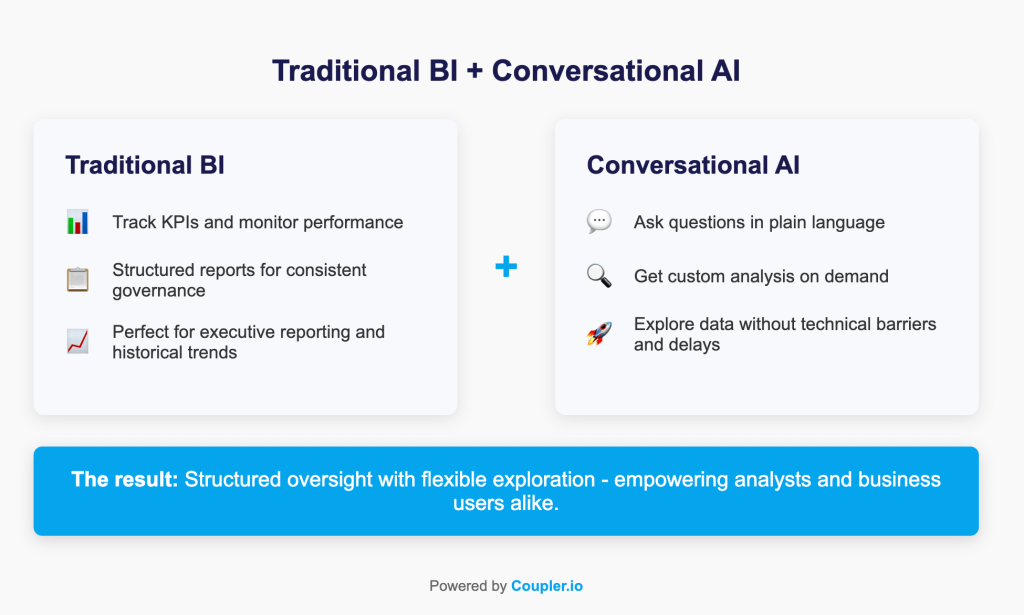
The hybrid future of business intelligence
The future isn’t about choosing dashboards or LLMs. It’s about combining the strengths of both. A hybrid approach gives organizations the structure of traditional BI dashboards and the flexibility of conversational, AI-driven analytics.
In this hybrid model:
- LLMs query governed data sources: AI assistants connect to the same validated pipelines, semantic layers, and metric definitions that power dashboards. This ensures the model pulls the right data, uses the correct KPIs, and remains aligned with the business’s reporting rules.
- Conversational exploration of visual insights: A user can open a dashboard, notice a spike or dip, and immediately ask the LLM to explain the pattern. Instead of manually adjusting filters or rebuilding views, they get instant narrative context, root-cause analysis, or comparisons to other periods or segments.
- Shared context across interfaces: LLMs can reference dashboard KPIs by name (“monthly active users,” “gross margin,” “pipeline velocity”), and their answers can link back to the relevant dashboard view. This creates one consistent analytical environment instead of two disconnected tools.
- Faster workflows without replacing the foundation: Dashboards remain the authoritative visual layer. LLMs become the conversational layer on top, helping to clarify metrics and reducing the time users spend hunting through filters or tabs.
- Actionable recommendations on top of structured analytics: LLMs can turn dashboard signals into next steps: “Churn is rising in mid-market accounts. Here are three likely drivers and recommended actions.” This expands the usefulness of dashboards without changing how the underlying data is managed.
This combination preserves accuracy while enabling AI-powered speed. This is something dashboards or LLMs can’t achieve on their own.
For example, imagine a product team reviewing a dashboard and spotting a sharp drop in weekly active users for a specific segment.
Instead of building new filters or waiting on an analyst, they ask the LLM, “What changed for this group last week?” Because the assistant queries the same governed sources, it can surface related shifts such as lower onboarding completion, a spike in support tickets, or reduced feature engagement. The team can then jump back to the dashboard to inspect those affected areas visually.
This shows how dashboards reveal the pattern and the LLM accelerates the follow-up, using the same data foundation to give teams faster context without replacing visual analysis.
The hybrid model in action: AI Insights for dashboards
Coupler.io’s AI Insights feature demonstrates how conversational AI can enhance dashboards without replacing them.
Rather than building a separate AI tool, AI Insights adds an intelligent interpretation layer directly onto existing dashboard views.
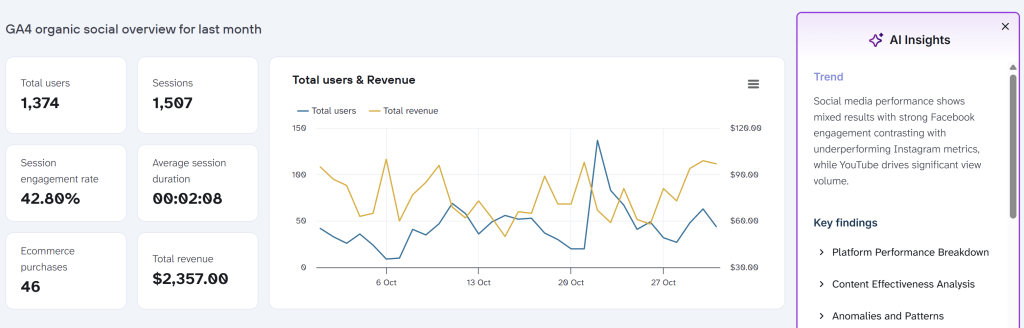
When a marketing manager opens their social media analytics dashboard in Coupler.io, they see all the traditional visual elements (charts) showing platform performance, conversion metrics, and engagement trends. But with one click, AI Insights generates a personalized summary in about 20 seconds that includes:
- Trend overview: High-level patterns and which channels are driving results, giving immediate context to what’s happening in the business
- Key findings: 5-6 specific insights about performance anomalies or opportunities. For example, “LinkedIn generates fewer impressions but higher conversion rates than other platforms,” helping managers identify where to focus attention
- Actionable recommendations: Specific suggestions like reallocating budget to high-ROI platforms, pausing underperforming campaigns, or adjusting content strategy based on engagement patterns
The AI analyzes the same governed data powering the dashboard visualizations. This ensures consistency between what users see in charts and what the AI explains in text. The dashboard remains the source of truth while AI makes those insights more accessible through natural language summaries.
This implementation preserves everything dashboards do well: visual pattern recognition, consistent metrics, and shared organizational views. Meanwhile, it adds what LLMs excel at: contextual explanation, trend summarization, and personalized recommendations.

Explore dashboards with AI insights
Try Coupler.io for freeThe role of data integration platforms
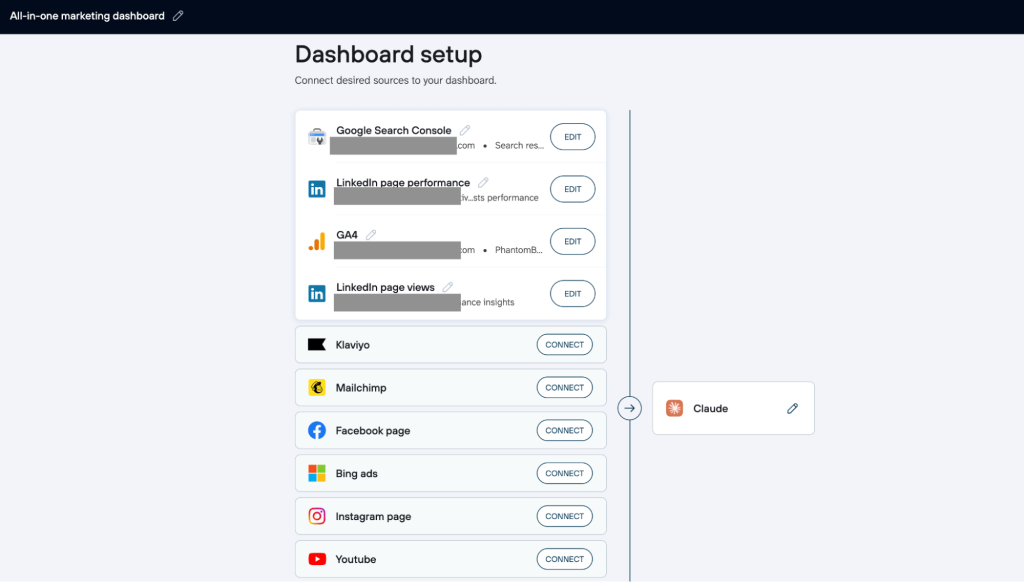
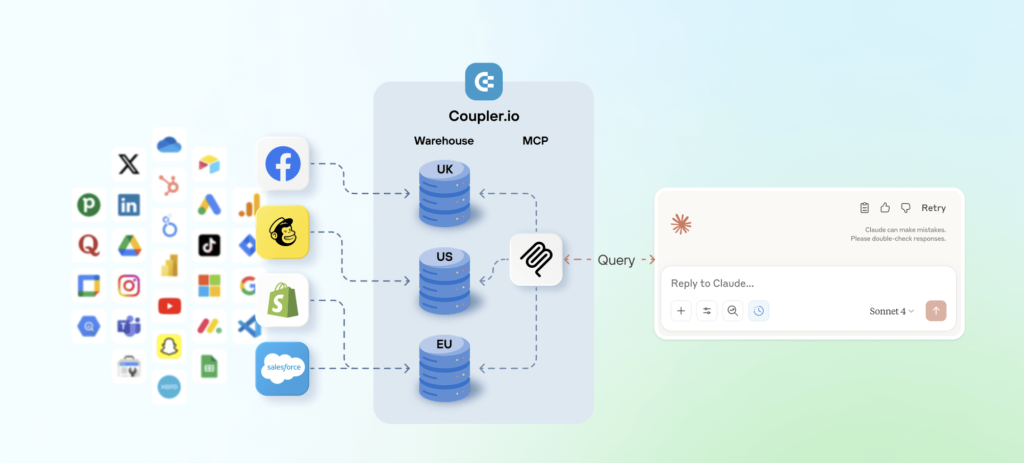
The hybrid model depends on one critical foundation: LLMs need access to the same governed, structured data that powers your dashboards. In this regard, Coupler.io becomes essential as it bridges the gap between your business systems and AI tools.
With Coupler.io, you can connect your CRM, marketing tools, financial systems, and databases into unified, AI-ready datasets. The platform handles the technical complexity, including data extraction, transformation, validation, and loading. As a result, LLMs can focus on interpretation rather than data wrangling.
What Coupler.io does for data that can be used in dashboards and LLMs:
- Connects disparate business systems: Automatically extracts data from CRMs, marketing platforms, financial tools, and databases without custom coding
- Standardizes data formats: Transforms inconsistent schemas, date formats, and naming conventions into unified structures LLMs can interpret
- Maintains data freshness: Schedules regular updates so AI tools work with current information, not stale snapshots
- Enables governed AI access: Routes LLM queries through validated data pipelines that enforce the same business rules and metric definitions your dashboards use
- Reduces AI errors: Provides structured, contextual data that helps LLMs generate more accurate responses
Here’s how it works: When a user asks an LLM a question about something like sales performance, the integration platform:
- Retrieves the relevant data from your governed sources
- Applies the correct business rules and metric definitions
- Performs the required calculations
- Returns the aggregated result to the LLM.
The model then interprets that verified output and explains it in natural language.
This workflow ensures the AI isn’t guessing or generating numbers and it’s responding based on the same structured data and logic your dashboards already trust.
Integrate your data with AI and BI tools with Coupler.io
Get started for freeFAQ
Will AI replace dashboards in the future?
No. Dashboards address fundamental business needs: governance, visual cognition, consistent metrics, and collaborative decision-making. LLMs aren’t designed to replace these. The future is integration: LLMs will enhance how people interact with dashboards, not eliminate them.
Why are dashboards more consistent than LLMs?
Dashboards are built on fixed semantic layers that define exactly how each metric is calculated. The same dashboard always shows the same result for the same data.
LLMs, by contrast, generate responses based on probabilistic text prediction. This means that slight changes in question phrasing, model versions, or conversation history can produce different answers. For decisions requiring consistent, repeatable metrics, such as financial reporting or performance tracking, this variability is unacceptable.
Can LLMs handle large datasets or complex calculations?
No. LLMs cannot directly process large datasets or perform complex calculations as they’re designed for text generation, not data processing. In effective implementations, BI platforms or data integration tools like Coupler.io handle the actual computation and aggregation, then provide LLMs with pre-calculated results to interpret and explain. The LLM adds contextual understanding, not computational power.
Are AI-generated insights trustworthy?
AI-generated insights are trustworthy when LLMs interpret data from governed sources rather than generating calculations independently. The key is architectural: LLMs should analyze results from validated BI systems, not perform their own queries against raw databases. This ensures insights are grounded in the same trusted metrics your dashboards display.
For critical business decisions, cross-reference AI insights with your established dashboards before taking action.
How do LLMs fit into a traditional BI environment?
LLMs integrate with traditional BI through three primary approaches:
- Natural-language query interfaces that translate questions into SQL or BI tool filters
- Contextual assistants that explain dashboard metrics and suggest next steps
- Data exploration tools connected to the same governed sources that feed dashboards.
The key is to ensure LLMs access validated data through your existing semantic layer rather than querying raw databases directly.
What is the benefit of combining dashboards with LLMs?
The combination delivers both governed truth and intuitive access. Dashboards provide the metrics, governance, visualization, and organizational alignment that ensure everyone works from the same data.
LLMs democratize access to those insights through natural conversation. They let non-technical users explore data without learning BI tools or waiting for analyst support. You get reliability and accessibility in one system.
How do AI agents fit into the future of BI?
AI agents are autonomous systems that orchestrate multiple tools and actions, while LLMs are conversational interfaces.
An AI agent might monitor dashboard metrics, detect anomalies, query an LLM for analysis, pull relevant historical data, and send a summary to stakeholders. They expand analytics capabilities but still rely on dashboards for governed metrics and LLMs for interpretation.
What’s the best way to get started with conversational analytics?
Connect your LLM to clean, governed data, then compare AI outputs with your dashboards to ensure consistency. Start small with a specific use case where natural language access would provide clear value. Establish success metrics, train users in effective prompting, and gradually expand as confidence builds. Use integration platforms like Coupler.io to ensure your LLMs access properly transformed and validated data.
Ready to explore how your organization can leverage both technologies? Coupler.io‘s AI Integrations provide a secure, flexible way to connect your trusted data sources with powerful AI tools, ensuring you get the best of both worlds.