Running a sales team or overseeing a sales department, you always want to stay on top of things. Sales reporting gives you an invaluable amount of information about the entire process and each of its components. It can help you find and address the bottlenecks, prioritize your efforts better, find new markets, and improve things in an informed way.
In this article, we’ll explore everything there is to know about reporting in sales. We discuss the pros and cons of different reporting tools, share examples of reports, and give practical tips on how to set up a reporting pipeline for your team.
What is sales reporting about?
Sales reporting is an analytical process that aims to provide an overview of a sales process and answer common questions that lurk in the minds of every sales manager – what can we do better? Are we getting enough from the leads we have? Is our strategy working out?
A sales report is a collection of relevant metrics presented as numerical values or displayed in a visual way on charts, graphs, tables, maps, and more. Reports can cover a lot of different sales activities – deals closed, revenues generated, conversions between the stages of a funnel, lead distribution, employees’ workload, close rate, and much more. With a bit of effort, you can monitor virtually any aspect of a sales process and use it to your advantage.
Sales reports can take different shapes too. It could be a report you generate from your CRM weekly or monthly to review the progress or take to a board meeting. More and more often, companies opt for using interactive sales reporting dashboards that present almost real-time information, are accessible, and can be tweaked to the liking of their users. We’ll focus more on those throughout this article, show you examples of a few, and explain how to get one for yourself.
The benefits of sales reporting
There are plenty of benefits of reporting in sales. Here are some of the most significant ones.
It can improve the team’s performance
Monitoring sales reports can help you understand where things can be improved. Perhaps individual sales reps struggle with closing deals or their average deal value has deteriorated lately. Identifying such issues early can help you improve the situation – coach the person, offer them additional training, and adjust their responsibilities to what they’re more confident doing.
Reporting in sales can also positively impact the overall sales team performance and make for a more effective sales process. Breaking down your process into small steps, comparing different periods of time, or monitoring cohorts of leads rather than all of them at once can give you insights into where the bottlenecks are. Then, you can work to address them one by one.
It helps you address issues on the go
Things can change quickly in sales and it’s in your best interest to notice negative events as soon as they appear on the horizon. Perhaps the cold emails you send out en masse suddenly stopped reaching their targets due to technical failure. Maybe a sales strategy you successfully employed last year is no longer yielding the same results. Having the reports available whenever you need them makes it easier to notice such roadblocks and deploy immediate countermeasures.
It can boost team spirit and give direction
With a sales reporting system in place, you always know how the team and each salesperson perform. While not everyone enjoys being watched like this, setting goals and keeping track of them is proven to have a positive impact on individual performance. What’s more, having fresh reports available at any time can help boost team morale. You can celebrate hitting your monthly quota or surpassing an ambitious milestone the moment it’s breached. Setting long-term sales goals and keeping track of the progress toward them can also give the sales team a sense of direction.
Types of sales reports
Different reports serve different purposes. Here are some of the common reports sales teams can benefit from.
Sales overview reports

Sales overview reports, as the name suggests, typically give an omnichannel reporting overview of the sales process and key KPIs, without delving deep into their particular aspects. On such reports, you’re likely to see the sales revenues accumulated over the chosen period, broken down into categories (different products, regions, types of clients, etc.). What’s more, such reports can present top-performing teams or sales reps, best-selling items, the sales performance comparison versus the previous periods, and many more.
Sales funnel reports (aka conversion reports)

These reports focus on the sales pipeline (funnel) and tell you how leads convert from one stage to another. Typically, you’ll see the quantity of leads that reached a certain stage as well as the percentage of them that converted from the previous stages. All in all, it’s an invaluable report for finding bottlenecks in the process. You get to see how the conversions look month-to-month and so can quickly spot when the numbers across the sales pipeline move in the undesired direction.
Sales leads reports

Many sales reports also talk about the leads themselves. It’s useful to understand where the leads reside and which channels drive them to you so you can make business decisions accordingly. Commonly, leads reports look at the sheer numbers of leads and their quality and so help you evaluate the effectiveness of your lead generation efforts.
Sales cohort analysis reports

When selling subscription-based products, cohort analysis can often prove invaluable. To produce such reports, you break down the user base into smaller groups with common characteristics – registration date, country of origin, etc. Such analysis is particularly useful if your product changes rapidly – adds many new features, iterates on the pricing, experiments with different target groups, etc. Looking at individual cohorts is almost guaranteed to reveal patterns you wouldn’t have noticed otherwise.
Sales forecast reports
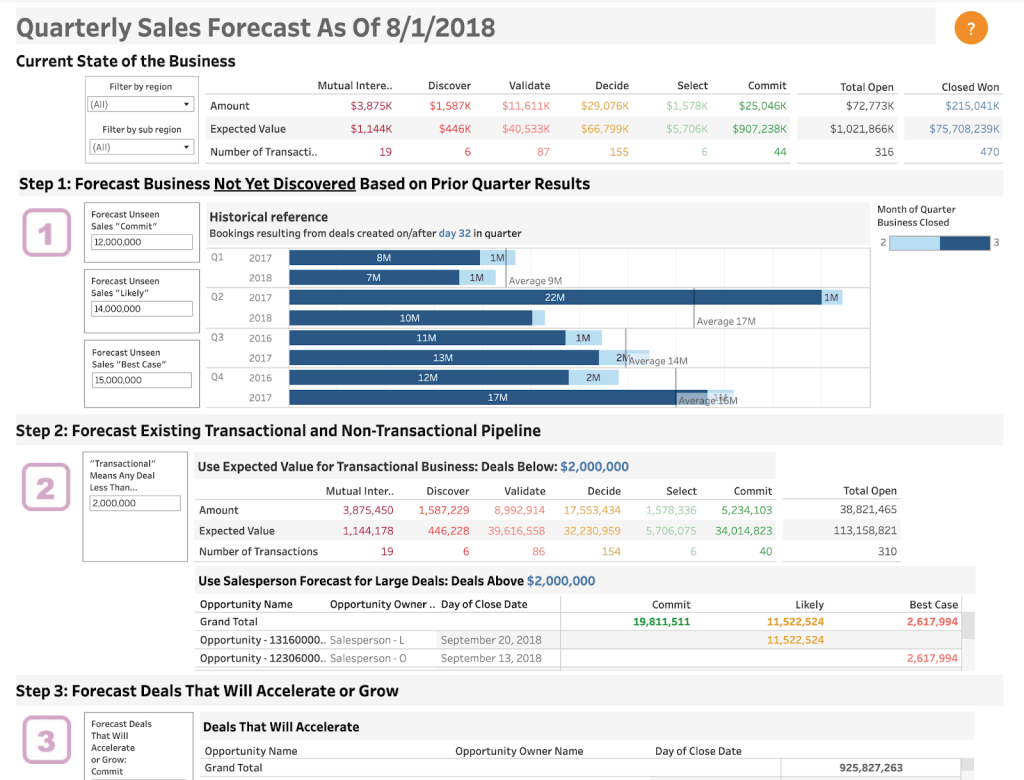
Image source: Tableau Public
Another common type of report is a sales forecast report. As the name suggests, it looks into the future and aims to estimate how the sales volume will shape up based on historical and recent sales performance. It can help you predict seasonal fluctuations, adjust resources, and plan future budgets. It can also reveal the potential flows in the sales process, such as an insufficient number of sales reps in the key period of time. Thanks to sales forecasting, you can aim to address such bottlenecks before they even have an impact on your company.
Note: If you like any of the sales analysis reports shown above, you’ll find most of them on the Coupler.io website. Our team of data experts prepared these and many other sales report templates to help you visualize your data in an understandable and intuitive way. Feel free to grab any sales report template for yourself or reach out if want us to make a custom sales reporting dashboard to your exact specifications for you.
How to do sales reporting?
Before you set off to prepare or commission a company’s sales report, there are a few things you should figure out first. You want to have a clear purpose for building a report and an idea for the insights you want to extract from your data. Then you’ve got to figure out the technical aspects of your report. Finally, it will be time to interpret the results and plan for the further development of your sales reporting. As rarely will the initial report you build be the final one!
Sales reporting – first steps
Let’s now expand on each of the steps you should consider while preparing a sales report.
Understand the purpose and the audience of the report
As the first step, you should figure out why you’re building the report in the first place. Is the purpose solely to track the revenues from sales and connect them to other financial data? Maybe you’re hoping to find bottlenecks and improve sales processes. Or perhaps the main goal is motivating team members and keeping them in the loop with how things are going.
Of course, you can do all of that but we’d recommend being more focused at first. Build the initial report, validate whether it meets your requirements, iterate on it if needed, and only then expand with further reports.
At this stage, you also want to understand who the audience for the report is and what kinds of sales data they’ll be interested in. C-level executives will mostly care about the actual and forecasted revenues. Sales reps will be eager to know how they stake against each other and what valuable insights they can extract about their leads. A sales manager will care about a piece of each, with a particular focus on the team they manage.
There’s a lot of data you can extract about your sales but plenty of it is probably rather irrelevant to the audience you’re building the report for. Rather than overload them with data, it’s better to focus the report on specific information so that the audience can quickly find what they were looking for.
Our sales dashboard built in Looker Studio also started a simple one-pager with just a few key sales metrics and a chart. Over time it expanded into close to a dozen pages, with rich visualizations and lots of options to customize the displayed data to the viewer’s liking. Everyone working for and with sales finds there something of value and teams can use it on and off meetings to monitor their progress, quickly spot issues, and act on them.
The bottom line is – don’t try to fit all the sales activity at your disposal into the report. It’s far better to start small and build on it.
Decide how to build a report
Once you have the goals of the report figured out and know what kinds of sales data you want to showcase, it’s time to look into the technical aspects of reporting in sales. There are plenty of options here.
The simplest thing is arguably using the reporting features built into the CRM you use. Every sales platform, including the likes of Salesforce, Pipedrive, Zoho Sales, and Monday.com, offers a set of analytics built into the platform. Typically they cover all the basic metrics, such as the number of sales deals closed, revenues, performance by sales rep, breakdowns into categories, lead sources, etc. The customization options may be limited but it’s often a good start.
If the options inside your CRM are limiting you then you’ll need to look at exporting the data into the tool suitable for sales reporting or reporting in general. They can be as simple as an Excel or Google Sheets spreadsheet (we showed you earlier a sales funnel report built in the latter) or a PowerPoint presentation. If you’re hungry for more, it’s best to connect the data to business intelligence tools like Looker Studio or Tableau for advanced reporting in sales.
One thing to decide on is also how you want to retrieve the data to the external option. If you’re solely going to prepare a presentation once a month, it’s best to just copy/paste the needed metrics directly from the CRM. Likewise, if you need to bring the monthly sales overview into your Excel for further processing, you may want to export the data from the sales tool manually. Every tool offers such an option, available usually via .csv files that can be then uploaded to another tool.
However, if you’re looking at building a sales reporting dashboard in a spreadsheet or a BI tool, you need a way to automate the export process. Manually exporting the data even once a week would be dull, time-consuming, and subject to human errors. In fact, to always work with fresh data, you should opt to refresh it at least daily. The only viable way to do this is via automated measures.
Analyze the outcome and plan what’s next
Once you have the data, it’s time to ask your audience for feedback. Do they understand what’s shown in the report? Is the data answering the questions they have? Can they quickly find the information relevant to them? Can the report in its current shape be used to plan for improvements or will it need further iterations?
Building any report, not only in sales, is an iterative process. You bring in the initial release and keep improving it until it finally delivers on the promise. You may, for example, extract just sheer numbers first and later enhance them with charts, graphs, or other forms of visualization. Once you’ve delivered the final report, you may already have lots of requests for new metrics, new types of data, or a whole new report to do next. And it goes on and on.
The important thing is for the data to be clear, conclusive, and actionable.
Automated sales reporting
A popular choice for automated sales reporting is Coupler.io. It’s an all-in-one, data analytics, and automation platform used by thousands of businesses around the world. It empowers companies to get the most out of their data and fully automate their reporting in sales and other disciplines.
Coupler.io allows you to set up automated report scheduling by extracting data from the apps you use, such as Salesforce CRM, Pipedrive, HubSpot, or Airtable. The data can be brought either to spreadsheets (Excel, Google Sheets) or data warehouses (BigQuery) on the schedule you choose (for example, daily, hourly, or even every 15 minutes). With that data, you can build reports directly in the spreadsheets or connect the data further to data visualization tools.

And if you lack the expertise to build sales reports yourself, Coupler.io has got something for you too. We have a large team of data experts that can build any custom reporting solution for you, be it a dashboard, data automation, transformation, or any other data wizardry you can think of. Together we can help you visualize your business data so you can reveal hidden insights and build the sales reporting you need.
If this sounds like a good option, please reach out to us for a free consultation.

Cost of sales reporting
The cost of sales reporting very much depends on the tools you use and your requirements.
If you use the reporting features inside your sales tools, you likely have some analytics available out of the box. It’s, however, a common practice to offer just the basic analytics on the lower plans and reserve the advanced analytics for those on the higher plans. Here’s for example an excerpt from Salesforce Cloud pricing.

If you choose to use Coupler.io for sales reporting, the subscription plans start from $49/month when billed annually. A free version is also available.
On every plan, you have access to all available source apps, including Salesforce, Pipedrive, and HubSpot. You can also take advantage of a customizable import schedule, as often as daily on the Starter plan and going down to 15-minute intervals on the higher plans.
Speaking of the app that can be used for reporting. Doing so in Google Sheets is free, while Excel comes as a part of the Office 365 package, although it’s also available as a standalone app.
And what about data visualization tools? Google Data Studio is free and can serve as a powerful platform for your sales dashboards. Tableau and Power Bi are available with a subscription fee, although free trials are also available.
The frequency of sales reporting
Some sales metrics should be monitored frequently, even daily. On the other hand, some may require a longer, even monthly timeframe to be the most meaningful. Let’s look at some examples.
Monthly sales reports
Monthly sales reporting is used to monitor sales performance on a month-to-month basis. It’s best for analyzing the effects of a sales strategy or trends that impact your performance as well as product decisions (changes to pricing, etc):
- Number of closed deals
- Total sales as well as sales by categories, regions, channels, etc.
- Average deal size
- Leads numbers on the sales funnel
- Sales cycle duration
Weekly sales reports
Weekly sales reports report on the performance week-to-week. They’re best for monitoring sales operations, the completion of sales goals, and the bottlenecks that appear and should be tackled immediately.
- Number of closed deals
- Total sales volume as well as sales by categories, regions, channels, etc.
- Conversion rate from leads to opportunities
- Conversion rate from leads to purchases
- Number of sales calls, meetings, etc.
- Quota completion
Daily sales reports
Daily sales reports are most suitable for sales rep KPI tracking – meetings, calls, and productivity in general.
- Call report, including the number of them and the average call duration
- Number of emails sent
- Email response time
- Number of opportunities converted
Export sales data automatically with Coupler.io
Get started for freeWhat is a sales report – sum up
As you can see, there are many different reasons to do sales reporting and sales analytics and many different ways to do it. Let’s look at some key takeaways.
There are two main approaches to running a sales reporting process. You can either use the data reporting features built into the CRM you use or develop sales reports in an external application.
Using built-in tools has certain benefits. The reports are available out of the box and require little to no effort from your side. On the other hand, the customization options tend to be limited. If a metric or a report you care about isn’t available, you’re often out of options and need to settle for something else.
External reporting solutions have that unique advantage – with a bit of effort you can build virtually any custom reporting. You can take advantage of dozens of visualization methods and can gain much deeper insights from your data. The downside – such solutions require a certain time investment in the initial setup and usually come with an additional fee.