Stripe holds your charges, subscriptions, invoices, payouts, refunds, customer records, and product data, but all of it stays locked inside Stripe’s analytics until you export it.
Once it’s out, you can combine it with other sources for cross-platform reporting, or build dashboards stakeholders can check without a Stripe login. It’s also how you reconcile transactions against accounting tools, or run AI analysis on patterns like churn and declining revenue before they show up in reports.
Coupler.io lets you export Stripe data on an automatic schedule, then analyze it with AI once it arrives. Manual CSV export and Stripe Sigma still work well if you only need a single file or prefer SQL inside Stripe.
How to automate data export from Stripe with Coupler.io
Coupler.io is a data integration platform and AI analytics tool that connects to Stripe and 400+ other business apps, including QuickBooks and Shopify. Set it up once, and your data refreshes automatically in whatever tool you report from.
Step 1. Collect data from Stripe
Start by deciding where your Stripe data should land. Once you connect your account, you’ll narrow it down to a specific entity and date range, so you’re only exporting what you’ll actually use.
Select a destination from the dropdown: Stripe to Power BI or Stripe to Data Studio for BI tools, Stripe to Google Sheets or Excel for spreadsheets, Stripe to BigQuery for a database, or AI tools for conversational analysis.
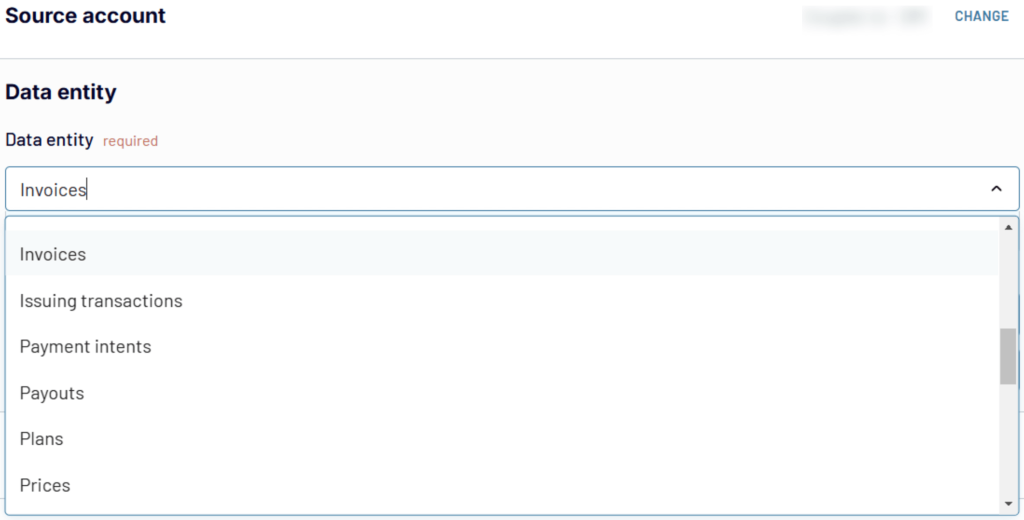
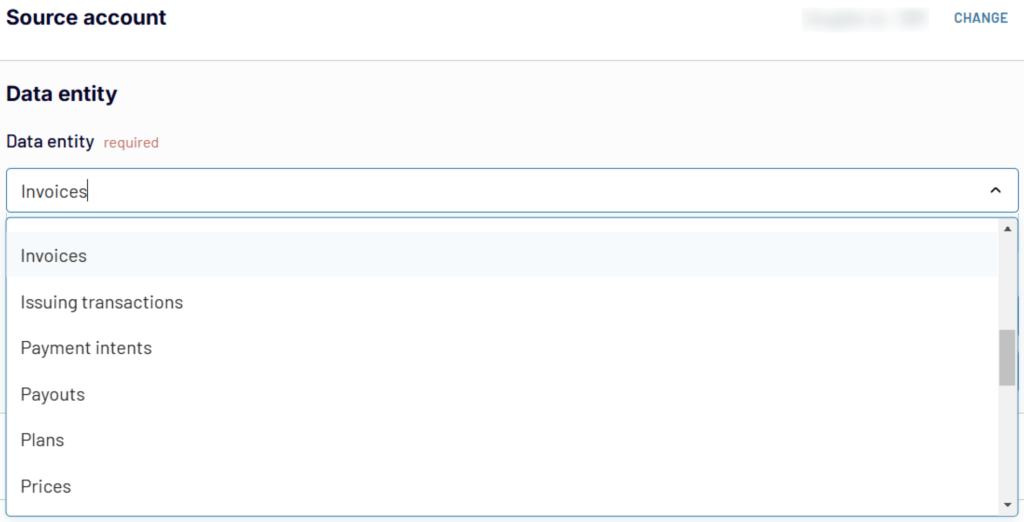
Sign up to Coupler.io for free. Connect your Stripe account, select the data entity you’ll export (I’ll choose Invoices here), and optionally set a date range before moving on.
Step 2. Organize your data
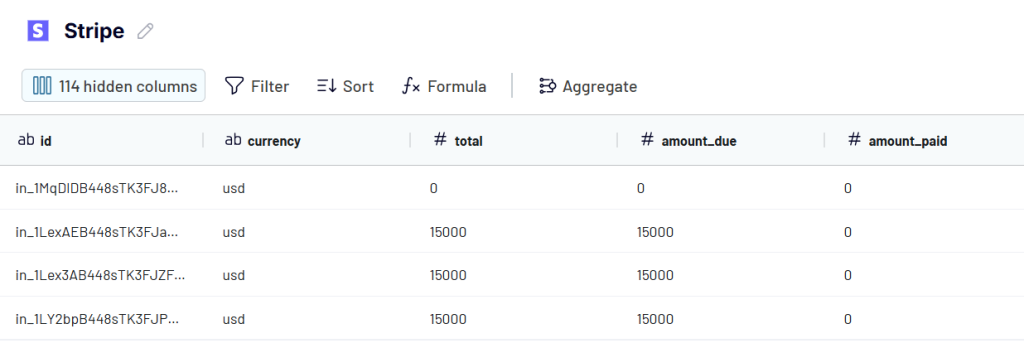
Shape your Stripe data before it reaches its destination. Preview it and apply:
- Rename, rearrange, hide, or add columns. Filtering and hiding sensitive fields here also controls what downstream tools, including AI, can see later.
- Sort by created date or amount, ascending or descending.
- Filter by criteria like payment status, currency, or date range.
- Add formula columns, like calculating net revenue after fees and refunds.
- Aggregate by month or customer using sum, avg., count, min., or max.
- Combine with other sources, like QuickBooks or Xero, for reconciliation in the same data flow.
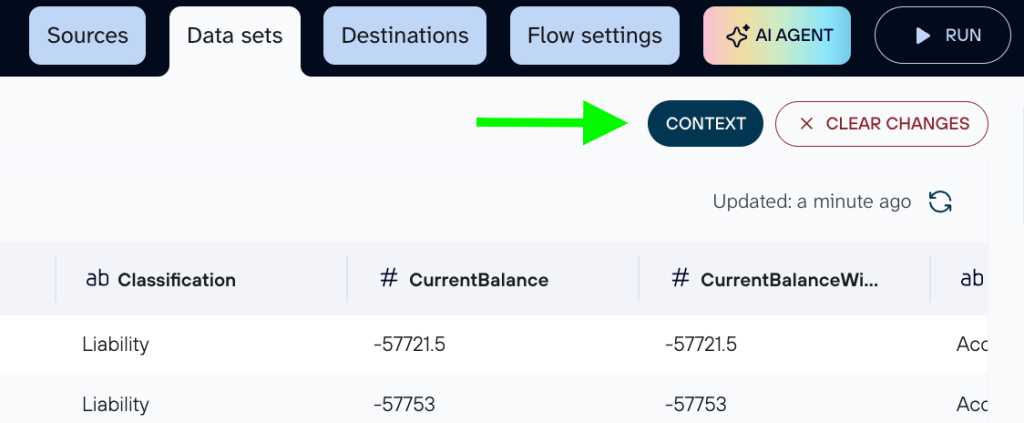
You can also attach business context, like field descriptions or metric definitions, to improve AI analytics later. Stripe stores amounts in the smallest currency unit, and statuses like past_due carry specific meanings; define that once, and every AI query carries it forward.
AI never connects to your Stripe account directly. It only works with the dataset you build here.
Step 3. Load data and schedule refresh
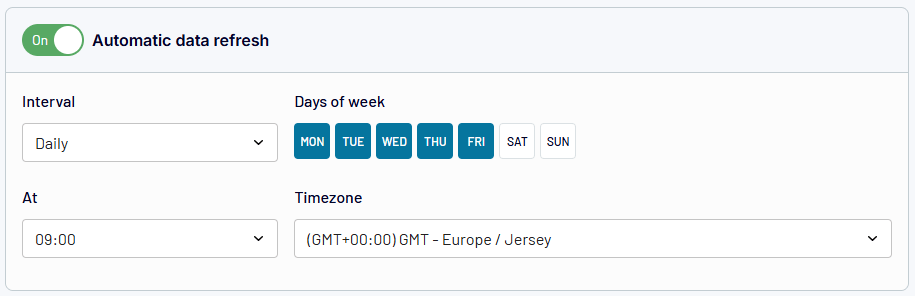
Load your data into the destination you picked, then turn on the automatic data refresh. Intervals range from monthly to every 15 minutes, so you can match the schedule to how often Stripe payouts or charges change.
You can send this data to multiple destinations at the same time. Add Google Sheets, Data Studio, BigQuery, and an AI tool as destinations in a single flow, and each updates on the same schedule.
Bonus step: Analyze Stripe data with AI
Once your Stripe data is organized and exported, the next problem is finding the answer you need. A question about failed payments or refund rates can still mean digging through the data and working out the calculation yourself.
With AI Agent, you can ask those questions directly in Coupler.io. Behind the scenes, the Analytical Engine calculates the answer from your dataset and validates the result before the Agent responds.
Try prompts like:
- “How does the refund rate compare across payment methods this quarter?”
- “Compare retention between customers who upgraded plans in their first 90 days and those who never upgraded.”
- “Find customers with more than one dispute in the past year and show their lifetime value against the average”
- “What’s the net revenue difference between customers billed annually versus monthly, once refunds and failed payments are factored in?”

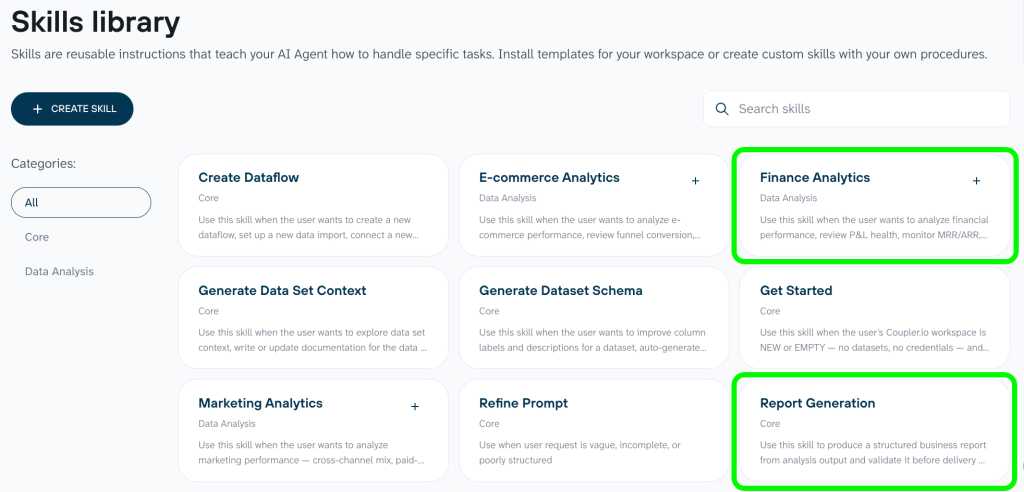
If you’re doing the same financial analysis repeatedly, AI Skills mean you don’t have to build the prompt from scratch every time. The finance-analytics skill is set up to spot revenue patterns and anomalies. The report-generation skill takes those findings and formats them into a report.
And you’re not limited to working inside Coupler.io. AI Integrations lets you use the same Stripe data with tools like Claude, ChatGPT, or Gemini. Coupler.io handles the data connection, so the AI never talks to your Stripe account directly. If Claude is your preferred tool, How to Connect Stripe to Claude walks through the setup.
The AI only sees the data you’ve made available in your organized dataset. This lets you keep sensitive Stripe data out of the analysis when it isn’t relevant to the question.

Analyze Stripe data with AI in Coupler.io
Get started for freeWhat data you can export from Stripe with Coupler.io
The steps above work for any Stripe data entity. Each one can be added to its own data flow, or you can pull multiple entities into a single data flow to keep related data together.
Coupler.io covers 30 Stripe data entities, grouped here by category. Click each one to expand:
How to export all transfers from Stripe automatically
Want to export transfers from Stripe? You can use the same method described above.
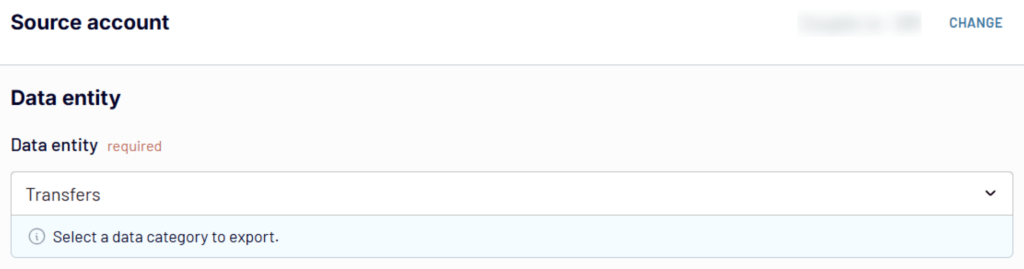
Connect your Stripe account with Coupler.io and select Transfers instead of Invoices as your data entity. From there, the rest of the setup (organizing data, choosing a destination), is identical.
Where you can export Stripe data with Coupler.io
Coupler.io sends Stripe data to the tools your team already works in, and a single data flow can target multiple destinations at once.
Spreadsheets: Google Sheets, Microsoft Excel. Good for quick sharing, ad hoc analysis, or feeding data into existing financial models.
BI and dashboard tools: Data Studio (formerly Looker Studio), Power BI, Tableau, Qlik. For visual reporting that updates on a schedule.
AI tools: Claude, ChatGPT, Gemini, Perplexity, CursorAI, OpenClaw. Enterprise options include Microsoft Copilot Studio and Gemini Enterprise. For conversational analysis of your Stripe data in the AI tool you already use.
Data warehouses: BigQuery, Supabase, Snowflake, PostgreSQL, Redshift. For long-term storage and cross-source joins, or as a centralized layer behind your BI tools.
Other: JSON, CSV, monday.com, Microsoft Excel desktop.
Need help with your Stripe data export?
Book a demoVisualize data with ready-to-use Stripe dashboard templates
Once you’ve automated your Stripe data export with Coupler.io, you can transform that data into visual reports using ready-to-use dashboard templates. Depending on your business model, you can choose between two specialized templates designed for different types of Stripe users.
Stripe revenue growth dashboard for subscription businesses
The Stripe revenue growth dashboard consolidates your billing data to track MRR (Monthly Recurring Revenue) and customer retention alongside subscription plan performance. It helps you understand whether revenue growth comes from acquiring new customers or increasing the value of existing ones.
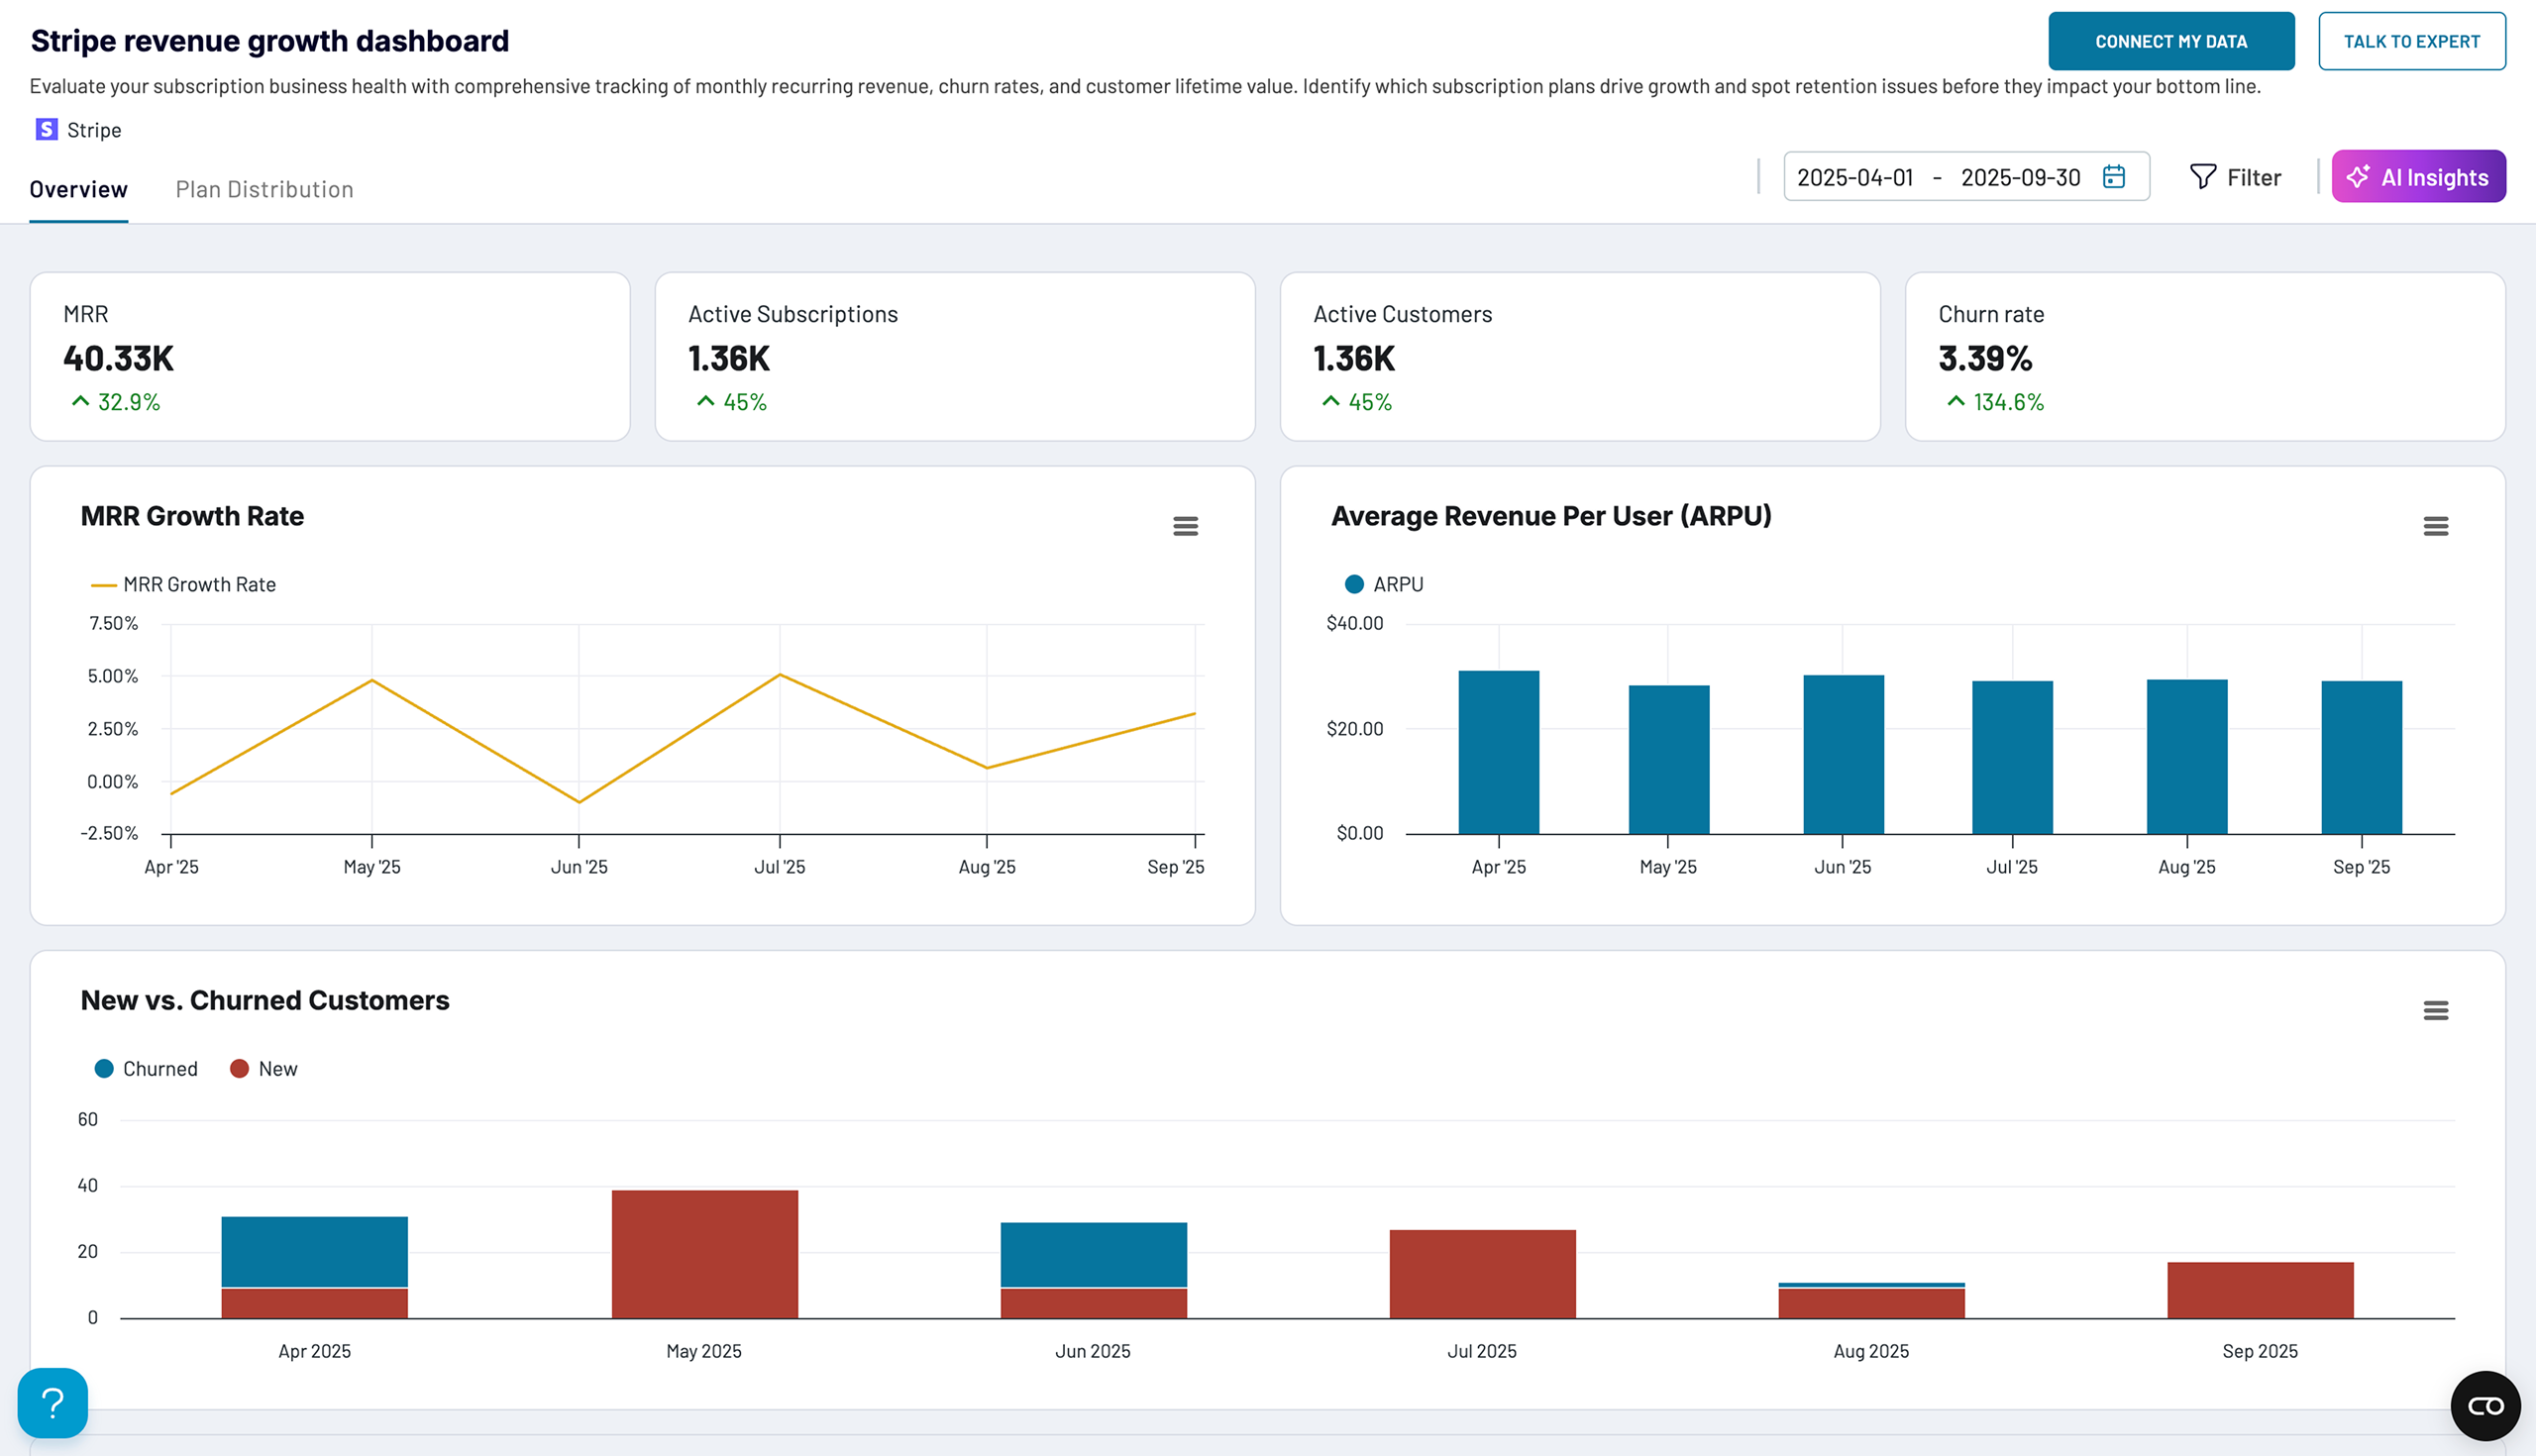
Key metrics you can track include:
- MRR growth rate: monitor monthly percentage changes in recurring revenue to spot acceleration or deceleration trends
- Average Revenue Per User (ARPU): determine if growth stems from higher-value customers or volume increases
- Customer churn rate: track the balance between new customer acquisition and churn to identify retention issues
- Subscription plan performance: analyze which pricing tiers drive the most revenue and sustainable growth
- Revenue forecasting: create accurate projections based on historical MRR patterns for investor reporting
The dashboard automatically updates with your Stripe data via Coupler.io’s scheduled refresh, keeping your subscription metrics up to date for decision-making. It’s available natively in Coupler.io and as a template in Data Studio. Pick the version you like and try it for free.


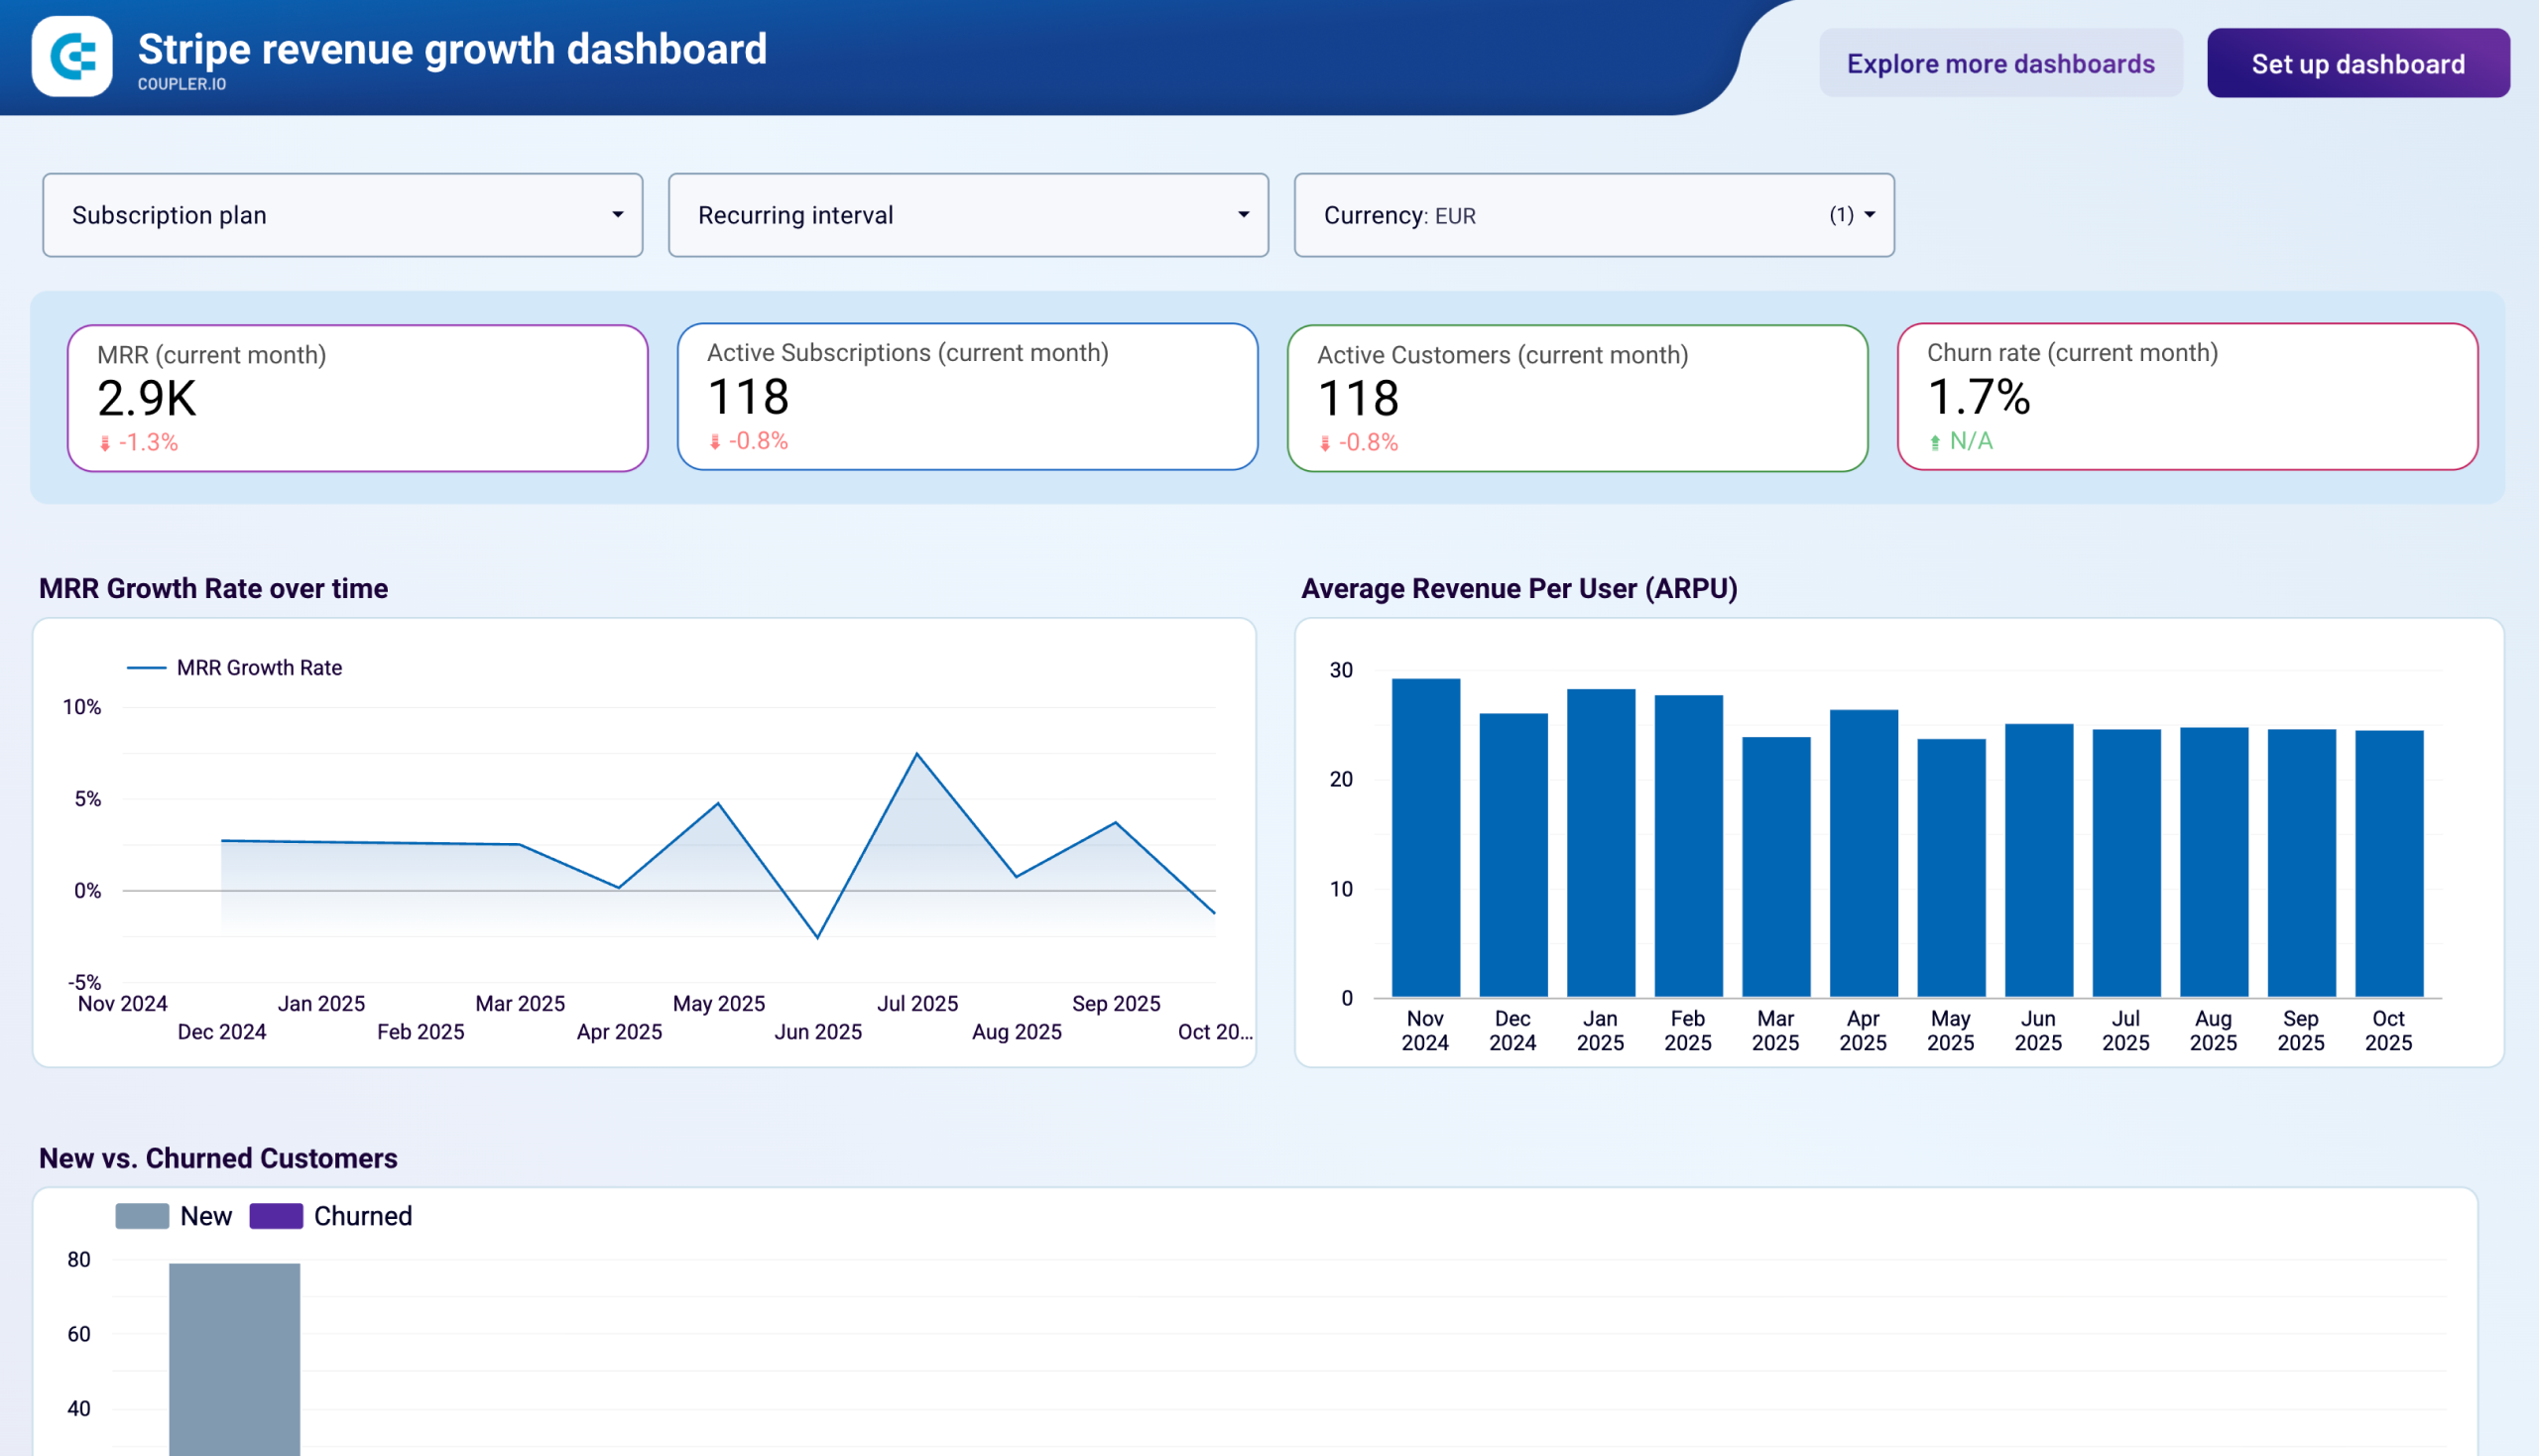
This type of automated reporting is only possible when you export Stripe data on a schedule, something manual exports can’t achieve efficiently.
Stripe e-commerce dashboard for online stores
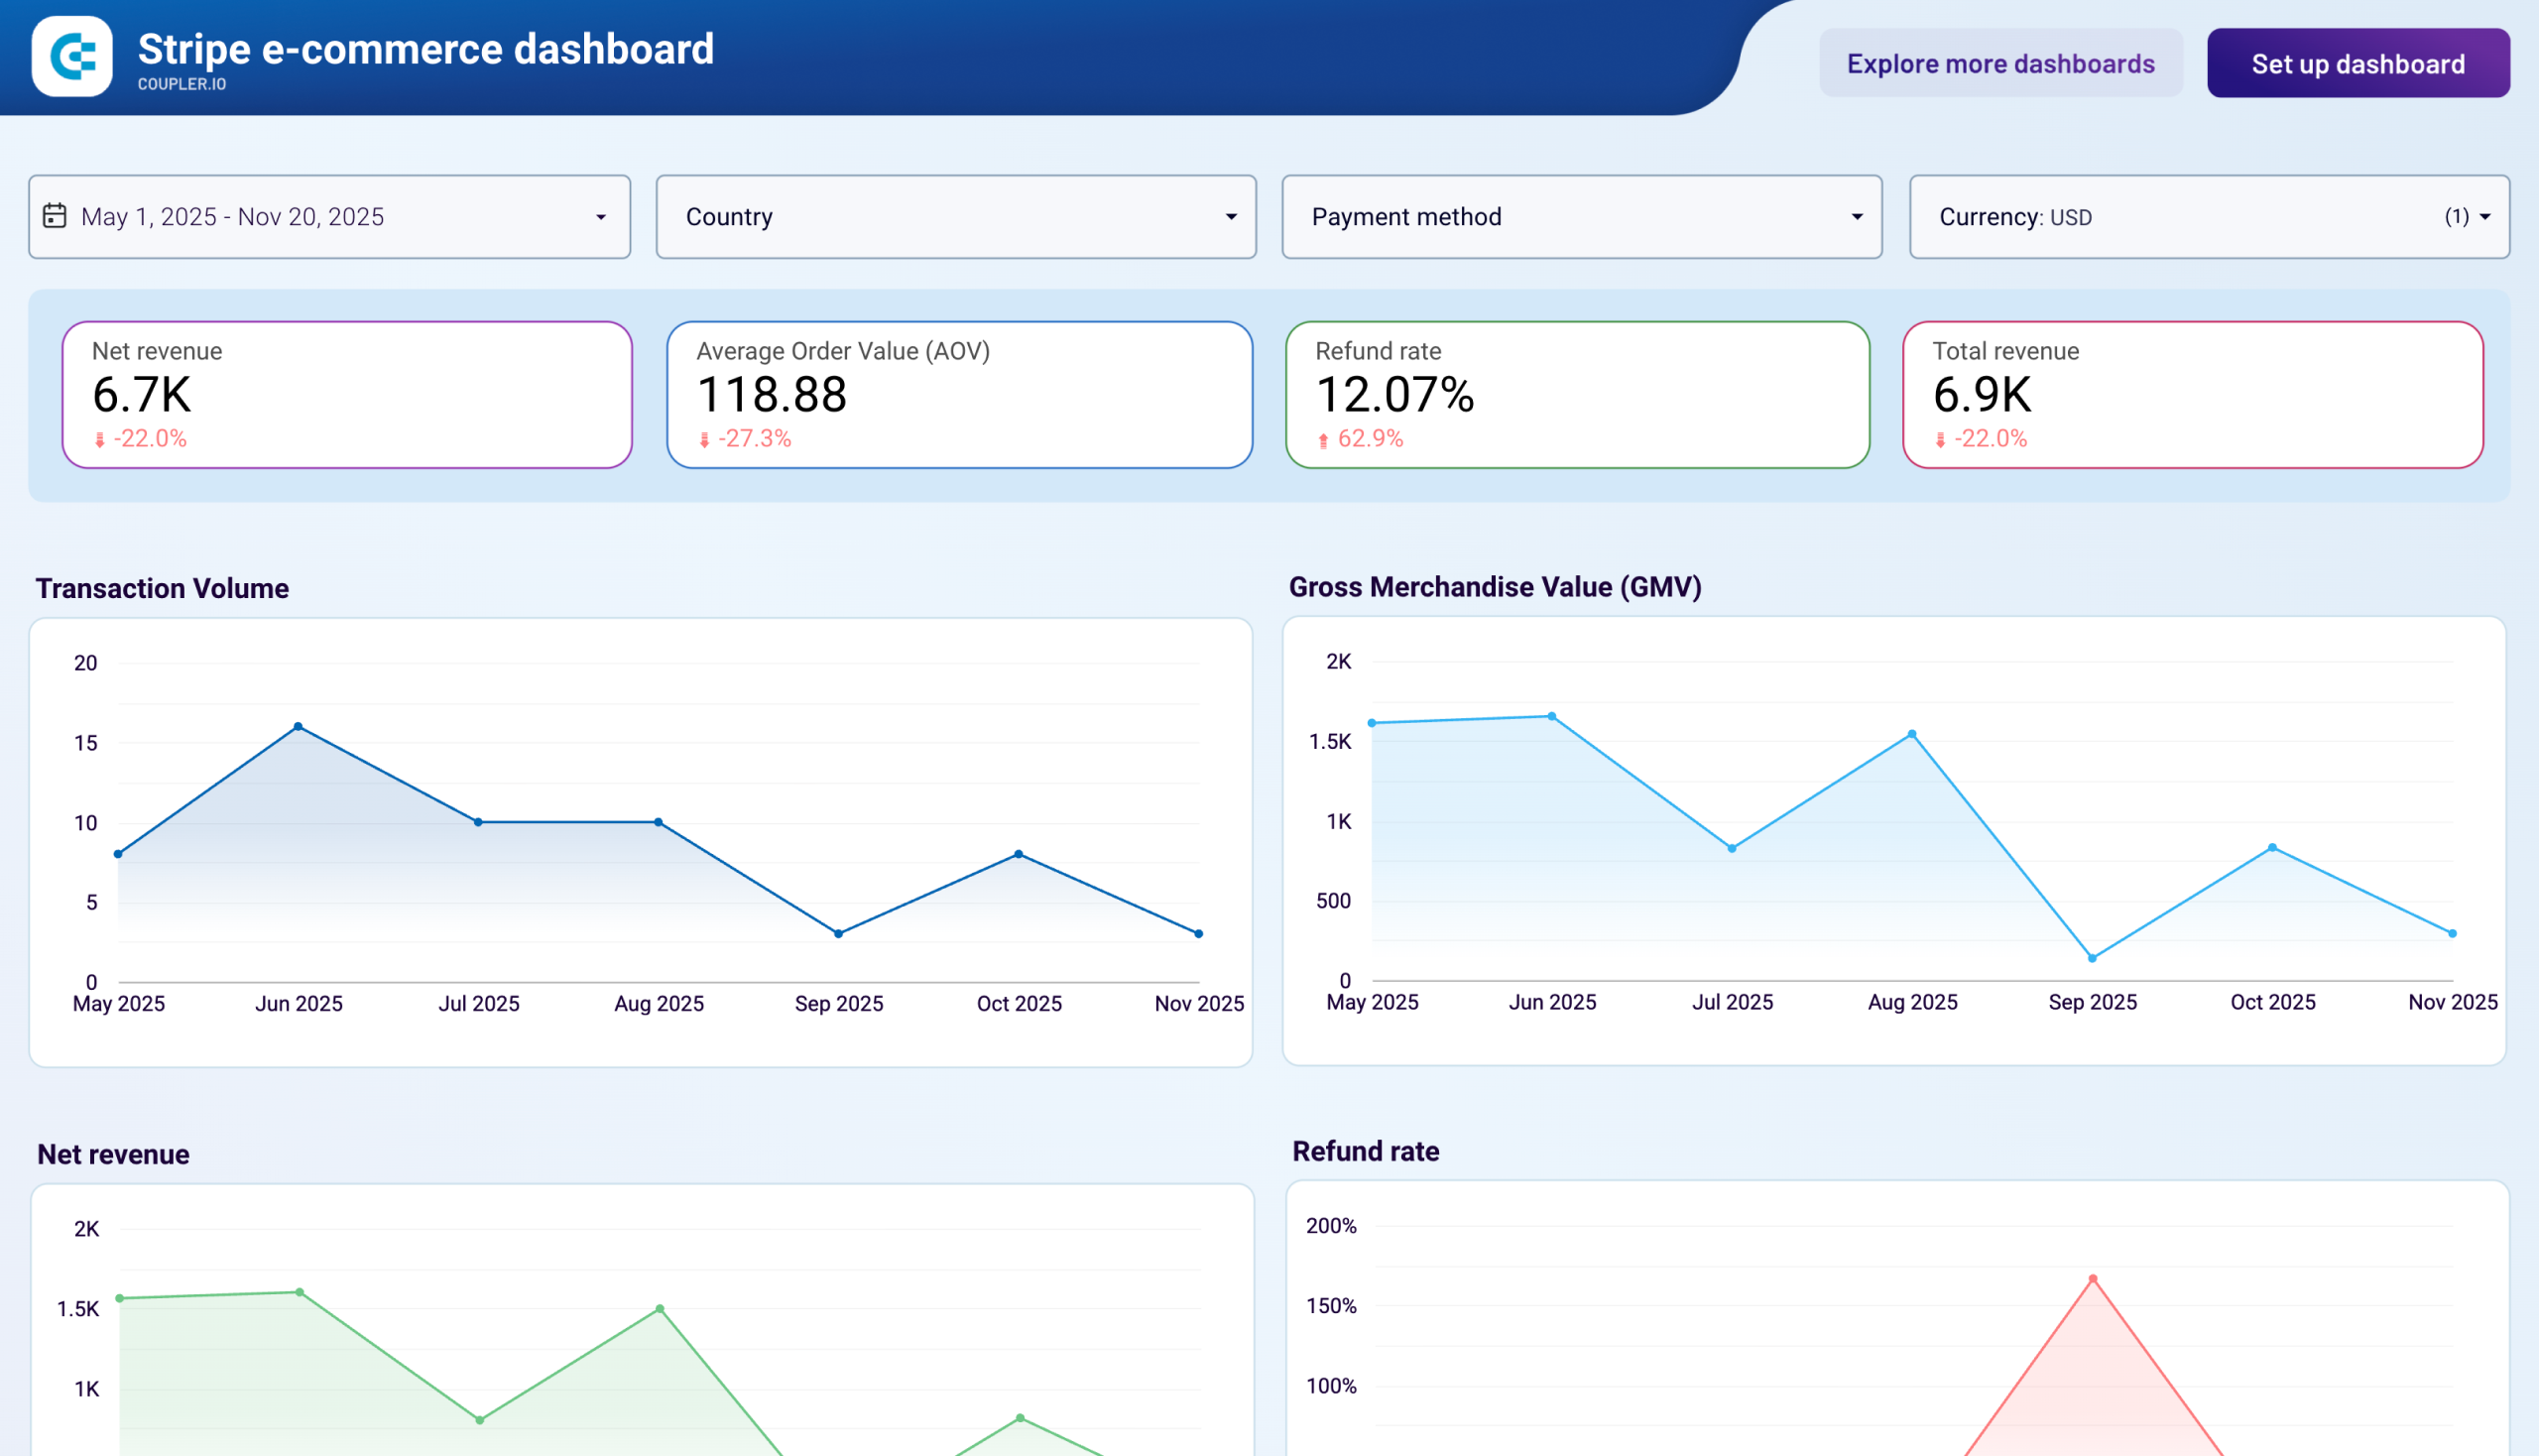
The Stripe e-commerce dashboard is built for online store owners and finance teams who need to monitor payment processing performance and identify revenue issues. This dashboard consolidates Stripe payment data to show transaction volume trends, refund rates, payment method effectiveness, product revenue contribution, and geographic sales patterns in a unified view.
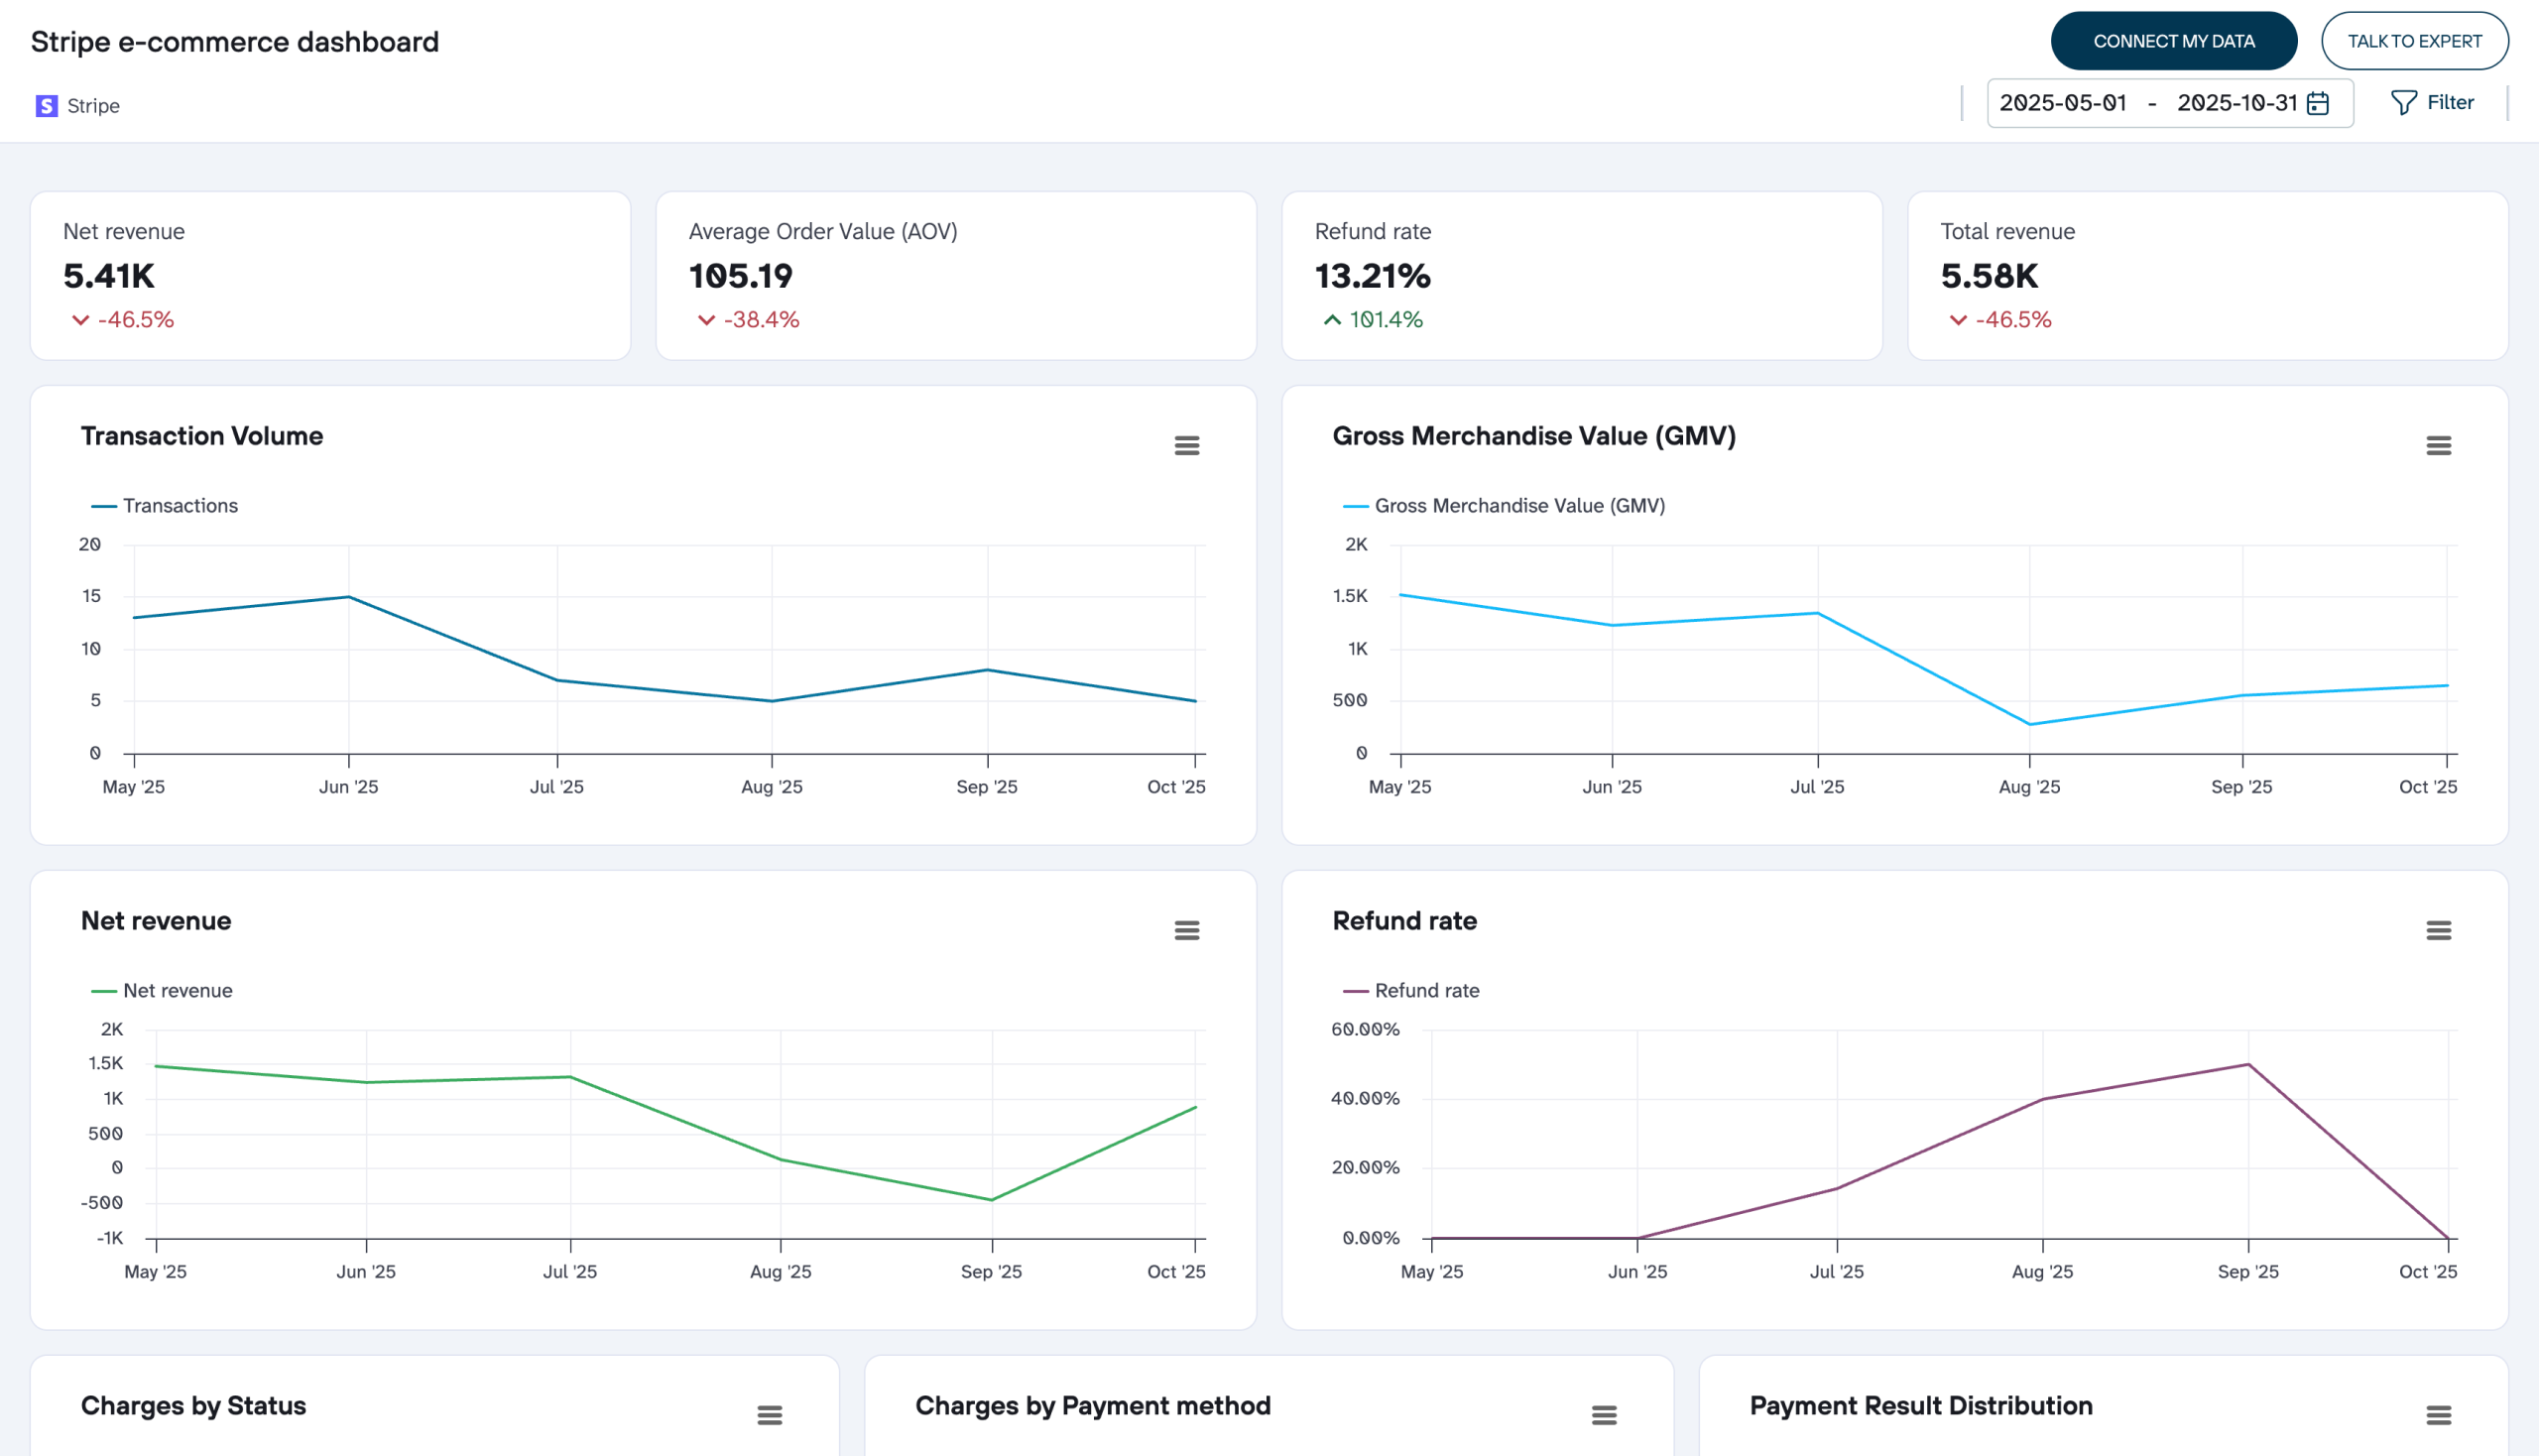
The dashboard helps you spot checkout friction and understand where revenue is lost, so payment processing decisions come from data instead of guesswork.
Key metrics you can track include:
- Transaction volume and GMV: track how many payments are processed and total payment amounts before refunds to reveal seasonal patterns and growth trajectories
- Net revenue and refund rate: monitor actual collected revenue after refunds alongside refund percentages to identify whether revenue fluctuations stem from sales changes or product quality issues
- Payment method performance: analyze charge success rates across different payment types to remove methods creating friction and add options that improve conversion
- Charge status distribution: view transactions broken down by successful, pending, refunded, and canceled outcomes to understand payment flow health
- Product revenue contribution: identify which products generate the largest share of revenue to prioritize inventory and marketing investments effectively
- Geographic market analysis: compare revenue, disputes, and failed charges by country to identify strong performers and markets requiring policy adjustments
The dashboard is available natively in Coupler.io and as a template in Data Studio. Choose the version you like and connect it to your Stripe account.


Other Stripe data export methods
Coupler.io covers the automated path, from scheduled refreshes to AI analysis. For a one-off CSV snapshot or SQL queries run directly inside Stripe, two alternatives are worth knowing about.
How to perform manual Stripe export
Stripe’s dashboard has a built-in export for individual data entities. It’s manual and one-off, but it works when you only need a quick CSV. Here’s how it looks with payouts.
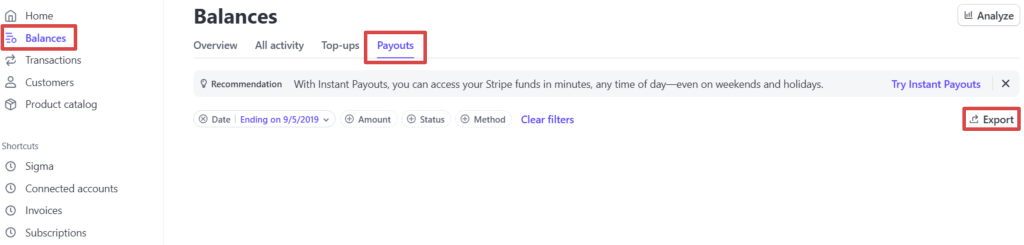
Log in to your Stripe account and click Balances at the top left. Then, select Payouts at the top. At the top right, you will see the Export button.
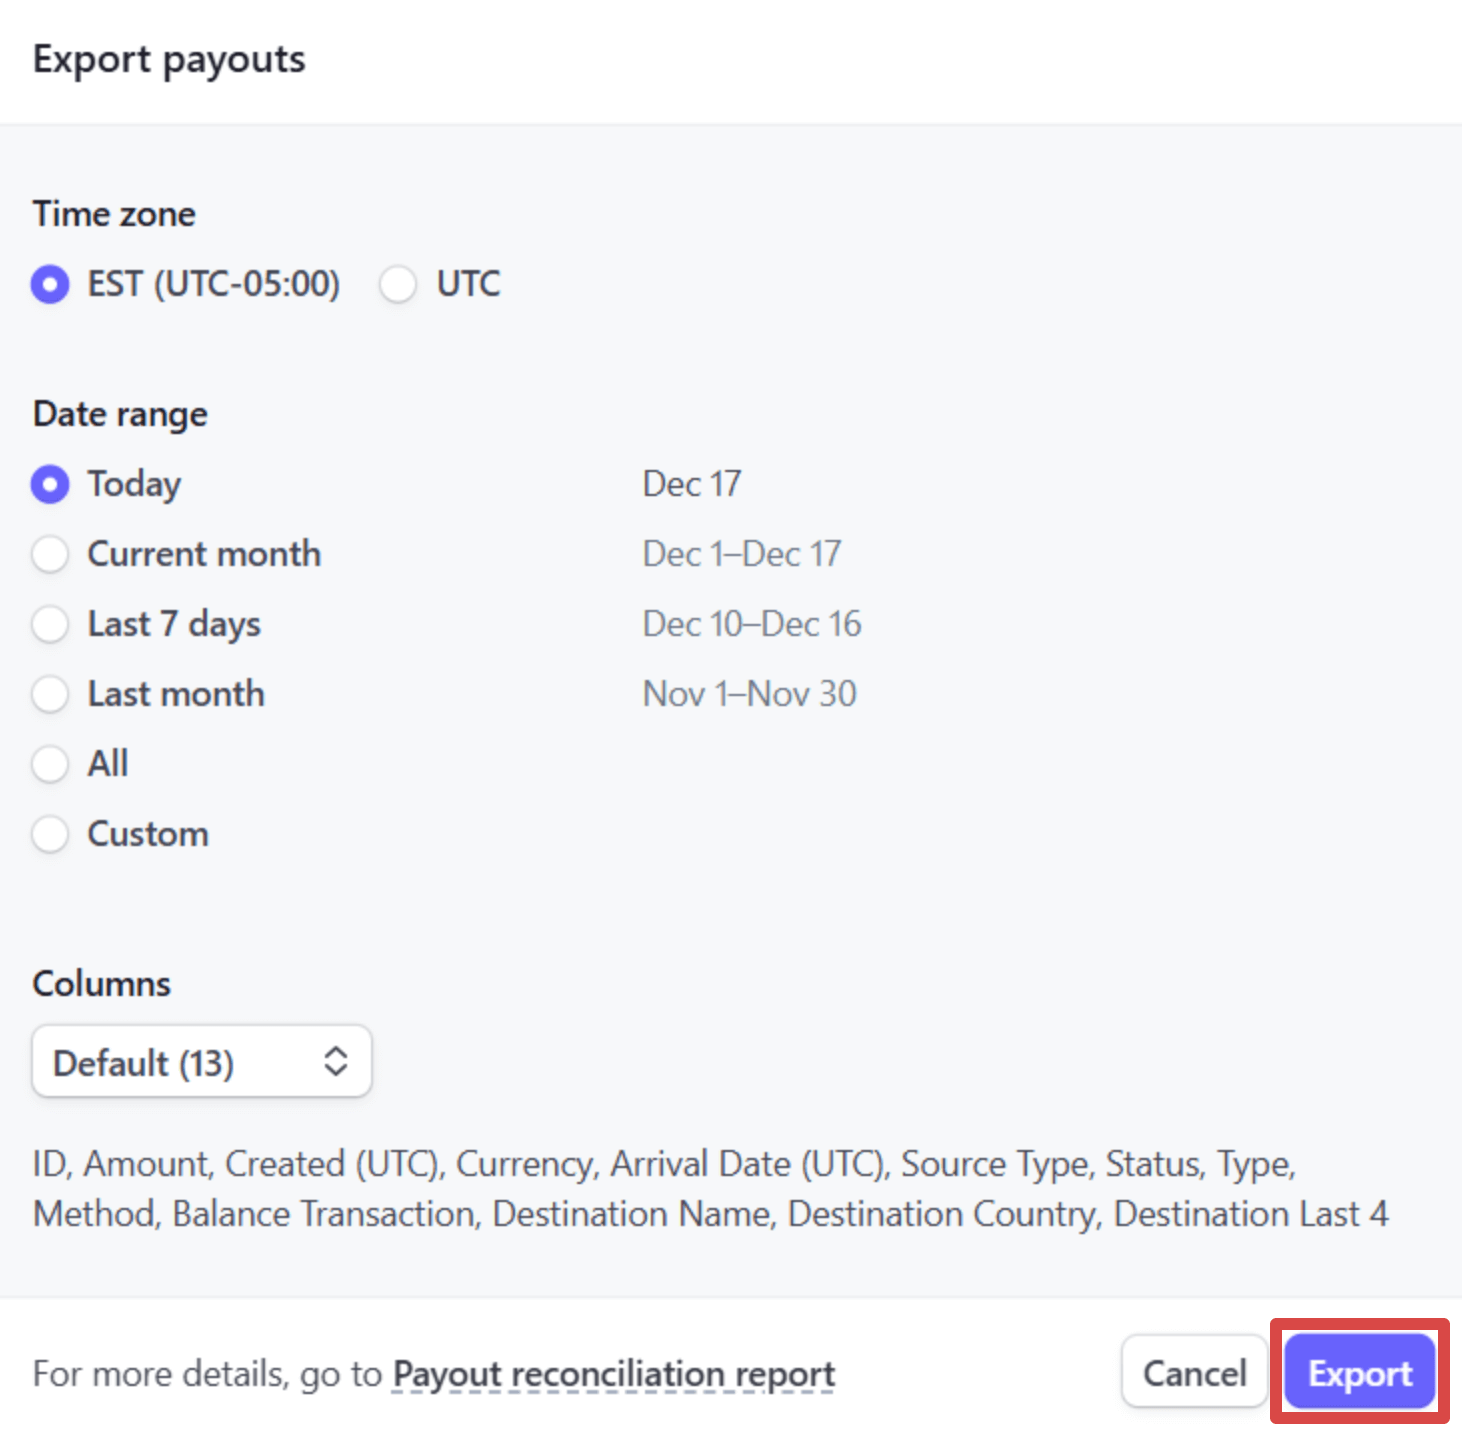
Configure the export by selecting the time zone and date range. Finally, click Export.
Your data will be exported as a CSV file. You can then import this CSV report into your preferred reporting tool (Data Studio, Power BI, etc.).
Manual export gives you the raw data with no way to filter rows, sort, add or rename columns, or combine data with other sources before the download. Coupler.io lets you reshape the dataset before it lands in your destination, which matters once you’re working with more than a one-off pull.
How to use Stripe Sigma, Stripe’s SQL solution
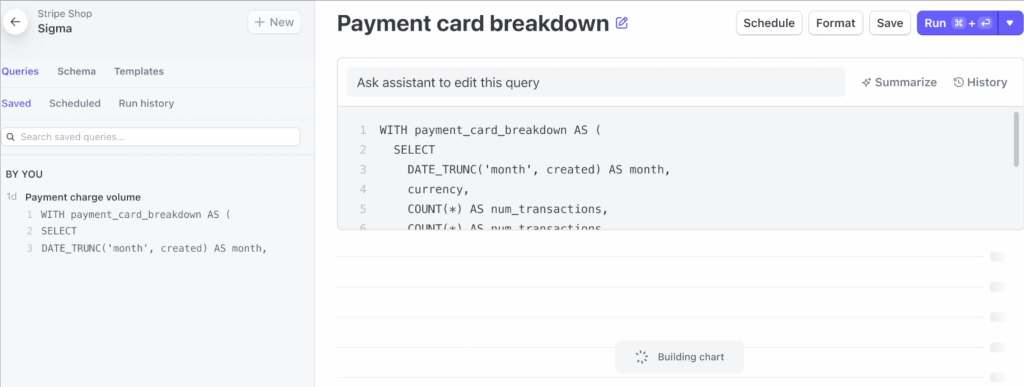
Stripe Sigma is an SQL environment that allows you to create custom reports that can be saved and exported later. Stripe Sigma where users can create and visualize reports from data. It is an alternative to using Stripe API.
First, log in to your Stripe account and find Stripe Sigma in the navigation menu. Then, you can enter your queries manually to create a custom report. This is an SQL-based environment, so you must have some SQL knowledge to use it.
A more straightforward option is to use one of the templates provided by Stripe to export data. Click on Templates and customize or select one of the options.
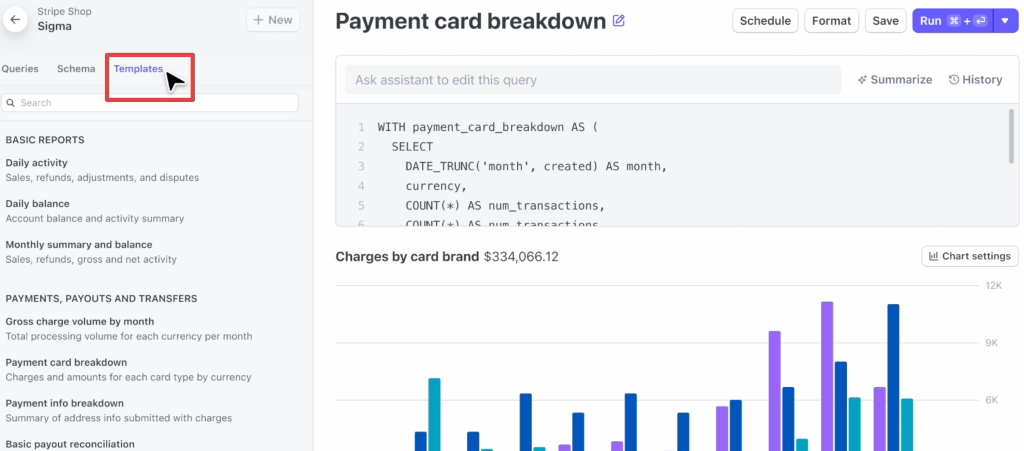
To export the required data, you must Run the report first. Next, download it as CSV. All transactional data becomes available in an interactive SQL environment in your dashboard.
This method of Stripe data export gives you a lot of flexibility, but it might require a significant learning curve. It is also a paid option, unlike manual data export. The pricing depends on the number of users and the number of transactions.
How to export all data from a Stripe account
If you want to export all of your data from a Stripe account, you might be in for a challenge. Stripe doesn’t allow a single bulk download across all data types. But there are a few ways to work around that.
- With Coupler.io, you can add multiple data entities to a single data flow, or create separate data flows if you prefer to keep them organized individually. You can specify the same spreadsheet as a destination but choose a separate sheet for each data type.
- After that, all data from your Stripe account will be exported at once, and Coupler.io will automatically export fresh data according to your schedule. You’ll get an auto-updating spreadsheet containing all your Stripe data, one data type per tab.
- Another option to export all Stripe data is to use Stripe’s API. However, this is a bit more complicated, especially if you don’t have the necessary technical skills.
- If you plan to change your service provider and cancel your Stripe account, you must know that Stripe provides migrations. You can request data migration from the Stripe support team to ensure all your information reaches your new account securely.
Why export Stripe data with Coupler.io
Manual CSV export is fine when you need a quick snapshot, and Stripe Sigma works well for SQL-based analysis inside Stripe. Both solve the problem of getting data out once.
Coupler.io is built for everything that happens after that. One connector gives you access to all 30 Stripe data entities and a way to structure your data for reporting and AI analysis. By setting up one export, you can send the same data to a spreadsheet, a dashboard, or an AI tool simultaneously.
Once the pipeline is running, the data stays fresh without you going back to Stripe.
Automate Stripe data exports and AI analysis with Coupler.io
Get started for free