How to Measure Your Ads Leads Performance: Essential Dashboards and KPIs
What ad lead performance really means
Ad platform reports show you clicks, impressions, and other surface-level performance metrics. Here’s the uncomfortable truth: clicks don’t equal revenue. Neither do raw lead numbers if they never move further down the customer journey.
What you really need to know is how many qualified leads are coming in, how much they cost, and whether they’re turning into revenue.
Measuring ad lead generation properly means going beyond volume and tracking:
- Quantity: Understand the total number of leads your digital marketing efforts are generating.
- Quality: Track how many leads become MQLs (marketing-qualified leads), SQLs (sales-qualified leads), and ultimately conversions or paying customers.
Funnel visualization measurement
A performance funnel is the simplest way to translate campaign metrics into a story you can act on. Picture it as a narrowing path where each stage of the customer journey gets smaller:
Impressions → Clicks → Leads → Qualified Leads → Revenue
This visual approach makes campaign troubleshooting intuitive, as you can see exactly which stage of the customer journey needs optimization. Here is what the funnel to measure ads leads performance looks like in the customer acquisition dashboard for HubSpot by Coupler.io.
- The number of impressions tells you how often your ad is seen
- Clicks show whether your ad copy and targeting resonate and make users click
- Leads show whether the landing page convinced people to take a desired action
- Revenue shows whether those leads are valuable to your business goals.
Here’s how to read it in practice:
- Top of the funnel (Impressions → Clicks): This is where CTR matters most. A low CTR signals ad fatigue, weak targeting, or poor ad placements.
- Middle of the funnel (Clicks → Leads): Conversion rate tells the story here. If you’re generating clicks but few leads, the landing page, form, or offer isn’t strong enough.
- Bottom of the funnel (Leads → Revenue): CPL, CPA, and ROI come into focus. If you’re generating a high number of leads but they aren’t converting into SQLs or sales in your CRM, it usually points to a lead quality issue. This is likely caused by weak targeting that attracts non-ICP leads, or by ad copy that set unrealistic expectations compared to what the product actually delivers.
For example, a SaaS PPC campaign shows 10,000 impressions, 600 clicks (6% CTR), and 100 leads (16.6% conversion rate). At first glance, this looks healthy.
But if only 5 of those leads request demos or start trials that move into your CRM pipeline, your return on ad spend is poor.
With a funnel view, it’s clear that the breakdown happens between leads and qualified leads, not at the click stage. That directs you to improve targeting and tweak ad copy to ensure you’re attracting qualified leads.
Core metrics to measure ad leads performance
Here are the main PPC and digital marketing metrics that performance marketers rely on to understand, compare, and optimize campaign effectiveness:
| KPI | Formula | What it tells you |
|---|---|---|
| Cost per Lead (CPL) | Ad spend / Number of leads | Quick efficiency check |
| Cost per Click (CPC) | Ad spend / Number of clicks | Gauge for bidding efficiency |
| Cost per Acquisition (CPA) | Ad spend / Number of conversions | True acquisition cost |
| Return on Investment (ROI) | (Revenue – Spend) / Spend | Overall profitability |
| Return on Ad Spend (ROAS) | Revenue / Ad spend | Ad-specific profitability metric |
| Click-through Rate (CTR) | Number of clicks / Number of impressions | Effectiveness of ad copy and targeting |
| Conversion Rate | Leads / Clicks | Landing page and form performance |
| Lead Value | Revenue / Number of leads | Quality of leads over volume |
| Qualified Lead Rate | Qualified leads / Total number of leads | Targeting and lead quality assessment |
| Lead Velocity | Number of leads added to the pipeline per period | Growth pace over time |
| Lifetime Value (LTV) | Revenue per customer over time | Strategic long-term customer value |
Platform-specific ad lead metrics
Now that we’ve covered the universal KPIs, let’s zoom in on how these play out on different platforms. Each channel has its own campaign metrics that influence PPC strategy, targeting, and ROI:
Google ads
- Strengths: High-intent search ads drive potential customers at the bottom of the funnel.
- Challenges: Higher CPC and competition.
- Key KPIs: CTR, CPC, CPL, CPA, Conversion Rate, Quality Score.
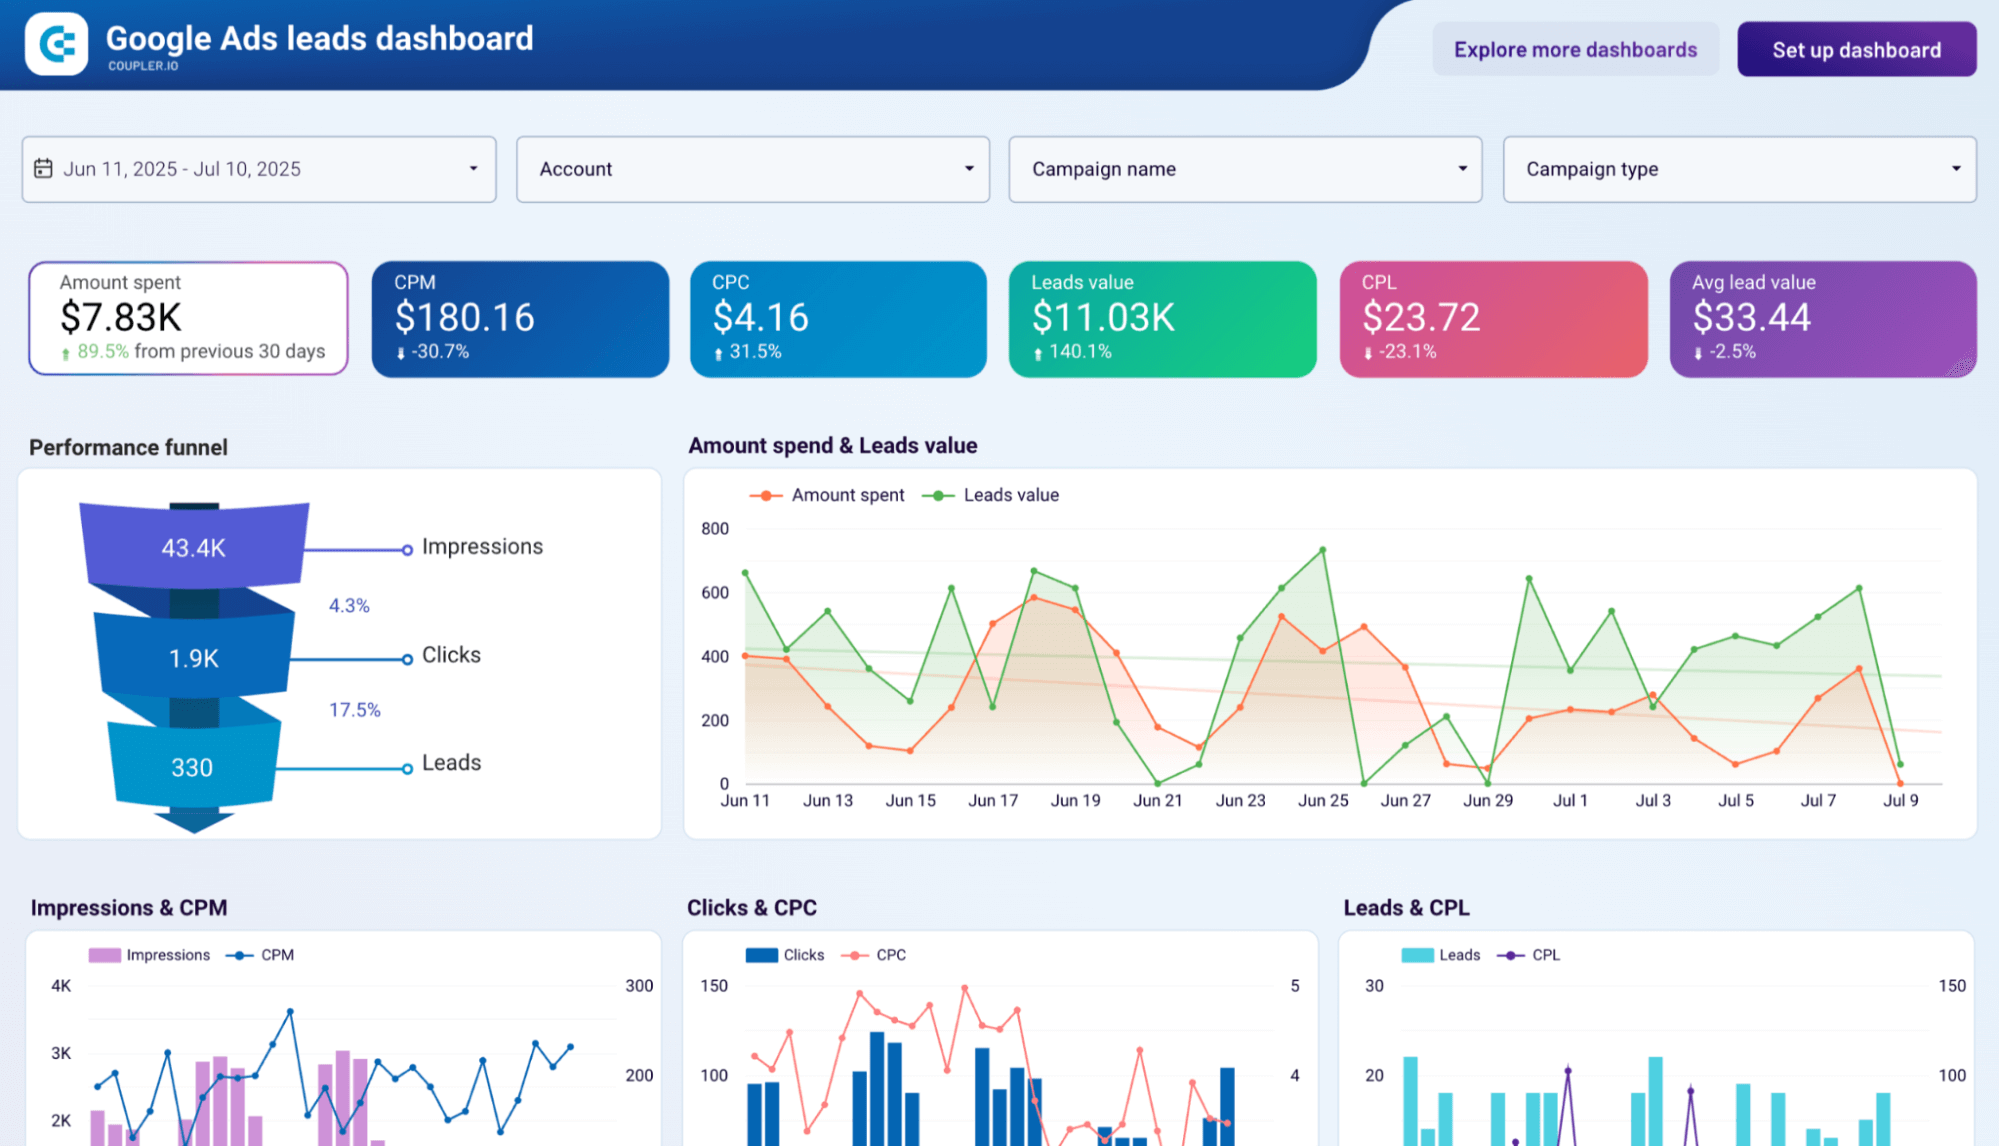
Google Ads shows you impressions, clicks, and conversions inside the ads account or through Google Analytics. At the same time, you can track lead conversions easily in a dedicated Google Ads leads dashboard by Coupler.io.
Facebook ads
- Strengths: Lower CPLs and broad social media reach, strong for top/mid-funnel brand awareness.
- Challenges: Lower lead quality and need for more nurturing.
- Key KPIs: Impressions, Clicks, CPL, Conversion Rate, Demographics.
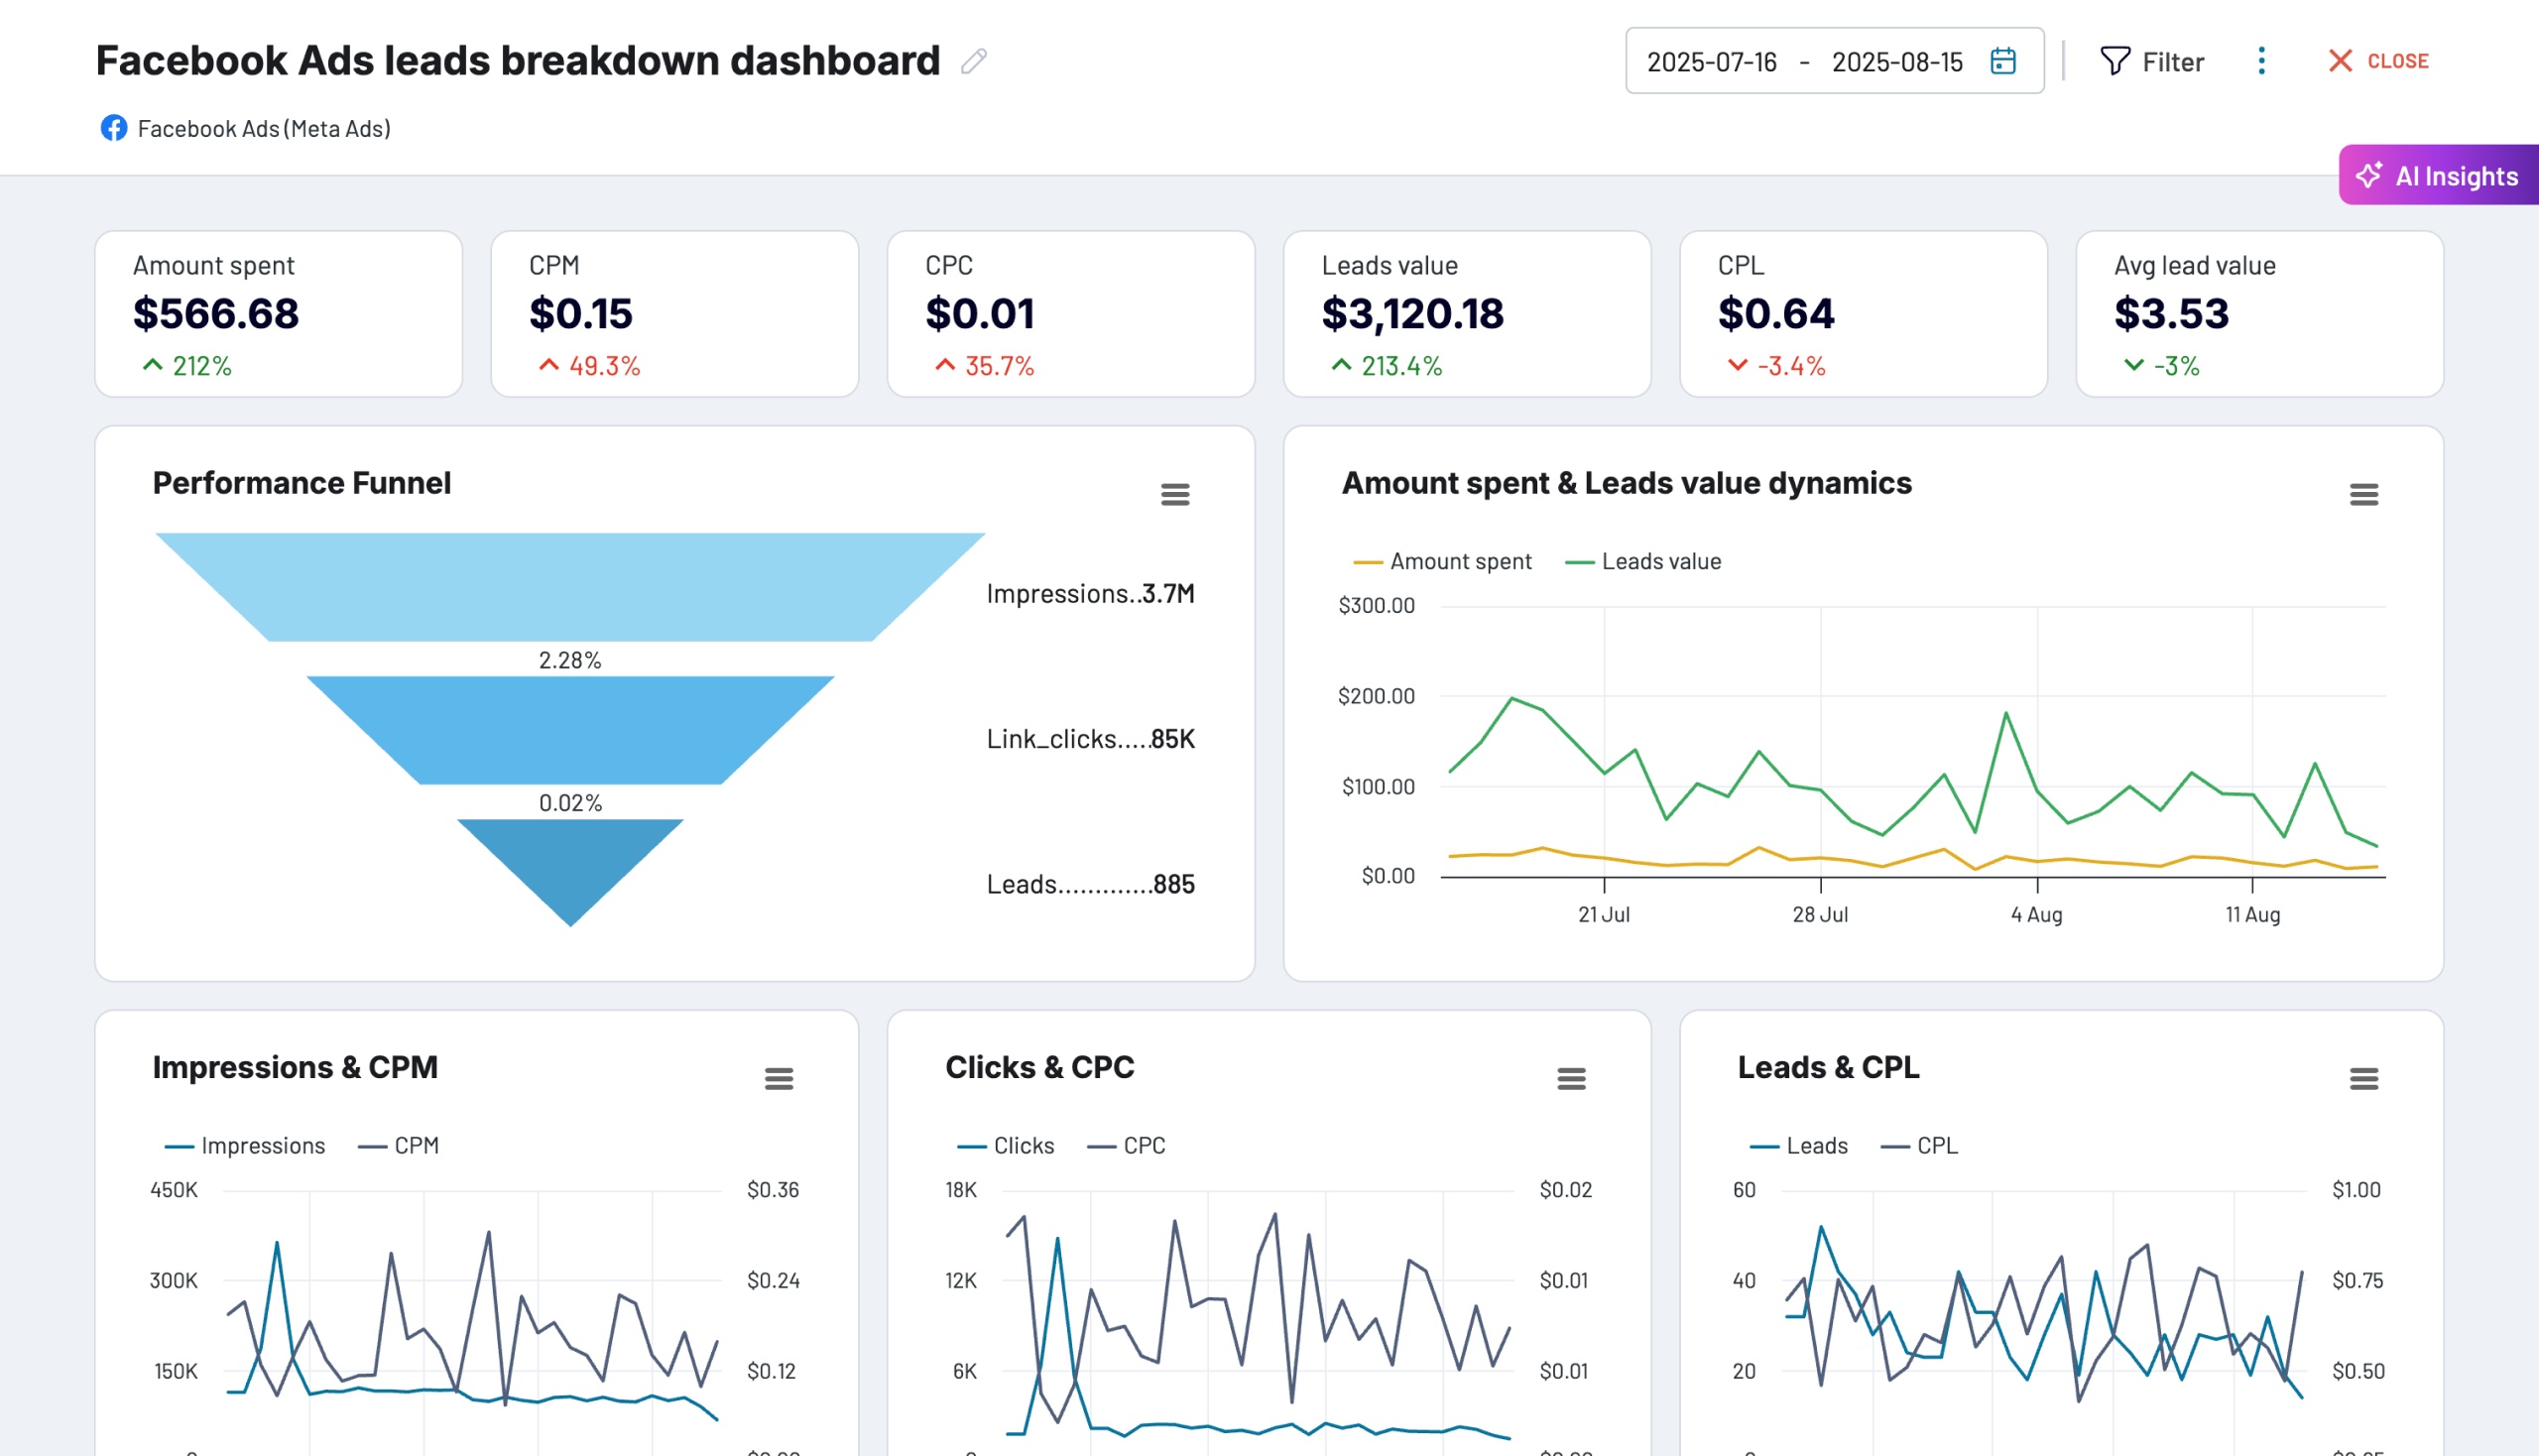
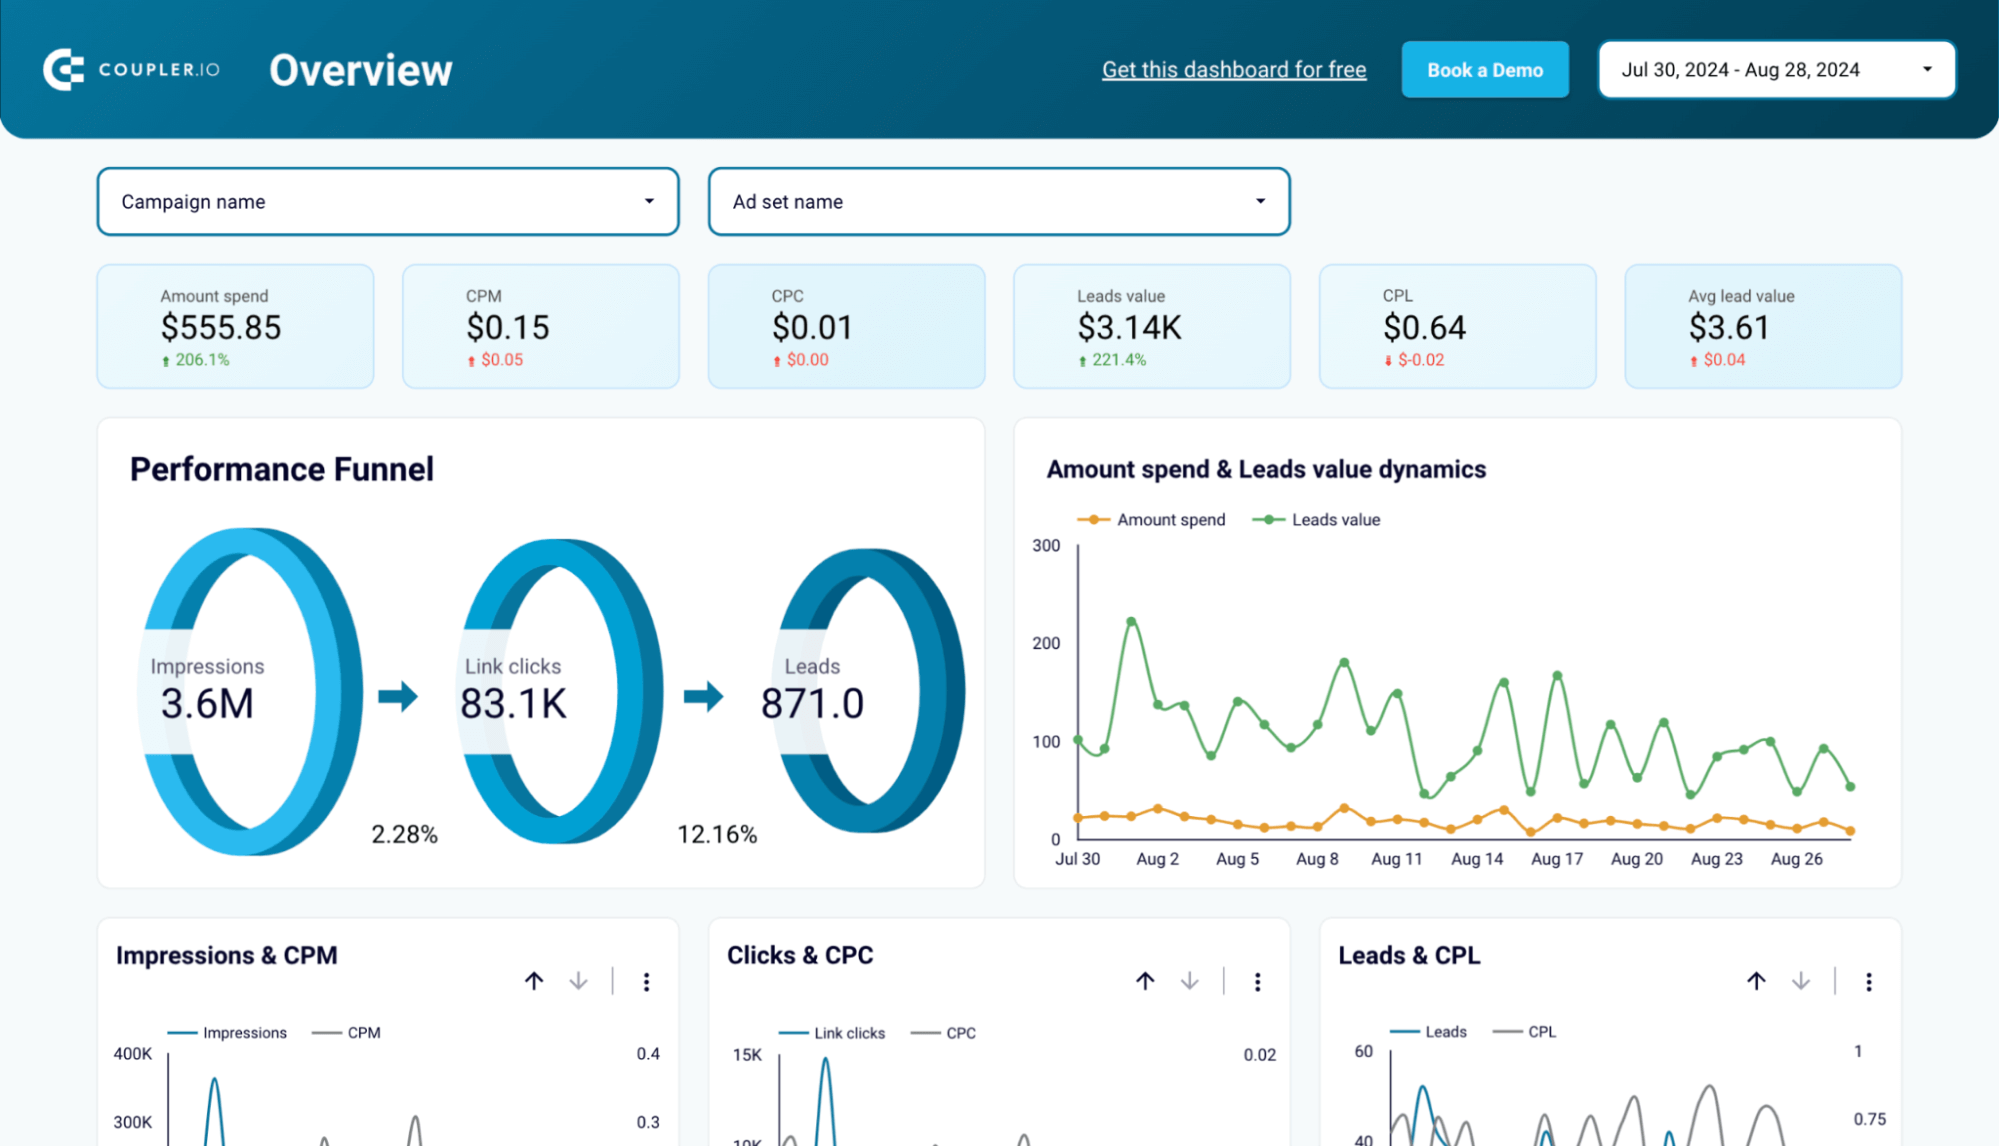
Facebook Ads Manager provides campaign-level stats, but comparing CPL or lead value across audiences is clunky. Therefore, opt for the Facebook Ads leads breakdown dashboard by Coupler.io to have a better way to measure ads leads performance.
LinkedIn ads
- Strengths: Highly targeted B2B ad groups and ad placements; better SQL quality.
- Challenges: Higher CPL benchmarks.
- Key KPIs: CPL, ROI, ROAS, SQL Rate, Conversion Rate, Lifetime Value.
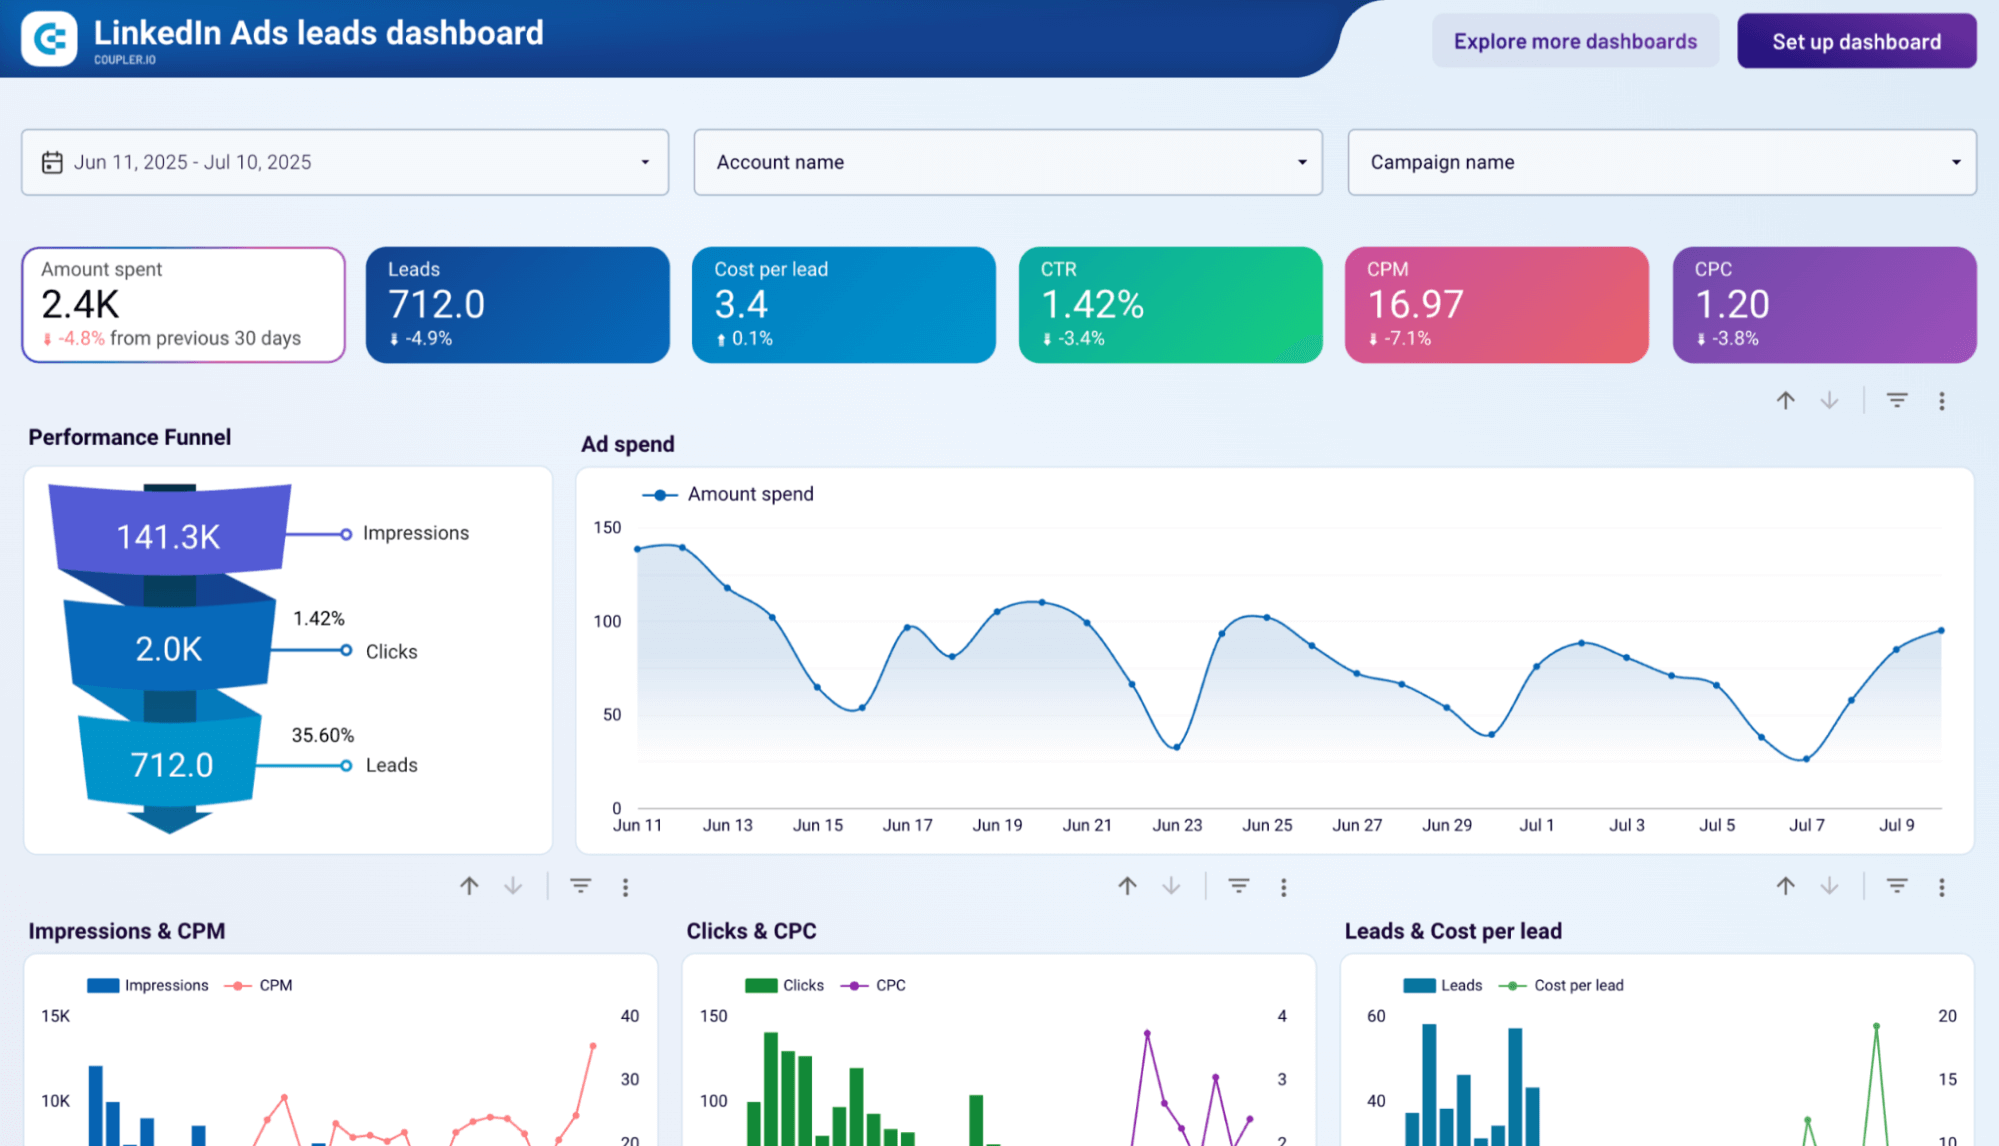
LinkedIn Campaign Manager lets you see spend and leads, but doesn’t easily connect those numbers to SQLs or ROI. With the LinkedIn Ads leads dashboard by Coupler.io, you can do this and measure ads leads performance more effectively.
Why measuring ads leads performance is challenging for marketing teams
Native ads accounts measure primary campaign metrics like CTR, CPC, and number of clicks, but they don’t help you understand lead quality or attribution across the full customer journey. This creates three big challenges:
- Clicks ≠ Leads ≠ Revenue: A high click-through rate might look good, but if the landing page doesn’t drive higher conversion rates, you’re stuck with wasted traffic.
- Quantity vs Quality: You can generate a high number of leads, but if the cost per acquisition (CPA) is too high or SQL conversion rates are too low, ROI and ROAS suffer.
- Budget blind spots: Without connecting key metrics across platforms, you can’t align ad placements, campaign goals, or targeting strategy with business goals.
This is why tracking the right KPIs is important. They provide the performance metrics that tie ad campaigns back to business goals, ensuring that your marketing strategy is guided by real data rather than surface-level impressions or clicks.
With Coupler.io, you can pull data from Google Ads, Facebook Ads, and LinkedIn Ads into dedicated lead generation dashboards. This way, you’re not just looking at siloed numbers inside each ad account. You can track CPL, conversion rates, and lead quality side by side. It makes it much easier to compare campaign performance, allocate budget, and spot which channels are actually moving leads down the funnel.
Key dashboards to measure ads leads performance
Coupler.io’s prebuilt dashboards already combine the right KPIs and performance metrics for each platform and make it easy to monitor campaign performance and share results with your team:
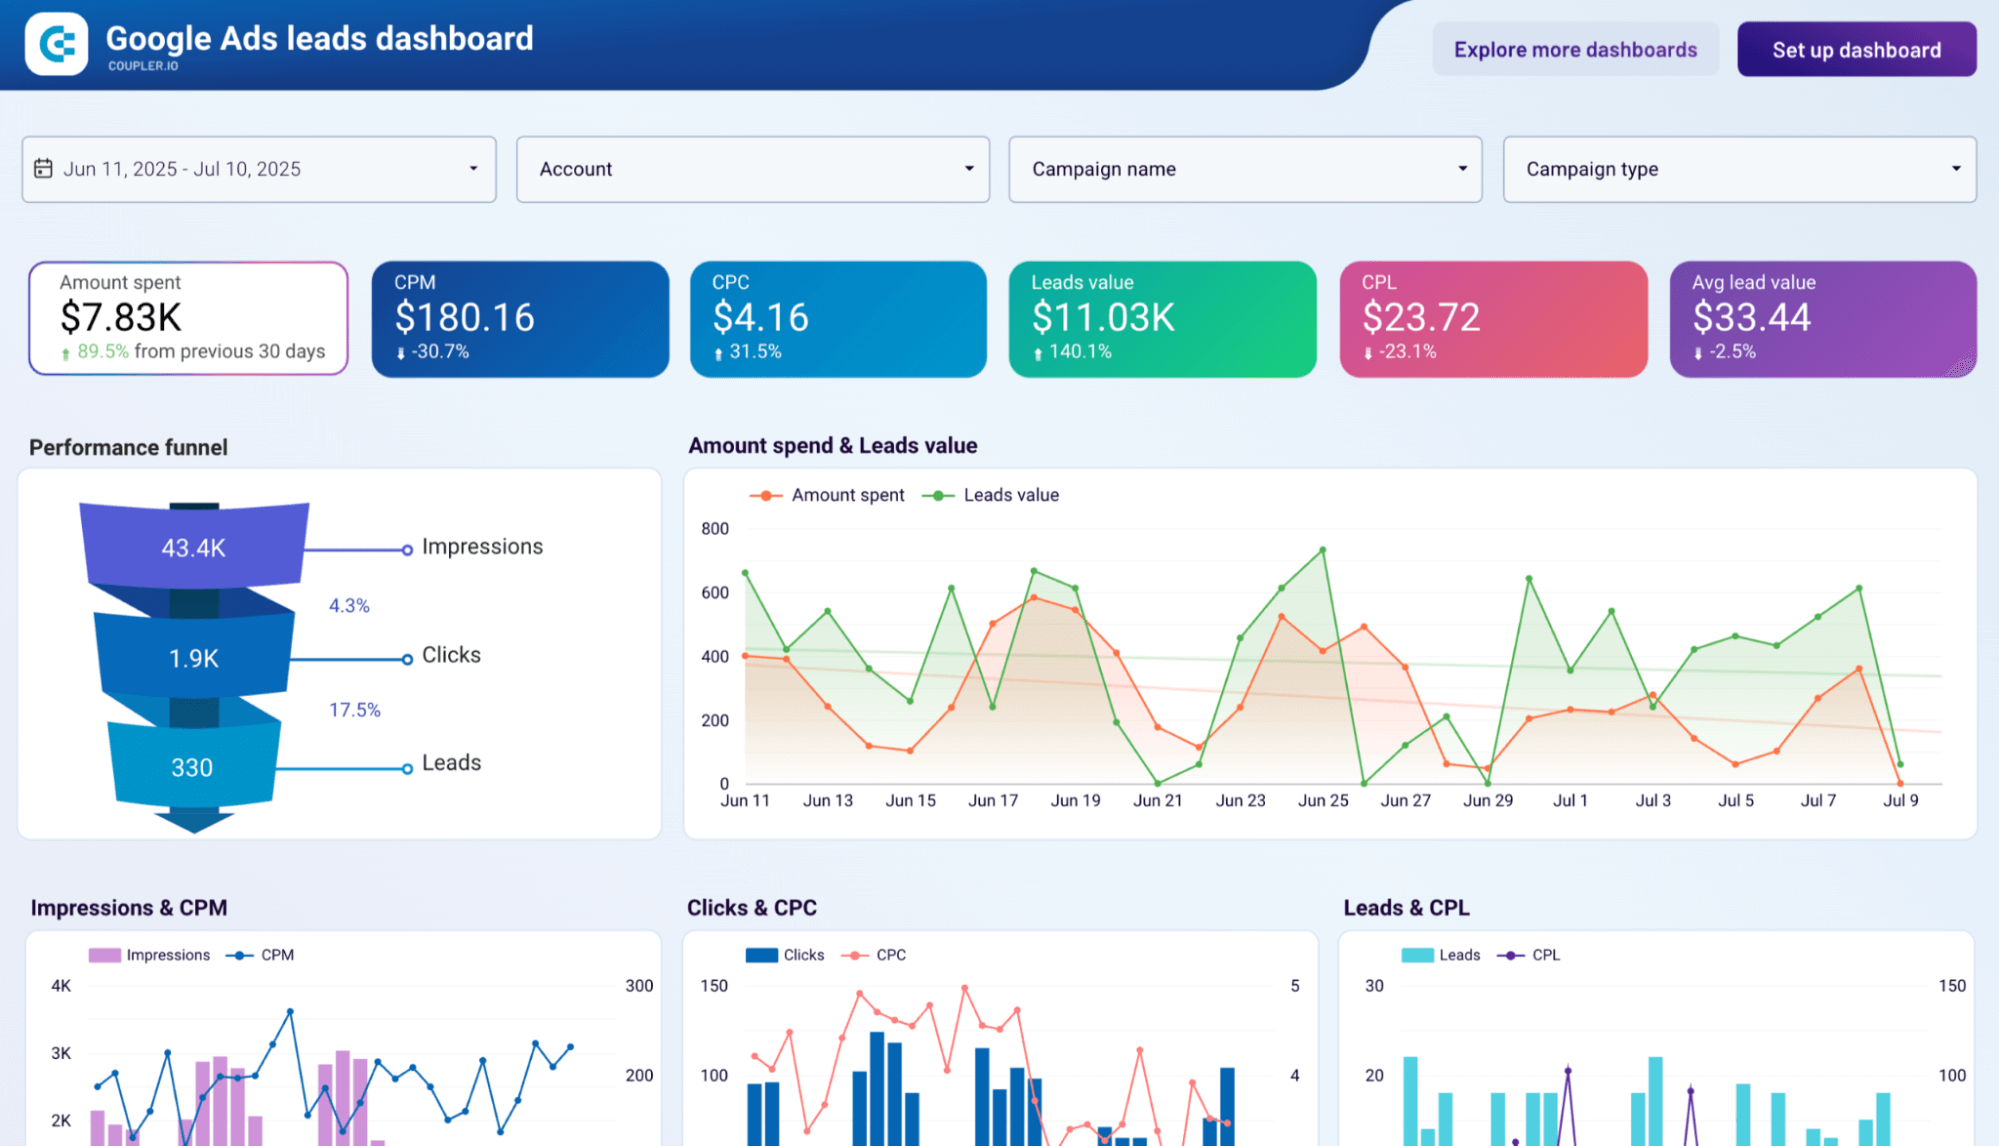
Google Ads leads dashboard
The Google Ads dashboard consolidates your Google Ads performance metrics into one view. You can monitor CPL, CTR, conversion rate, and ad groups side by side to understand which campaigns deliver higher conversion rates and where ad spend is wasted.
What insights you can get:
- Lead generation performance overview
- Funnel with conversion tracking (impressions → clicks → leads)
- Spend vs. lead value correlation
- Campaign-level performance breakdown
- Conversion action analysis (form submissions, demo requests, etc.)
How to get started:
This Google Ads leads dashboard is available as a Looker Studio template. You only need to connect your Google Ads account via the built-in Coupler.io connector, and your dashboard will be populated with up-to-date ads leads performance data.
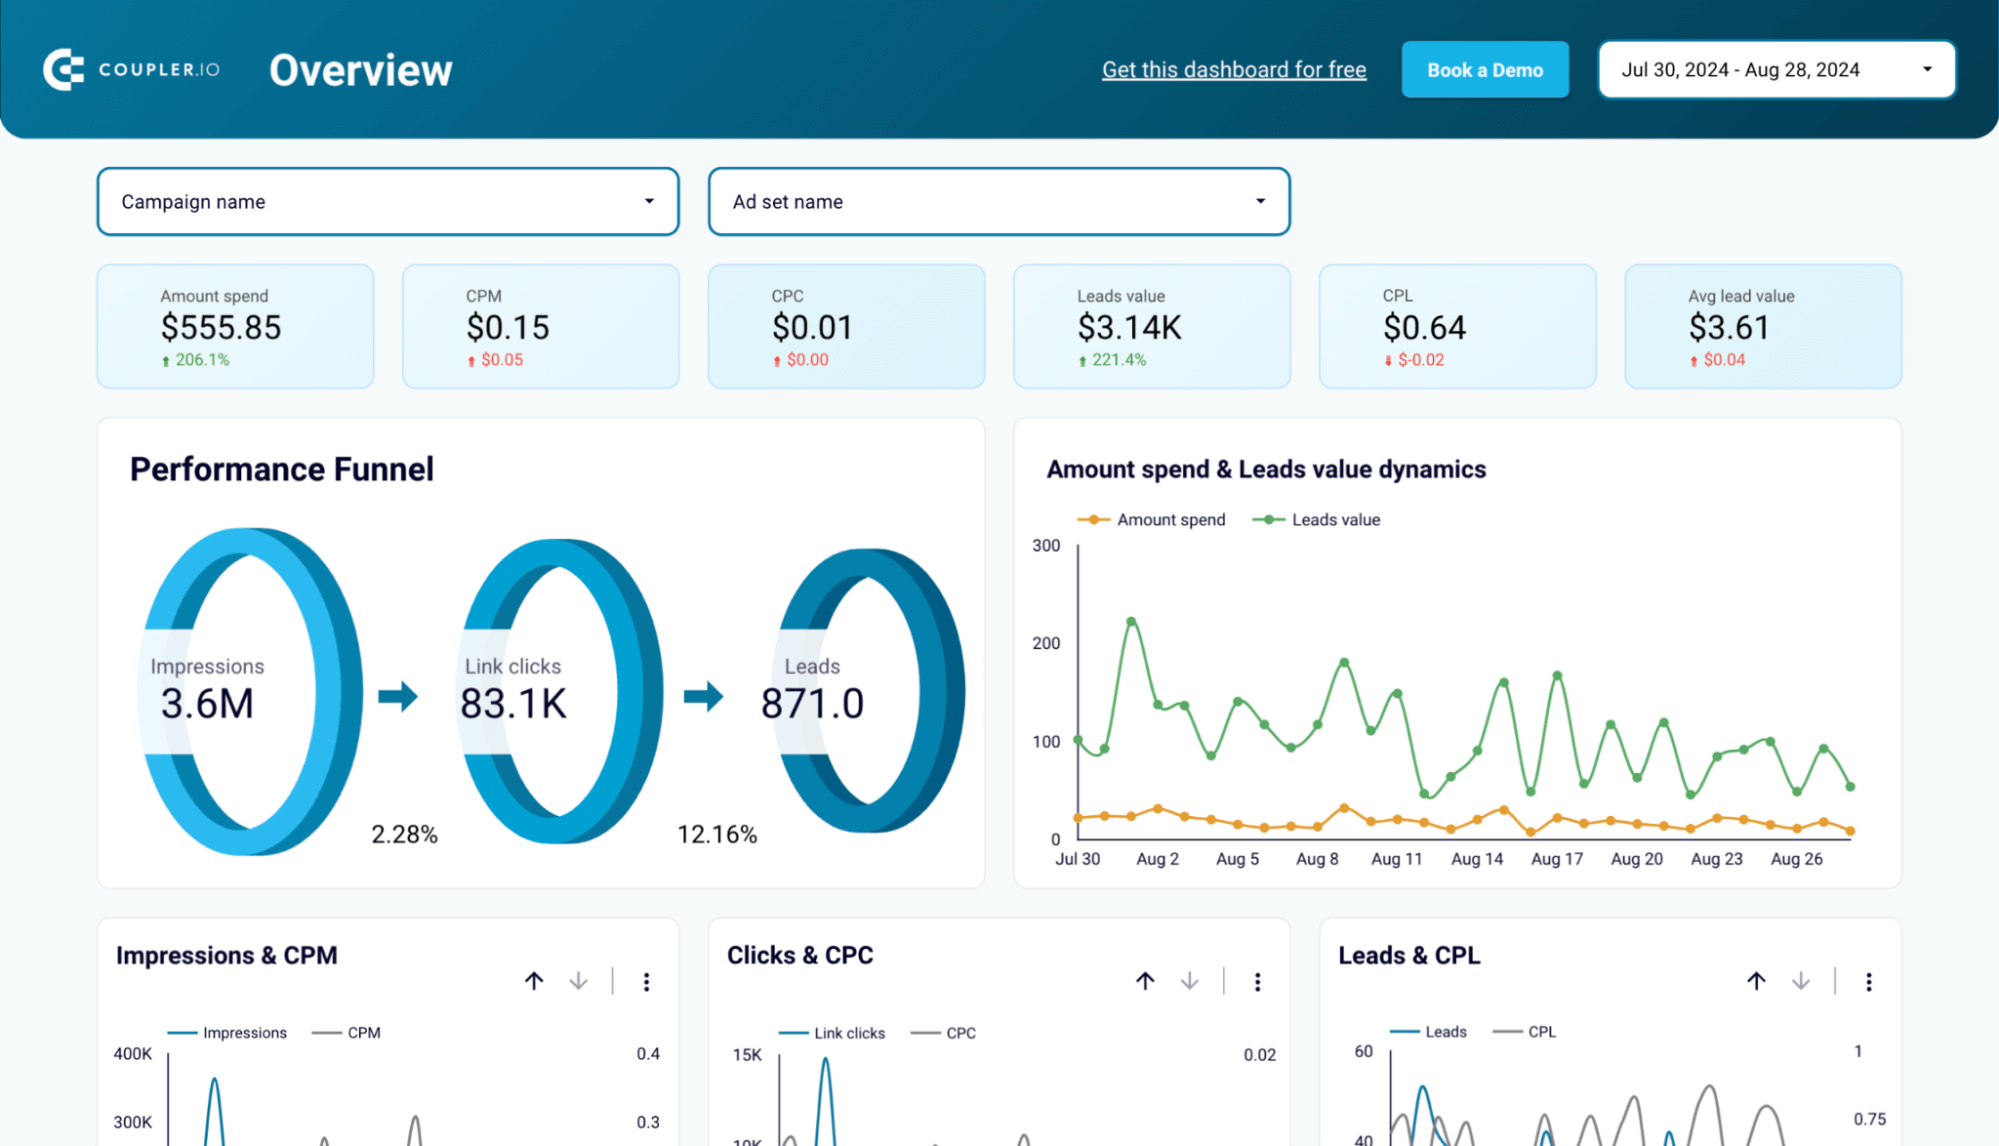
Facebook ads leads dashboard
Designed for Facebook lead ads, this dashboard helps you track demographics, CPL, campaign goals, and the number of leads over time. It’s especially useful for seeing which audience segments bring higher lead quality and lower cost per conversion.
What insights you can get:
- Performance funnel with leads value dynamics
- Campaign performance breakdown by spend, CPL, and conversions
- Monthly dynamics of key ads leads performance metrics
- Leads and lead value by demographics (age, gender)
- Country breakdown for geo-targeting insights
How to get started:
Choose the version of the Facebook ads leads dashboard you want. The template in Looker Studio is equipped with the Coupler.io connector to integrate your Facebook Ads account. The dashboard in Coupler.io has an AI-powered layer called AI insights that shows trends, key findings, and recommendations. The Facebook ad dashboard template will automatically pull in your campaign data, letting you explore lead value trends and audience breakdowns without building reports from scratch.
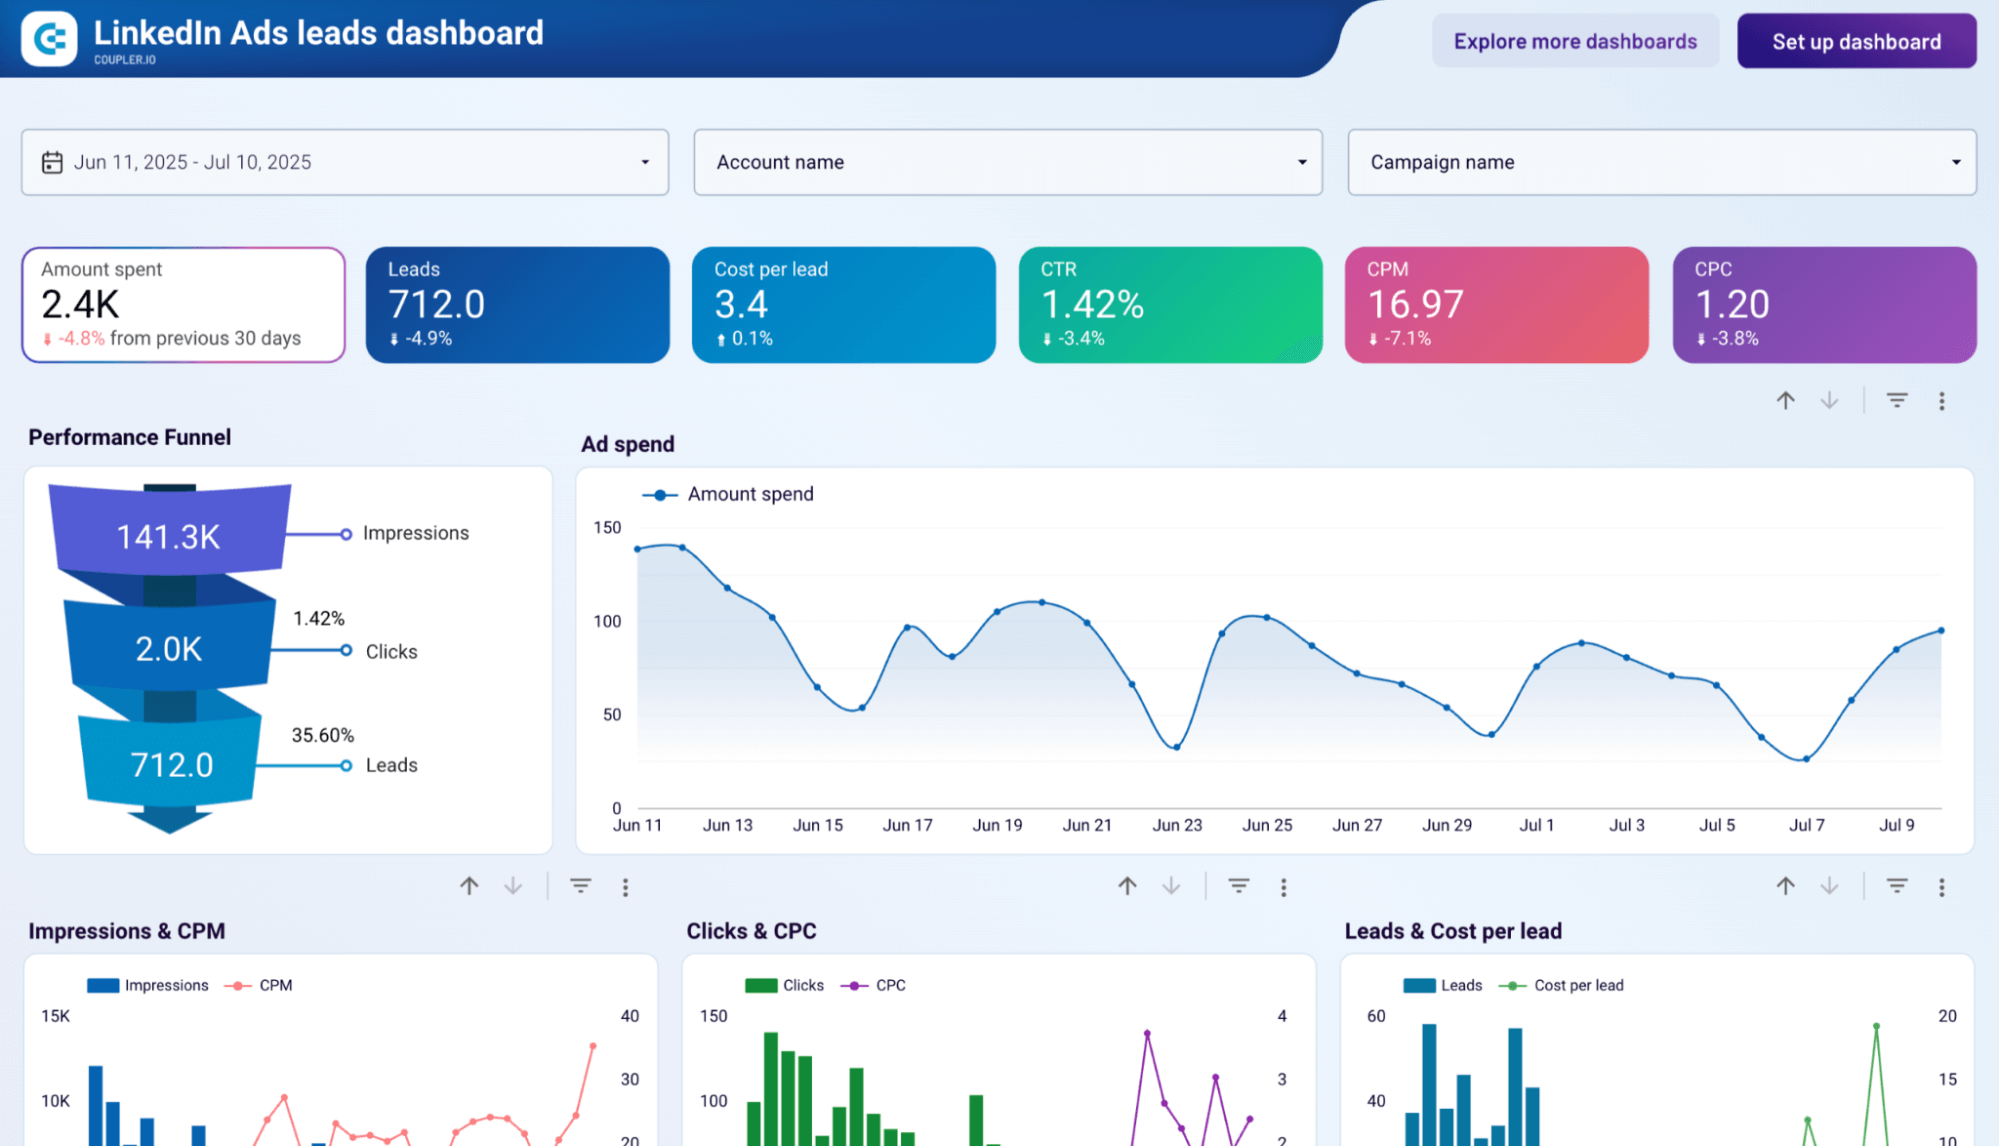
LinkedIn ads leads dashboard
For B2B marketers, the LinkedIn ads dashboard highlights SQL rate, cost per conversion, and campaign-level ROI. It helps you evaluate whether higher CPL benchmarks are justified by stronger pipeline contribution.
What insights you can get:
- Real-time tracking of lead generation metrics (spend, leads, CPL, CTR)
- Funnel visualization to spot drop-offs
- Daily spend and lead trends
- Campaign-level performance comparison
- Multi-metric trend analysis (impressions, CPC, CPM, leads)
How to get started:
The LinkedIn Ads leads dashboard is available as a ready-made template in Looker Studio. Connect your LinkedIn Ads account using Coupler.io’s connector, and the dashboard will display your campaign KPIs automatically, giving you a clear picture of which ads are delivering SQLs and ROI.
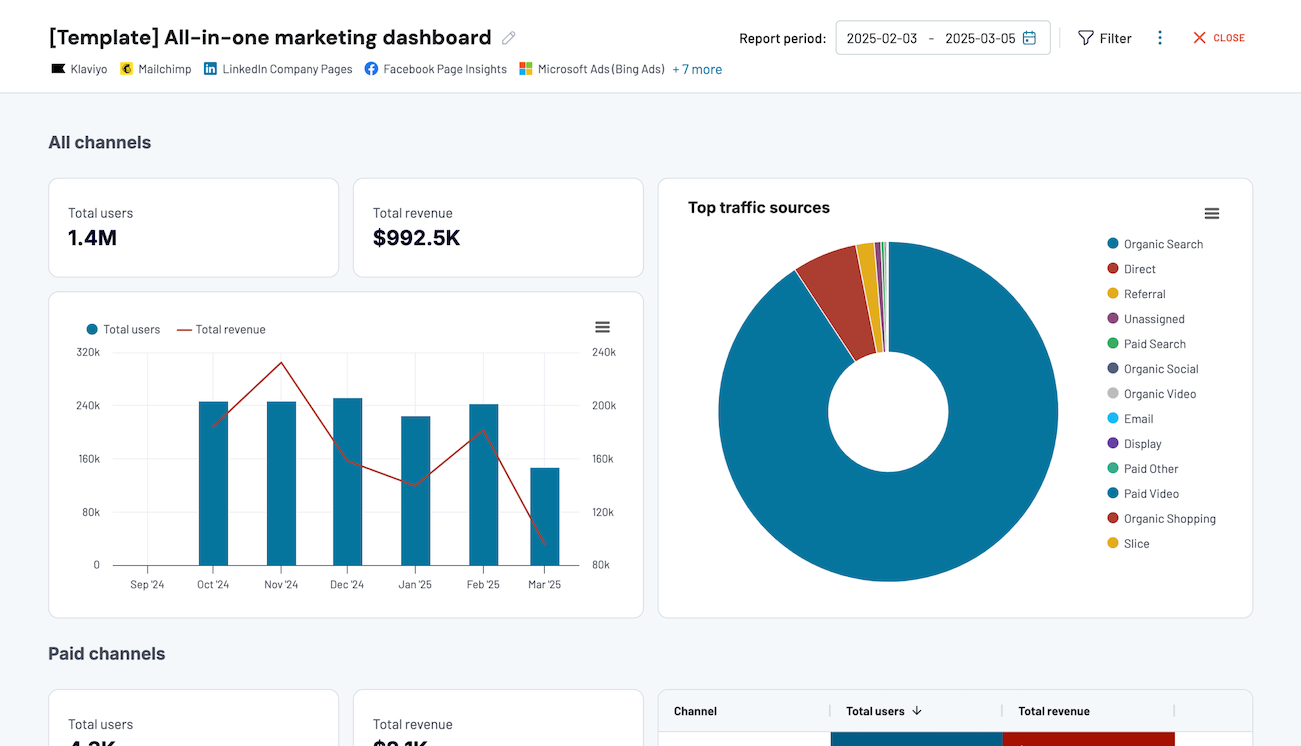
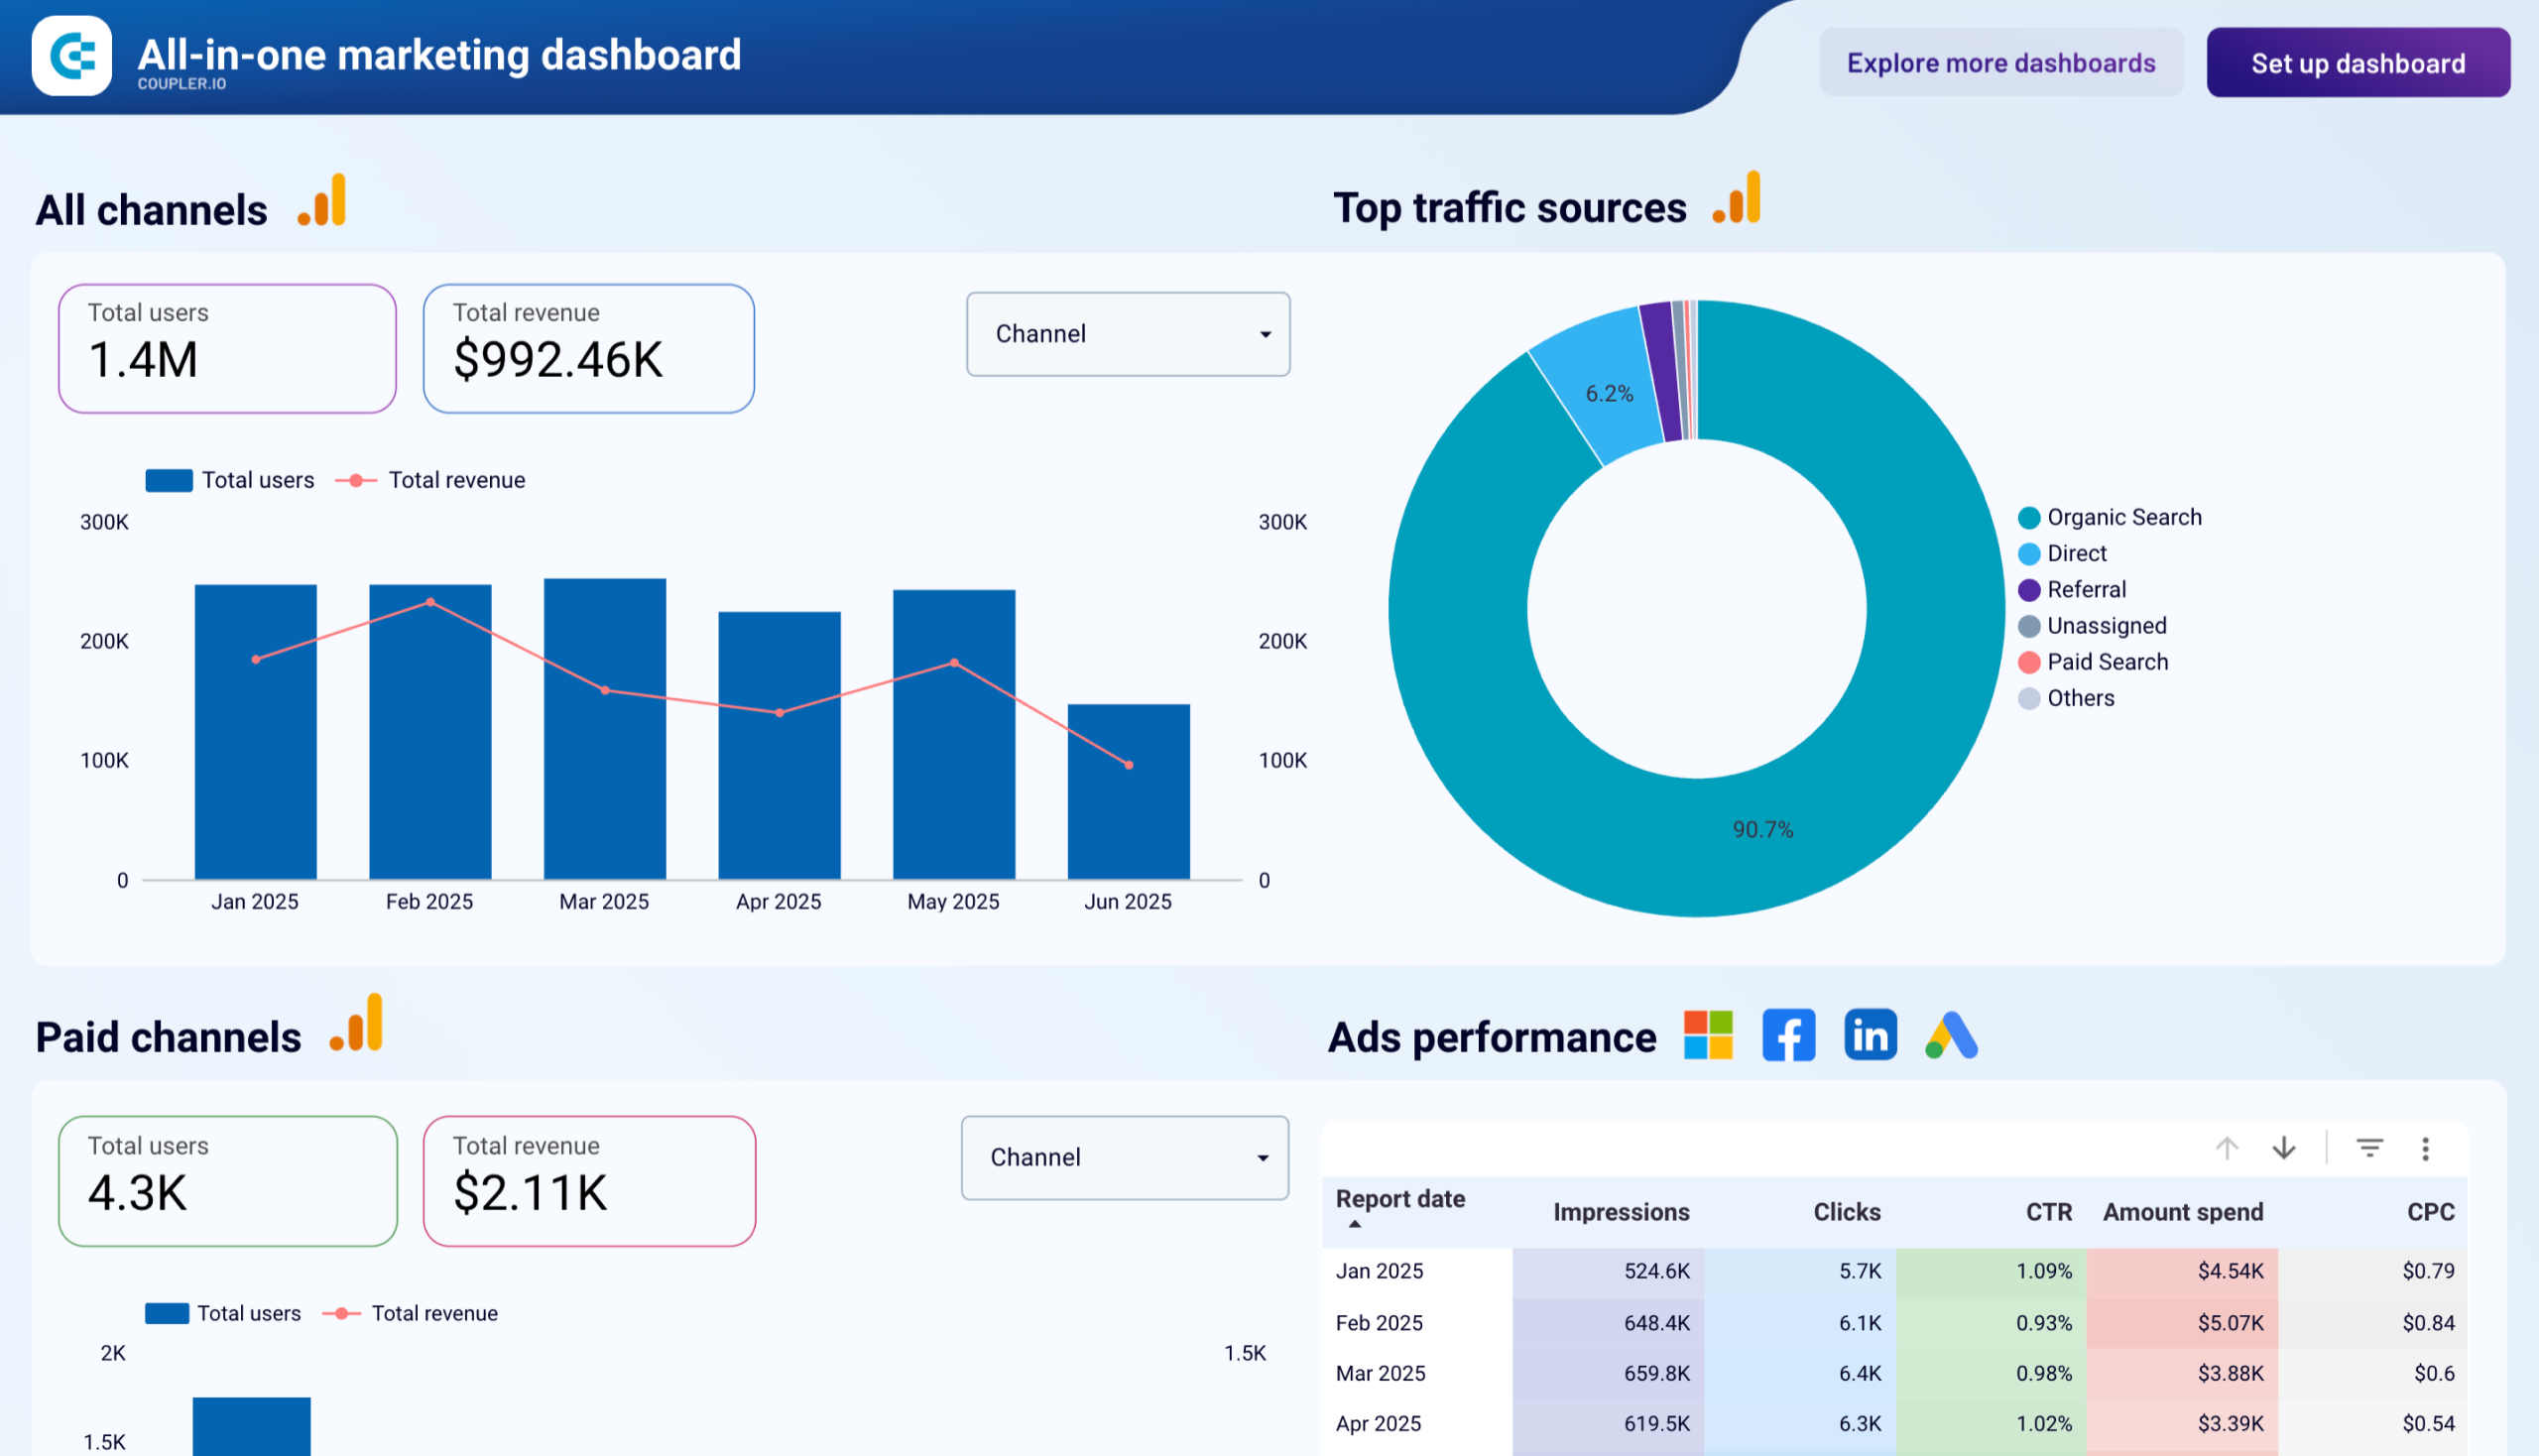
All-in-one marketing dashboard
Individual dashboards for each channel give you more clarity than the native reporting inside each ad account. But to truly see the whole picture and allocate budget with confidence, you need an all-in-one view.
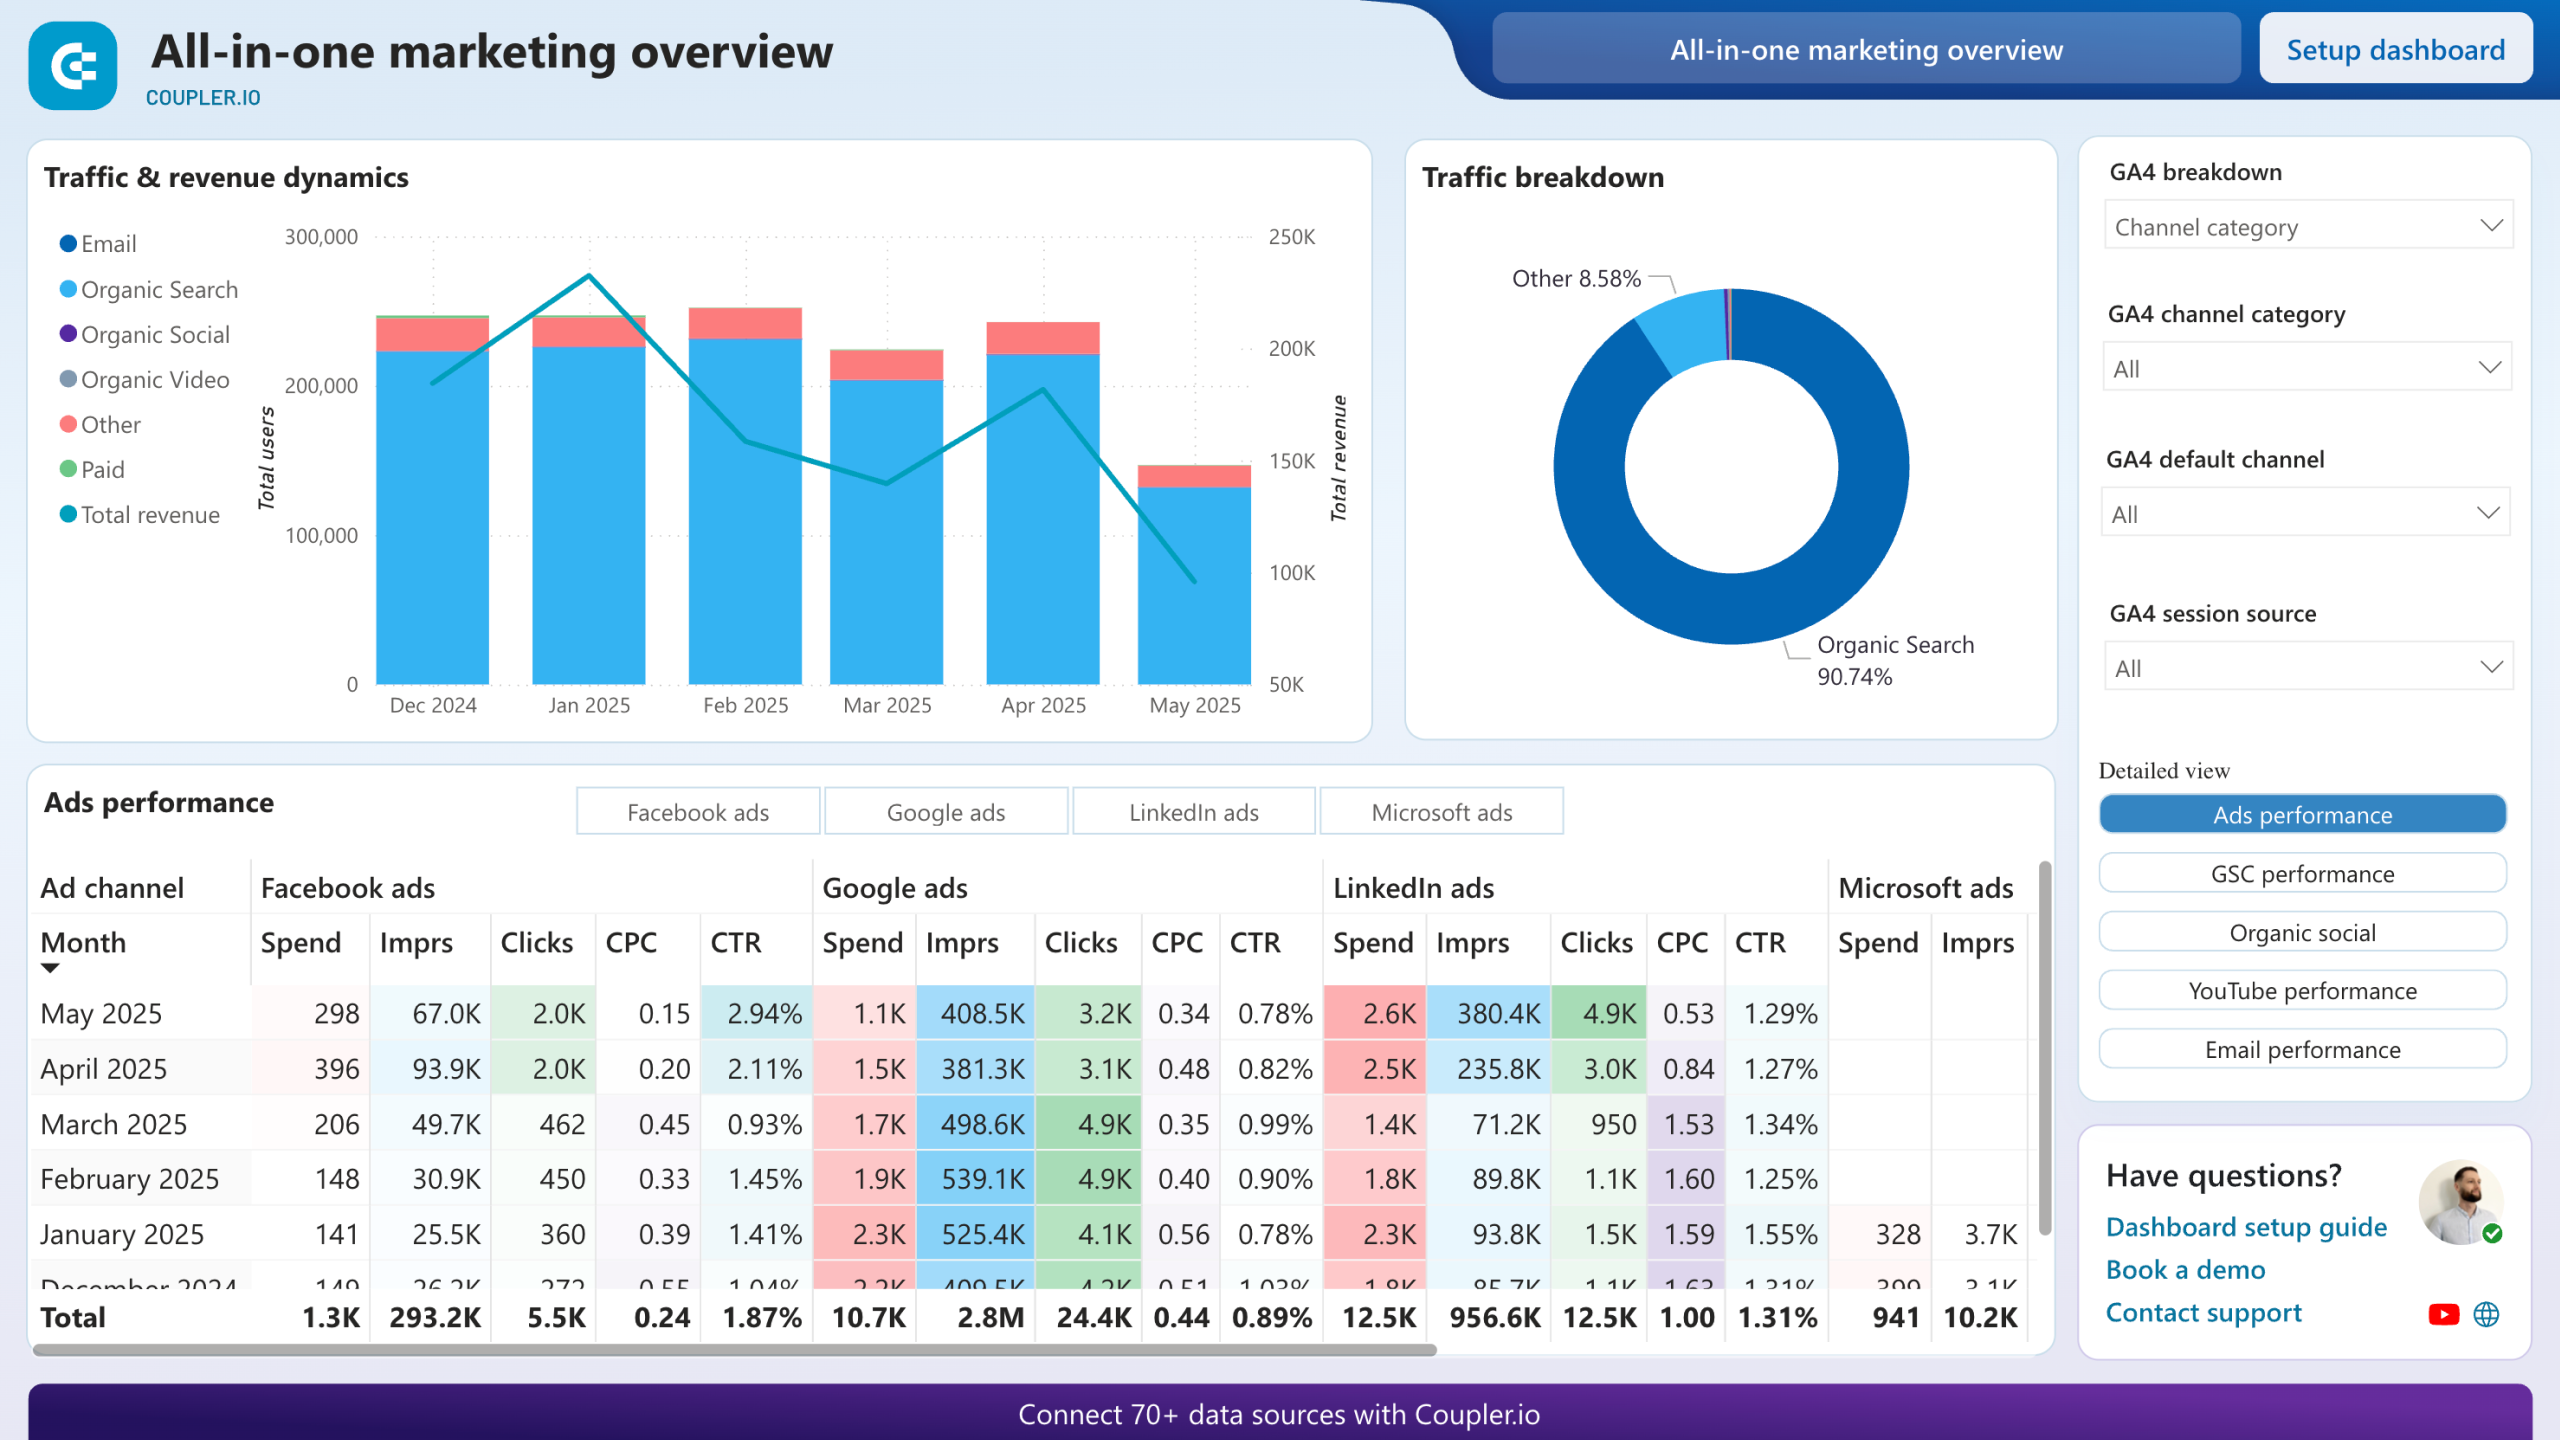
This All-in-one marketing dashboard from Coupler.io pulls data from multiple marketing channels like Google Ads, social media, email, SEO, in one place so you can understand how everything works together, not just in silos.
What insights you can get:
- Full performance overview across all channels in a single interface
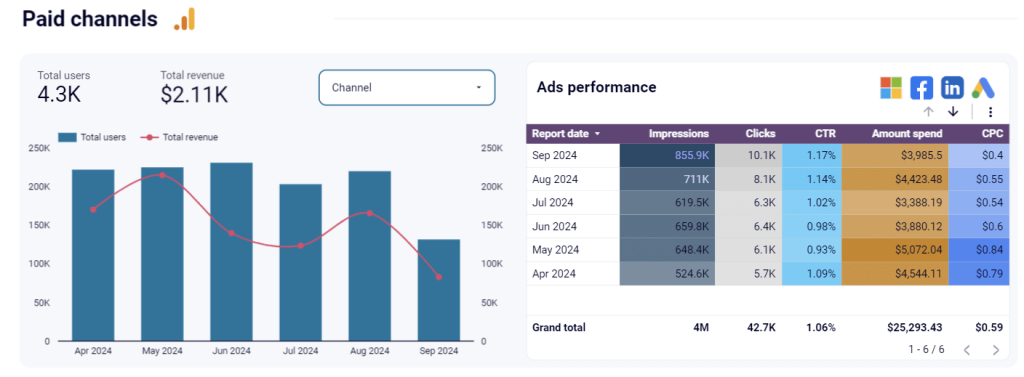
- Paid channel analysis (impressions, clicks, CPC, CTR)
- Organic search performance (impressions, clicks, average position)
- Social media and YouTube performance breakdowns
- Email campaign effectiveness (open rate, clicks, bounces)
How to get started:
The All-in-one marketing dashboard is designed as a template for Looker Studio and Power BI. The Coupler.io version of the dashboard also has the AI-powered module to display trends, key findings, and recommendations on your data. Connect the ad accounts and marketing tools you already use with the built-in Coupler.io connector. The template will update automatically with fresh data, giving you end-to-end visibility of your ad campaign’s performance.
The future: Conversational ad analytics using AI
Dashboards give you visibility into campaign metrics, but conversational analytics takes it further. Instead of analyzing reports, you simply ask questions in plain English and get answers directly from your marketing data. AI integrations make this possible by acting as the bridge between AI models and your data in ads accounts, CRM, or analytics tools.
Here’s what conversational analytics can unlock:
- Natural language queries: Ask questions like, “Which ad campaigns drove the highest number of conversions last month?” without touching a spreadsheet.
- Real-time insights: Because MCP servers connect to live data sources, you’re not working with outdated exports.
- Cross-platform visibility: Query across Google Ads, Facebook Ads, LinkedIn, and even your CRM in a single conversation.
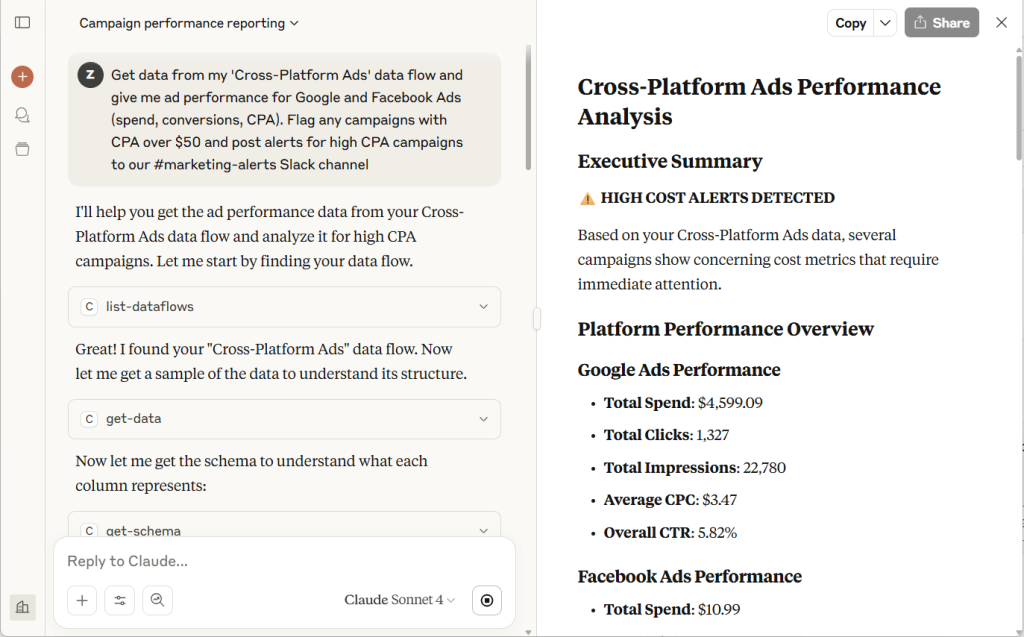
Coupler.io’s AI integrations are one example of this in action. Once configured, you can connect data flows to Claude or ChatGPT and start querying the data to measure ads leads performance:
- “Get data from my ‘Cross-Platform Ads’ data flow and give me ad performance for Google and Facebook Ads (spend, conversions, CPA). Flag any campaigns with CPA over $50 and post alerts for high CPA campaigns to our #marketing-alerts Slack channel.”
- “How does revenue for paid acquisition compare to organic revenue?”
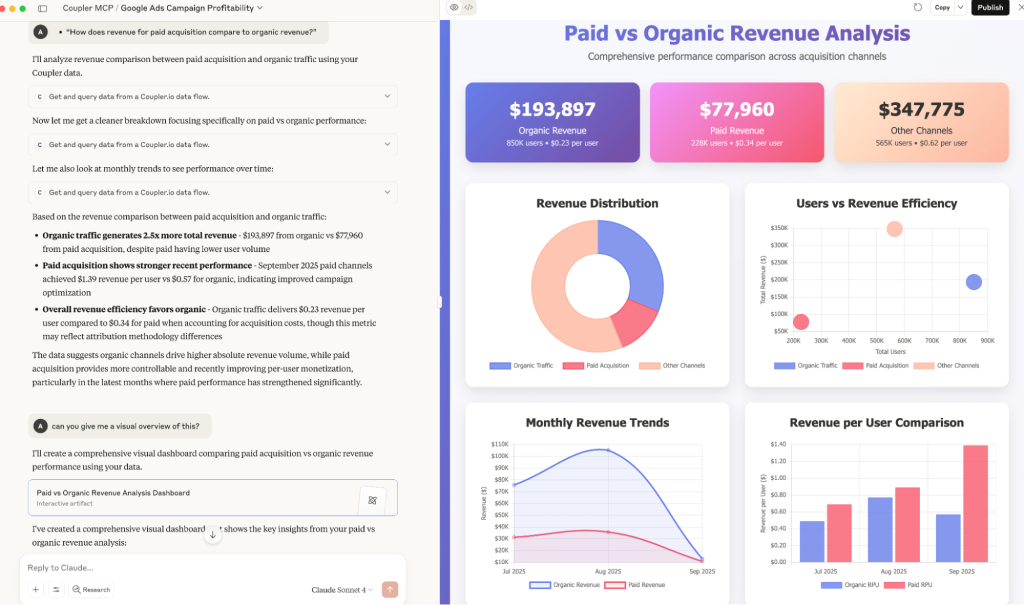
This workflow connects digital marketing KPIs directly to business goals and desired actions. You don’t just see dashboards, you can interact with them conversationally, uncovering insights on the fly.
Integrate your marketing and business data with AI using Coupler.io
Get started for freeBenchmarking your ads leads performance data
Benchmarks give you a useful reference point for campaign ads leads performance, especially when you’re trying to figure out if your CPL or CPA is in line with the market. These numbers vary by industry, targeting, and ad placements, but they serve as guardrails when setting campaign goals. For example:
- WordStream’s latest report shows the average CPL in Google Ads rose to about $70.11 in 2025, up from $66.69 in 2024, a roughly 5% year-over-year increase.
- Focus Digital analyzed over 130 Meta Ads campaigns in North America (March–June 2025) and found CPL by industry for E-commerce at ~$27.25, B2B SaaS at ~$63.40, and Legal at ~$72.40.
- Dreamdata’s report show LinkedIn Ads deliver the best ROAS among major platforms (113%), surpassing Google Search (78%) and Meta (29%).
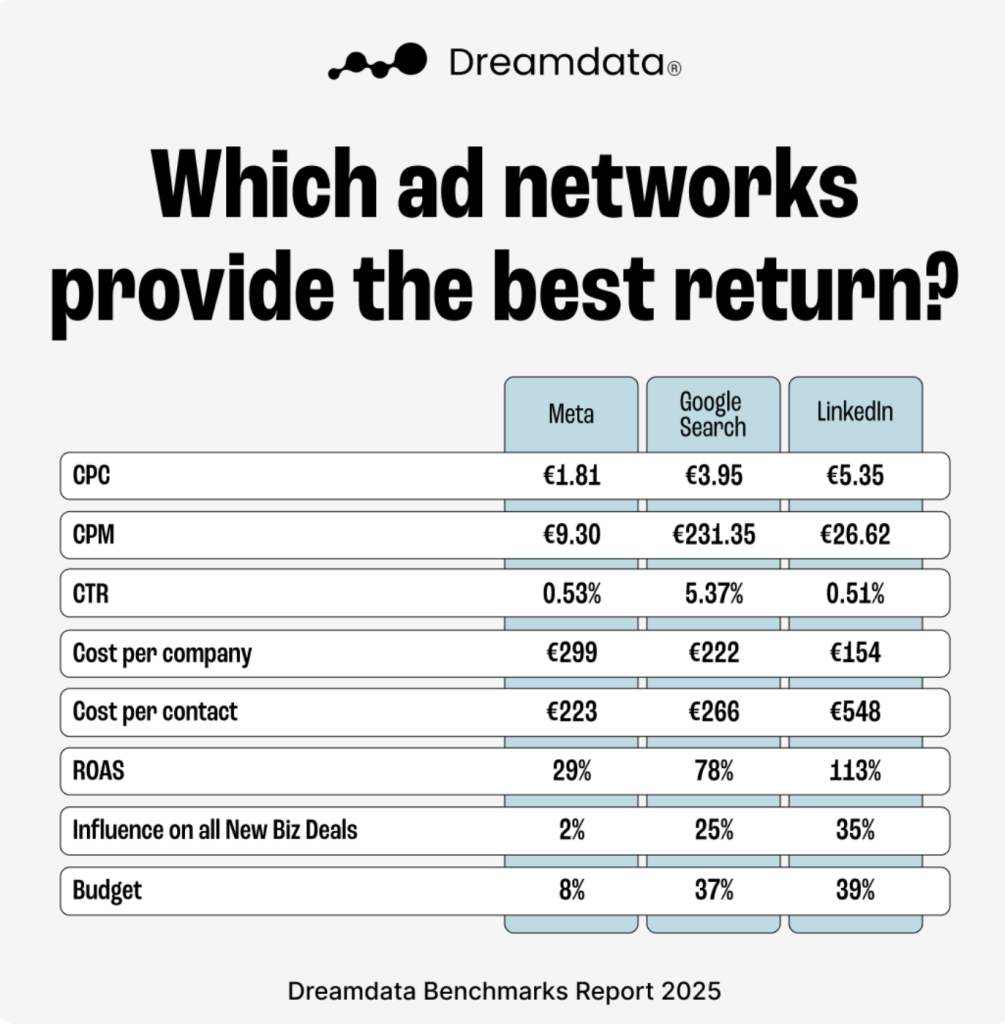
These numbers vary by industry, targeting, and ad placements, but they serve as guardrails when setting campaign goals. The key is not to treat them as hard targets.
Benchmarks are a starting point, but your own performance data is what really matters.
Pull at least 90 days of your ads leads performance into dashboards, calculate your true CPL, CPA, and ROI, and then use that as your baseline. From there, you can track how changes in targeting, ad copy, or budget allocation impact results over time.
Think of industry benchmarks as the compass and your own historical data as the map. Use both together to guide optimization: benchmarks show you what’s typical, while your data tells you what’s achievable for your specific audience, product, and business goals.
From ad metrics to action: Optimization and troubleshooting
Once you’ve pulled your CPL, CPA, ROAS, and conversion rates into dashboards, the next step is making decisions that protect the budget and improve results. Here are some guidelines and troubleshooting playbooks you can follow:
General rules for optimizing ad performance metrics
- Pause high-CPL ad campaigns that drain budget without conversions.
- Scale campaigns with strong ROAS and lead value to double down where you see profitable growth.
- A/B test ad copy, landing pages, and ad placements when CTR or conversion rates dip. Even small tweaks, such as CTA copy, can lead to higher conversion rates.
- Validate with CRM data to track SQLs and pipeline contribution as the true benchmarks, not just the number of leads.
- Review attribution paths using funnel tracking to see how campaigns work together.
Troubleshooting ad lead performance playbooks
Ad campaign optimization is continuous. By regularly reviewing campaign metrics in your dashboards and connecting them back to business goals, you’ll know when to troubleshoot, when to double down, and when to pivot. Here are some quick playbooks:
- CPL rising, CTR steady: Likely a landing page or form issue → test shorter forms or reduce friction.
- CTR falling: Triggered by creative fatigue or audience saturation → refresh ad copy or expand your target audience.
- Leads up, revenue flat: Indicates poor lead quality → tighten targeting, adjust exclusions, or refine your campaign goals.
- Great CPL on Facebook, poor SQLs: Points to ICP targeting mismatch → introduce qualification steps or refine demographics to improve lead quality.
FAQs
What’s the difference between CPL and CPA?
CPL (cost per lead) tells you how much you pay to capture a lead, regardless of whether that lead ever converts. CPA (cost per acquisition) goes a step further. It shows the cost of acquiring a paying customer. CPL helps you monitor efficiency at the top of the funnel, while CPA reflects true business impact.
Which ad platform gives the best leads?
It depends on your campaign goals and target audience. Google Ads often delivers high-intent, bottom-funnel leads, but at a higher CPC. Facebook Ads can generate volume at lower CPLs, making it strong for brand awareness and top/mid-funnel nurturing. LinkedIn Ads cost more per lead, but for B2B SaaS and enterprise campaigns, they often deliver the most valuable SQLs and pipeline contribution.
How often should I review my ad leads performance?
For most teams, a weekly review is enough to spot trends and adjust. But if you’re running high-spend PPC campaigns or testing new ad copy, checking daily ensures you can catch wasted ad spend before it snowballs.
How do you know if your ad is performing well?
Look at more than just impressions or clicks. A strong campaign balances efficiency (low CPL, healthy CTR), quality (SQLs and opportunities in your CRM), and profitability (positive ROI or ROAS). If you see leads moving smoothly through the funnel, from clicks to conversions to revenue, then your ad campaigns are doing their job.
Can I combine multiple ad platforms into one dashboard?
Yes. With Coupler.io, you can pull in data from Google Ads, Facebook Ads, LinkedIn Ads, and more into a single dashboard. This lets you compare CPL, CTR, and ROI side by side and understand attribution across the full customer journey instead of just one platform.
Measuring ads leads performance is about aligning campaign metrics with business goals, not chasing vanity clicks. With the right KPIs, attribution models, and real-time dashboards, you can optimize marketing efforts, increase conversion rates, and maximize ROI.
Coupler.io makes it easy to connect your ad accounts, CRM, and analytics tools, then track everything in real time. Start with a free account and see how quickly you can move from reporting to actionable insights.


