What is a financial performance analysis?
A financial performance analysis is a process of evaluating your company’s financial health. This process is usually repeated and associated with looking at financial statements, current ratios, and other essential metrics. The goal of the financial analysis is to provide valuable insights into your company’s strengths and weaknesses. Also, this should help you focus on making informed business decisions.
There are five main types of financial performance analysis:
- Horizontal analysis: Overview of changes in financial statement items over multiple periods to detect trends and growth patterns.
- Vertical analysis: Assessment of financial statements by expressing each item as a percentage of a base figure (like total revenue) to understand relative proportions.
- Ratio analysis: Evaluation of relationships between different financial statement items to analyse company performance and financial health.
- Cash flow analysis: Examination of operating, investing, and financing cash flows to determine how well your company manages its cash.
- Variance analysis: Comparison of actual financial results with budgeted or planned figures to identify and explain discrepancies.
The importance of financial performance analysis of a company
If you look at your company’s financial performance analysis, you’ll see that it has multiple benefits for stakeholders, including investors, shareholders, and possible lenders.
It’s crucial to monitor financial performance regularly to:
- Assess profitability: Understand how well you manage your assets and liabilities to generate revenue and meet objectives.
- Evaluate financial health: Monitor your financial position over a specific period of time so you can be proactive in making business decisions. By assessing overall financial health, stakeholders can have the necessary basis for adjusting the company’s strategy, implementing effective risk management, and more.
- Track and analyze business performance: Identify operational efficiency by measuring ROI and looking at your profitability ratios as well as your liabilities.
- Facilitate planning and budgeting: Get a complete overview of your financial metrics at any given time so you can make both short-term and long-term decisions.
Tip: If you want to truly leverage your data, don’t only use annual reports once a year. Set up profitability reporting dashboards that are automatically updated so you can stay proactive and maintain financial health at different points in time
Let’s look at a real-world example of how financial performance analysis impacts business. One of the SaaS Gurus agency’s clients – reported as the Company – faced a problem of losing cash at an alarming rate with no clear explanation.
To tackle that SaaS accounting challenge, the agency conducted an in-depth financial performance analysis and built a cash forecasting model, resulting in actionable KPIs. This enabled informed decisions on cost-cutting and resource allocation, which significantly improved financial stability, cash runway, and revenue growth (2x) in a year.
How to evaluate the financial performance of a company
With a data-driven approach and efficient data management in place, you’ll be all set to conduct an insightful financial performance analysis of your business. Here’s how to achieve this in five steps.
1. Decide the type of analysis you want to focus on
The first thing you need to do is to decide on the type of analysis you want to perform. This is important as it will determine the necessary indicators and tell you what financial performance data you require. You might want to focus on your balance sheet data for a liquidity analysis or look at your estimated budget vs. the budget spent over a period of time for a variance analysis.
This data might be in your QuickBooks, Xero, or Stripe account or even across multiple spreadsheets. With Coupler.io, you can perform financial consolidation by seamlessly integrating records from these various sources into a single analytical environment. No more manual data gathering.
We will explore the main types of analysis and metrics in the following sections. For now, remember that the analysis type will define the data you need.
2. Perform comparative analysis
Comparative analysis is the process of evaluating your current financial performance by looking at key metrics in relation to benchmarks, peers, industry standards, and historical data. This provides context for understanding how well your company is doing compared to others and helps to identify areas of strength and opportunities for improvement.
Let’s break this down into its components: industry benchmarking and historical performance analysis.
Industry benchmarking
Benchmarking is comparing your company’s financial performance against industry averages or standards. This helps you assess whether you’re doing well within your sector or lagging behind competitors, identify possible gaps, and ensure your company meets the industry’s expectations. There are two essential elements in the benchmarking process:
- Peer comparison – placing your financial performance against that of similar companies within the same industry or market. It is crucial to know how you stack up against your closest competitors so you can pinpoint strategic adjustments to outperform them.
- Market position – your company’s standing within the sector based on market share, profitability, and customer base. You must analyze your market position to determine how your company compares to more prominent or minor players in the industry. This lets you know your relative strength and set realistic targets for growth and improvement.
Historical performance analysis
Historical performance analysis is investigating past financial data to assess your company’s progress and identify trends. It’s essential for understanding long-term growth trajectories and evaluating your ability to meet financial goals over time. Here are two building blocks of this process:
- Trend analysis – studying past performance to spot patterns or trends in key financial metrics, such as revenue, expenses, and profitability. By doing so, you can learn your company’s direction, predict future performance, forecast challenges or opportunities, and plan accordingly.
- Growth patterns – the rate at which your company has expanded its revenue, assets, or market share over time that shows whether it is scaling and sustaining its growth. This way, you see potential growth drivers and optimize your strategies for continued success.
3. Track market performance indicators
Market performance indicators are critical factors that help investors and analysts evaluate your company’s standing in the financial markets. They not only reflect the current market sentiment but also provide insights into your future growth potential and overall financial health. These indicators typically fall into stock market metrics and investor returns.
Stock market metrics
Stock market metrics demonstrate your company’s position in the financial markets and its stock’s liquidity, value, and demand:
- Share price trends – the movement of stock price over time. You should analyze these trends to understand market sentiment, identify volatility, and predict future price dynamics. For instance, a steadily rising share price may indicate growing investor confidence, while frequent fluctuations could suggest market uncertainty or potential risk.
- Market capitalization – the total market value of your outstanding shares calculated by multiplying the share price by the number of outstanding shares. This gives a snapshot of the company’s size and stability and allows for easy comparisons across peers in the sector. A higher market cap typically signals that your company is more established and less volatile.
- Trading volumes – the number of shares or contracts exchanged during a given period. High trading volumes often reflect strong investor interest and liquidity, indicating that a stock is actively traded. You must track this metric alongside price movements to confirm the strength of market trends and identify potential breakout or reversal patterns.
Investor returns
These indicators show how investors benefit from holding your company’s stock and guide investment decisions:
- Price-to-earnings (P/E) ratio – a valuation metric based on your company’s market price divided by earnings per share, showing whether a stock is over- or undervalued relative to its earnings. If high, this ratio might suggest that investors expect notable growth rates in the future, but if low, it could indicate an undervalued opportunity.
- Dividend policy – the company’s approach to distributing a portion of its profits to shareholders through dividends. It’s a key indicator of your financial health and commitment to returning value to investors. A consistent dividend policy can attract income-focused investors, as regular dividends provide a steady income stream.
- Total shareholder return (TSR) – a measure of the returns investors earn from holding your company’s stock. It combines capital gains (from share price appreciation) with any dividends received over a period. The metric is calculated as the percentage change in the stock price plus dividends paid (adjusted for any corporate actions).
4. Prepare financial statements
A financial performance statement is a summary-level report that shows your business performance. Businesses typically use four primary types of financial statements: the balance sheet, the income statement, the cash flow statement, and the annual report. In some cases, instead of the annual report, you can go with the statement of retained earnings.
Some financial statements are available in your accounting software, such as QuickBooks. Others need to be created separately using the data from external sources. Let’s check out each of these financial statements.
Balance sheet
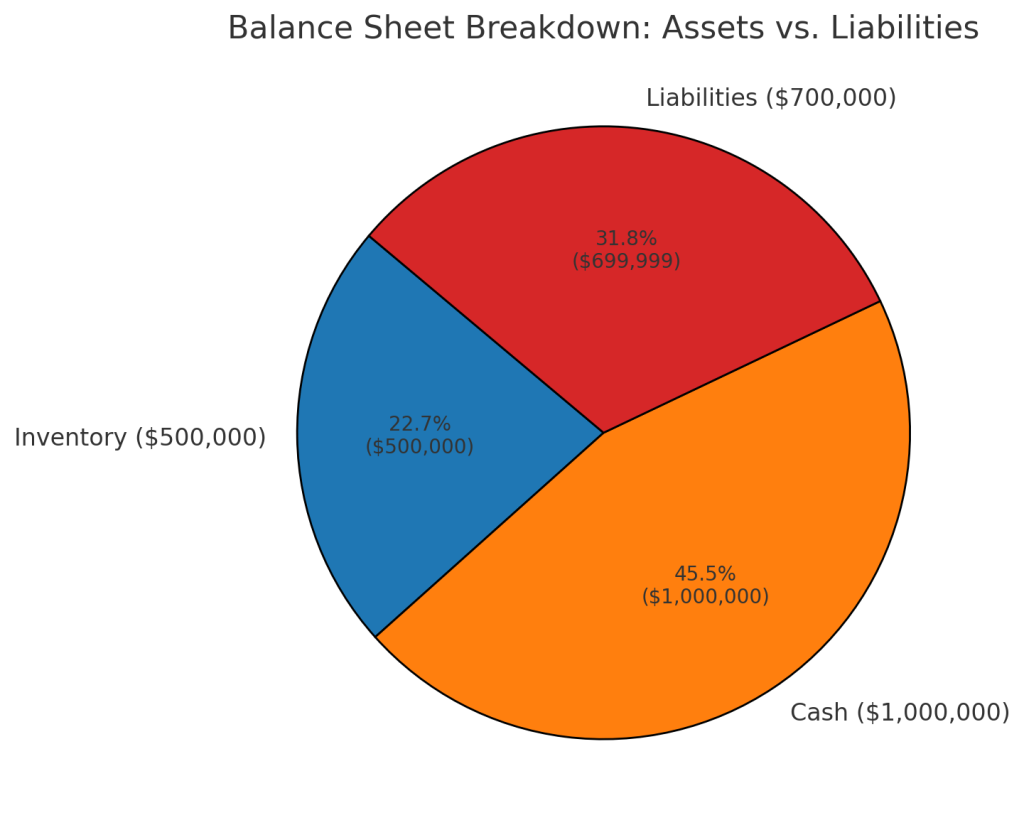
A balance sheet is a report that provides a snapshot of the financial position at a specific point in time, showing assets, liabilities, and equity. It measures liquidity ratios and financial stability by answering what the company owns versus owes. Check out what a balance sheet dashboard may look like and what values it can provide to you.
This kind of report covers the following metrics:
- Assets – what the company owns, such as cash, inventory, equipment, and accounts receivable.
- Liabilities – what the company owes, including loans, accounts payable, and taxes payable.
- Shareholders’ equity – the business’s net worth (assets minus liabilities).
For instance, your company owns $500,000 in inventory and has $1,000,000 in cash but owes $700,000 in loans. The net equity would be $800,000.
Income statement
An income statement (or profit and loss statement) is a report of your company’s revenues, expenses, and net income. Income statements are usually generated for a specific period, like a quarter, half a year, etc. They measure profitability by answering whether your company is making money.
Key components include:
- Revenue (sales) – total income from business operations.
- Cost of goods sold (COGS) – direct costs of production.
- Gross profit – revenue minus the cost of goods sold.
- Operating expenses – costs related to running the business, such as salaries and rent.
- Net income (profit) – the remaining amount after deducting all costs and taxes.
For example, your company generates $1,000,000 in revenue, spends $100,000 on COGS, and incurs $650,000 in operating expenses, $20,000 in interest expense, and $30,000 in taxes, leaving $200,000 in net income.
| Income statement | Amount ($) |
|---|---|
| Revenue | 1,000,000 |
| Cost of revenue (COGS) | (100,000) |
| Gross profit | 900,000 |
| Operating expenses | (650,000) |
| Salaries and wages | (300,000) |
| Rent and utilities | (30,000) |
| Marketing and sales | (180,000) |
| Research and development | (80,000) |
| Customer support | (40,000) |
| Other operating costs | (20,000) |
| Operating income | 250,000 |
| Interest expense | (20,000) |
| Taxes | (30,000) |
| Net income | 200,000 |
Check out free income statement reporting dashboards.
Cash flow statement
A cash flow statement is a financial report used to track actual cash movements in and out of the business. It allows you to measure liquidity and ensure your company has enough cash to cover its expenses.
Here’s what it is about:
- Operating activities – cash from sales and expenses.
- Investing activities – buying and selling assets.
- Financing activities – loans, dividends, and fundraising.
Let’s say your company earns $500,000 in profit but spends $600,000 on equipment purchases, resulting in negative cash flow despite profitability.
| Cash flow statement | Amount ($) |
|---|---|
| Operating activities | |
| Net income (profit) | 500,000 |
| Depreciation and amortization | 25,000 |
| Changes in working capital | (30,000) |
| Cash from operating activities | 495,000 |
| Investing activities | |
| Equipment purchases | (600,000) |
| Sale of investments or assets | 0 |
| Cash used in investing activities | (600,000) |
| Financing activities | |
| Loan proceeds | 100,000 |
| Repayment of debt | (50,000) |
| Dividends paid | (20,000) |
| Cash from financing activities | 30,000 |
| Net increase in cash | (75,000) |
| Opening cash balance | 200,000 |
| Closing cash balance | 125,000 |
Check out examples of a cash flow dashboard by Coupler.io
Annual report
An annual report is an overview of your company’s financial performance over the year. This helps stakeholders – such as investors, creditors, and analysts – make informed decisions respectively about investment opportunities, credit extension, and long-term strategic planning.
What’s inside of an annual report:
- Financial statements – a collection of reports such as the income statement, balance sheet, and cash flow statement.
- Management discussion and analysis – insights into performance, strategy, and future outlook.
- Risk factors – an overview of potential risks and uncertainties facing the business.
- Corporate governance – details on leadership, board structure, and governance practices.
Auditor’s report – an independent evaluation that verifies the accuracy of the financial statements.
5. Make analysis an ongoing process
Before you start exporting data and trying to figure out how to blend it and visualize it for your analysis, you should consider looking at an ongoing approach rather than relying solely on yearly or quarterly financial performance reports.
Streamlining reporting and monitoring crucial processes can help achieve this.
This approach provides more accurate and timely trend analysis, better responsiveness to changes, and continuous decision-making based on data.
To truly make financial analysis ongoing, you need to eliminate the manual effort of regular data collection and report building. Data automation platforms like Coupler.io transform financial analysis from a periodic task into a continuous process by connecting your data sources directly to your analytics tools. With scheduled data refreshes that can run daily, weekly, or monthly, your financial dashboards always reflect the most recent information without requiring manual updates. This automation enables proactive decision-making rather than reactive responses to outdated information.
6. Implement data automation
Data automation can be a game changer when it comes to implementing an ongoing financial analysis.
By automating your data flows, you eliminate manual data entry, copy-pasting, or extracting data manually on a regular basis, which can be time-consuming and tedious. Not to mention, being prone to human errors.
For example, data in your accounting software is updated regularly. Refreshing your reports for analysis manually will mean wasting time.
But when you automate your data flow, for example, from QuickBooks to BigQuery or to a spreadsheet app, you get instant access to the latest data that is always fresh and analysis-ready.
We have a full step-by-step financial reporting automation process example at the end of the article that you can check out.
7. Leverage machine learning (ML) algorithms for analysis and forecasting
To enhance your performance data analysis and financial forecasting, you can use ML algorithms. It enables you to identify patterns and correlations in your data that a human analyst might not be able to see.
For example, in BigQuery, a data warehouse, you can create and execute machine learning algorithms to analyze large sets of your data and identify correlations and patterns. To get started with BigQuery, you will first need to move your data there. You can automate your data flow for manipulation and analysis or simply load it manually.
8. Analyze your data with informative dashboards
If you want to track different metrics and KPIs and make your business decision-making powered by data, you should use dashboards.
Analyzing data with informative dashboards is all about making your data digestible and insight-generating. Specific data represented in a visually appealing way is meant to help you understand large amounts of information. Graphs, charts, or tables on a dashboard make the data easy to comprehend, hence facilitating the identification of trends, patterns, and anomalies.
For example, you may have a revenue dashboard with a line chart to display your company revenue over time. It can also allow you to drill down into different income sources, like product vertical or geographical location.
Explore practical methods for revenue tracking and analytics.
You can create financial dashboards using multiple business intelligence tools, such as Looker Studio, Power BI, or Tableau. They provide different customization options to adapt dashboards to the needs of your business.
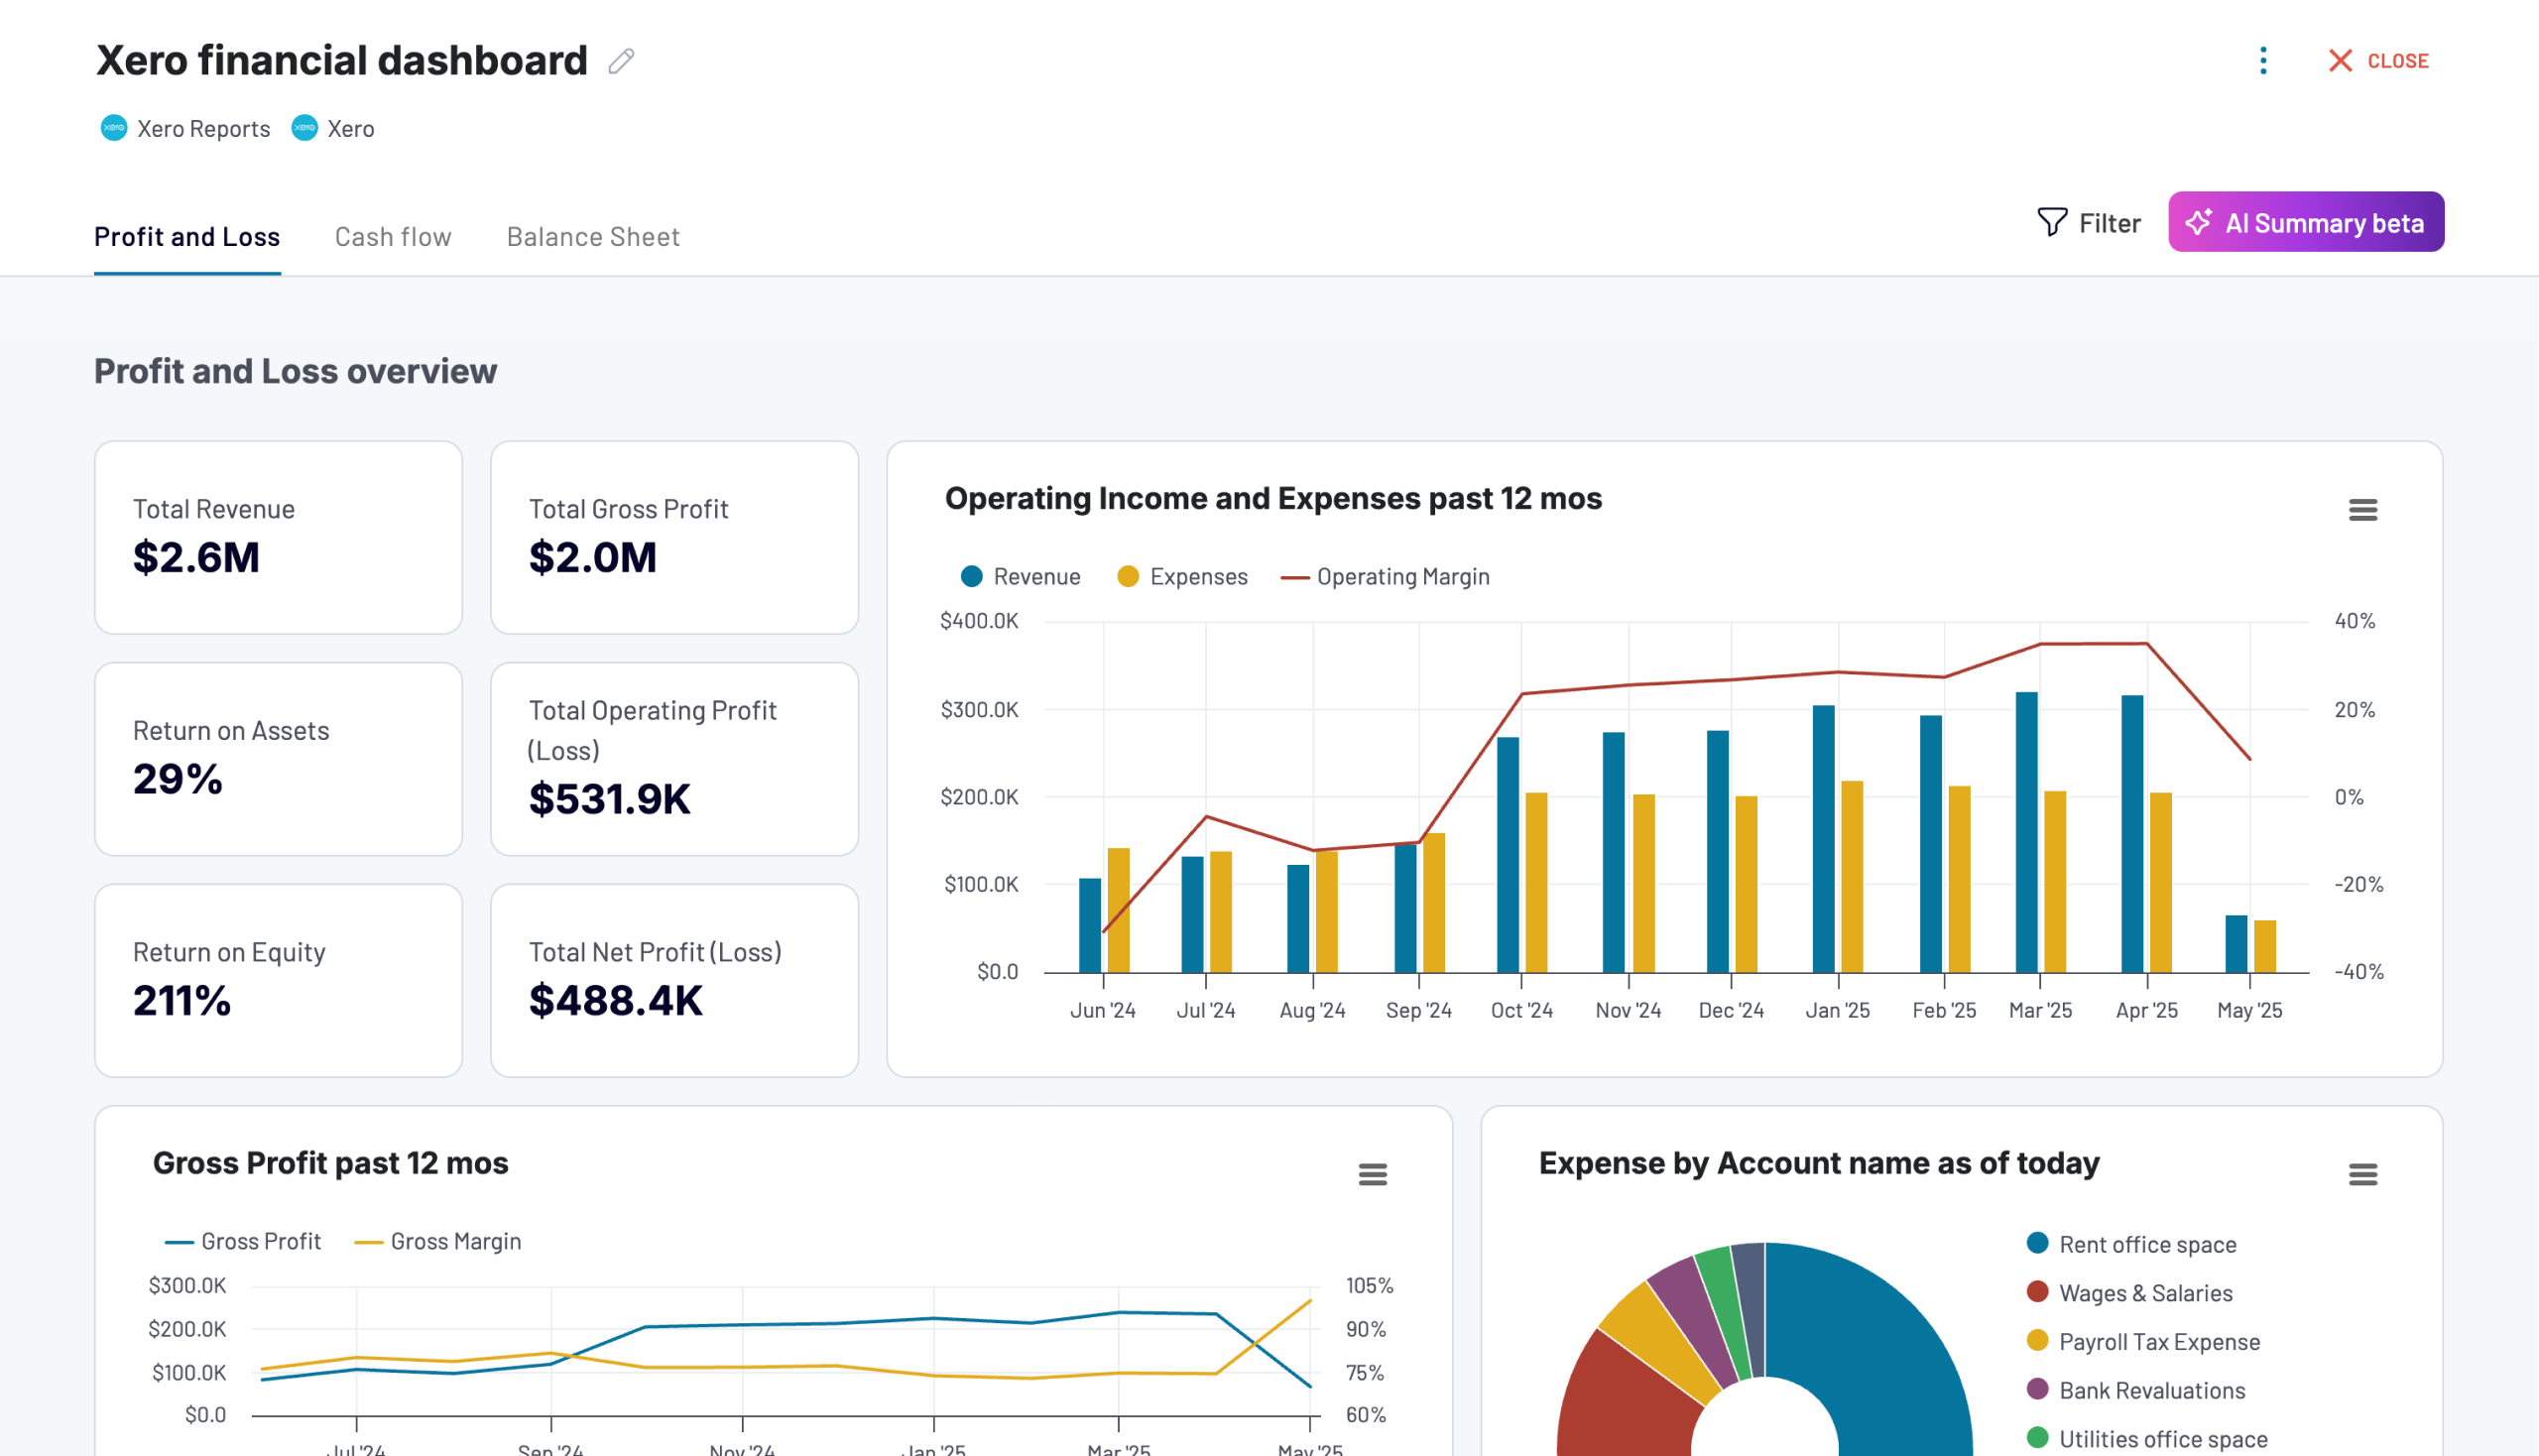
Below is an example of a financial performance dashboard. It’s designed in Looker Studio and rests on the data collected from multiple sources. This allows you to have a quick overview of your financial sales performance.
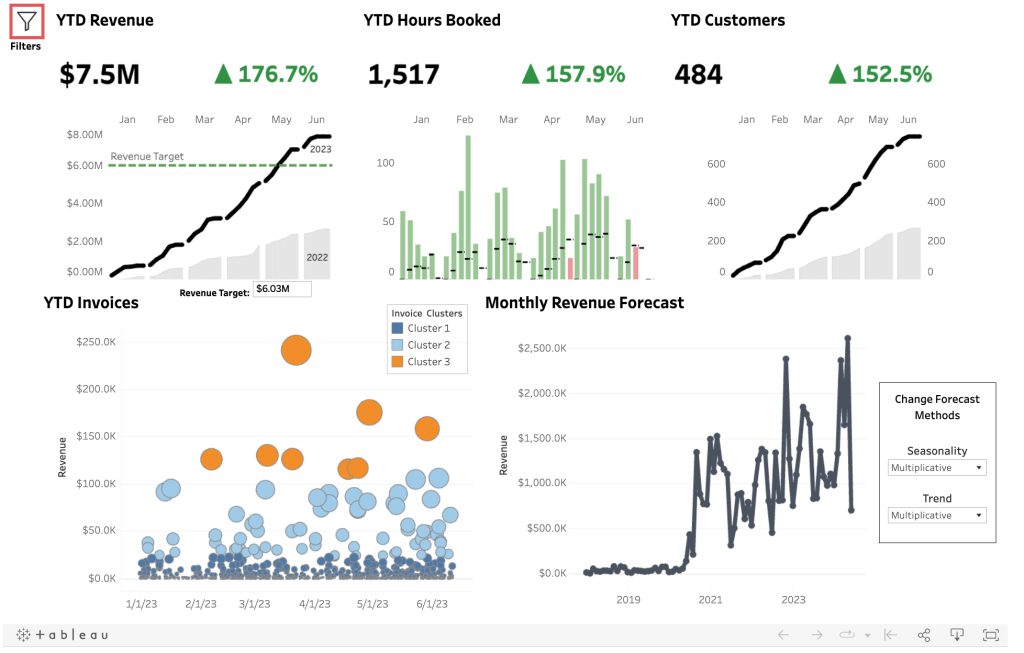
You must not always visualize your data yourself. The Coupler.io data analytics team is ready to assist you in any complex financial data visualization or data management task you have.
Types and methods of financial performance evaluation
The type of financial statement analysis defines the data to be used. Let’s look at the most common types to determine the data you need to process.
Horizontal analysis
A horizontal analysis identifies trends and changes in your company’s financial performance over time. It’s also known as a trend analysis and works by comparing financial statements from different periods, like year to year or month to month.
You can use horizontal analysis to identify strengths and weaknesses, as well as feasible opportunities and threats. To perform it, take a specific item from a financial statement, for example, expenses, and compare it across two or more periods of time. This way, you’ll get a year-over-year or quarter-over-quarter analysis of expenses.
For example, you notice that your operating expenses increased by 20% over the last two years while revenue only grew by 5%. This indicates inefficiency and the need to optimize cost management.
| Year | Revenue | Operating expenses | Revenue growth | Operating expense growth | Horizontal analysis (Revenue vs. operating expenses) |
|---|---|---|---|---|---|
| Year 1 | 100,000 | 50,000 | – | – | – |
| Year 2 | 110,000 | 52,000 | 10% | 4% | – |
| Year 3 | 120,000 | 55,000 | 9.09% | 5.77% | – |
| Year 4 | 125,000 | 60,000 | 4.17% | 9.09% | – |
| Year 5 | 126,000 | 66,000 | 0.80% | 10% | Revenue growth: 5% (Year 3 to Year 5). Operating expenses growth: 20% (Year 3 to Year 5). Inefficiency indicated by higher expense growth. |
Vertical analysis
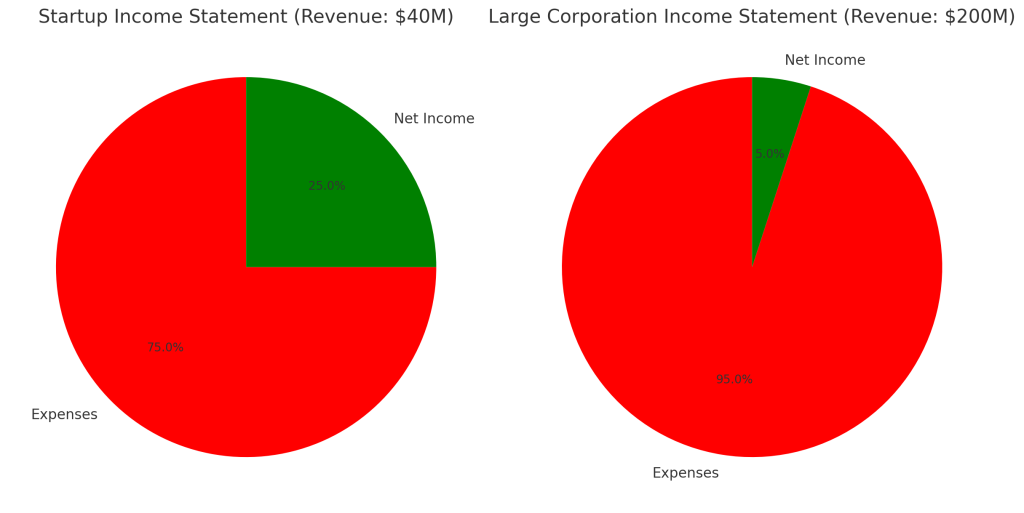
Vertical (or common-size) analysis is the process of comparing financial statements vertically, meaning that each line item is represented as a percentage of a base figure within the statement.
For example, in a vertical analysis of the income statement, each line item would be expressed as a percentage of total revenues.
The insights derived from such analytics allow you to understand your company’s overall profitability and how it is affected by each revenue item.
This kind of analysis is also helpful for comparing financial statements across companies of different sizes or industries.
For example, a startup and a large corporation may both report $10M in net income. However, when expressed as a percentage of revenue, the startup has a 25% net profit margin, while the large company has only 5%. This shows greater efficiency at the startup despite its lower absolute revenue.
Ratio analysis
Ratio analysis, or a financial health check, is evaluating financial ratios (quantitative relationships between different variables) to measure:
- Profitability: How well your company generates profit.
- Liquidity: Ability to pay short-term obligations.
- Efficiency: Effectivity of resource use.
- Solvency: Long-term financial stability.
Ratios help standardize financial data and make it easier to compare performance across periods, competitors, and industries. Here’s a breakdown:
| Ratio category | Ratio | Formula | Real-word implication |
|---|---|---|---|
| Profitability ratios | Gross profit margin | (Revenue – COGS) ÷ Revenue | A company with a 40% gross profit margin is more efficient in production than one with 25%. |
| Net profit margin | Net income ÷ Revenue | If the net profit margin shrinks despite growing revenue, operating costs may be too high. | |
| Liquidity ratios | Current ratio | Current assets ÷ Current liabilities | A ratio of 1.2 means the company has just enough assets to cover short-term debts. A ratio below one signals liquidity risk. |
| Quick ratio | (Current assets – Inventory) ÷ Current liabilities | A quick ratio of 1.1 means a company can easily cover its short-term liabilities without relying on inventory. Below 1 indicates potential liquidity issues. | |
| Efficiency ratios | Accounts receivable turnover | Revenue ÷ Average accounts receivable | A low turnover ratio may indicate issues with late payments. |
| Asset turnover ratio | Revenue ÷ Average total assets | A company with high asset turnover uses its assets more effectively to generate revenue. | |
| Solvency ratios | Debt-to-equity ratio | Total debt ÷ Total equity | A debt-to-equity ratio above 2 or 3 means that a company relies heavily on borrowed funds, increasing financial risk. |
| Interest coverage ratio | EBIT (earnings before interest and taxes) ÷ Interest expense | A ratio between 3 and 5 signifies that the company earns 3-5 times its interest expense, indicating an ability to meet interest payments. |
Cash flow analysis
Cash flow analysis is the assessment of operating, investing, and financing cash flows to determine how well your company manages its cash. This analysis is crucial to performance because, even if your company is profitable on paper, it may still face cash flow challenges due to delayed payments or poor working capital management.
For instance, a company may report $5M in net income. Still, if the cash flow statement shows negative operating cash flow due to unsold inventory, it indicates poor inventory turnover and potential liquidity problems.
| Metric | Value | Interpretation |
|---|---|---|
| Net income | $5M | Shows accounting profit after all expenses |
| Operating cash flow | -$2M (negative) | Indicates poor cash generation from core business |
| Key issue | Unsold inventory | Cash is tied up, causing liquidity problems |
Cash flow challenges often arise suddenly, making regular monitoring crucial. While traditional cash flow analysis might be performed monthly or quarterly, Coupler.io enables near real-time cash flow visibility. By automating data flows from your payment processors (like Stripe) and accounting systems (like QuickBooks or Xero) to analytical dashboards, you can identify cash flow trends or issues as they emerge. For example, a company using automated cash flow monitoring might detect a slowdown in accounts receivable collections early enough to adjust payment terms before facing liquidity problems.
For deeper operational visibility, many finance teams complement traditional cash flow statements with a 13 week cash flow model. This rolling forecast provides weekly granularity over a 13-week horizon, making it easier to identify short-term liquidity risks that monthly or quarterly statements might miss.
Variance analysis
Variance analysis is a financial results analysis that involves comparing actual figures to planned ones. It also helps you identify the reasons for the differences between what you expected and the actual outcomes.
For example, if you expected $10,000 in sales for a month and only made $8,000, variance analysis would help you identify the reason for the $2,000 difference. Pricing issues, greater costs, or lower demand could lead to this.
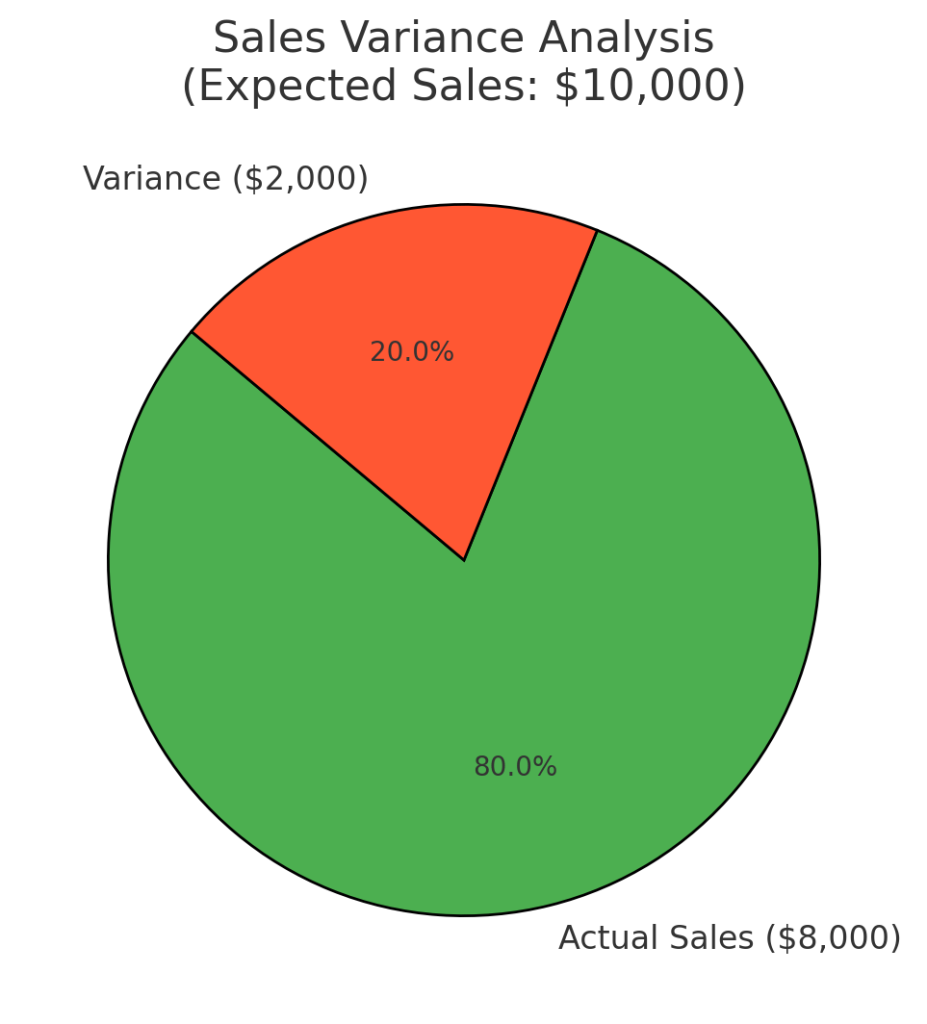
Understanding the reasons for the differences between planned and actual results can help you improve your financial planning and budgeting. This can be adjusting budgets, identifying cost savings opportunities, or investing in areas that are generating higher-than-expected returns.
Financial performance indicators and quantifiable metrics
Here are the metrics (in addition to those mentioned earlier) that are most used to monitor financial performance and how to calculate each.
| Metric | What it measures | Formula |
|---|---|---|
| Operating margin | A profitability ratio that shows the percentage of revenue remaining after covering operating expenses | Operating margin = Operating income ÷ Total revenue |
| Working capital | An organization’s cash flow for day-to-day operations | Working capital = Current assets – Current liabilities |
| Debt to equity ratio | A measure of financial leverage and risk based on a company’s total debt to total equity | Debt to equity ratio = Total liabilities / Total equity |
| Accounts payable turnover | An indicator of how quickly a company pays off its suppliers | Accounts payable turnover = Total purchases ÷ Average accounts payable |
| Inventory turnover | Sales and replacements of inventory in a given period by a company | Inventory turnover = Cost of goods sold / Average inventory |
| Return on equity (ROE) | Profit generated by a company in relation to its shareholders’ investment | ROE = Net income / Total equity |
| Return on assets (ROA) | A company’s profitability as a percentage of its assets | ROA = Net income / Total assets |
| Operating cash flow | The amount of cash generated by a company’s operations, which is used to determine how well it can pay its debts and invest in expansion | Operating cash flow = Net income + Non-cash expenses – Changes in working capital |
Tools for financial performance monitoring
Let’s now discuss the tools to monitor financial performance of your company. These break down into:
- Financial data management systems – accounting and billing software to collect your actual financial data.
- CRMs – to use if you want to enrich your data with nuanced insights into sales, financial goals, and metrics.
- Spreadsheets and BI tools – to report financial performance and present your data in an easily digestible format.
- Reporting automation platform – to pull data from financial management systems, create custom reports on the go, and push them into spreadsheets or BI tools.
Learn more about Power BI financial reporting.
Financial management systems
QuickBooks
QuickBooks is accounting software that helps you analyze profitability, manage cash flow, and monitor expense distribution, revenue trends, and cost allocation. It provides transaction records, profit and loss statements, balance sheets, tax reports, and more.
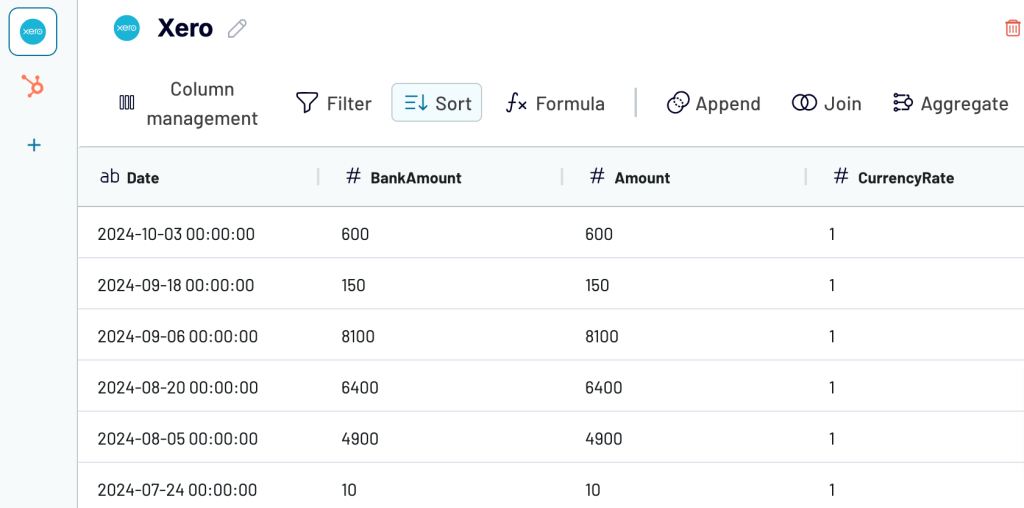
Xero
Xero is one more accounting system, which allows you to evaluate spending patterns and anticipate financial trends. You can use it to derive data on accounts payable and receivable, cash flow forecasting, payments, expenses, and other aspects of financial health.
Stripe
Stripe billing software focuses on payment processing and offers detailed analytics to evaluate payment success rates and revenue retention. It captures transaction volumes, subscription performance, customer lifetime value, and refund trends.
CRMs
Salesforce
Salesforce lets you refine your financial performance analysis to make more accurate revenue forecasts and decisions. It delivers in-depth data on sales pipelines, customer behavior, and revenue generation.
HubSpot
With HubSpot data, you can assess the financial impact of marketing and sales efforts. The platform tracks customer interactions and lifecycle stages, providing records on deal values, sales conversion rates, and retention.
Pipedrive
Pipedrive helps you assess the financial health of your sales operations and optimize revenue generation. It’s used to organize and track sales processes as well as gain clear insights into deal values, sales cycle lengths, and forecasting accuracy.
Spreadsheets and BI tools
Google Sheets
Google Sheets enables you to create meaningful reports on your financial performance by organizing data in spreadsheets and applying formulas and functions. You can also visualize the data using charts, graphs, and tables to present performance trends.
Microsoft Excel
Excel is another spreadsheet app well-suited for building a financial performance report. Like Google Sheets, it lets you arrange data in spreadsheets and perform calculations with formulas and functions. It also suggests charts to summarize data, identify trends, and highlight patterns.
Looker Studio
Google Looker Studio is a BI tool for creating dashboards that turn raw financial data into actionable performance insights. It lets you build various visualizations and use features like viewer filters and date range controls to make your dashboard even more interactive.
The tool for financial performance report automation and AI analytics: Coupler.io
To report and analyze your financial performance, you’ll need to pull data from your accounting or billing system and import it into a spreadsheet or BI tool…or connect to an AI tool. However, these systems often lack native accounting automation for integration with such tools, which leaves nothing to do but manually download and upload data.
This is where Coupler.io, a data integration platform and AI analytics, comes to the rescue. It lets you create reports based on data from QuickBooks, Xero, or Stripe and enrich them with records from CRMs like Salesforce, Pipedrive, or HubSpot. You can combine disparate data into a single view and export the ready-to-go report to Google Sheets, Excel, Looker Studio, and other solutions.
At the same time, Coupler.io is not a regular tool for ETL in finance. The platform also lets you integrate your financial data with AI for CFO and finance teams to derive AI financial insights. Your reports will auto-update on your chosen schedule to reflect the recent changes in the source.
Explore how you can connect QuickBooks to Claude for AI conversational data analysis or dive deeper into how to automate financial reporting with Claude.
Here’s more on how you’ll benefit from Coupler.io automated reporting:
- Time savings: Eliminate the need for manual data exports and significantly reduce the time spent on repetitive tasks.
- Improved data consistency: Ensure uniform data formats across financial performance reports from different team members to minimize the risk of inconsistencies.
- Reduced human error: Minimize the chance of errors in data collection and calculations and enhance the accuracy of financial performance analysis.
- Faster financial insights: Generate up-to-date financial insights quickly to enable faster decision-making.
- Lower operational costs: Free up resources to improve efficiency and reduce operational costs associated with manual processes.
Coupler.io also allows you to collect and store your financial records in data warehouses like BigQuery. Additionally, it provides a gallery of ready-to-use dashboard templates for reporting. Try the solution for free with no credit card required.
Dashboard templates for insights on financial performance improvement
To create a financial performance report, you need to collect data from your system, then combine and prepare it to be analysis-ready. Instead, to save time and effort, Coupler.io’s free white-label dashboard templates are available for you to use. Each template comes with a built-in Coupler.io connector, ensuring that the data is automatically loaded into the dashboard and visualized.
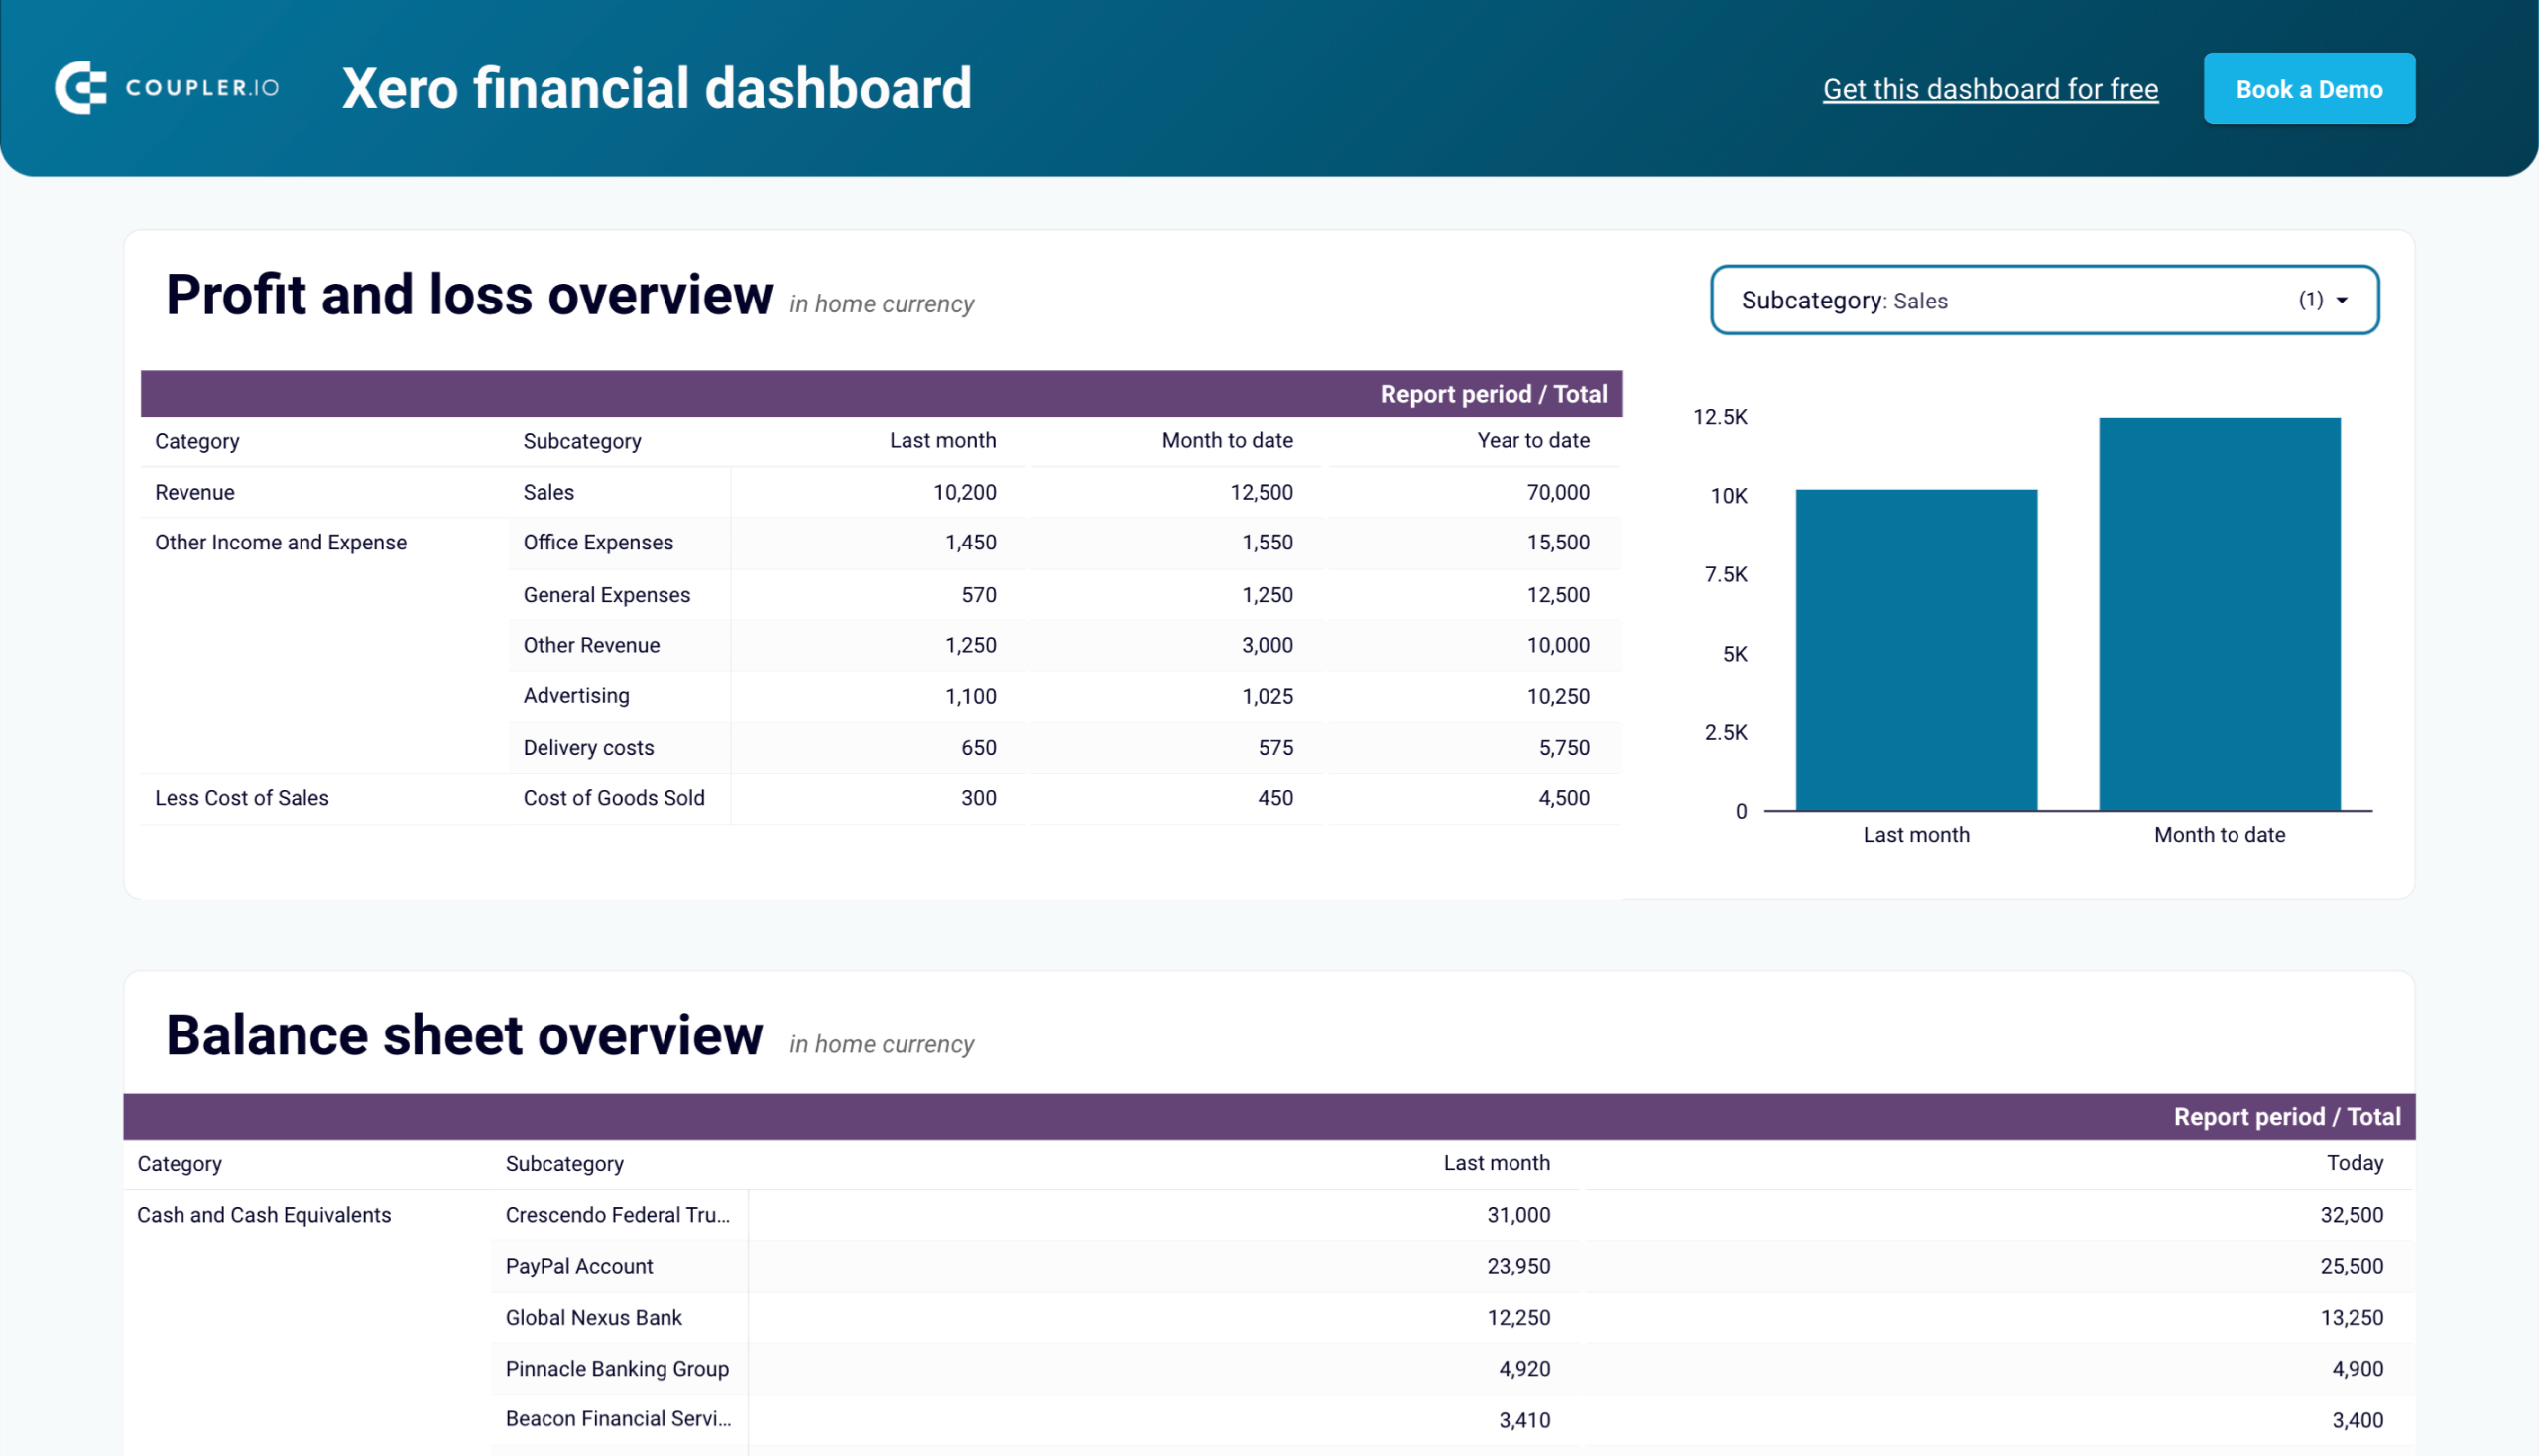
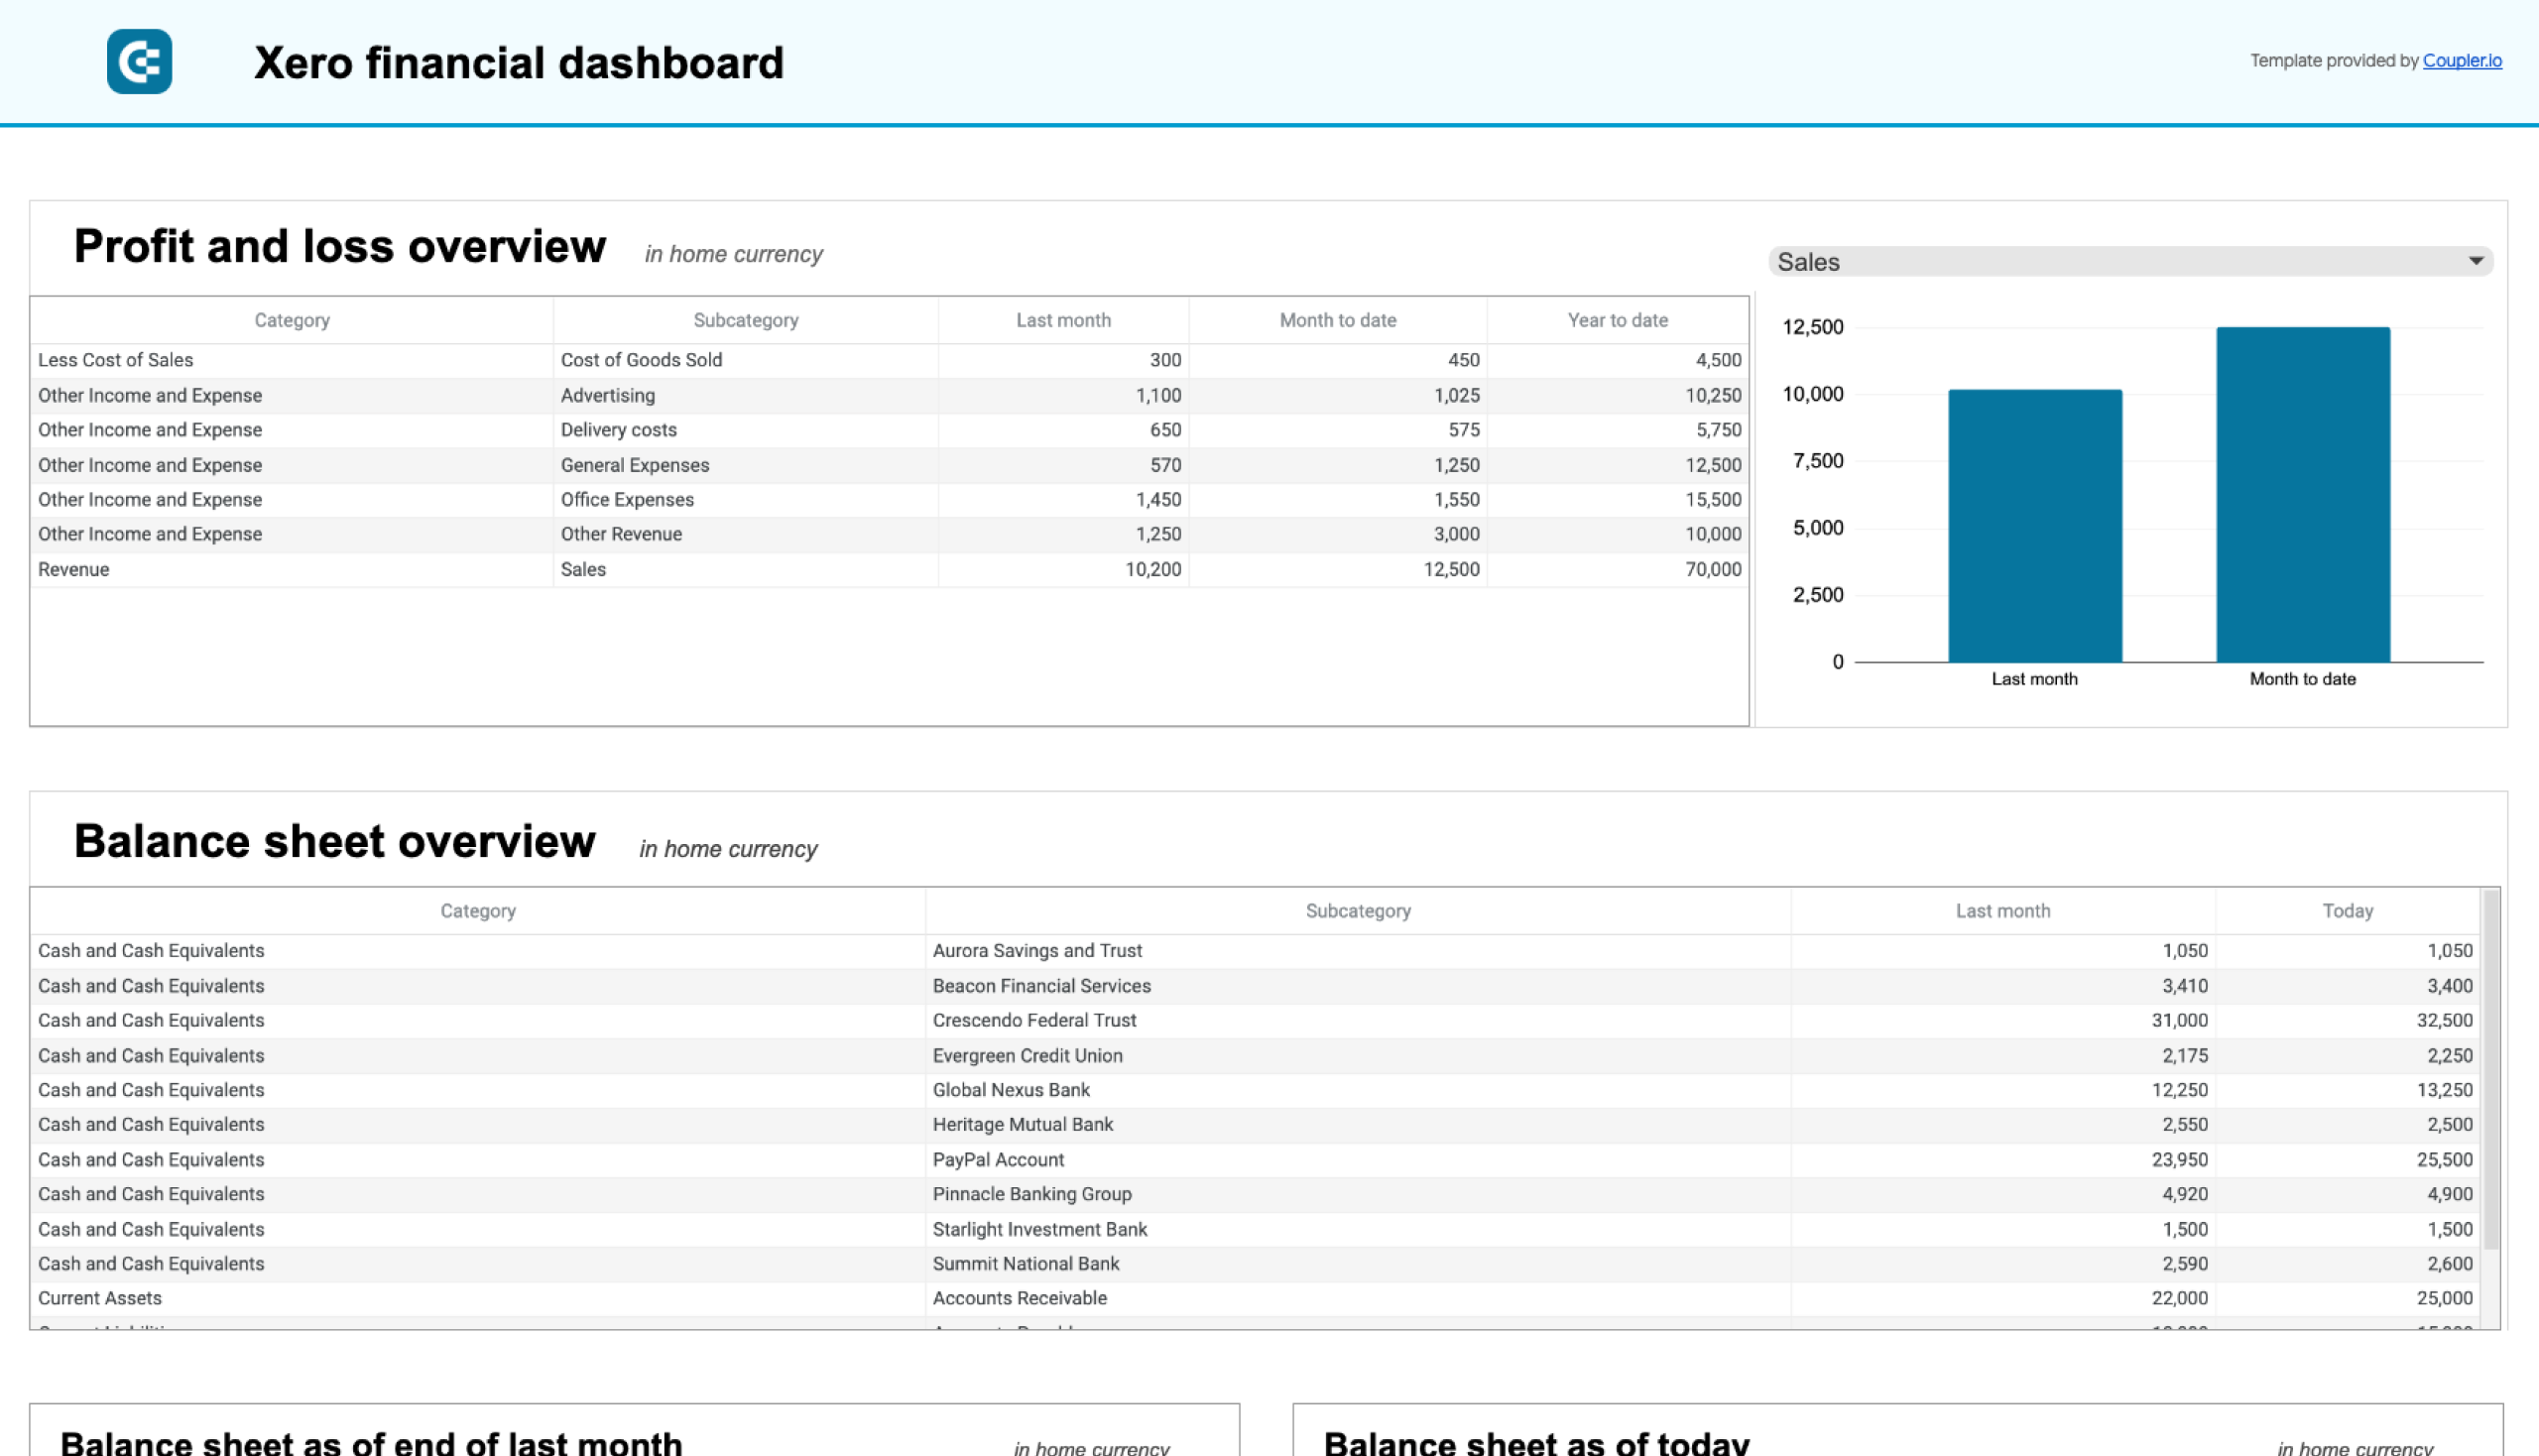
Financial dashboard for Xero/QuickBooks
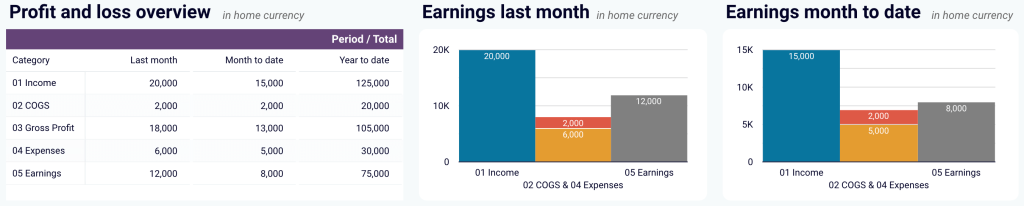
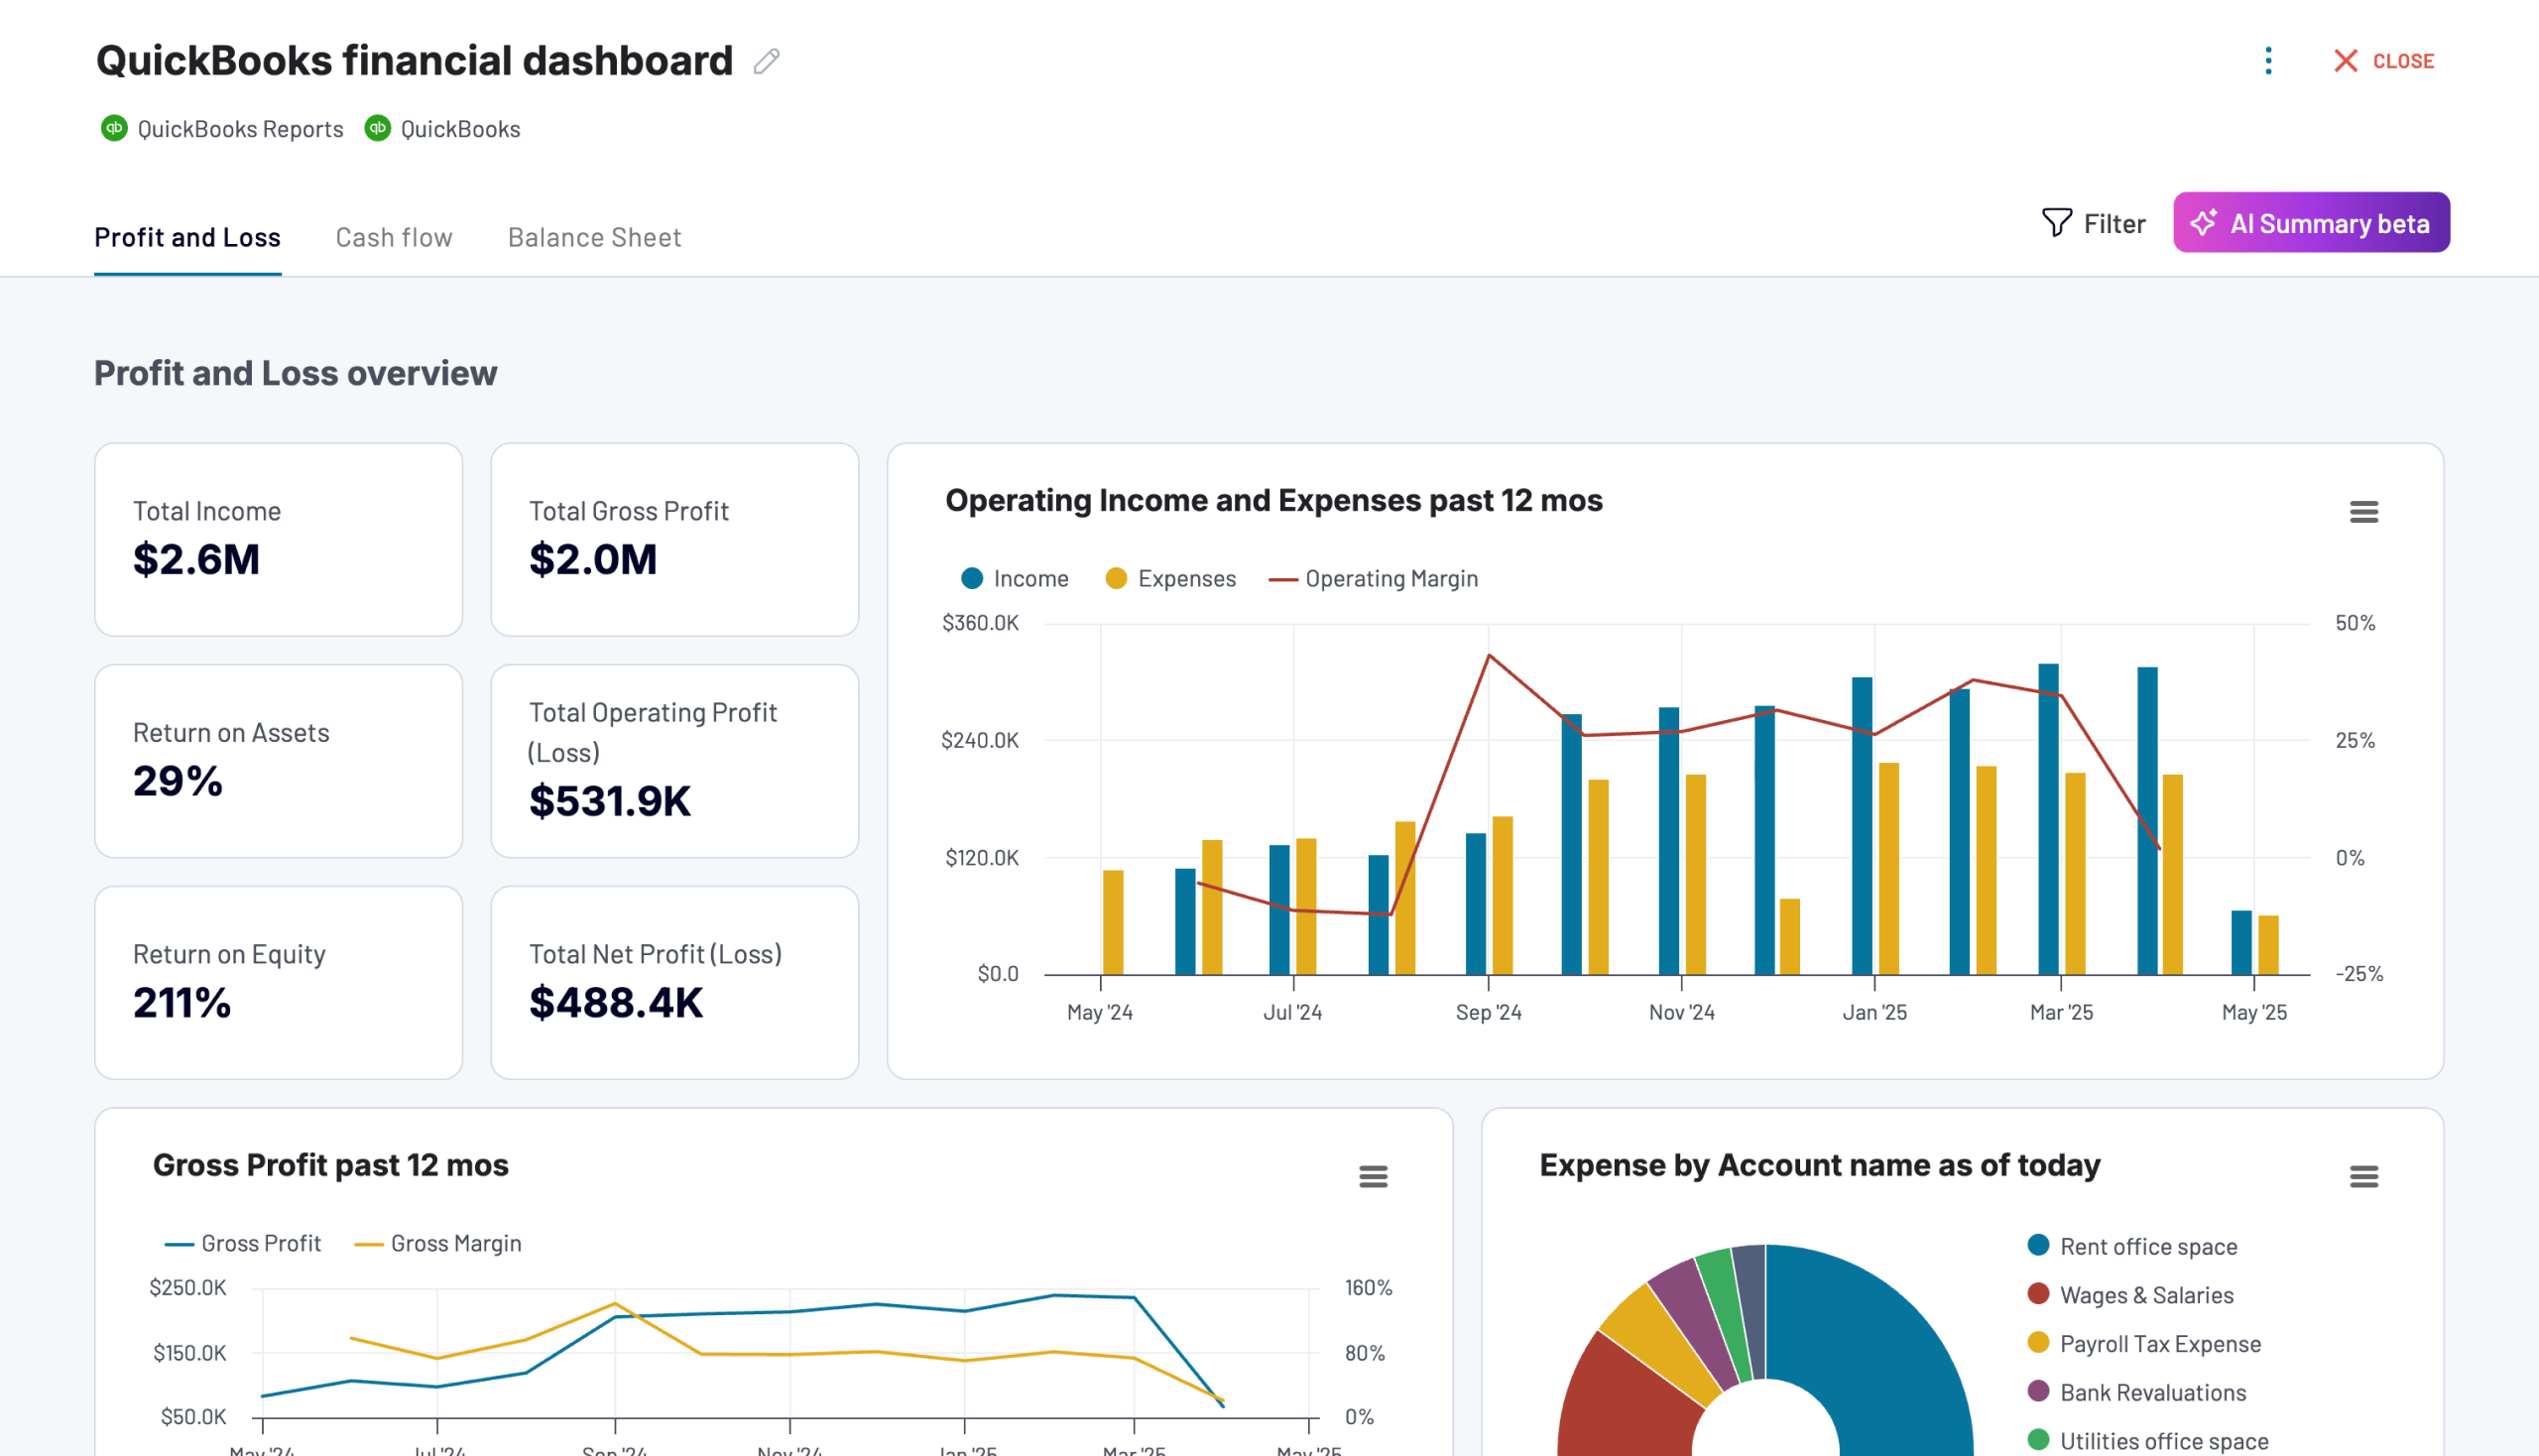
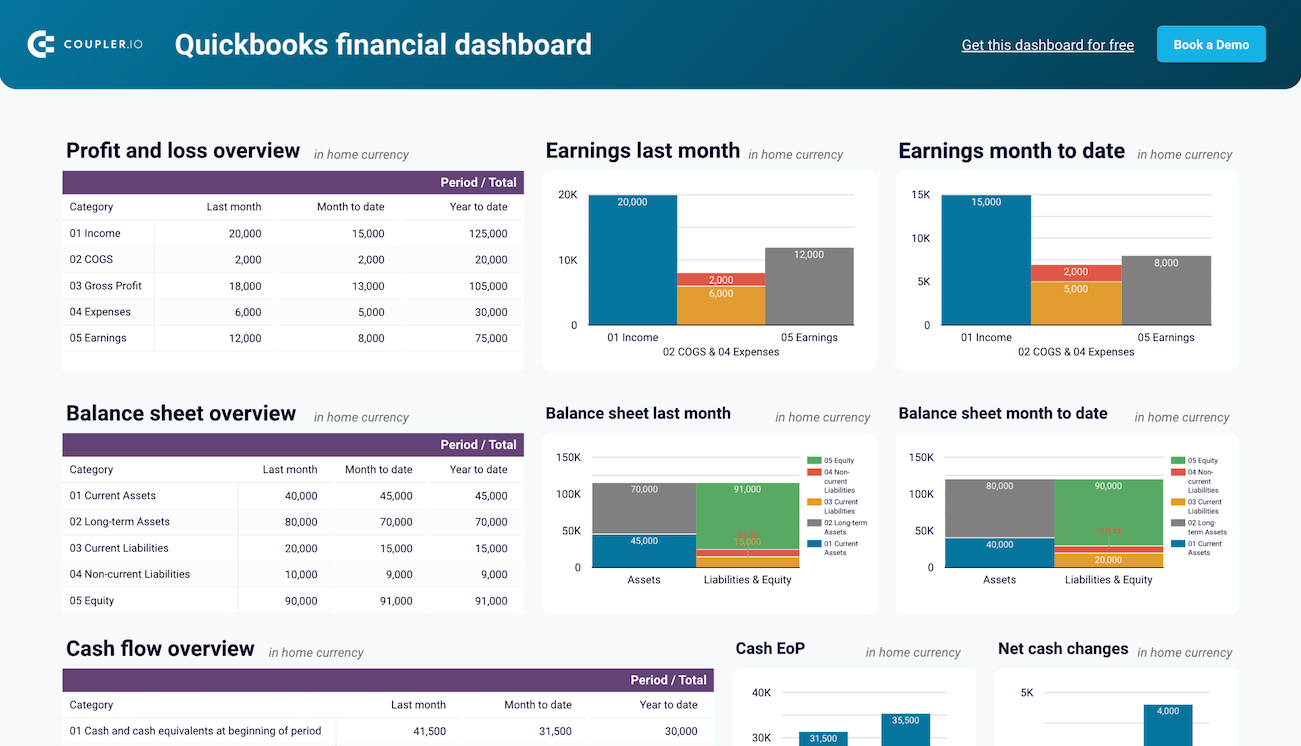
The financial dashboard lets you track the company’s earnings, cash flow, and balance sheet changes. It’s perfect for an at-a-glance understanding of the company’s financial health without diving into detailed spreadsheets or reports.
Use this dashboard to gain the following insights:
- P&L report: Get a summary of the company’s revenue, expenses, and net income for the last month, month to date, and year to date to monitor profitability and control your costs. Compare your earning trends to spot growth patterns or areas needing improvement.
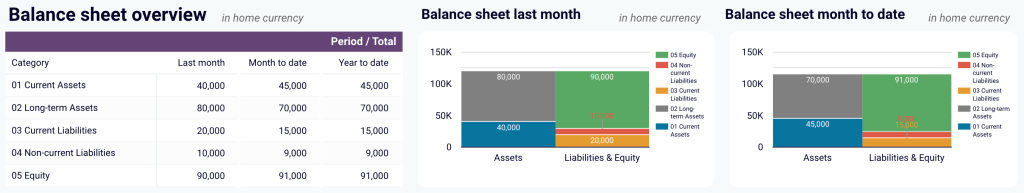
- Balance sheet overview: Take a snapshot of your assets, liabilities, and equity to understand your company’s financial position, liquidity, and business health. Place your balance sheet assets alongside liabilities and equity for the last and current month.
- Cash flow overview: Look at net cash changes over the reporting period to see how your cash position evolves and ensure effective liquidity management. Explore the cash position at the end of the period and the changes in net cash to check your financial stability.
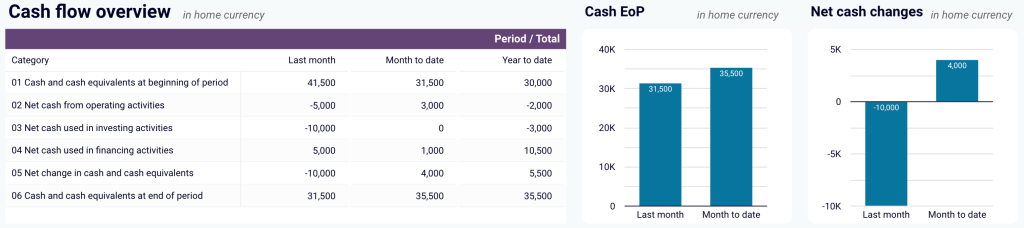
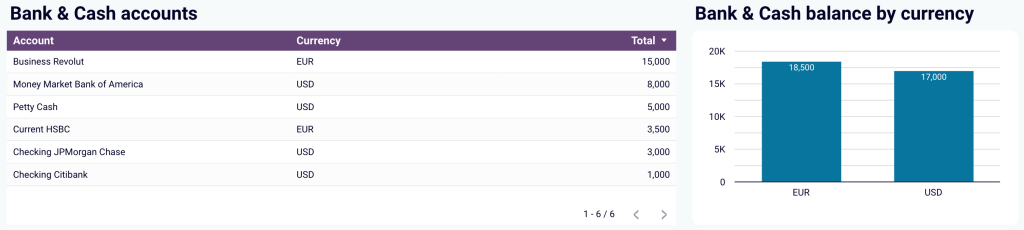
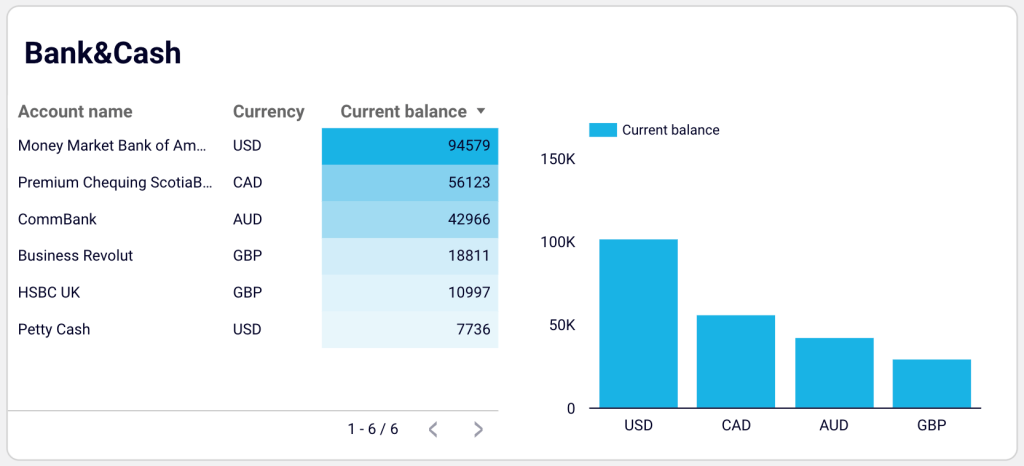
- Bank and cash accounts overview: Go over your available funds and list balances for all linked bank and cash accounts to help you verify all accounts are reconciled. If you’re handling multi-currency transactions, view account balances by currency to simplify the tracking and monitoring of foreign accounts.
You can use the dashboard in Coupler.io, which offers the AI insights feature designed to help you quickly make sense of your data.
Learn how you can analyze QuickBooks data with AI using Coupler.io.
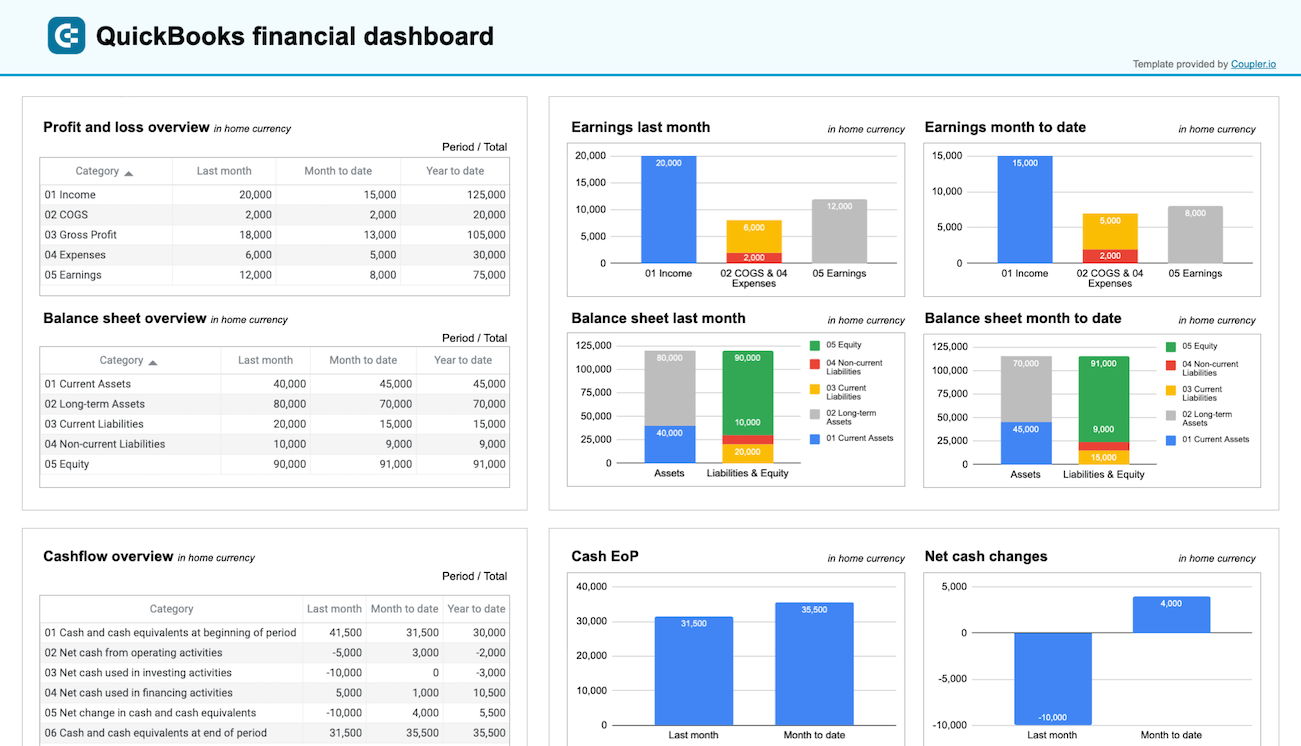
There are also Looker Studio and Google Sheets templates for this dashboard. To set up your chosen one, go to the template’s Readme tab and follow the instructions.


If you use QuickBooks Online instead of Xero, Coupler.io also offers templates for this accounting software.

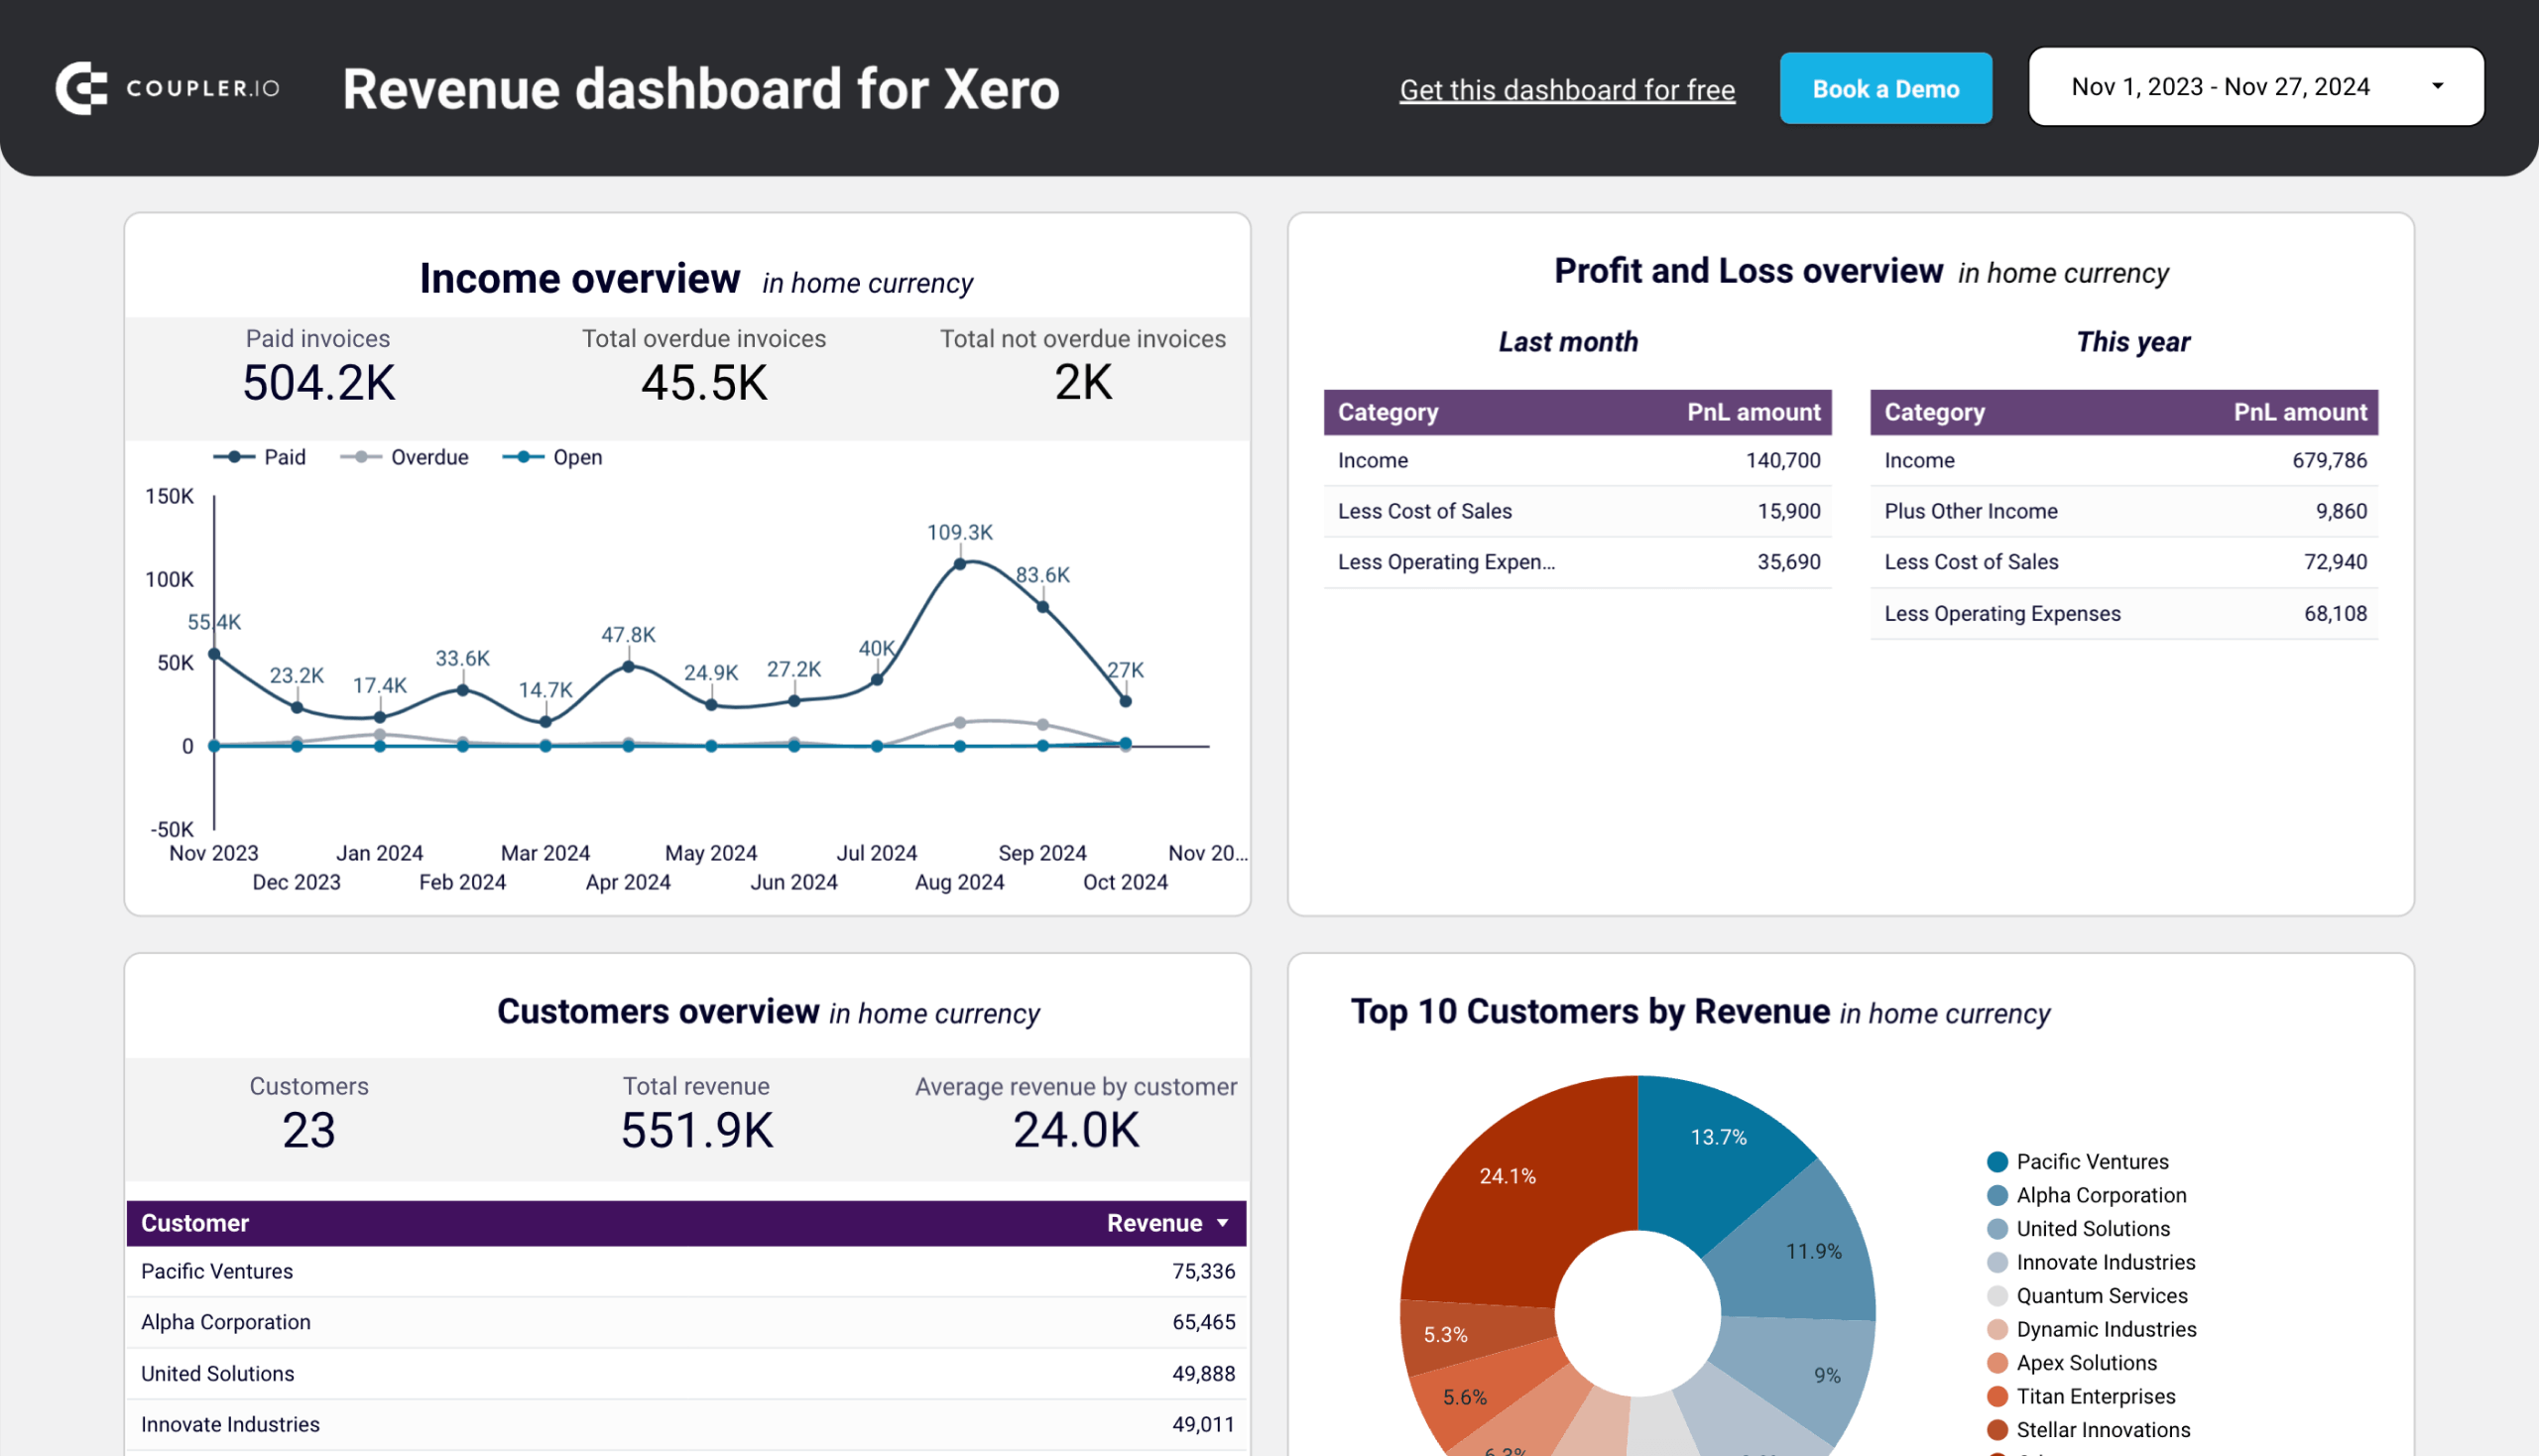
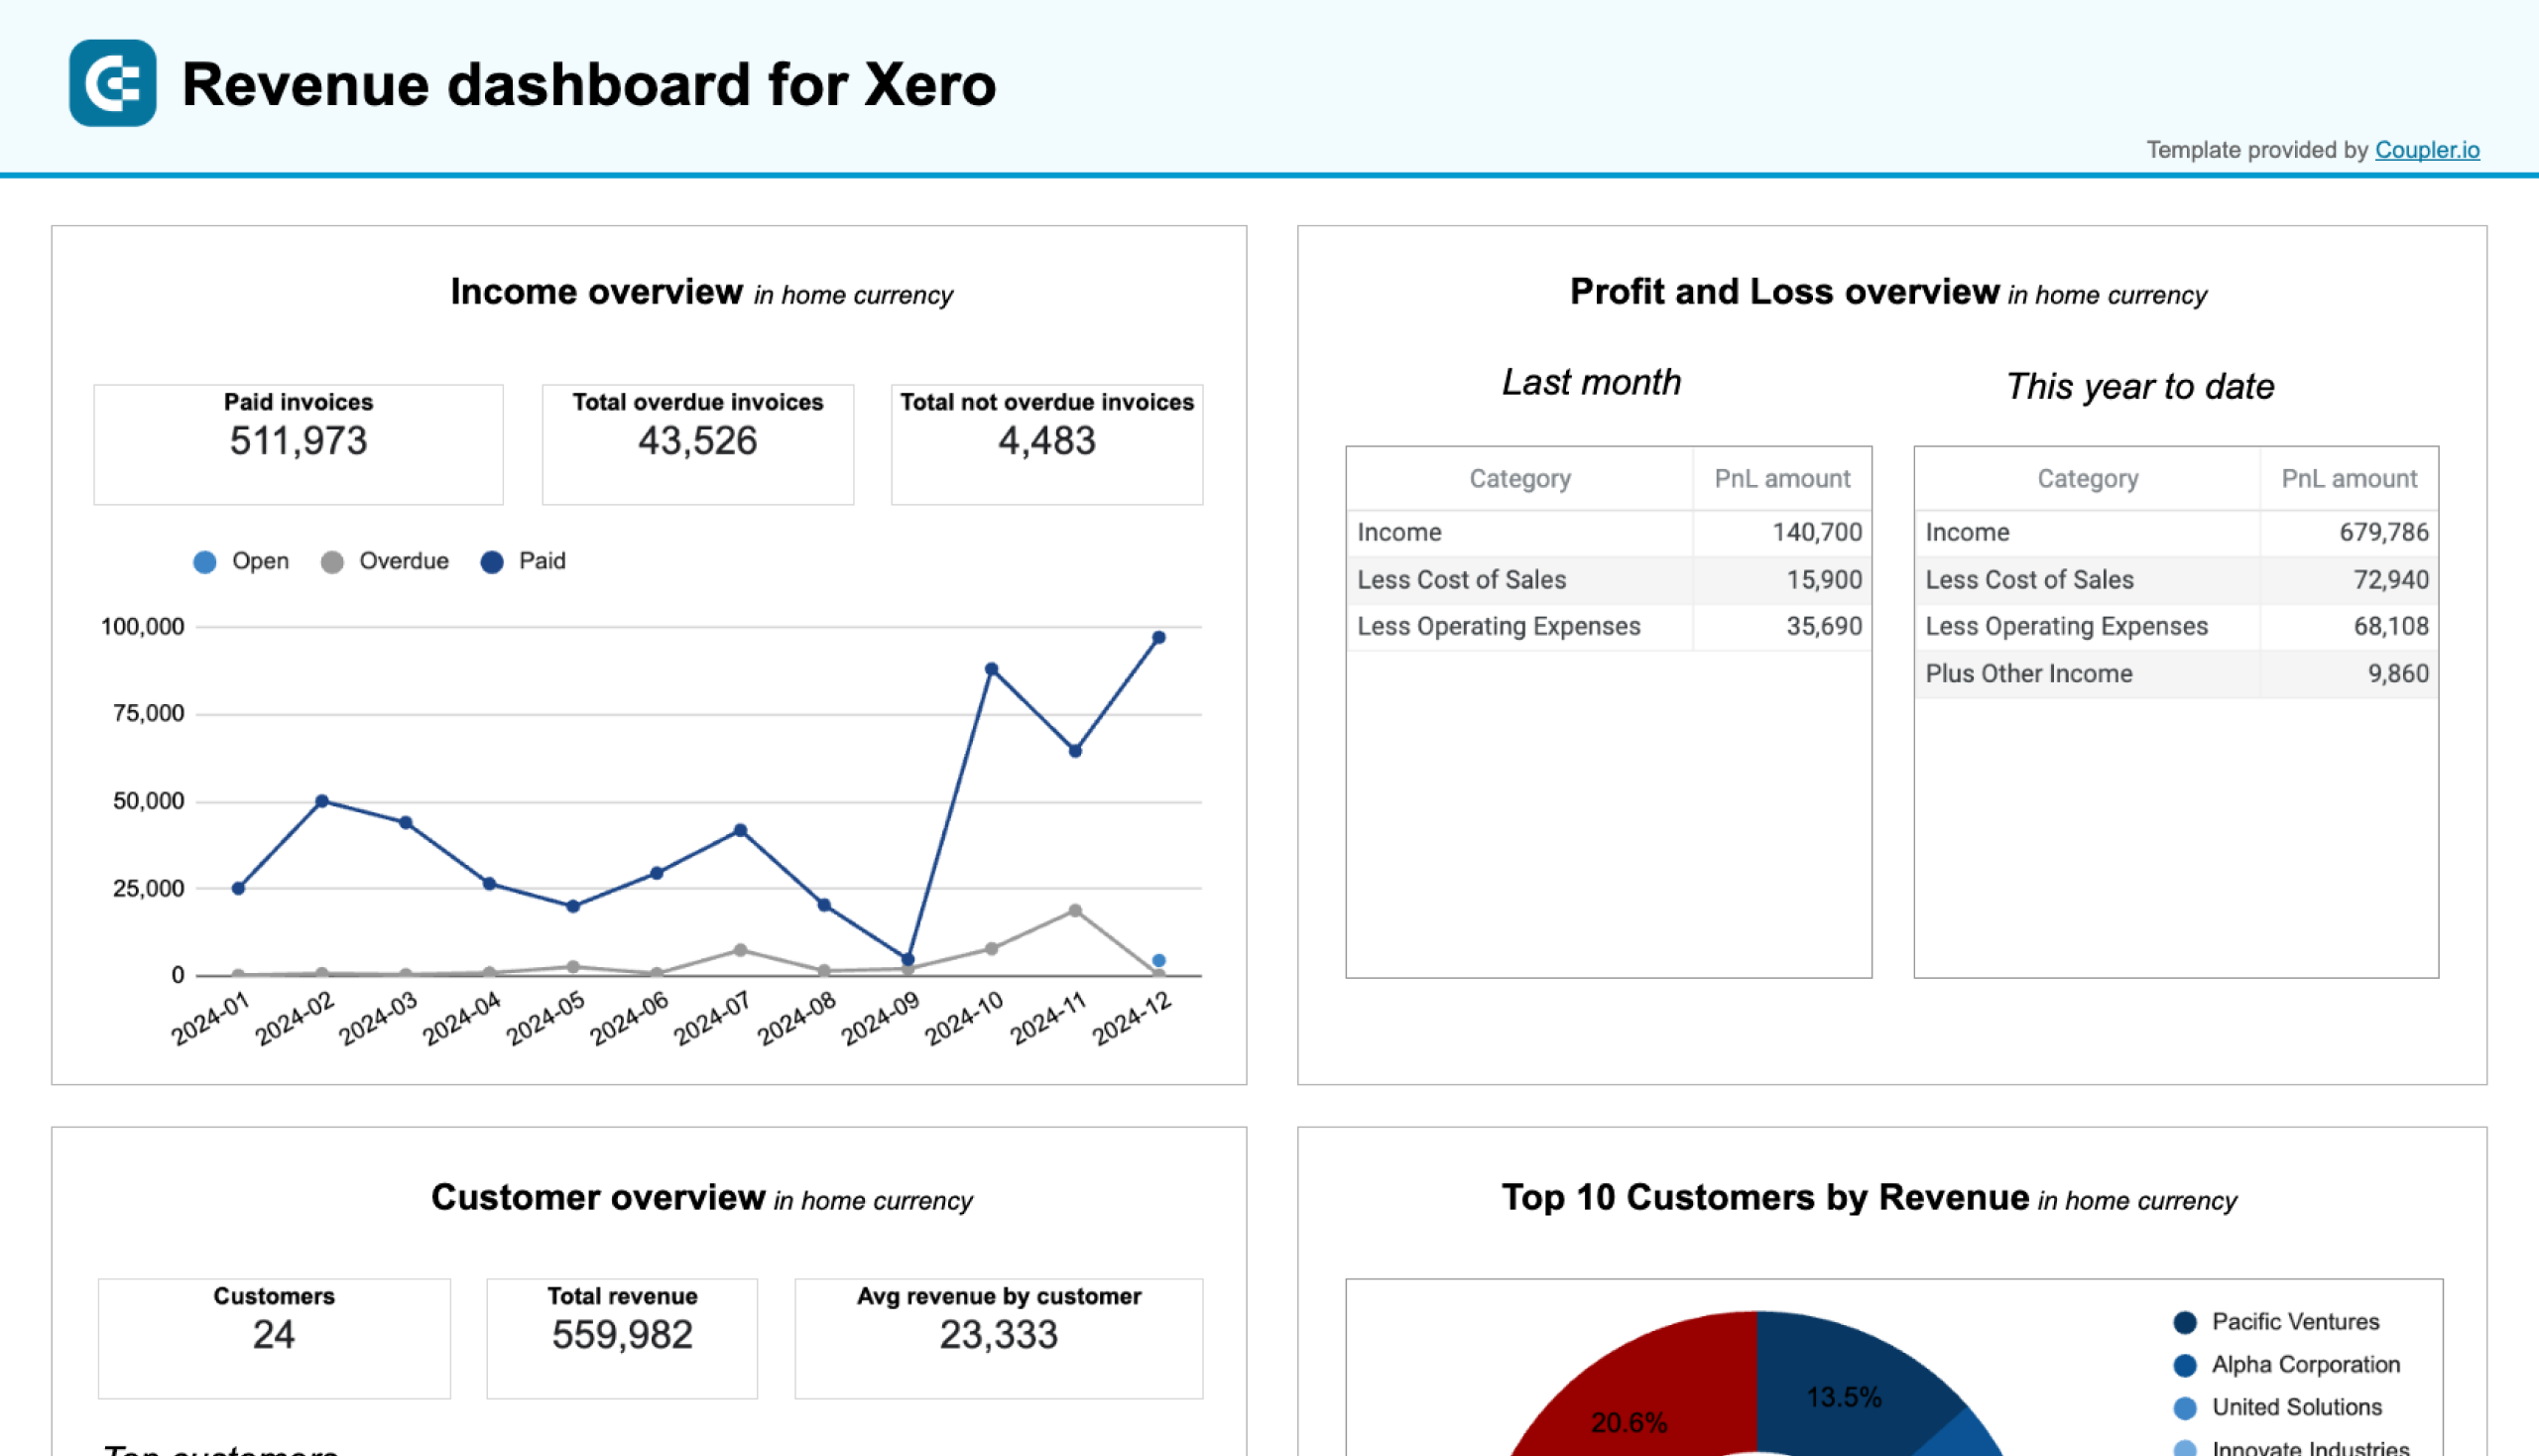
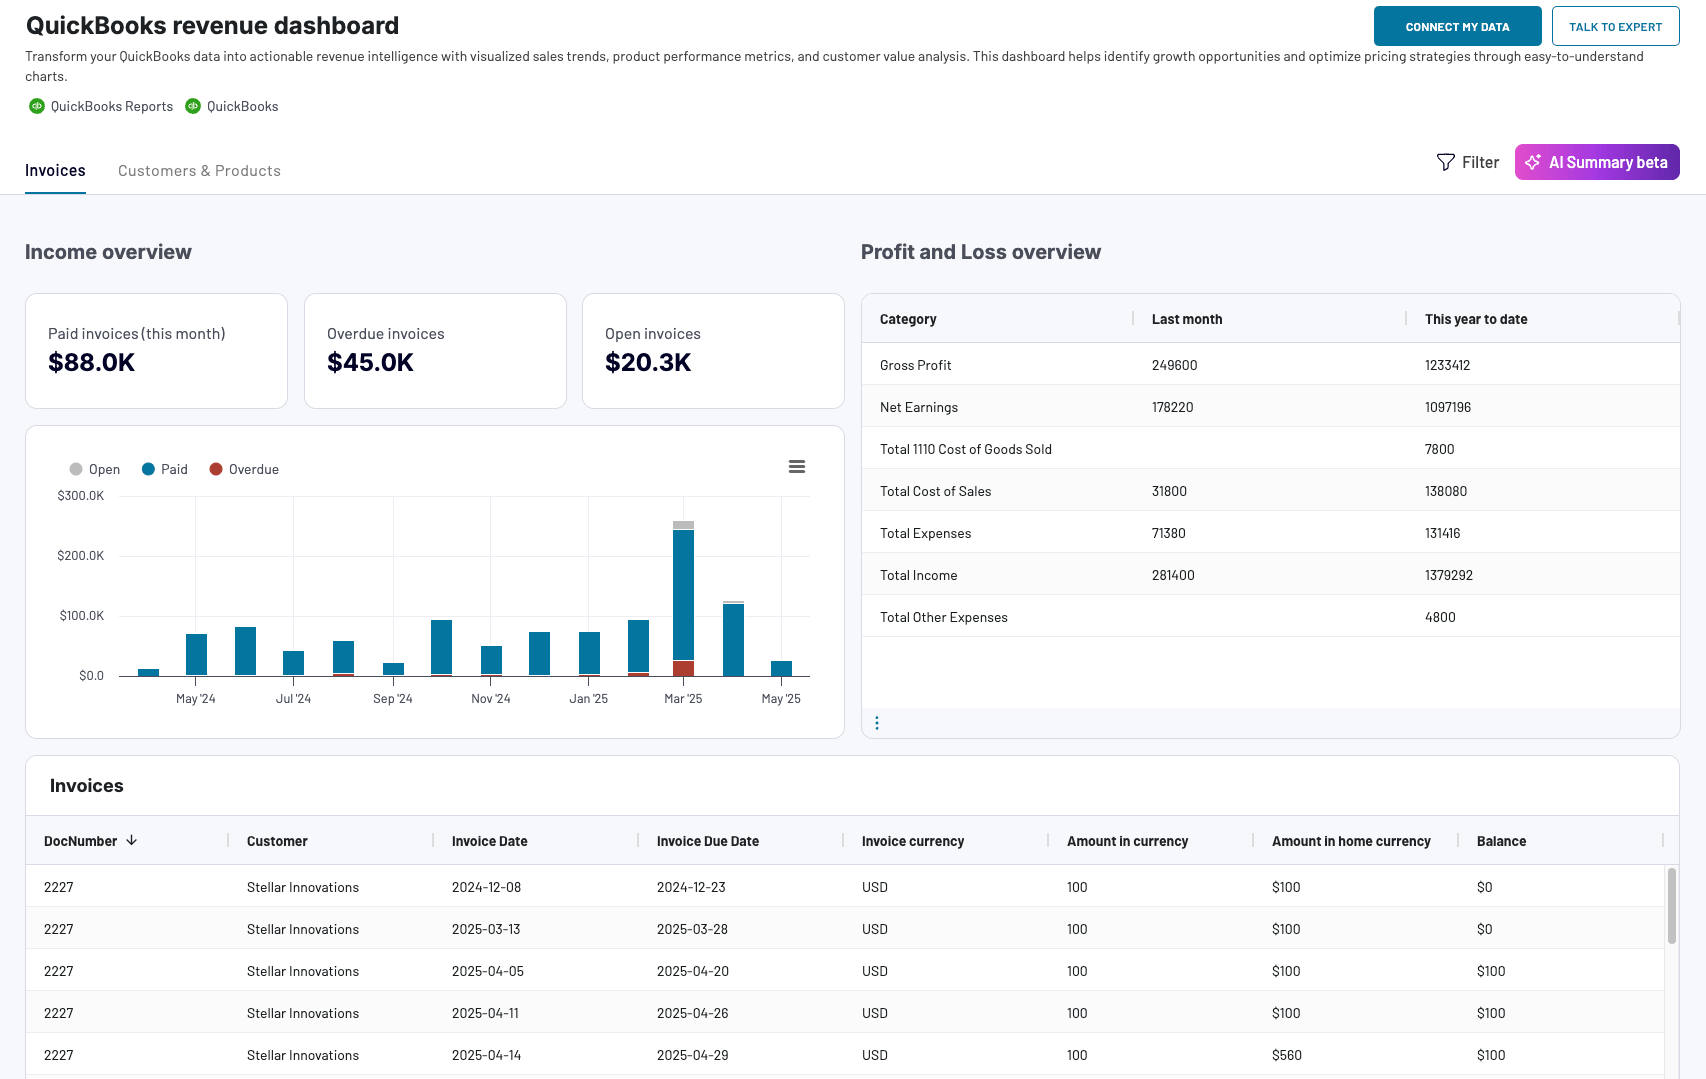
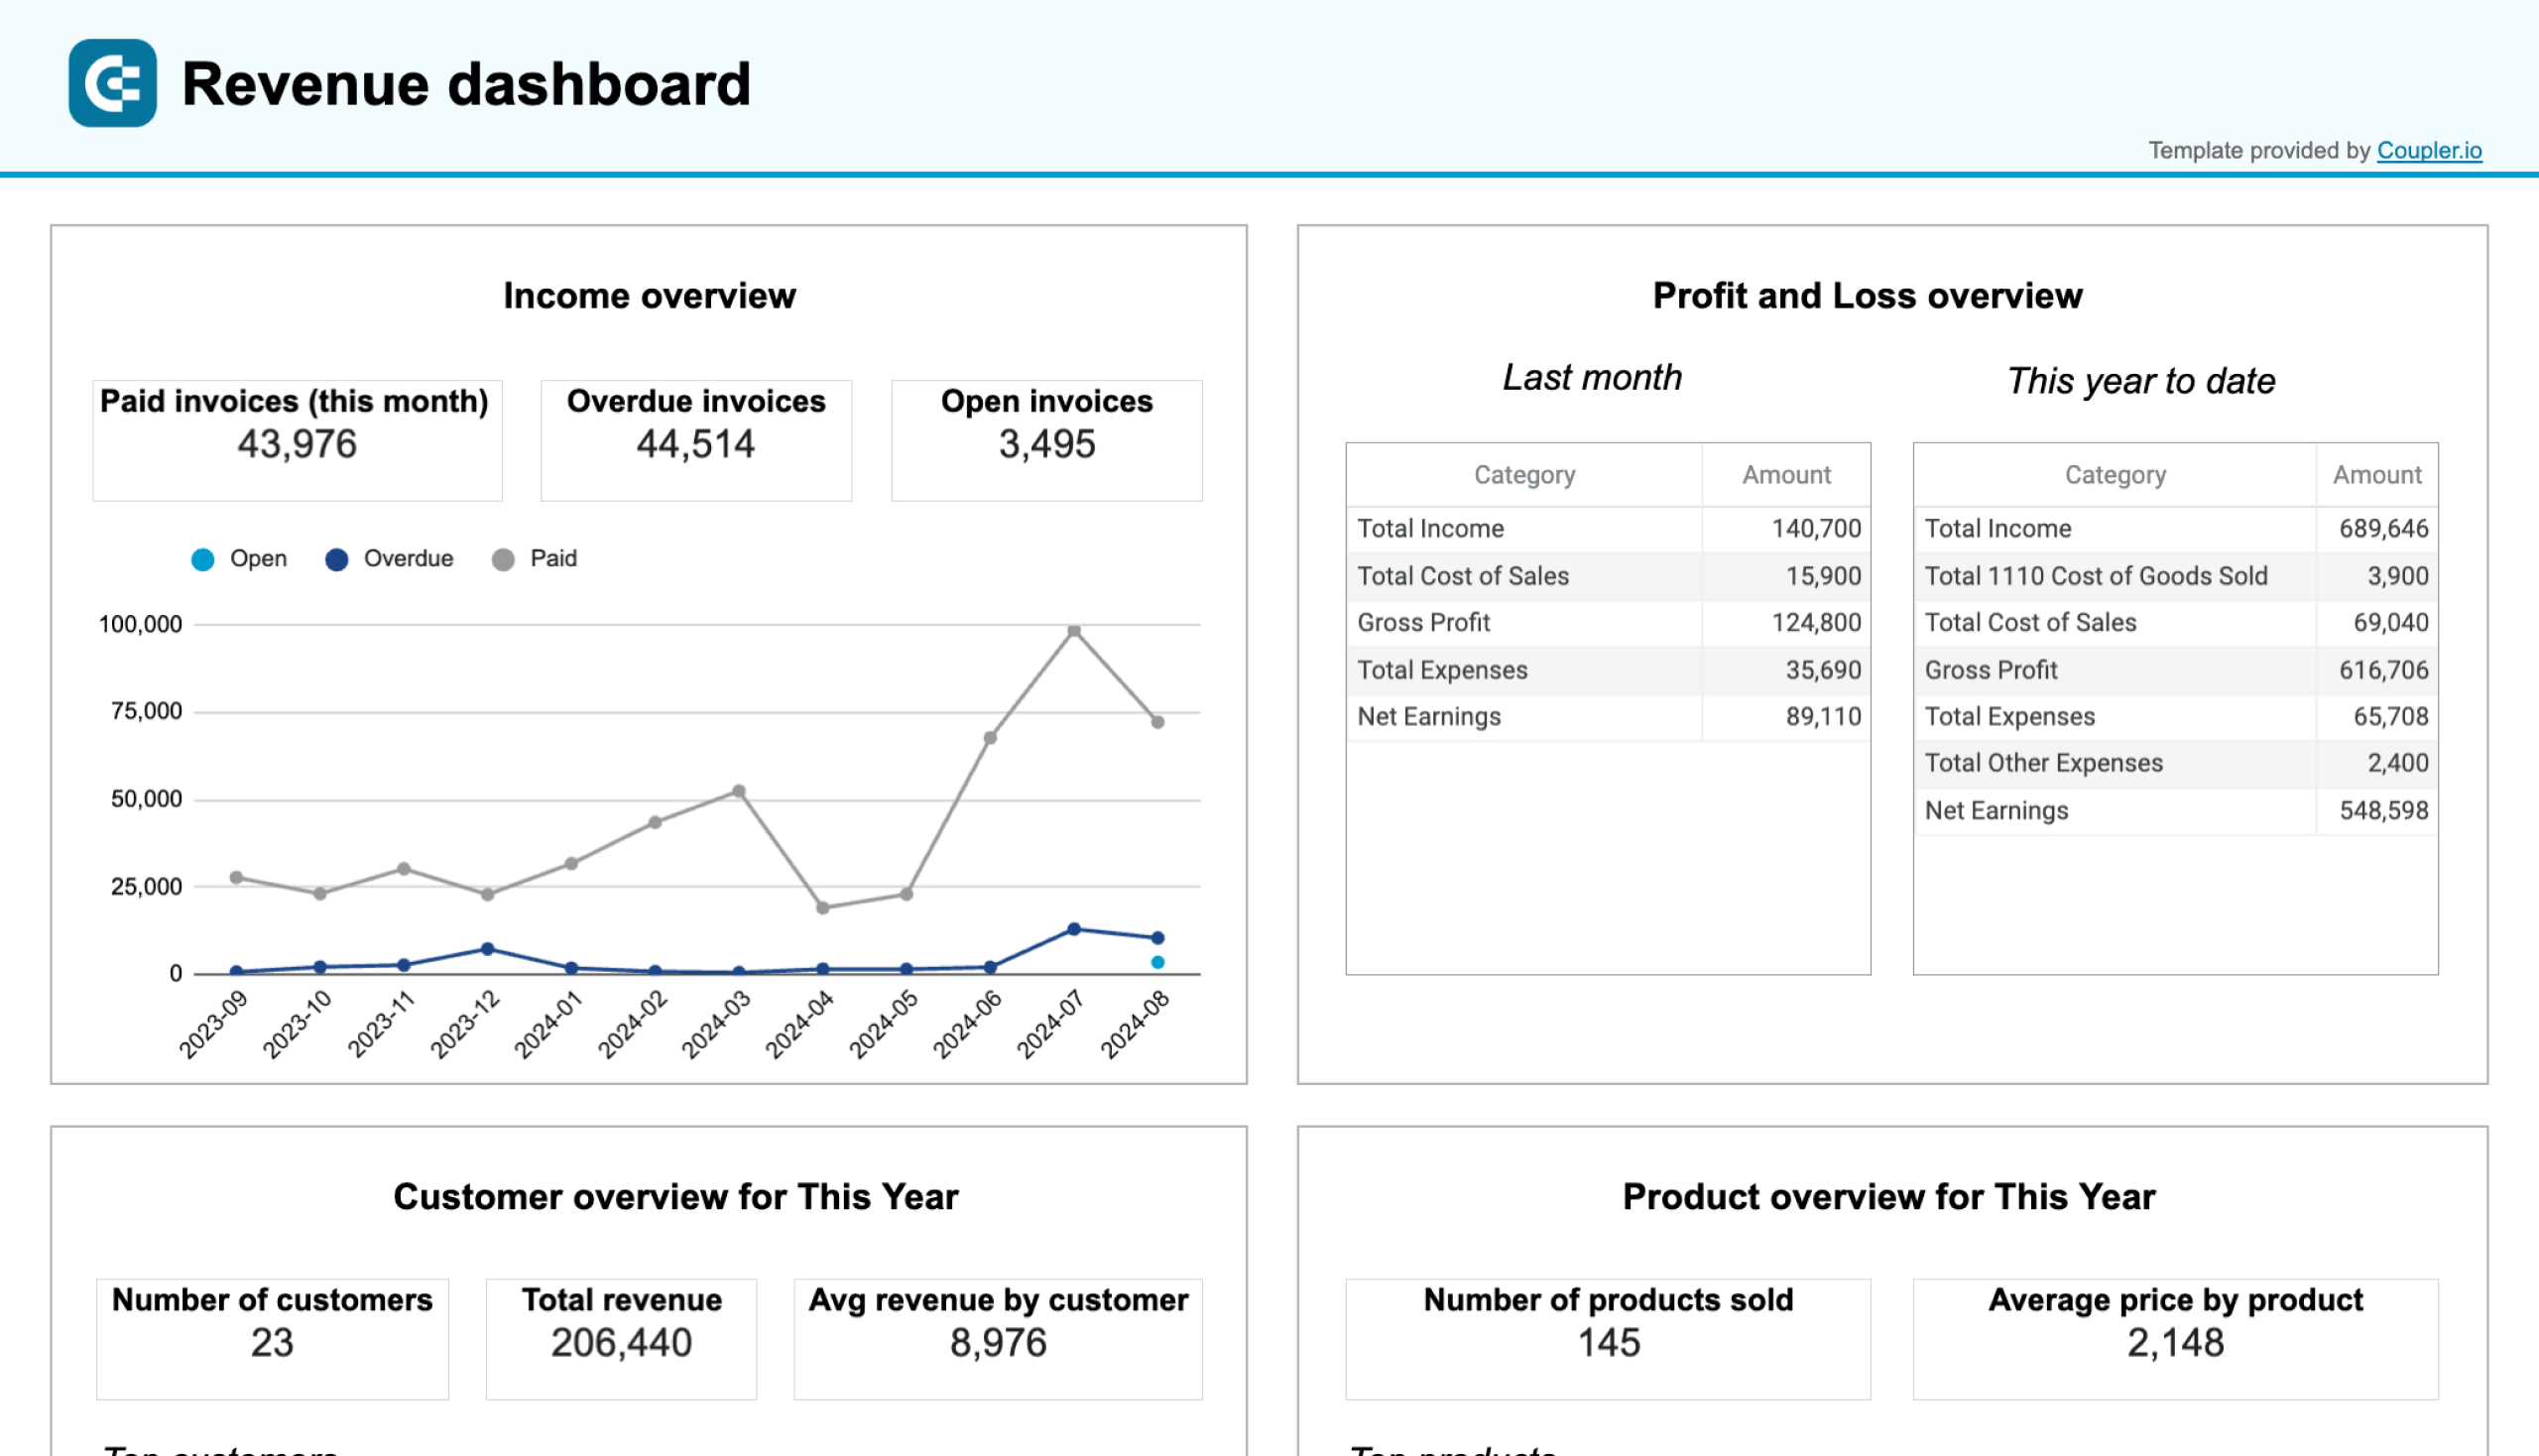
Revenue dashboard for Xero and QuickBooks
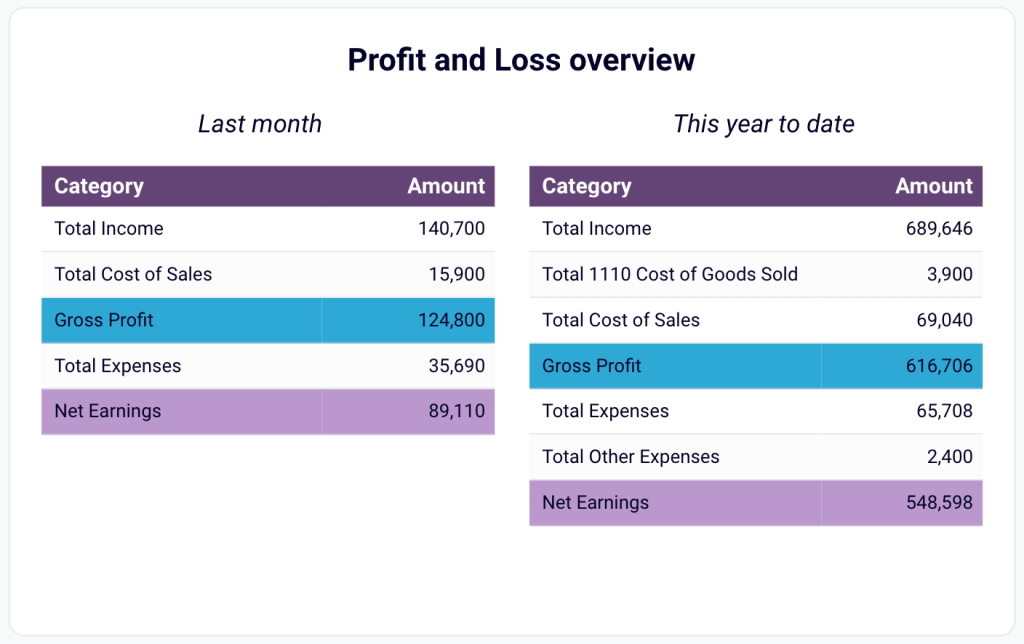
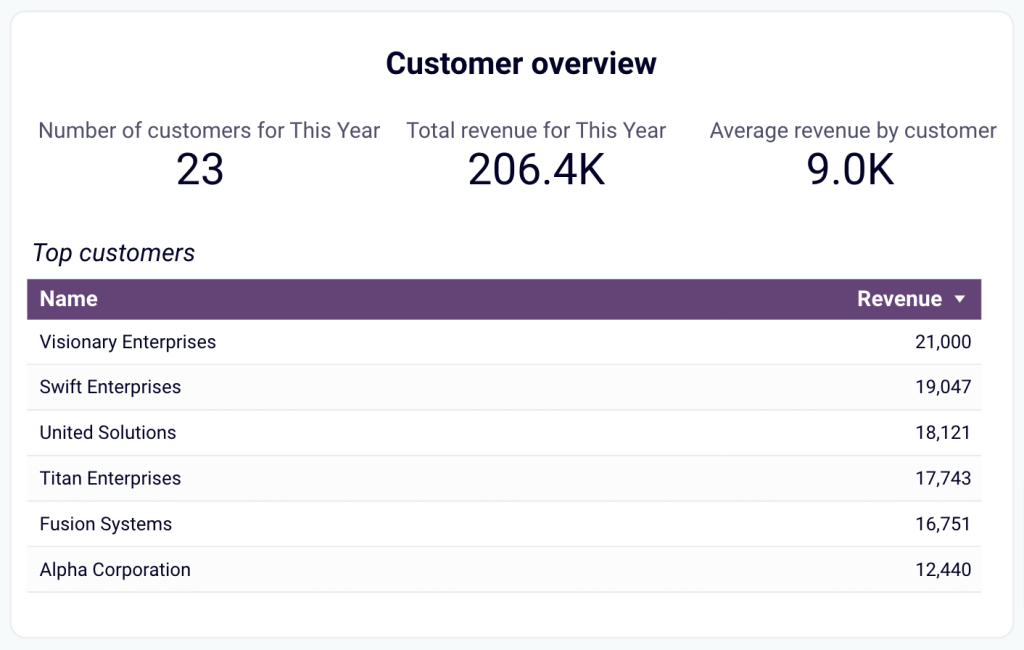
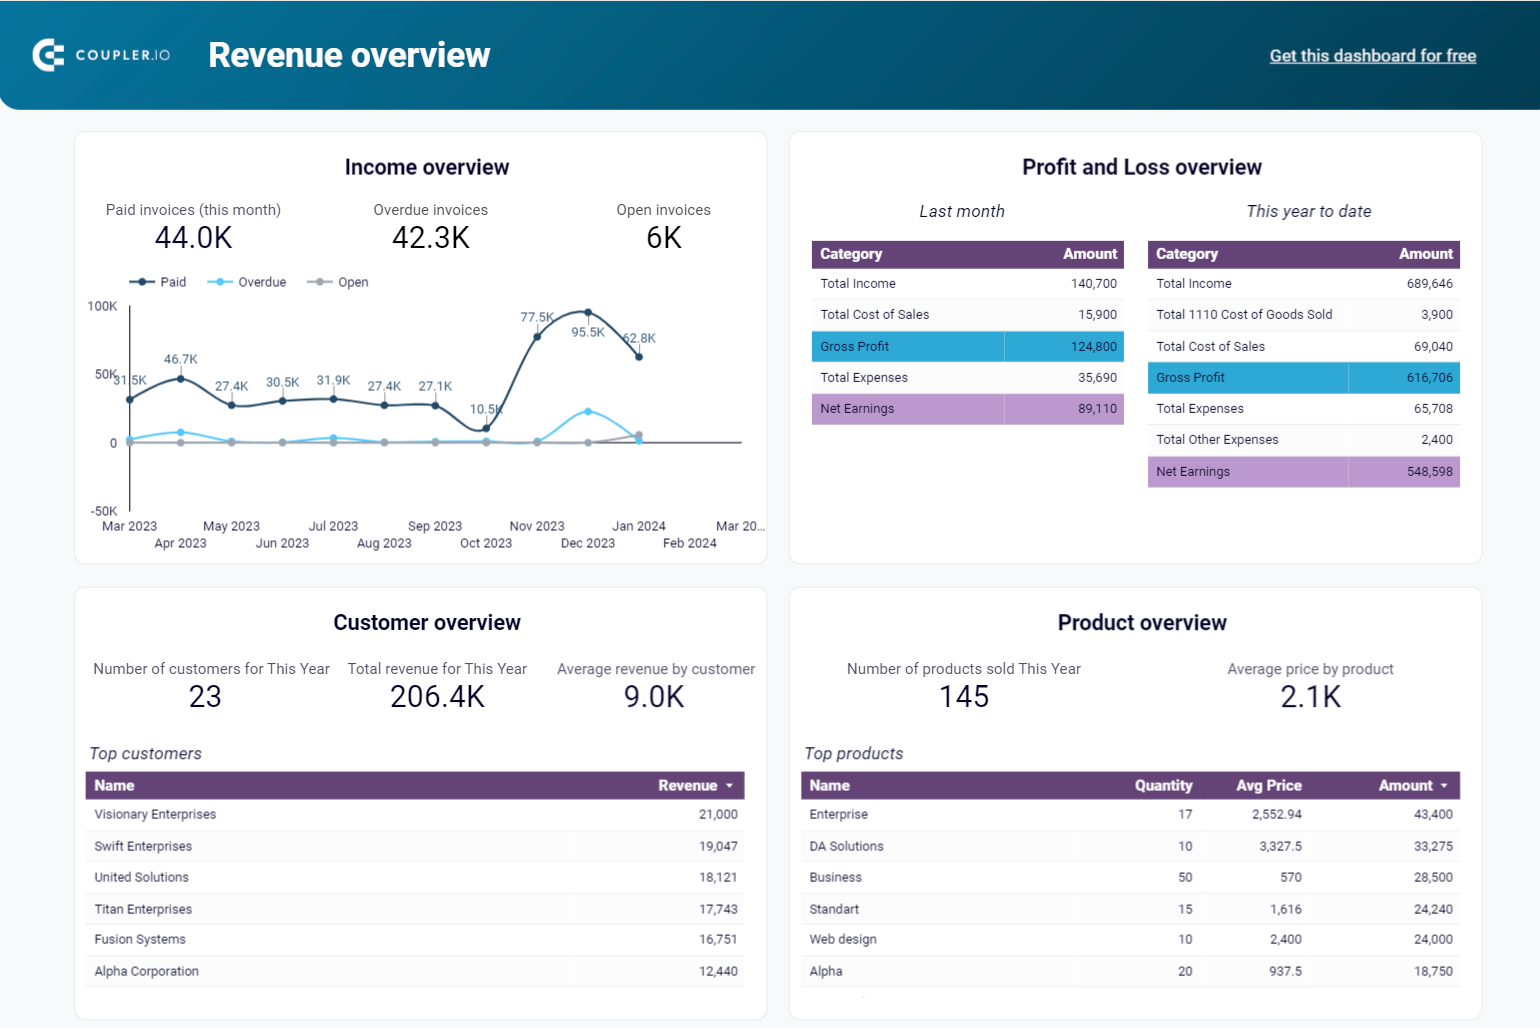
The revenue dashboard helps you monitor your income and expenses. It shows the revenue distribution by customers, aggregates key metrics, and displays top customers for your business.
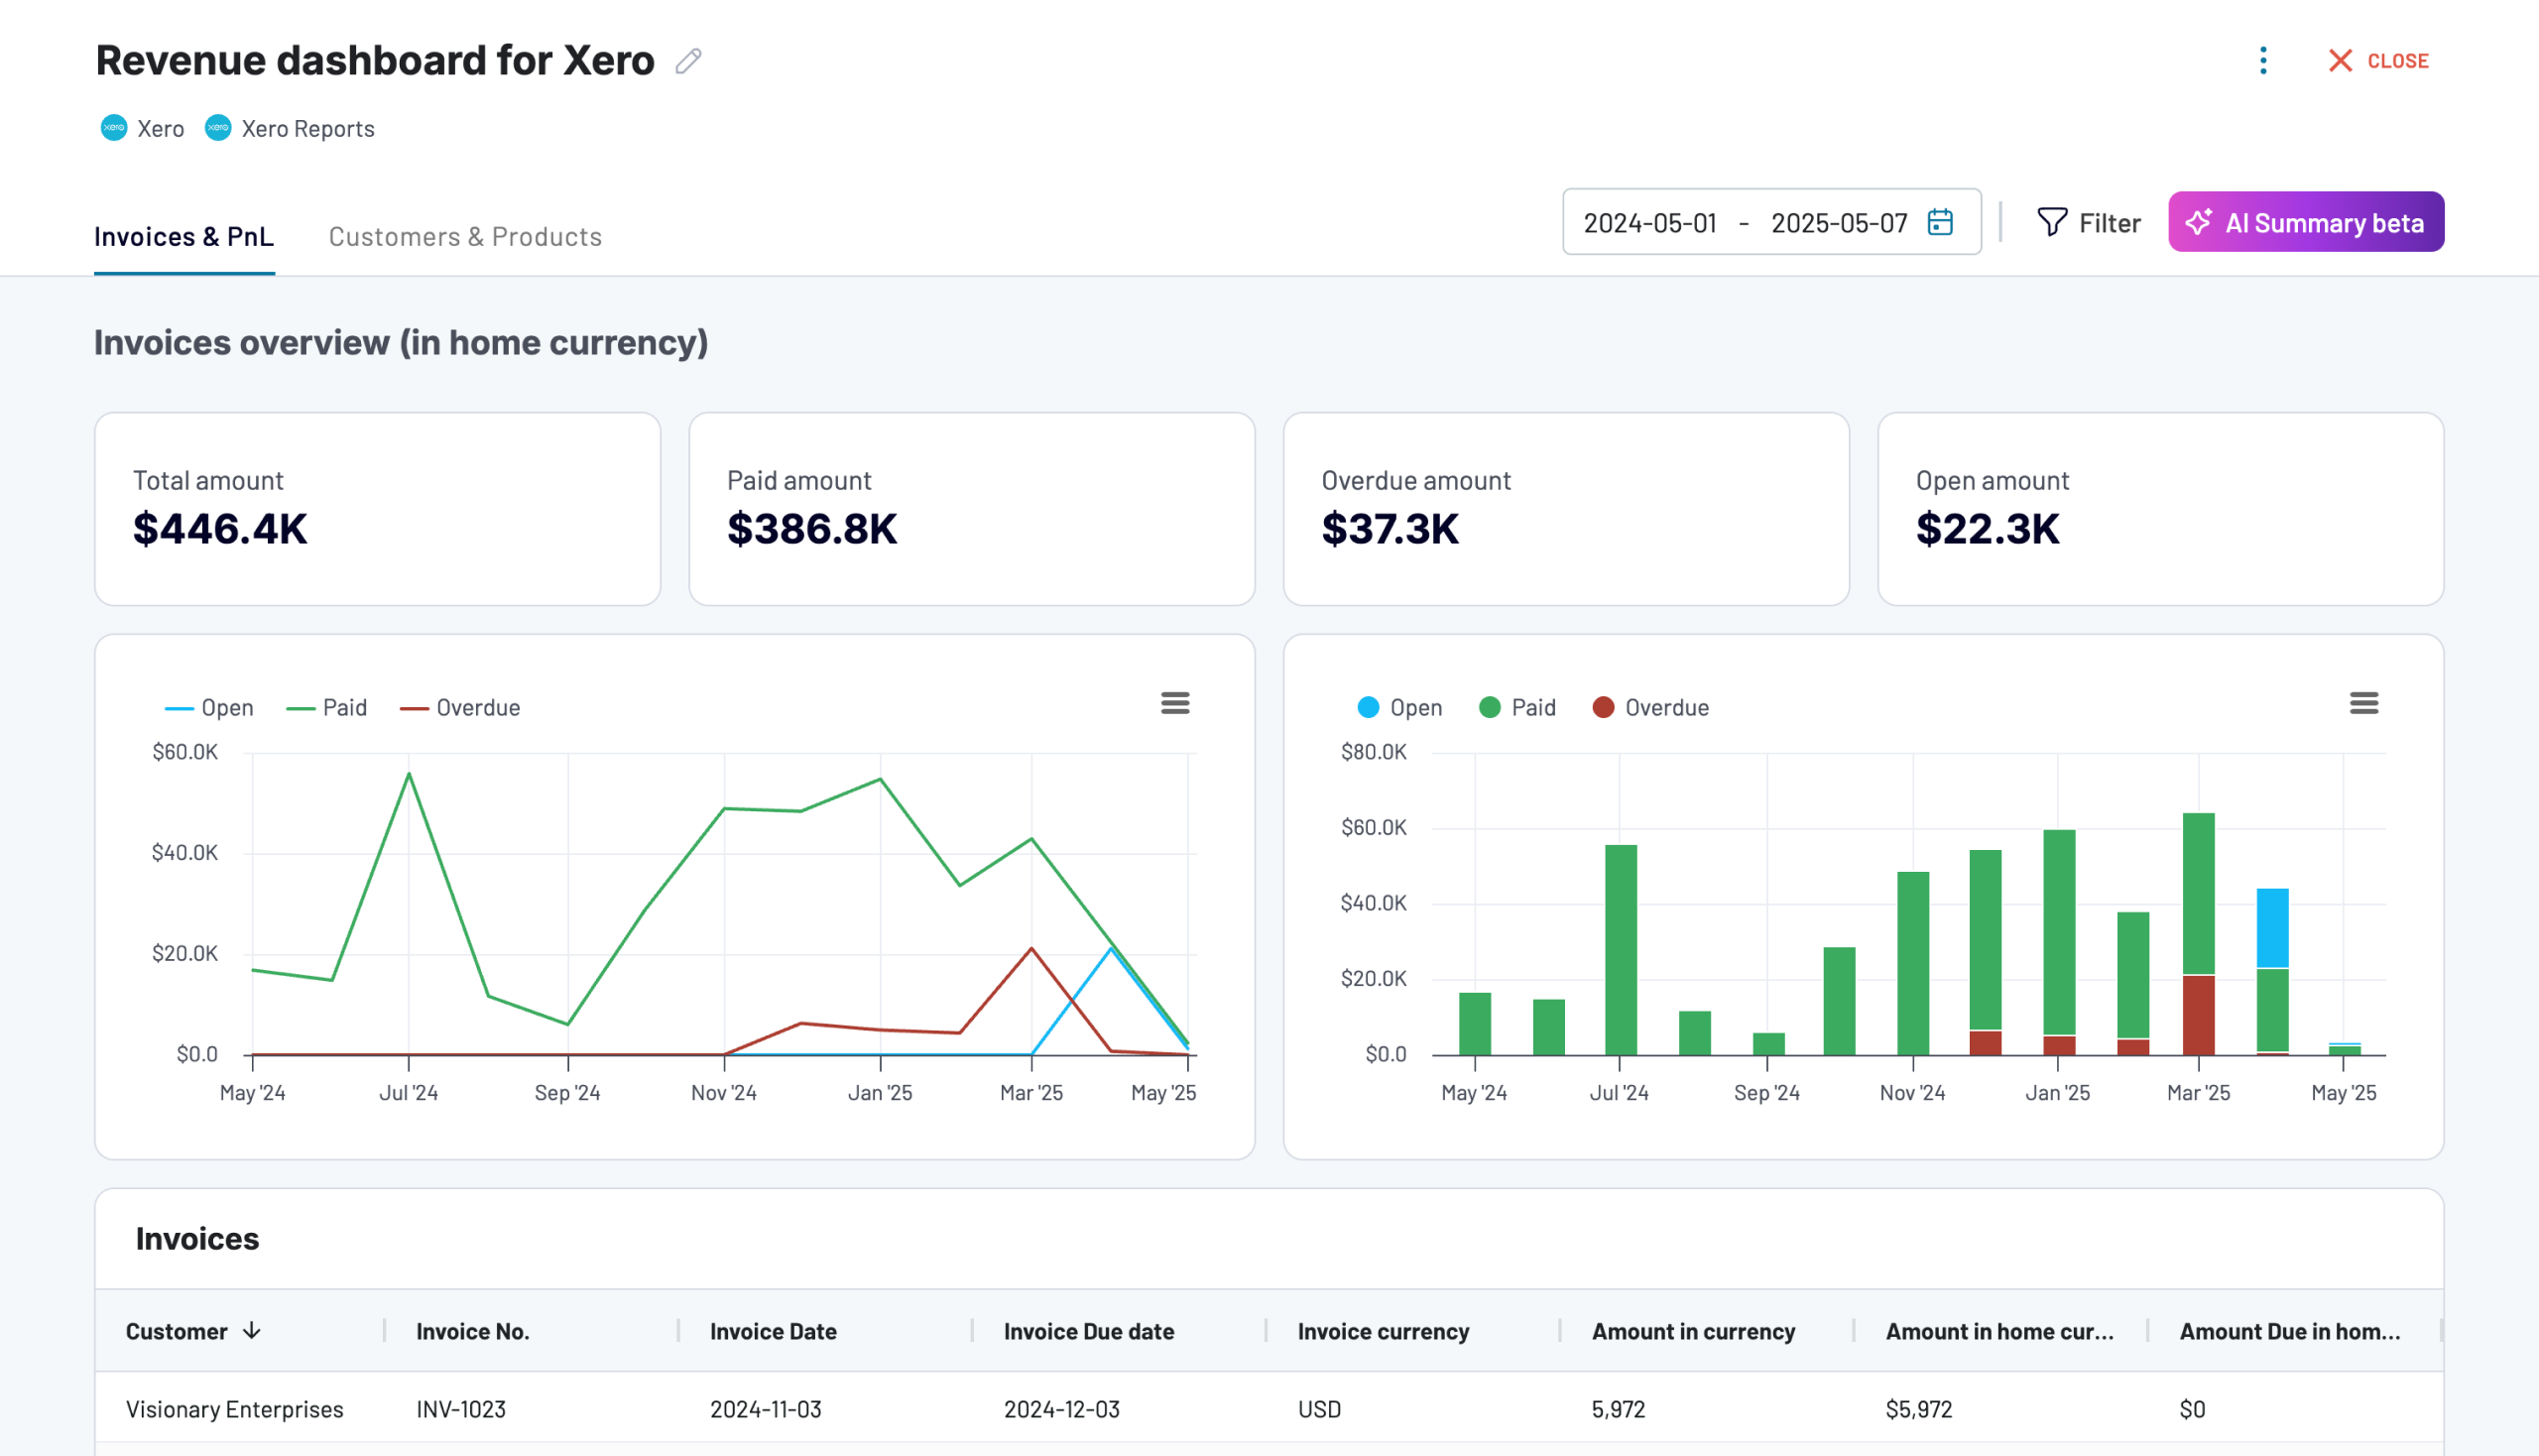
What reports the dashboard provides:
- Income overview: Track overall revenue trends for the last 12 months. Identify seasonal fluctuations, peak revenue periods, and any unexpected dips.
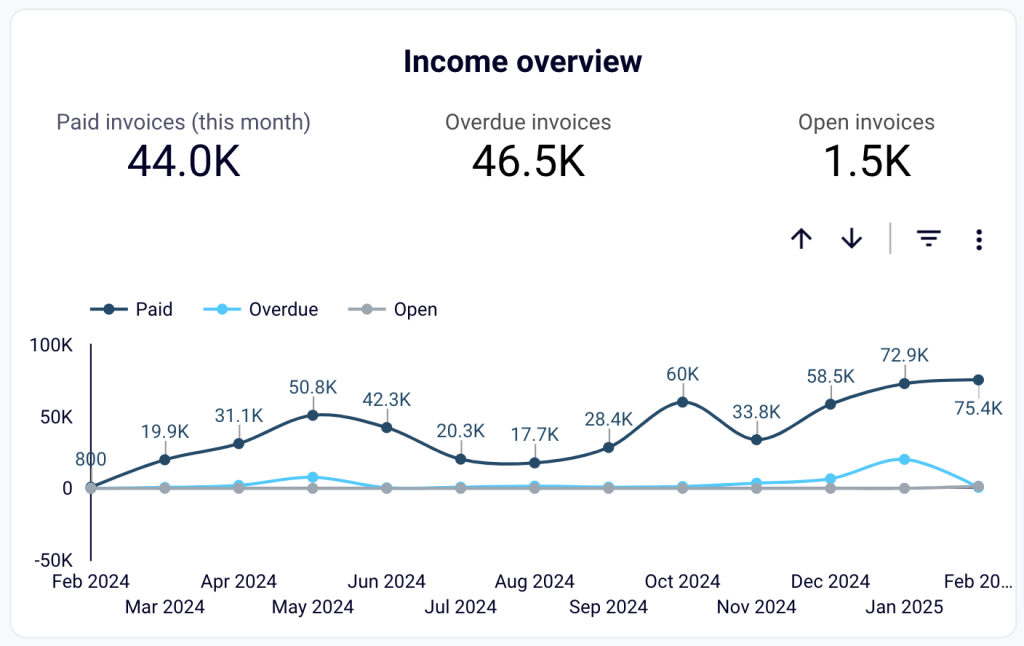
- Profit and loss overview: Compare revenue and expenses to gain insights into net income. Assess how well your business manages costs relative to income to support your budgeting and financial planning.
Explore other options for the Profit and Loss analysis in QuickBooks.
- Customer overview: See your most valuable customers by revenue contribution for targeted marketing efforts and retention strategies. For example, you can provide loyalty incentives for high-value customers.
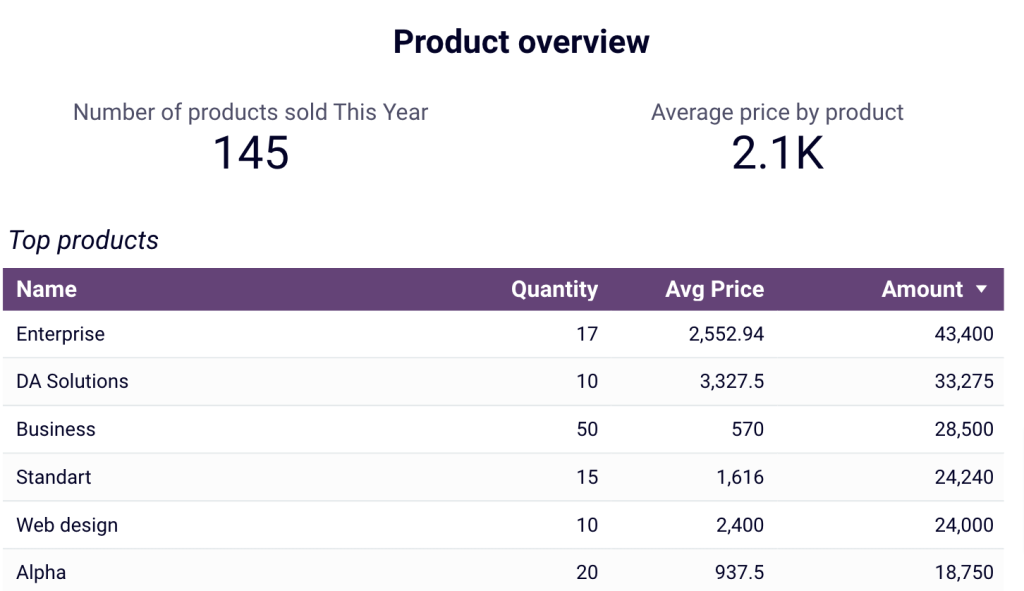
- Product overview: Figure out which products generate the most revenue. Based on this information, you can adjust your sales strategies based on the performance of high- or low-performing products.
The dashboard is available in Coupler.io and as a Looker Studio and Google Sheets template with a built-in Xero connector.
At the same time, you can use the QuickBooks dashboard available in Coupler.io and as a template in Google Sheets, Looker Studio, and Power BI. Learn more about using Power BI for accounting reporting.
Navigate to the Readme tab inside the chosen template to set up the dashboard according to step-by-step instructions.

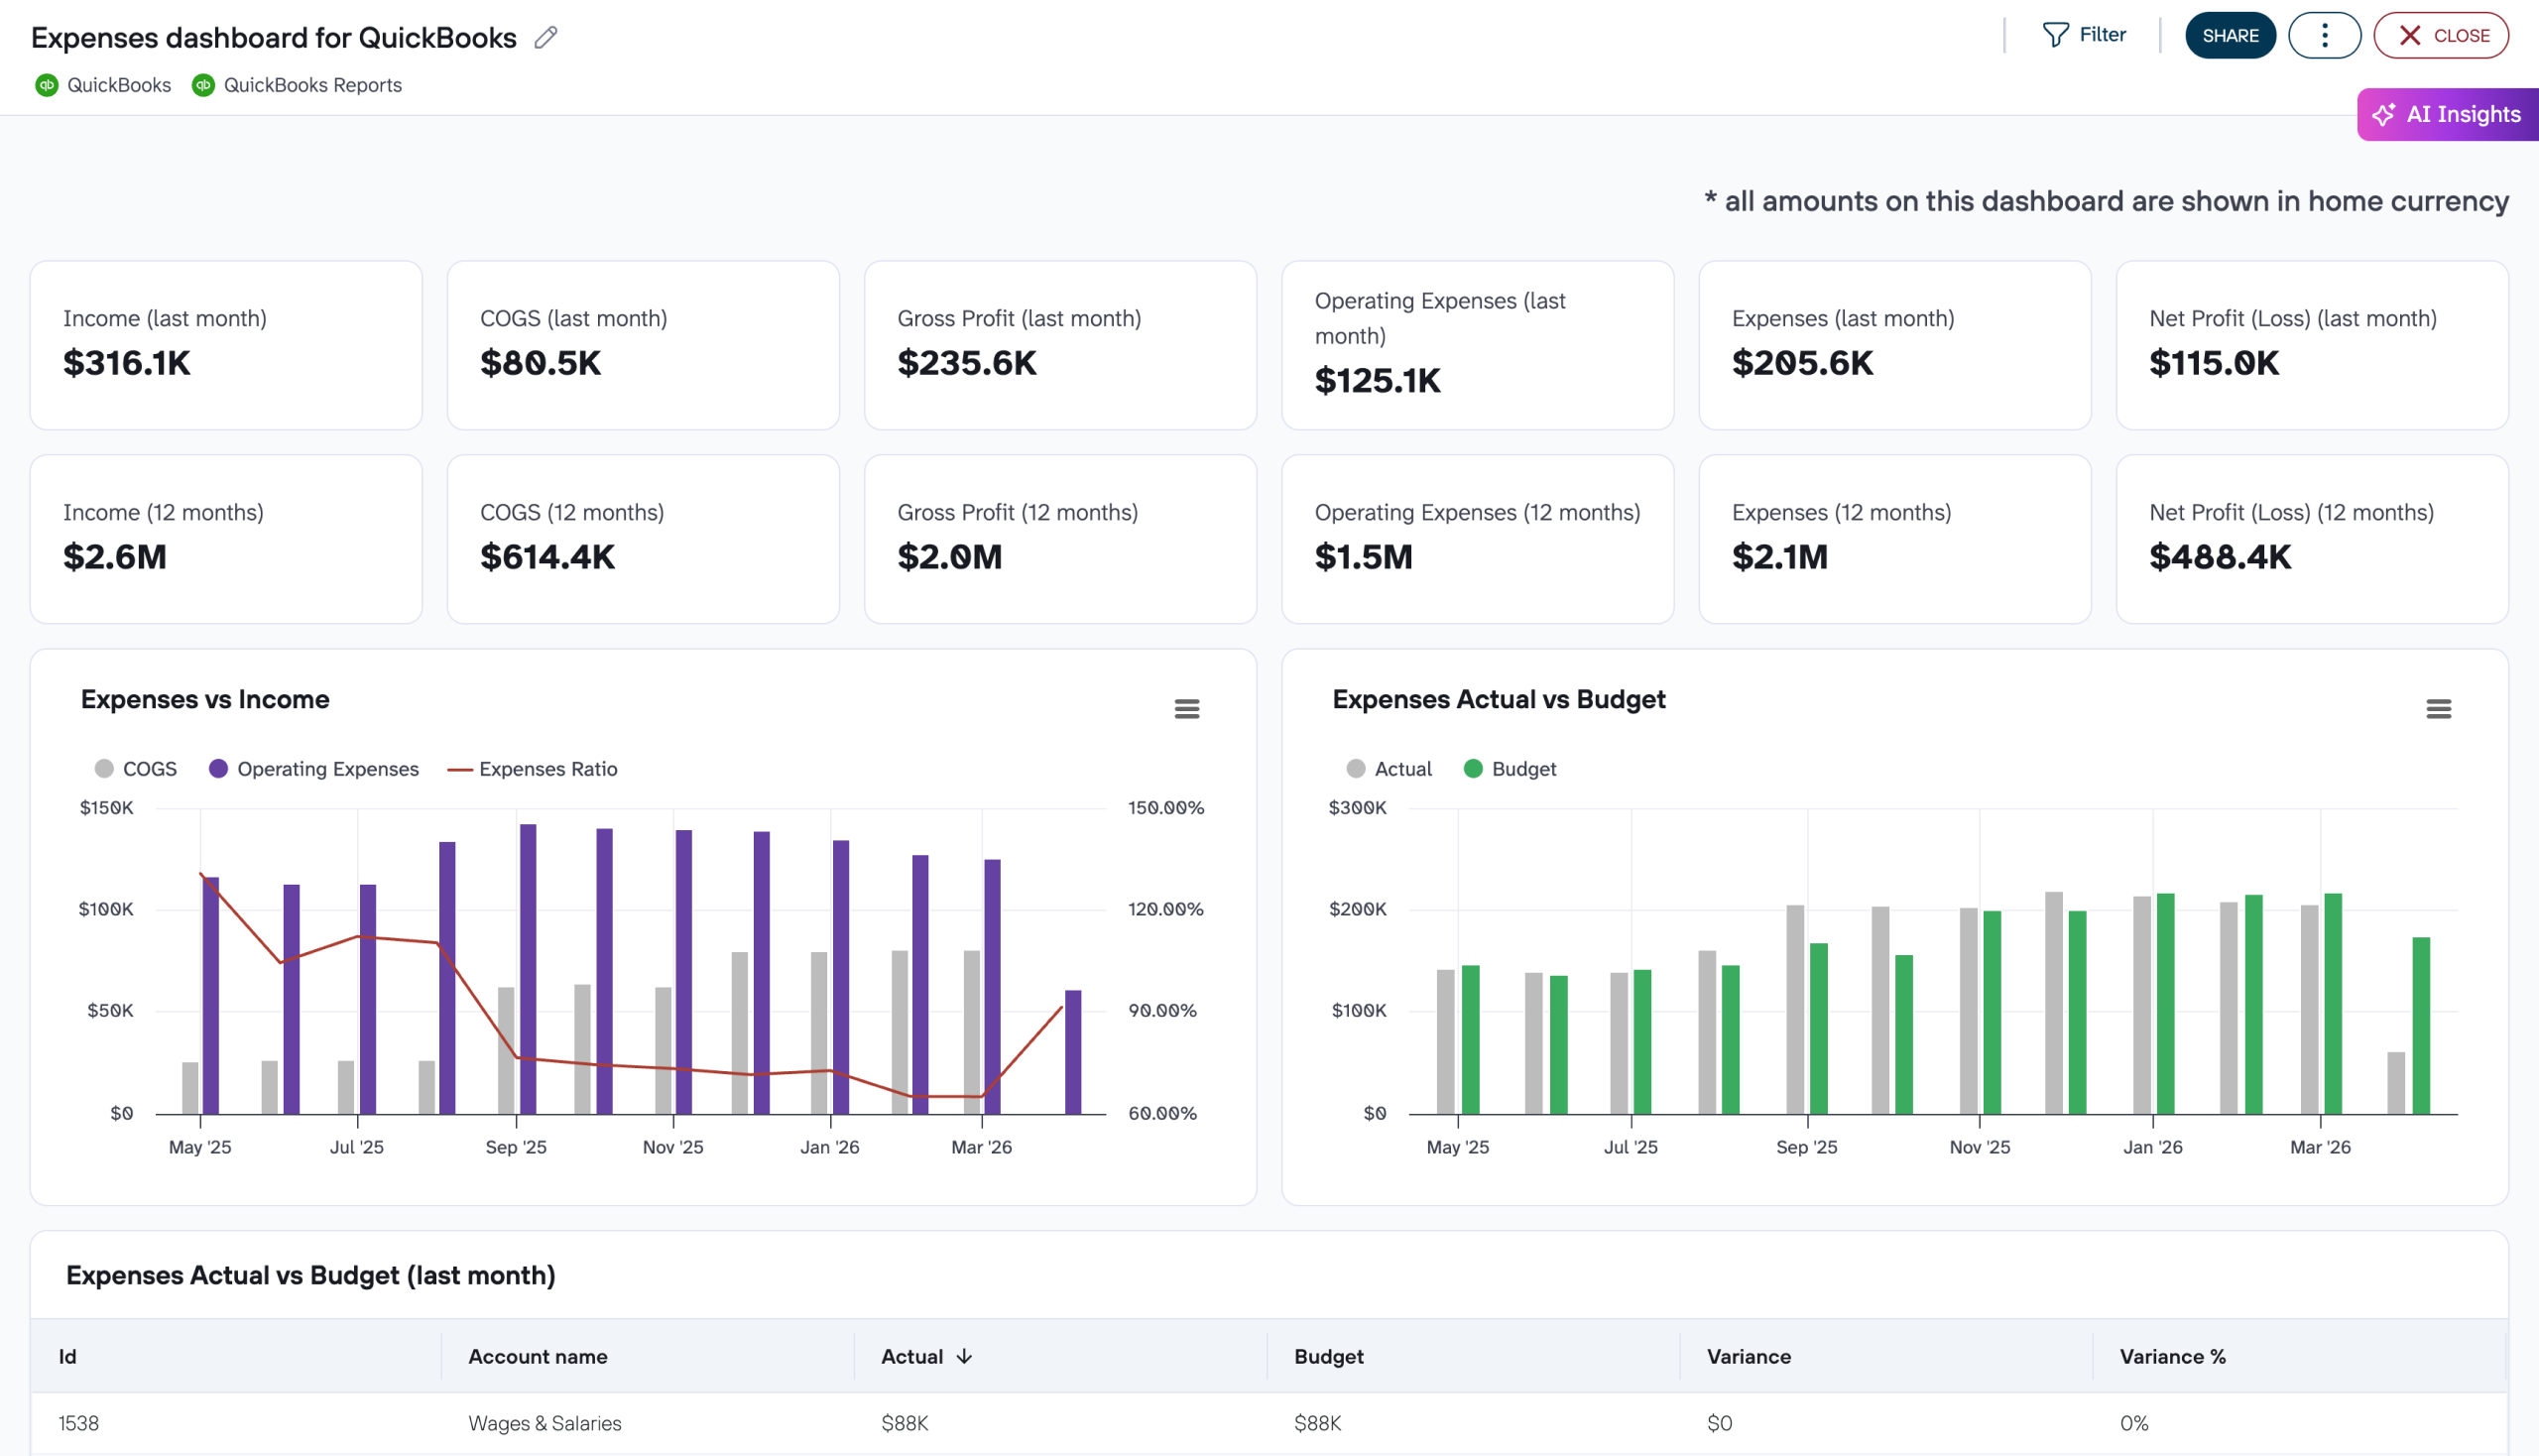
Expenses dashboard for QuickBooks
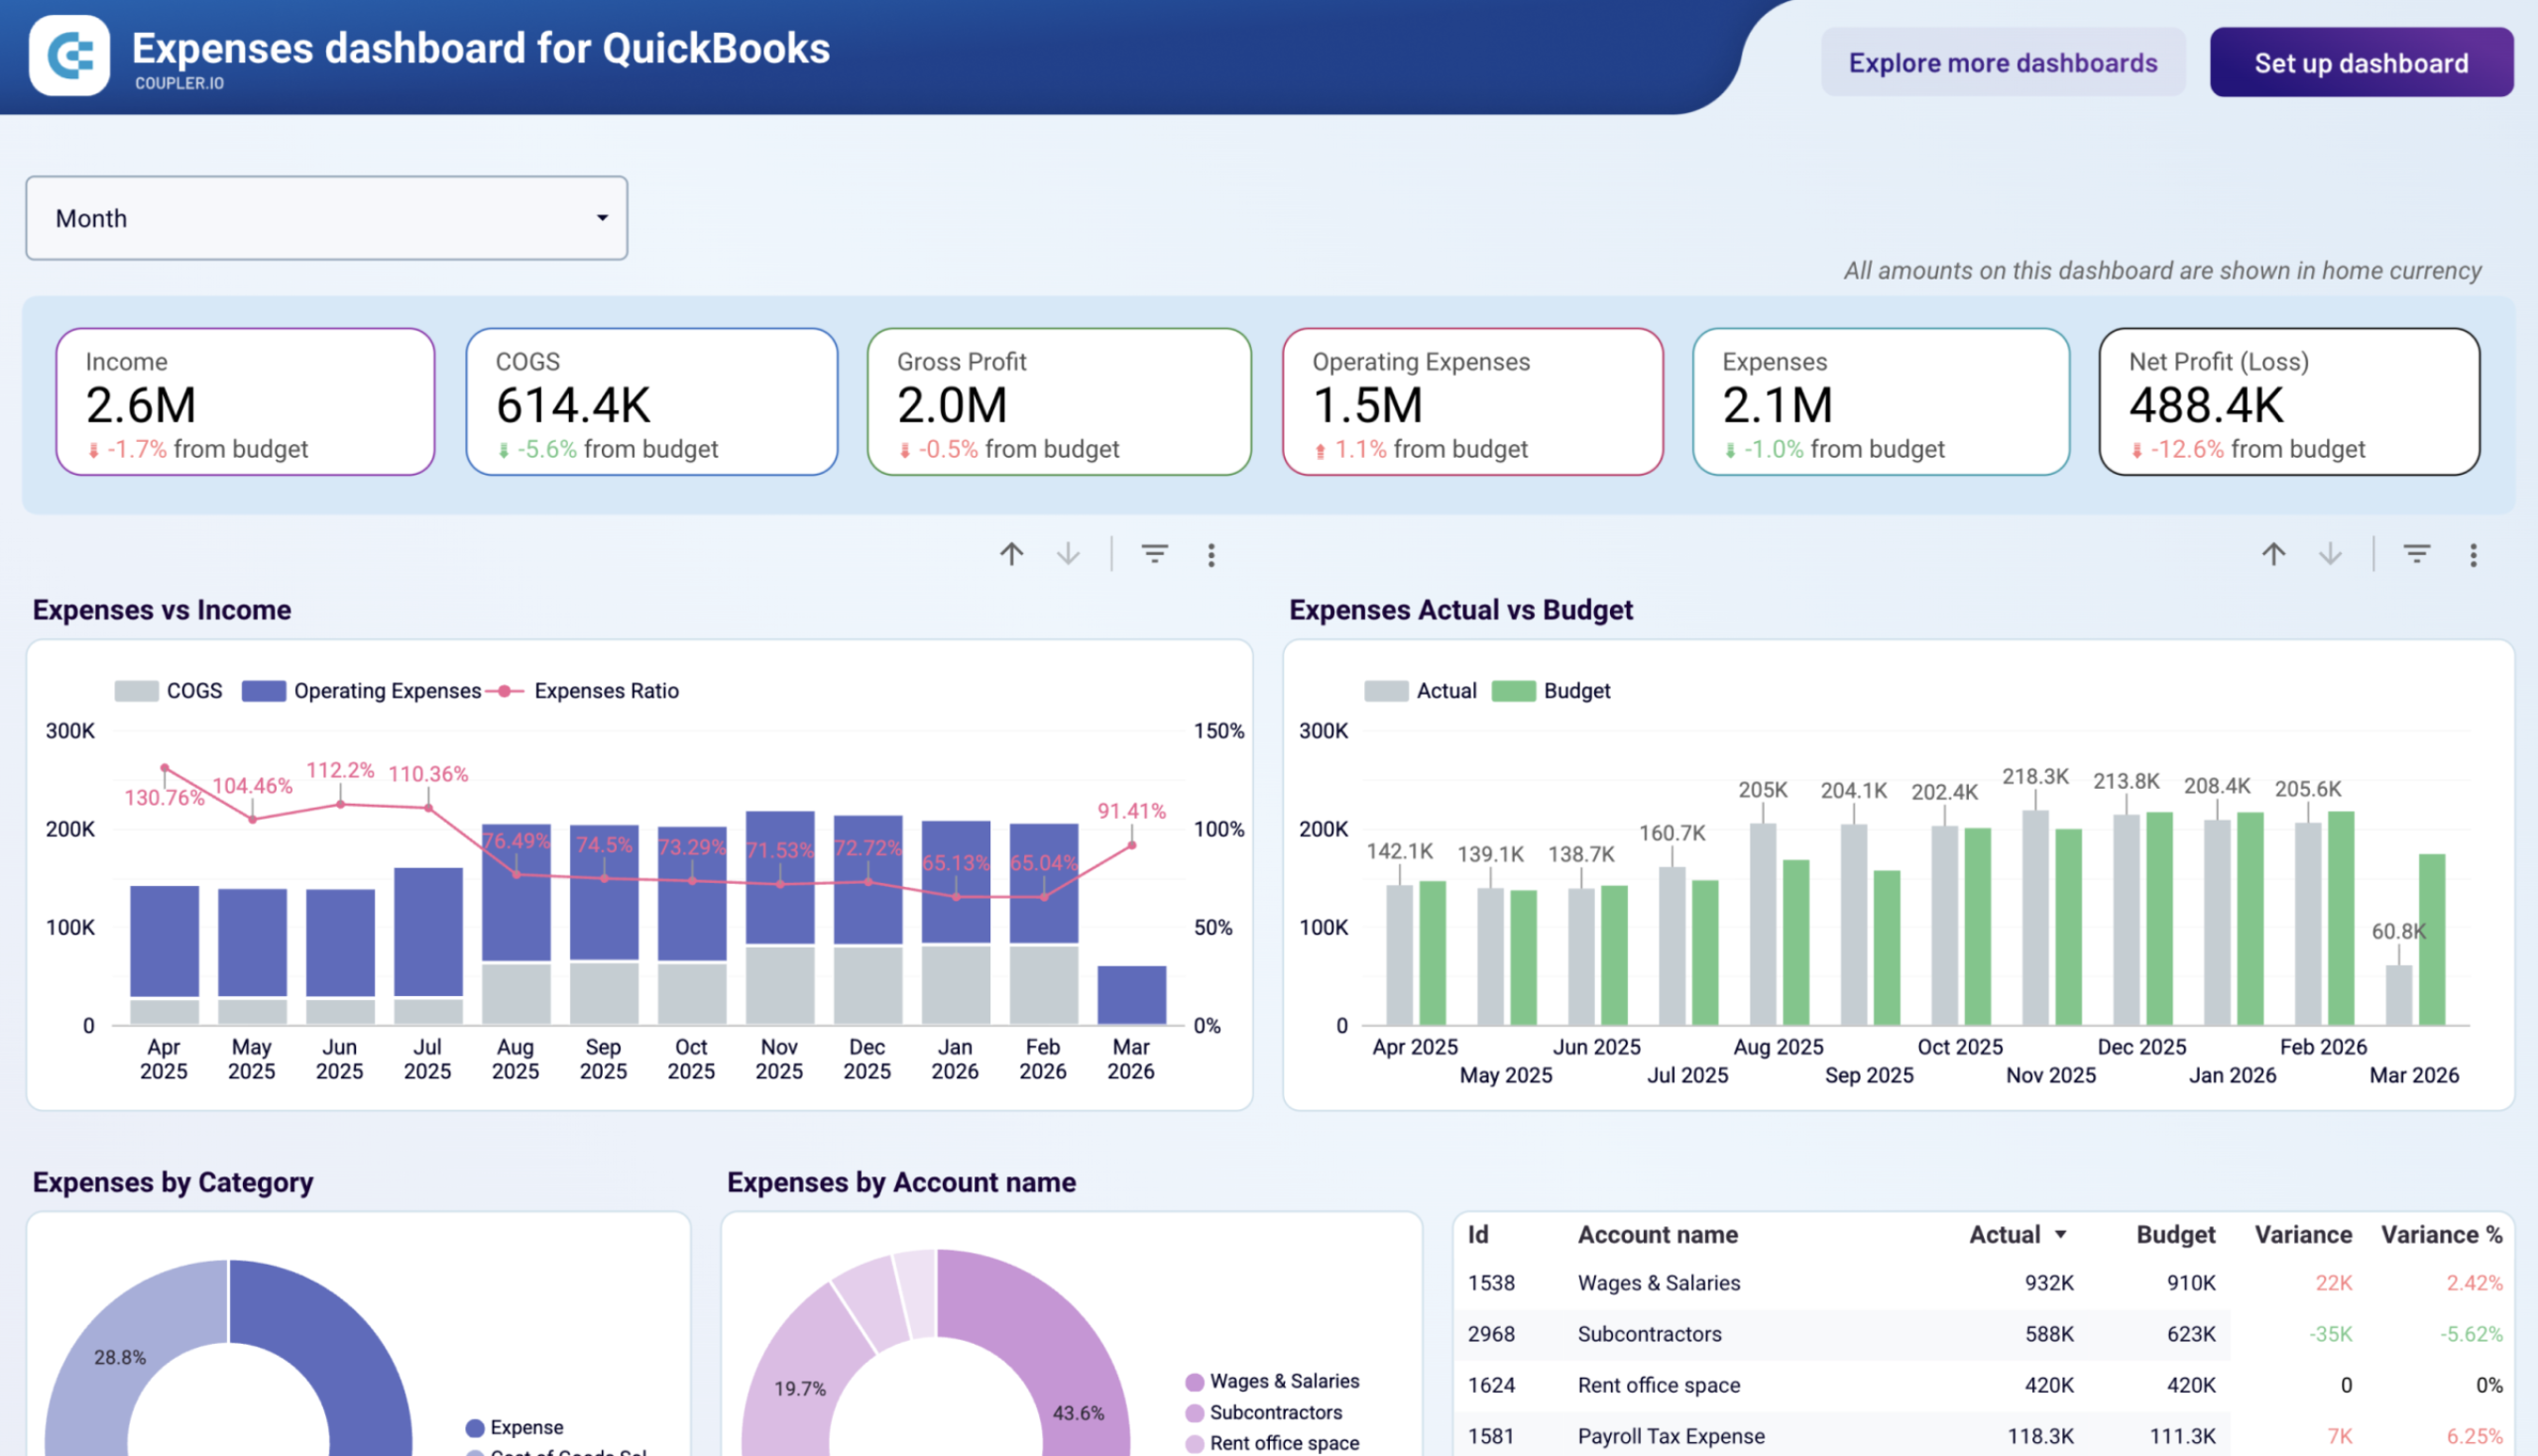
Variance analysis (comparing actual financial results against budget) is one of the five core methods of financial performance analysis. The Expenses dashboard for QuickBooks by Coupler.io is built specifically for this: it connects to your QuickBooks account and surfaces actual costs alongside budget targets, so you can see where the gap opened, by how much, and in which accounts.
Expenses dashboard for QuickBooks
 Preview dashboard
Expenses dashboard for QuickBooks
Preview dashboardHere’s what you’ll learn using this dashboard:
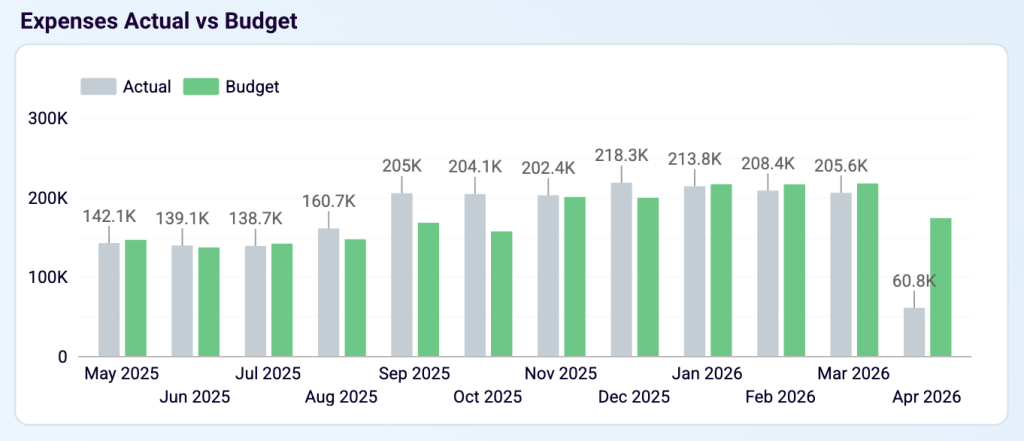
- Expenses actual vs budget: See month-by-month whether the business is running over or under plan, and whether variances are narrowing or widening over the reporting period.
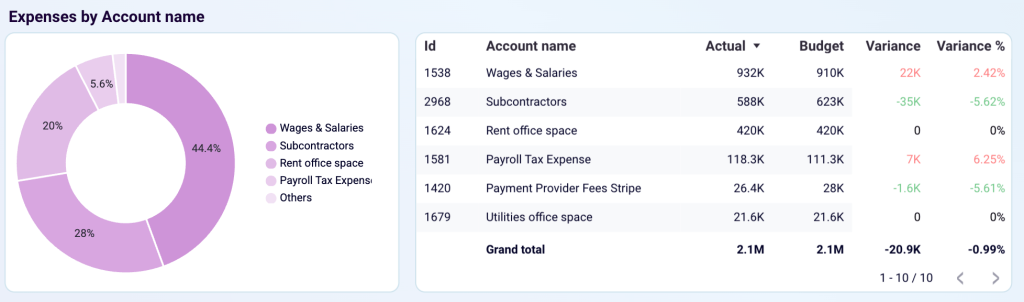
- Account-level variance breakdown: The Expenses by Account name table shows actual spend, budget, and both absolute and percentage variance per account (the detail needed to pinpoint exactly which lines drove an overrun).
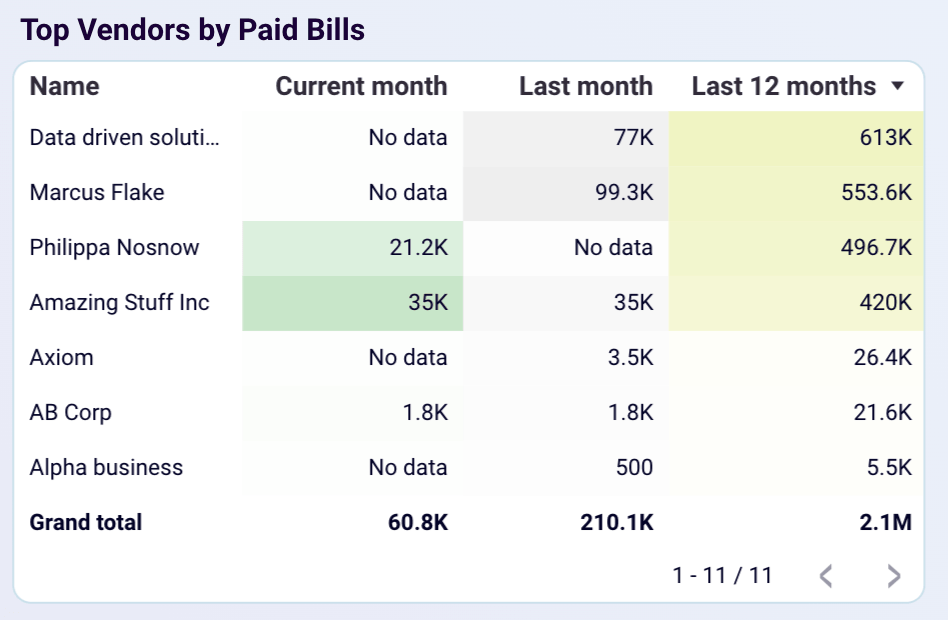
- Top vendors by paid bills: A ranked table shows supplier spend for the current month, last month, and the trailing 12 months.
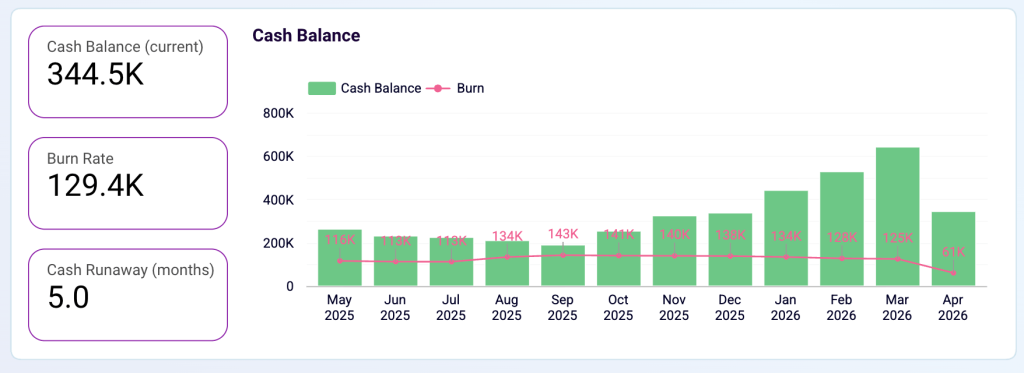
- Cash balance and runway: KPI cards show current cash, monthly burn rate, and months of runway remaining, so cost decisions can be made with liquidity in view.
The dashboard is available as a Looker Studio template with a built-in Coupler.io connector. Or you can use it right in Coupler.io, which is faster and enhanced with AI insights.
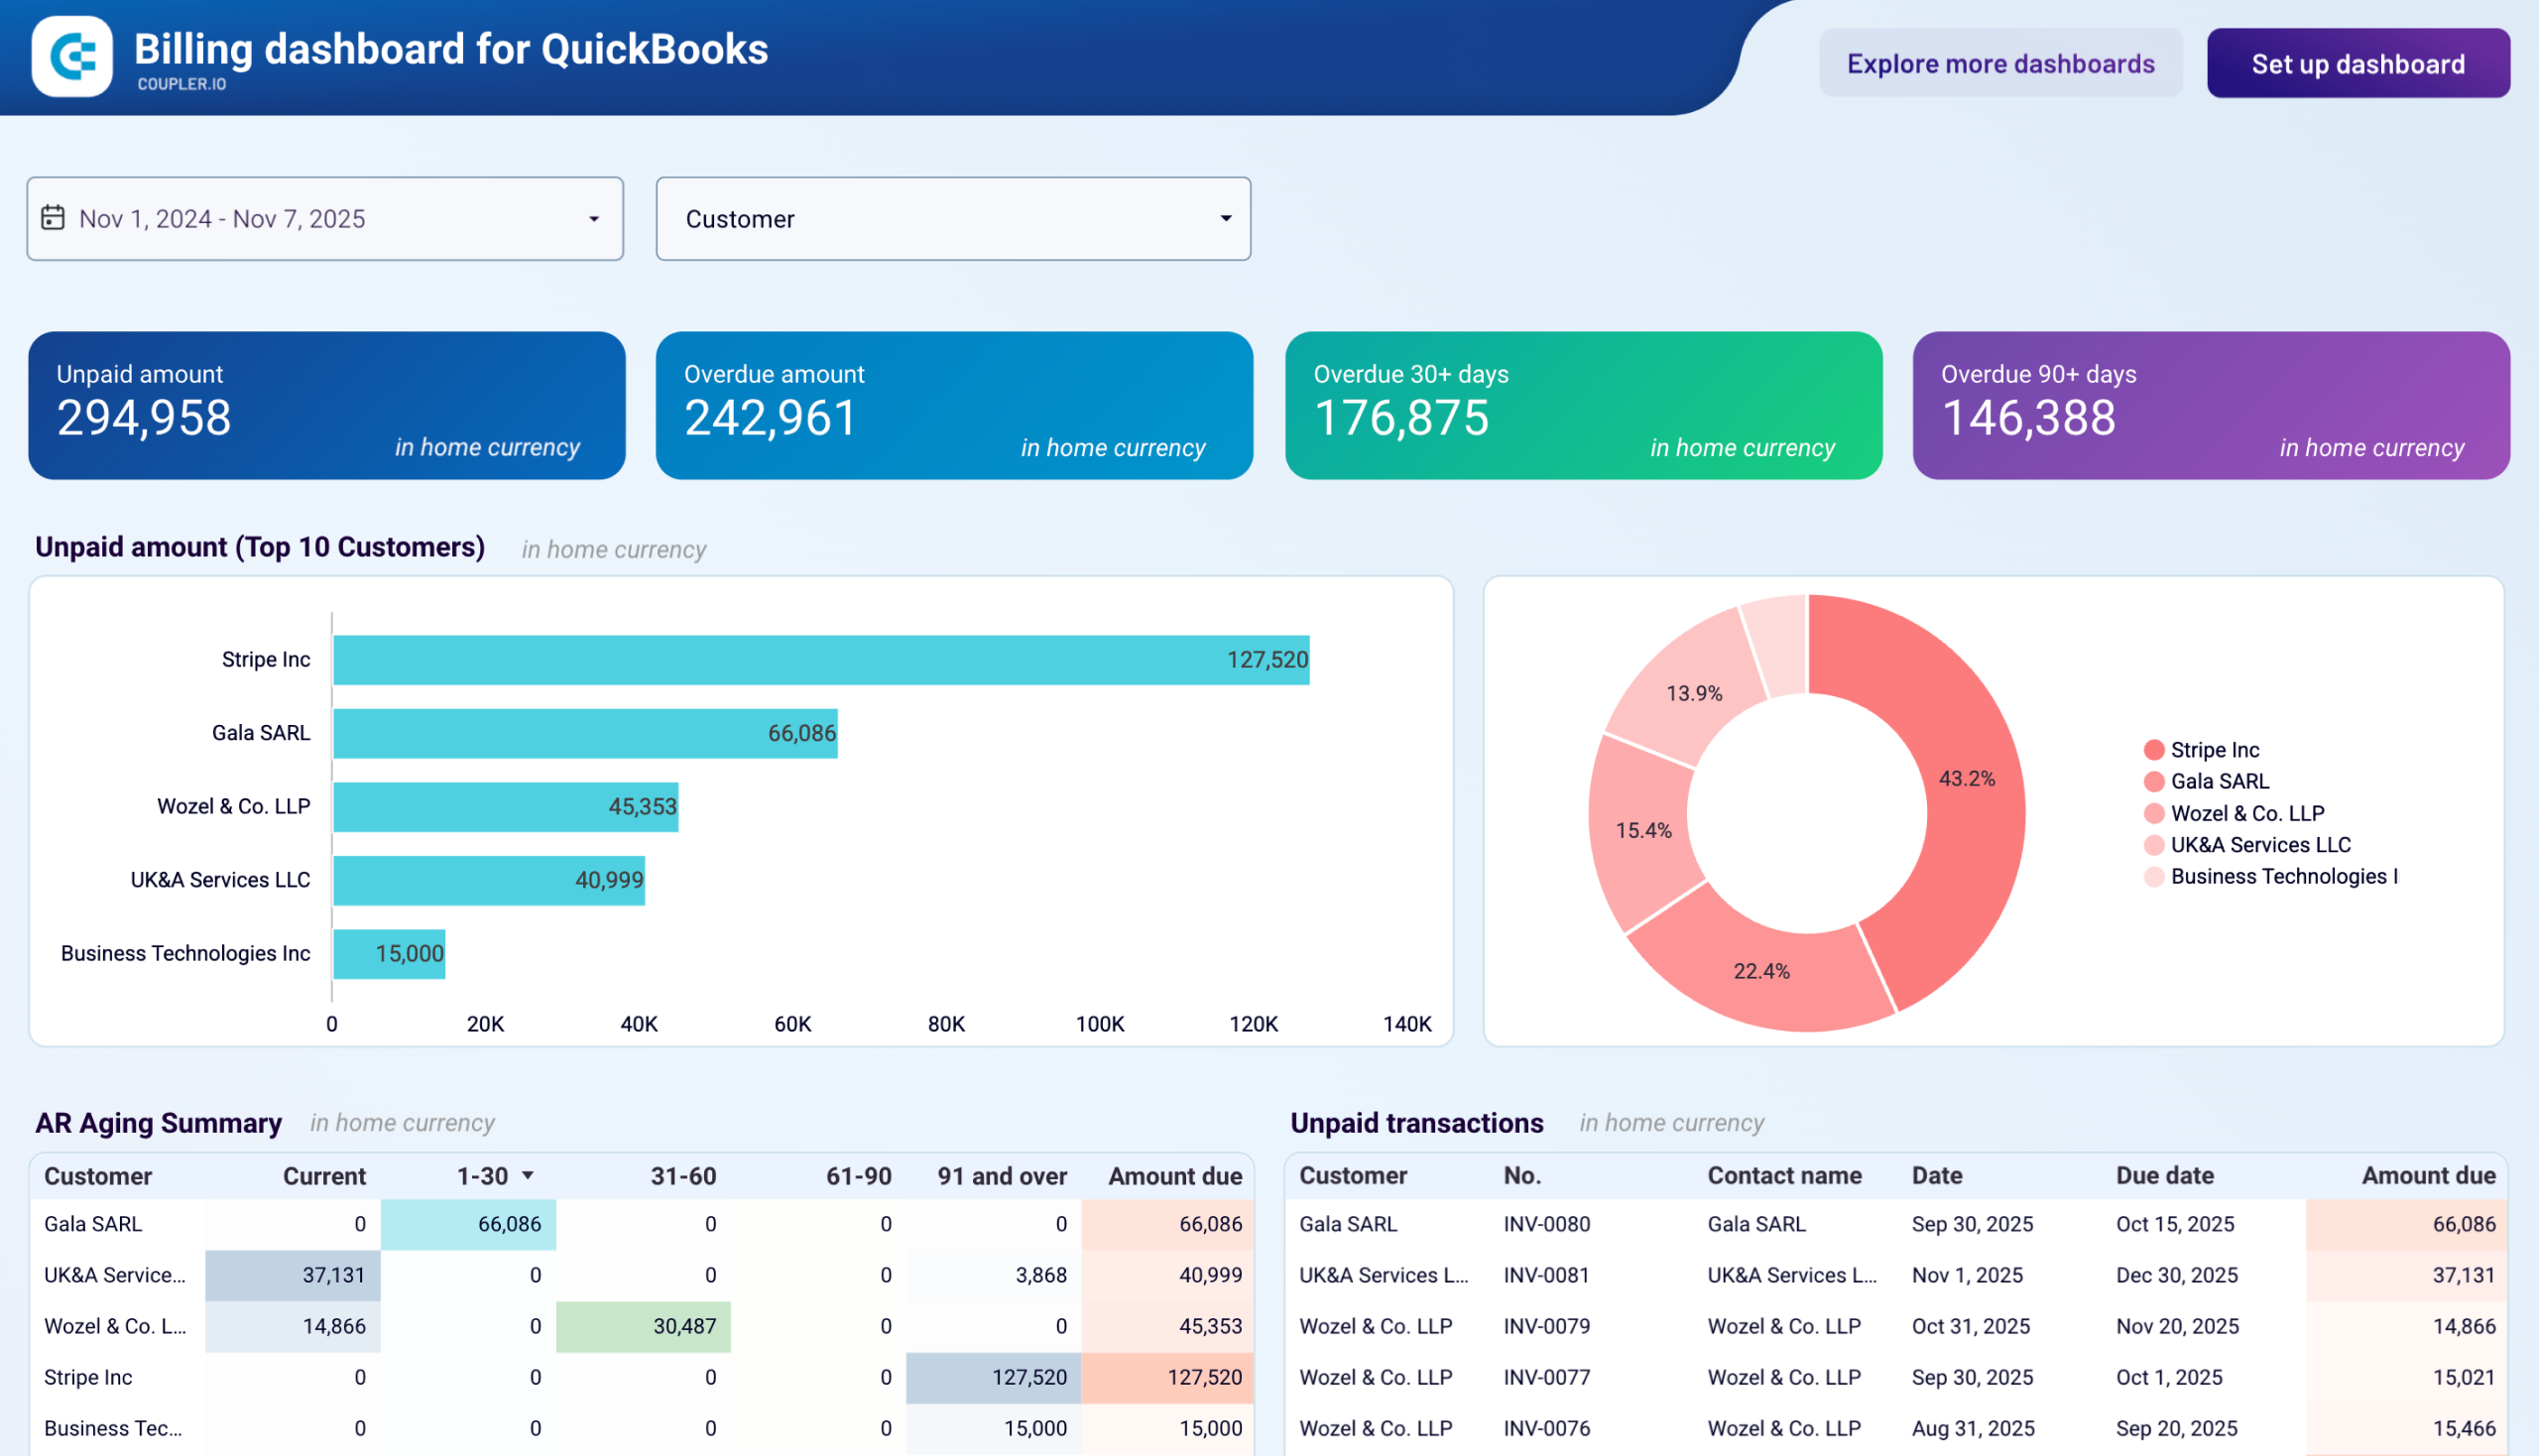
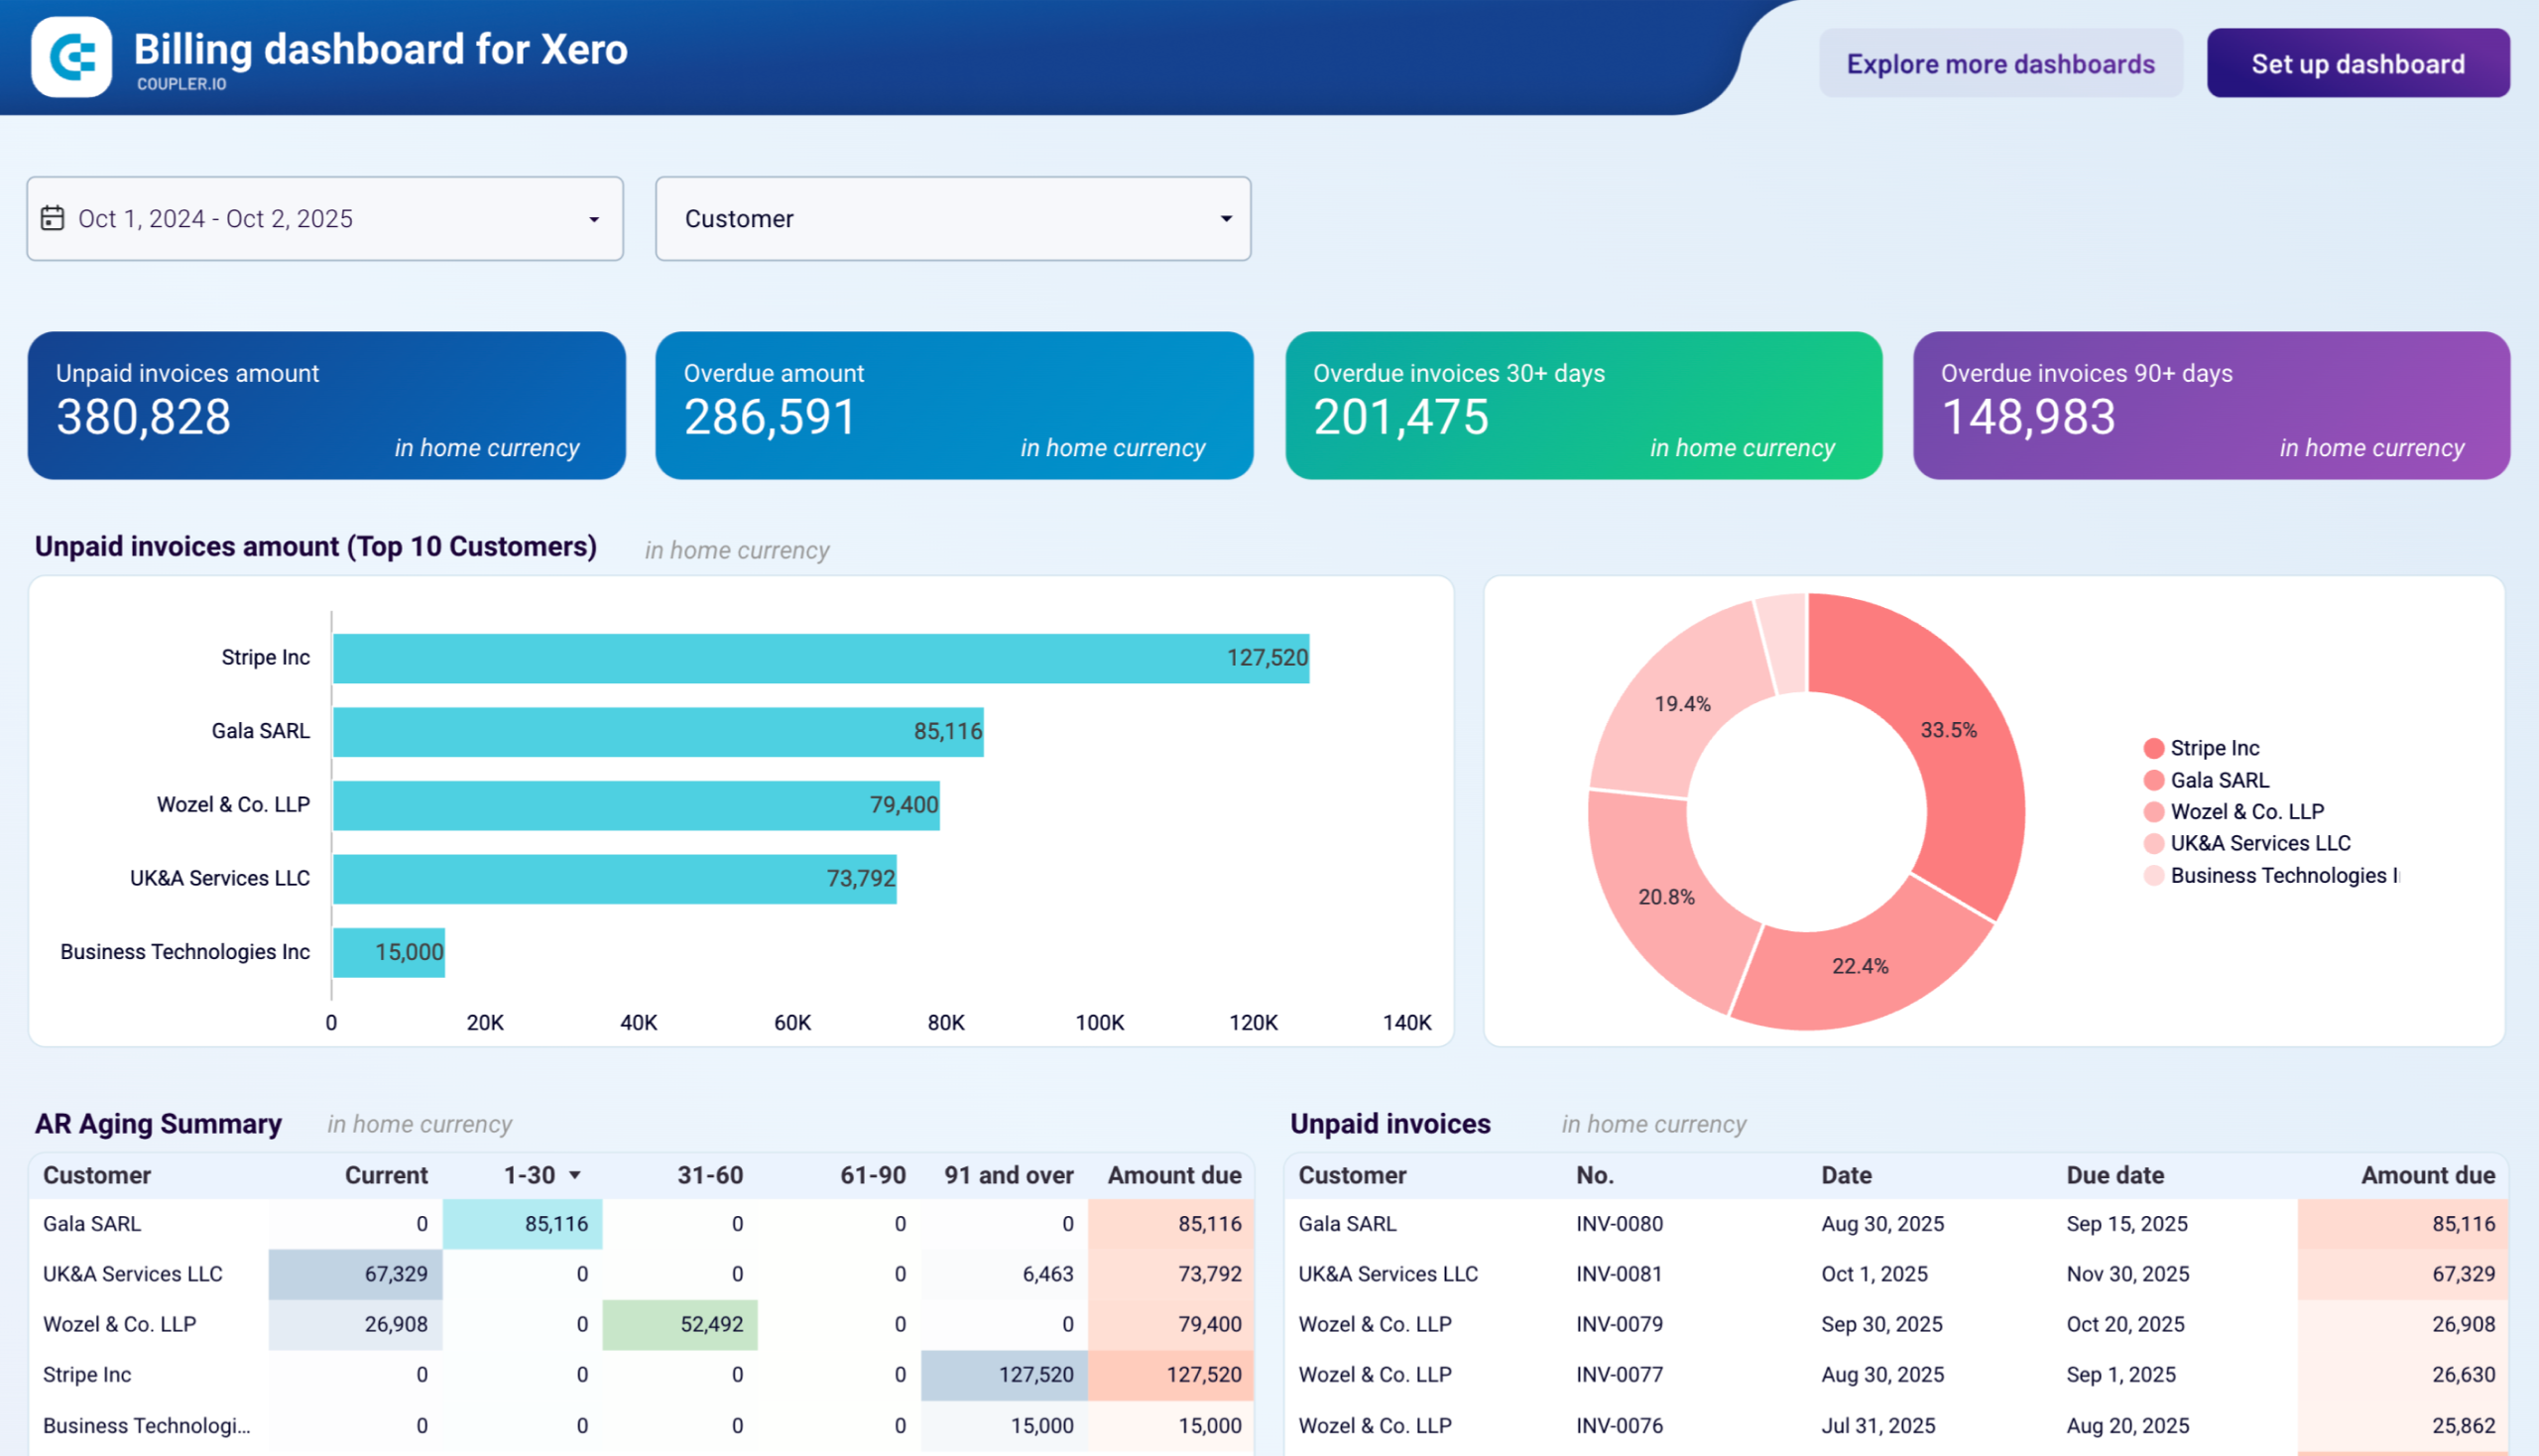
Billing dashboard for QuickBooks/Xero
The billing dashboard consolidates accounts receivable and accounts payable into one interface. This is helpful to understand how customer payments and vendor obligations interact to impact working capital. This unified view reveals timing mismatches between collections and disbursements that can create cash flow challenges even when your business is profitable.
Billing dashboard for QuickBooks
 Preview dashboard
Billing dashboard for QuickBooks
Preview dashboardUse this dashboard to gain the following insights:
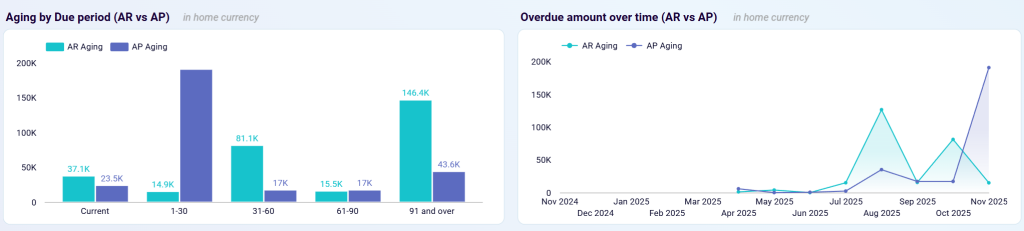
Cash flow timing analysis across receivables and payables: Compare the aging structure of incoming payments against outgoing obligations to identify potential cash flow gaps. The Aging by Due Period chart presents AR and AP side-by-side across identical time periods, making synchronization issues immediately visible. Track whether you’re collecting from customers faster or slower than you’re paying vendors to anticipate liquidity challenges.
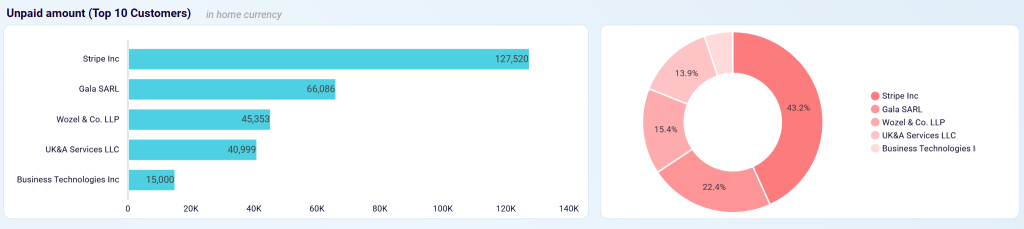
Outstanding invoice tracking with customer concentration analysis: Monitor total unpaid amounts alongside overdue balances categorized by aging periods. The top 10 customers bar chart displays outstanding balances in descending order, while the pie chart shows each customer’s share of total receivables, revealing concentration patterns. Assess which accounts require immediate attention and understand the concentration of your receivables risk.
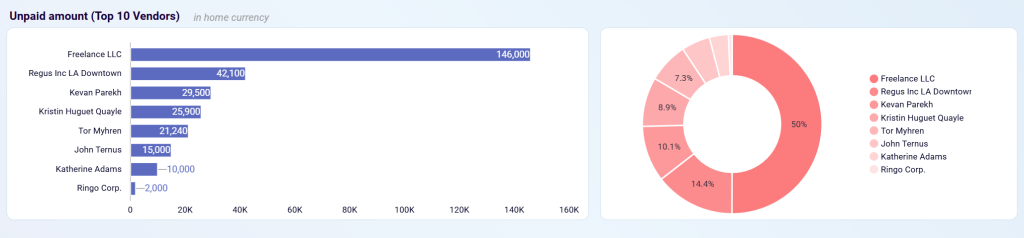
Vendor payment obligation overview with spend concentration: Track total amounts owed to vendors with breakdowns by overdue status and aging periods. The top 10 vendors bar chart ranks suppliers by unpaid amounts, while the pie chart displays percentage distribution of total payables. Identify which vendors represent your largest payment obligations and understand vendor spending distribution across your supplier base.
The dashboard is designed in Looker Studio and available as a template with a built-in Coupler.io connector for QuickBooks or Xero. Choose the version you need and follow the instructions to connect your accounting software account and populate the dashboard with your data.
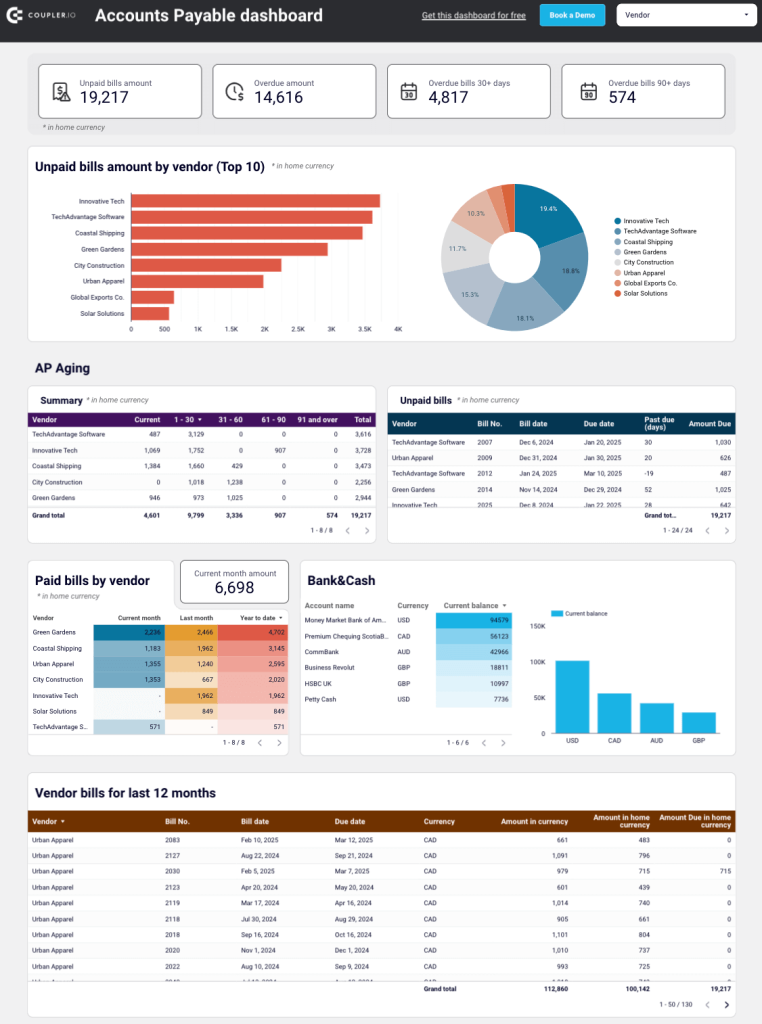
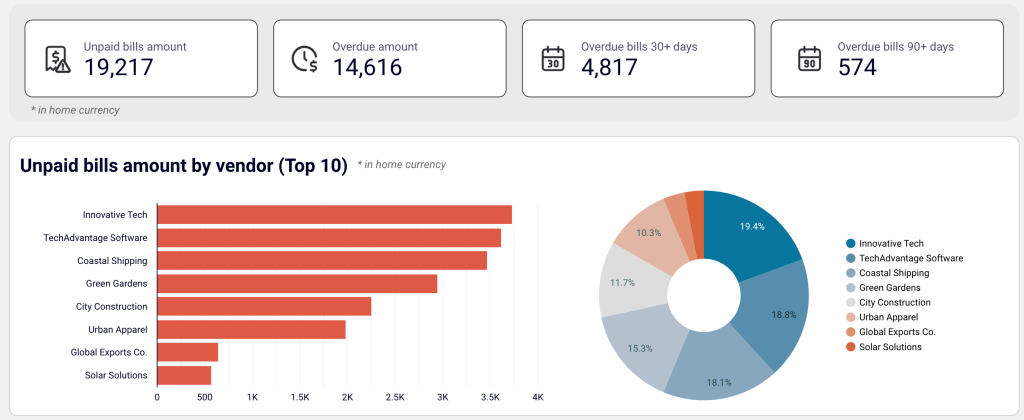
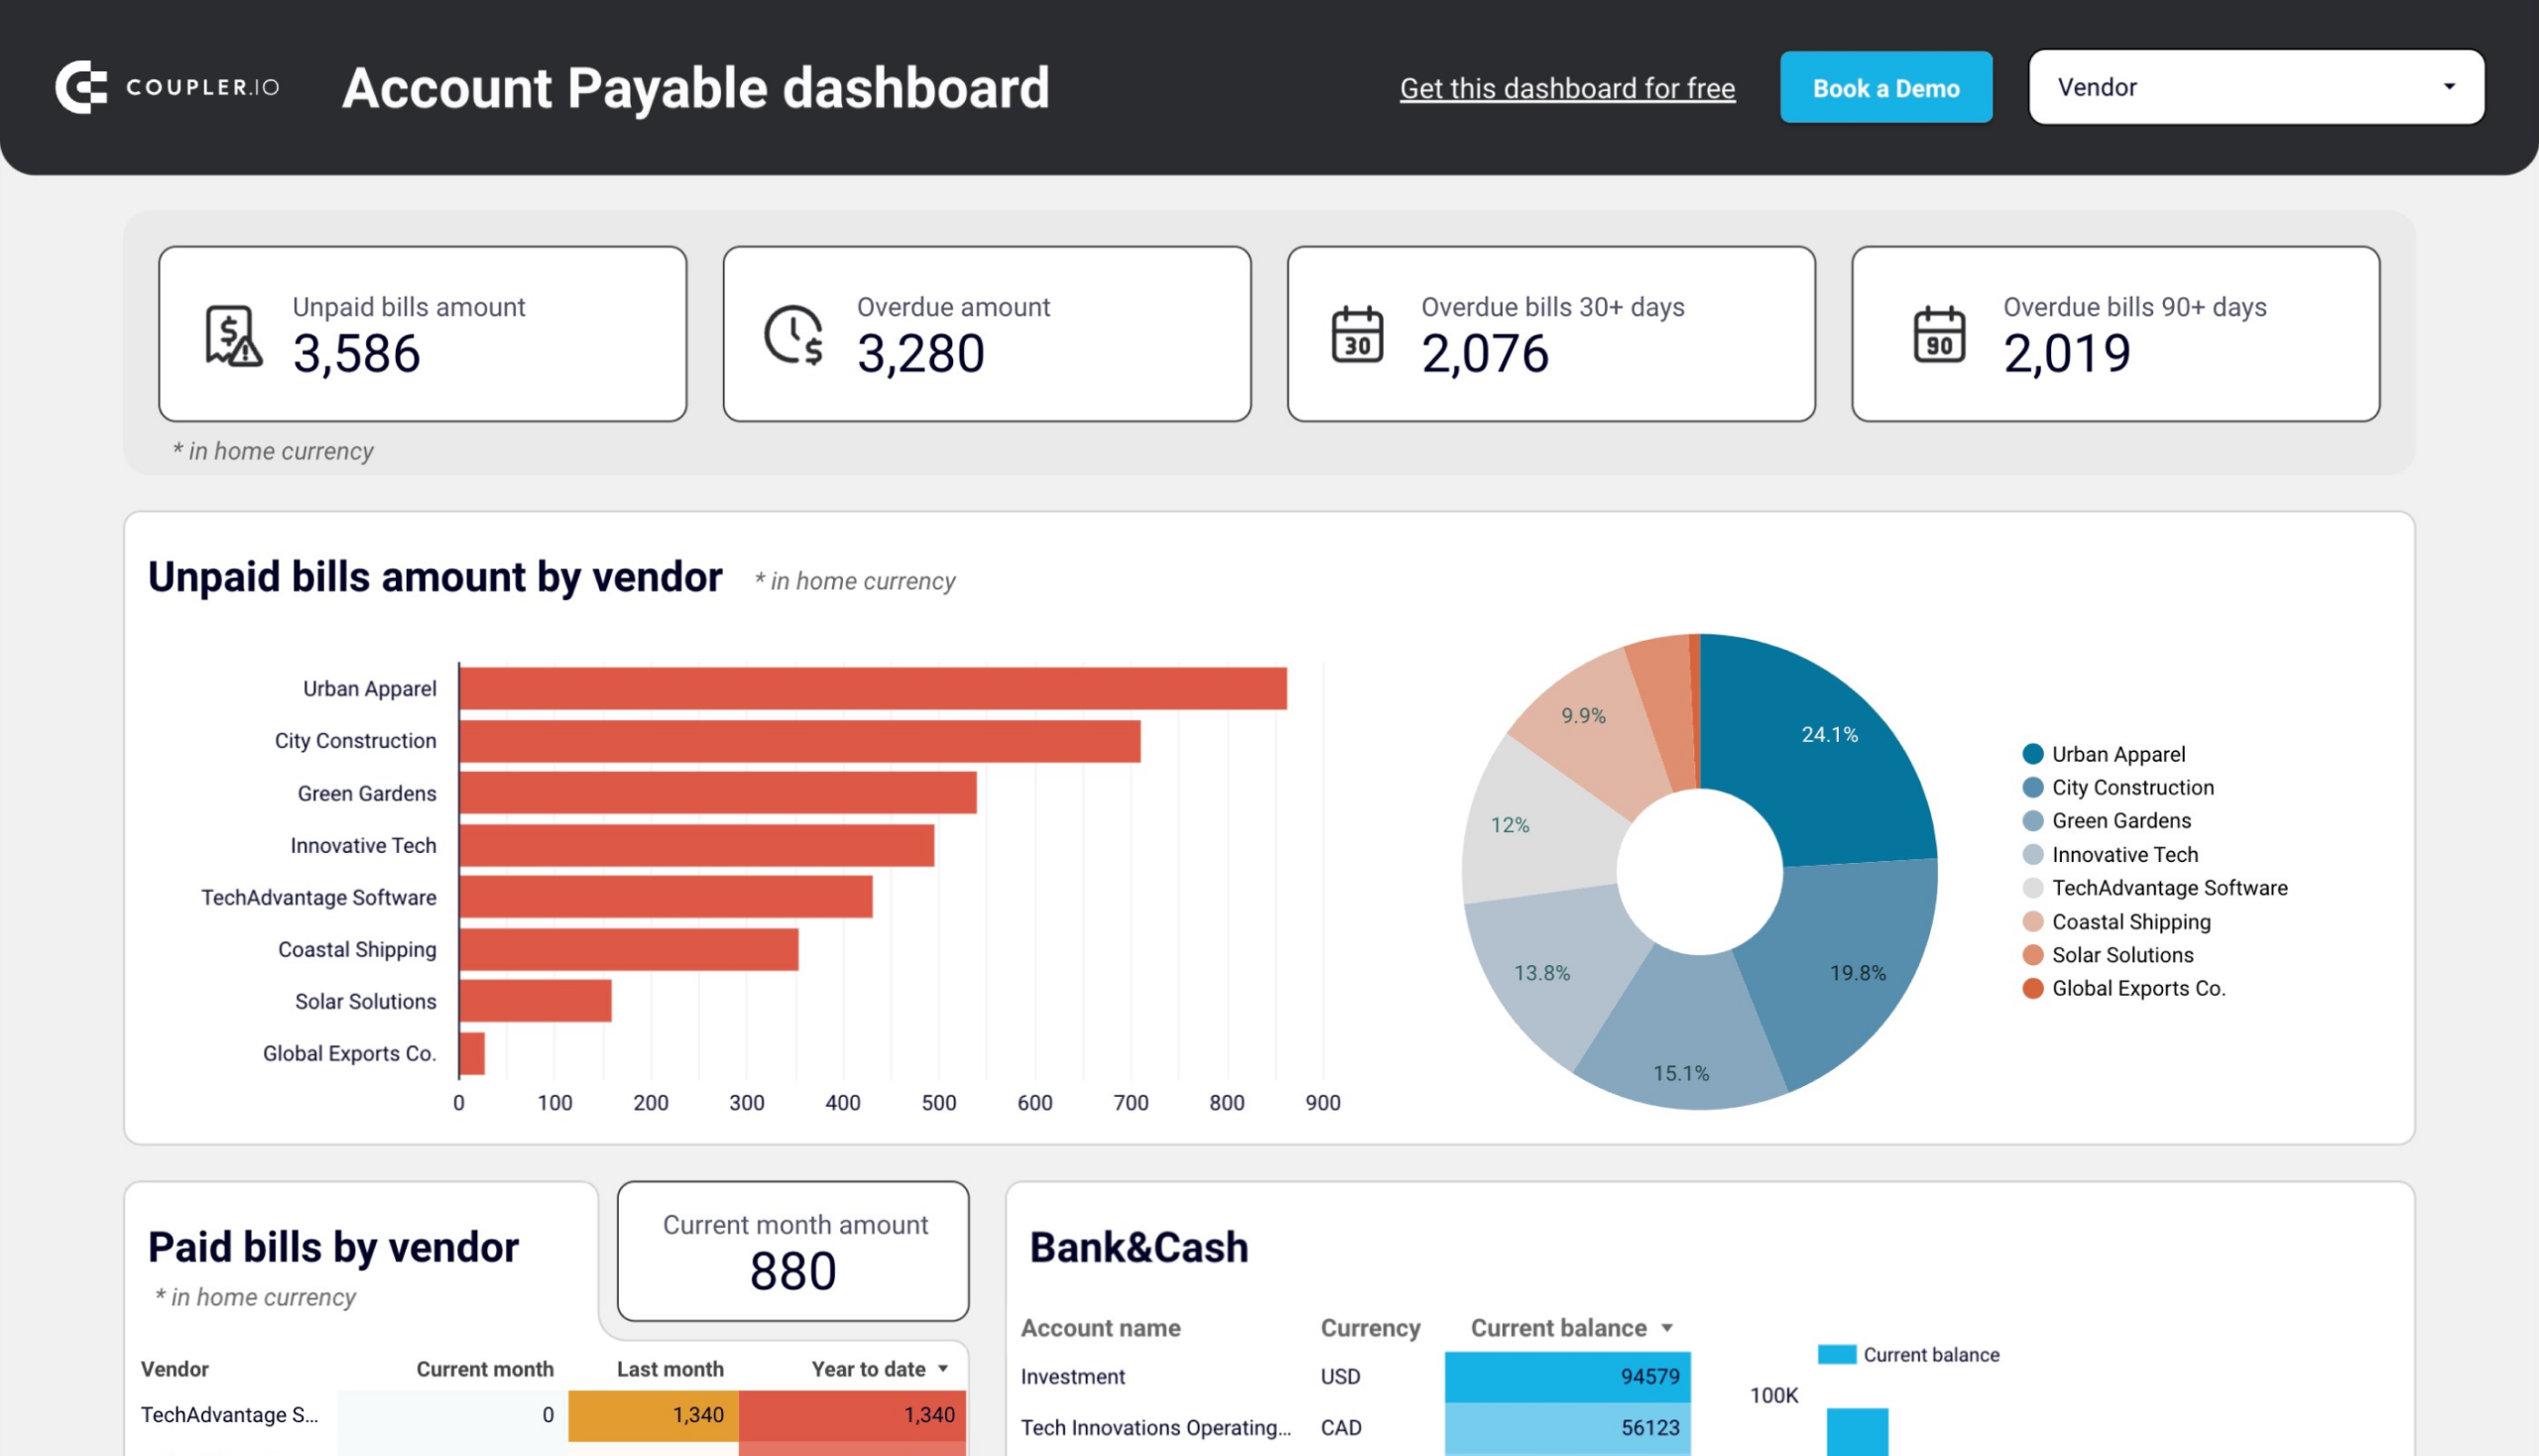
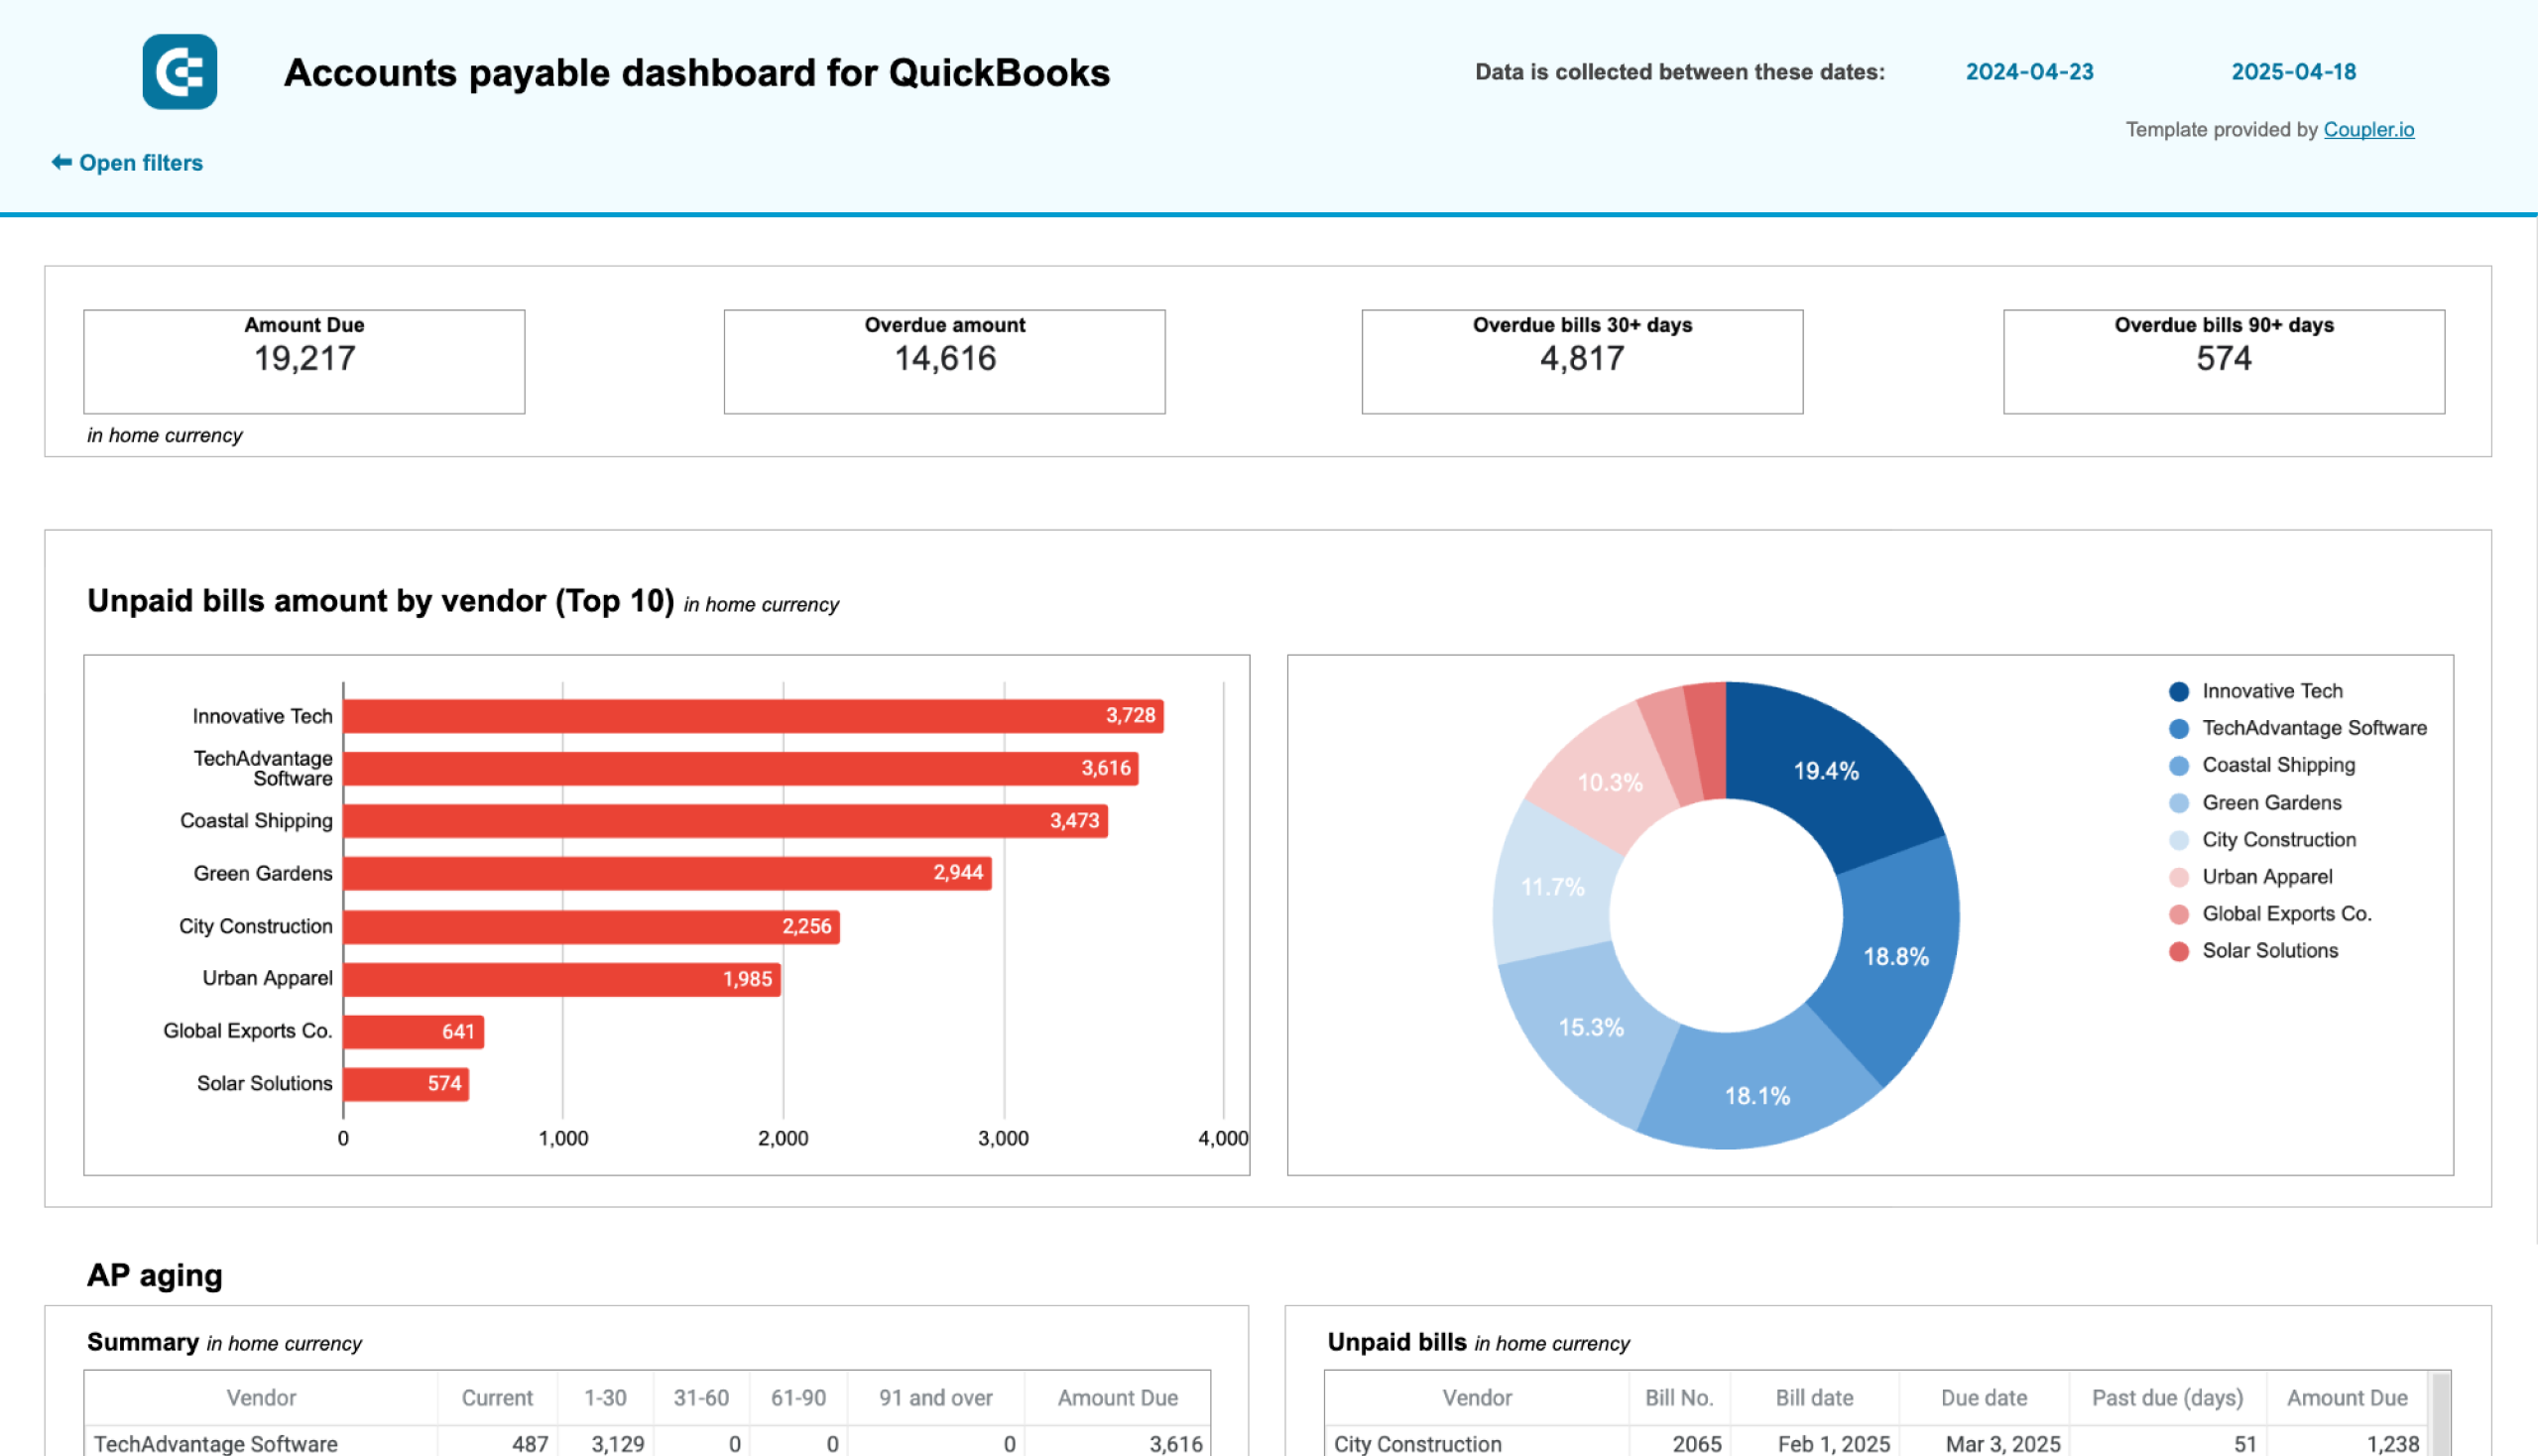
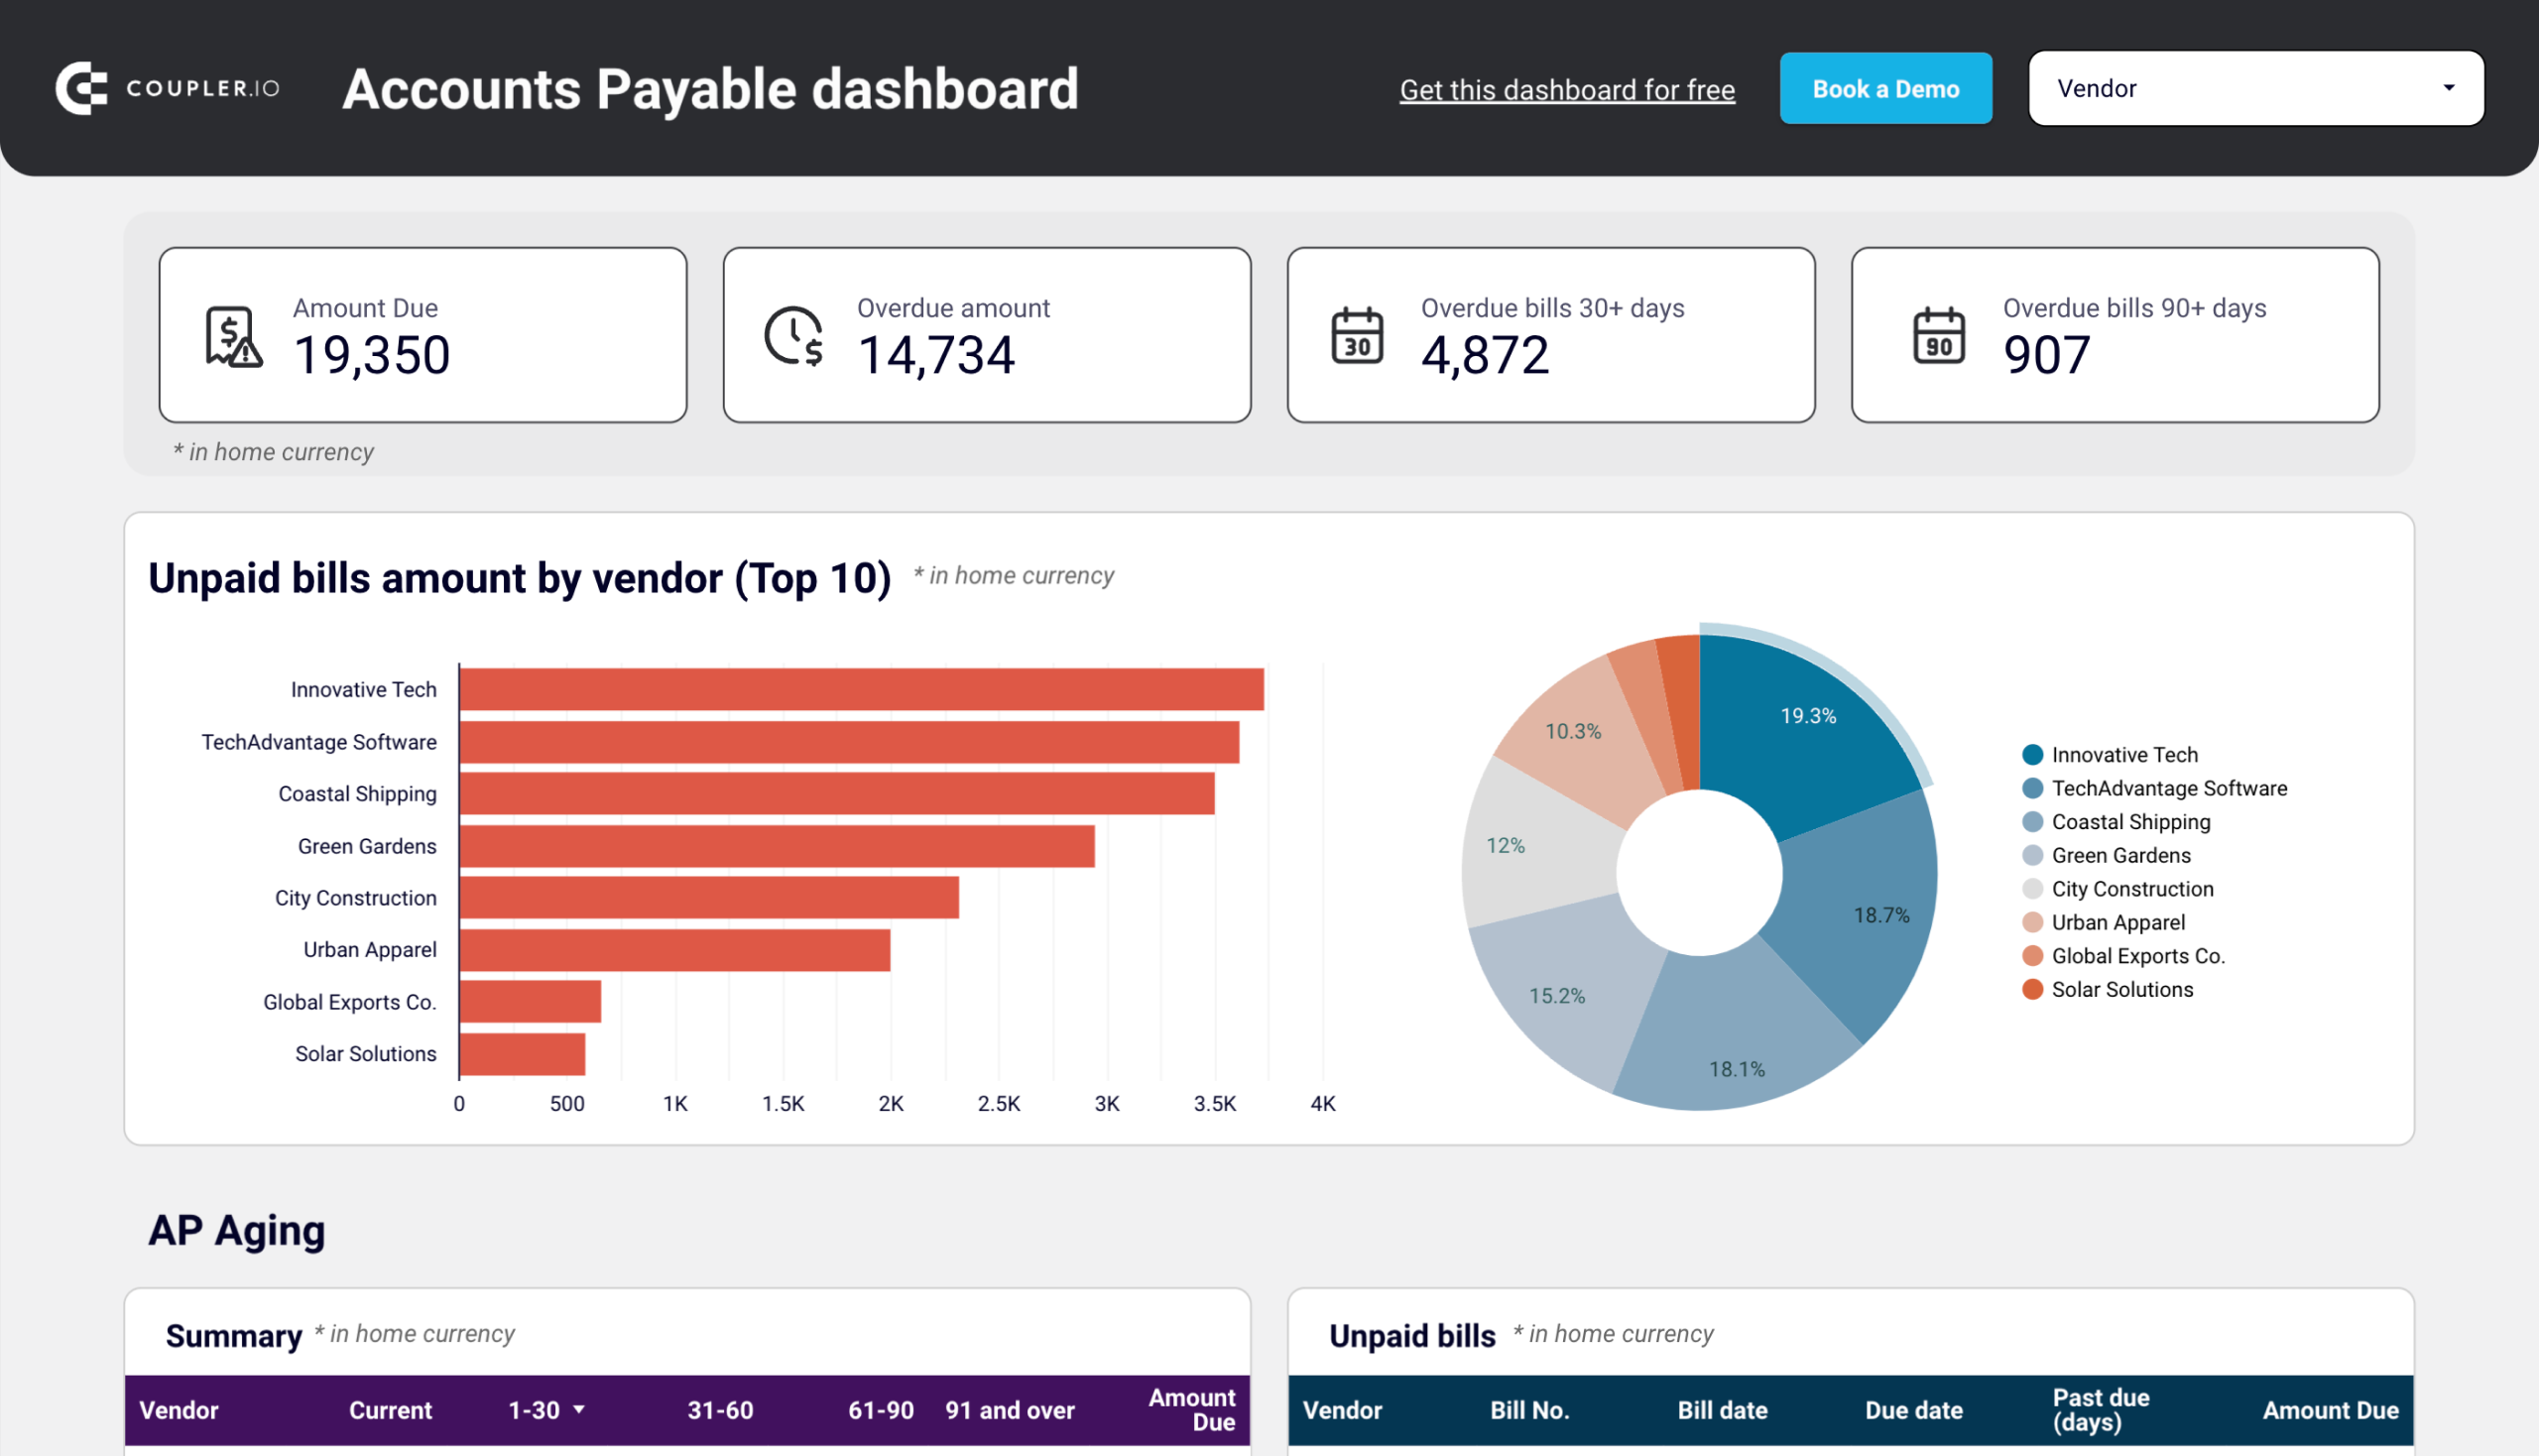
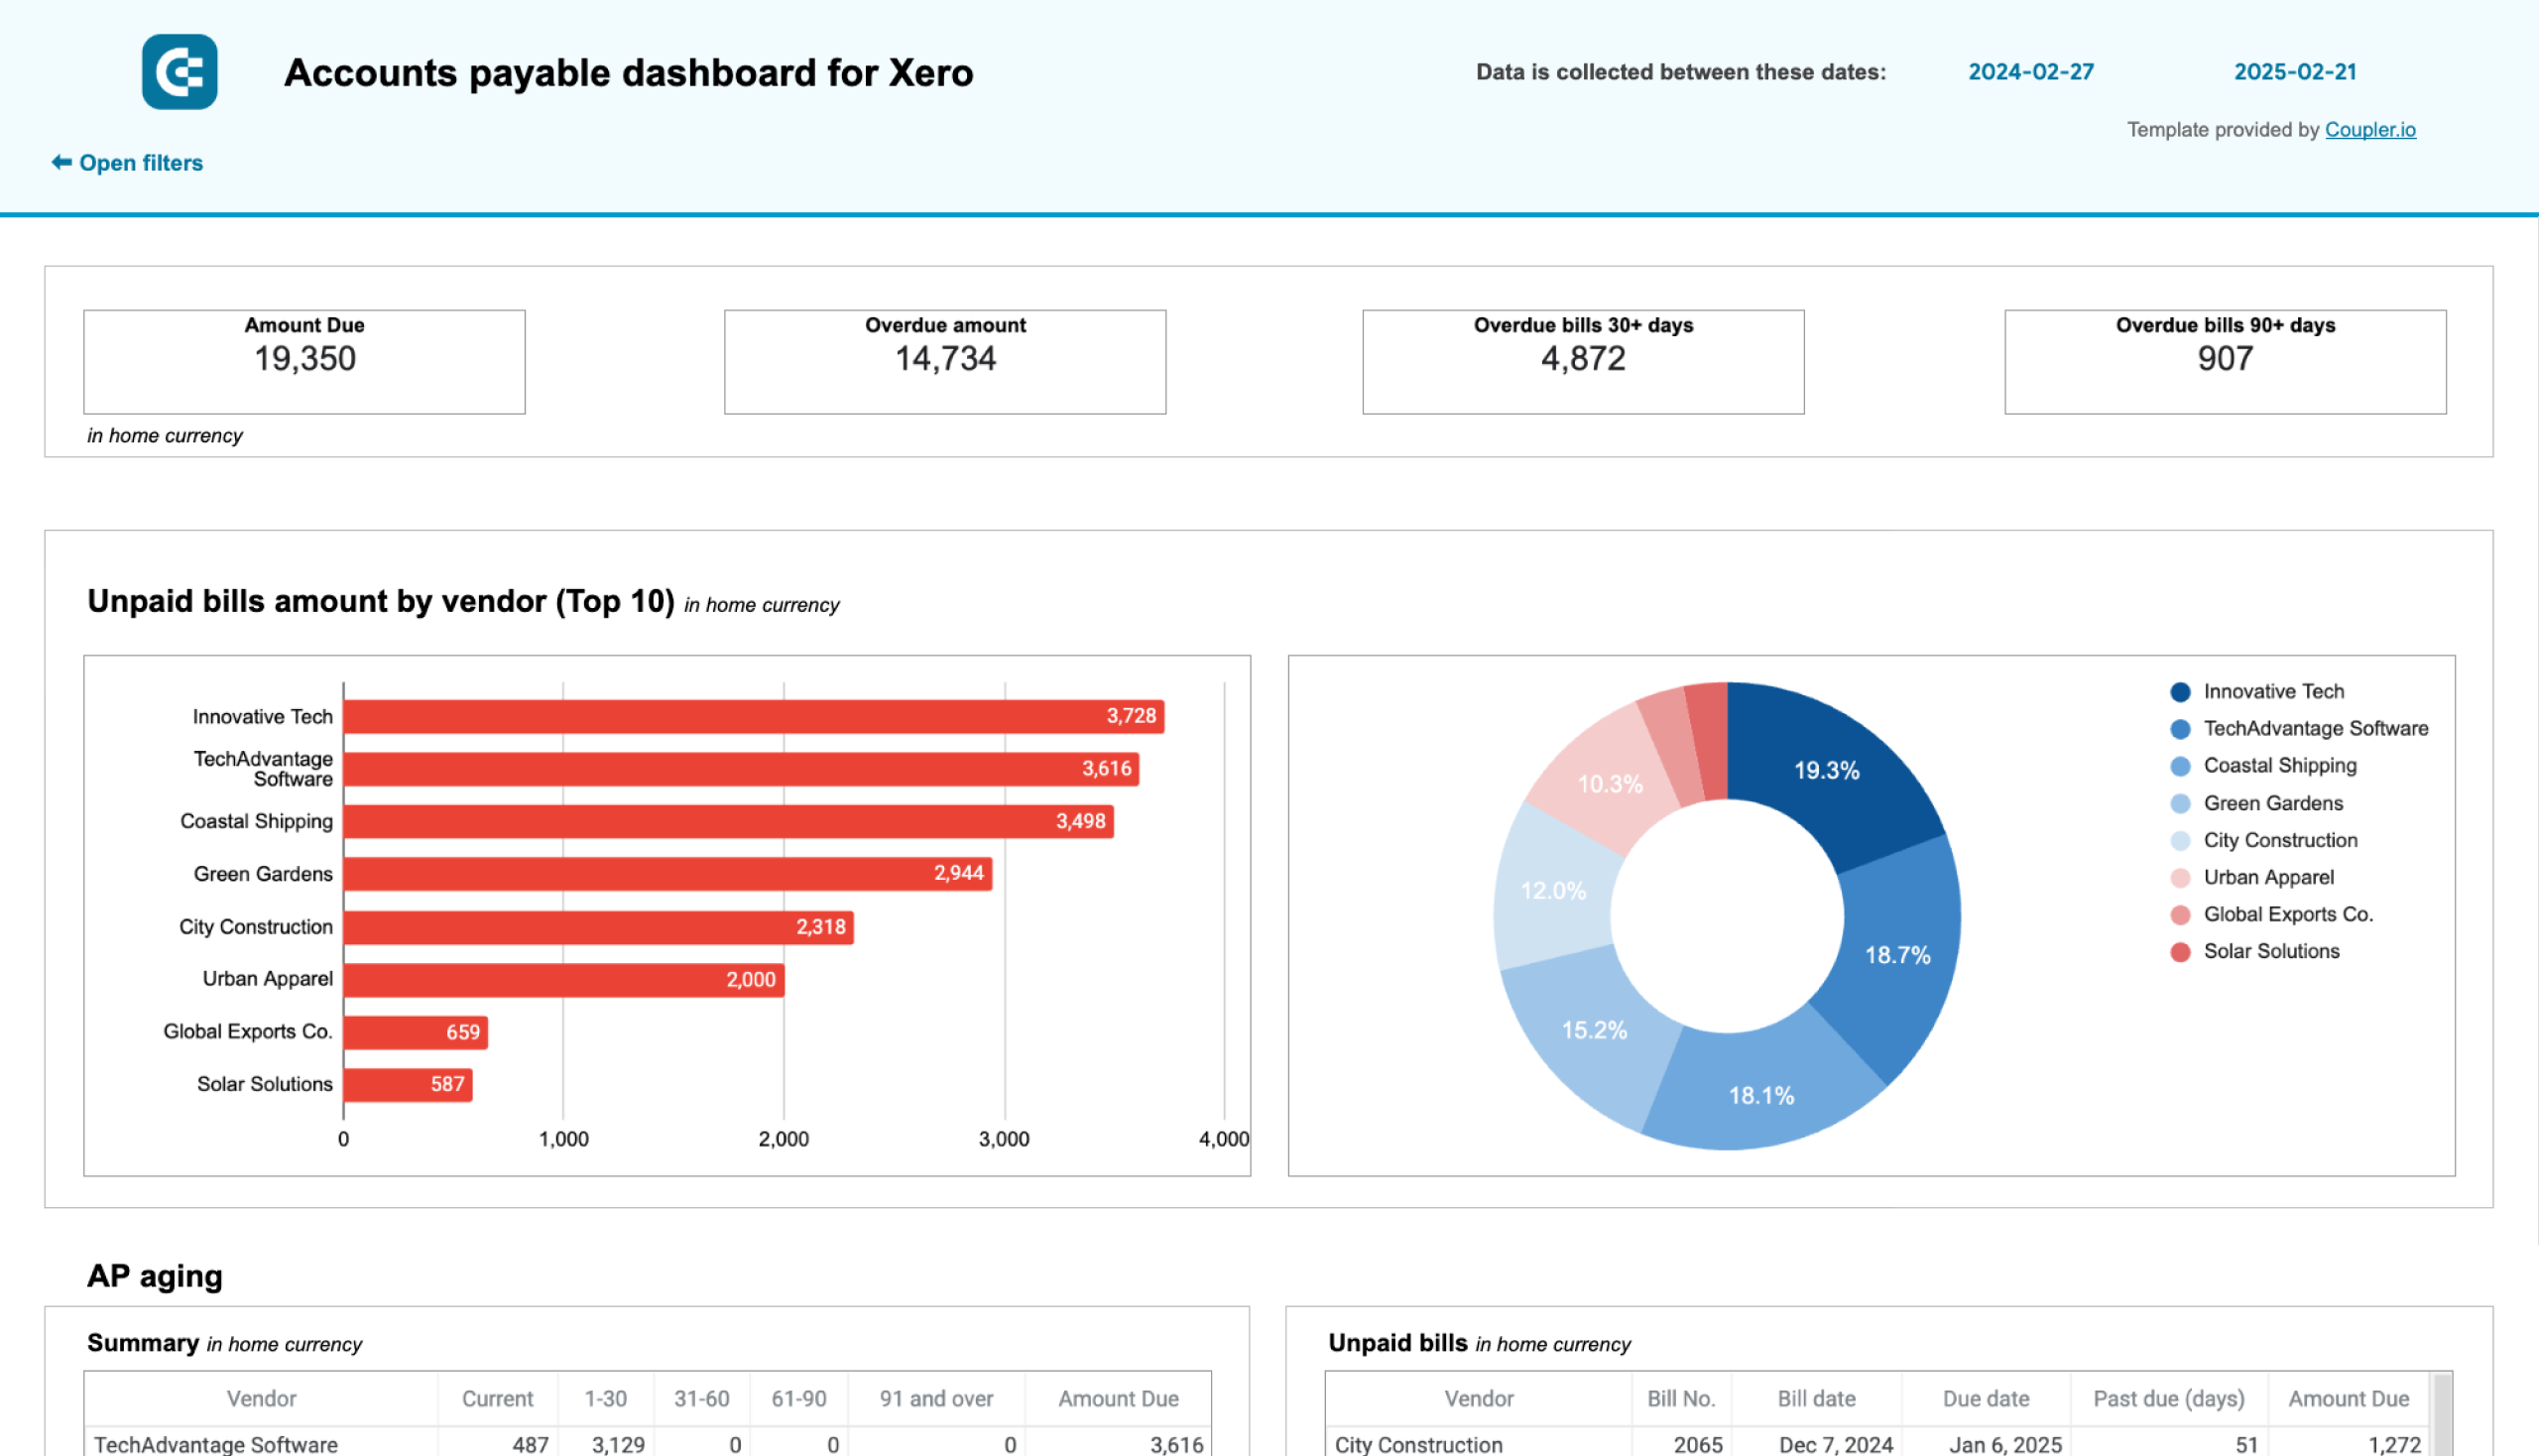
Accounts payable dashboard for QuickBooks and Xero
This accounts payable dashboard allows you to understand who your main creditors are and how much you owe them. With this information, it’s easier to prioritize payments to vendors.
With this dashboard, you’ll reveal the following:
- Unpaid bills overview + filter by creditors: Check the amount of unpaid and overdue bills, with values displayed in the home currency. For unpaid bills, look at the top 10 vendors by credit debt. Additionally, see all the vendors and their share in your accounts payable, identify your major creditors, and prioritize payments to your vendors.
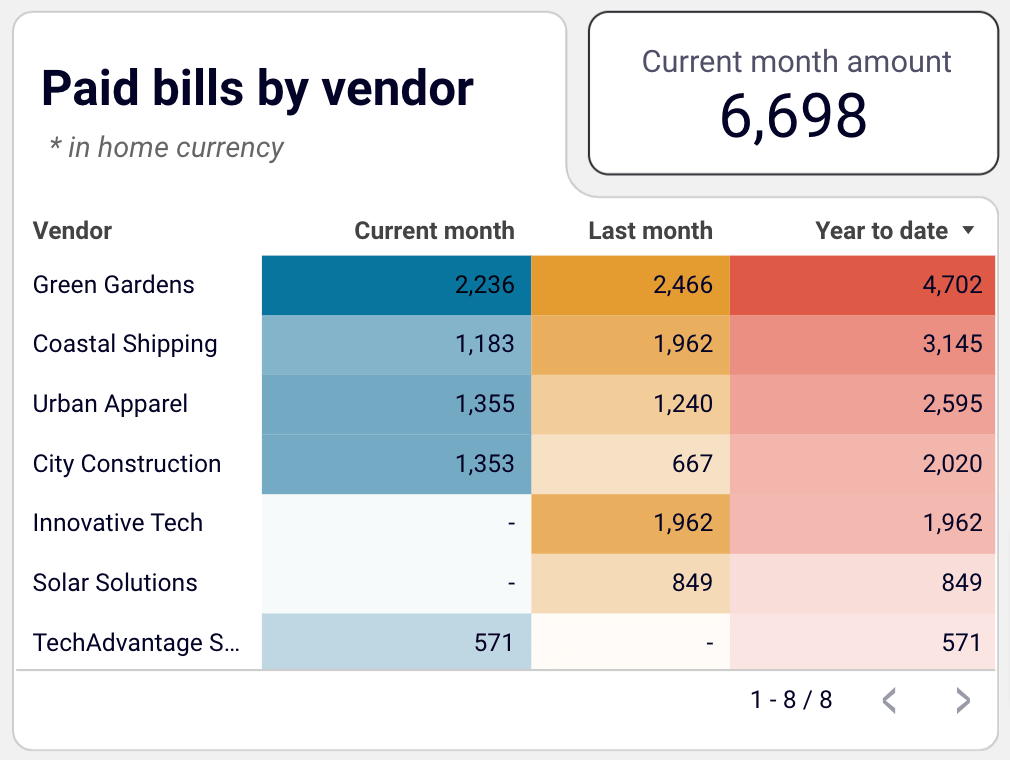
- Paid bills by vendor: Get a summary of bills from your vendors that were previously paid. Based on this data, evaluate your vendors by the size of the amounts you have paid to them to decide on payment prioritization for specific creditors.
- Bank and cash: Easily track your current balance by accounts and currency to distribute your money correctly and prioritize payments.
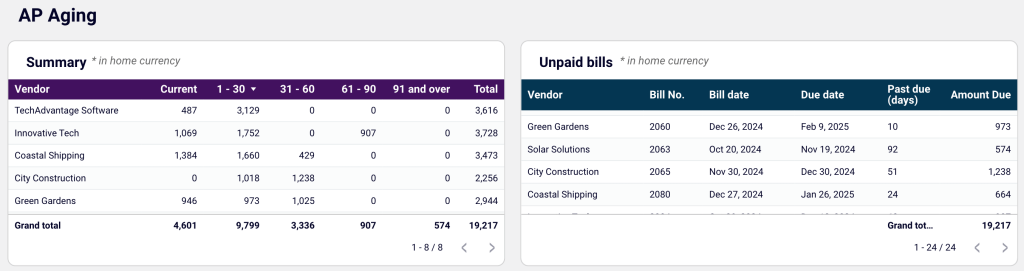
- Aging of accounts payable: Explore the distribution of overdue amounts by vendor and period: current, up to 30 days, 30 to 60 days, 60 to 90 days, and 90+ days. Look at the vendors’ overdue bills that constitute your accounts payable.
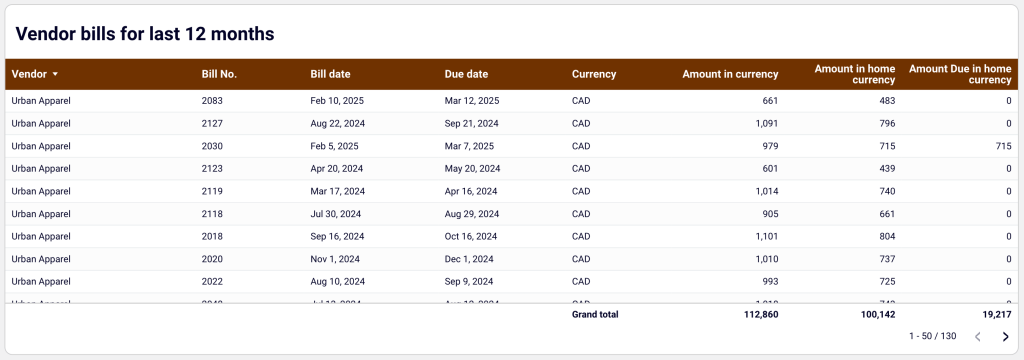
- Vendor bills: View the details of all vendor bills, paid and unpaid, for the last 12 months in all currencies.
The dashboard is available for QuickBooks and Xero as a template in Google Sheets and Looker Studio. To start using the dashboard, click the template’s Readme tab and follow the straightforward setup guide.
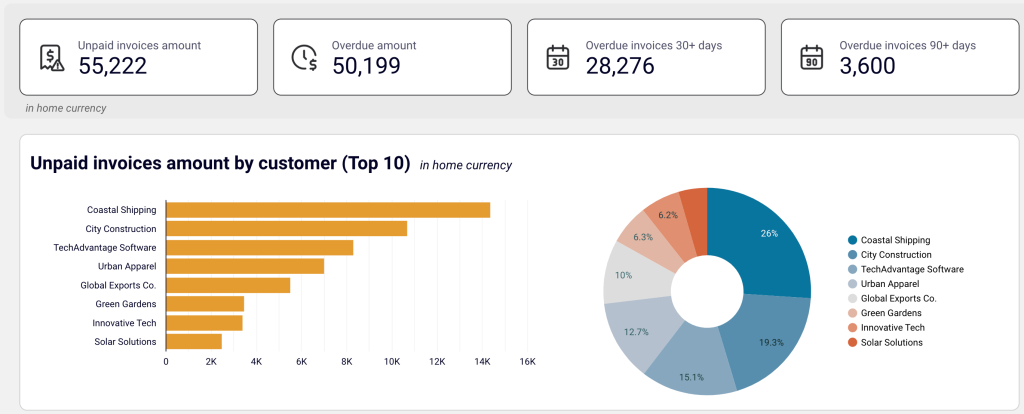
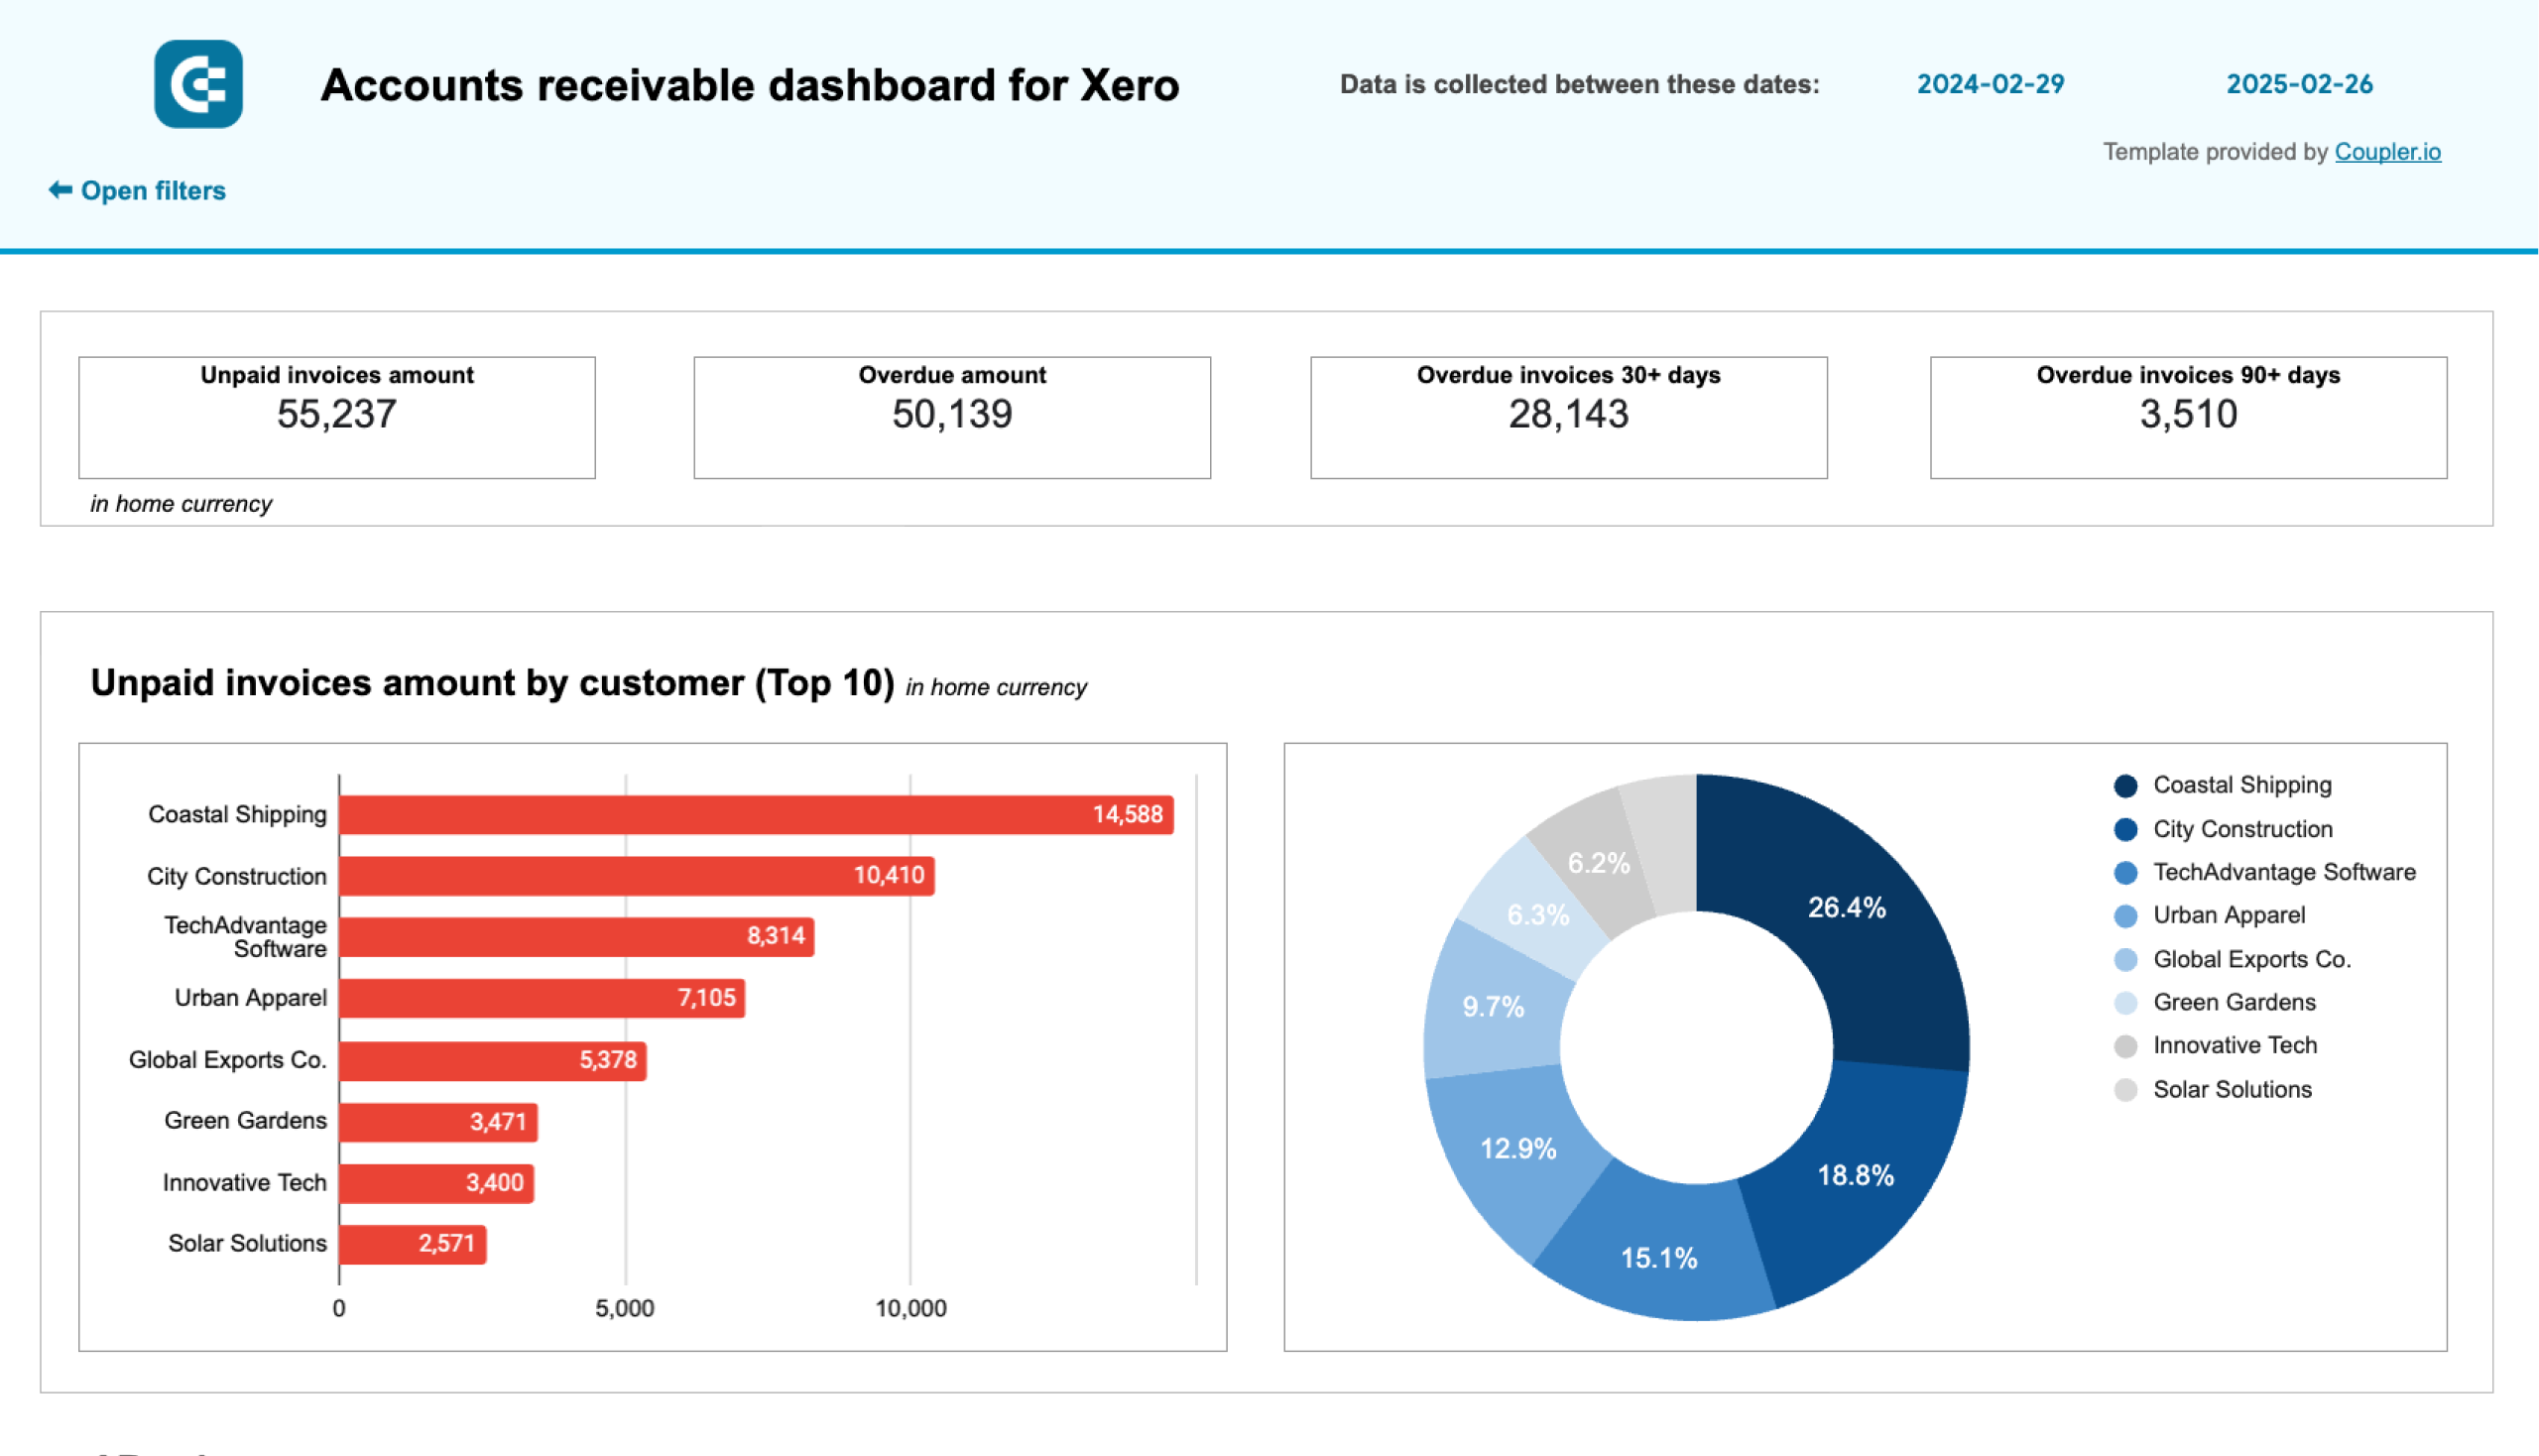
Accounts receivable dashboard for QuickBooks and Xero
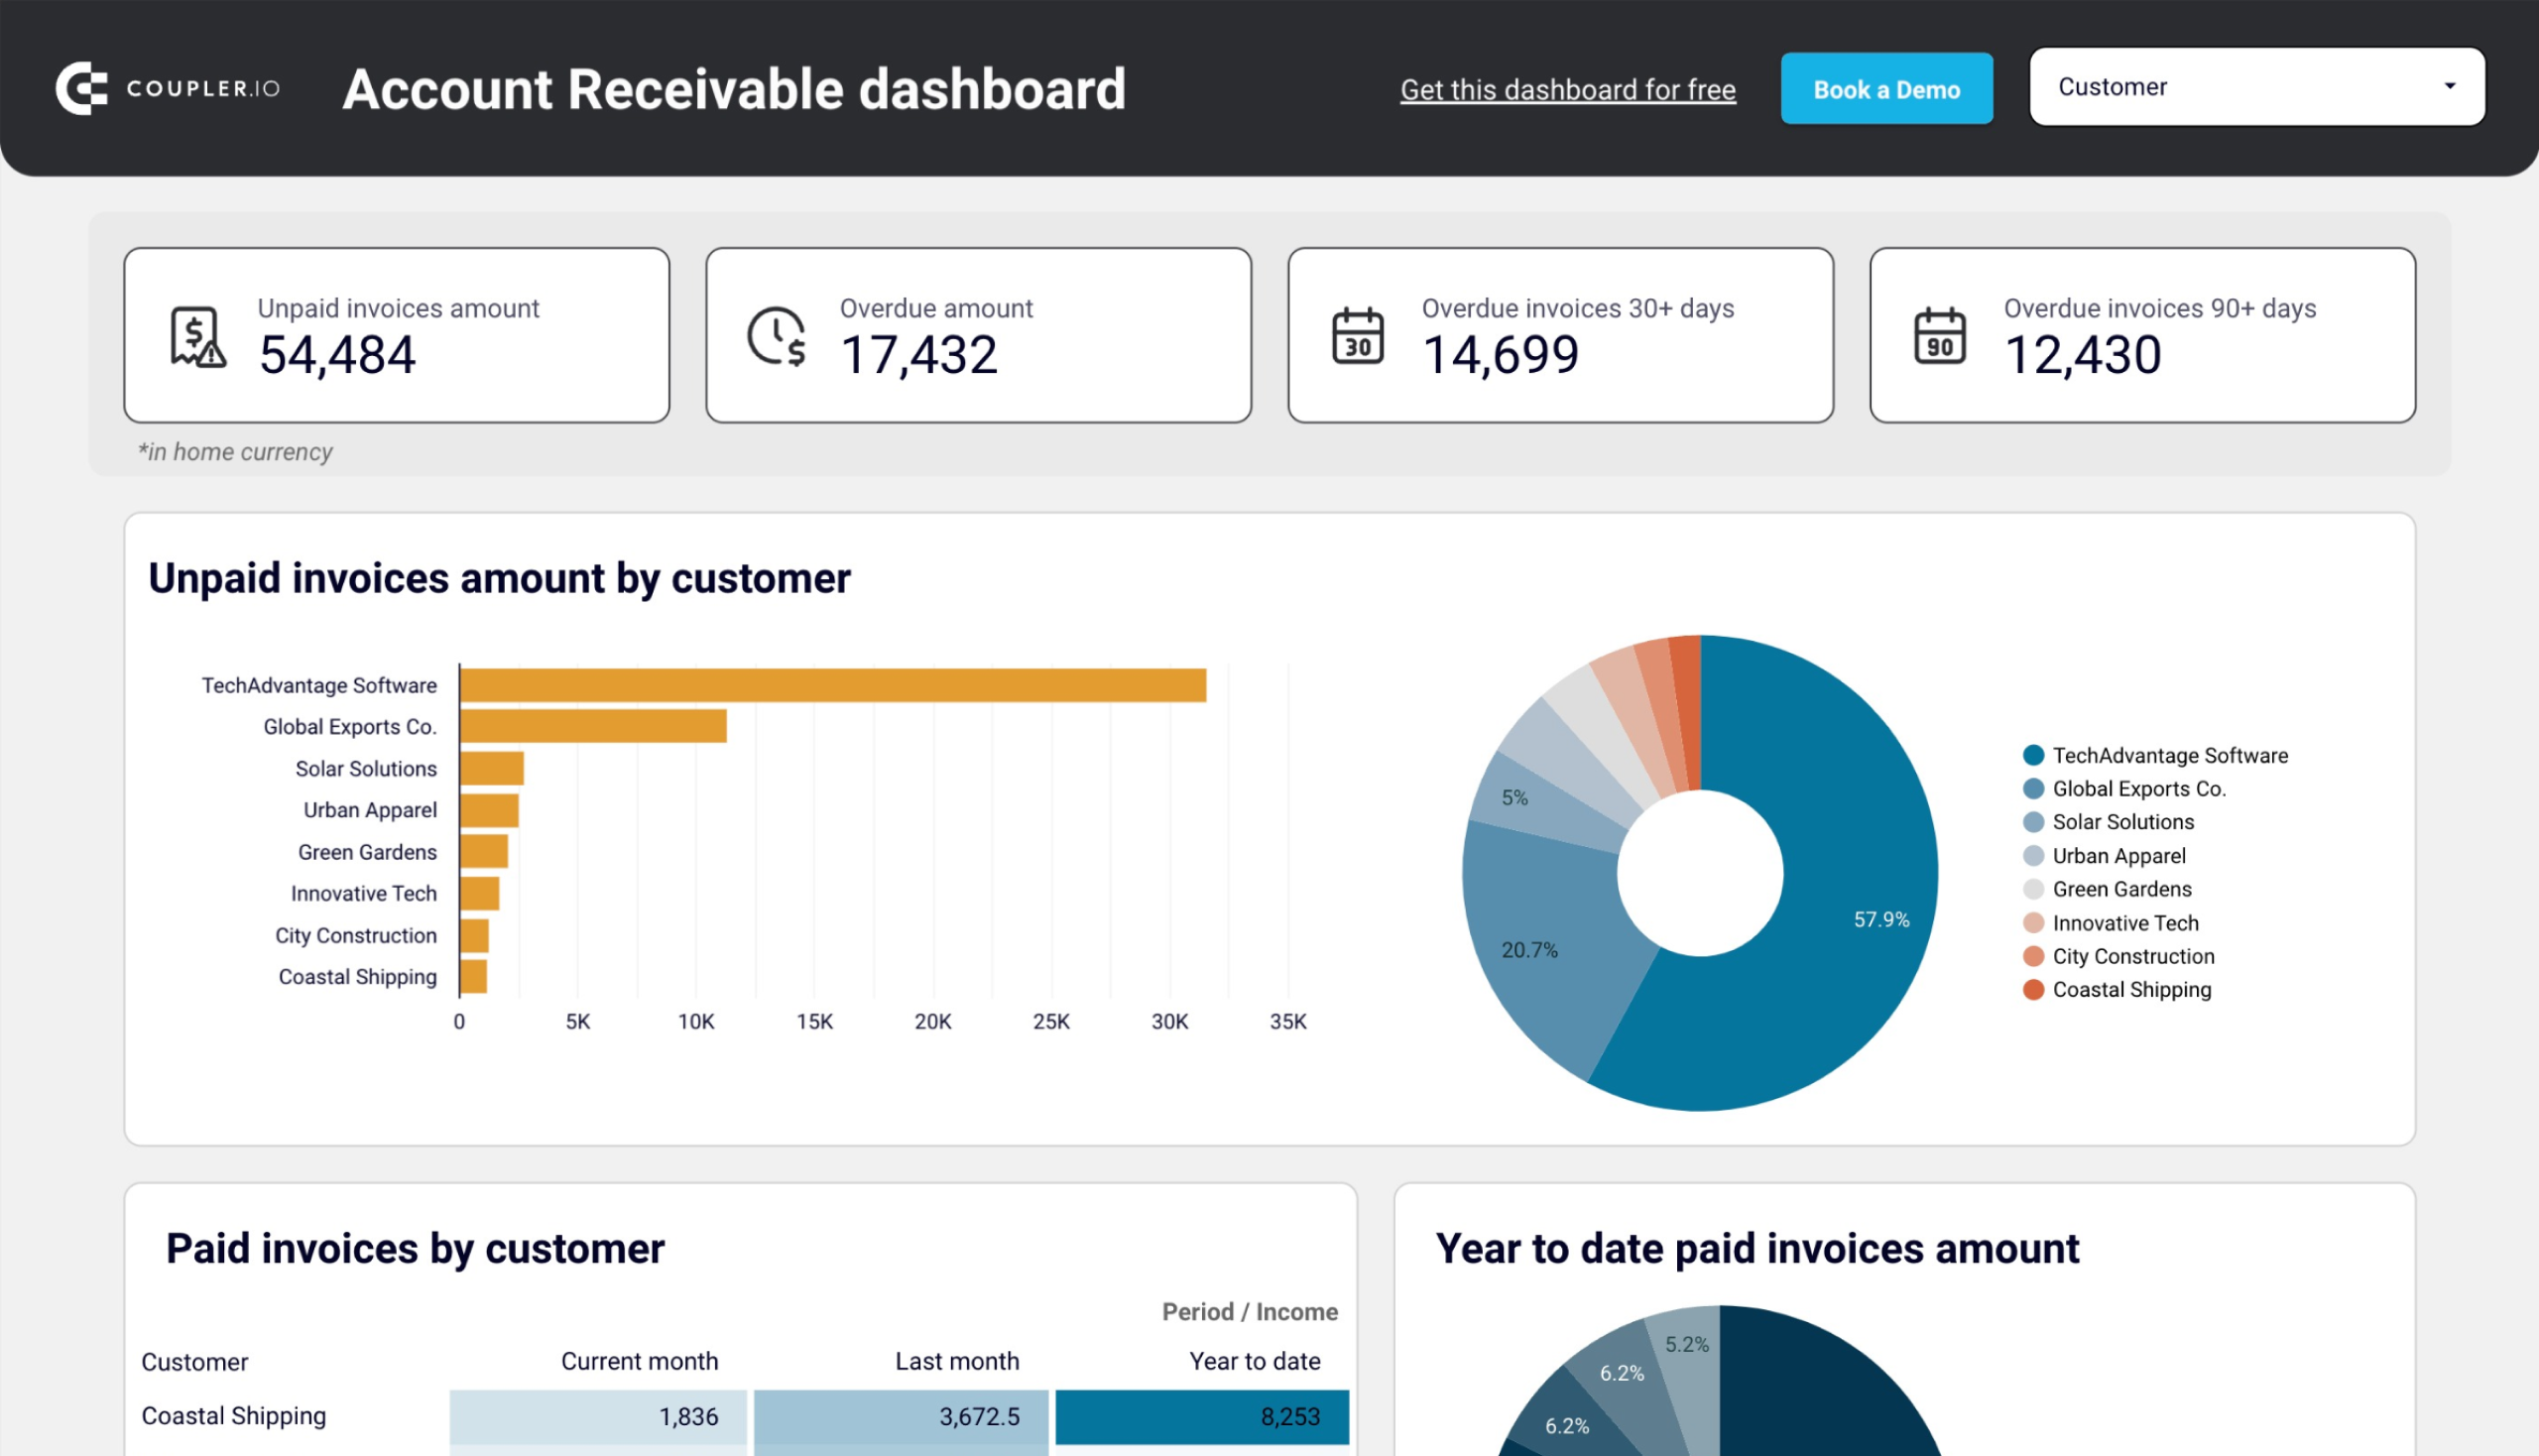
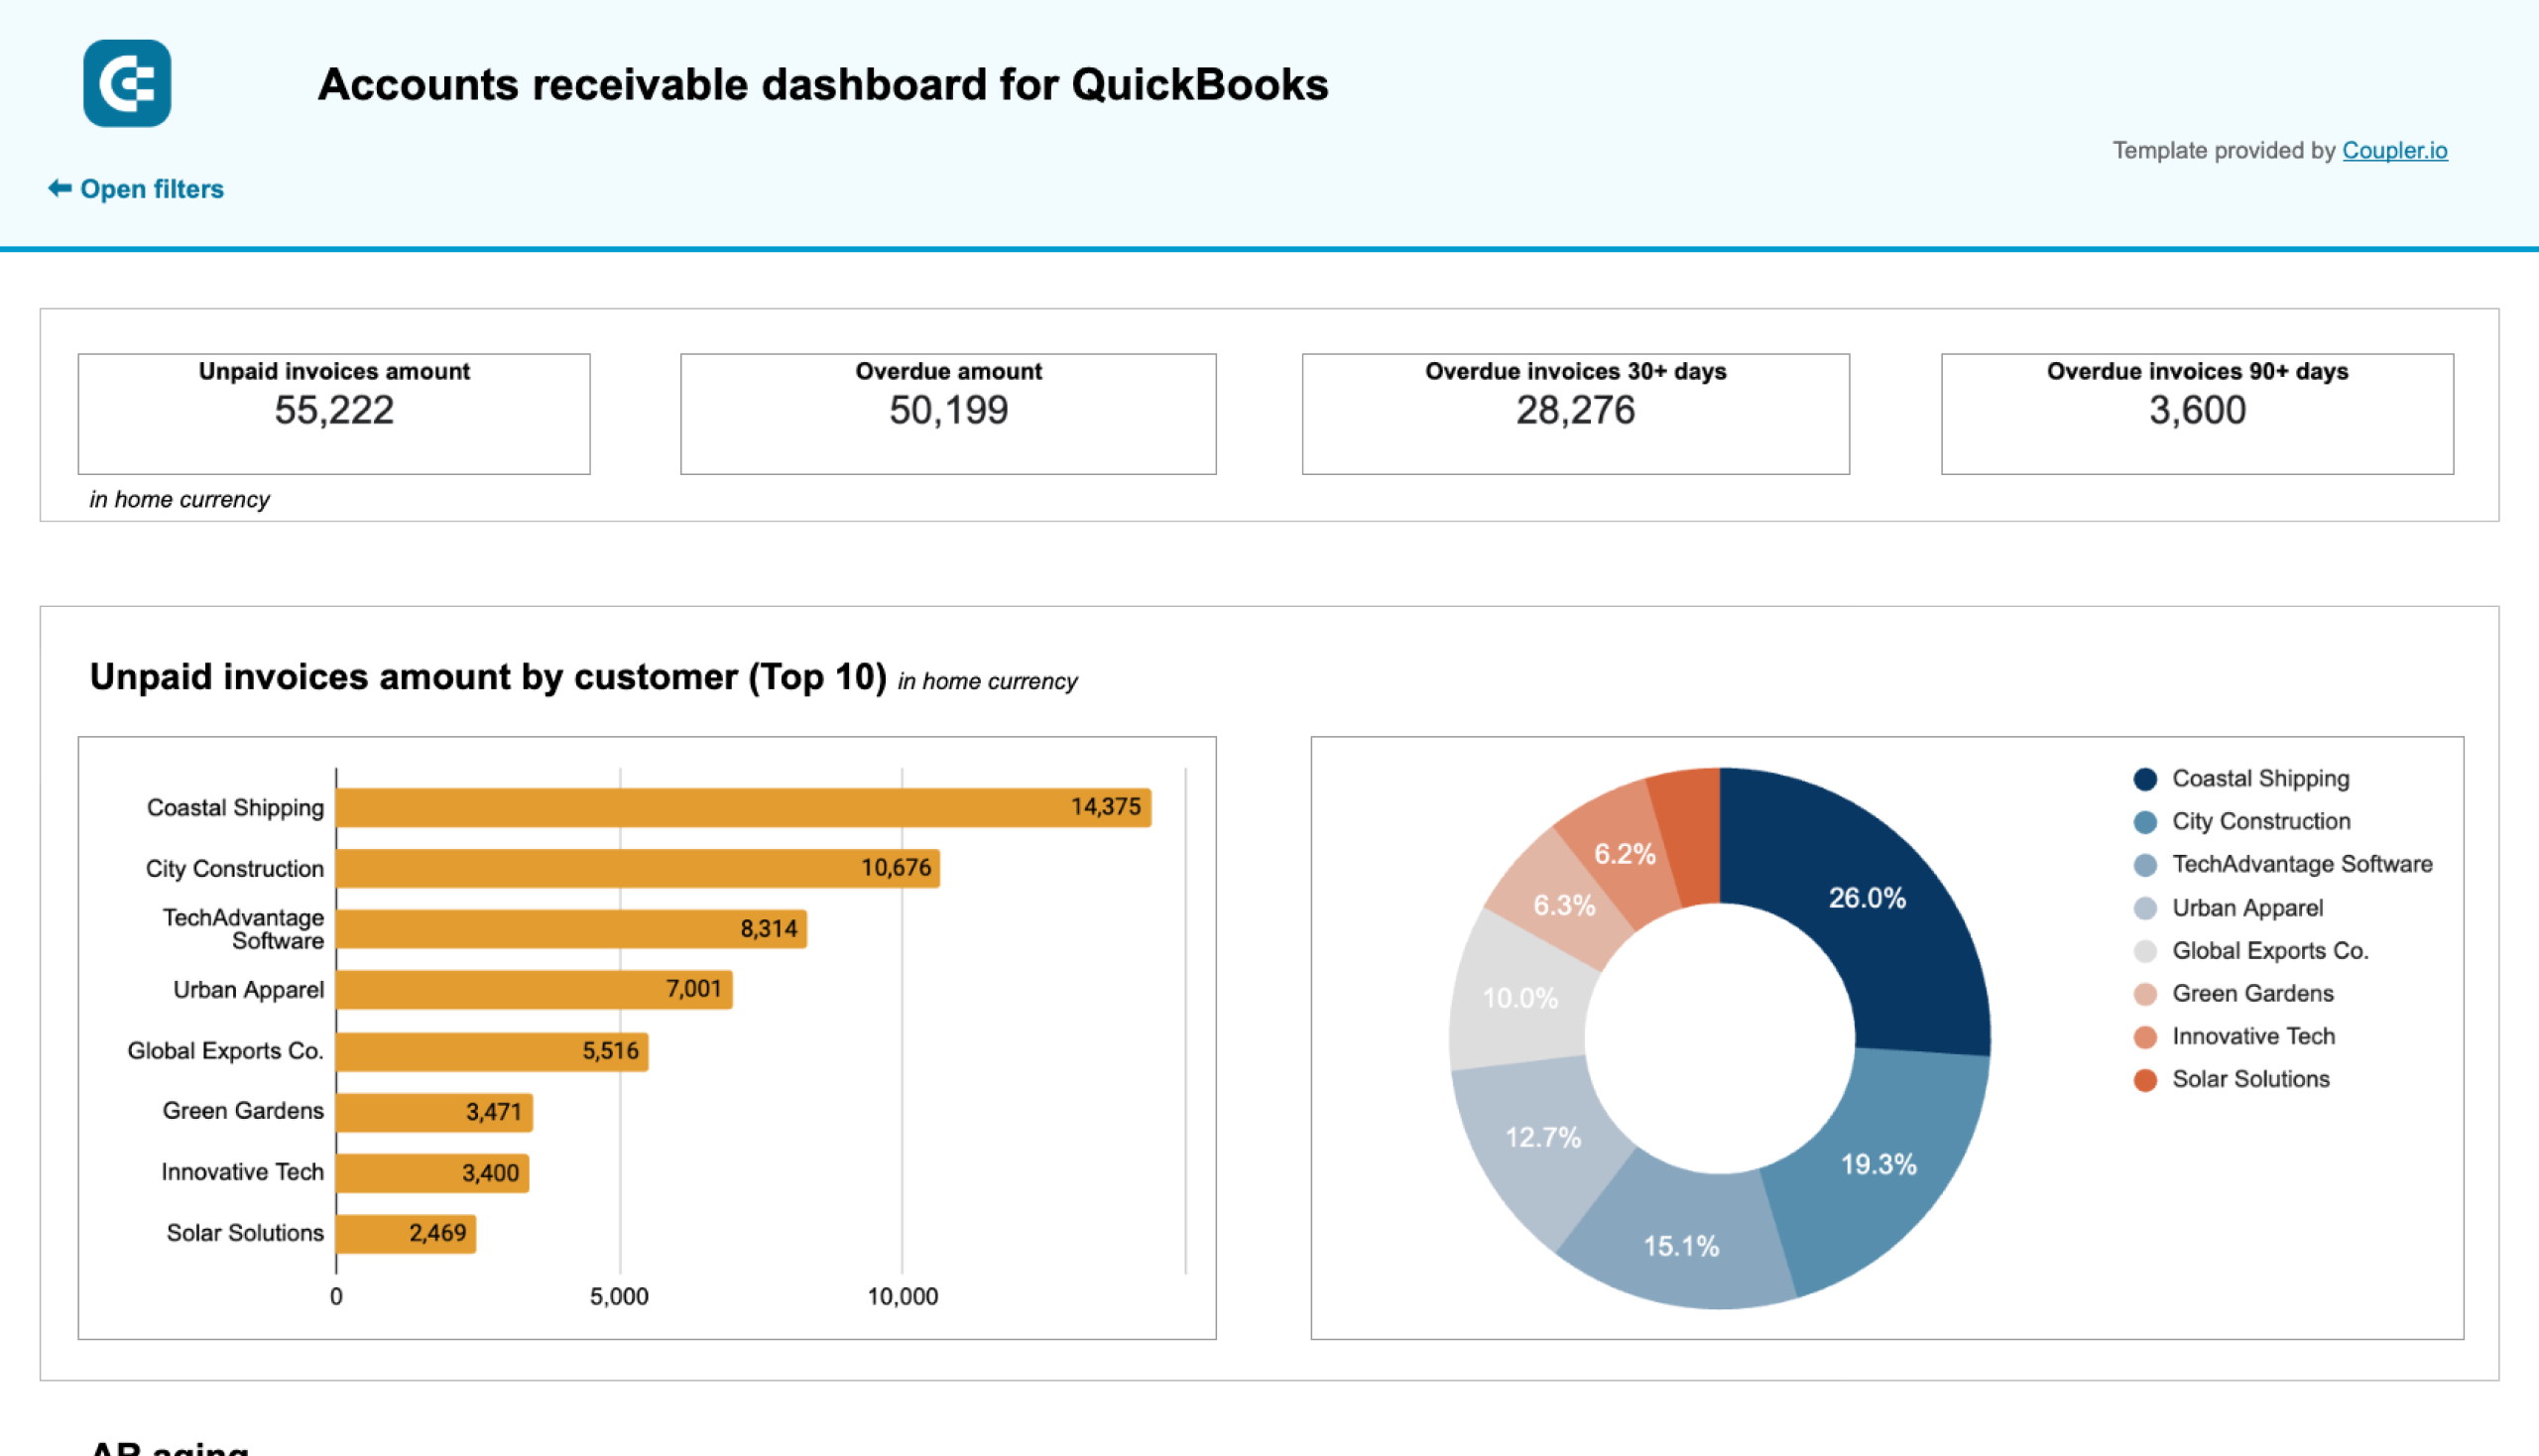
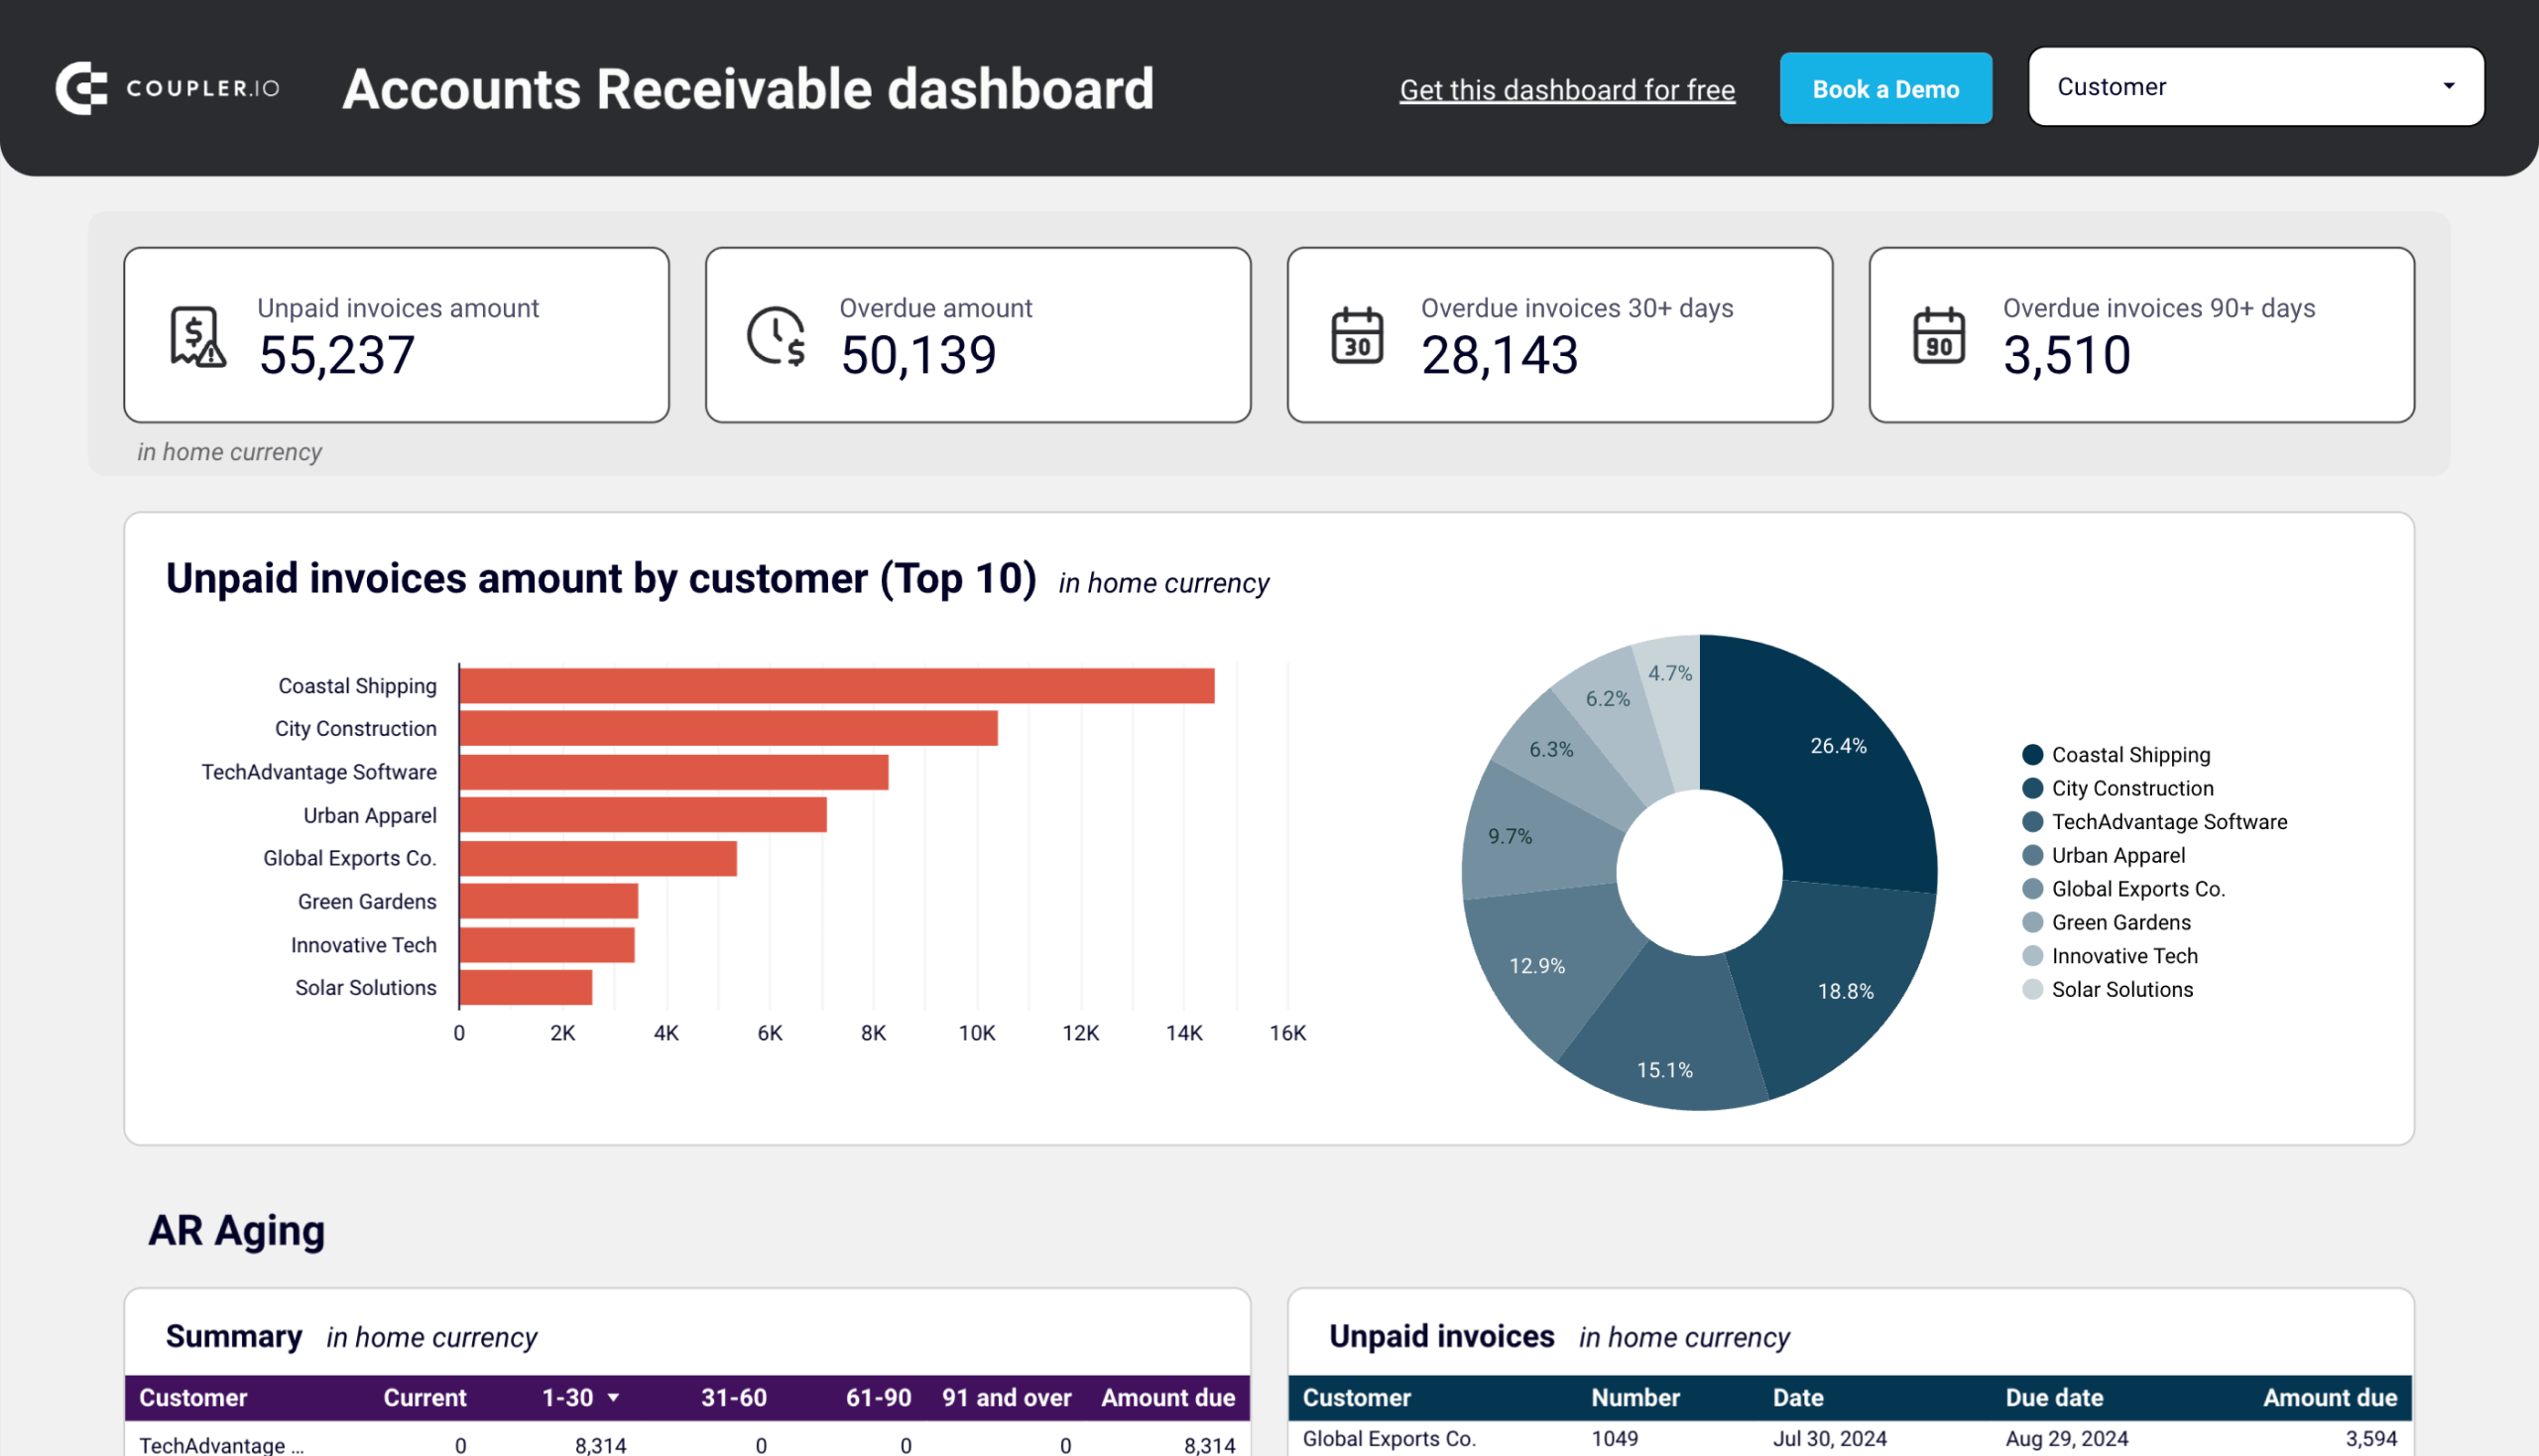
The accounts receivable dashboard shows who your primary customers (debtors) are and how much they owe you. This lets you make decisions on communication with customers and activities to settle indebtedness and prevent a cash gap.
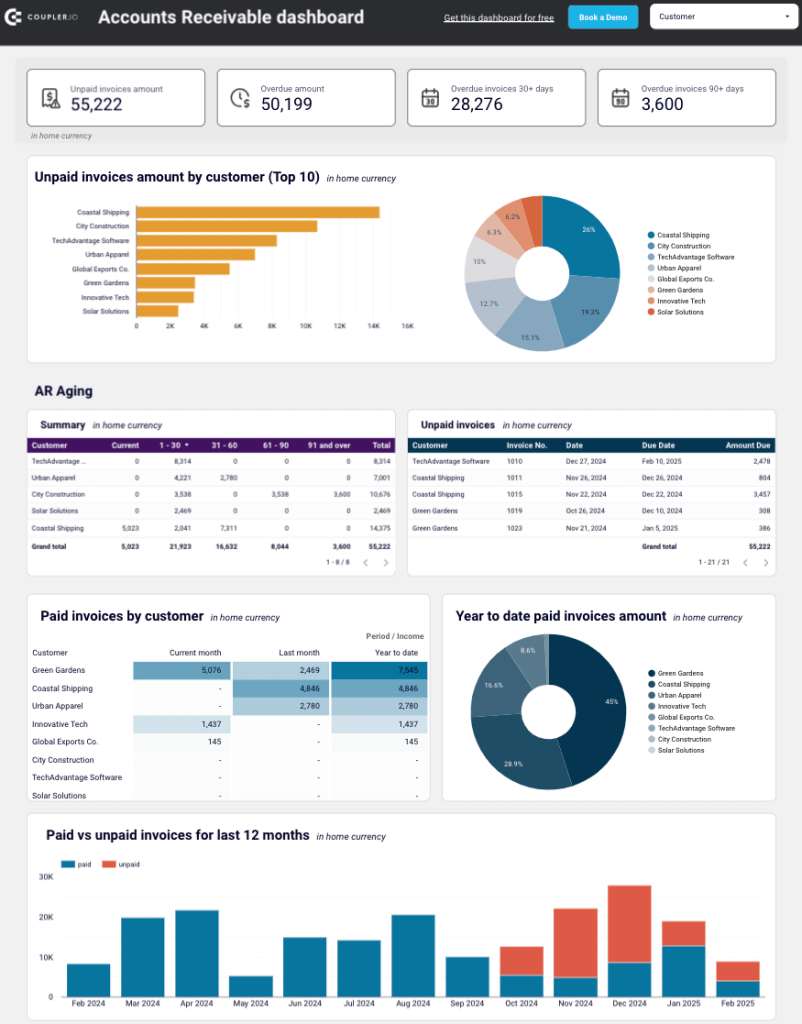
Here’s what you’ll learn using this dashboard:
- Unpaid invoices overview + filter by customers: Check the amount of unpaid and overdue invoices in the home currency. For unpaid invoices, see a selection of the top 10 customers by debit debt. Besides, view all the customers and their share of your accounts receivable. Based on this information, identify your major debtors and prioritize your activities to settle indebtedness.
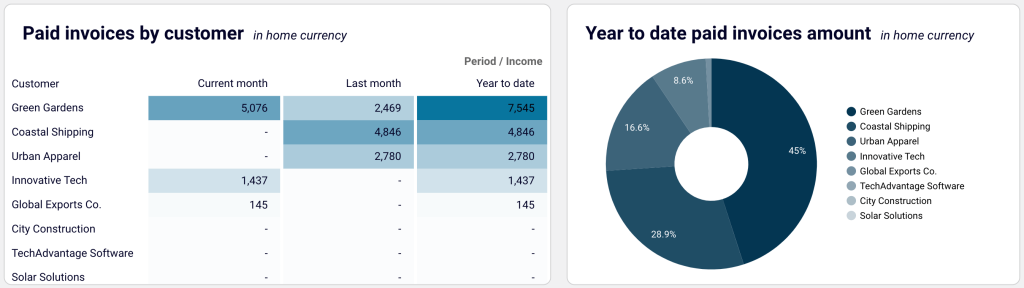
- Paid invoices by customer + year-to-date amount: Gain insights into invoices previously paid by your customers. Evaluate your customers based on the amount of previously paid invoices and decide activities for debts to be paid off.
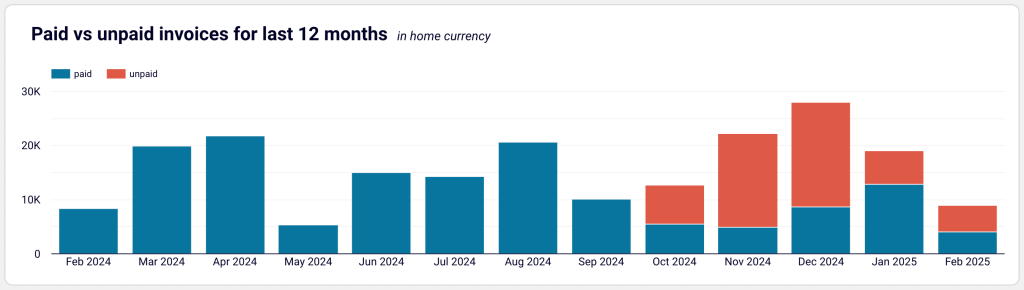
- Monthly dynamics of invoices: Track the dynamics of paid and unpaid invoices from the monthly perspective.
- Aging of accounts receivable: Monitor the distribution of the overdue amounts by debtor and period: current, up to 30 days, 30 to 60 days, 60 to 90 days, and 90+ days. Discover the customer’s overdue invoices that constitute your accounts receivable.
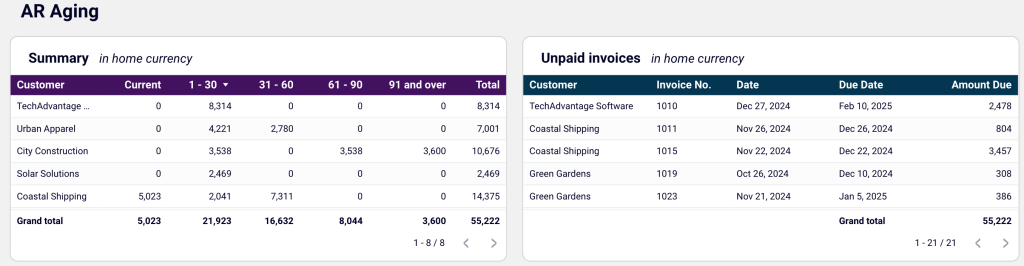
- Customer invoices: Unpack the details of all customer invoices for the last 12 months, both paid and unpaid, for all currencies.
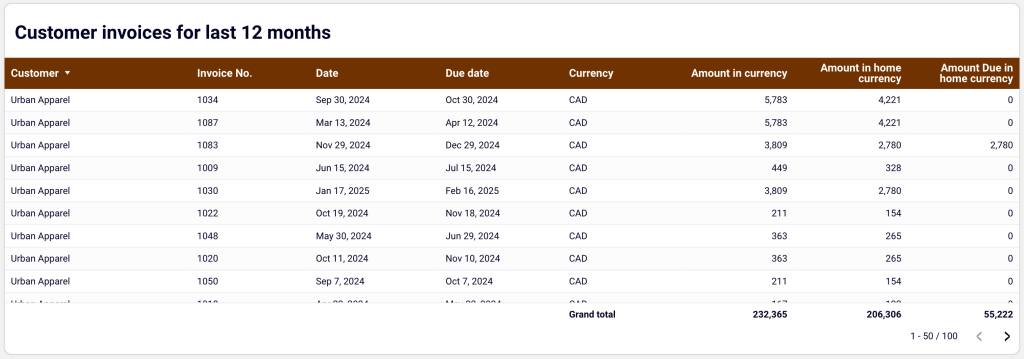
You can set up this dashboard for both QuickBooks and Xero using either a Google Sheets or a Looker Studio template. To get started, follow the instructions in the Readme tab to have your financial performance data visualized in the dashboard.
Set up Coupler.io dashboards for free and have your data transformed into actionable insights! If you, however, require a tailored dashboard solution for your reporting, contact our data experts.
Common mistakes in financial performance
Throughout financial performance analysis, there are common mistakes that skew insights and lead to misguided decisions. Let’s delve deeper so you can recognize and avoid them, improving the accuracy and effectiveness of your financial assessments.
Relying only on one metric
One of the biggest mistakes in financial performance analysis is focusing on a single metric to evaluate the business’s health. While metrics like revenue, profit margins, or ROI are important, they can’t provide a complete picture and lack nuances in your company’s performance.
For example, a high revenue figure may mask underlying issues like poor cash flow or high operational costs.
It’s essential to evaluate multiple financial metrics in conjunction to form a detailed analysis that reflects the true state of the business.
Ignoring cash flow in favor of revenue
Many businesses place too much emphasis on revenue figures and neglect cash flow. However, while revenue is crucial, it does not always equate to profitability or solvency, and cash flow can be far more telling when evaluating financial health. It indicates the ability to meet short-term obligations and sustain operations. So, ignoring it can lead to a false sense of financial security and even contribute to cash crises.
For instance, your company might experience a high revenue stream but still struggle with liquidity issues if cash flow is not managed correctly.
Not considering industry benchmarks
Another common overlook is failing to compare a company’s financial performance against industry benchmarks. They let you understand where the business stands relative to competitors and assess whether financial results are good, bad, or just average. As a result, this allows you to set realistic performance targets.
You should also remember that each industry has its own performance standards, and what works for one sector may not apply to another.
Manually reporting your financial performance
As you know, financial performance analysis relies on reports generated from data in accounting and billing systems. If you collect this data manually, you’ll spend too much time downloading it for report creation, especially when handling large volumes of records.
Additionally, report updates will need to be done by hand each time. As a result, manual financial reporting will not only consume valuable working hours but introduce significant risks of error and delay. Finance teams often spend 60-70% of their time collecting and preparing data, leaving limited capacity for actual analysis.
To avoid this problem, automate financial reporting using Coupler.io. It allows you to create self-updating reports from your data and load them into spreadsheets and BI tools for further analysis.
Try Coupler.io for free and let your reporting run by itself, so you can simply analyze your financial performance and act upon it!

Automate financial reporting with Coupler.io
Get started for free