Most analytics routines still burn more time on data preparation than on actual analysis. Claude.ai Artifacts change that. You describe a dashboard you want in plain language, and Claude builds a working, interactive panel right in the chat. Pair it with Coupler.io to connect structured data from over 400 sources, and your dashboards start with clean numbers instead of raw exports. Read on to learn how to build your first artifact in a couple of minutes.

Connect your data to Claude with Coupler.io
Get started for freeWhat are Claude Artifacts?
Claude.ai Artifacts are interactive outputs that appear in a side panel next to your conversation. Instead of getting a text response you’d need to copy somewhere else, you get a rendered chart, dashboard, web page, or document you can edit by continuing the conversation. Claude updates the artifact in place whether you want to change a metric, adjust a layout, swap a date range, etc. Every version is saved, so you can roll back if an edit doesn’t work out.
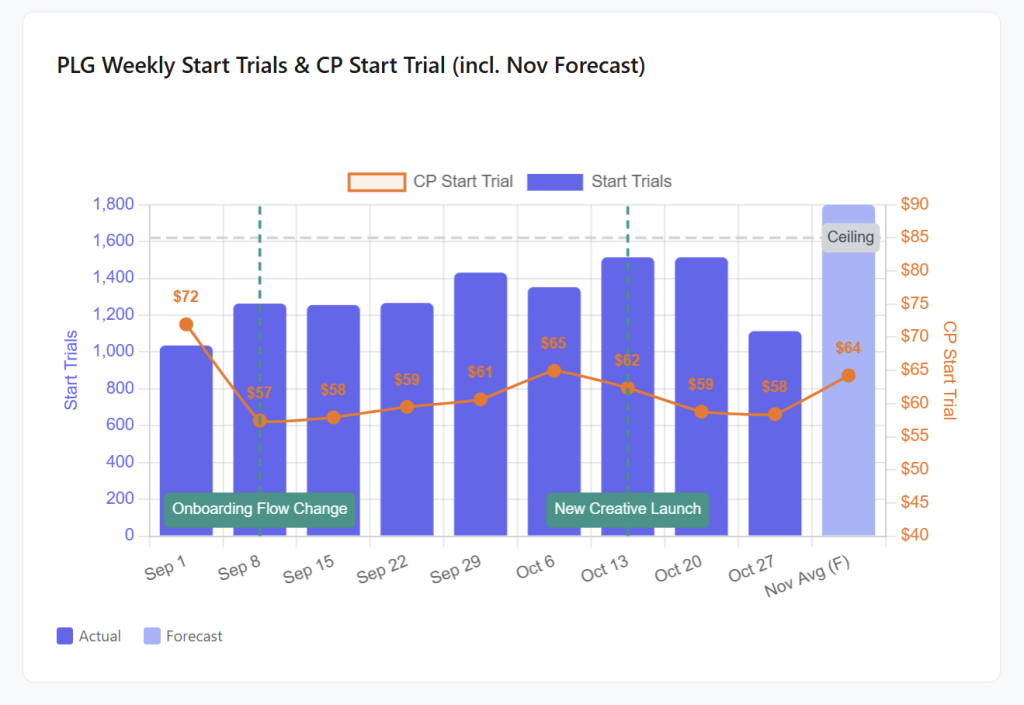
Here’s an example of an artifact for tracking weekly trial starts against cost per trial over a two-month window. The artifact uses the Coupler.io connector to feed Meta Ads data to Claude, and the dashboard updates every time you open it.
Live Artifacts in Claude Cowork
In April 2026, Anthropic introduced Claude Live Artifacts, which take this further. Live Artifacts are persistent dashboards that live in Claude Cowork and pull fresh data every time you open them. You do not need to re-upload files or re-run prompts. Just open the artifact, and the numbers are already updated.
Live Artifacts and persistent storage require a paid plan (Pro, Max, Team, or Enterprise). The Cowork experience runs on Claude Desktop for macOS and Windows.
How to use Claude Artifacts for analytics
Two things need to happen before Claude can build you a dashboard:
- Connect your data sources
- Describe what you want the dashboard to look like.
1. Connect your data to Claude
Claude connects to external services through MCP (Model Context Protocol), Anthropic’s API layer for authentication and data access. You can enable built-in Claude connectors for services like Google Drive, Slack, Jira, and Notion directly from the sidebar. An alternative is to set up custom MCP connections to load API data to Claude from tools not in the directory.
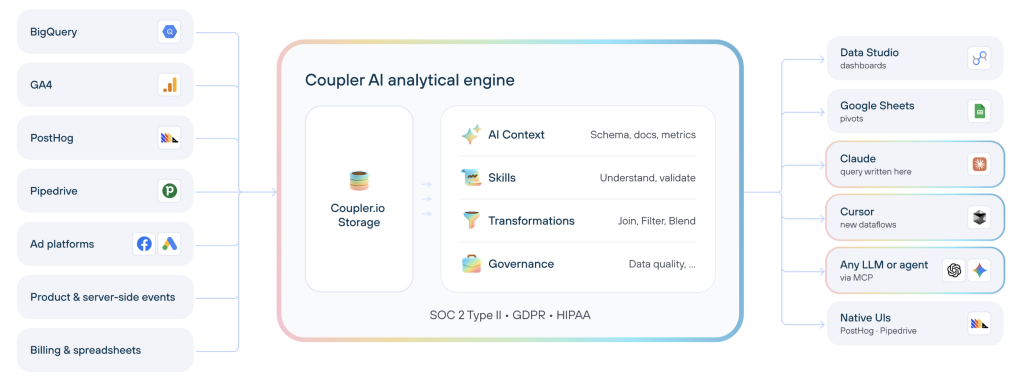
Coupler.io is one of the native Claude connectors, but it’s not limited to a single data source. It allows you to connect data to Claude from over 400 business apps, data warehouses, spreadsheets, etc.
What’s important is that Coupler.io runs calculations through its Analytical Engine before passing results to Claude via MCP. It minimizes the hallucinations LLM can produce. When you ask a question, Claude writes a query, Coupler.io executes it, and only verified results come back.
Gabe Solberg at Right Percent runs this exact workflow. He connected Meta Ads data to his artifacts in Claude through Coupler.io, which allowed him to cut his PPC reporting time by 60%.
Performance marketing is not and never was a static workflow. Being able to connect my performance data across sources to an LLM with Coupler.io creates a truly dynamic AI workflow across reporting, analysis, and forecasting that not only makes me faster but exponentially better at what I do…I like to call this vibe reporting.

Performance marketing is not and never was a static workflow. Being able to connect my performance data across sources to an LLM with Coupler.io creates a truly dynamic AI workflow across reporting, analysis, and forecasting that not only makes me faster but exponentially better at what I do…I like to call this vibe reporting.
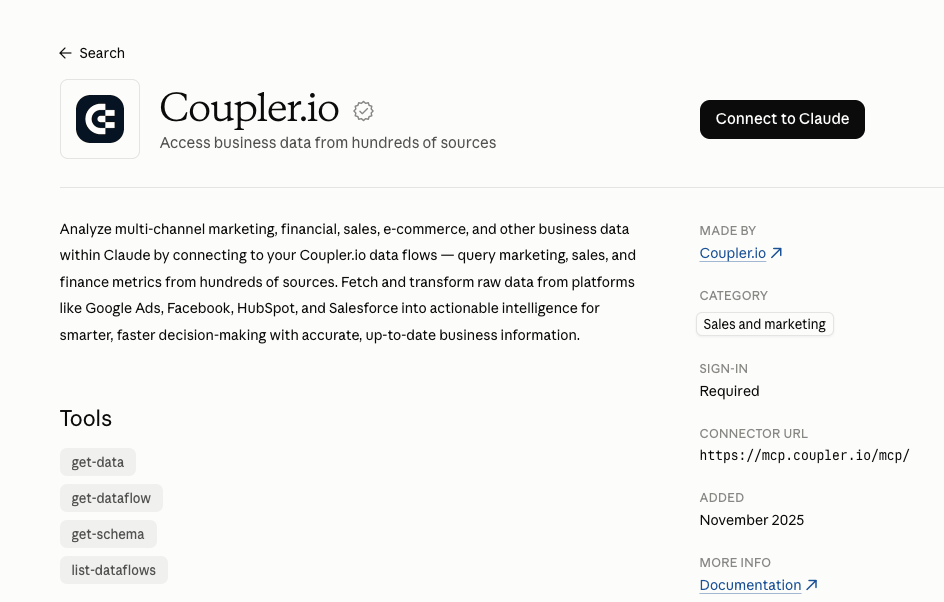
Try it yourself right away for free. Install the Coupler.io connector for Claude and ask AI to create your data flow.
Connect over 400 data sources to Claude
 Try Coupler.io
Connect over 400 data sources to Claude
Try Coupler.io2. Build your first artifact (dashboard)
Unlike dashboard examples in Data Studio or Power BI, getting your first reporting tool off the ground takes about two minutes once Coupler.io is connected. You describe what you want in plain language, and Claude handles the data work and the visualization in the same chat.
Two paths work here, depending on where your data stands.
If you already have a data flow in Coupler.io, point Claude at it. For example, I asked: Build a dashboard showing weekly ad spend by channel, conversions, and ROAS from my connected data.
Claude requested access to the relevant Coupler.io data sets, then returned an interactive panel with charts, filters, and KPI cards.
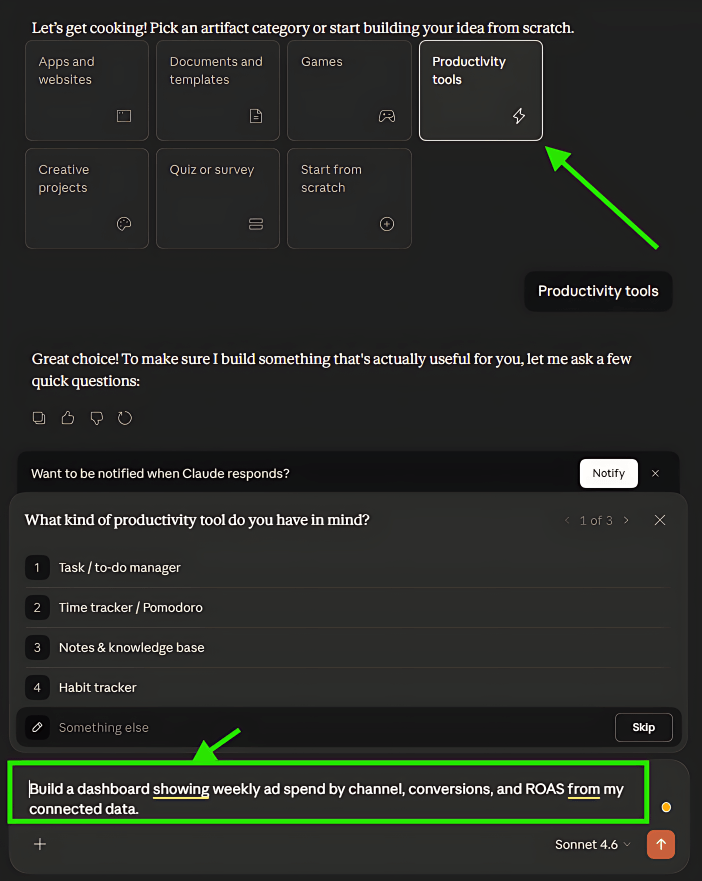
The specificity of your prompt matters. A vague request like “show me my ad data” returns a generic table. A prompt that names the metrics, time range, and breakdowns you care about gives you something you can actually use in a meeting.
Then refine it by chatting. Adjust date ranges, add comparisons, or switch chart types. Preview mode shows the live view, Code mode reveals the HTML and JavaScript for inspection or export. Every change I make with my dashboard is saved in a version history, so I can roll back if needed.
If something goes wrong, I tap the “Try fixing with Claude” option to send error details back for diagnosis. It’s not guaranteed to fix every issue, but it catches most rendering and data-mapping problems on the first pass.
Here is my result.
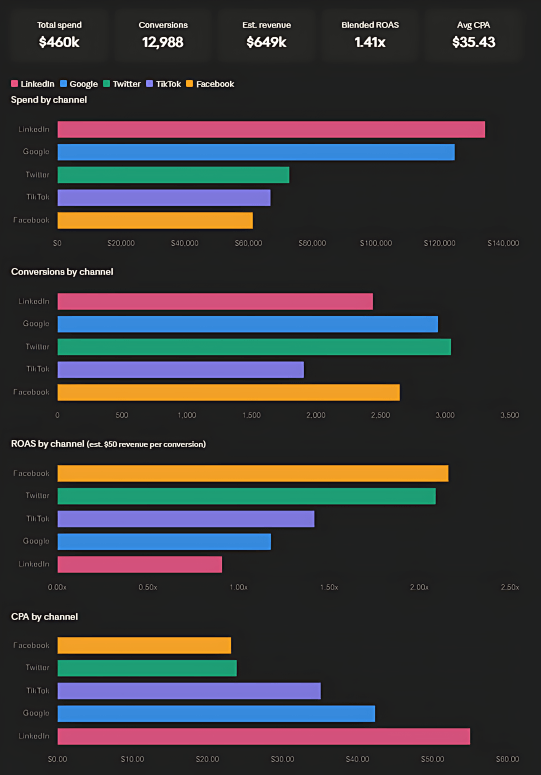
If the Coupler.io data flow doesn’t exist yet, Claude can build it from the same prompt. In a recent test, I asked Claude to join product variants between Shopify and GA4 using a Custom SQL query, add a new destination to the flow, run it, and set up three queries behind the dashboard. Claude handled all of that in sequence without a trip back to the Coupler.io UI. Here is what the result looks like:
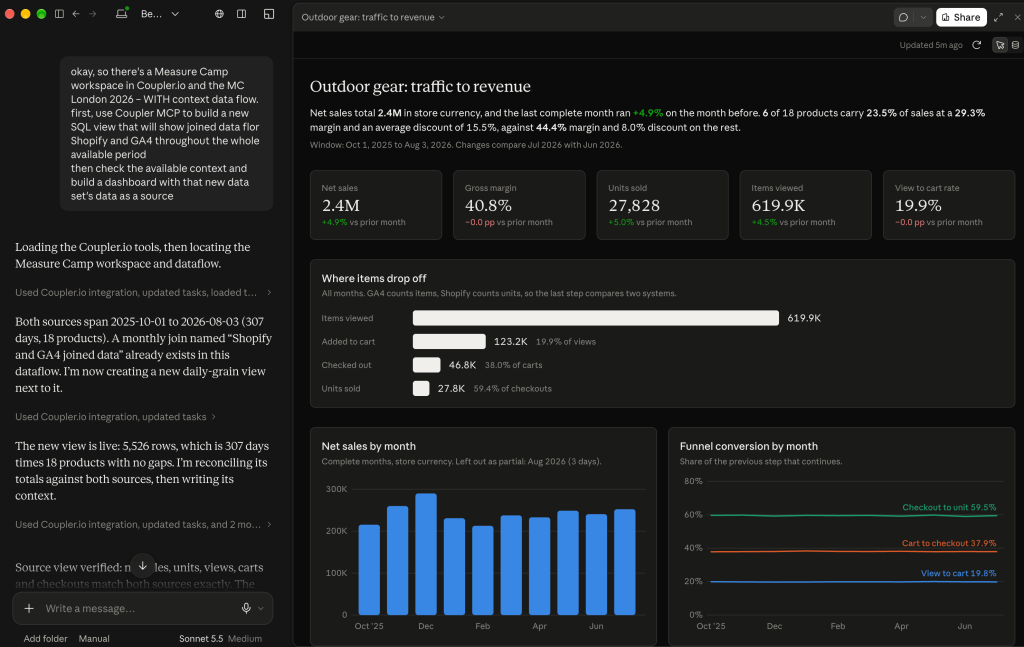
Claude worked through the pipeline in sequence:
- located the dataflow
- created a new daily-grain SQL view next to the existing monthly one
- ran the dataflow to populate it
- reconciled totals against both Shopify and GA4\
- documented the dataset’s context.
It also added a new Claude destination for the view, since the view wasn’t queryable without one.
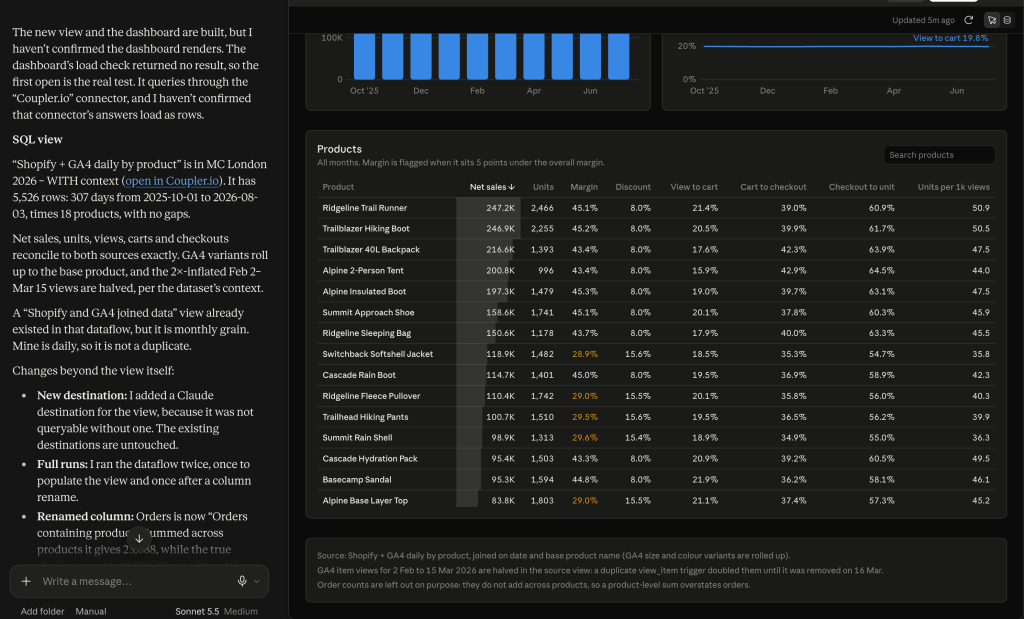
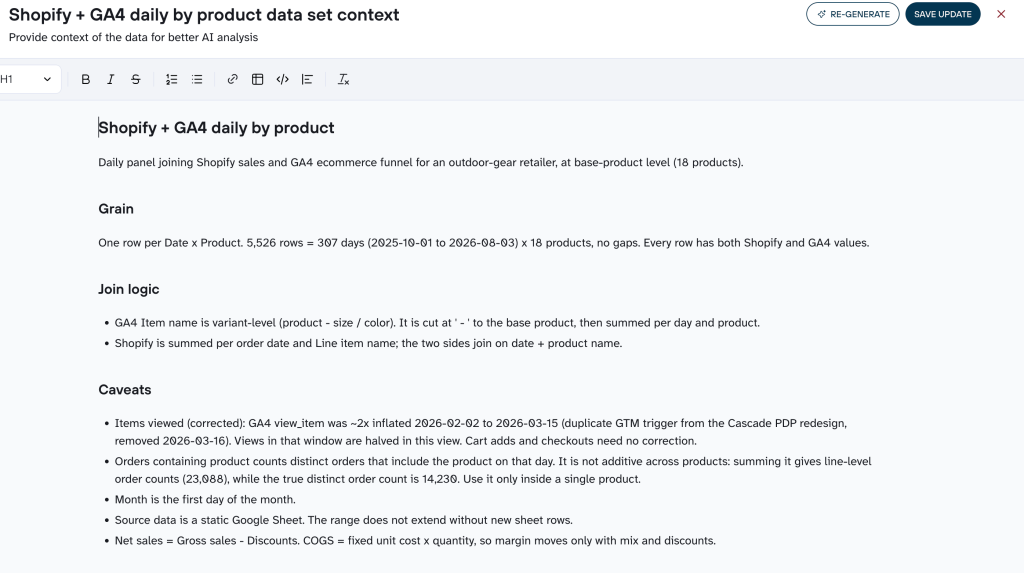
One caveat worth planning for: Claude populated the dataset’s higher-level context (grain, join logic, caveats) but didn’t write per-column schema descriptions. If you want its downstream answers to stay precise, review the dataset context in Coupler.io and add field-level descriptions yourself.
Get your first Claude dashboard with Coupler.io
Get started for freeClaude.ai Artifacts feature highlights for analytics teams
Each Claude Artifacts feature below solves a specific bottleneck that analytics teams hit regularly.
- Persistent storage: On paid plans, artifacts can store information across sessions, up to 20 MB. That’s useful for trackers, logs, or any display that needs to hold onto its state between visits.
- AI-powered artifacts: Claude can run inside the artifact itself, so dashboards re-query their data every time you open them. No manual refresh or re-running a script. If you need fresher data mid-session, hit the refresh button inside the dashboard.
- Publishable and shareable: Publish an artifact and share it with a link. Viewers don’t need a Claude account to see it. Claude users can remix the dashboard into their own editable copy.
For dashboards backed by Coupler.io data, viewers see live data when they have access to both the Claude org and the Coupler.io workspace behind it. Without workspace access, they get a snapshot taken when the dashboard was shared, instead of the live view.
- No-code access: Anyone on the team can build a working analytics dashboard without knowing SQL, Python, or a BI platform. That removes a real bottleneck and lets people spin up prototypes without waiting on one analyst who’s expected to handle all reporting needs.
- Data stays in Coupler.io: Claude doesn’t store your business data. It stores the dashboard page and the dataset definitions (connector, dataset, SQL query). The data itself lives in Coupler.io for live queries, or on your machine if you’ve chosen to work from a snapshot. That means permission changes you make in Coupler.io apply to the dashboard immediately, and nothing sits in Claude that you haven’t explicitly set up.
Claude Artifacts examples for analytics
Most analytics workflows break down at the same point. Your data lives in five different tools, and getting it into one coherent view takes more time than the analysis itself. The examples below show how to fix that.
Each follows the same basic workflow. Coupler.io pulls data from your tools and standardizes it across sources, then passes it to Claude through MCP, a connection layer that gives Claude access to live data. Claude takes it from there, building an interactive dashboard directly in the chat that you can filter, share, or revisit anytime.
The goal is to stop manually reconciling all your tools and improve ecommerce performance with Claude or any other vertical, not to replace the whole suite with a single solution.
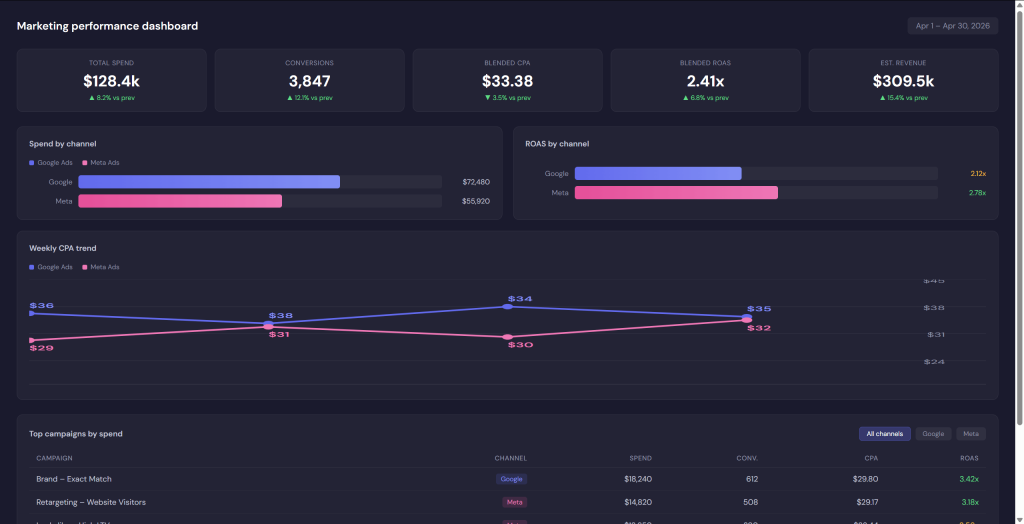
Marketing performance dashboard
One display so you can make budget decisions without jumping between tabs.
The problem: You’re running ads on Google and Meta, and your spend, CPA, and ROAS data live in two separate platforms with different formats. You want one view that makes channel comparisons straightforward.
What Coupler.io does here: Pulls ad data from both platforms and standardizes the field names and currency before passing it to Claude. This is what makes apples-to-apples comparisons possible.
What you get: A dashboard with a spend bar chart broken down by channel, ROAS and CPA trend lines over your chosen date range, and a sortable table of your top campaigns. You can filter by channel, date, and campaign name.
Prompts to try:
- “
Show me spend, conversions, CPA, and ROAS by campaign for the last 30 days across Google Ads and Meta.“ - “
Compare this week to last week by channel. Flag any campaigns where CPA is above $50.“ - “
Give me a one-page summary of the top 5 campaigns by spend this month.“
If the result looks wrong: Open Coupler.io and check that spend, conversions, CPA, and ROAS fields are mapped consistently across both sources. Then re-run your prompt and specify the currency and date range explicitly.
Monitor marketing, sales, and operations in Claude
Try Coupler.io for freeCompetitive intelligence tracker
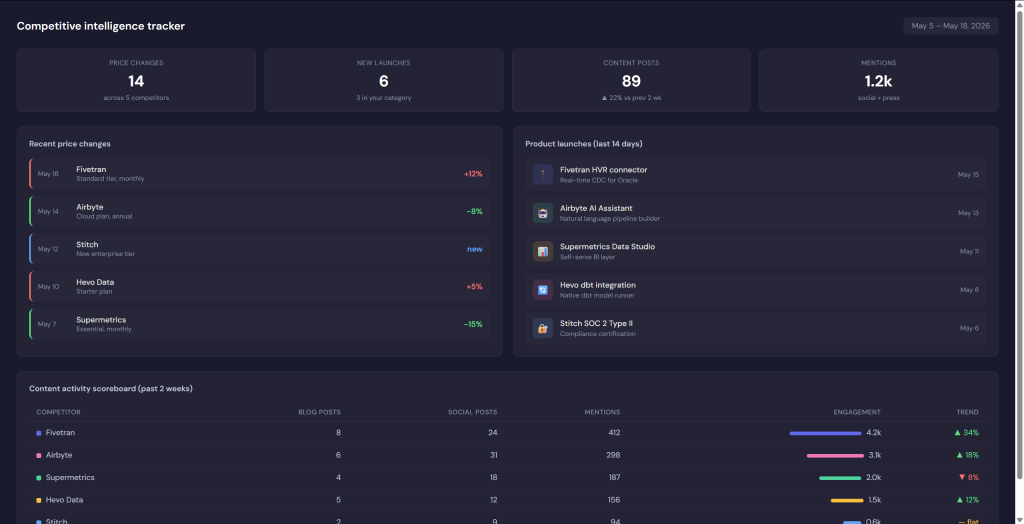
Track competitor pricing changes, product launches, and content activity to inform your planning sessions.
The problem: You want to know when competitors change their prices or release new items before your weekly strategy call, not after.
What Coupler.io does here: Aggregates pricing feeds, merchandise announcements, and content signals from multiple sources into one standardized dataset. Without this step, comparing across competitors is manual and error-prone.
What you get: A tracker showing a timeline of price changes, a calendar of product launches, and content activity (post volume, engagement) broken down by competitor.
Prompts to try:
- “
List price changes by product category for the top 5 competitors over the last 14 days, with percentage change and date.“ - “
Show a weekly summary of product launches and note any correlation with price shifts.“ - “
Give me a one-page content activity scoreboard, posts and mentions by channel, for the past week.”
If the result looks wrong: Check that your Coupler.io sources cover the competitors you care about, and that price units, time zones, and product categories are mapping consistently. Ask Claude for a raw table view first to verify the data before generating charts.
Sales pipeline and revenue monitor
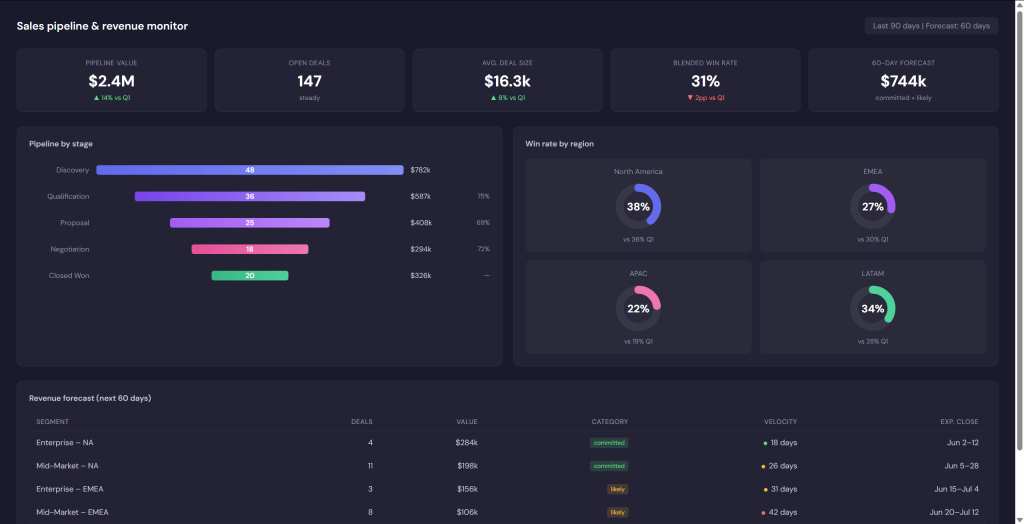
Give your whole team, not just ops, a clear read on where things stand and where they’re headed.
The problem: Your CRM has the deal data, but pulling a clean pipeline view, with win rates, stage-by-stage breakdowns, and a revenue forecast, takes hours of manual work every week.
What Coupler.io does here: Pulls deal data from HubSpot or Salesforce and blends it with other sources like marketing-qualified leads. It standardizes stage names, close dates, and amounts so Claude gets consistent inputs.
What you get: A funnel chart showing deals by stage, win-rate gauges by region or product line, and a revenue forecast table. Built to be readable in a planning meeting, not just by your ops team.
Prompts to try:
- “
Show pipeline health by stage for the last 90 days, with a revenue forecast for the next 60 days.“ - “
Break down win rates by region and product line, and compare to last quarter.“ - “
Flag any stages where deal velocity is dropping compared to the previous period.”
If the result looks wrong: Confirm that CRM field names (stage, close date, deal amount) are mapped correctly in Coupler.io. If numbers look off, ask Claude to show a raw table for one pipeline segment first, then build the visual once you’ve confirmed the data.
Operational KPI morning brief
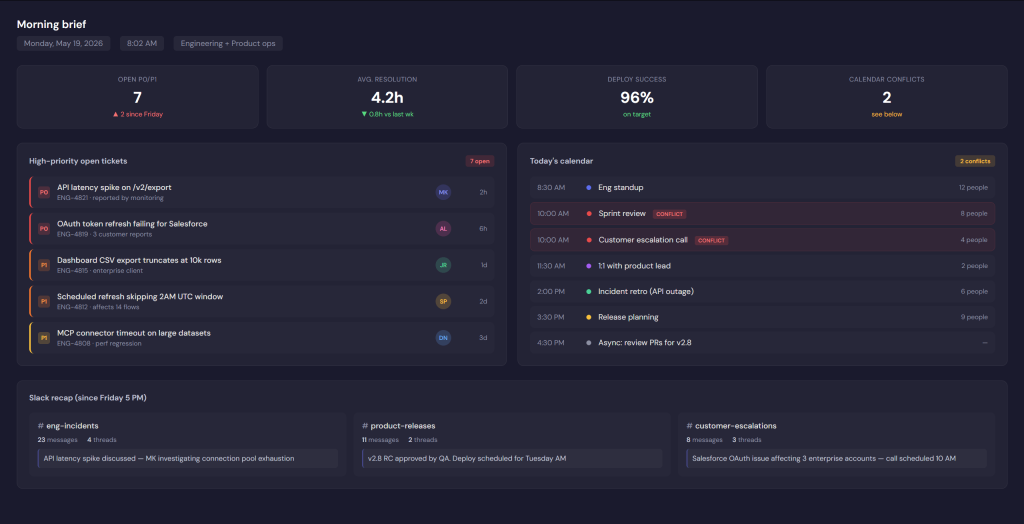
Start the day with a clear head and get a quick breakdown of your key signals in a single document.
The problem: Every morning, you’re checking Slack, your issue tracker, and your calendar separately just to understand what needs attention today.
What Coupler.io does here: Pulls signals from Slack, Linear or Jira, and calendar into one blended dataset. Claude then turns that into a single, readable brief instead of three separate tabs.
What you get: A one-page snapshot of high-priority open tickets, today’s calendar events, and the key operational metrics your team tracks daily. Designed to be skimmed in two minutes.
Prompts to try:
- “
Create today's morning brief: high-priority open tickets, calendar events, and top operational metrics.“ - “
Summarize yesterday's Slack mentions and Jira tickets by priority, plus a quick outlook for today.“ - “
Give me a focused snapshot for the operations team. Urgent items only, plus today's calendar conflicts.”
If the result looks wrong: Narrow the scope in your prompt, specify the teams, channels, or ticket priorities you want included. Then check that your Slack, Jira/Linear, and calendar sources are all feeding into Coupler.io correctly.
Explore your business data in Claude with Coupler.io
Get started for freeWhat to expect and where Claude Artifacts fall short
Claude.ai Artifacts handle a wide range of analytics use cases well, but they sit in a specific position relative to other AI tools and traditional BI platforms.
Where it compares well to other AI tools
Most LLMs can generate charts or analyze a spreadsheet if you paste data into the chat. What sets Claude.ai Artifacts apart is persistence and live connectivity. Your dashboards stay connected to your data sources and update when you open them, rather than requiring a fresh paste every session.
- ChatGPT’s Canvas is built for document-style outputs and works well for writing and code. It doesn’t support MCP connections, so there’s no way to build auto-refreshing dashboards fed by live external data without leaving the chat.
- OpenAI’s data analysis can handle data you upload, but connecting to external platforms requires custom API integrations or plugins set up separately. Claude handles that connection layer through MCP, with permissions set once and reused on every refresh.
- Gemini works well with Google Workspace, which is an advantage if your data already lives in Sheets or Docs. But pulling from a CRM, an ad platform, and a spreadsheet at the same time takes more manual setup. Claude’s MCP workflows handle cross-platform data blending without extra configuration.
- Microsoft Copilot is a strong choice if your team already runs on Microsoft 365. But for teams pulling data from tools across different vendors (HubSpot, Jira, Meta Ads, Slack, and others), Claude connects to more of them out of the box.
Where it falls short compared to traditional BI tools
Claude.ai Artifacts aren’t a replacement for Tableau, Looker, or Power BI. Those platforms offer role-based access controls, embedded analytics, audit logs, and enterprise governance that Claude doesn’t have yet.
If your organization needs org-wide monitoring or has strict data compliance requirements, a dedicated BI tool is still the right call. Claude is better suited to individual analysts, small teams, and fast prototyping use cases where setup speed and conversational iteration matter more than governance infrastructure.
Practical limits to know before you start
- No live co-editing: Two or more people can’t edit the same artifact at the same time, the way Google Docs or Figma allows. When you publish and share the link, others get their own view of your dashboard, and anyone who remixes it works on a separate copy. If you need multiple people building the same dashboard together, plan around this.
- No scheduled refresh: Dashboards re-query their data every time you open them, and the refresh button inside the dashboard forces an immediate re-run. What’s missing is scheduled delivery, meaning automated morning emails or scheduled Slack digests built off the dashboard. If you need those, trigger them from Coupler.io’s own scheduling layer and point the delivery at your usual reporting destination.
- Export options have limits: Dashboards run inside Claude, so there’s no native web publishing. You can export the static HTML for archival or embedding, and the dashboard can be copied into tools like PostHog or Datadog. Those tools need their own access to the underlying data for the dashboard to render live; otherwise they’ll show empty widgets. Some products accept the data as a pushed snapshot, in which case the copied dashboard is live-shaped but stale.
- Sandboxed: Frontend HTML only, no backend or direct database queries. Heavy transformations need to happen upstream. That’s where Coupler.io’s Analytical Engine does the heavy lifting.
- Not a production BI replacement: There’s no role-based access, no embedded analytics, no enterprise governance. It’s best suited for personal use or small teams running quick experiments, not org-wide monitoring.
- No image generation: Charts and SVG work well, but photorealistic visuals aren’t supported. For most analytics work, that’s not a problem. Clear, scalable charts cover most needs, and you can export them for sharing.
- Poor usage limits visibility: Artifact usage counts against your plan, and you won’t see how many credits remain until you hit the cap. Worth keeping an eye on during busy stretches.
Claude.ai Artifacts are ready to use from your sidebar across Claude.com browser mode, mobile, and desktop. If your data is spread across multiple platforms, a good first step is to connect your data using Coupler.io. That way, Claude gets clean, ready-to-use metrics instead of messy raw exports.
Pick the use case closest to your current reporting workflow, copy one of the prompts from the examples above, adjust the metrics to match your data, and go from there.