Facebook Ads cost more in 2026, but they’re also generating more clicks. The most useful Facebook Ads benchmarks are not broad platform averages. Campaign objective, industry, and conversion quality all change the result. For 2026, average cost per click (CPC) is $0.60 for traffic campaigns, cost per lead (CPL) is $27.39 for lead campaigns and ecommerce return on ad spend (ROAS) is 1.88.
This article rounds up the Facebook Ads statistics and benchmarks worth knowing for 2026, by objective, industry, format and use case. You can find the sources of the data at the end.
Top Facebook Ads statistics for 2026
Here are the headline Facebook Ads statistics for 2026:
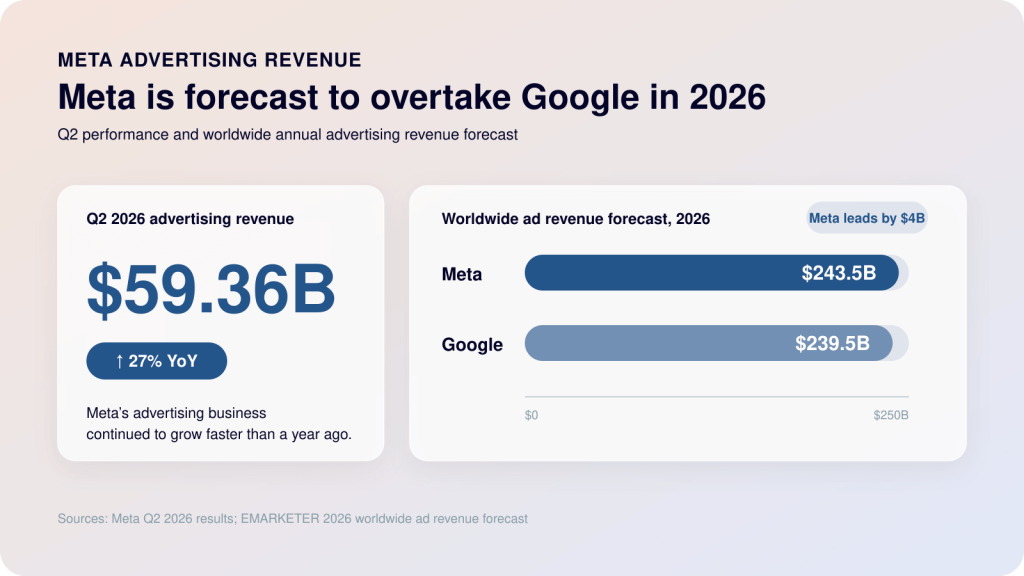
- Facebook ad revenue statistics from Meta show advertising revenue reached $59.36 billion in Q2 2026, up 27% year on year, per Meta’s Q2 results.
- eMarketer forecasts Meta will overtake Google in worldwide ad revenue in 2026, at $243.5 billion versus $239.5 billion. It would be the first time Google does not hold the top spot in digital advertising.
- Facebook’s potential ad reach is 2.35 billion people, based on Facebook advertising audience demographics from Meta’s ad-planning data for October 2025, according to DataReportal. This is an addressable audience estimate, not measured delivery.
- Average price per ad on Meta rose 12% year on year in both Q1 and Q2 2026, while impressions grew 19% and then 14%, per Meta’s earnings calls.
- Facebook Ads average CTR for traffic campaigns is 1.93%, up 12.87%, and average CPC Facebook Ads sits at $0.60, down 14.29%, in WordStream by LocaliQ’s 2026 benchmarks.
- Average cost per lead for Facebook lead campaigns is $27.39, flat year on year, with an 8.54% conversion rate, per the same data.
- Ecommerce brands on Meta see a median Facebook Ads CPM of $15.06 (up 13%), CTR of 2.39% (up 16%) and ROAS of 1.88, according to Triple Whale.
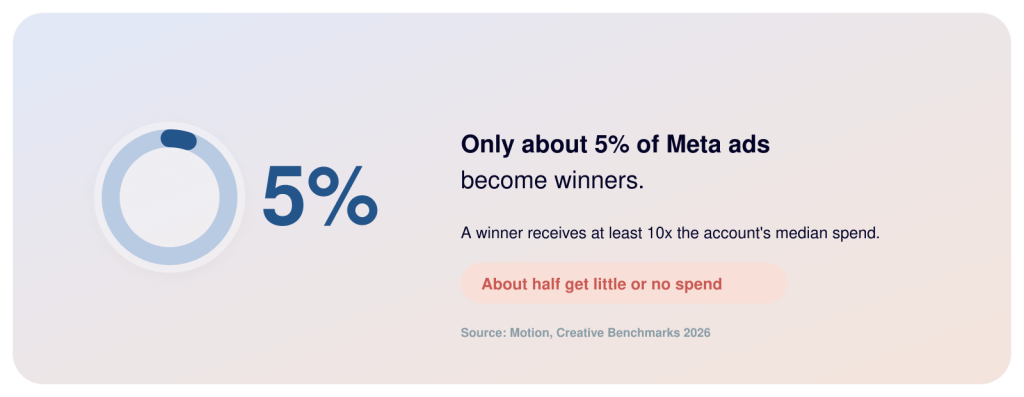
- Only about 5% of Meta ads become “winners”, and roughly half of all ads get little or no spend, in Motion’s analysis of $1.3 billion in spend.
- Advantage+ (Meta’s umbrella name for the AI and automation features in Ads Manager) reached a $75 billion annual revenue run rate, and more than 9 million small businesses now use at least one of Meta’s AI creative tools, per Meta’s Q2 2026 call.
- Meta projected that 10.1% of its 2024 Facebook ad revenue statistics, about $16 billion, came from ads for scams and banned goods, according to internal documents reviewed by Reuters.
- Meta’s Ads Manager history lists 20 resolved incidents in 2026: 12 affected ad delivery, six affected ad creation or editing and two affected reporting.
Key Facebook Ads benchmarks for 2026
Meta’s advertising tools span Facebook, Instagram, Facebook Messenger and WhatsApp. Benchmarks still change with campaign objective: traffic, lead generation and ecommerce campaigns optimize for different actions, so click-through rate (CTR), cost per click (CPC) and conversion rate should not be compared as one average.
| Metric | Traffic campaigns | Leads campaigns | Ecommerce, all objectives | All accounts |
|---|---|---|---|---|
| CTR | 1.93% | 2.70% | 2.39% | 1.9% (all clicks), 1.18% (link clicks) |
| CPC | $0.60 | $1.80 | – | $0.40 |
| CPM | – | – | $15.06 | $7.26 |
| Conversion rate | – | 8.54% | 1.53% | – |
| Cost per lead or acquisition | – | $27.39 (CPL) | $38.99 (CPA) | $17.04 (cost per purchase) |
| ROAS | – | – | 1.88 | 3.16 (purchase ROAS) |
Traffic campaigns generate the lowest Facebook Ads cost per click because Meta optimizes for visits, while lead campaigns pay more for conversion intent. Ecommerce campaigns need a separate reference point because they optimize for revenue across Facebook and Instagram.
The same pattern appears across datasets: Facebook Ads CPM increased, but click performance improved faster. Triple Whale recorded CPM up 13.24% and CTR up 15.97%; Skai recorded CPM up 9%, CTR up 33%, clicks up 53% and CPC down 18%. The pressure has moved from earning the click to converting it.
Facebook Ads benchmarks by industry
Use separate benchmarks for traffic and lead campaigns: traffic campaigns optimize for clicks, while lead campaigns optimize for form submissions. Treat the tables with statistics on Facebook Ads below as a starting point, then set your own benchmarks from your campaign data.
Facebook Ads average CTR and CPC by industry (traffic campaigns)
| Industry | Average CTR | Average CPC |
| Animals & Pets | 1.85% | $0.51 |
| Apparel / Fashion & Jewelry | 1.51% | $0.71 |
| Arts & Entertainment | 2.71% | $0.34 |
| Attorneys & Legal Services | 1.77% | $0.69 |
| Automotive – For Sale | 1.47% | $0.70 |
| Automotive – Repair, Service & Parts | 1.51% | $0.74 |
| Beauty & Personal Care | 2.73% | $0.50 |
| Business Services | 1.64% | $0.70 |
| Dentists & Dental Services | 1.55% | $0.61 |
| Education & Instruction | 1.50% | $0.70 |
| Finance & Insurance | 1.46% | $0.86 |
| Furniture | 1.90% | $0.64 |
| Health & Fitness | 1.86% | $0.64 |
| Home & Home Improvement | 1.76% | $0.63 |
| Industrial & Commercial | 2.06% | $0.54 |
| Personal Services | 1.93% | $0.67 |
| Physicians & Surgeons | 1.90% | $0.61 |
| Real Estate | 2.37% | $0.55 |
| Restaurants & Food | 2.68% | $0.45 |
| Shopping, Collectibles & Gifts | 1.88% | $0.59 |
| Sports & Recreation | 1.77% | $0.59 |
| Travel | 2.28% | $0.42 |
Lead campaign CTR, CPC, Facebook Ads conversion rate and CPL by industry
| Industry | CTR | CPC | Conversion rate | Cost per lead |
| Arts & Entertainment | 3.34% | $0.88 | 15.31% | $14.59 |
| Automotive – For Sale | 2.29% | $2.01 | 4.15% | $35.52 |
| Beauty & Personal Care | 1.35% | $2.97 | 5.63% | $50.91 |
| Career & Employment | 3.52% | $0.73 | 5.38% | $12.30 |
| Dentists & Dental Services | 1.62% | $5.70 | 6.07% | $61.56 |
| Education & Instruction | 1.74% | $1.72 | 15.87% | $26.31 |
| Furniture | 3.78% | $2.18 | 5.66% | $39.25 |
| Health & Fitness | 3.09% | $1.84 | 7.98% | $27.11 |
| Home & Home Improvement | 2.14% | $2.18 | 5.32% | $42.95 |
| Industrial & Commercial | 2.57% | $1.55 | 4.50% | $35.87 |
| Personal Services | 2.24% | $1.62 | 6.61% | $38.09 |
| Physicians & Surgeons | 4.18% | $1.68 | 6.41% | $32.14 |
| Real Estate | 4.17% | $1.27 | 9.95% | $13.74 |
| Sports & Recreation | 3.16% | $1.08 | 6.75% | $15.49 |
Facebook Ads benchmarks for SaaS and cloud companies
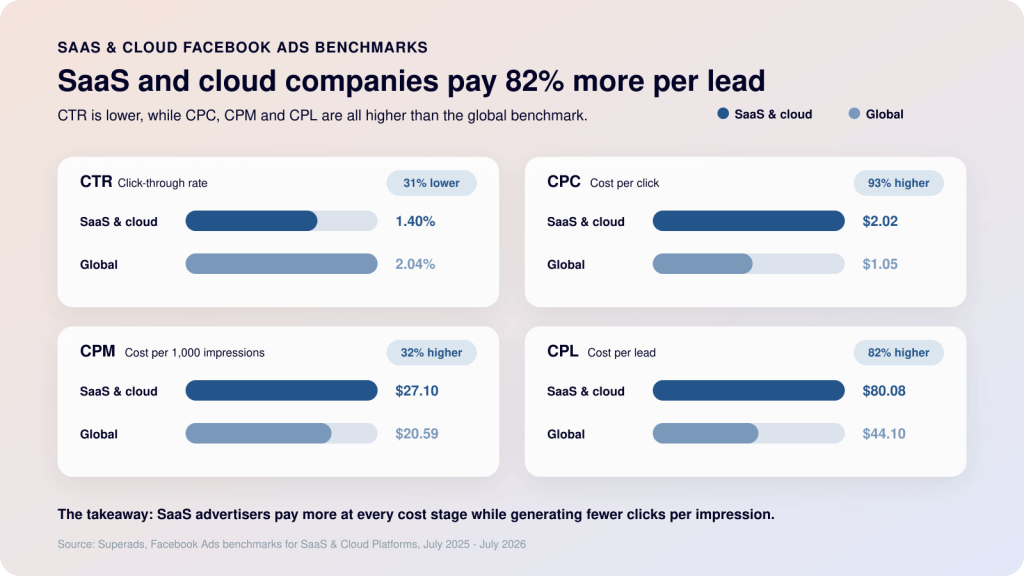
Facebook Ads cost more for SaaS and cloud companies. Across July 2025 to July 2026, Facebook Ads average CTR was 1.40%, 31% below the global benchmark, while CPC was almost twice as high at $2.02. Cost per lead averaged $80.08, compared with $44.10 globally.
| Metric | SaaS & cloud | Global benchmark | Difference |
| CTR | 1.40% | 2.04% | 31% lower |
| CPC | $2.02 | $1.05 | 93% higher |
| CPM | $27.10 | $20.59 | 32% higher |
| CPL | $80.08 | $44.10 | 82% higher |
Pro tip
A benchmark only helps if your own numbers sit next to it at the same level of detail: by objective, by campaign, by placement. Most teams still get there by exporting Ads Manager to a spreadsheet once a month. Coupler.io’s Facebook Ads dashboard helps you track CTR, CPC, CPM and cost per result by campaign, with age, gender and geography breakdowns, and refreshes on a schedule. The Facebook Ads connector behind it also feeds the multi-channel views if you run Google or TikTok alongside.
Why your Facebook Ads results may not match the benchmarks
Facebook Ads statistics show what happens across thousands of campaigns. They do not account for a measurement change, an outage, or a sudden drop in traffic quality in one account.
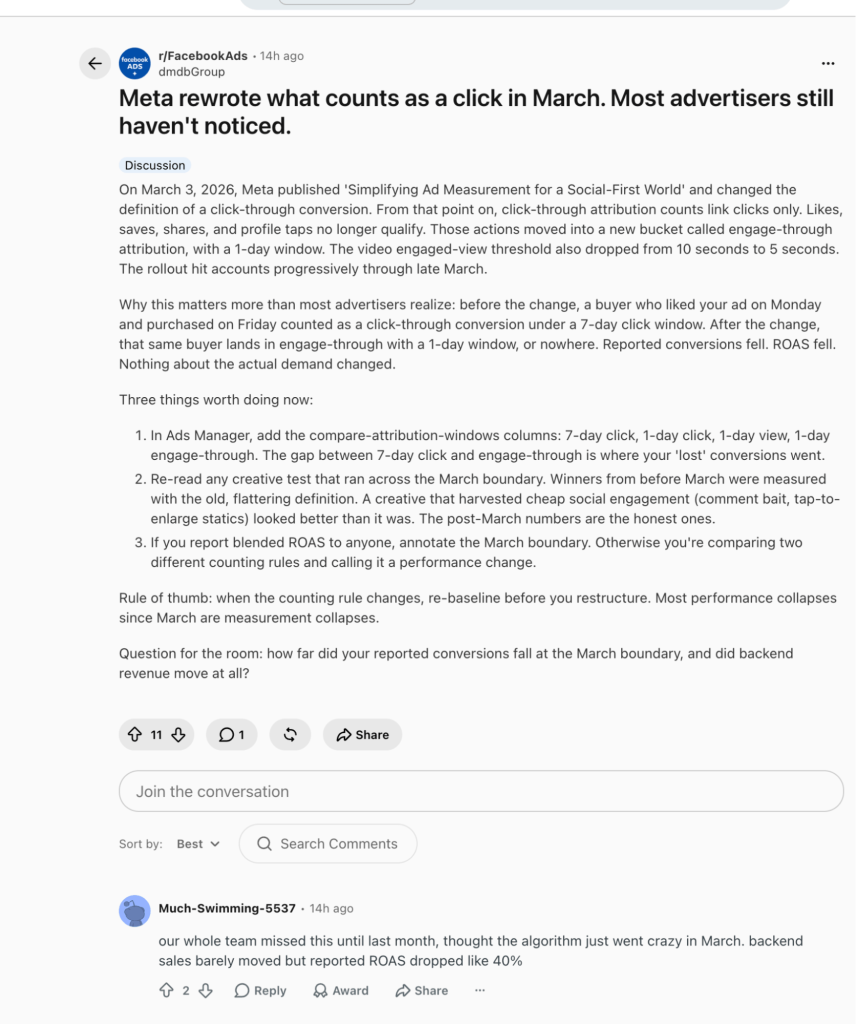
- Meta changed click-through attribution in March 2026. Website and in-store conversions now count as click-through conversions only when someone clicks a link. Likes, shares, saves and other non-link interactions moved to engage-through attribution, and the engaged-view threshold for video ads dropped from 10 seconds to five seconds.
- Meta’s Ads Manager history lists 20 resolved incidents in 2026: 12 affected ad delivery, six affected ad creation or editing and two affected reporting.
The measurement change means results from before and after March are not directly comparable. Reported conversions and ROAS can fall even when backend revenue moves much less.
Outages and performance swings show up in account data before they show up in a benchmark. Advertisers have reported campaigns spending without sales, access problems while ads continue running and sharp daily changes in CPC.
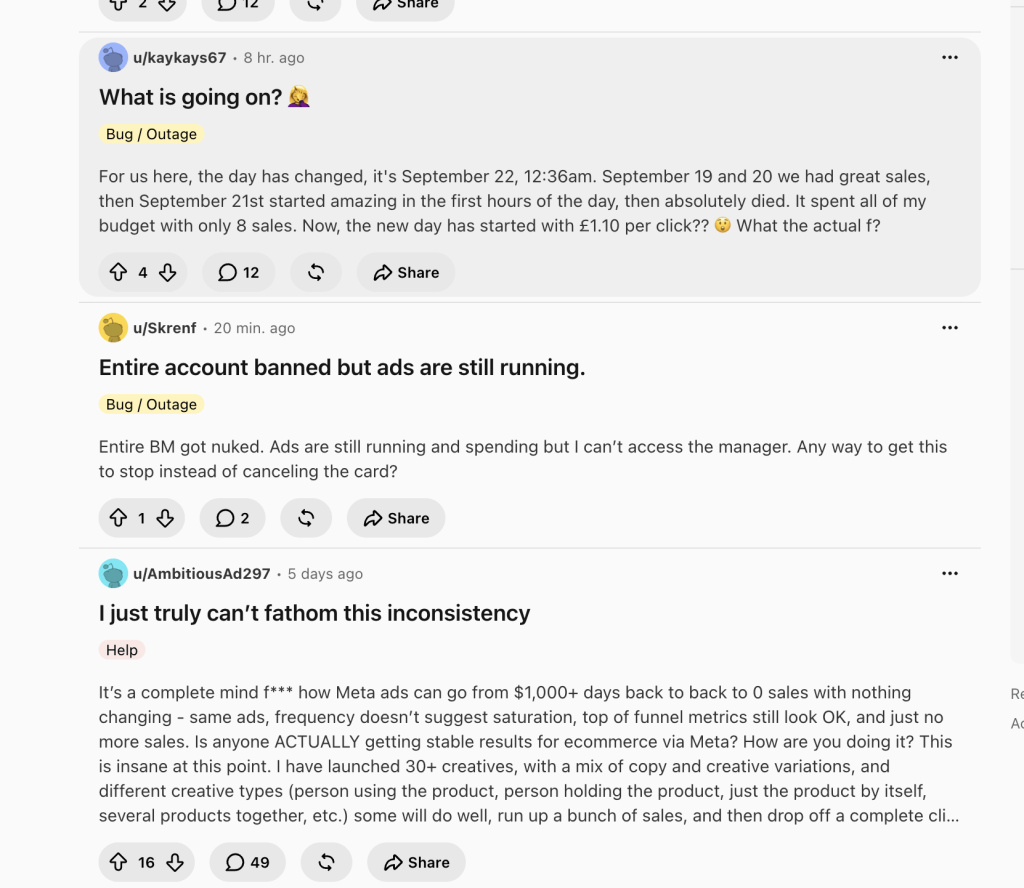
Recent advertiser reports of performance and account-access problems. These are individual experiences, not platform-wide benchmarks. Source: r/FacebookAds.
If results fall suddenly, check Meta’s status page before rebuilding the campaign. Then compare CPM, CTR, conversion rate and backend revenue together:
- Higher CPM with stable CTR points to auction or audience pressure.
- Stable clicks with weaker onsite engagement points to traffic quality or landing-page problems.
- Lower Ads Manager ROAS without a matching fall in backend revenue may be a measurement change.
Facebook Ads Library statistics
Facebook Ads Library statistics shows which ads are running, but it does not show CTR, CPC or ROAS for commercial ads. It’s useful for creative and competitor research, not performance benchmarking. Use it to see which types of ads businesses in your industry are running, then look for ways to make your creative stand out.
- The library covers every active ad across Facebook, Instagram, Messenger, Audience Network and Threads, per Meta’s Transparency Center.
- Ads about social issues, elections or politics are kept for seven years and include spend and reach ranges, according to Meta’s Ad Library documentation.
- Ads shown in the EU are archived for one year with their Facebook advertising audience demographics, including age, gender and location targeting. This is a requirement under the Digital Services Act.
- Meta stopped accepting political, electoral and social-issue ads in the EU in early October 2025.
Facebook Ads ROI statistics
Facebook Ads ROI statistics varies widely by business model and measurement setup:
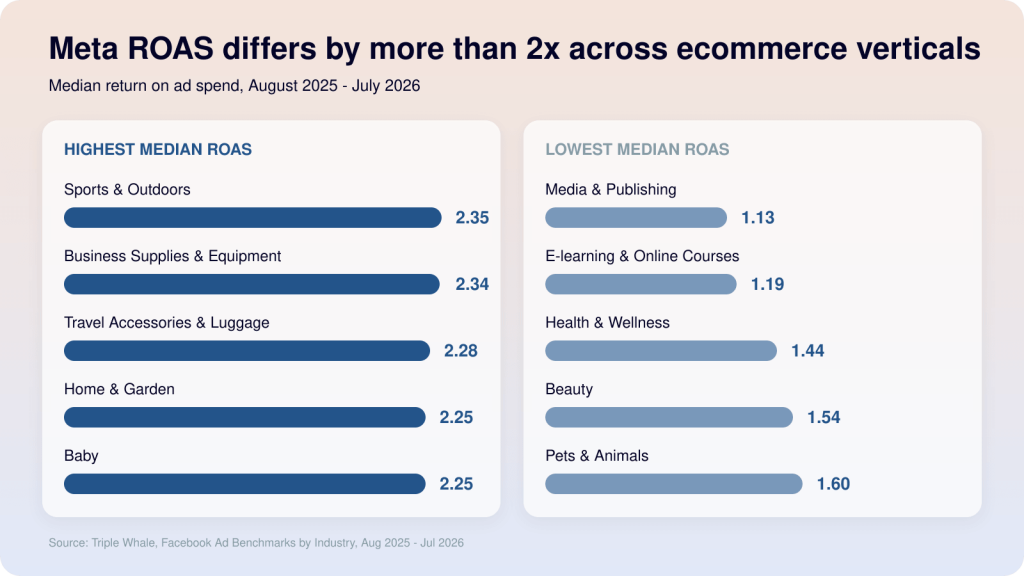
- Median Facebook Ads ROAS for ecommerce brands on Meta is 1.88, up 0.57% year on year, and 12 of 17 verticals improved, according to Triple Whale.
- Sports and Outdoors leads at 2.35, then Business Supplies at 2.34 and Travel Accessories at 2.28. Media and Publishing sits at the bottom at 1.13, with an average order value of $44.67 that leaves almost no room for error.
- Median purchase ROAS across Databox’s benchmark group is 3.16, but the spread is wide: the bottom quartile sits at 0.12 and the top at 7.45.
- Average order value from Meta ads for ecommerce is $73.36, up 3.5%. Travel Accessories and Luggage is highest at $121.18, E-learning lowest at $34.33, per Triple Whale.
- On the cost side, median CPA is $38.99, up 3.14%, and only 3 of 17 ecommerce verticals brought their CPA down year on year.
- Meta’s incremental attribution model, launched in 2025, drove 24% more incremental conversions than its standard attribution model in Q4 2025, according to Meta. The product reached a multi-billion-dollar run rate within seven months.
Facebook Ads in the 2026 marketing mix
Facebook is still a major social media platform in 2026, but it competes for budget with Instagram, TikTok, LinkedIn and YouTube.
- 70% of companies use Facebook for marketing, level with Instagram at 70% and ahead of YouTube at 69% and TikTok at 57%. Small businesses lean hardest on it at 77%; mid-market and enterprise sit at 67% and 66%.
- Asked where they plan to invest most in 2026, marketers put TikTok and Instagram first at 19% each, then Facebook and YouTube at 18%.
- Across all marketing channels, paid social ranks second for ROI at 26% of marketers, one point behind SEO at 27%.
- 73% say their budgets are more heavily scrutinised than they used to be. Even so, 93% expect budgets to stay flat or grow, and 37% plan to increase paid social spend, level with video and one point behind AI chatbots at 38%.
Pro tip
Tracking campaign performance across channels in one view helps you optimize budget allocation. Coupler.io’s PPC dashboard puts Facebook, Instagram, Google and TikTok spend, revenue and cost per purchase in one view, and the multi-channel ROAS template does the same with ROAS as the headline metric. Once the data is in one place, the “should we move budget to TikTok” conversation gets a lot shorter.
Facebook Ads statistics by campaign objective
Campaign objective changes which benchmark matters. Traffic campaigns optimize for visits, lead campaigns for form submissions and ecommerce campaigns for purchases, so each needs a different reference point.
Lead generation campaign objective statistics
- Facebook lead campaigns average a 2.70% CTR (up 4.25%), $1.80 CPC (down 6.25%), 8.54% average conversion rate (down 0.98%) and $27.39 cost per lead (down 0.98%), per WordStream by LocaliQ.
- The highest lead-campaign CTRs are Physicians and Surgeons at 4.18%, Real Estate at 4.17% and Furniture at 3.78%. Beauty and Personal Care is lowest at 1.35%.
- The highest lead conversion rates are Education at 15.87% and Arts and Entertainment at 15.31%. Automotive For Sale is lowest at 4.15%.
Lead performance improved at the top of the funnel: clicks became cheaper and cost per lead stayed almost flat. Lead quality still determines whether that efficiency turns into revenue.
Average CPC Facebook Ads for traffic campaigns
- Facebook traffic campaigns average a 1.93% CTR, up 12.87%, and a $0.60 CPC, down 14.29%, per WordStream by LocaliQ.
- In LocaliQ’s comparison of its 2026 benchmark sets, Google Ads CPC is more than double the average CPC Facebook Ads figure.
- Across paid social as a whole, clicks rose 53% year on year in Q2 2026 while CPC fell 18%, according to Skai.
Facebook Ads ROAS for sales campaigns statistics
- Ecommerce campaigns on Meta convert 1.53% of clicks, down 4.73%, at a median CPA of $38.99 and Facebook Ads ROAS of 1.88, per Triple Whale. Food and Beverage converts best at 1.89%; Medical Devices worst at 1.09%.
- Electronics is the clearest warning: CTR rose 21.5%, but conversion rate fell 15.7%. More clicks do not help if the offer, landing page or call-to-action cannot convert them. Test CTAs against the promise made in the ad.
- Meta reports that its ranking upgrades lifted Facebook conversions 15.7% in Q2 2026 and increased Facebook Ads conversion rate for landing-page-view ads by more than 6% in Q1. These are Meta-reported tests, not independent benchmarks.
- Meta’s value optimization suite, which bids for the highest-value conversions rather than the most conversions, passed a $20 billion annual run rate in Q1 2026, more than doubling year on year.
Facebook Ads CPM for awareness and reach campaigns stats
Use potential reach to estimate audience size and decide whether the target audience is large enough. Then use your own CPM, frequency and incremental-reach data to judge a brand awareness campaign. A global estimate cannot tell you whether your campaign performed well.
- Facebook’s potential ad reach is 2.35 billion, according to DataReportal’s analysis of Meta’s ad-planning data for October 2025.
- Potential reach is a planning estimate. It is not the number of people who saw an ad, and it is not the same as monthly active users or daily active users. Do not use it as a delivery metric.
Facebook Ads stats by content format
Creative performance is concentrated in a small number of ads. Most new ads never receive enough spend to prove themselves, which makes testing volume as important as testing different ad formats.
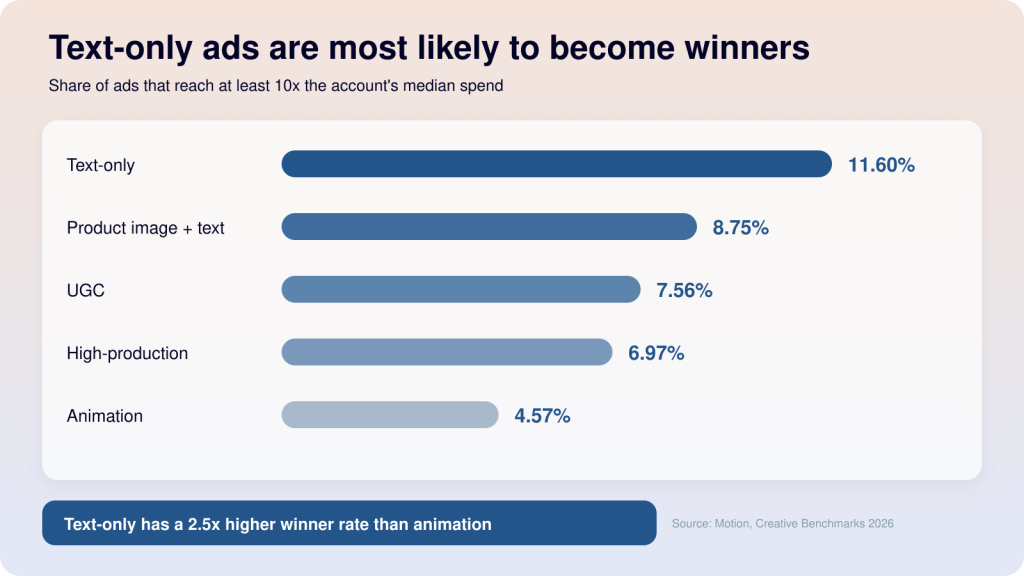
Motion’s benchmark covers more than 550,000 Facebook and Instagram ads and about $1.3 billion in spend. A winner is an ad that receives at least 10 times the account’s median spend.
- By asset type, text-only ads had the highest hit rate at 11.60%, followed by product images with text at 8.75% and UGC at 7.56%.
- High-production assets reached 6.97%, while animation came in at 4.57%. Simple creative does not mean weak creative.
Facebook video ads statistics also point to a larger share of attention and ad delivery:
- 48% of Facebook users say short-form video is the content they interact with most, then text posts at 32% and live video at 22%, in Sprout Social’s 2026 content strategy research.
- Instagram Reels account for 35% of ad impressions in Tinuiti’s Q2 2026 benchmark report.
- Facebook video ads statistics from Meta show time spent rose 9% globally in Q2 2026, and over 10% in the US and Canada. Nearly 10% of daily Reels views now come from content made in Meta’s Edits app.
- Meta’s video generation tools reached a $10 billion annual run rate in Q4 2025, growing almost three times faster than ads revenue overall.
Pro tip
A benchmark tells you what worked across 550,000 ads. It cannot tell you why video beat static in your account last month or which audience and placement drove the result. That question needs your data, not an average. Coupler.io pulls Facebook Ads into a dashboard on a schedule, and you can connect the same data flow to Claude or ChatGPT. This way, your Facebook Ads analytics live in a plain-language conversation with AI. You get answers based on your actual campaigns rather than guesses from the industry median. Coupler.io runs the numbers; the model explains them.
Ecommerce Facebook Ads spending statistics
Ecommerce Facebook Ads spending statistics show the 2026 trade-off most clearly: clicks are increasing, but conversion rates are slipping.
- Triple Whale brands put 66.88% of their total ad budget on Meta.
- The medians: CPM $15.06 (up 13.24%), CTR 2.39% (up 15.97%), conversion rate 1.53% (down 4.73%), CPA $38.99 (up 3.14%), ROAS 1.88 (up 0.57%), AOV $73.36 (up 3.50%). Here, CPA means cost per acquisition, not cost per action.
- CTR rose in all 17 verticals, by between 3.89% and 29.38% while CPM rose in 16 of 17 and CPA rose in 14 of 17. More clicks, at a higher price, converting slightly less.
- The cheapest customers to acquire are in E-learning at $26.80, Baby at $29.61 and Books and Music at $30.69.
- The most expensive are Electronics and Medical Devices, both at $51.86, with Travel Accessories close behind at $50.95.
- Health and Wellness has both the highest CTR, 3.02%, and the highest CPM, $21.80, up 18.96% in a year.
- E-learning was the only vertical where CPM fell, down 6.61%, and it also posted the biggest CTR gain at 29.38%.
Automation can improve the ecommerce Facebook Ads spending statistics when audience, placement and budget optimization work together. After Indian apparel brand Underneat moved from manual setup to Advantage+ sales campaigns, it reported a 13% incremental lift in purchases and 16% more add-to-cart conversions. This is a Meta case study rather than a general benchmark.
The ecommerce pattern is consistent: CTR improved, conversion rate slipped and acquisition cost increased. More creative volume may win the click, but the landing page and offer still determine whether that click pays back.
Pro tip
Ecommerce funnels leak between the click and the purchase: CTR up in every vertical, conversion down in eleven of them. Coupler.io’s ecommerce dashboard and the Facebook Ads ecommerce performance template track the funnel from impression to purchase, and the Shopify dashboard joins ad spend to actual orders so ROAS is calculated on revenue that landed, not revenue Ads Manager claimed.
Facebook Ads bots, invalid traffic and scam ads
Invalid traffic and scam advertising create two different costs. Invalid traffic wastes spend on clicks that were never genuine prospects while scam ads compete with legitimate advertisers in the same auctions.
Invalid-traffic rates vary by detection method. Use these statistics on Facebook Ads as risk indicators, not as a precise estimate of wasted ad spend.
- Lunio, which sells click-fraud protection, estimates that 8.20% of Meta ad clicks are invalid. Its 2026 report analysed 2.7 billion paid clicks across five platforms; the reported all-channel average was 8.51%.
- Lunio estimates invalid traffic cost advertisers $63 billion across all channels in 2025.
- Lead generation campaigns have 32% higher invalid-traffic rates than transactional campaigns.
- Zooming out, 53% of all web traffic was automated in 2025 and 40% came from bad bots, the seventh consecutive year of growth, according to Imperva’s 2026 Bad Bot Report.
- Meta estimates that violating accounts, including bots and spam, represented less than 5% of worldwide daily active people in 2025. The estimate is based on a limited sample and rose after a methodology change. This is not an estimate of invalid ad clicks and should not be converted into an account count.
The Lunio and Meta figures are not directly comparable. Lunio measures paid-click quality, while Meta measures violating accounts. Neither can validate or calculate the other.
Hundreds of clicks do not help if the visits do not behave like prospects. One advertiser reported that clicks remained high while conversion rates collapsed and session recordings showed unusually linear scrolling across client accounts. This does not prove that Meta is sending bots. It is a reason to compare Ads Manager clicks with sessions, engagement and backend conversions.
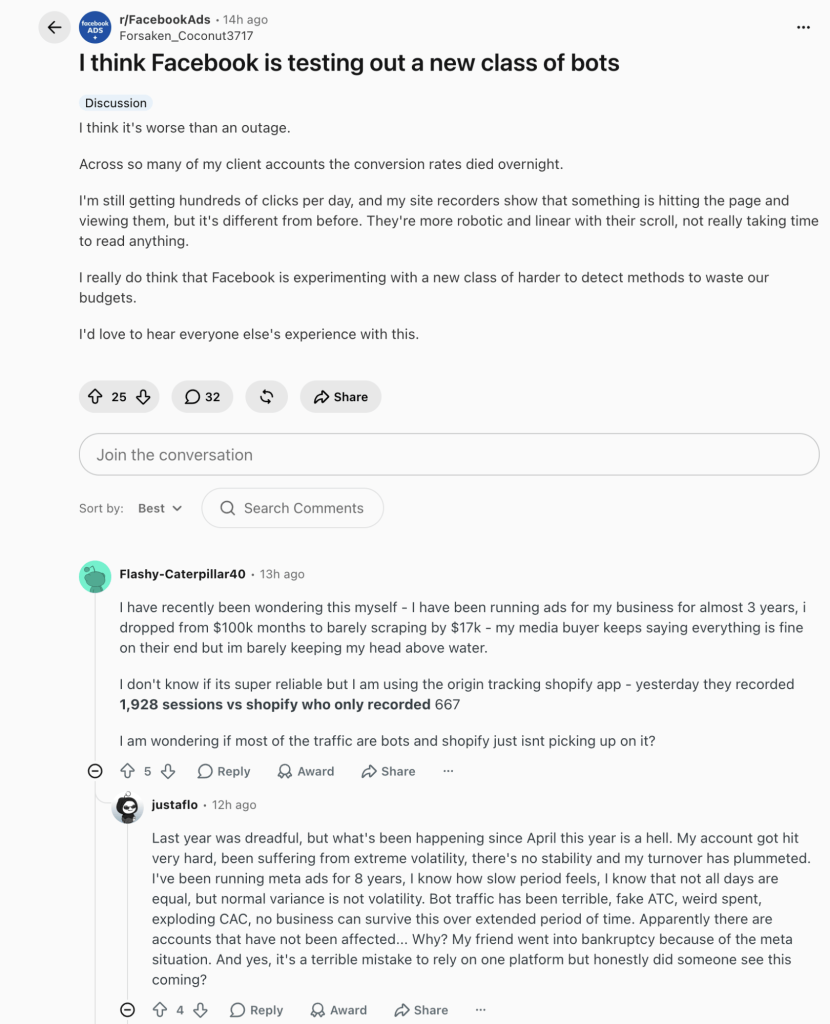
An advertiser describes a sudden drop in conversion quality across client accounts. This is an individual report, not evidence of a platform-wide bot test. Source: r/FacebookAds.
Scam ads create a separate problem because fraudulent advertisers compete for the same inventory as legitimate campaigns.
- Internal Meta documents reviewed by Reuters projected that 10.1% of 2024 revenue, about $16 billion, would come from ads for scams and banned goods.
- The documents estimated that Meta showed about 15 billion higher-risk scam ads per day and was involved in as much as one-third of successful US scams.
- According to Reuters, Meta’s systems required 95% certainty before automatically banning a suspected fraud advertiser; some advertisers below that threshold were charged higher ad rates instead.
- Meta said the 10.1% estimate was rough and overly inclusive. It also removed more than 134 million pieces of scam ad content in 2025.
Pro tip
A persistent gap between Ads Manager clicks and GA4 sessions is a signal to investigate, not proof of fraud. Consent settings, redirects and slow pages can create the same pattern. Use Coupler.io’s PPC dashboard to look at both sources side by side and catch gaps before the end-of-month report.
AI in Facebook Ads
Meta attributes much of the 2026 improvement in ad clicks and conversions to its AI ranking, optimization and creative tools. These are Meta-reported results rather than independent benchmarks.
Meta reported the following performance changes:
- The GEM ads ranking model, combined with LLM-based understanding of users’ ads and organic activity, generated an 8.3% increase in ad clicks and a 15.7% uplift in conversions on Facebook in Q2 2026, per Meta’s Q2 earnings call.
- In Q1 2026, improvements to Lattice and GEM drove a 6% increase in Facebook Ads conversion rate for landing-page-view ads, and extending Adaptive Ranking to offsite conversions added another 1.6%.
- In Q4 2025, doubling the compute behind GEM and adopting a new sequence-learning architecture lifted ad clicks on Facebook by 3.5%, and a new runtime model across Instagram surfaces lifted conversion rates by 3%. Consolidating surfaces into Meta Lattice raised “ads quality” by 12%, per Meta’s newsroom.
- Meta’s incremental attribution model drove 24% more incremental conversions than standard attribution, and passed a multi-billion-dollar run rate seven months after launch.
- In Q2 2026, Meta introduced Meta Generative Recommender, which uses large language models to evaluate ad content and user preferences together.
Advertiser AI adoption is growing, but these figures do not represent the total number of active advertisers:
- Advantage+, Meta’s suite of automated campaign tools, reached a $75 billion annual revenue run rate in Q2 2026.
- More than 9 million small businesses use at least one of Meta’s generative AI ad creative tools, up from 8 million in Q1. Image generation adoption more than doubled during the quarter.
- Meta’s video generation tools hit a $10 billion run rate in Q4 2025. Advertisers using video generation saw more than 3% higher conversion rates in tests, per Meta’s Q1 call.
- The Meta AI business assistant is now available to all eligible advertisers, and Meta ads AI connectors, launched in open beta in April 2026, let advertisers connect their ad account directly to an AI agent.
- Away from Meta’s own data, 62% of marketers use generative AI tools daily, according to Social Media Examiner.
- EMARKETER attributes its forecast of 24.1% growth for Meta in 2026 to Advantage+, AI-generated creative and Reels.
AI adoption does not remove the creative problem:
- 80% of marketers use AI for content creation, according to HubSpot’s 2026 State of Marketing.
AI makes it cheaper to produce more variants, but it does not make every variant effective. Motion’s 5% winner rate puts Meta’s performance claims in context: more output only helps when the testing process can identify what works.
AI performance and Facebook Ads ROI statistics still need to be measured against your own campaign data. Coupler AI Claude integration is one way to get there: Facebook Ads data is delivered on a schedule with its schema attached, so the model interprets the results instead of calculating them.
What the 2026 Facebook Ads cost numbers add up to
Facebook Ads became more expensive in 2026, but the additional cost is producing more traffic. CPM increased, but traffic CPC fell and ecommerce CTR rose across most verticals. Lead cost stayed almost flat.
The harder part is turning those clicks into revenue: ecommerce conversion rate slipped, and higher engagement alone does not fix weak offers or landing pages.
Test enough creative to find the small share of winners, then judge performance against revenue in your own account. Facebook Ads statistics and benchmarks provide context; they do not replace your own data. Compare them with live campaign data in this dashboard.
Sources
- WordStream by LocaliQ, Facebook Ads Benchmarks 2026
- Triple Whale, Facebook Ad Benchmarks by Industry (Updated 2026 Data)
- Meta Platforms, Second Quarter 2026 Results
- Meta Platforms, Q2 2026 Earnings Call Transcript
- Meta Platforms, Q1 2026 Earnings Call Transcript
- Meta Newsroom, 2026: AI Drives Performance
- Meta Platforms, Form 10-K for fiscal year 2025
- Meta Transparency Center, Ad Library tools
- Meta Ad Library Report
- Motion, Creative Benchmarks 2026
- Databox, Facebook Ads Benchmarks
- EMARKETER, Meta to Surpass Google in Digital Ad Revenues for First Time Ever
- Tinuiti, Digital Ads Benchmark Report Q2 2026
- Skai, Q2 2026 Digital Marketing Quarterly Trends Report
- HubSpot, 2026 State of Marketing Report
- Social Media Examiner, 2026 Social Media Marketing Industry Report
- DataReportal, Digital 2026 Global Overview Report
- Sprout Social, 2026 Social Media Content Strategy Report
- Lunio, 2026 Global Invalid Traffic Report
- Reuters, Meta is earning a fortune on a deluge of fraudulent ads, documents show (6 November 2025)
- Reuters, Meta created ‘playbook’ to fend off pressure to crack down on scammers, documents show (31 December 2025)
- Imperva, 2026 Bad Bot Report
- Superads, Facebook Ads benchmarks for SaaS & Cloud Platforms: CTR, CPC, CPM and cost per lead
- Meta, Simplifying Ad Measurement for a Social-First World
- Meta, Ads Manager status history
- r/FacebookAds, Meta rewrote what counts as a click in March. Most advertisers still haven’t noticed
- r/FacebookAds, I think Facebook is testing out a new class of bots
- r/FacebookAds, advertiser reports of outages and performance swings