When managing PPC (pay-per-click) campaigns across multiple platforms, you’re often dealing with fragmented data. Google Ads shows one set of metrics, Meta presents another, and website performance is tracked separately in GA4. This makes it difficult to measure true ROI, optimize your campaigns, or identify inefficiencies.
To gain a clear, centralized view of performance, you need a Google Analytics PPC dashboard. Explore how to build such a dashboard and use it to analyze paid campaigns.
What is a Google Analytics PPC dashboard?
A GA4 PPC dashboard is a custom reporting environment that brings together paid campaign data and on-site metrics. Unlike standalone Google or Facebook Ads PPC analytics, it lets you assess ad effectiveness beyond surface-level figures like click-through rate by connecting those results to user behavior after the click.
For example, instead of just seeing that a Google Ads campaign has a 5% CTR, the dashboard can show that users from that campaign viewed an average of three product pages, spent over two minutes on site, and had a 7% conversion rate. ??This helps reveal which ads attract qualified traffic, how users interact with the site, and what ultimately drives conversions.
Benefits of using a Google Analytics PPC dashboard
A well-structured GA4 PPC dashboard saves time, reduces guesswork, and eliminates the need to switch between multiple PPC reporting interfaces. Instead of piecing together insights from fragmented reports, you gain a single source of truth. This enables better decision-making, budget allocation, and understanding of how ads influence business results.
To give you an idea, look at the Google Analytics PPC dashboard example by Coupler.io. It helps you uncover the contribution, opportunities, and challenges unique to each ad platform. You’ll be able to view metrics side by side, spot trends, and check performance across selected channels: Google, Microsoft, Meta, LinkedIn, X, TikTok, Snapchat, Quora, or Pinterest Ads.
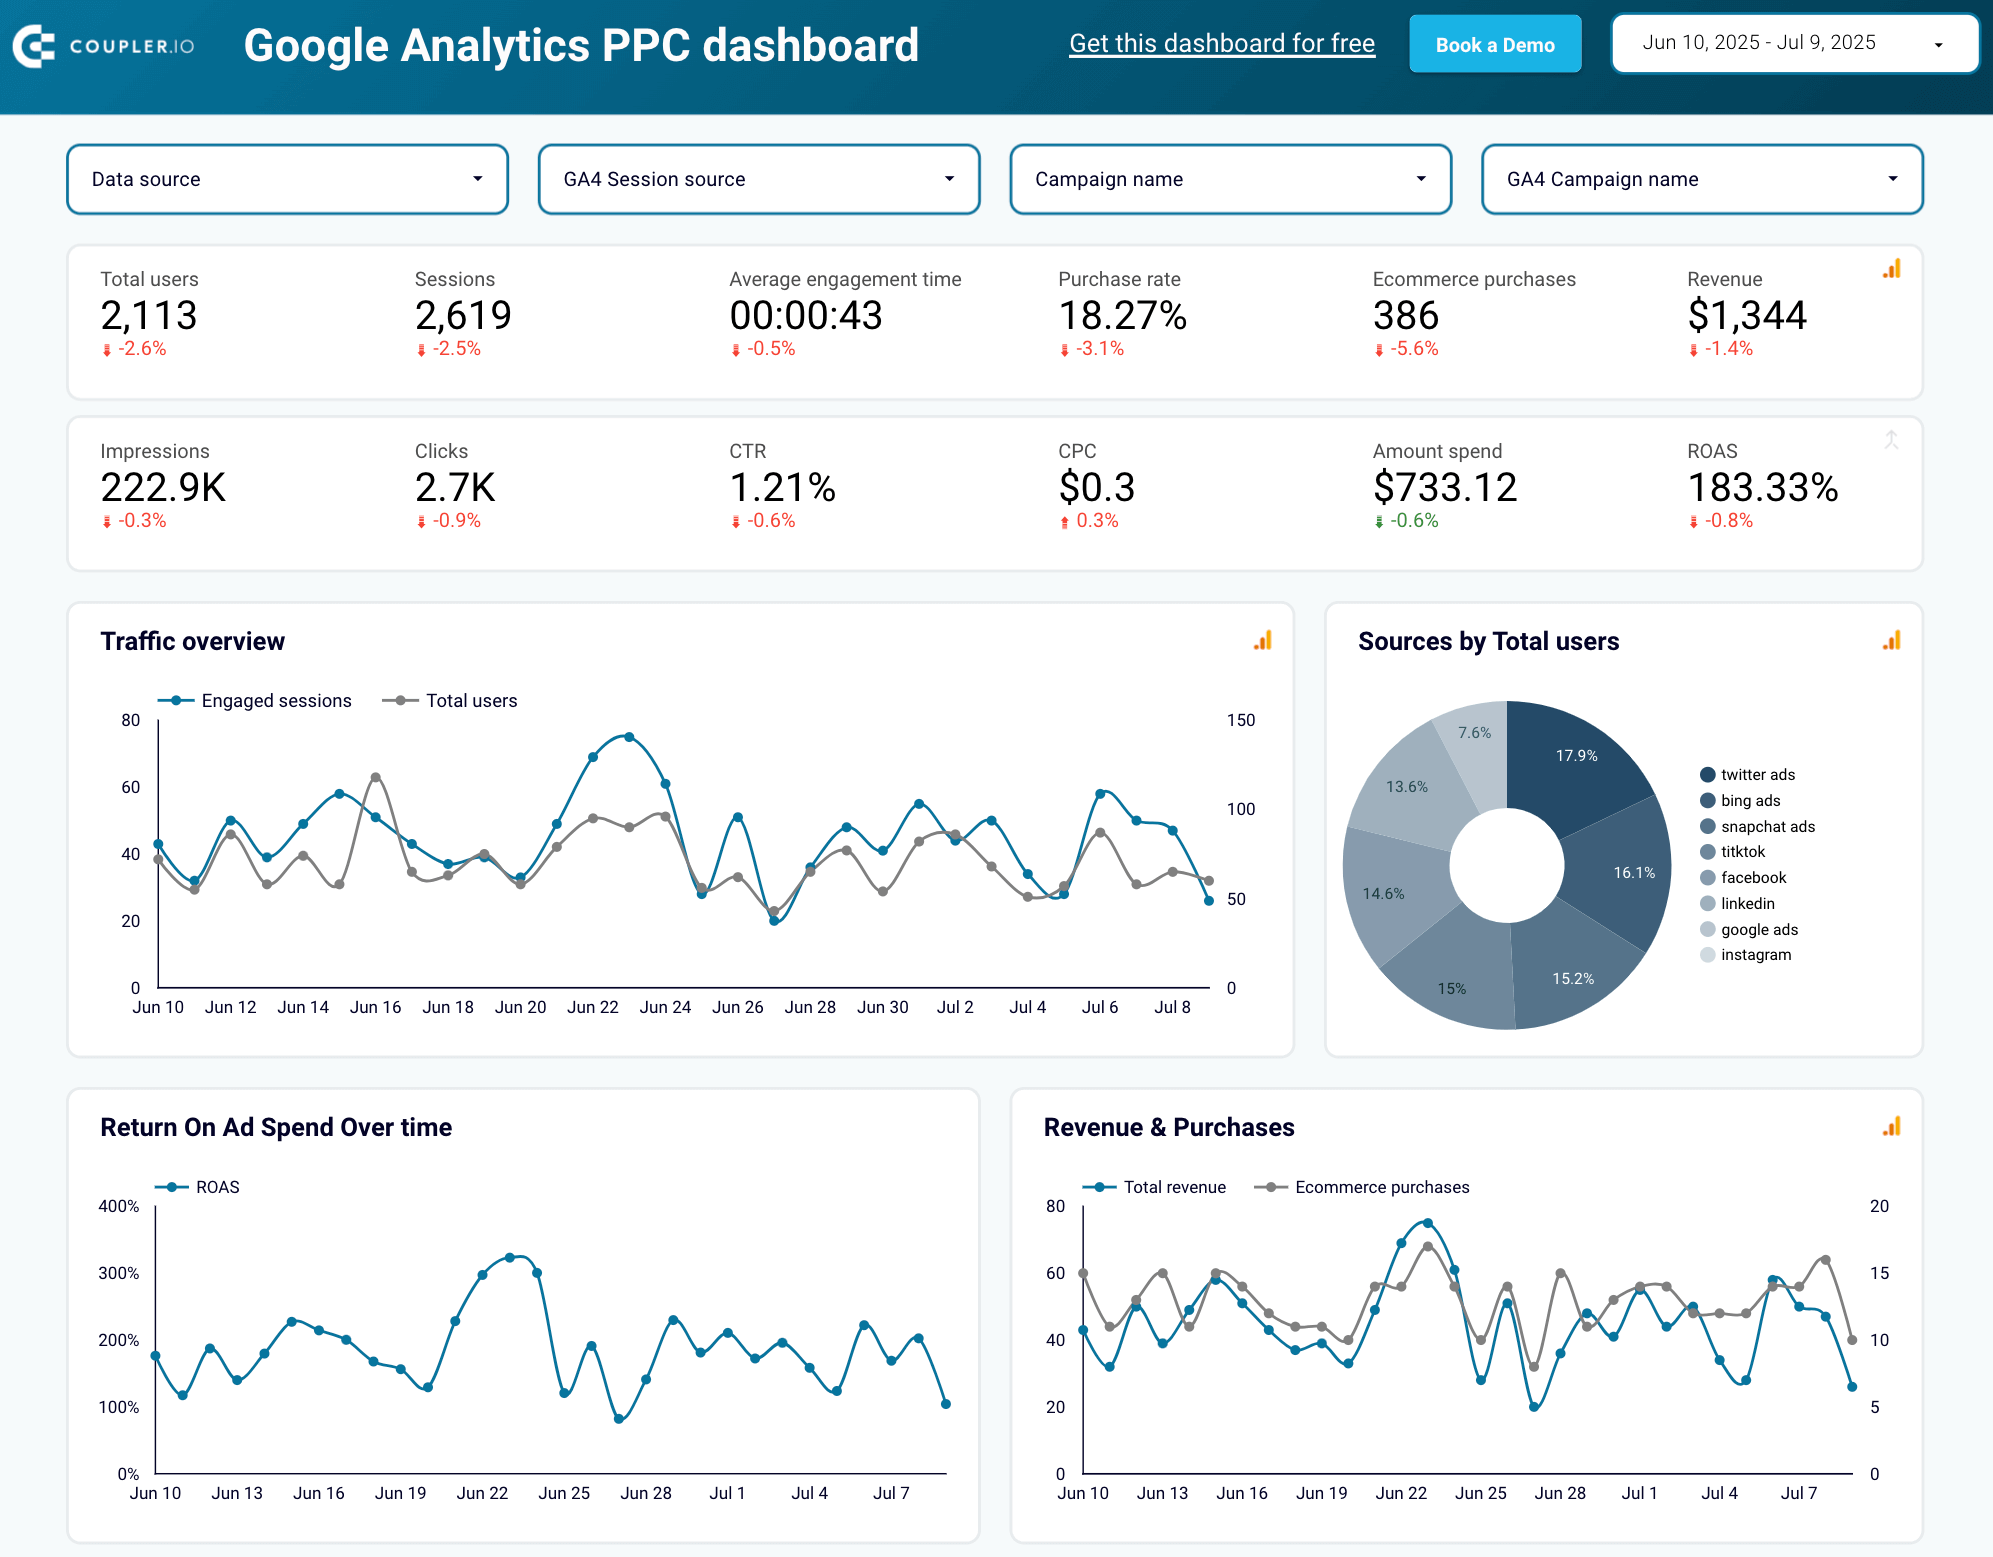
Here’s a deeper dive into what the Google Analytics PPC dashboard allows you to do.
Understand traffic trends and identify top-performing ad platforms
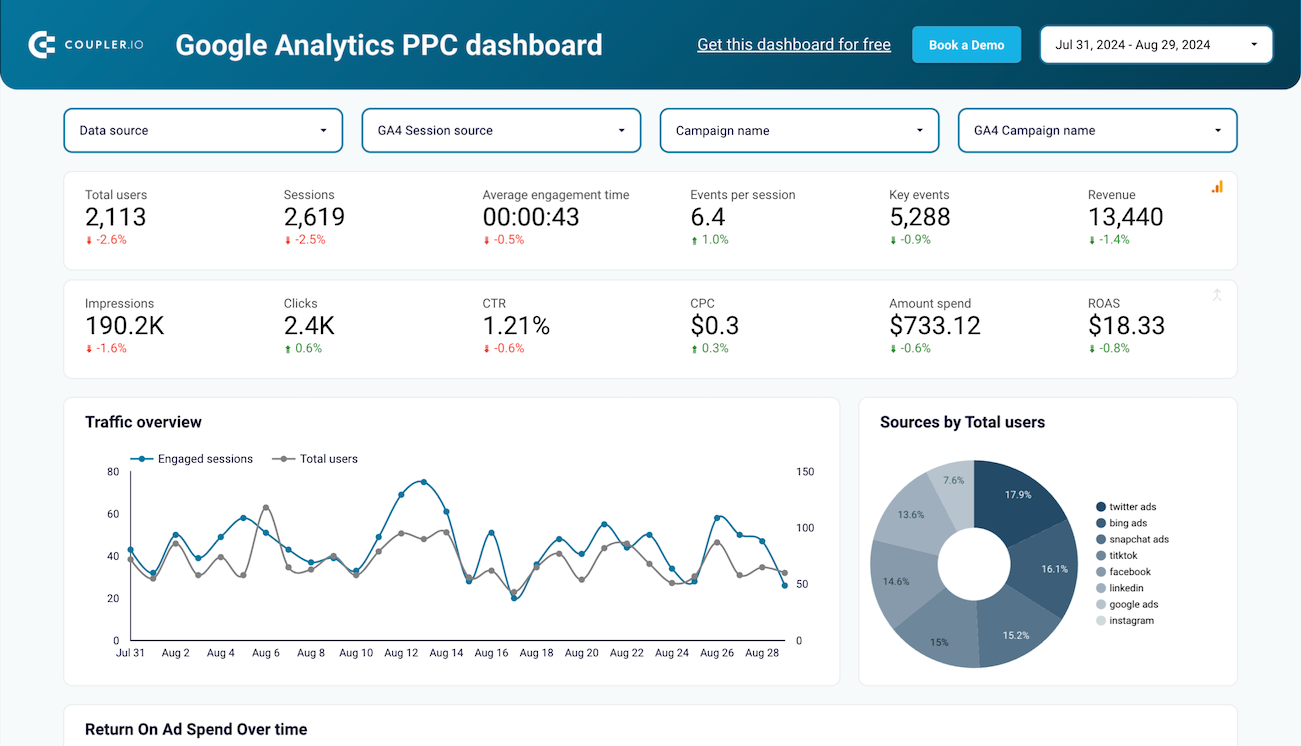
You can use the dashboard to highlight traffic patterns by comparing engaged sessions, total users, and user behavior across timeframes. This visibility helps you catch spikes in activity, notice seasonal patterns, and see how different platforms affect traffic volume and quality.
Refer to the chart below: Between June 20 and 26, engaged sessions peaked significantly compared to total users. This indicates that the audience coming in during that window wasn’t just larger, but also more interested and active. In contrast, around June 30, both metrics dropped, which suggests a dip in campaign performance or a mismatch in audience targeting.
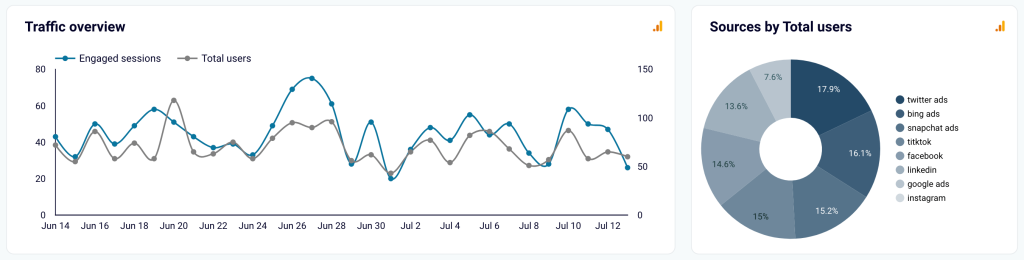
The GA4 PPC dashboard also reveals which platforms drive the most users to your site. It lets you compare their effectiveness and prioritize spend based on actual engagement, not assumptions.
In the image above, Twitter Ads led the pack with 17.9% of total users, followed by Bing Ads (16.1%) and Snapchat Ads (15.2%). If these users also show high engagement, you might decide to allocate more budget to those channels.
Track ROAS, revenue, and purchase trends over time
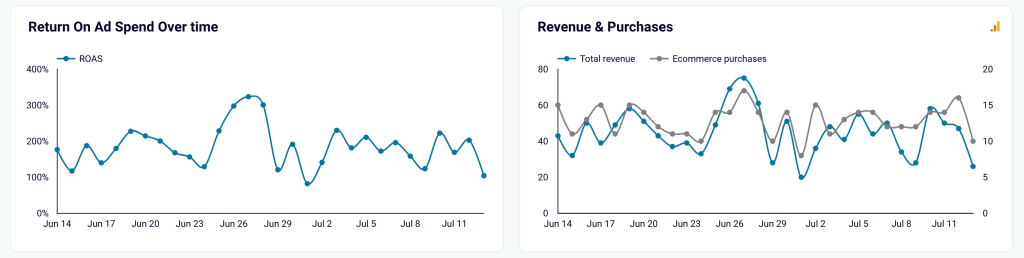
The Google Analytics PPC dashboard presents return-on-ad-spend metrics alongside revenue and purchase data, so you get a broader view of financial performance. By reviewing ROAS trends in the context of sales activity, you can assess campaign profitability, detect efficiency drops, and pinpoint tactics that deliver the highest returns.
Revenue and purchase trends bring further clarity by linking ad performance to actual business impact.
For instance, between June 24 and June 27, ROAS spiked to over 300%, while both total revenue and ecommerce purchases also climbed to their highest levels. This signals an efficient use of ad budget – campaigns during this window didn’t just generate traffic, they converted it into real sales.
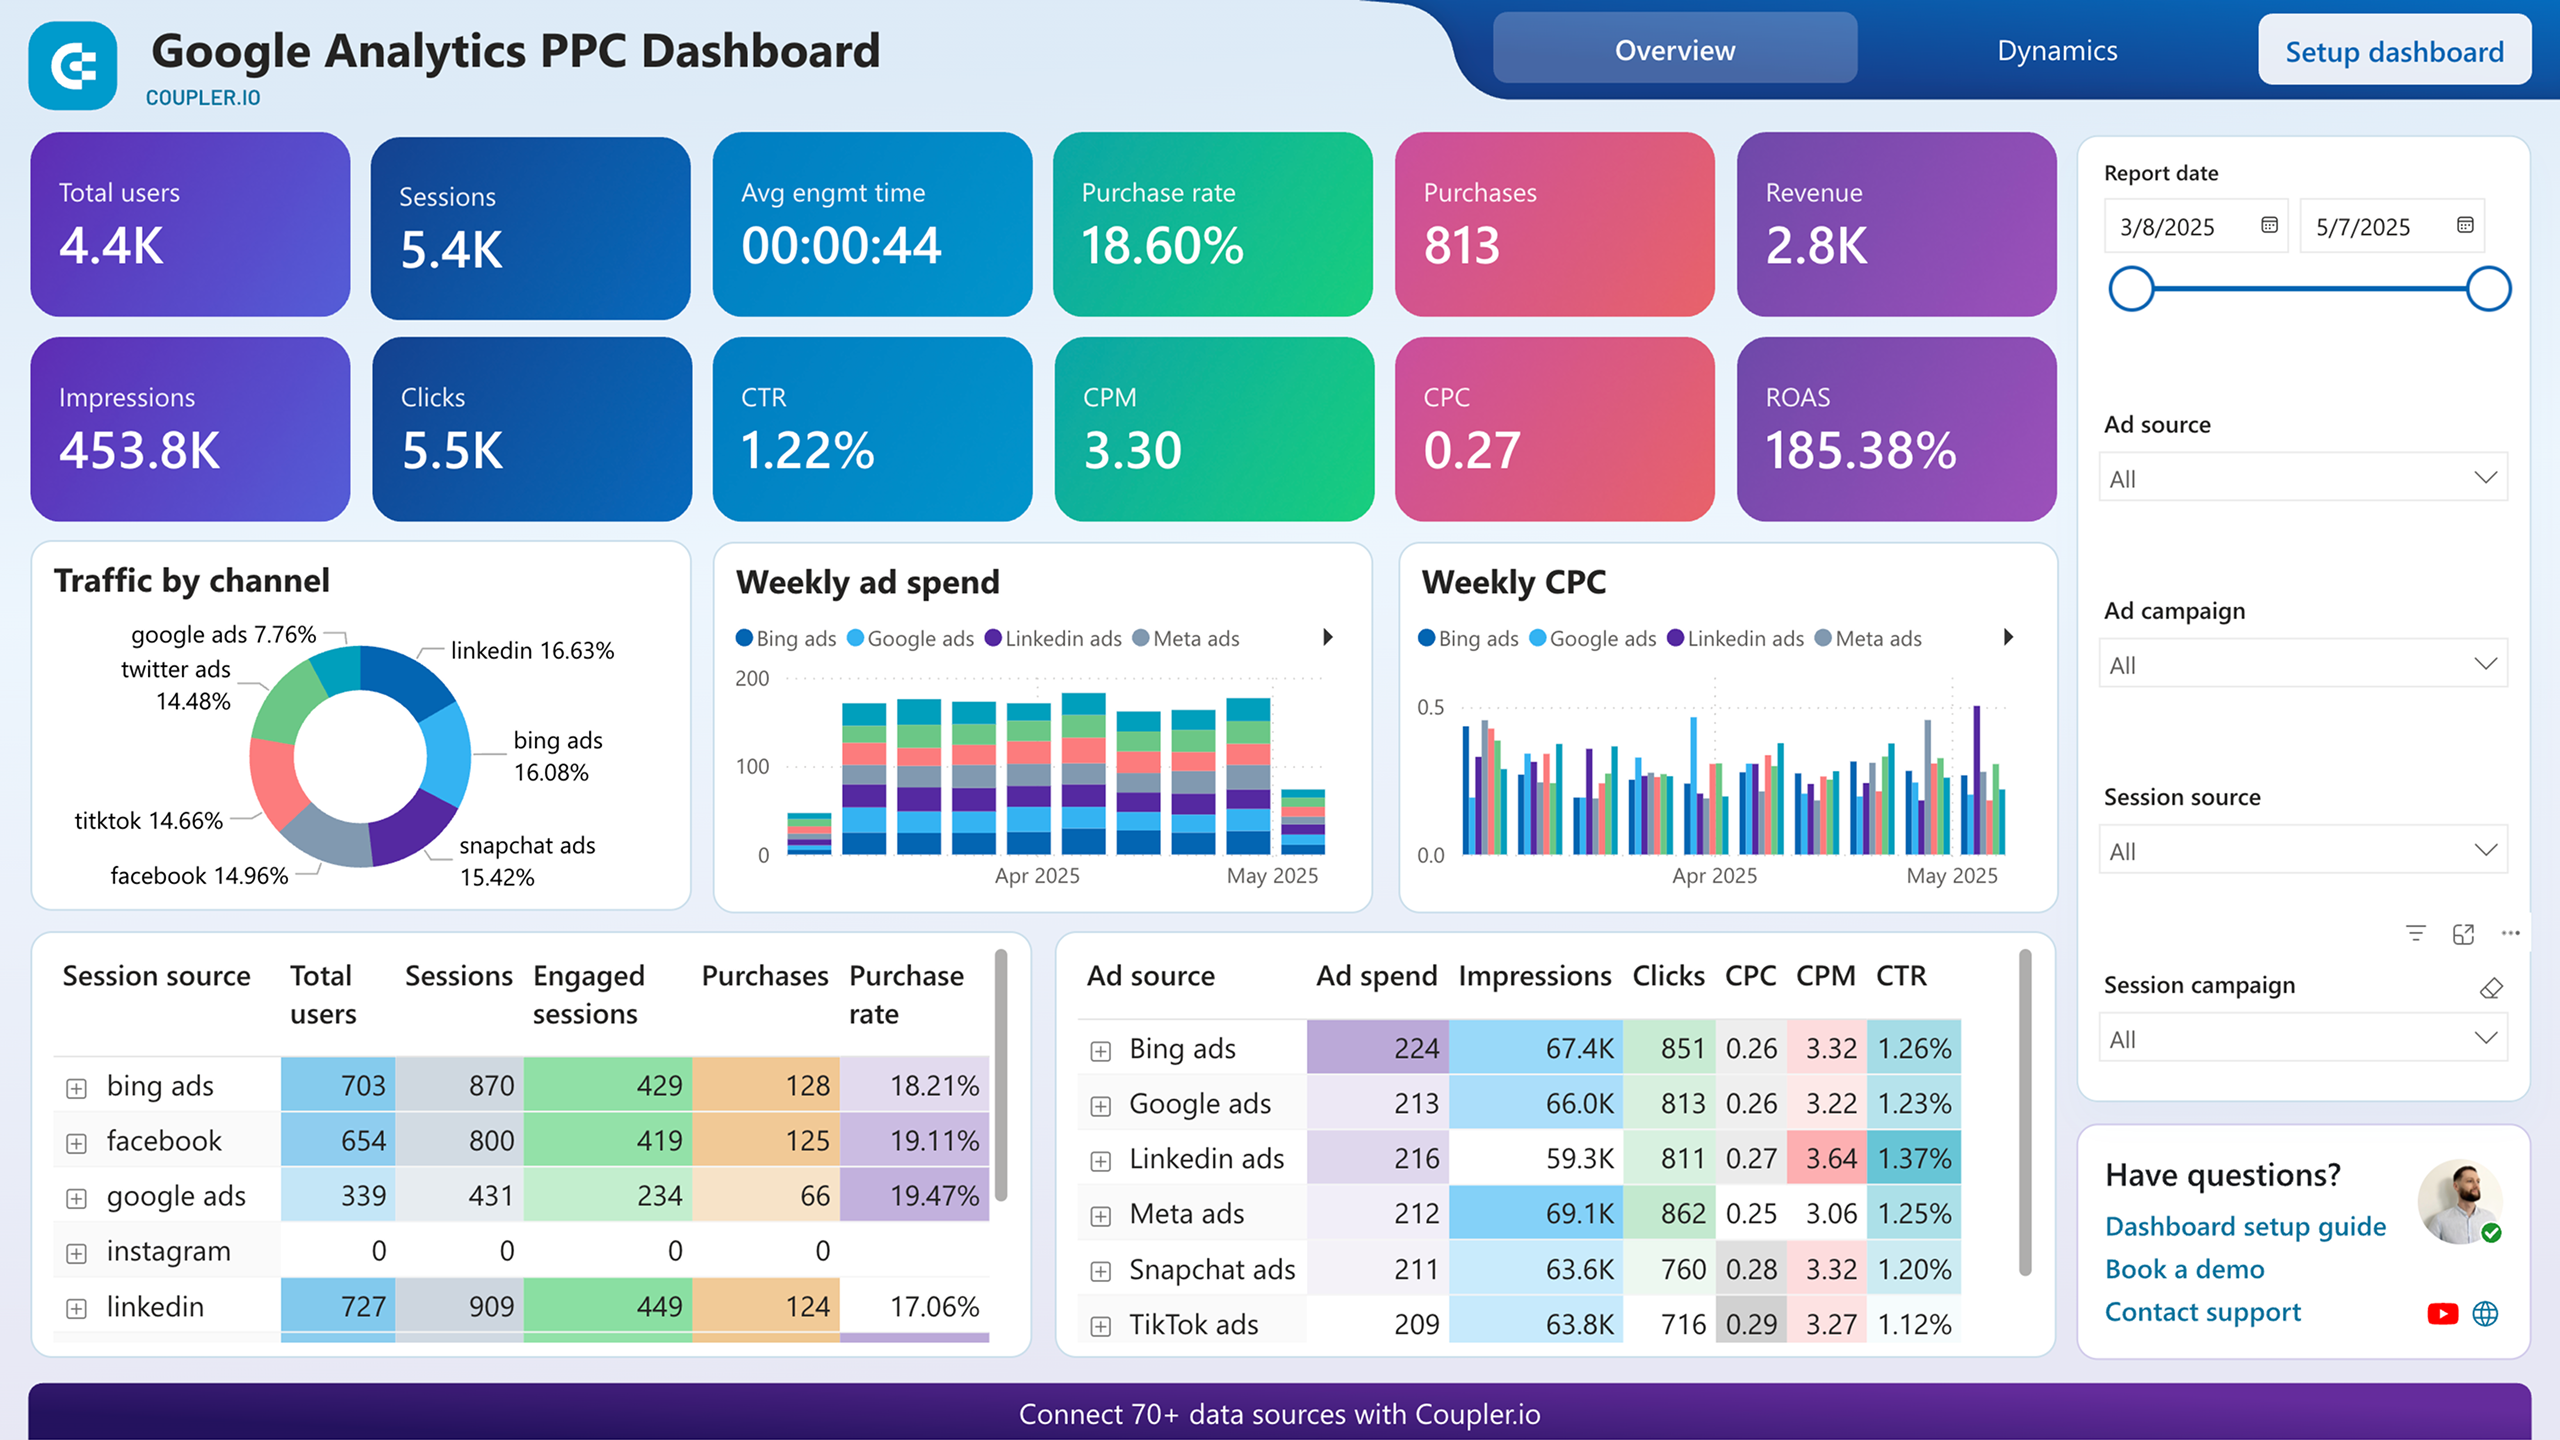
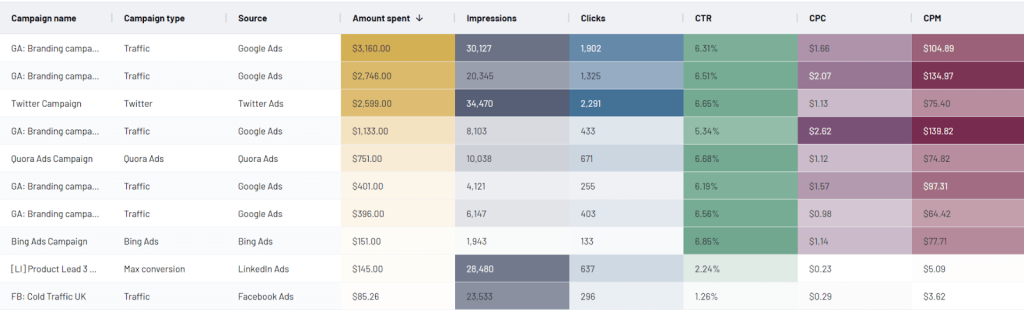
Explore platform-specific performance
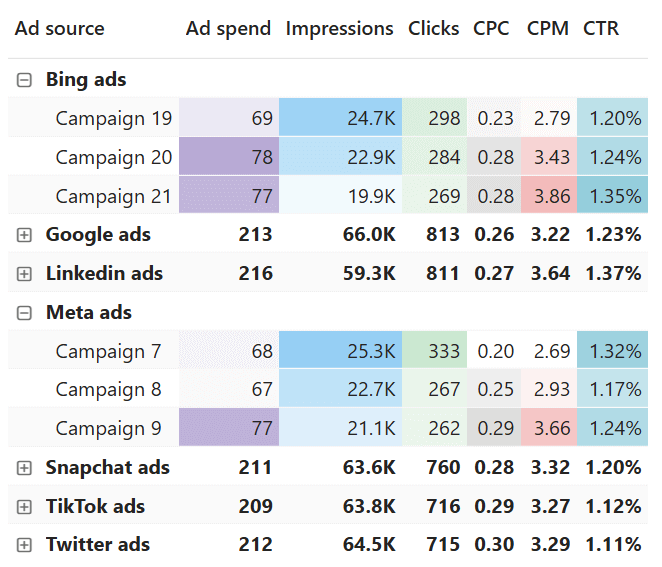
With the help of the GA4 dashboard, you can evaluate paid ads performance by traffic source, including metrics such as impressions, clicks, cost, CPC, and CTR. This allows you to determine which platforms deliver cost-efficient results and where ad spend may require adjustment.
Such detailed breakdowns make it easier to single out high-performing sources and refine strategies for improved reach and conversion potential.
For example, Meta Ads Campaign 7 achieved the highest CTR of 1.32% and the lowest CPC of $0.20, making it a strong candidate for scaling. In contrast, Twitter Ads delivered a lower CTR of 1.11% with the highest CPC at $0.30, pointing to a potentially less efficient use of budget. Similarly, Google Ads had the highest number of clicks (813) at a moderate CPC of $0.26 – a good balance between reach and cost-efficiency.
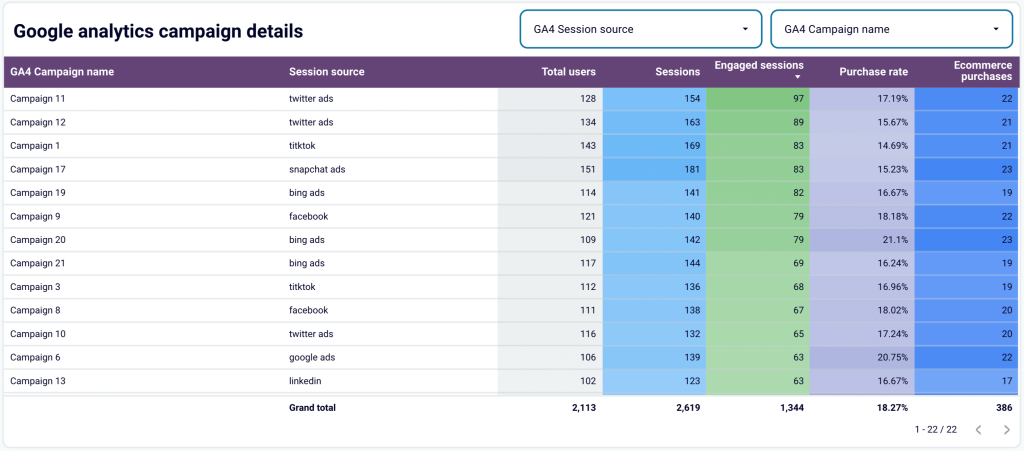
Compare campaign-level results across platforms
At the campaign level, the GA4 PPC dashboard aligns metrics from ad platforms with user behavior on the website. This enables side-by-side evaluation of key paid advertising indicators like clicks and CPC against metrics such as users, engagement rate, or purchases.
By cross-referencing these data points, you can clarify which campaigns deliver both traffic and conversions to support smart optimization and scale your decisions.
See the table below: Campaign 20 (sourced from Bing Ads) had 109 total users and 142 sessions, of which 79 were engaged sessions. Despite having fewer users than several other campaigns, it achieved the highest purchase rate at 21.1% and generated 23 ecommerce purchases. In contrast, Campaign 1 (from TikTok) had a higher number of users (143) and sessions (169), but a lower purchase rate of 14.69% and slightly fewer purchases (21).
This Google Analytics PPC dashboard template is freely available in Looker Studio and Power BI. It comes with a built-in paid ads and GA4 data connector by Coupler.io, so your data is automatically loaded and visualized. To set it up, go to the Readme tab inside the template and follow the provided instructions.
Google Analytics PPC dashboard in Looker Studio
Get an overview of the traffic performance of your advertising campaigns launched across different PPC platforms.


Google Analytics PPC dashboard in Power BI
Analyze how your paid advertising campaigns drive website traffic and conversions by combining PPC performance data from multiple platforms with user behavior insights from GA4.


How to track PPC campaigns in Google Analytics
For insightful PPC analysis, you need to connect revenue conversions to the performance of paid search in Google Analytics. To do this, configure attribution and set up conversion tracking in GA4, as explained below ?
Configure attribution
Without proper attribution, you’re flying blind with your PPC budget decisions. GA4 uses last-click attribution by default, which can severely misrepresent your campaign performance and lead to costly optimization mistakes.
Imagine a customer searches “management software” on Google, clicks your ad, browses your pricing page, but leaves without converting. Two days later, they see your retargeting ad on LinkedIn and make a $500 purchase. With default attribution, LinkedIn gets full credit for the conversion, while Google gets none despite driving initial discovery.
This attribution blind spot can mislead your strategy. You might pause your Google “discovery” campaigns while over-investing in LinkedIn retargeting, which only works because of the initial Google touchpoint. As a result, without a full view of the customer journey, you’re optimizing with only half the story.
For Google Ads integration: Connect Google Ads to GA4 through the Admin settings to import cost data, click metrics, and keyword details. This allows GA4 to properly attribute traffic and conversions back to specific Google Ads campaigns, giving you accurate ROAS calculations and conversion paths.
For non-Google platforms like Meta or LinkedIn Ads: Add standardized UTM parameters to every campaign URL, specifying the source, medium, campaign, content, and term. ??When a user clicks a tagged link, GA4 reads the parameters and attributes the session to the appropriate source and campaign.
Attribution model selection: In GA4, navigate to Admin > Attribution Settings and choose the model that best reflects your business reality. Data-driven attribution works well for accounts with sufficient conversion volume, while position-based attribution gives credit to both first and last touchpoints—useful for understanding how discovery and closing campaigns work together.
This proper attribution setup ensures your PPC dashboard shows accurate performance data, helping you make informed decisions about where to invest your ad spend based on actual contribution to conversions, not just final-click credit.
Set up conversion tracking
To ensure your PPC Google Analytics data reflects meaningful user actions, not just raw traffic, mark key events in GA4 as conversions. These may include form submissions, purchases, sign-ups, or downloads, depending on business objectives.
Common key events to track:
- E-commerce purchases (automatic with enhanced ecommerce)
- Lead generation forms (“Get a Quote,” “Request Demo,” “Contact Us”)
- Newsletter signups (for nurture campaigns)
- Free trial registrations (for SaaS companies)
- Content downloads (white papers, case studies)
- Phone call clicks (for local businesses)
Setup process: In GA4, navigate to Admin > Events, find your key events (like “form_submit” or “generate_lead”), and toggle the “Mark as conversion” switch. For e-commerce, ensure the “purchase” event is marked as a conversion.
Example setup: If you run a marketing agency, you might track three conversion types:
- “contact_form_submit” (primary lead generation)
- “case_study_download” (content engagement)
- “consultation_booking” (high-intent action)
Each conversion type tells you different things about campaign effectiveness. A campaign driving lots of case study downloads might be great for brand awareness, while one generating consultation bookings is directly tied to revenue.
Critical alignment: Ensure your GA4 conversion goals match your ad platform optimization settings. If Google Ads is optimizing for “Maximize Conversions” but you haven’t marked your key events as conversions in GA4, the algorithm won’t have proper data to optimize against.
Tackle common tracking challenges
Tracking often breaks due to missing UTM’s, incorrect tag installation, or consent issues. To catch early signs of broken tracking, watch for spikes in “unassigned” traffic or mismatched conversion numbers between GA4 and ad platforms.
Audit tagging regularly using Google Tag Assistant or DebugView and align time zones, attribution windows, and event definitions to minimize discrepancies.
Optionally: Analyze data through custom dashboards
While ready-made Google Analytics reports cover user acquisition, engagement, and retention by campaign or source, they can lack the depth or customization you need.
To gain deeper insights, you can build a custom Google Analytics dashboard for paid traffic with the Explorations tool. This lets you sort, filter, and drill down into data, focus on the most relevant info using segments, and even turn segments into audiences for future analysis or targeting.
For more on Explorations and other features, read our Google Analytics 4 guide.
To save time building a dashboard from scratch, use Coupler.io’s free white-label PPC report templates in Looker Studio, Power BI, and other BI tools. Have your data pulled in automatically and turned into visualizations so you can start analyzing right away!
What metrics to include in a PPC dashboard
For a meaningful dashboard, you need PPC Google Analytics data that captures traffic quality, user engagement, cost efficiency, and conversion performance. Below is a breakdown of the essential metrics to include, along with formulas and examples ?
Traffic metrics
| Metric | Description | Formula/Example | Why It Matters |
| Impressions | Impressions represent the number of times your ad appears on users’ screens. This metric reflects reach and ad visibility, not interaction. | Direct from ad platform | A large number of impressions indicates broad exposure, but doesn’t guarantee clicks or conversions |
| Clicks | Clicks show how many times users interacted with your ad. This is a primary indicator of interest. | Direct from ad platform | An ad with many impressions but few clicks might need better targeting or more engaging creative |
| Click-through rate (CTR) | CTR reveals how often people click after seeing your ad. It helps evaluate ad quality and targeting precision. | CTR = (Clicks ÷ Impressions) × 100 Example: (305 ÷ 25,000) × 100 = 1.22% | Evaluates ad quality and targeting precision |
| Users | Users are unique individuals who visit your website. | From Google Analytics | This figure lets you understand how many distinct people your campaigns attract, excluding repeat visits |
| Sessions | Sessions signify the total number of website visits, including multiple visits from the same person. | From Google Analytics | They help identify traffic volume and return activity |
Engagement metrics
| Metric | Description | Formula/Example | Why It Matters |
| Engaged sessions | Engaged sessions are visits where users stay for at least 10 seconds, view multiple pages or screens, or trigger a conversion. | From Google Analytics | Use this metric to filter out low-quality traffic and detect genuine interest |
| Bounce rate | Bounce rate is the share of sessions that don’t become engaged. | Bounce rate = (1 – Engaged sessions ÷ Total sessions) × 100 Example: (1 – 1,049 ÷ 1,200) × 100 = 12.6% | A high number can indicate a poor user experience or misaligned ad targeting |
| Session duration | Session duration tracks the average time a user spends on your website. | Session duration = Total time ÷ Sessions Example: 29,700 ÷ 150 = 198 seconds (3:18) | Longer sessions usually signal stronger content relevance or user intent |
Conversion performance metrics
| Metric | Description | Formula/Example | Why It Matters |
| Purchase events | Purchase events count the number of completed transactions. | From Google Analytics/E-commerce platform | This metric tracks final outcomes and is critical for ecommerce-focused campaign performance |
| Revenue | Revenue refers to the total value of purchases attributed to your PPC traffic. | Revenue = Sum of purchase values | This allows you to assess how much income your campaigns generate. |
| Return on ad spend (ROAS) | ROAS conveys how efficiently your campaigns turn ad spend into revenue. It’s a direct measure of profitability. | ROAS = Revenue ÷ Ad spend | Example: Your campaign generates $4,634.50 in revenue and costs $2,500.$4,634.50 ÷ $2,500 = 1.85 That means every $1 spent returns $1.85 in revenue |
Cost metrics
| Metric | Description | Formula | Why It Matters + Example |
| Cost per click (CPC) | CPC quantifies the amount you pay on average for each ad click. | CPC = Total cost ÷ Clicks | It highlights cost-efficiency and bidding performance. Example: If you spend $121.50 and receive 450 clicks. CPC = 121.50 ÷ 450 = $0.27 |
| Cost per mille (CPM) | CPM denotes how much you pay for 1,000 ad impressions. | CPM = (Total cost ÷ Impressions) × 1,000 | This is important for awareness-focused campaigns. Example: If you spend $396 and get 120,000 impressions: CPM = (396 ÷ 120,000) × 1,000 = $3.30 |
| Cost per conversion | Cost per conversion captures how much it takes to generate a single conversion, such as a purchase or signup. | Cost per conversion = Total cost ÷ Conversions | Shows efficiency of converting traffic to actions. Example: If your campaign costs $2,198.70 and generates 30 purchases: Cost per conversion = 2,198.70 ÷ 30 = $73.29 |
Performance ratios
Performance ratios help determine which ad platforms work best across cost, engagement, and revenue. By comparing ROAS, CTR, CPC, or cost per conversion between Google, Meta, LinkedIn Ads, and more, you can identify where your budget drives the most value.
Example: If Google Ads has a ROAS of 3.5 and Meta Ads shows 5.0, Meta delivers stronger returns per dollar. Comparing CPC, you might find Google’s average click cost is $1.80 while Meta’s is $0.90, suggesting that Meta provides more affordable traffic. These comparisons support data-driven budget distribution and platform-specific strategy refinement.
Tips on how to analyze paid traffic in Google Analytics
To truly understand your paid ad performance, it’s not enough to simply set up a Google Analytics PPC dashboard with the key metrics. You need best practices for analyzing each aspect of the campaign – all broken down below ?
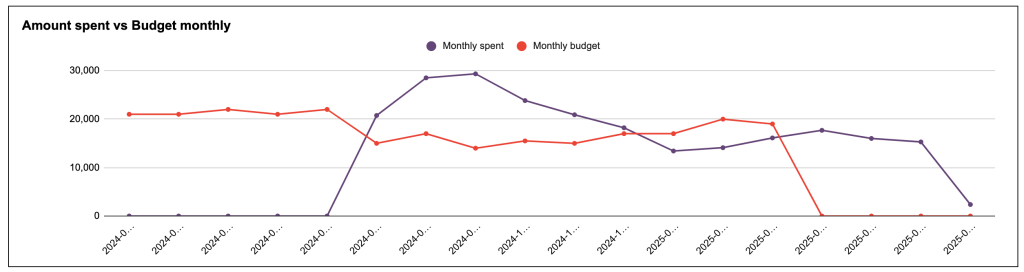
Review the budget and track spending daily
Regular budget checks help prevent overspending and uncover unusual spikes in cost. Monitor daily expenses closely to ensure ad spend stays aligned with your KPIs. Consistent tracking also lets you identify inefficiencies before they snowball into wasted budget.
Use dashboards that let you track budget and costs, like this PPC monthly budget dashboard by Coupler.io.
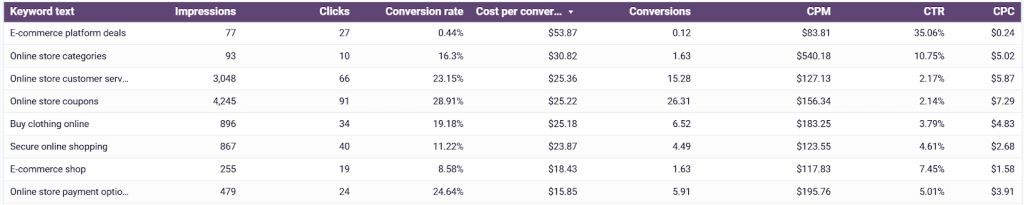
Evaluate expensive keywords
High-cost keywords can drain your budget without producing results. Examine whether these keywords contribute to conversions. If they underperform, consider reducing bids or shifting funds toward more cost-effective terms.
For example, if you work exclusively with Google Ads, use the keyword performance dashboard for Google Ads by Coupler.io. It allows you to efficiently identify expensive keywords and their performance. This dashboard shows cost, impressions, clicks, conversions, and CPC for all your keywords in one view, making it easy to spot high-cost keywords that aren’t delivering conversions.
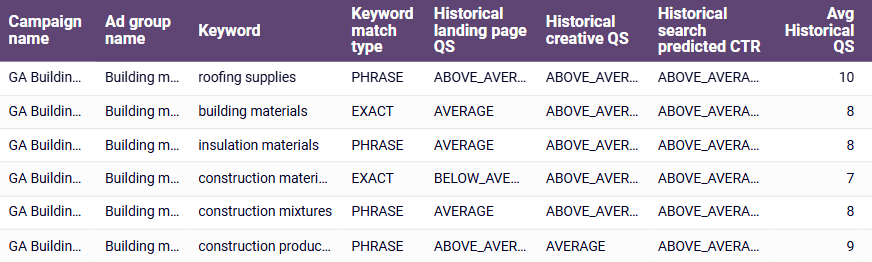
Check keyword quality score
A low quality score often points to mismatches between ads, landing pages, and user intent. By identifying keywords with poor scores, you can improve relevance and ad strength, reduce CPC, and raise visibility.
If you run ads in Google, use the quality score analytics dashboard by Coupler.io to track the relevance of your keywords. In addition to the table below, the dashboard offers more insights into the quality score analysis, so check it out for free.
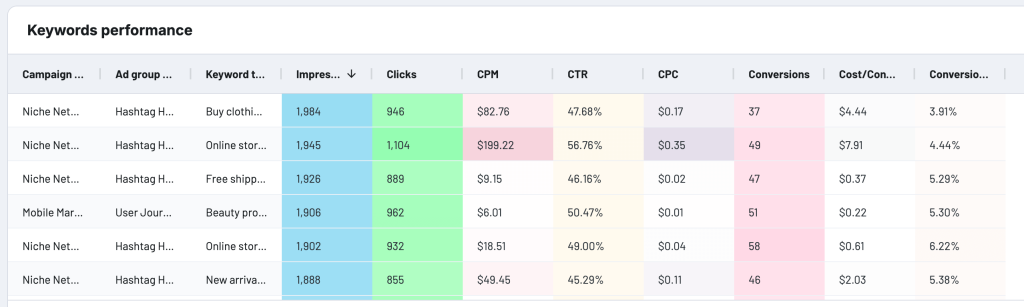
Analyze search terms
The search terms report reveals how users find your ads. Leverage it to identify irrelevant or underperforming queries. Remove wasteful keywords and apply negative keywords to block low-quality traffic from showing up again.
For instance, the Google Ads dashboard by Coupler.io contains a table showing the efficiency of each keyword from your campaigns.
Adjust bids based on PPC performance
Refine your bidding strategy by reacting to real-time performance. First, increase bids for top-performing keywords to maximize returns. Second, lower bids – or pause spending – on those that fall short of expectations.
For example, if your “project management software” keyword has a 15% conversion rate but “task management tool” only converts at 3%, increase bids on the first and reduce or pause the second.
Reallocate budget across campaigns
To yield better ROI, examine how your budget is split across campaigns and ad groups. It’s crucial to ensure high-performing segments receive greater funding, while low-performing ones are paused or revised.
To give you an idea, the table from the PPC multi-channel dashboard shows campaign performance across Google Ads, Meta, LinkedIn, TikTok, and other platforms in one view. You can identify which campaign from which platform performs better and reallocate your budget more effectively.
Assess regional performance
Not all locations convert equally. Using geographical data, find where your ads perform best. Adjust geotargeting to focus budget on the most profitable regions and exclude those that underdeliver.
Some of Coupler.io PPC dashboards provide geographic insights. For instance, the TikTok Ads dashboard offers detailed country-level performance data that can reveal emerging markets where video content resonates strongly, especially for brands targeting younger demographics.
See where your TikTok campaigns generate clicks and conversions by country, and compare audience response by age, gender, and platform that updates on a schedule. The template is available as Coupler.io in-house dashboard and as a Looker Studio template.
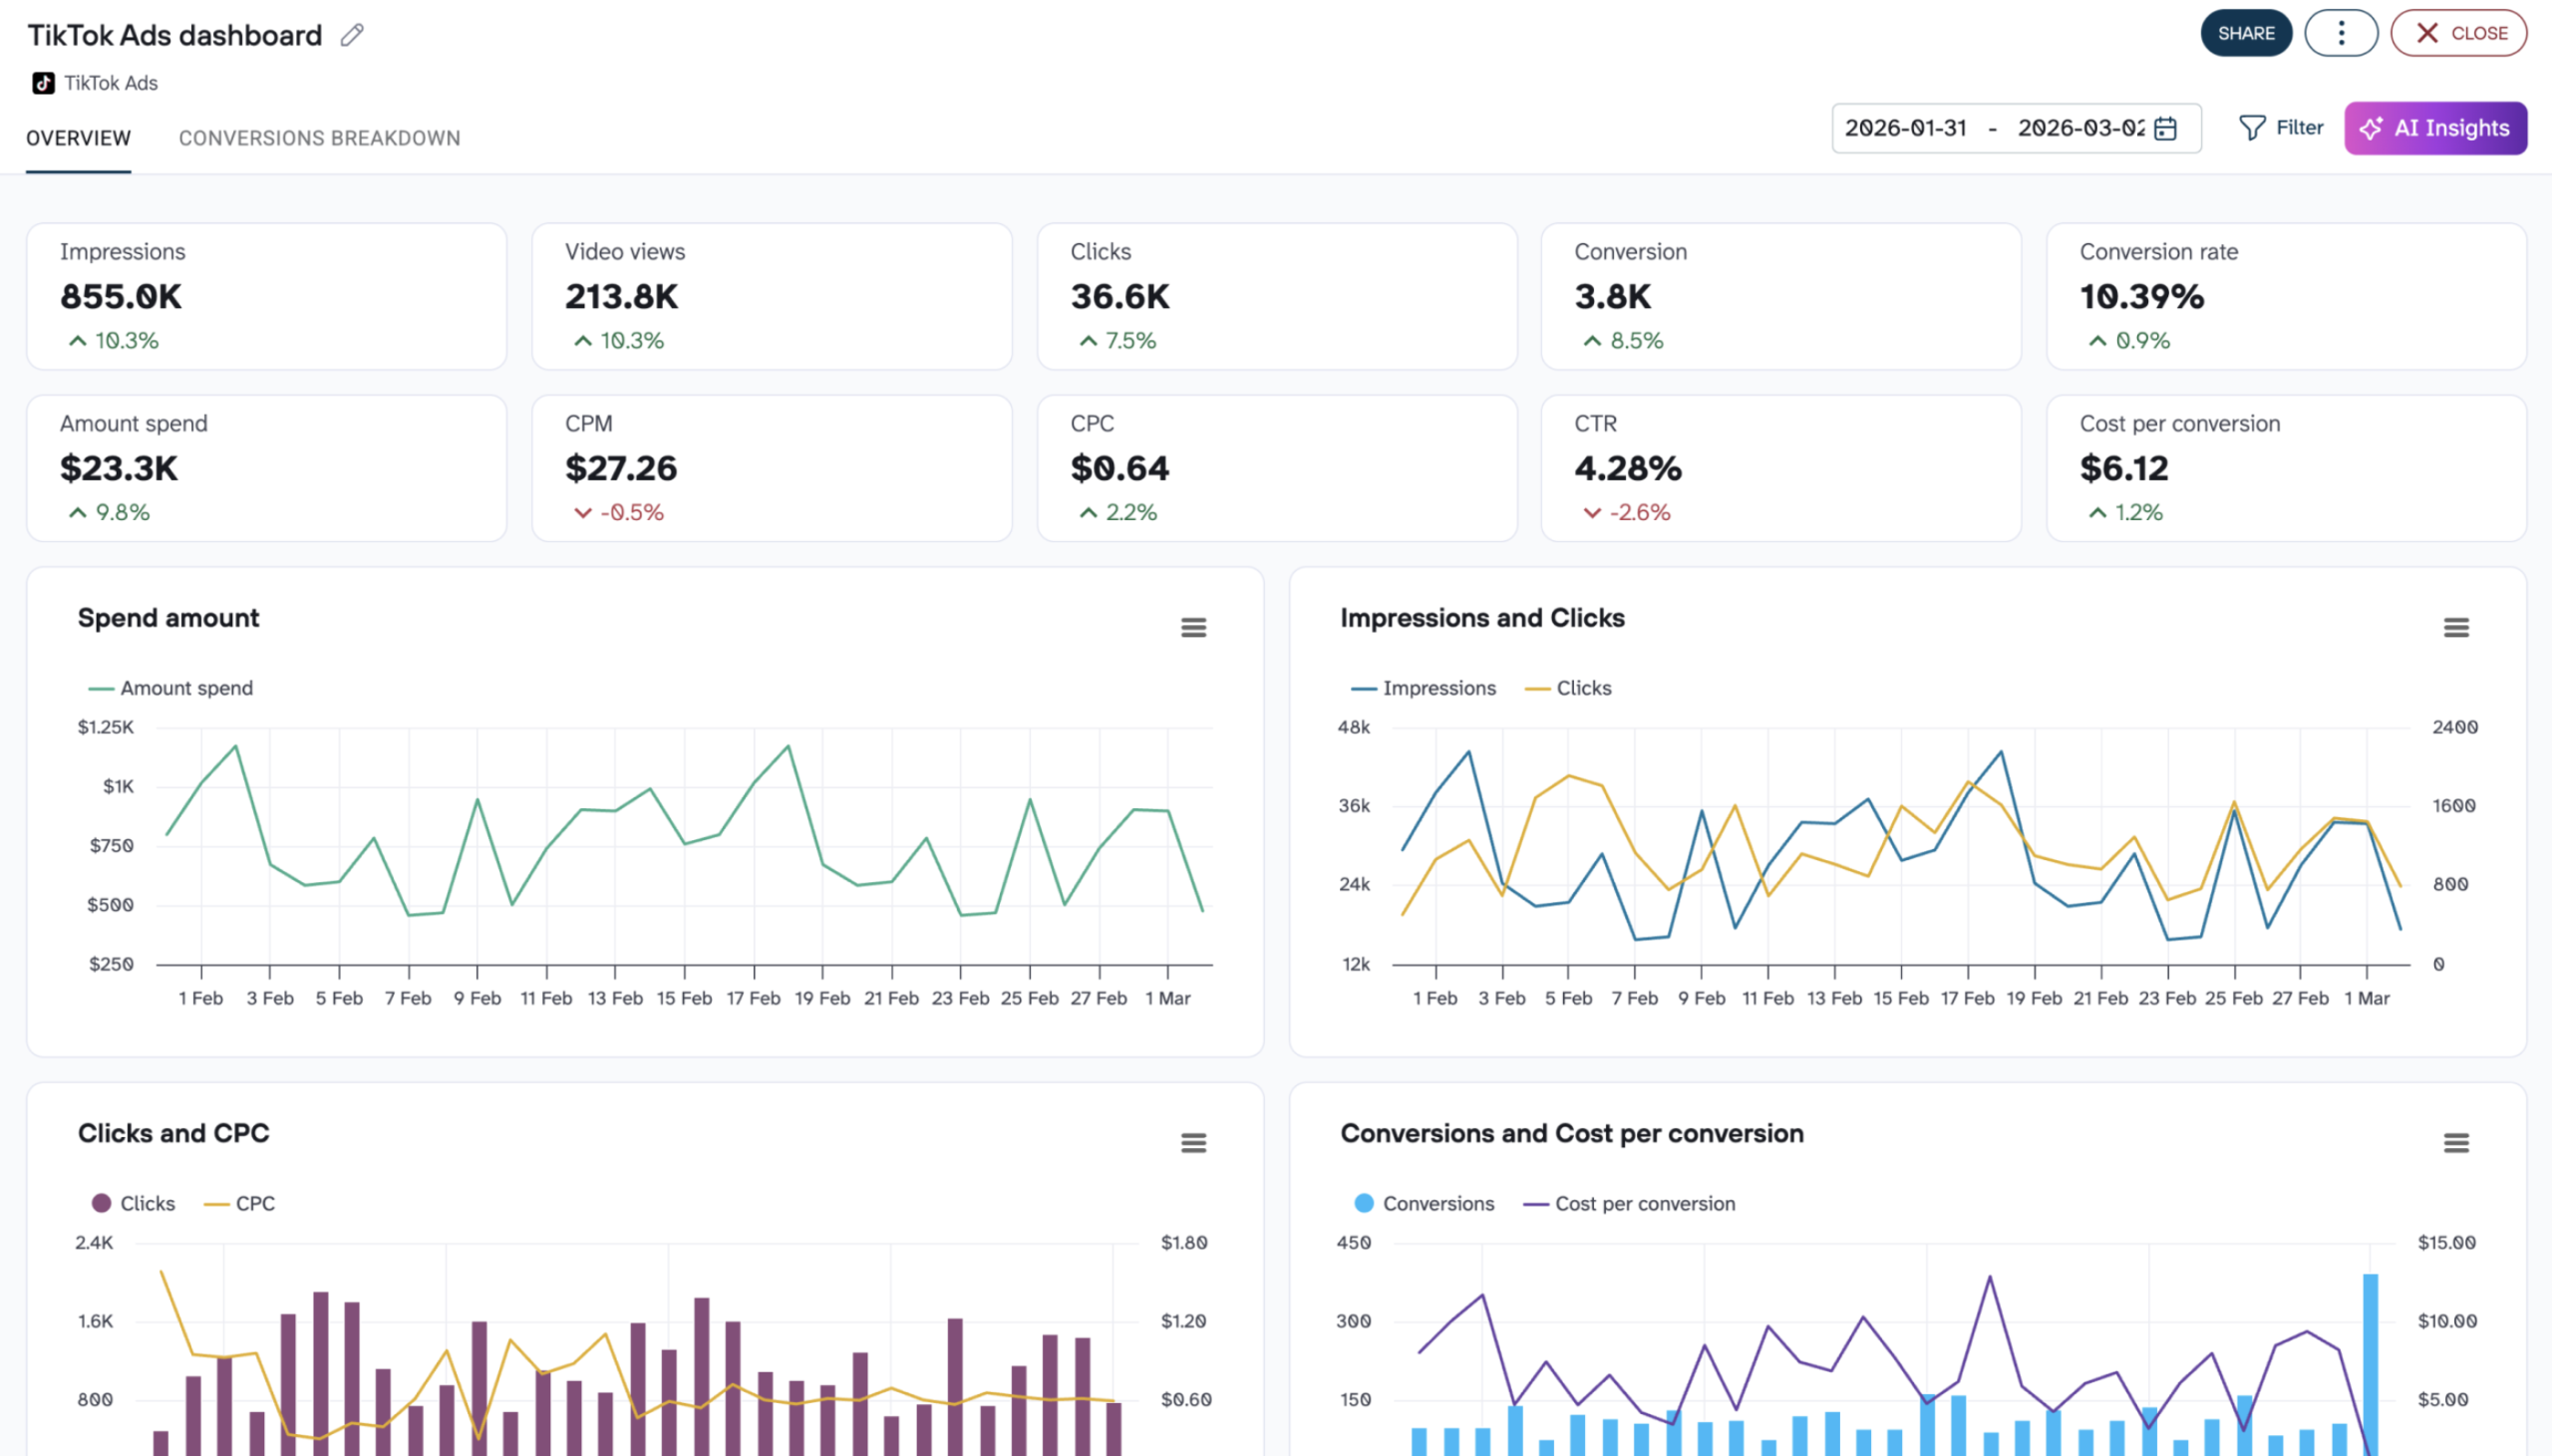
TikTok Ads dashboard in Coupler.io
Take control of your TikTok Ads data: consolidate multiple accounts into one view, break down conversions by country, platform, and demographics, and spot top-performing campaigns with this dashboard template.

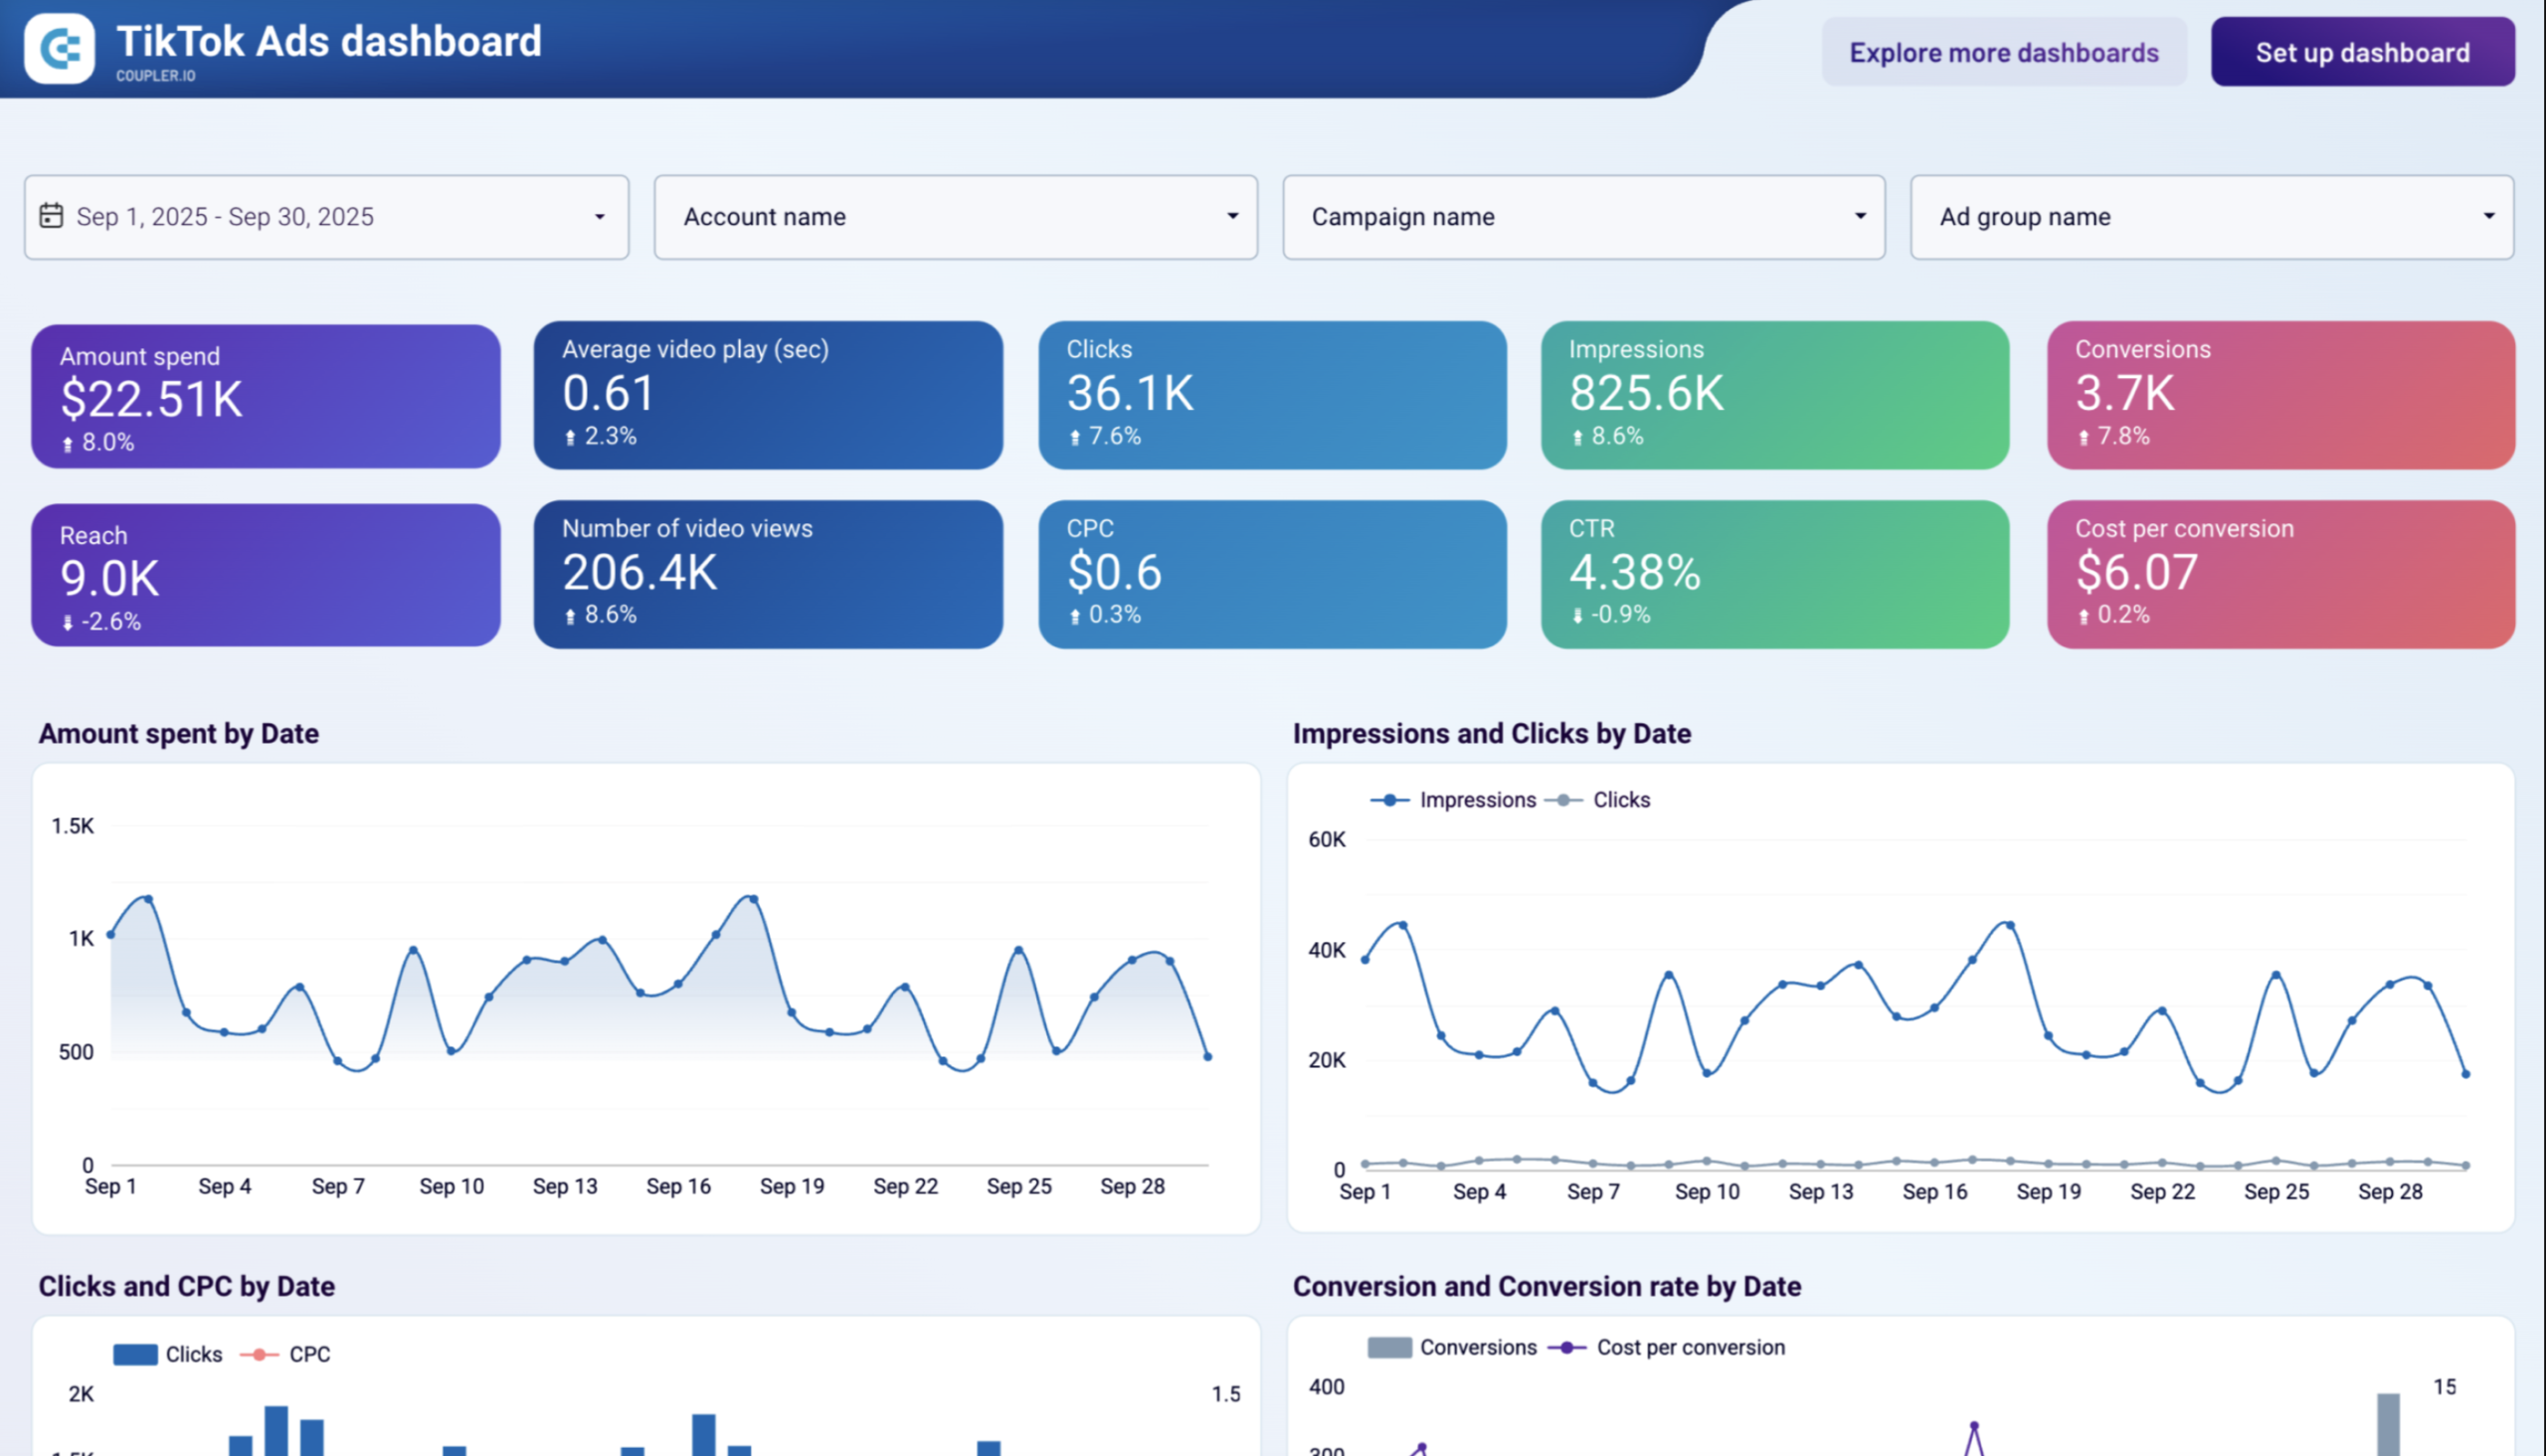
TikTok Ads dashboard in Looker Studio
Turn your TikTok Ads data into clear decisions: track impressions, clicks, and conversions over time, identify where your budget works hardest, and compare campaign results side by side with this dashboard template.
Compare performance across devices
Device type affects user behavior, so you need to measure ad performance on desktop, mobile, and tablet. If one device underperforms, adjust bids or tailor creatives to fit the platform experience.
To illustrate, let’s take a look at a chart from the Google Ads dashboard, which shows which devices provide the most cost-effective conversions.
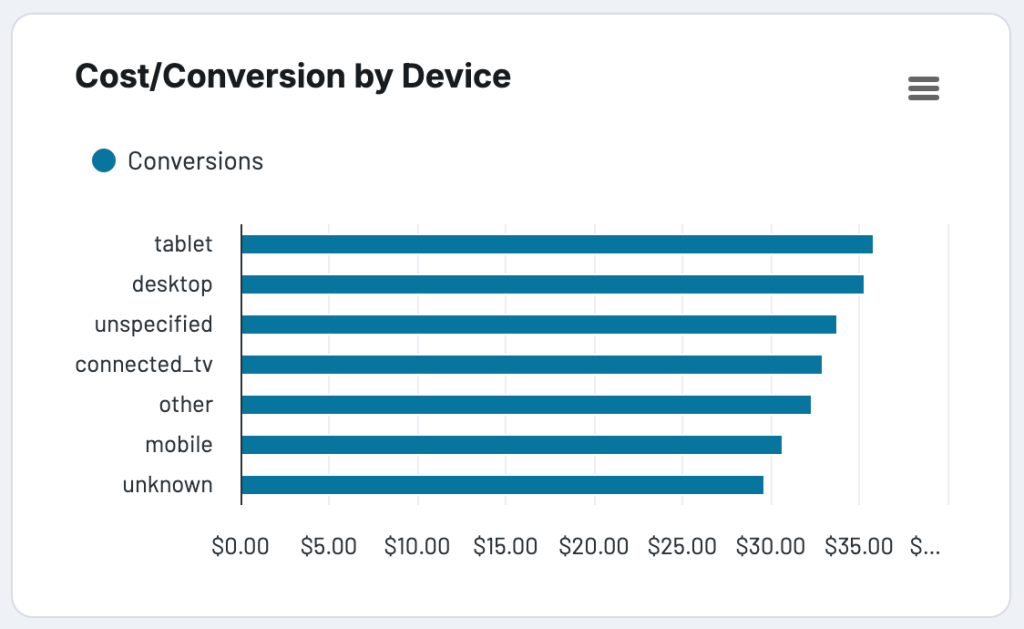
Similar charts are also available in other dashboards by Coupler.io.
The Twitter Ads dashboard shows detailed conversion breakdowns across Android, iOS, desktop, and mobile platforms. This helps you understand how social media users engage differently on each device.
For app-focused campaigns, the Apple Search Ads dashboard provides device-specific conversion tracking to reveal how mobile users interact with your app install ads.
The Bing Ads dashboard allows you to filter performance data by device type. It’s useful for optimization of campaigns for the Microsoft search ecosystem, where desktop usage often remains higher than on other platforms.
Track landing page effectiveness
Landing pages directly impact conversion rates. Assess which ones convert best and which lead to drop-offs. To lift results without raising ad spend, improve speed, clarity, or messaging on weak pages.
For example, one of the most popular GA4 report templates by Coupler.io allows you to analyze the effectiveness of your pages across their entire user journey, from initial search visibility to conversion and revenue generation.
This dashboard is accessible in three versions: Coupler.io, Looker Studio, and Google Sheets. Follow the setup instructions to use it for your own GA4 reporting.
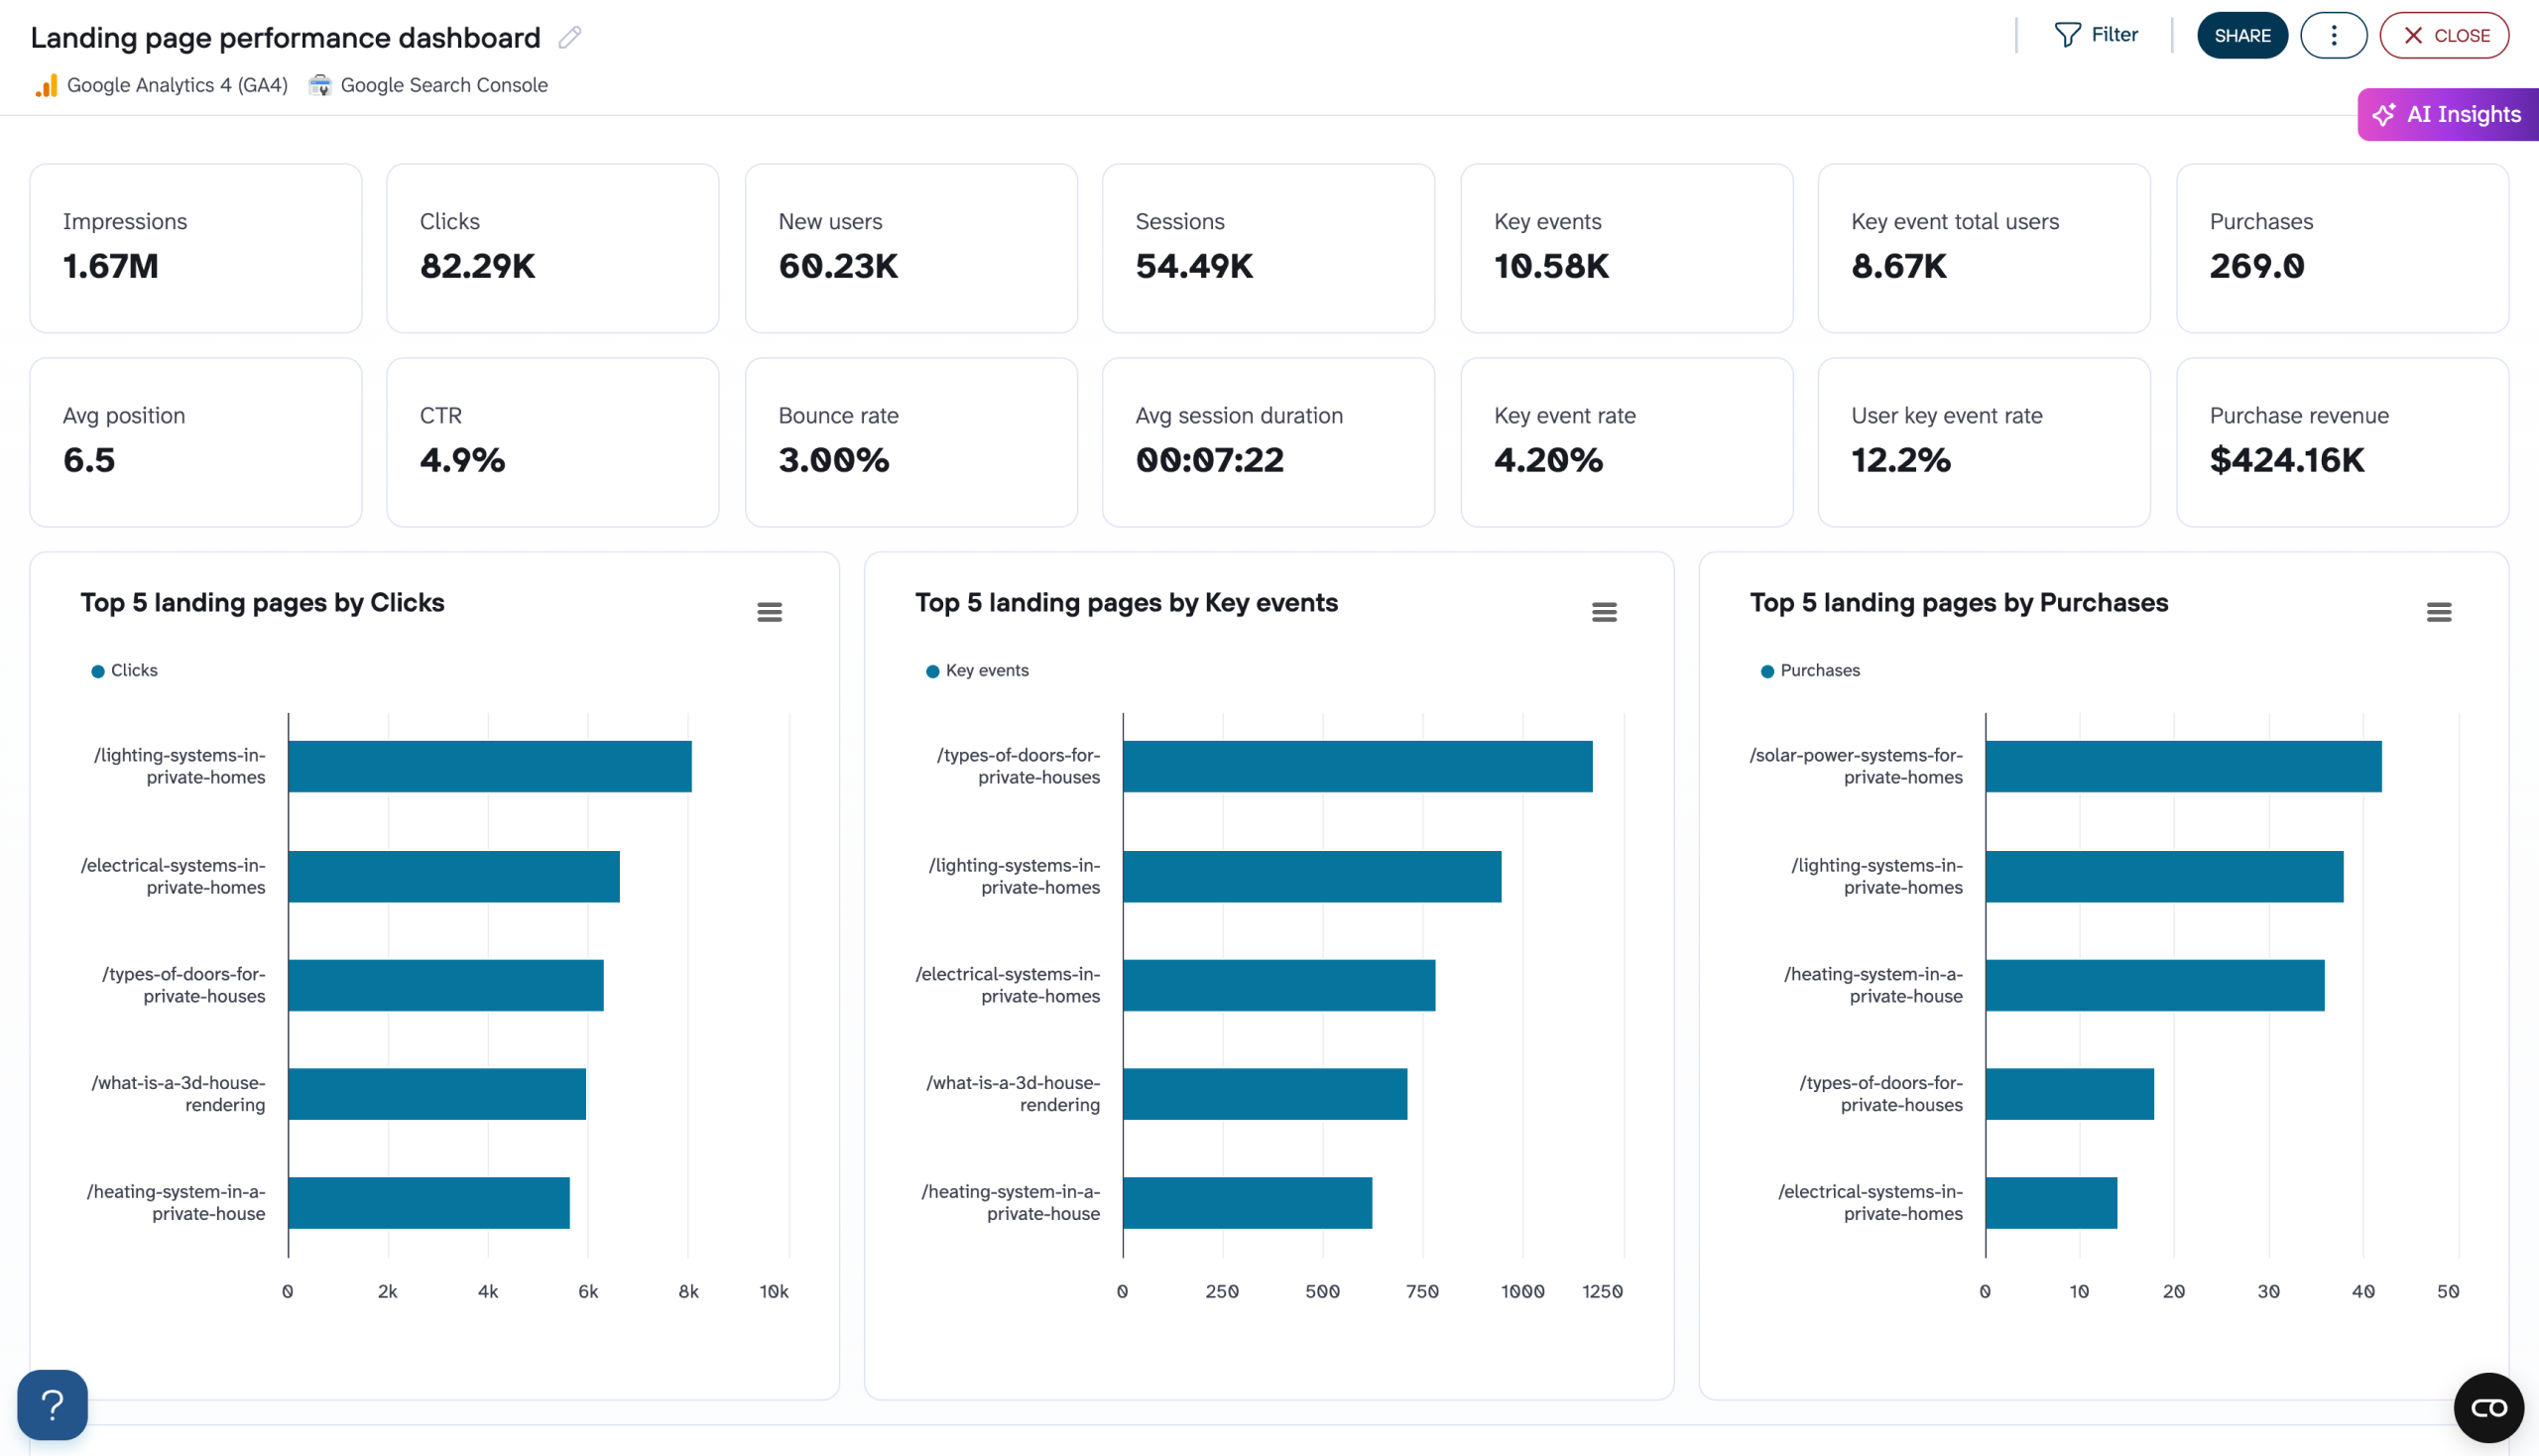
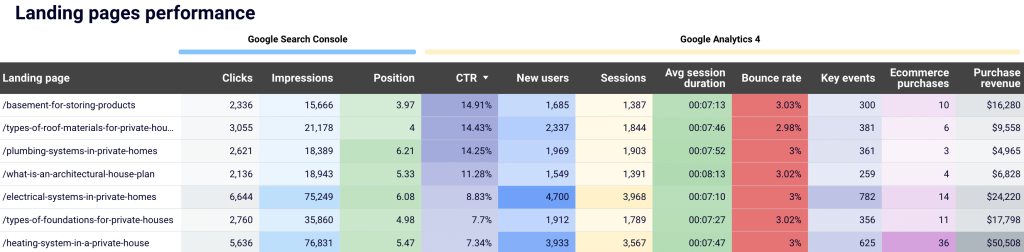
Landing page performance dashboard
Evaluate the effectiveness of your landing pages with combined data from Google Search Console and GA4. Track traffic sources, engagement metrics, conversion rates, and bounce rates to identify high-performing pages and optimize underperforming ones for better user experience and higher conversions.

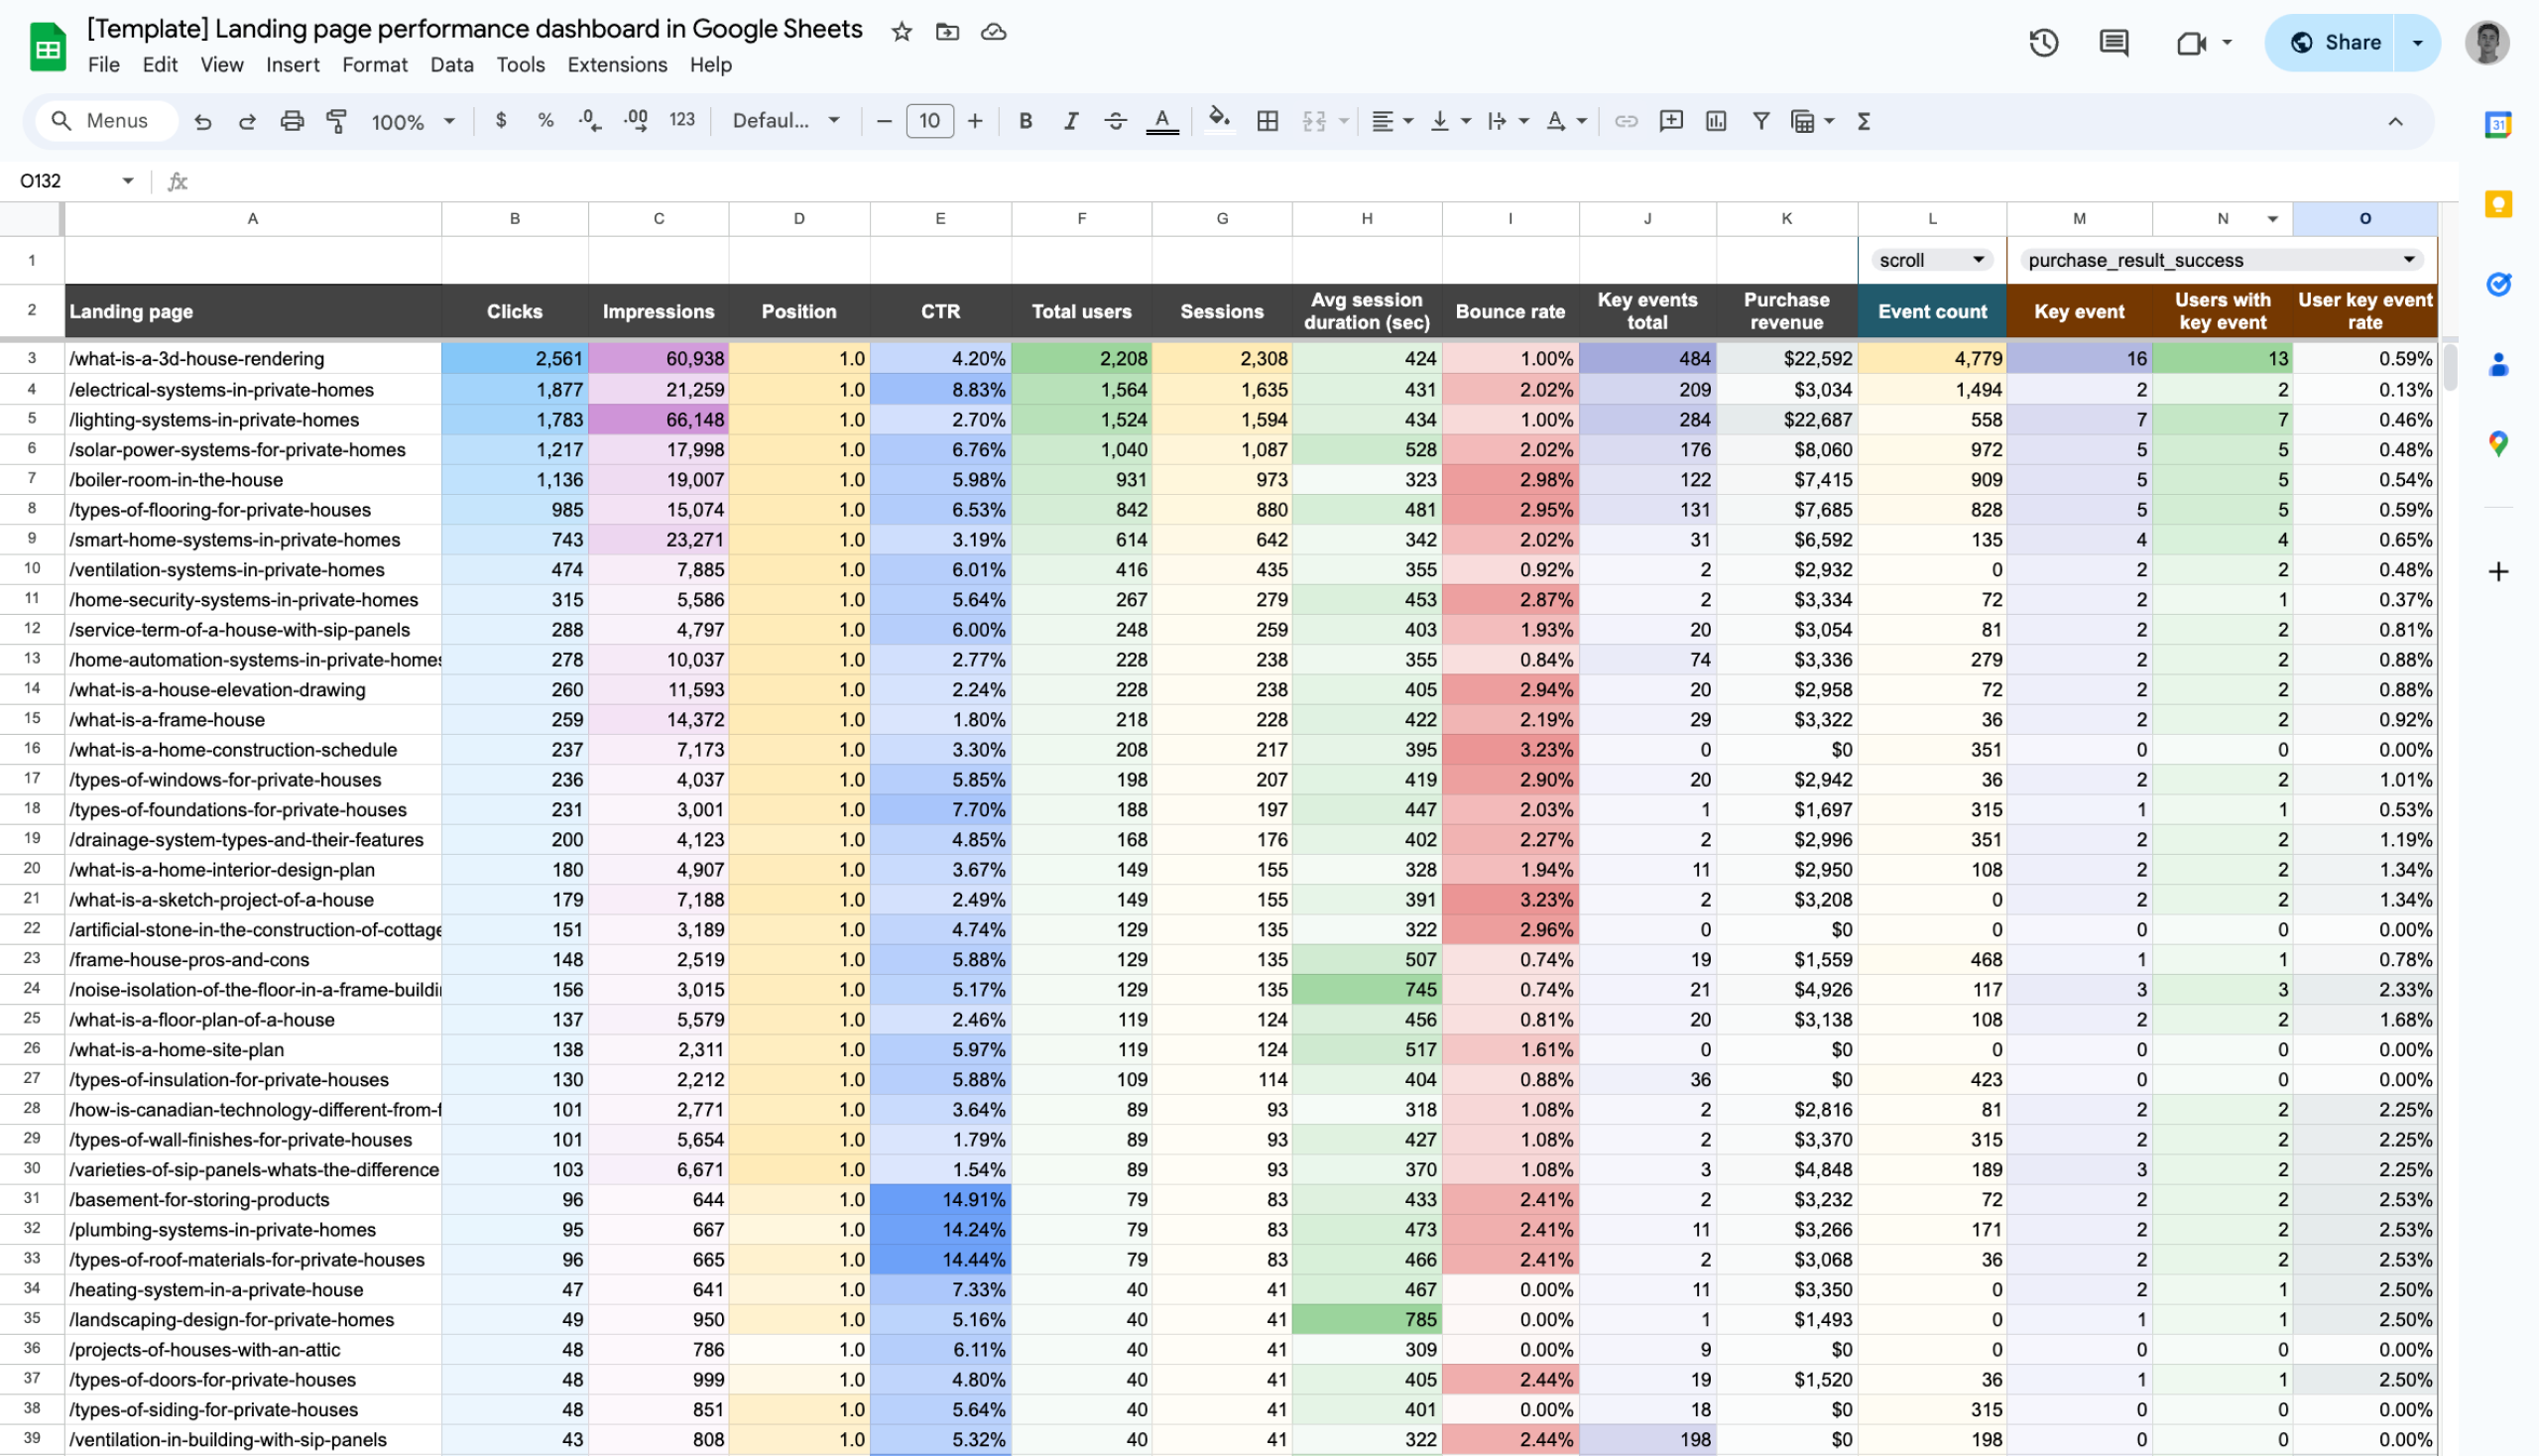
Landing page performance dashboard in Google Sheets
Analyze the effectiveness of your landing pages, from traffic and engagement to conversions, using data from GA4 and Search Console.

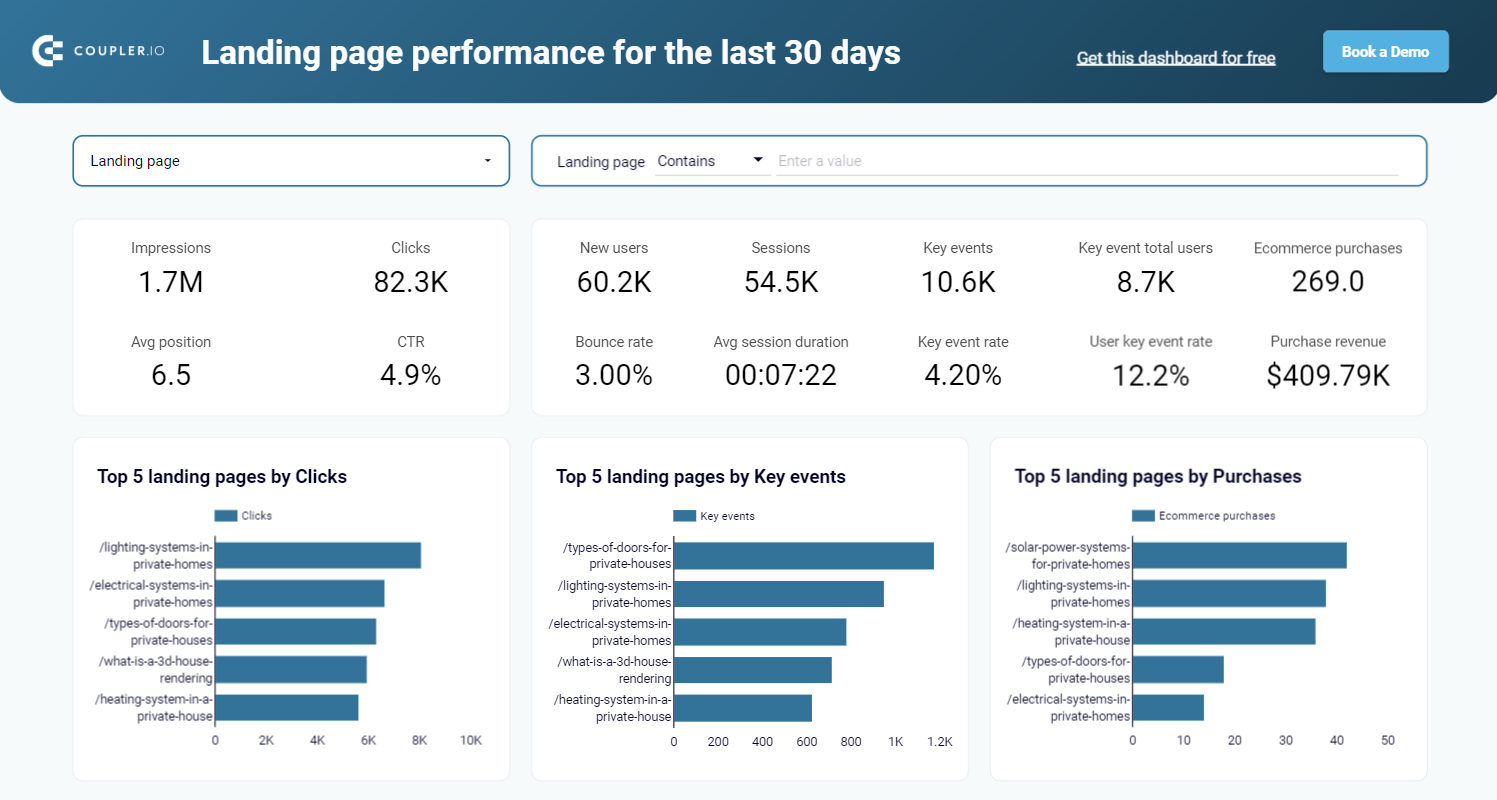
Landing page performance dashboard in Looker Studio
Evaluate the effectiveness of your landing pages such as traffic, clicks, bounce rate, and other metrics collected from GSC and GA4 in one dashboard.
Plan next month’s budget proactively
For smarter next month budget allocation and tighter control, base it on current performance trends and campaign goals – factor in what worked, what didn’t, and which targets remain unmet.
To implement all the practices above, use Coupler.io’s ready-made PPC report templates. Set them up for free and turn raw numbers into actionable insights.
If you, however, need a tailored dashboard solution, contact our data experts.
Automate reporting with Coupler.io
Get started for free


