According to Dentsu’s forecast, global advertising spend is forecast to surpass $1 trillion in 2026 for the first time. The market is entering what they call the “Algorithmic Era,” where AI-driven placements and retail media are the primary engines of growth.
But the question remains – are these funds being spent wisely and efficiently? PPC analytics reporting should answer this question.
In this article, we’ll discuss what you need to know about PPC reporting and how to structure your reports effectively. We’ll also explore various reporting tools that help simplify the process and the key metrics to include in your reports.
What is a PPC report?
A PPC (Pay-Per-Click) report is a document or presentation that provides an analysis of the performance of a PPC advertising campaign. It helps you to visualize and understand whether your ad spend and other efforts are effective for achieving your marketing goals.
PPC reports have to display all the key metrics that need to be measured to inform decisions. Therefore, it’s best to use visual formats to convey information in your report e.g. graphs, charts, tables, and comprehensive dashboards.
What a custom PPC report should include
Every PPC report tells a unique story about the marketing campaigns that were conducted during a timeframe. Below are the necessary details to include in a PPC report:
- Dates and timeframes
PPC reports serve as regular updates on ad campaigns, their KPIs, goals, and other notable information. You must keep track of the advertising process for proper reporting. You can mention when the campaign started, how long before edits or changes were made and when the marketing campaign ended.
- Campaign goal
Each campaign has a specific goal that must be reached to be considered a success. The common objectives for a marketing campaign include: improving brand awareness, generating leads and prospects, targeting existing customers, boosting social media, increasing conversion rates, etc. The goal should be included in your report.
- Previous campaign data
It’s important to include some data from recent campaigns. You can briefly discuss what went wrong or right and why it happened. It can be used to compare the current performance with the previous campaign. You can also detect trends or patterns that may have formed over time and strategies that should be eliminated or repeated in your future campaigns.
- Attribution modeling data
An attribution model allows you to give credit to the touchpoints and marketing channels that may have converted a lead. Taking note of your attribution data helps to identify what’s currently working, how to improve the buyer’s journey, and what to tweak in your PPC campaigns.
- PPC metrics
A PPC report wouldn’t be complete without a set of metrics that can help to measure the success of your marketing campaign. Based on the goal, you can display key metrics such as CTR (click-through rate), cost per click, conversion rate, cost per acquisition, return on ad spend (ROAS), etc. All these KPIs are essential to PPC tracking.
Why do you need PPC reports?
PPC advertising is one of the main marketing channels, and keeping track of your ad spend is critical. Without proper reporting and analysis of ad efficiency, you may end up wasting the entire budget. Tracking campaigns’ performance and comparing it to benchmarks will help you in many ways. You will find the relevant audience, tune your offering, and define which channels work best for you. Check out the benefits of PPC reports:
- To present campaign data properly
When you create a PPC report, you’re making it easy for everyone to access marketing data in an organized manner. You’re telling a story of what happened during or after a campaign and the factors that influenced such results.
- To display key metrics
Regardless of the marketing channels you’re using, there are always metrics that need to be checked. They allow you to understand how an audience reacted to your PPC advertising campaign. Metrics are a crucial part of any report.
- To compare campaign history
When you create reports for every ad campaign, it becomes easy to refer to the previous data and make comparisons when necessary. You can access historical data, review what occurred in the past and make better-informed decisions.
- To track campaign results
PPC ads are meant to achieve marketing goals and grow the business in one way or another. A report is a great way to showcase how a campaign has improved brand awareness, increased conversions, or boosted revenue.
- To gain amazing insights
A marketing report provides insights into your up-to-date PPC data. It shows whether your strategies were effective or not. You can discover aspects of your campaign that need to be improved upon and those that truly worked.
- To optimize your campaign
Marketing campaigns, whether paid or organic, need to be analyzed in order to perfect strategies and increase chances of success in the future. PPC reports allow you to collect and analyze real-time data for campaign optimization purposes.
Check out the extensive list of PPC statistics and benchmarks and compare the performance of your campaigns to industry standards.
Using AI tools allows you to significantly reduce the time for PPC reporting and get insights you could overlook with regular reports or dashboards.
Best tools to run and automate PPC reporting
PPC platforms such as Google Ads, Bing Ads, and Facebook Ads provide features that allow users to generate PPC reports. They help you understand the performance of your PPC campaigns. However, the downside of such reports is that they are limited to the marketing activities on each platform.
If you’d like to create cross-channel reports and be able to calculate and visualize custom metrics, you should opt for custom PPC reporting. This includes exporting data from your PPC platforms and building reports in your preferred tools. Whether you need a paid search dashboard for Google Ads performance or multi-channel reporting, these tools enable you to consolidate your PPC data effectively.
Coupler.io
Coupler.io is a one-stop reporting automation solution designed to turn your raw data into meaningful reports. It can meet all your data needs from common ETL integration to creating self-updating marketing reports. Coupler.io supports 390+ data sources meaning that you can pull digital marketing data from apps like Google Ads, Facebook Ads, LinkedIn Ads, and so on. The best part is that it takes one click to automate the data flow from the connected apps.
This solution can power your self-updating dashboards created in spreadsheets (Excel, Google Sheets) or BI tools (Power BI, Looker Studio(Google Data Studio), Tableau, and Qlik).
Coupler.io makes it very effortless for businesses to gather real-time data in one place, perform their analytics, and gain useful insights. It provides subscription plans for different types of businesses. You can get started with a free Coupler.io account.
Looker Studio (Data Studio)
Looker Studio is a web tool for analyzing data, creating smart reports, and building visualizations. Its features include data connectors, report templates, report embedding, visualization options, etc.
There are a variety of data sources supported by Looker, including Google Ads, Google Analytics, YouTube Analytics, Search Ads 360, etc. Some other data sources that are not available on the list can be connected with the help of third-party solutions like Coupler.io.
With just a few clicks, you can create and share interactive reports, charts, or dashboards. It’s a good idea to use Looker Studio as a PPC reporting tool, and the best part is the platform is entirely free for everyone.
Tableau
Tableau is a data analytics and visualization platform that offers a data management solution to connect and transform your marketing data.
You can pull cross-channel advertising data from a variety of sources (file systems, cloud storages, and databases).
You can also connect major ad platforms, such as Google Ads or Facebook Ads, directly to Tableau and use the reporting feature to organize your PPC marketing data into interactive charts and dashboards. It also allows you to add the filters, metrics, and dimensions that are important for your goals.
Tableau also makes it possible to share your dashboards and reports with other members of your team. The pricing starts at $15 per month but you can get started with a 14-day free trial.
Power BI
Power BI is a data visualization and discovery platform that allows you to connect, clean, and process marketing data. It also provides features for analyzing, collecting insights, and creating reporting dashboards.
Although you can directly connect your app or database to PowerBI, many popular PPC sources are not supported. You might need to export data from your advertising platforms first and then upload it as Excel, CSV, or PDF. As an alternative, you can also use a third-party connector such as Coupler.io to export your PPC advertising data directly to Power BI.
Then, you’ll be able to use Power BI to visualize marketing datasets and create interactive reports or dashboards. There are widgets for visualization, including charts, cards, graphs, tables, maps, slicers, treemaps, etc.
This tool also makes it easy for your team to collaborate on data and report creation. There’s a free version as well as pro and premium pricing plans from $9.99 per month.
Start with PPC reporting templates by Coupler.io
If you’re not keen on creating marketing reports from scratch, there are PPC report templates to use. They are helpful when you need a quick report for your campaigns. You can find free and paid PPC report templates on the web. Coupler.io offers both single-source and multichannel report templates for PPC analytics. They are automated, interactive, and scalable if needed. You can customize the report layout and the data refresh schedule to have a close to real-time data update frequency: every 15 minutes.
To use a PPC dashboard template, open it and follow the instructions in the Readme tab. They will help you connect your datasets from different sources and customize the template for a specific case. Let’s check out the two most popular dashboard templates.
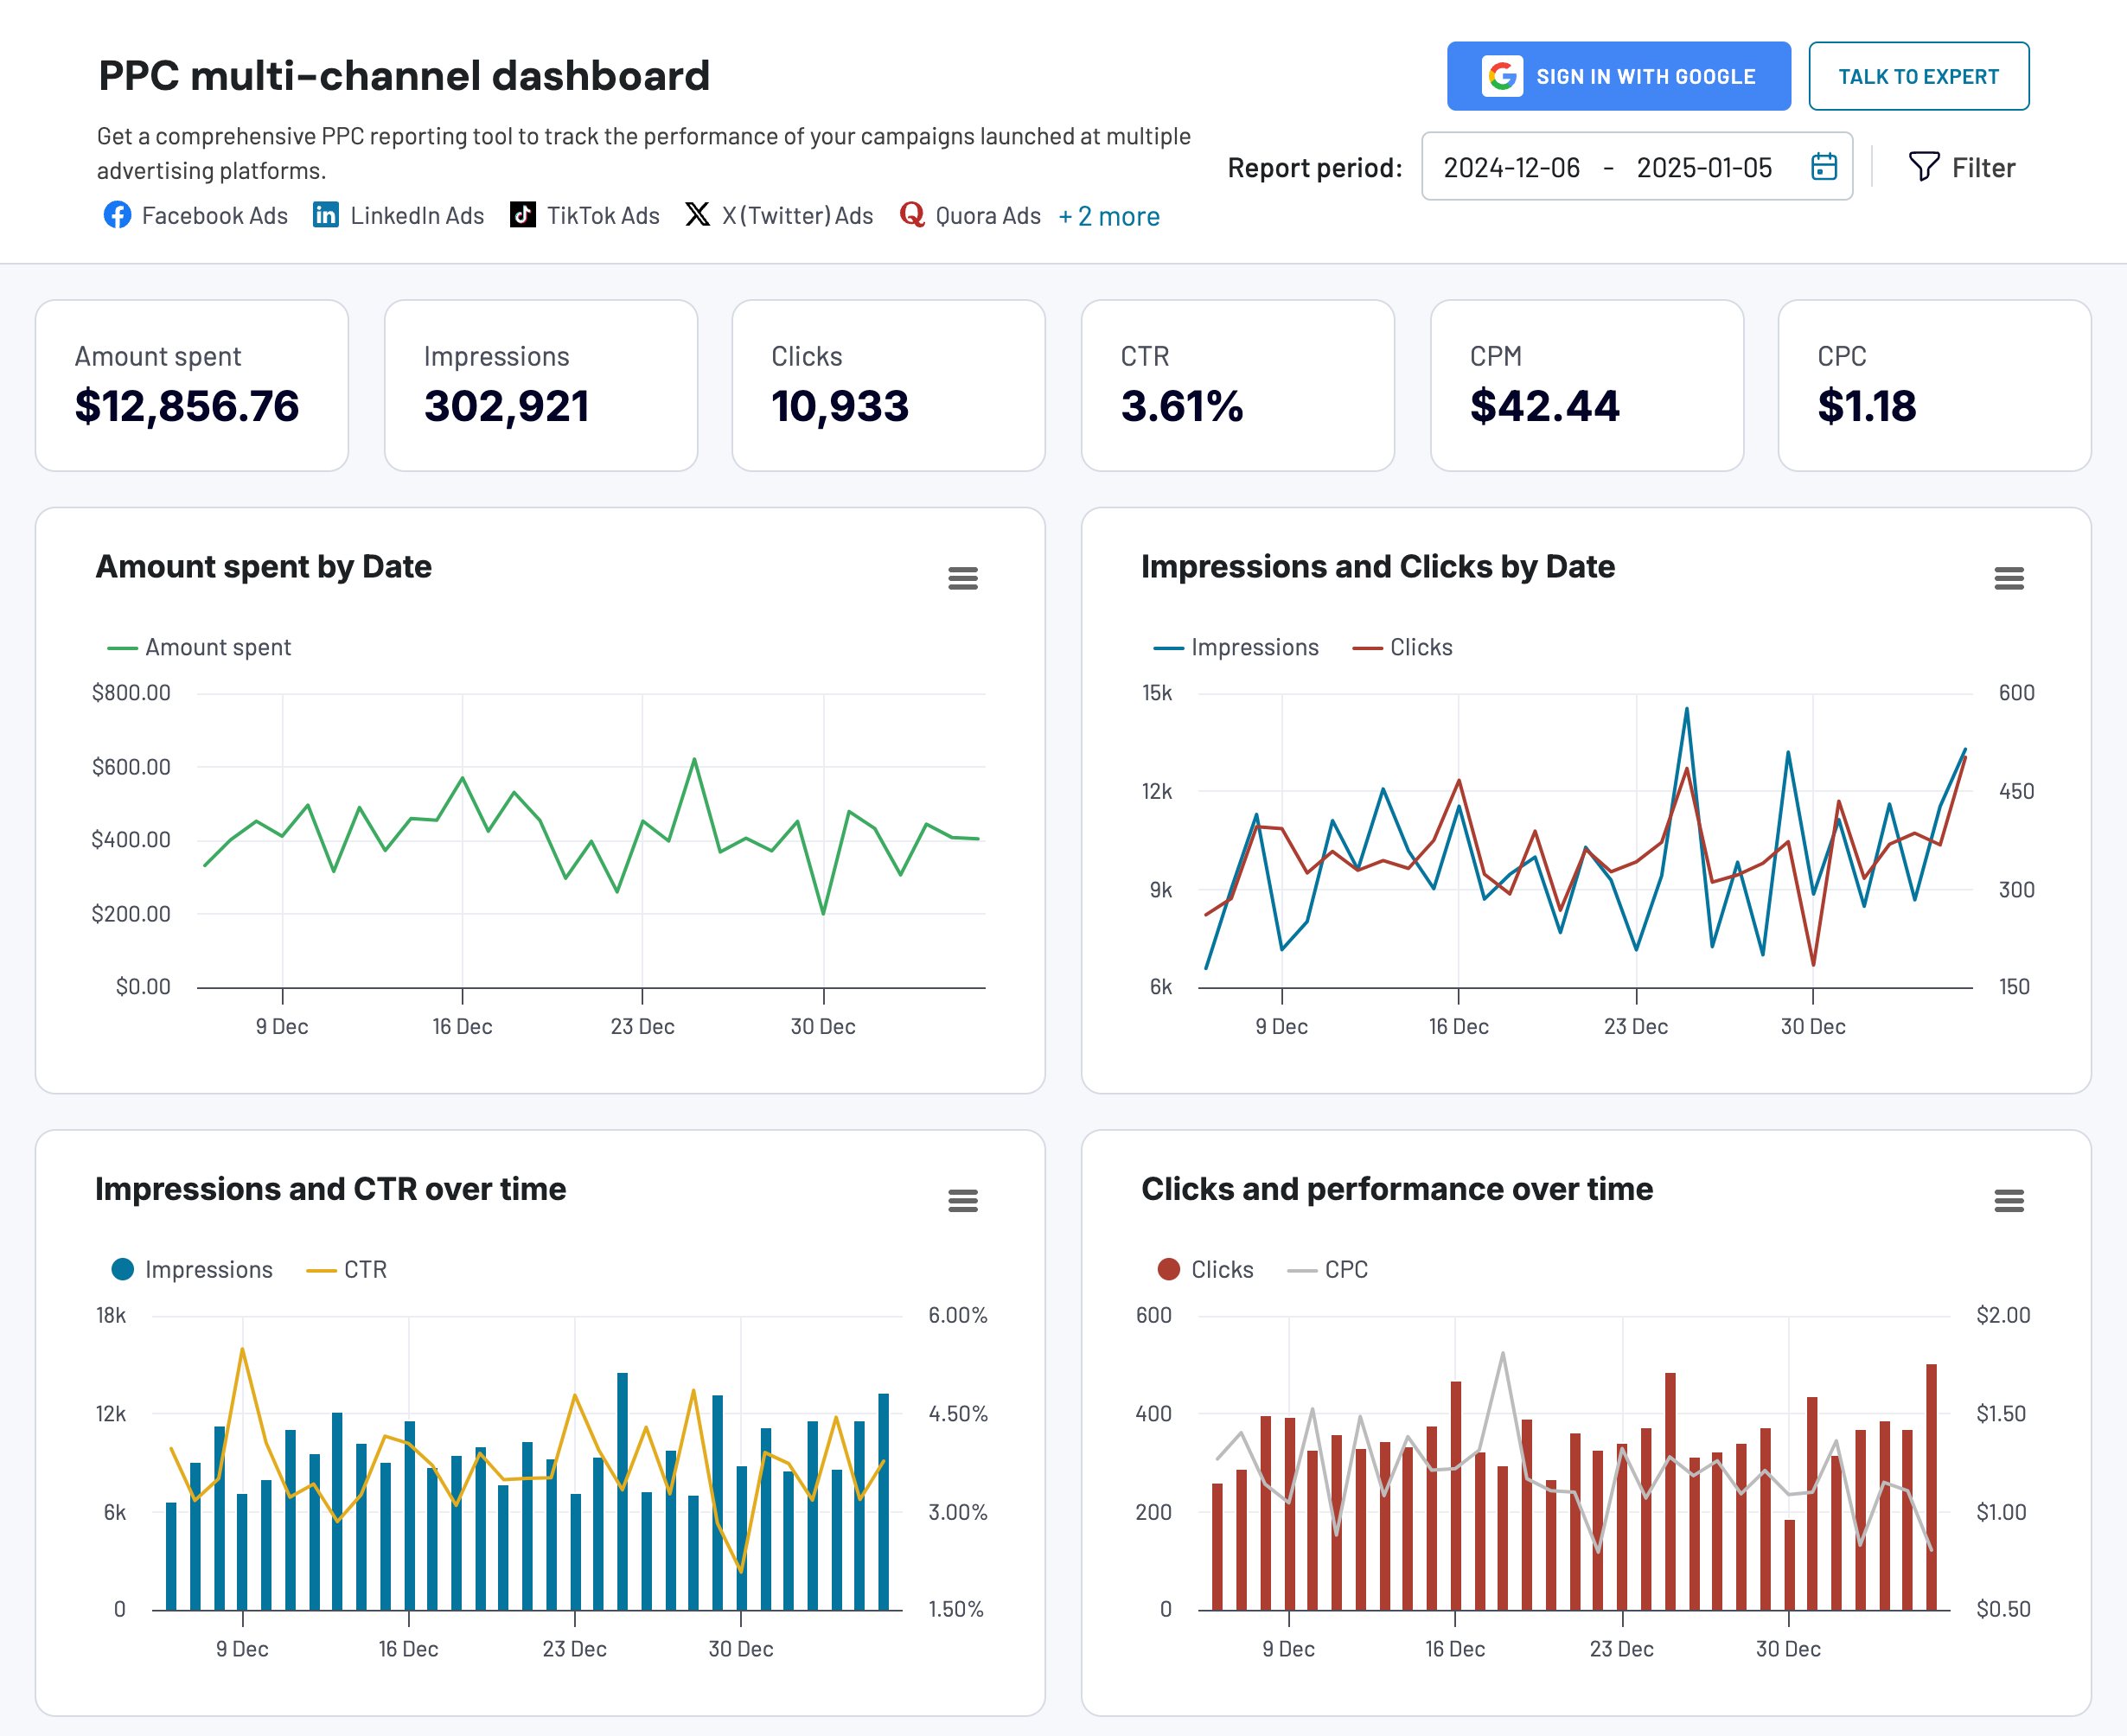
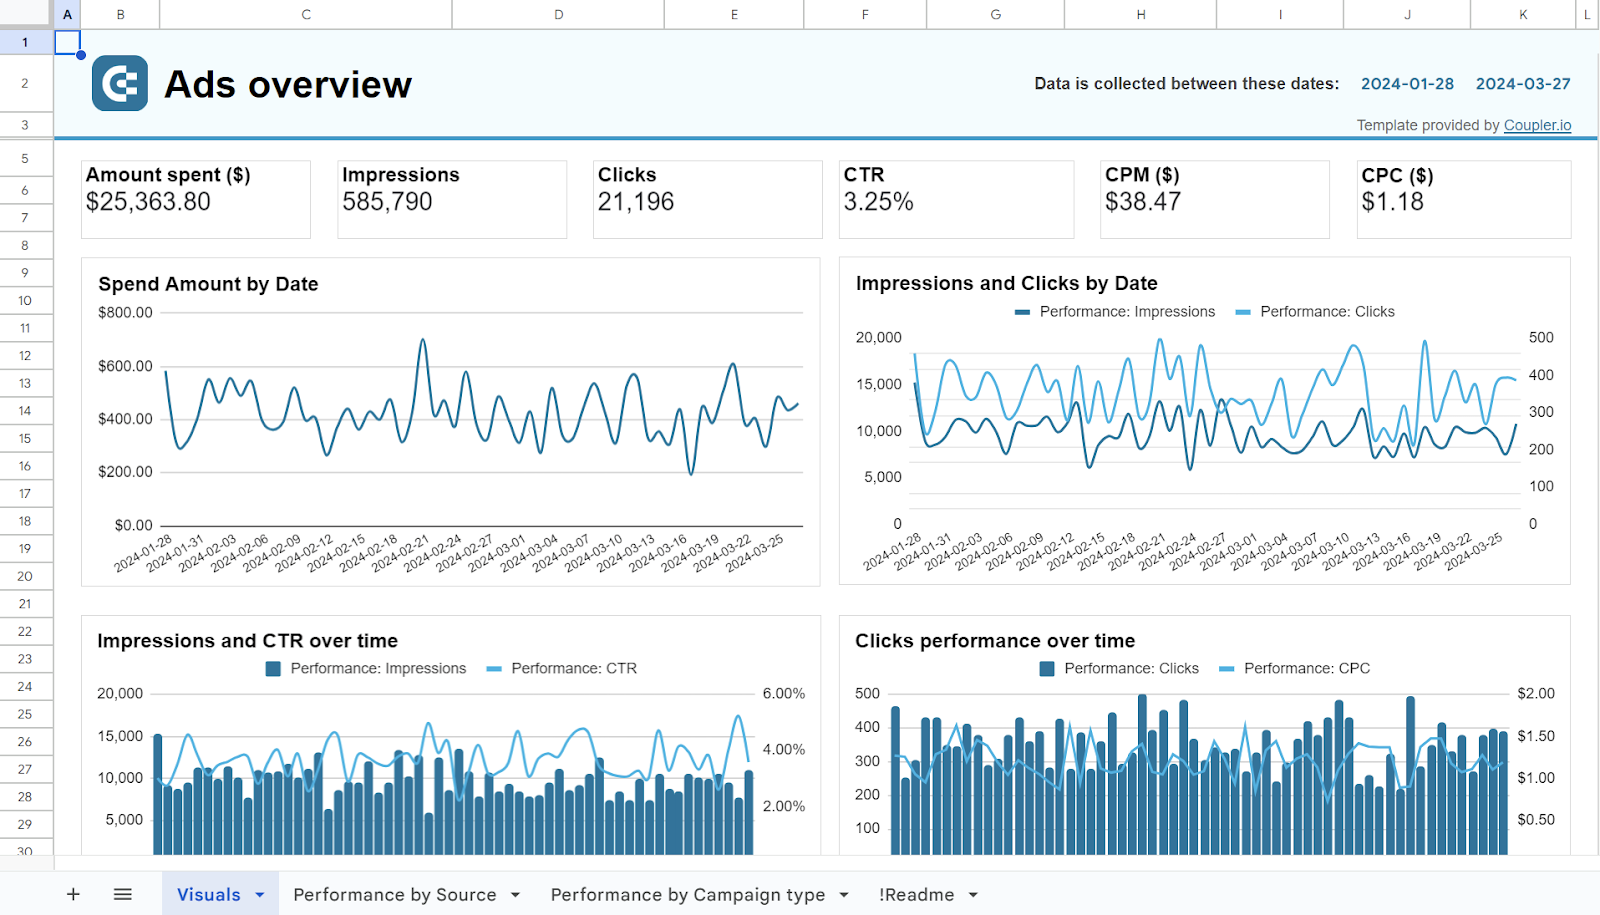
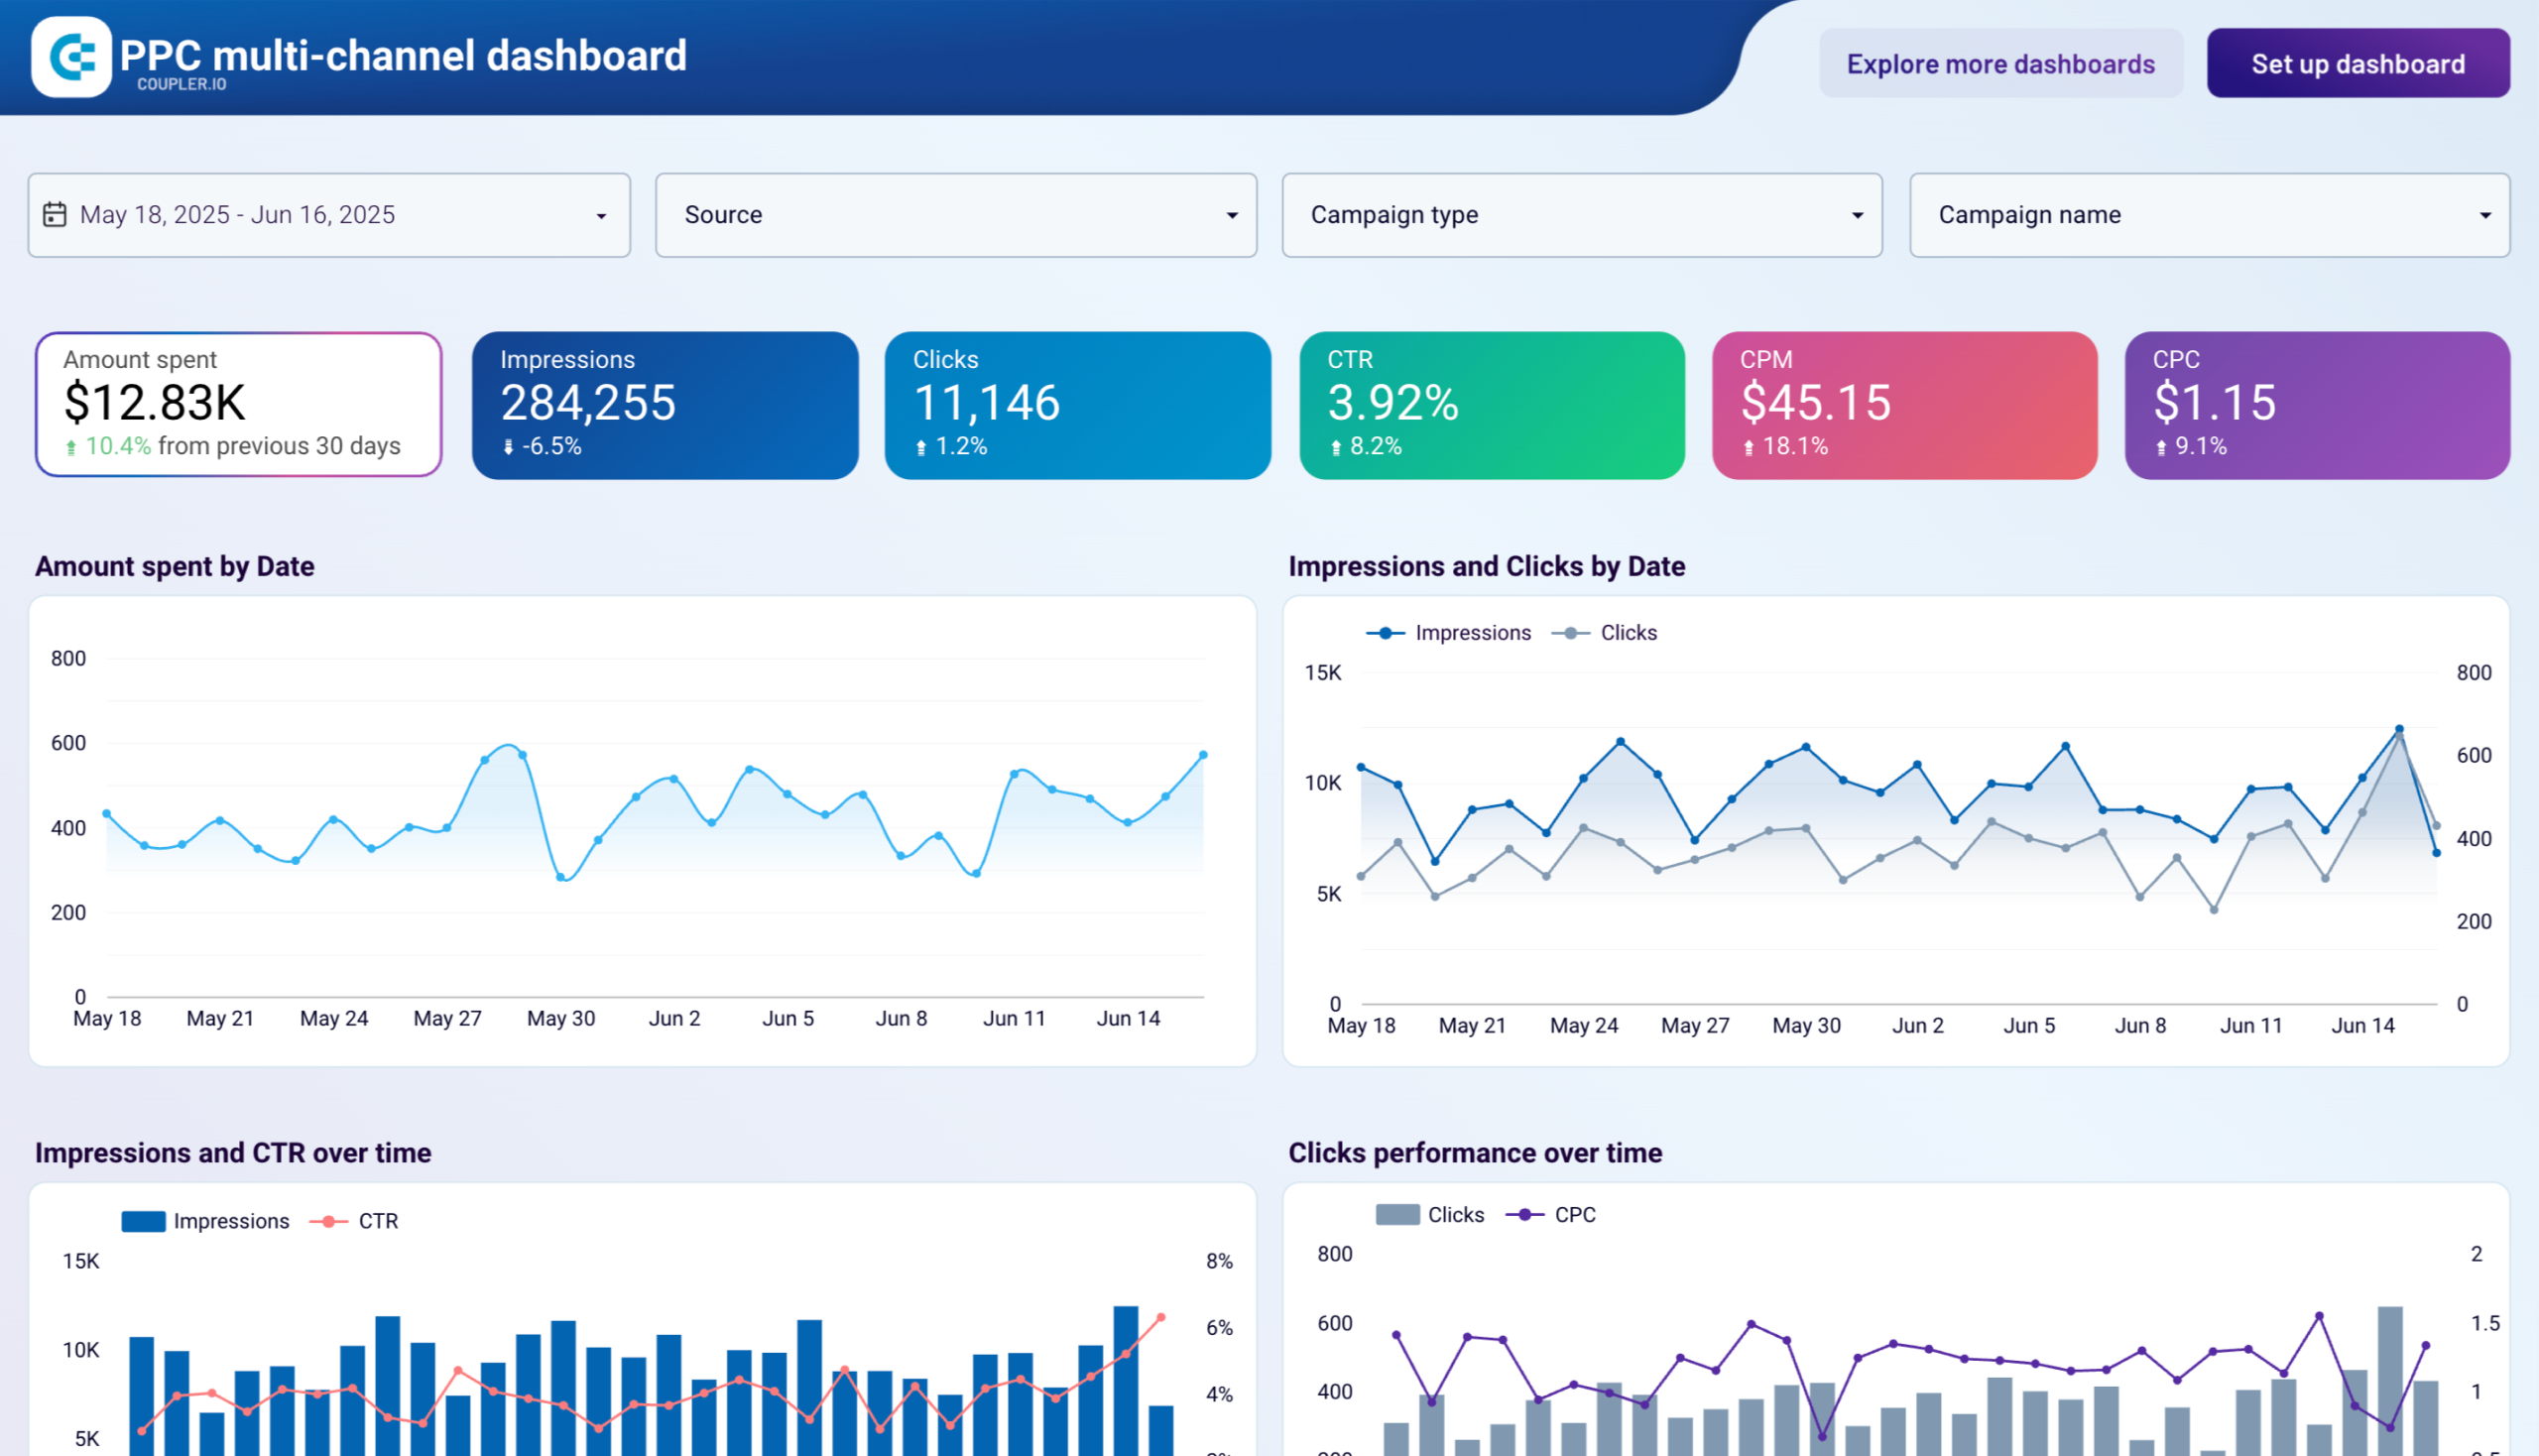
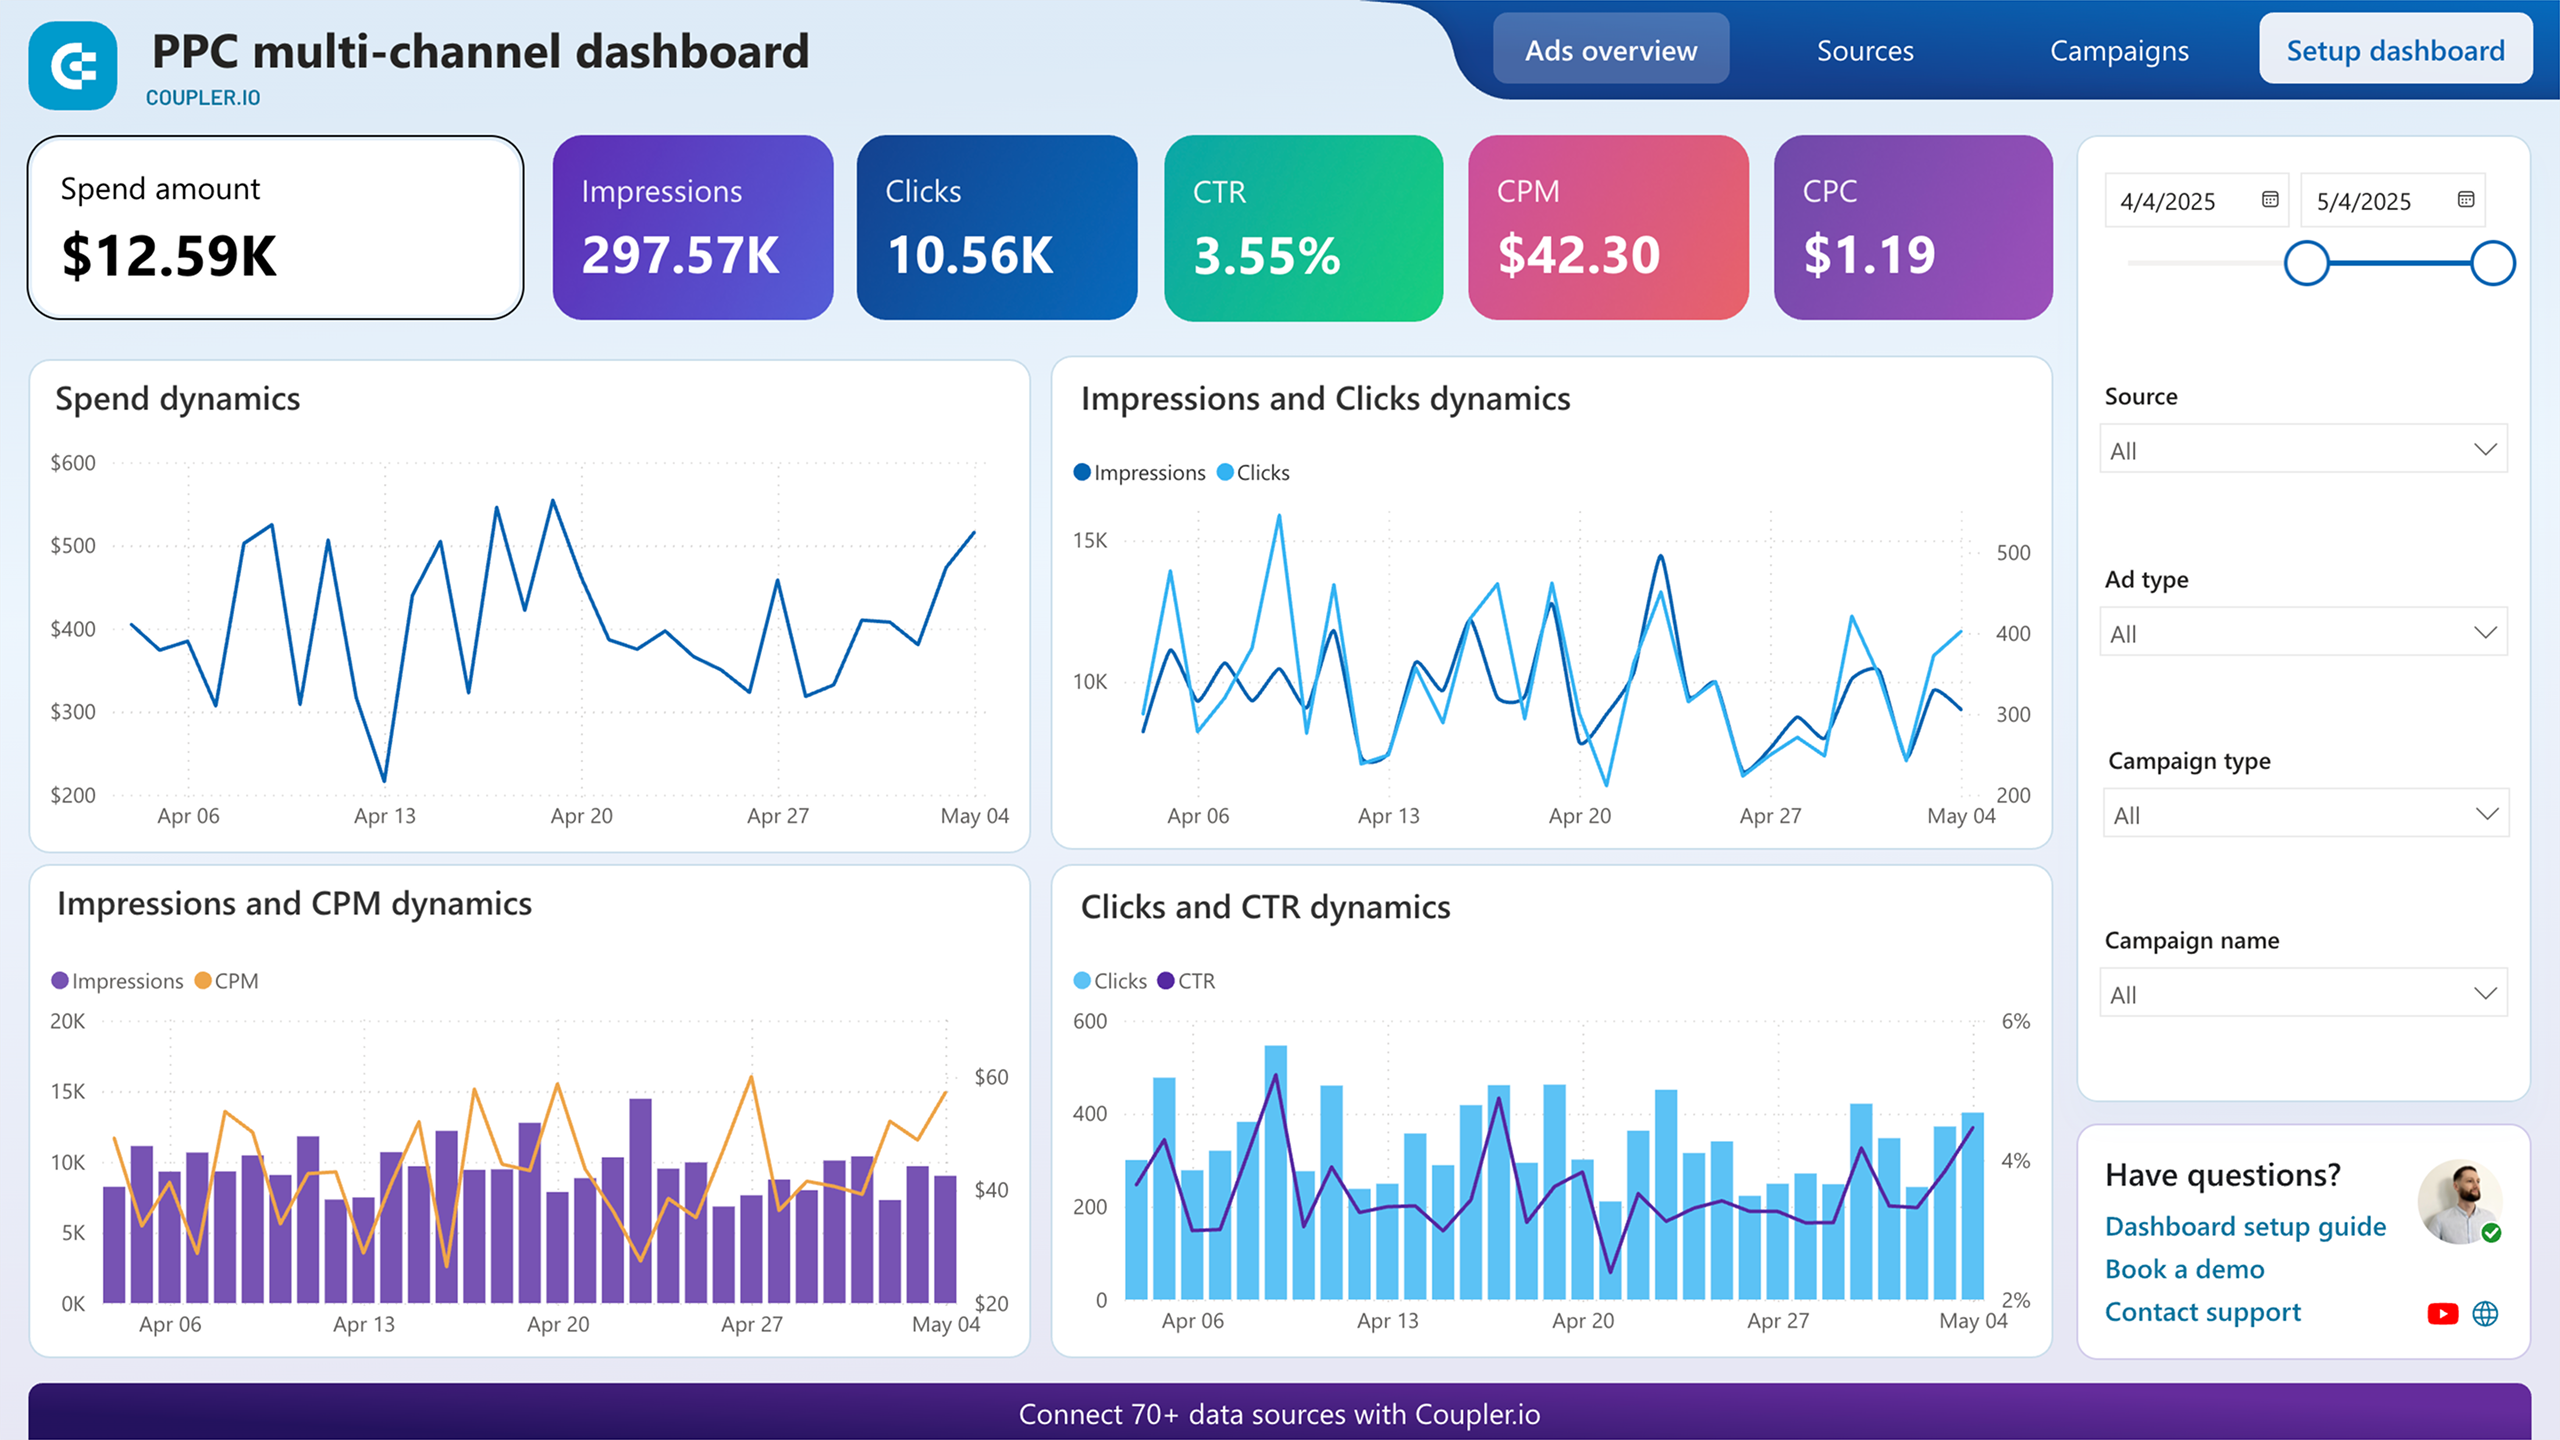
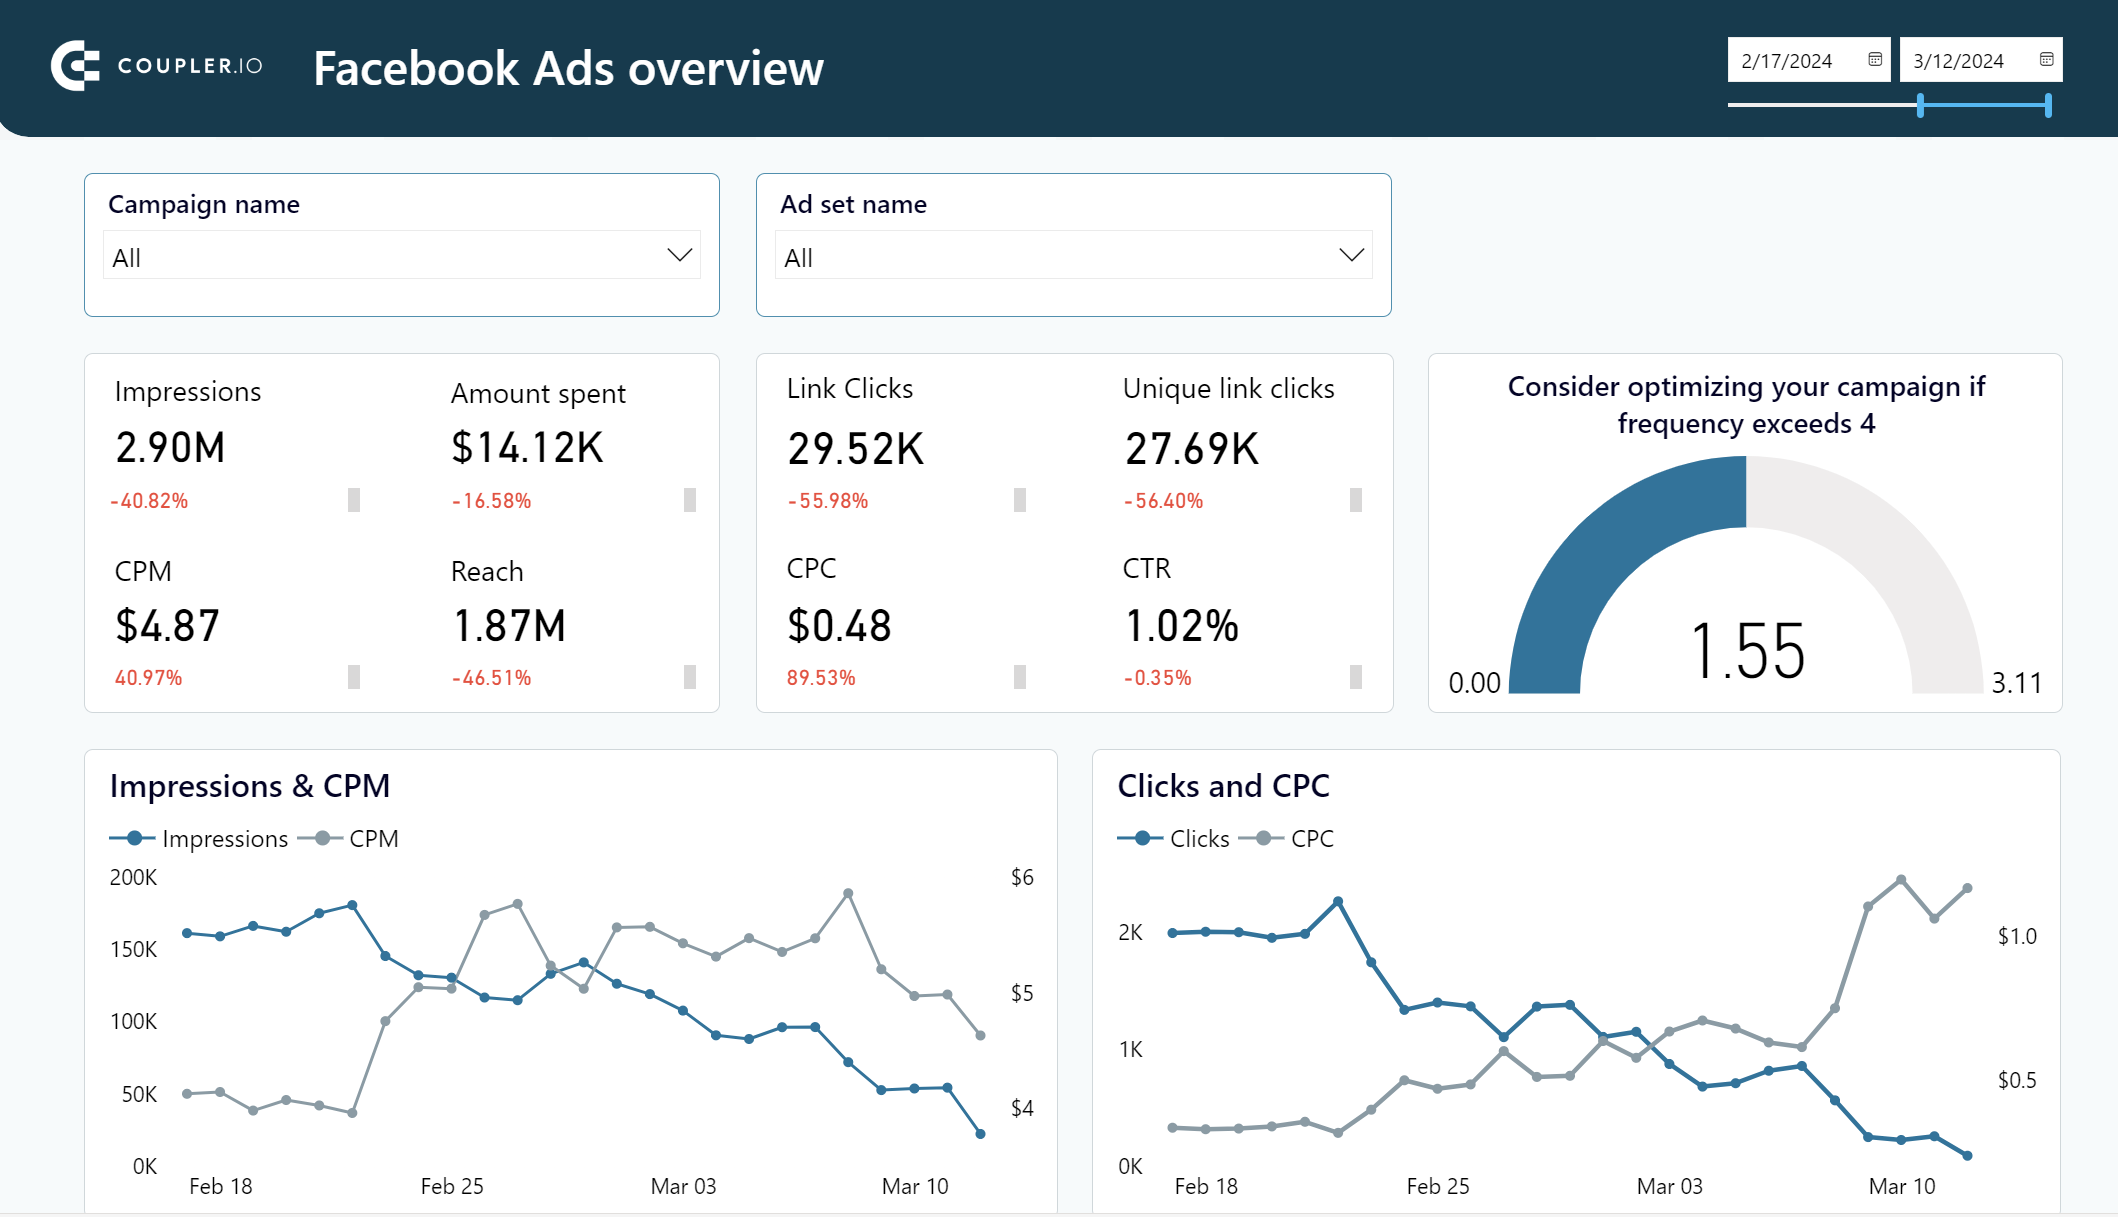
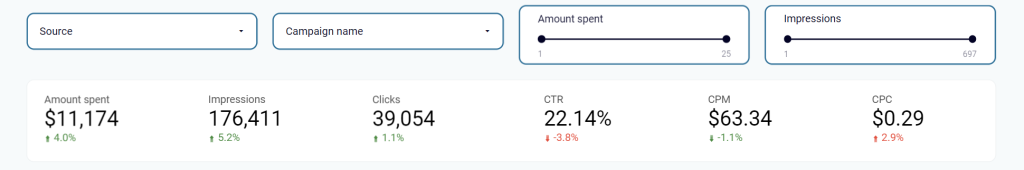
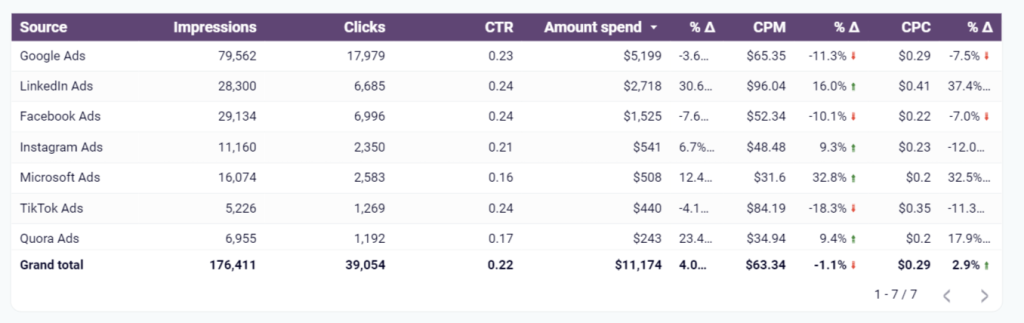
PPC multichannel dashboard template
This PPC report is connected to multiple advertising platforms: Google Ads, LinkedIn Ads, Facebook Ads, Instagram Ads, Microsoft (Bing) Ads, TikTok Ads, and Quora ads.
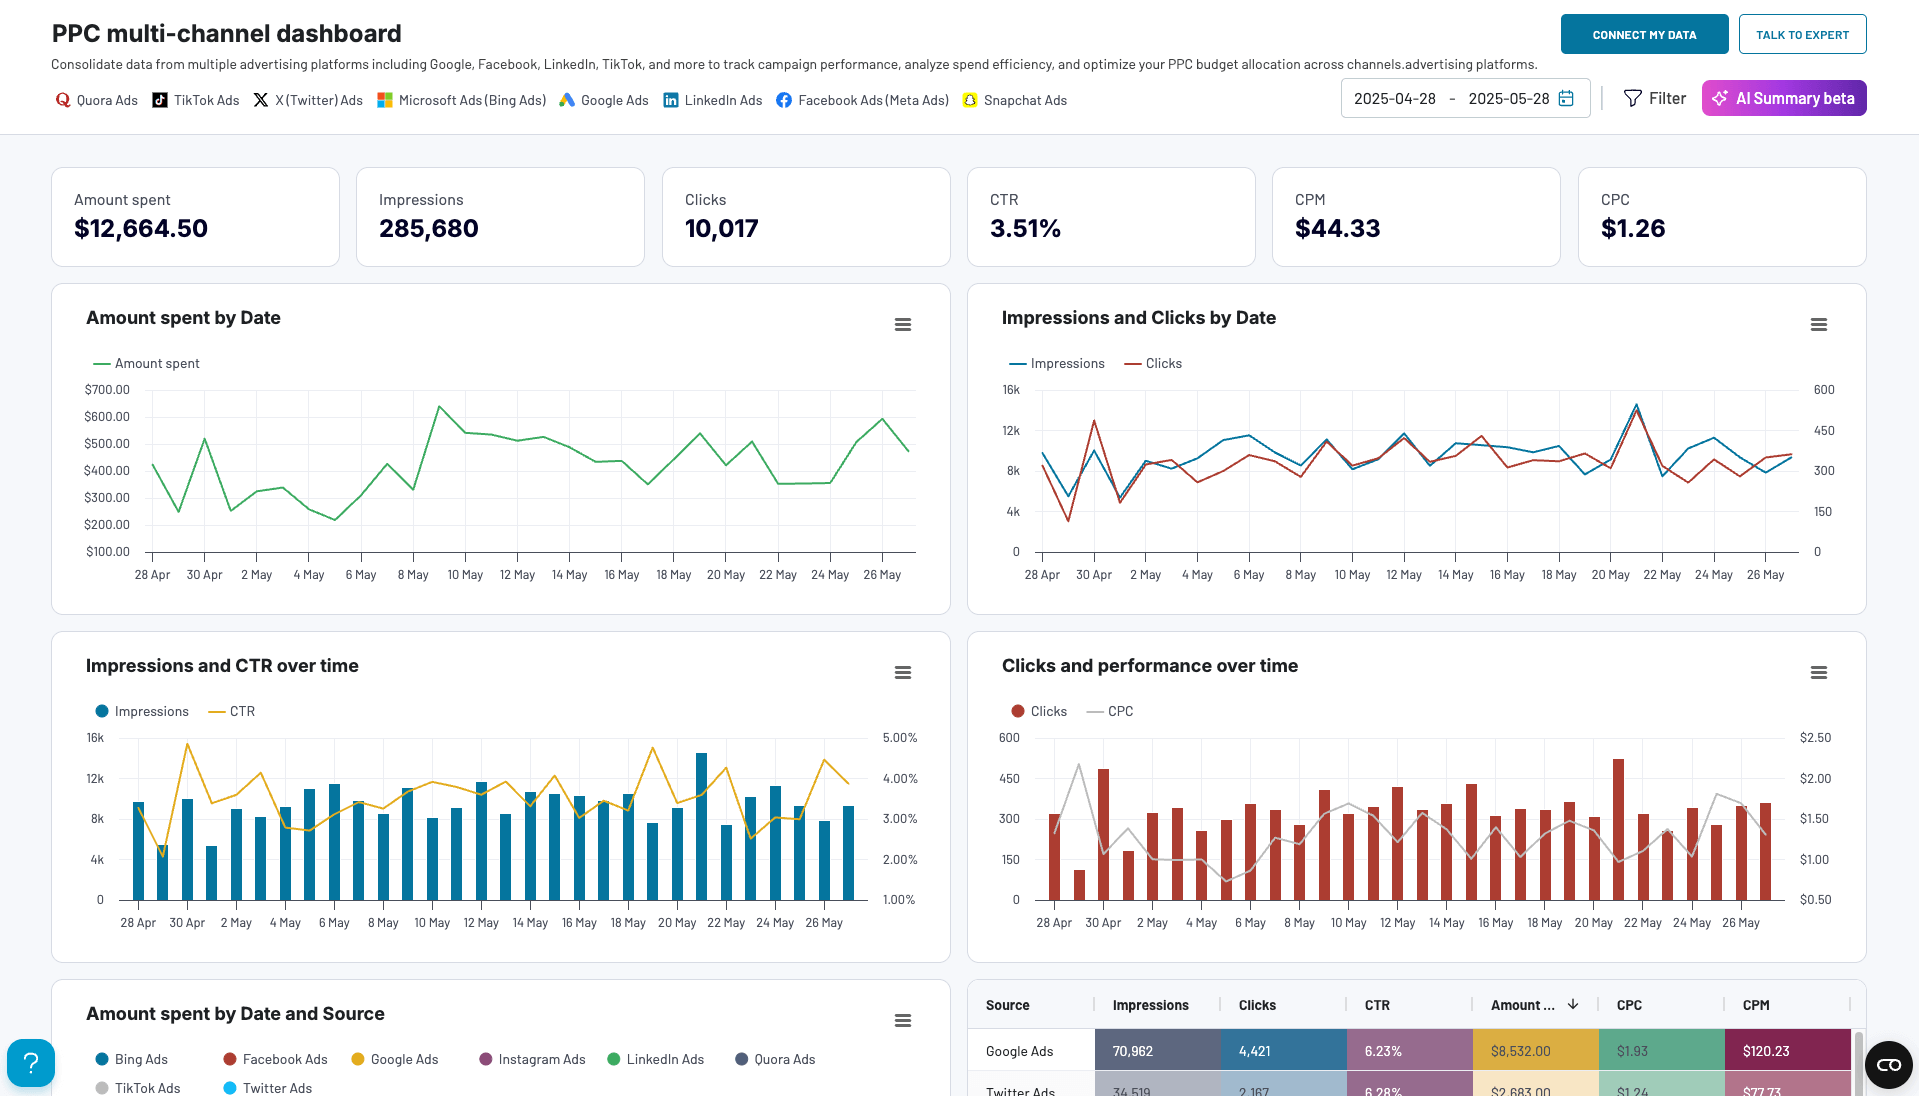
You can switch between ad channels to analyze your metrics from various perspectives. It’s also possible to search through periods, filter data by campaign, the amount spent, and the number of impressions. All this allows you to have a comprehensive cross-channel view of all your marketing performance in one place.
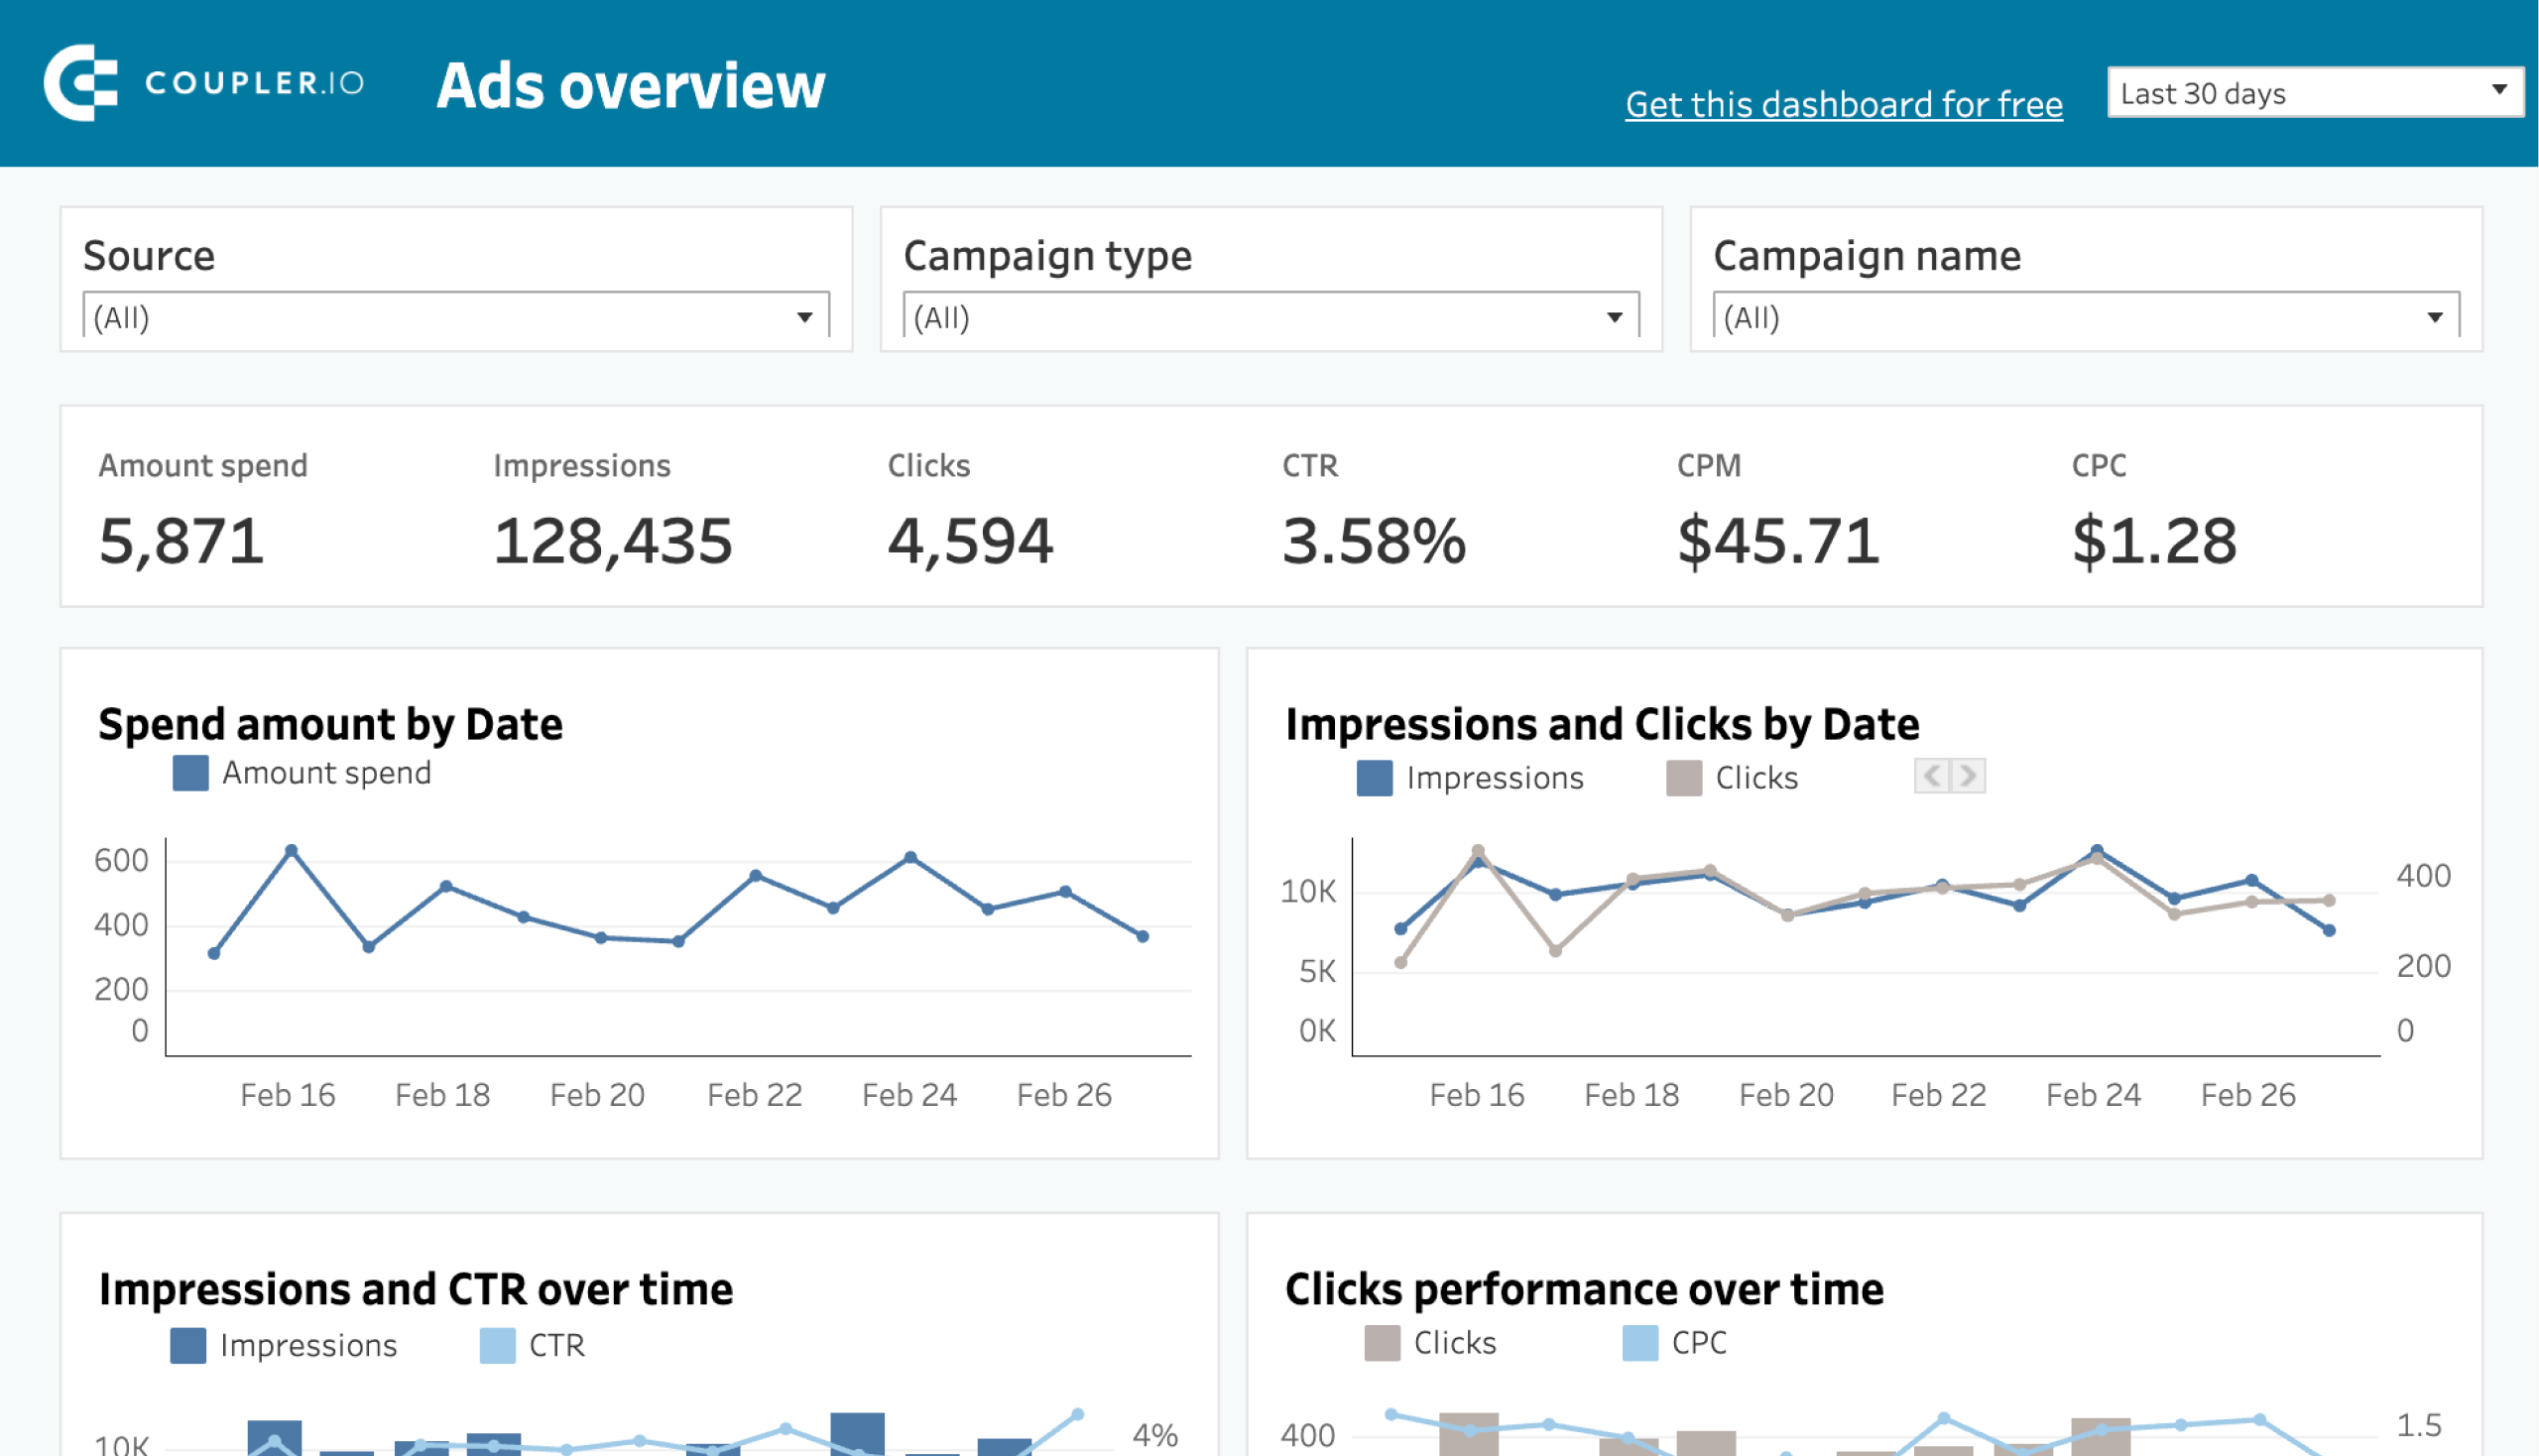
This PPC multichannel dashboard is also available as a template for different data visualization tools. Try out the one that fits your reporting requirements.


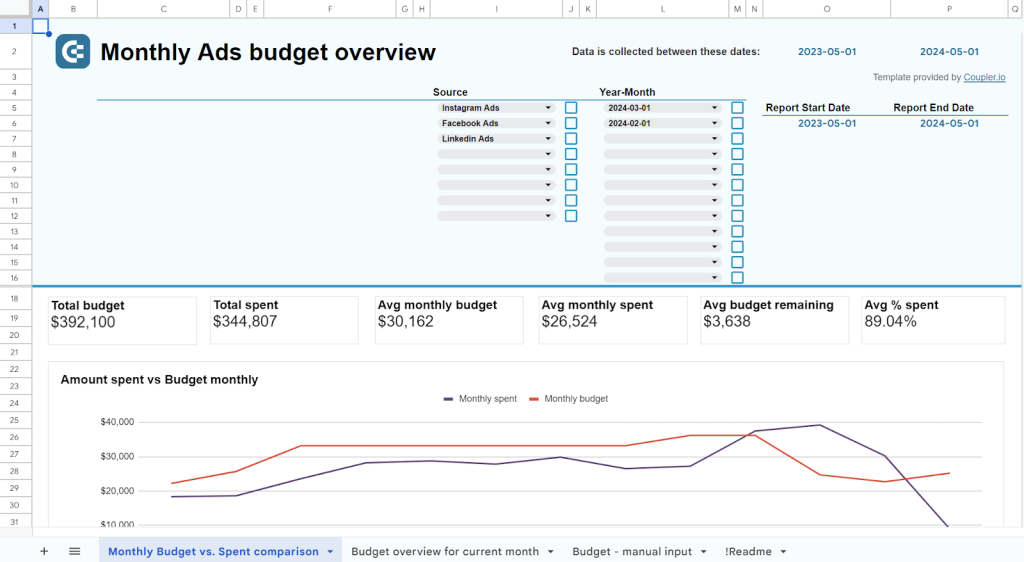
PPC monthly budget dashboard template in Google Sheets
If you need to track the dynamics of spending on advertising, check this PPC monthly budget dashboard. It provides a budget overview for the current month with spending predictions and alerts to avoid budget overspending. The template is designed in Google Sheets and lets you connect multiple ad source accounts to the dashboard.
Multi-channel creatives dashboard template
Another dashboard, powered by one of the best data blending platforms, Coupler.io, allows you to analyze the performance of your ad creatives across different channels. With the multi-channel creatives dashboard, you can compare how the same creative performs on Google, Facebook, LinkedIn, and other platforms.
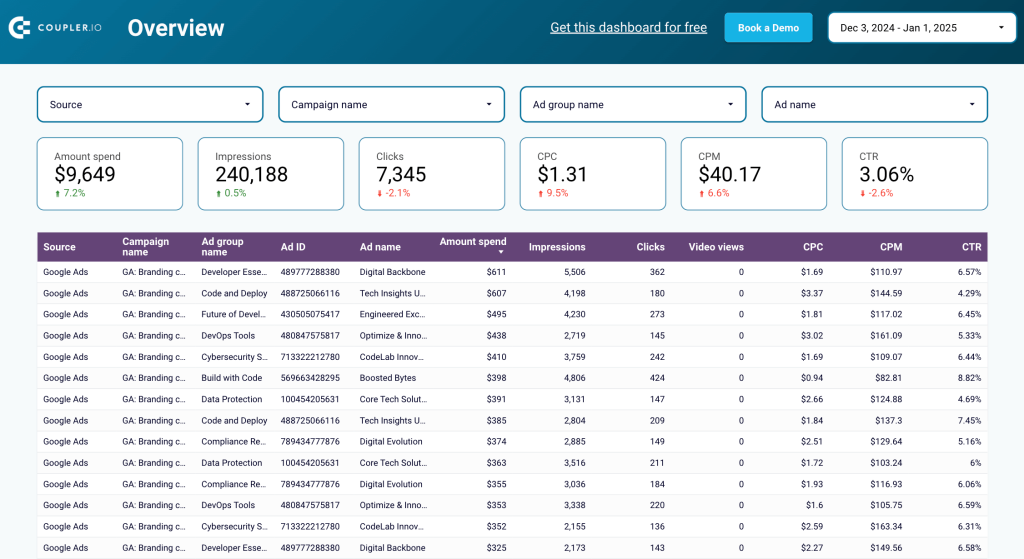
This dashboard enables you to evaluate your creatives using key metrics such as impressions, clicks, CTR, CPC, and ad spend. It offers advanced filtering options to analyze data by platform, campaign, or time period so that you have a clear overview of your PPC efforts.
Why use this dashboard?
- Cross-platform analysis – Track and compare creative performance across multiple platforms in a single view.
- In-depth filtering – Filter the dashboard by platform, ad campaign, group, and name to get a granular overview of your advertising results.
- Data-driven insights – Discover top-performing creatives and identify areas for improvement.
The dashboard is available in Google Sheets and Looker Studio. To connect your accounts, simply follow the setup instructions in the Readme tab. Your data will be populated within minutes, allowing you to start tracking your creatives’ performance immediately.
Single-source PPC dashboard templates
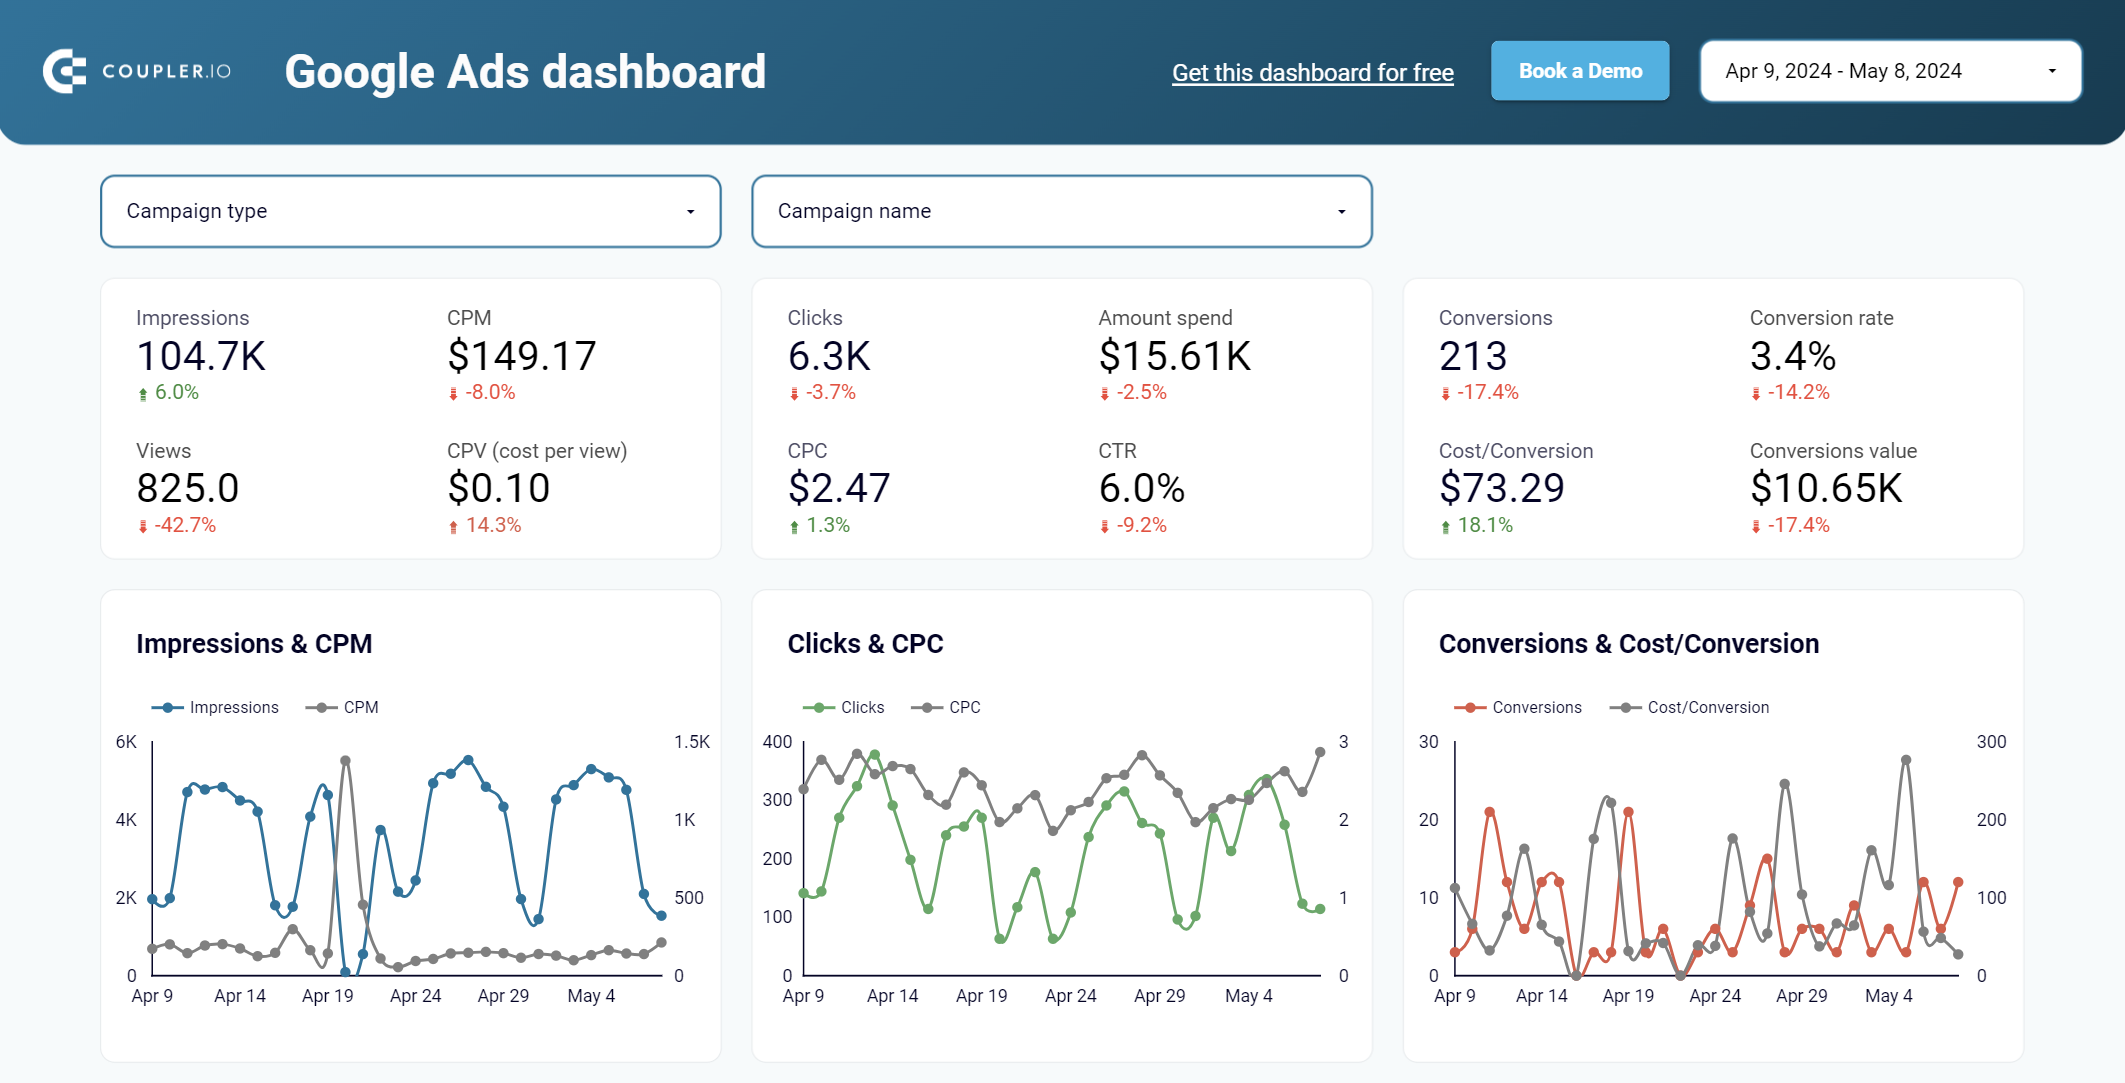
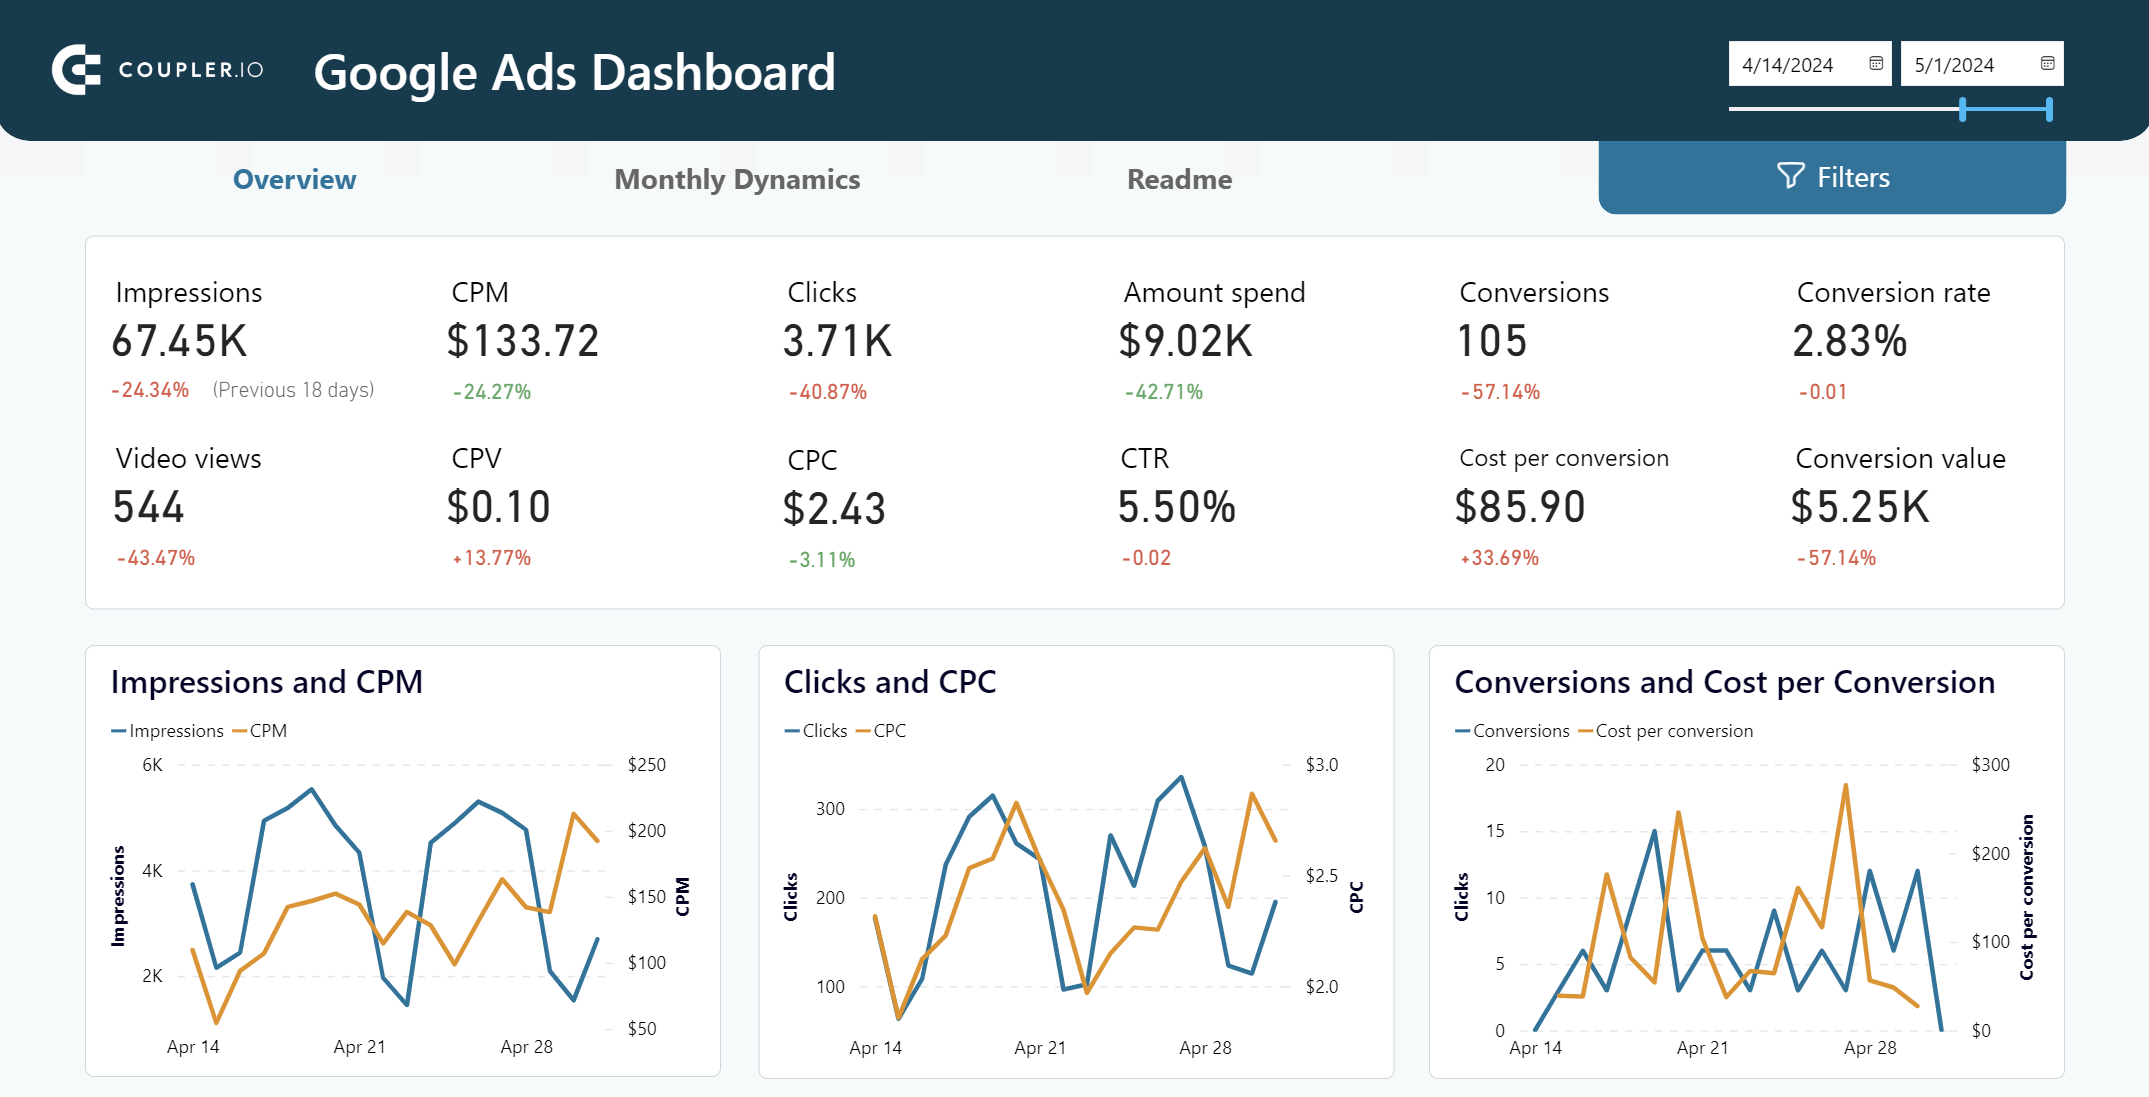
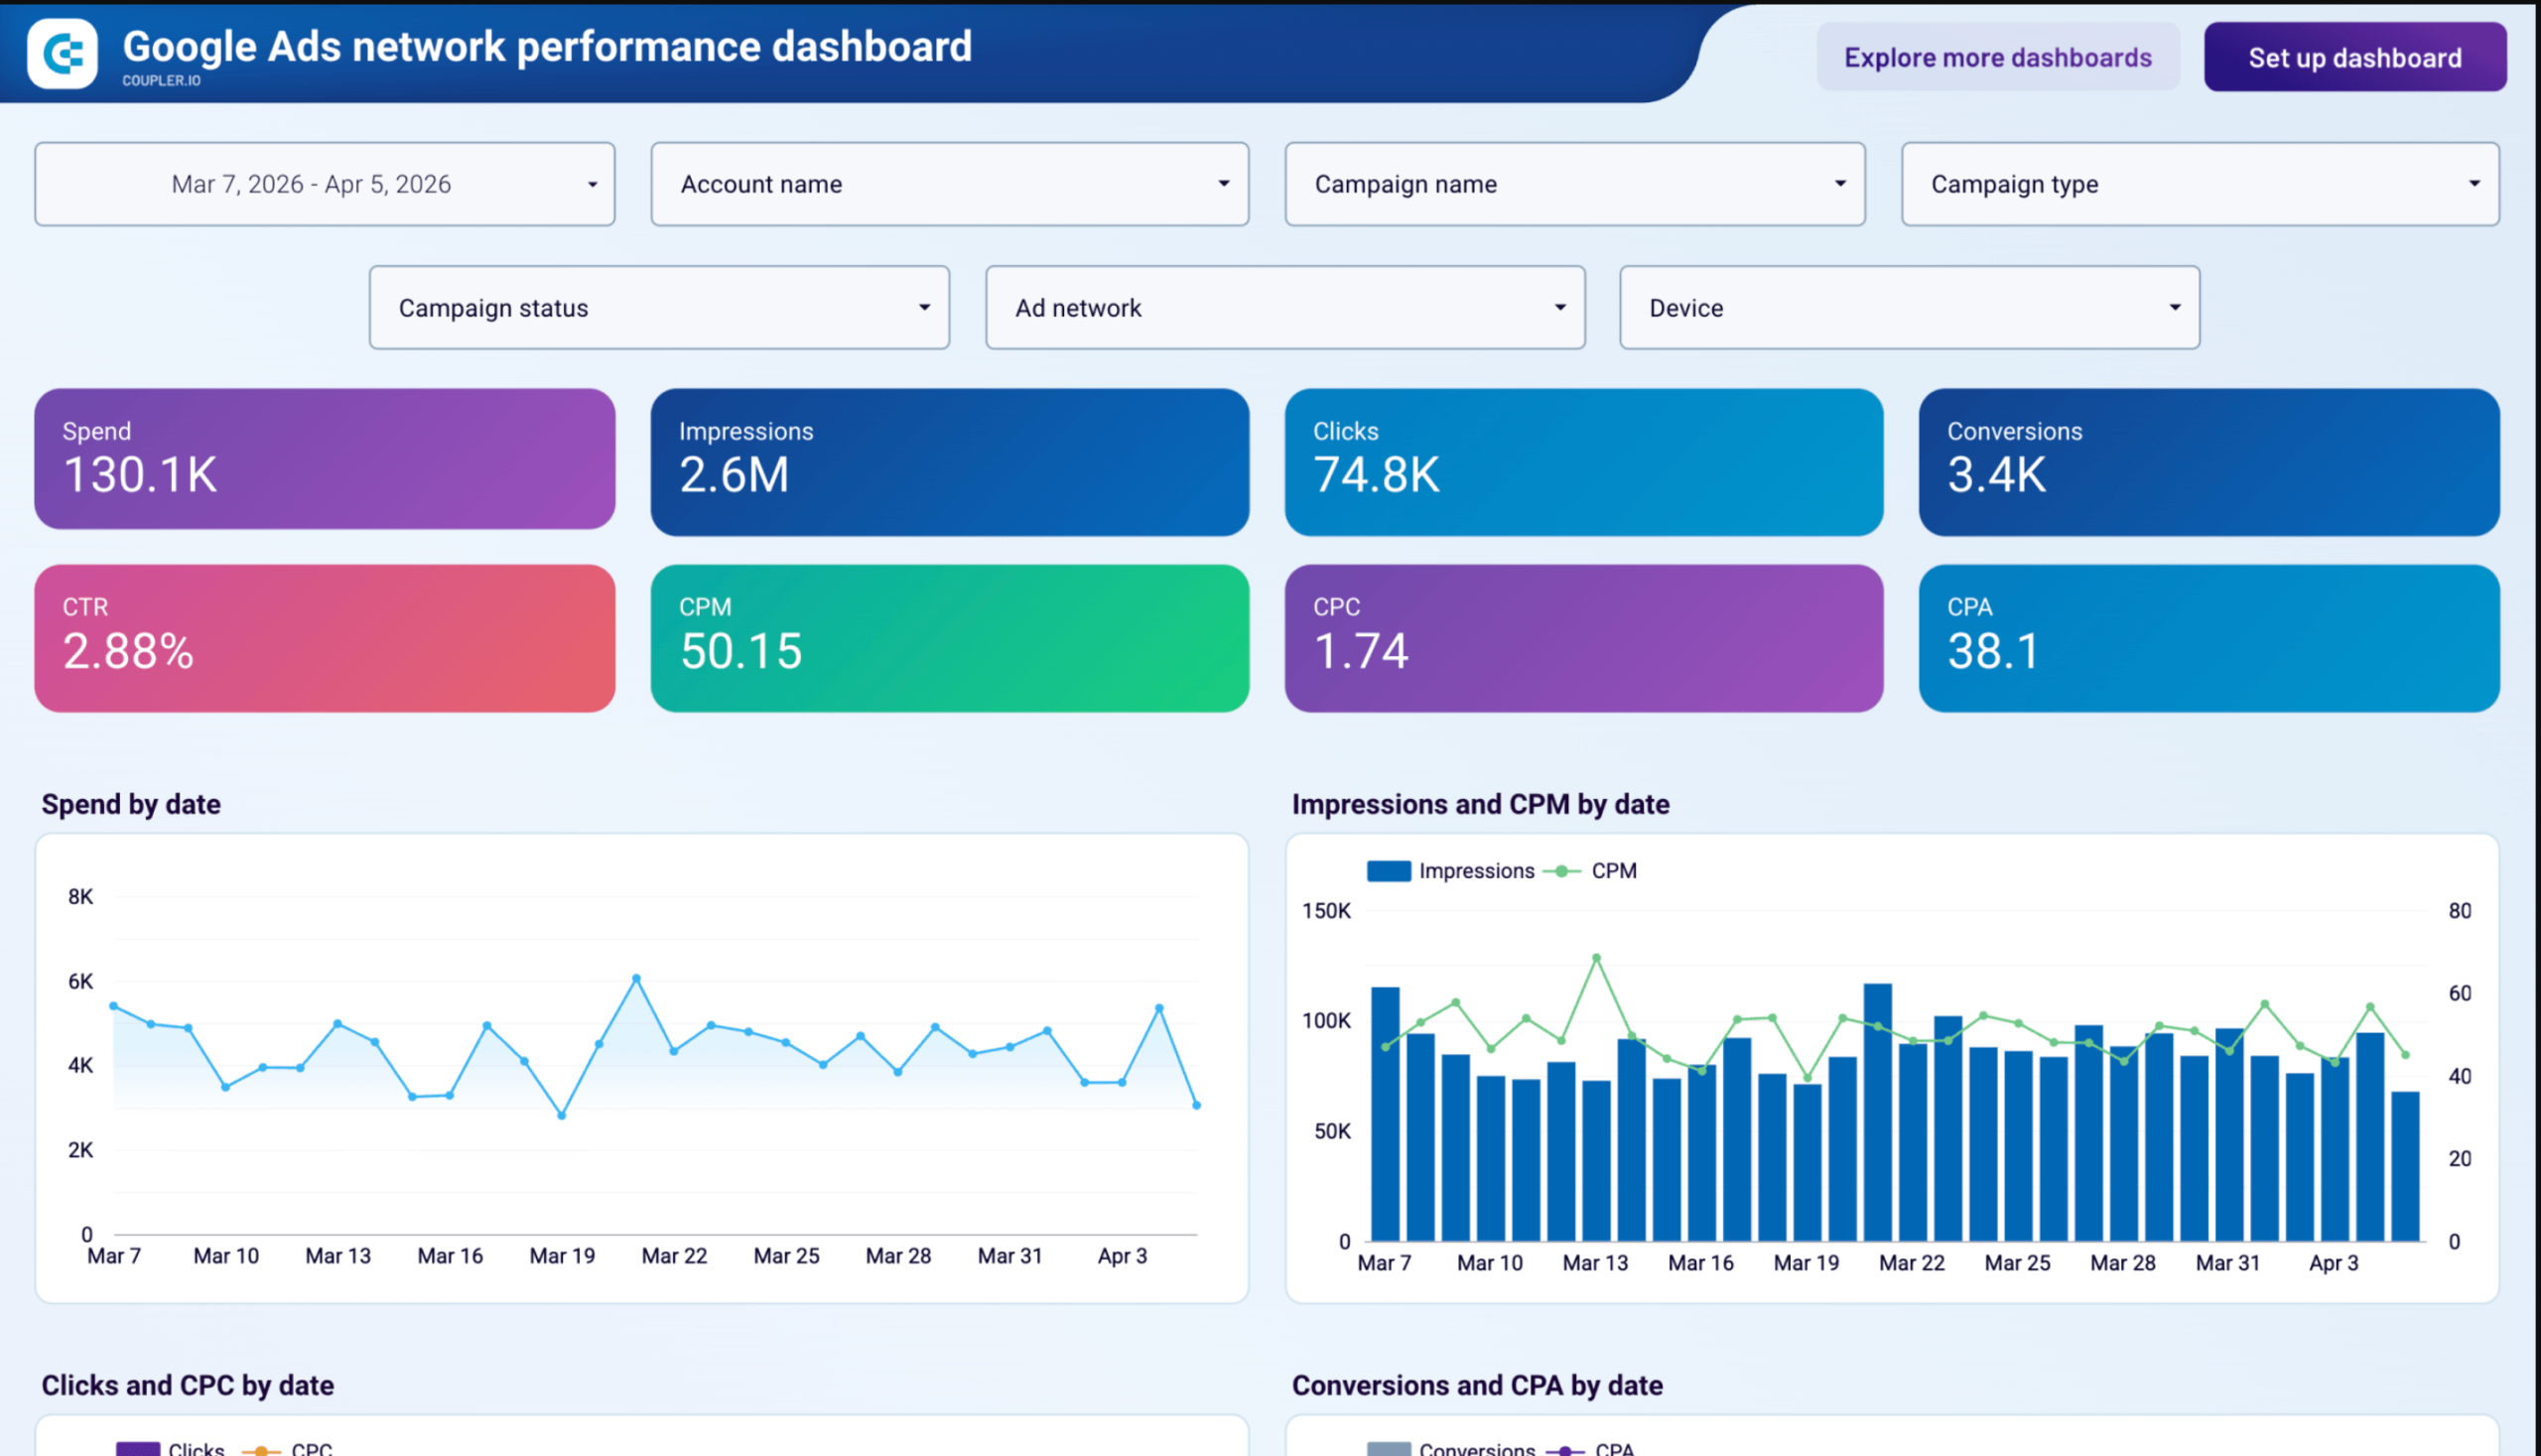
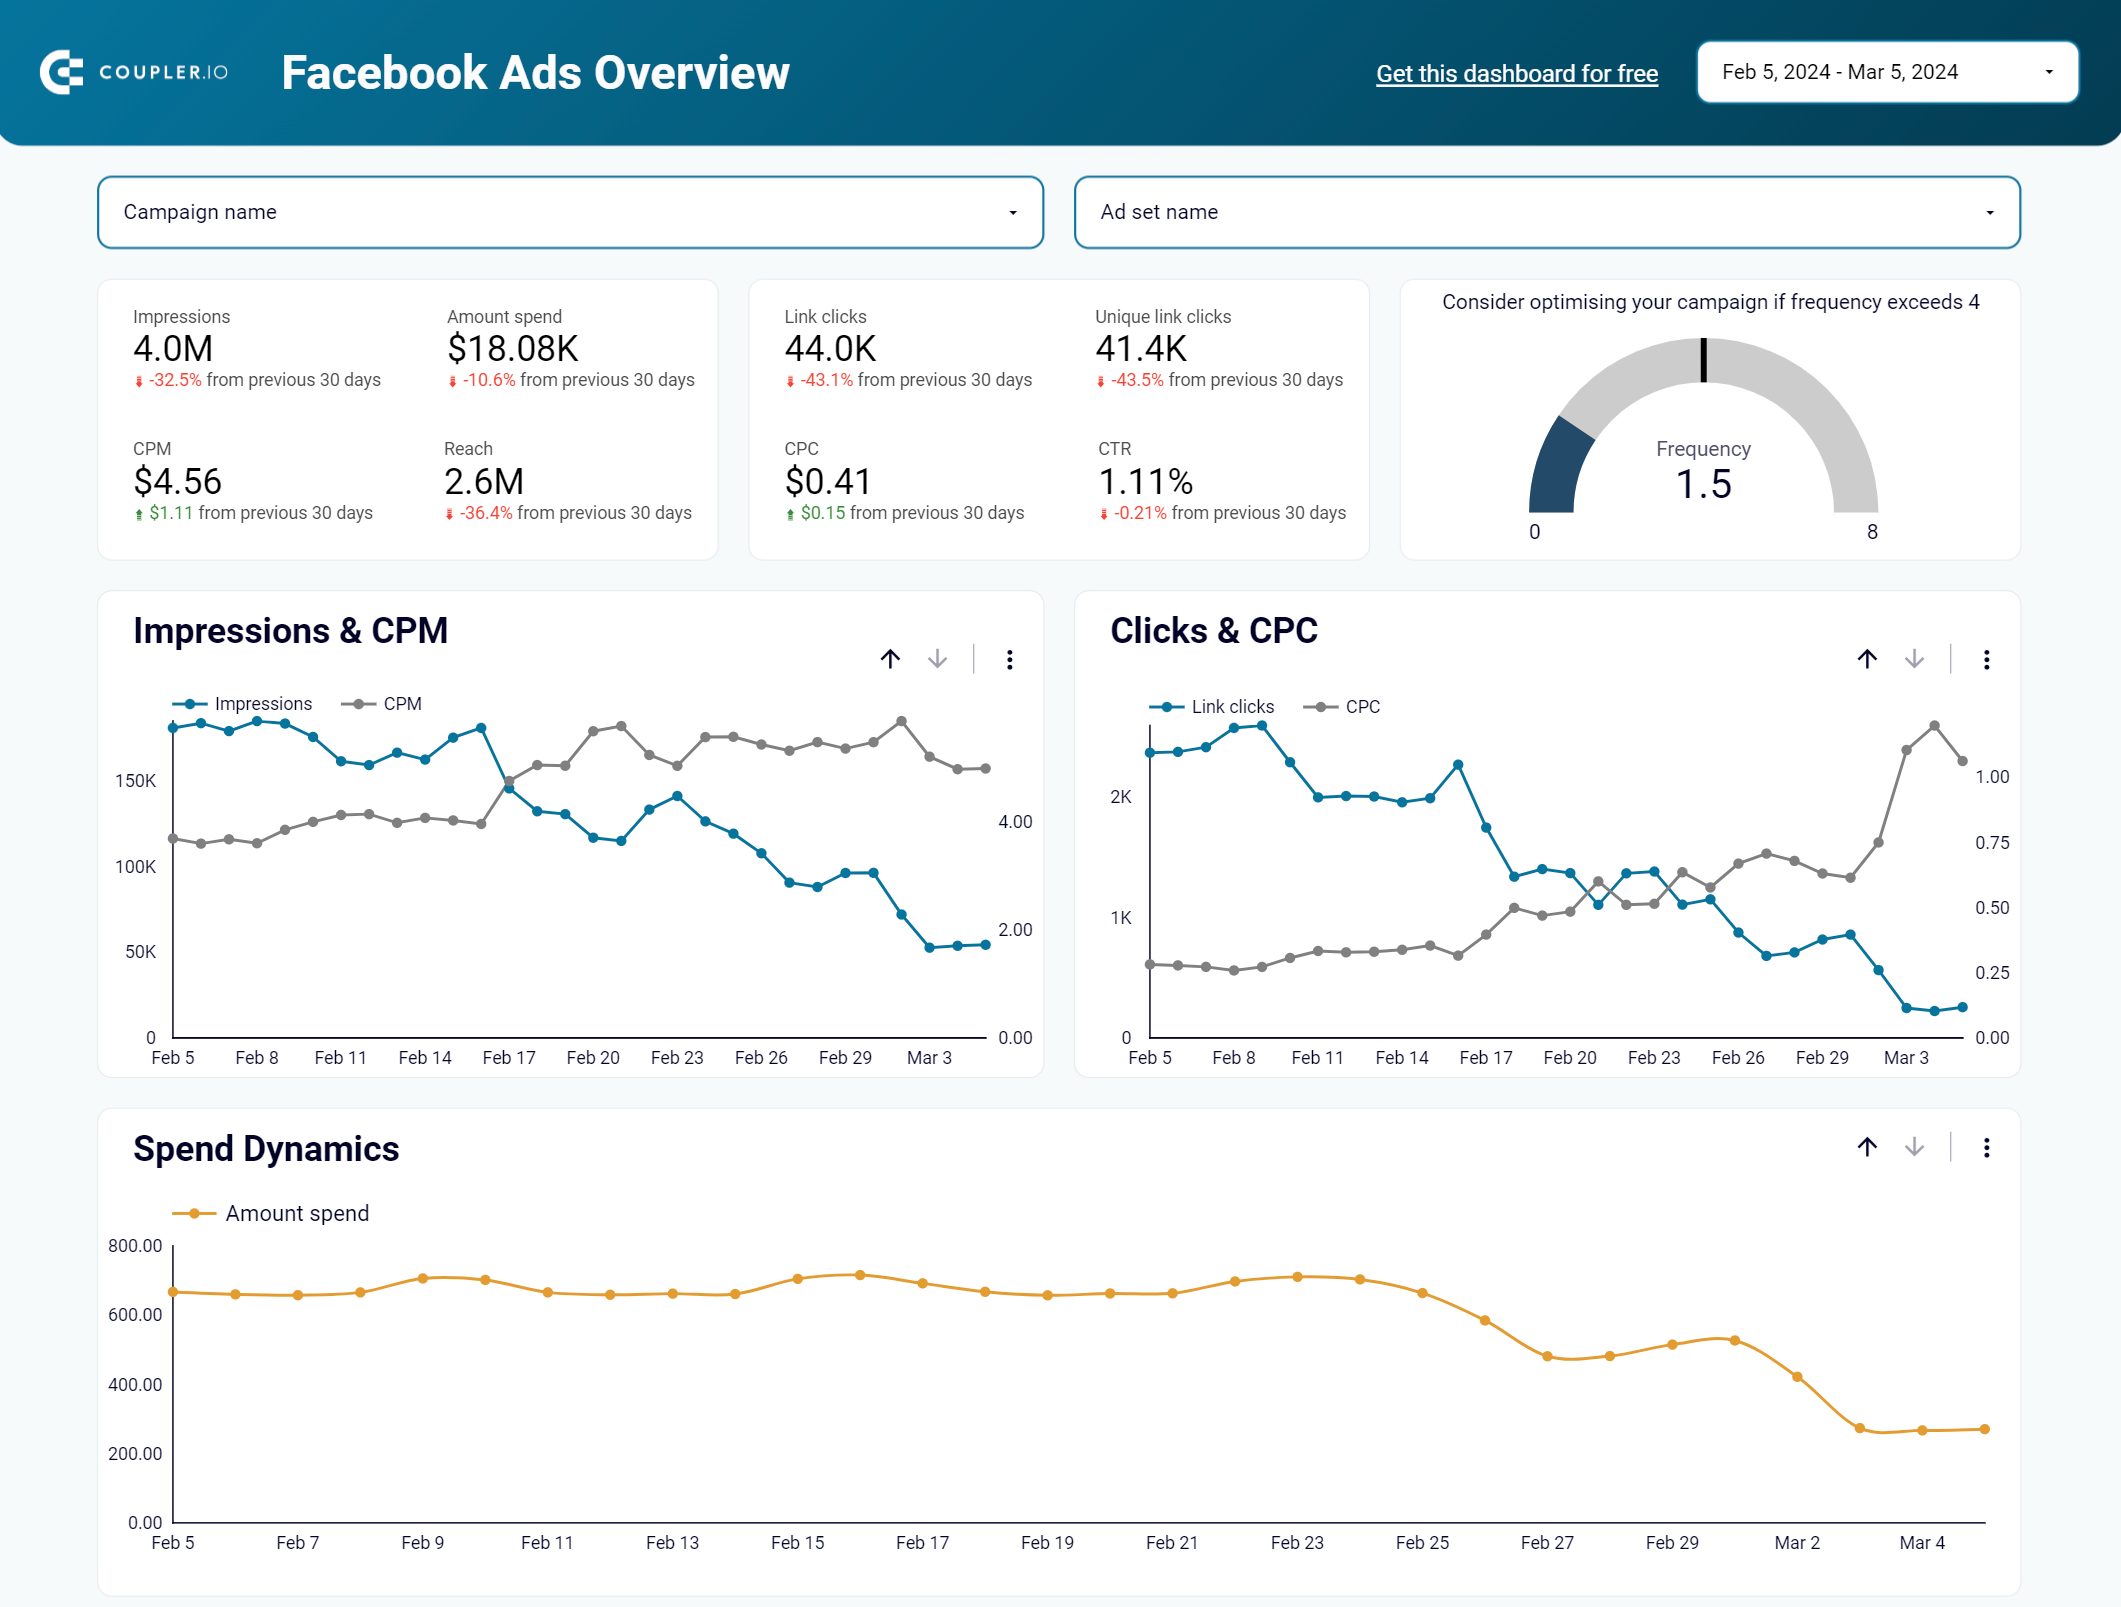
In addition to multichannel PPC dashboards, Coupler.io offers reporting solutions designed for specific ad sources – for example, LinkedIn Ads reporting templates and dashboards for Google Ads, Facebook Ads, etc. These PPC dashboards allow you to track essential metrics such as impressions, clicks, conversions, and others associated with your advertising platform.
Other useful PPC reporting examples
PPC reporting templates by Looker Studio
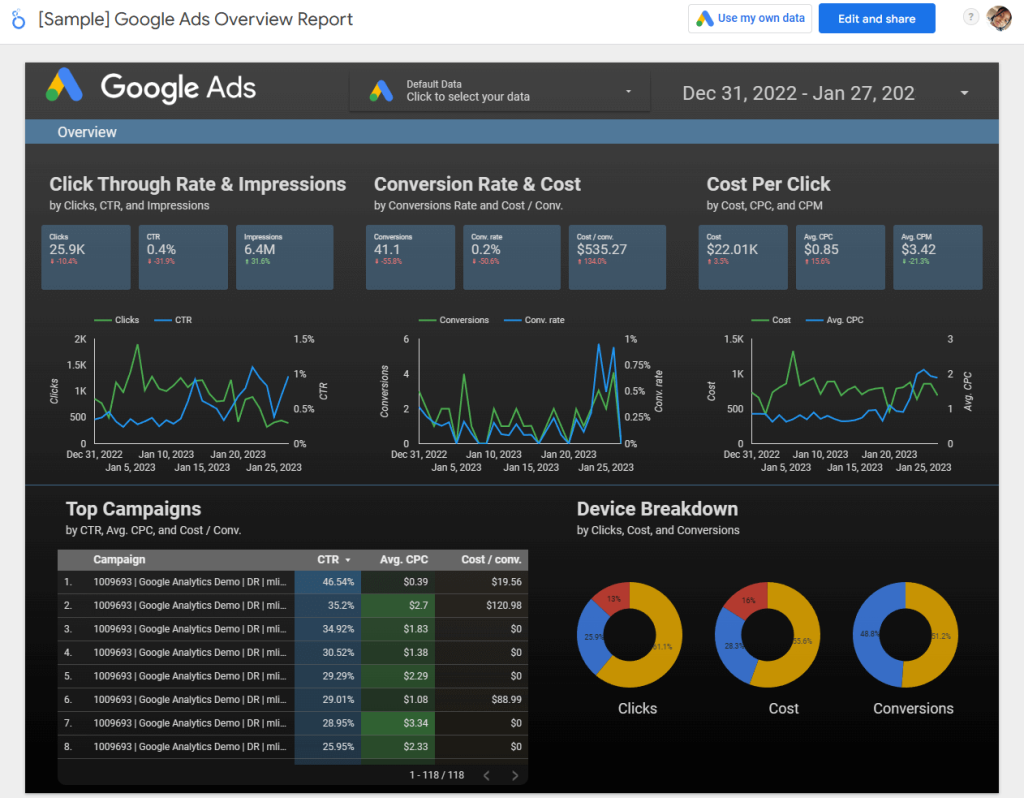
Amongst other options, there are two major PPC templates offered by Looker (Google Data Studio). They include:
This PPC report template allows you to track the conversion rate, cost per click (CPC), click-through rate (CTR) of your campaigns in Google Ads.
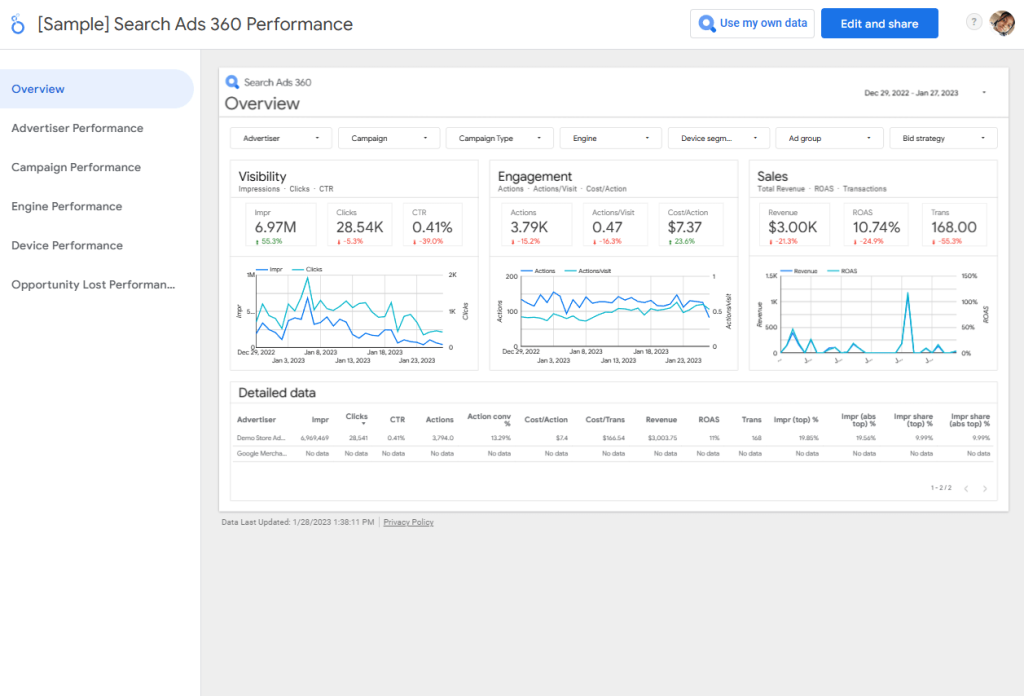
Here, you can load your Search Ads datasets and visually represent them. The template allows you to measure performance by advertiser, campaign, device, engine, and opportunity lost.
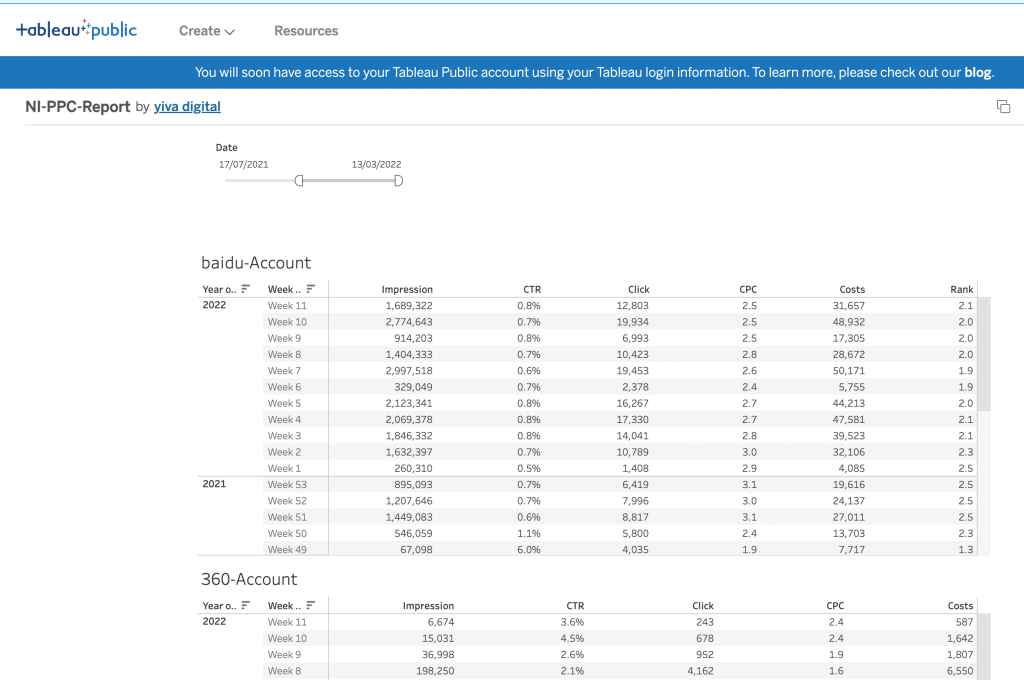
PPC report templates on Tableau Public
There aren’t many marketing report templates on Tableau Public. But you can use the search bar to find a few.
For example, here is a PPC template that shows the impressions, clicks, CPC, costs, and CTR of every week.
How to structure a PPC report?
In case you’re wondering how to create a PPC report from scratch, these are some pointers to help structure a good PPC campaign report:
- Details of ad groups
You have to mention all the ad groups that make up your campaign. You should mention the purpose of each ad group and what it was meant to achieve. Then, you can include specific details such as audience/targeting, keywords, bid/CPC strategy, placement, etc. This helps to know the general plan for all ad groups in the campaign.
- Aggregated numbers or data
Somewhere at the top of your report, you can aggregate data. This helps to briefly show the total metrics as well as the full impact of your advertising campaign. By adding up numbers, you make it easy for your teams or clients to understand what’s going on. It also takes away the need to calculate every time you want to examine your marketing data.
- PPC metrics and corresponding data
The most important aspect of PPC reporting is the ads performance metrics. However, you should not include every campaign data you can find. Instead, stick to those metrics that are crucial to your company’s marketing objectives. Necessary metrics for marketing reports are clicks, CTR, cost per click, conversion rate, etc.
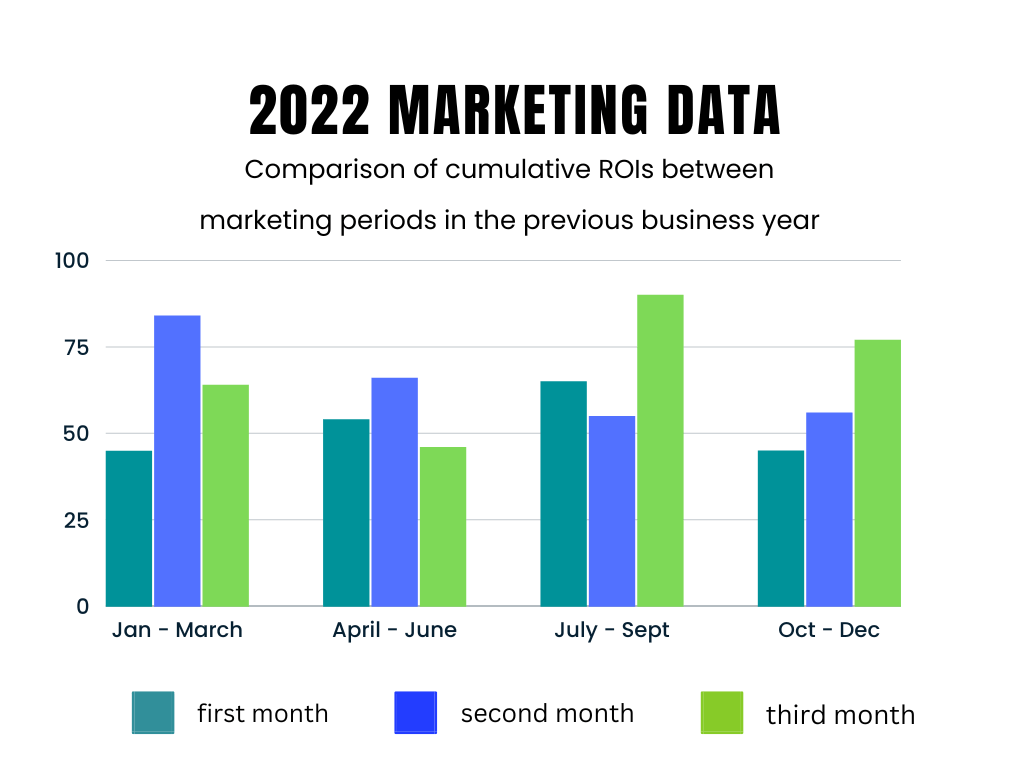
- Comparative data
A PPC report may have a section for some stats comparison. This can be a summary of previous report data or competitor data or results. It helps to compare the performance of the company’s overall marketing efforts. You can use graphs or charts to show similarities and differences between marketing periods.
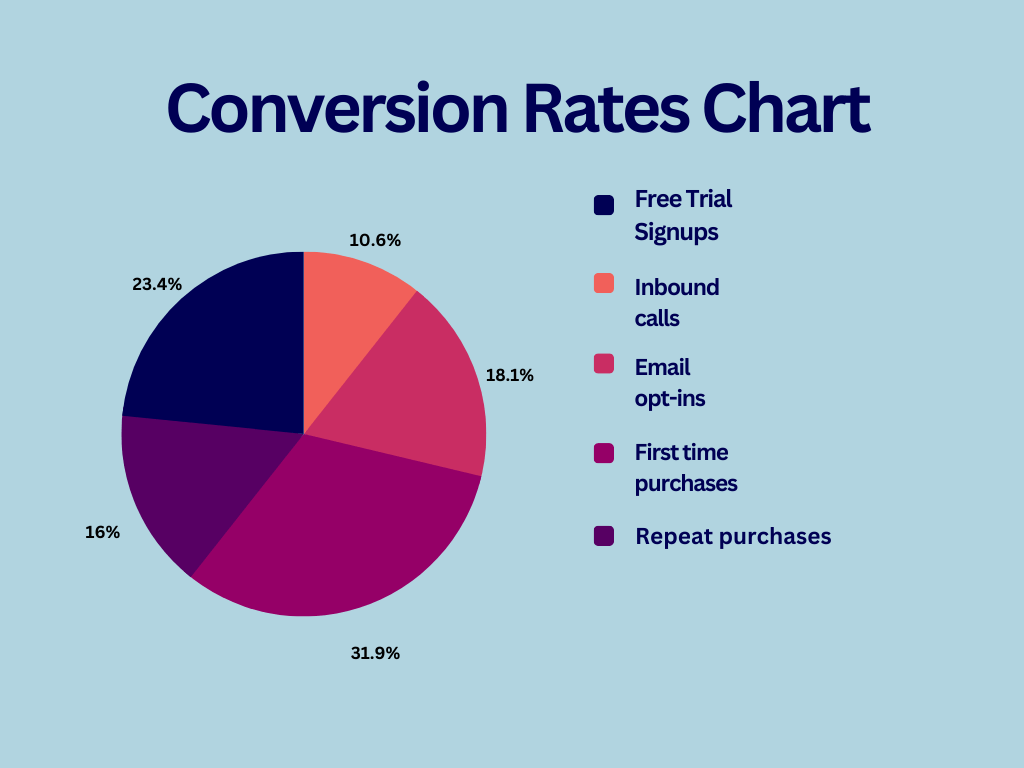
- Campaign results and conversions
Pay-per-click advertising might not result in direct sales but it can bring other conversions. Whether you’re trying to boost awareness, generate leads, or attract your target audience, there are a few conversions or results to keep an eye out for. They may include email opt-ins, contact forms, inbound calls, starting free trials, first purchases, subscription renewals, etc.
- Summary and key takeaways
The best way to conclude a PPC report is to add some insights or notable information that can inform decisions. You can state why the campaigns were successful or not. Are there any strategies that delivered great results? You should also mention areas of your campaigns that need to be optimized for better results and overall return on investment (ROI).
Key metrics: PPC metrics to include in your report
As we’ve explained earlier, performance metrics are an important part of your PPC reporting. But it’s vital to know and choose the right metrics for KPI tracking. Let’s explore the metrics for different ad stages.
Top metrics for awareness ads
These are advertising campaigns for creating brand awareness. They can bring traffic to your website, social media page, etc. It can also help in building an audience for your business. The KPIs include:
- Brand reach
- Impressions
- SEO Website Traffic
- Mentions
- Social media engagement
- Bounce rate
- CPM (Cost per mille impressions)
Top metrics for consideration ads
These are marketing campaigns for building interest, generating leads, and getting people to trust your brand. Here, you’ll establish authority in your niche so your audience can consider you. See common metrics for these ads:
- Clicks
- CPC (cost per click)
- CPA (cost per action)
- Site dwell time
- Email subscriptions
- Free trial sign-ups
- New user conversions
- CTR (click-through rates)
Top metrics for conversion ads
These are advertising campaigns for direct selling of your products or services to the target audience. This stage requires qualified leads or prospects to make a buying decision. The performance metrics to watch include:
- Sales
- Transactions
- Cost per conversion
- ROI (Return on Investment)
- ROAS (Return on Ad spend)
- Conversion rate
- Revenue
For more details, see our guide on PPC metrics.
Useful tips for PPC reporting
Companies that run pay-per-click advertising need PPC reporting for campaign optimization, goal tracking, and better decision-making. Here are some valuable reporting tips to consider:
Use appropriate metrics
With an understanding of your ad campaign’s stage, you’ll know the right metrics to track and include in your PPC report.
The KPIs you use can make or break your entire report. So it’s best to figure out the most relevant metrics.
Add visuals where necessary
PPC reporting is mostly about numbers, so you need to visualize your data wherever possible. This helps everyone to easily digest the data and quickly make sense of it.
You should utilize relevant visual elements when representing certain data – for example, charts, graphs, tables, and so on.
Tell an interactive story with your data
Whether you’re using reporting software or not, you can tell a meaningful story with your ads performance.
This means that you won’t dump your marketing data in a report. Rather, you’d aim to show how everything ties together.
Present accurate marketing data
As you may already know, marketing is a numbers game. Some PPC or SEO campaigns might not be very successful, while others can exceed expectations.
When creating ad reports, make sure to include the exact numbers and data that illustrate your results best. At the same time, it’s better to avoid so-called “vanity metrics” that may look good but have little value for the campaign.
Add insights and recommendations
After examining the numbers, you can include a recommendations section. This may seem like you’re stating the obvious, but it helps those reading your report to easily grasp the marketing insights. It also allows you to pull the right recommendations in the future.
Make PPC reporting a regular activity
As long as you continue to run campaigns, you’d have to create reports consistently. Your PPC reporting can be done weekly, monthly, or quarterly.
A good report schedule allows you to analyze and tweak your marketing strategies in time. The easiest way to ensure regular reporting is to automate this process. For example, you can do so by integrating your PPC platforms with Coupler.io. In this case, your reports will be regularly populated with fresh data automatically, with no manual effort.
Do it yourself or hire an expert – what is best for PPC reporting use cases?
PPC reporting is important for every campaign, from search engine marketing to social media reporting. There’s no specific way of structuring your report but there is certain actionable data that must be added to it.
You can create PPC reports yourself from scratch or use a PPC report template or software. This works for the majority of use cases when you need to get a result fast. However, in the long term, you’d likely need a more profound reporting solution for your business.
In this case, you can hire analytics professionals for your reporting needs. As a result, you will receive a valuable analytical instrument that will help you make data-driven decisions. This can be, for example, a visualized PPC report in the form of an interactive dashboard, that synchronizes with your data sources and displays your metrics in near-real time.