How to Share Google Data Studio Reports (Looker Studio) With Others: Top Ways, Permissions, and Limitations

Google Data Studio (formerly Looker Studio) is a free data visualization tool from Google that allows you to view data from multiple sources in one view. Think of creating a Looker Studio report based on the data exported from Hubspot or Google Ads for a more holistic view of your marketing and sales campaigns.
Building reports is step one. Next, you’ll want to make sure all your stakeholders have the right level of access and permissions to your reports.
To do this, sharing data from your Looker Studio reports can be done in a few simple steps.
In this article, I’ll cover the most common ways to share Looker Studio reports across your workspace or with external clients and discuss use cases and benefits for each. If you prefer watching to reading, then this video tutorial from Coupler.io Academy is right for you.
Now that you’ve got all the relevant data in your Looker Studio, how do you actually share it with relevant people on your team?
At first, you’d think about going to that Share button and simply copying the link, but there’s more to it to consider. When sharing analytic reports that might contain confidential data, you need to think of permissions.
In the next sections of this article, we’ll go over the most common ways you can share Looker Studio reports and the “must-knows” for each:
- Share Looker Studio report using public and private URLs.
- Invite others to view or collaborate on your Looker Studio reports.
- Export your Looker Studio as PDF.
- Set up a delivery schedule for sharing your Looker Studio report via email.
- Embed your Looker Studio report on websites or apps.
- Share Looker Studio reports on social media.
For the purpose of illustration, we’ll use one of these Coupler.io’s Looker Studio dashboard templates to walk you step by step through all the multiple ways of sharing a Looker Studio report.
In Looker Studio Pro, you also have an option to use AI to turn your reports into Google Slides. Learn more about this in our blog post where we’ve compared Looker Studio vs Looker Studio Pro.
Sharing your Looker Studio report using an URL is the most straightforward option as it only involves setting the permissions, copying the link, and then sending it to other people.
One thing to pay attention to is the link permissions you set before sharing the link, as simply copy-pasting the link in your browser’s URL might not work as you want unless you have enabled the right link settings first.
To properly share your Looker Studio report using an URL, click on the Share button on the top right corner of your screen.

Once the sharing dialog window opens, click on the drop-down arrow under Link settings.
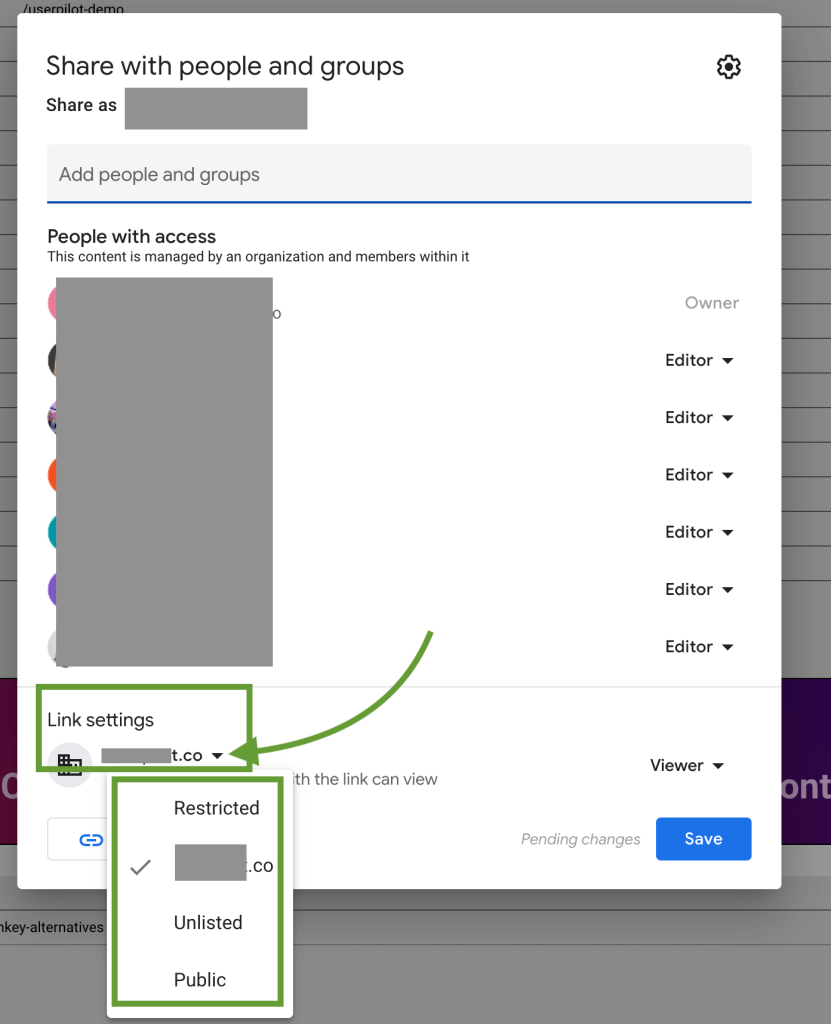
Here you can select between:
- Restricted: only people you add will have access (we’ll cover this option in the next section).
- [Your company’s Google account]: if you are sharing using a business email account, you have the option of selecting your domain and making the link accessible to everyone using an email address with that domain.
- Unlisted: anyone on the internet with the link can view or edit, based on your selection.
- Public: anyone on the internet with the link can find and view or edit, based on your selection.
Once you choose your preferred link-sharing options, click on Copy link to get your report link on the spot. Click Save to apply the changes too.

Note that once your settings are complete, you can easily get your sharable URL also by clicking Get report link in the drop-down menu on the Share button.

Invite others to view or collaborate on your Looker Studio reports
Inviting others to view or collaborate on your Looker Studio dashboard is one way of making sure your reports and data are only accessible to specific people. This helps you manage access at a granular level.
For example, let’s say that you have a shared marketing@company.com email address that all the people on your marketing team have access to. You’d probably want to give the entire team edit-level access while dave@company.com from your accounting department should only have view access.
If you’d use the previous sharing option, via public or private URL, all people would have the same level of access.
In our scenario, inviting specific stakeholders and giving them different access levels would be more beneficial.
Here’s how to invite people on your team to view or edit your Looker Studio report.
1. Go to your Looker Studio report and click on the arrow on the Share button in the top right corner. From the drop-down, select Invite people.

Next, you will see a new dialog box pop-up giving you the sharing options. Your name and account will be on top after “Share as” and you should have Owner permissions if this is a dashboard created by you.

Note that if you are trying to share a Looker Studio report that you are not the owner of, the sharing options will look different based on the permissions you were granted when you got access to the report.
2. To invite people to the report, simply add the email addresses in the Add people and Groups box and they will receive an email notification with your invite.

When adding each email address, you can manage access by choosing between Viewer and Editor roles on the drop-down menu on the right.
Note that if you want to assign different roles to each email address, you will need to go through the three steps for each role. Otherwise, when adding multiple emails, they will all get the same permission role.
Export your Looker Studio as PDF
Inviting people and sharing a URL are great options when you want to share your Looker Studio report with people that need recurring access. But what if you only want to share your report once?
For example, if you’re working with multiple clients and you’ve built a separate report for each to illustrate the results you are driving with your Google Ads campaigns, you might want to send them a monthly report of your work.
Giving clients access to the dashboard might not make sense as they could get confused and lost in all the numbers without an explanation or a report overview summary from you.
Sharing it as a PDF file should be your go-to option in this scenario.
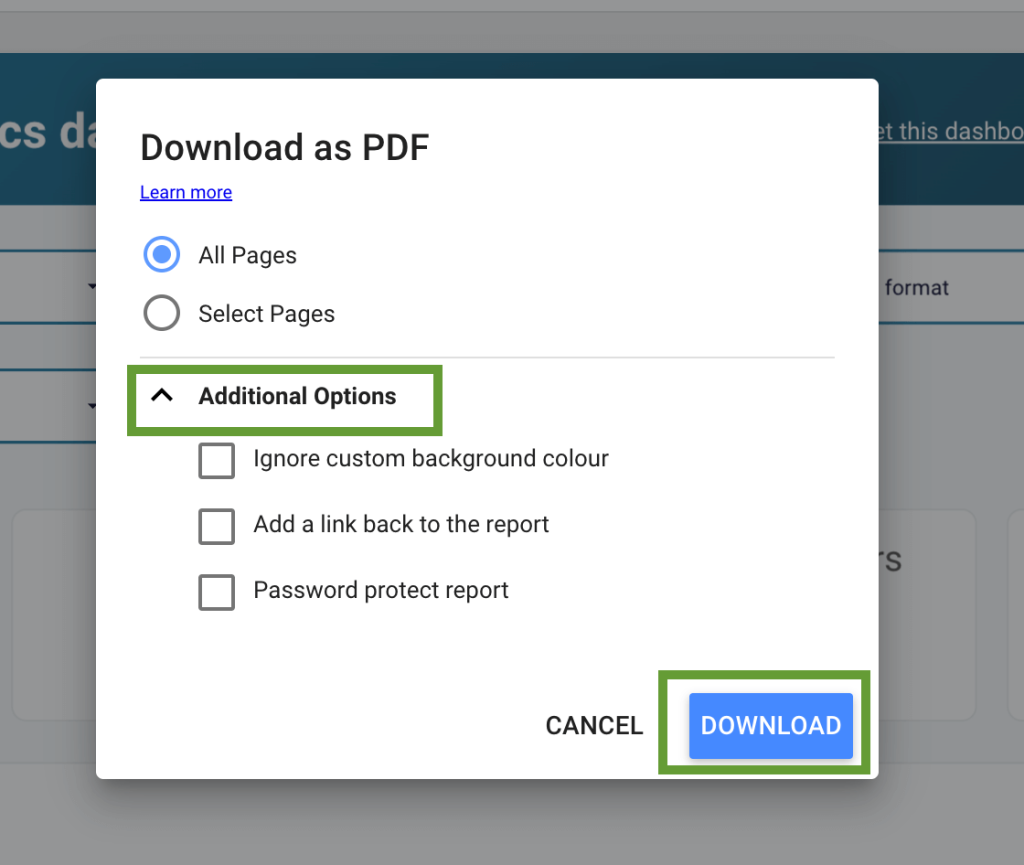
To export a PDF of your Looker Studio report, click on the drop-down arrow on the Share Button in the top right corner and select the Download report option.

A dialog window will pop up with specific settings. Before clicking on the Download button you can select from the following options:
- Export one or multiple pages of your report
- Ignore custom background color
- Add a link back to the report
- Add a password to the report
Sharing the data using an exported PDF works great, but when you want to do it monthly, it might become a mundane task.
In this scenario, scheduling a recurring delivery of your Looker Studio report might work better.
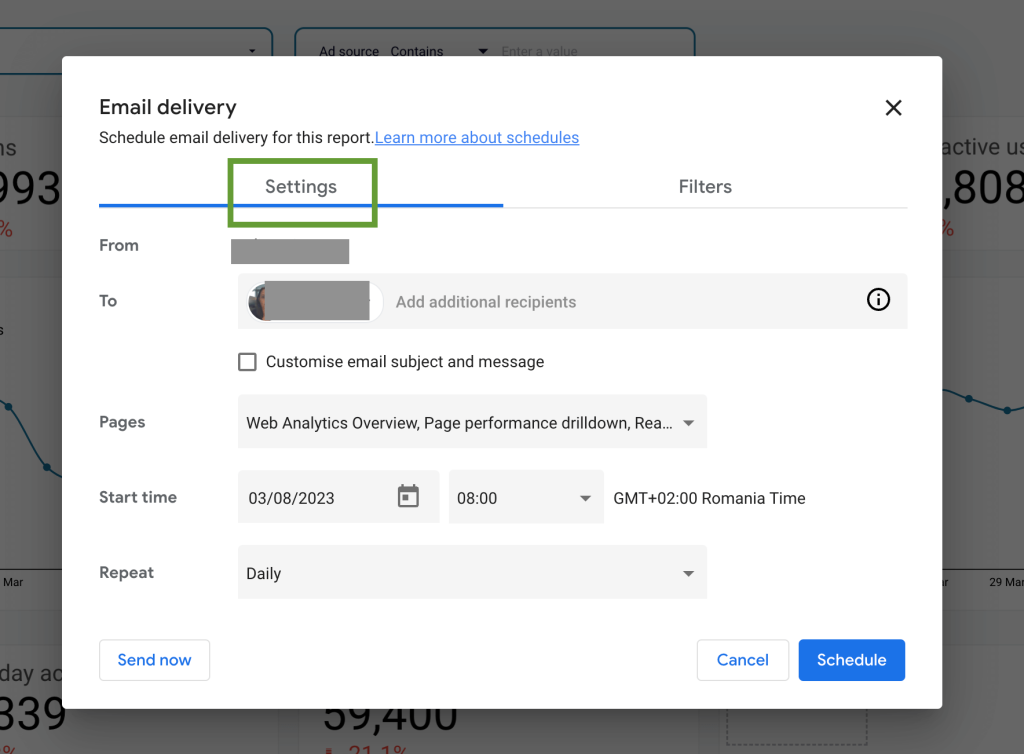
To schedule recurring delivery of your Looker Studio report, go to the drop-down arrow on the Share button and click on Schedule delivery. This will allow you to schedule email delivery only.

An email delivery settings dialog window will display on your screen. Here you will have access to the main settings and filters to customize your email delivery.
The Settings menu lets you customize:
- The recipient: enter one or multiple email addresses where you want your report to be emailed.
- Pages: select specific pages from your report that you want to be included in the email.
- Start time: specify when the delivery schedule should start from.
- Repeat: select the frequency of your email reports (Daily, Weekly, Every weekday, or Custom)
The Filters menu lets you customize the date range for your data and metrics you want to be included in the scheduled report:
- Date range: Fixed; Last 7, 14, 28, or 30 days; Today; or Yesterday.
- Metrics: choose whether to show all metrics and dimensions in your report or only specific ones.
Once you’re done with all the settings, click Schedule to apply the changes and set the automation.

Embed your Looker Studio report on websites or apps via HTML iframe
You can embed your Looker Studio report on any website or app that supports an HTML iframe tag, as this is what you will need to use. Here is an example of how an embed report looks like:
Note that you first need to share your report and set settings as these will also apply to your embedded iframe. If the report is only shared with specific users, then only those people will be able to see the data even when your report is embedded on a public website page.
Next, you will need to generate the iframe code for the report you want to embed.
This is done automatically by Looker Studio, you don’t need any HTML knowledge to get the code.
Navigate to the page report you want to embed and make sure you are in the Edit mode by clicking Edit on the top right corner.

You won’t be able to access the Looker Studio menu otherwise.
Select File from the menu and click on Embed report option at the bottom of the list.

Check the Enable embedding checkbox to get access to the settings dialog box and and generate the code.

Note that once you enabled this, the option to Embed report will display in the drop-down menu on the Share button too. If you are not seeing this option, you need to enable it using the steps described above.

Once this is enabled, you can choose to show report navigation in embedded mode and change the width and height of the iframe that will be embedded in the Embed Report settings dialog box.
Access this by clicking Embed report in the Share menu or automatically when enabling your embedded reports from the main menu, when doing this for the first time.

Once you are happy with the settings, click Copy to Clipboard to copy the code.
A few things to keep in mind when you choose the embedded option to share Looker Studio reports:
- All embedded reports will display in view mode and are functional and interactive. You can use filters and apply date range controls as in your normal report.
- You can’t refresh data in an embedded report; the data will refresh when the cache expires.
- Page navigation will display at the bottom of the report, not on the left side like in your browser view.
- You can click a link at the bottom of the report to access the report in Looker Studio.
- All embedded reports will display the Looker Studio watermark.
- You will have the option to embed a URL instead of a code. When you want to do this, make sure to use the URL option instead of the iframe code, as the shared URL we described in previous methods in this article is not an embeddable URL.
Sharing your Looker Studio reports on social media works the same as sharing any link on a social media platform that supports Open Graph Protocol, such as LinkedIn, Facebook, Twitter, or Slack.
Open Graph Protocol enables any web page, in our case a sharable URL, to be viewed as a rich object in a social graph.
To share Looker Studio report on social media, you can follow the steps described at the beginning of the article on sharing using a public or private link.
Once you get your link, simply paste it into your new social media message like you would do with any other URL.

This not only looks better, but it’s also more functional than simply taking a screenshot of your report and sharing it to social media using a simple image.
We’ve covered multiple ways to share your reports so far. Next, let’s look at how to export specific data from a report for further analysis.
We’ll go over how to export data from a graph or chart and how to export your Looker Studio report to external tools like Google Sheets.
Merge multiple data sources into one Looker Studio custom dashboard before sharing
You’ve learned the specifics of sharing your Looker Studio reports, but it’s important to mention that a Looker Studio report can contain multiple data sources. Before building separate reports and sharing them with the same people, you could consider a more detailed report.
For example, you might only need one report for your Google ads performance monitoring, meaning you’ll be using one data source with one dataset. Like in the example below:

Using the template above would give you the following Looker Studio Dashboard that only displays data from your Google Ads connected account.

But what if you want to track your marketing performance and attribution in one view?
Instead of building separate Looker Studio reports, one for each data source, it would be more efficient to build a new report using multiple data sources and datasets that can easily be shared with all stakeholders. You can check out our comprehensive tutorial guide on creating Looker Studio dashboards to learn more about this.
It’s important to mention that Looker Studio has over 850 connectors available at the time of this writing, including 3rd party connectors built by partners.
These work great but you have to manually add each of the sources to your report which can be time-consuming. Not to mention your data won’t be updated in real-time. This is not a problem when you only need to add data from a few sources and you’re ok with daily updates of your data.
However, when you’re looking for data accuracy and simplicity in building and automating data updates in your reports without having to understand what an API request is, you can use a tool like Coupler.io.
This allows you to export data from multiple sources at once and merge and enrich it before sending it to Looker Studio for better visualization.

Try it yourself – select the needed source in the form below and click Proceed. You’ll need to sign up with your Google account for free and configure the connection of the chosen source. Then you can add another one and another one and so on.
How to export Google Looker Studio data from a chart?
Let’s say you don’t want to share your full report but need to either send specific data to someone from a particular chart or do a more in-depth analysis of that data.
You would want to export the data in this scenario.
To do so, navigate to the chart you want to export data from and click on the 3 dot menu on the right that shows when you hover over the chart.

Click Export and you will see a dialog box.
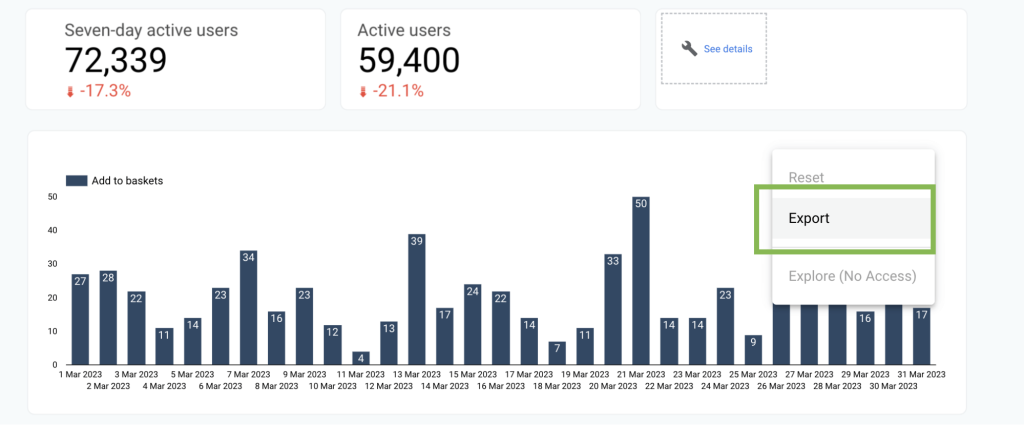
Select the format of the export, either a CSV file, CSV Excel file, or Google Sheets format file. Click the Export button and a download of your selected file will begin.

Can you export Looker Studio report to Google Sheets?
As we’ve seen above, you have the option to export your data in a downloadable Google Sheet. But you’ll have to do it manually for each chart or report in your Looker Studio dashboard.
This can be time-consuming and not really efficient since you’ll end up with your data across multiple sheets, making data visualization a pain.
To get all your data in one go into Google Sheets, you will need to export directly from the data sources your Looker Studio report is using to display data.
Let’s say your report has data from your Google Analytics account.
You can use the native Google Sheets connector add-on to export your GA data to Google Sheets. The downside of this is you can only get data from one data source at once.
Alternatively, if your Looker Studio report uses multiple data sources you should use a tool like Coupler.io to automate exports from Google Analytics plus other sources into Google Sheets or a data warehouse like BigQuery for further manipulation.
Since exporting data from your Looker Studio data sources is not the main topic of this article, we won’t go into further details here.
If you want to learn more about the options, here are some further reading recommendations:
- Export Salesforce data to Google Sheets
- Export Google Search Console to Google Sheets
- How to automate data entry in Google Sheets
What is the difference between a Google Data Studio and a Looker Studio report?
The Looker Studio report is the new version of a Google Data Studio report. It’s a matter of branding and product mergers that Google implemented in October 2022. Looker is the name Google now uses when talking about their Google Cloud business intelligence products as they merge Looker, Data Studio, and core Google AI and ML technologies into one tool.
How do I make a Looker Studio report public?
To make a Looker Studio report public you need to go to the Share setting in the top right corner and select Public in the link sharing options. Once the Public link is enabled, your report can be publicly shared or accessed by people.
How do I limit access to a Looker Studio report?
To limit access to your Looker Studio report, go to the Share settings in the top right corner and select Restricted or individually remove access for specific users from the People with access list.
Where can I get Looker Studio report templates?
Looker Studio is free and offers a lot of templates to get started with. Navigate to your main Looker Studio Google dashboard and click on Templates on the left-side menu to access all templates provided by Looker Studio Team. Alternatively, you can use external custom templates that can be duplicated for specific use cases with a simple Google search. For example, here is a curated list of Looker Studio marketing dashboard templates.