When using Microsoft Power BI for data analysis and business intelligence, make sure you take advantage of every function and filter at your disposal. The DAX (Data Analysis Expressions) language provides formulas (functions, operators, values) for performing advanced calculations and queries on data. SUMX is one of the numerous functions by DAX that uses an expression to sum up each row in a table and return the overall sum.
If you’re a data analyst or business owner who wants to aggregate data effortlessly, the SUMX function can be useful to you. This is because the function simplifies making complex aggregations and calculations on large datasets. In this article, we’ll discuss everything there is to know about SUMX in Power BI. We’ll explore the benefits, syntax, examples, how to use it, and tips for using the SUMX DAX function.
What is SumX in Power BI?
SumX is a built-in function in Power BI that allows users to create advanced calculations with their data. It works as an iterator function that employs a row-by-row calculation when calculating the sum based on the given expression. It’s one of the most flexible DAX functions for aggregating data and creating more accurate and insightful reports.
You can use SumX Power BI to enhance your data analysis. For example, you can calculate averages, totals, and percentages and compare performance. It’s a versatile function that lets you create custom formulas for a variety of calculations. It also handles large datasets without crashing or slowing the performance of Power BI.
What does SumX do in Power BI?
SumX in Power BI is often used to calculate the sum of an expression over a group of rows or a specific table. The function uses two arguments – table and expression – and can perform complex aggregations on very large datasets. You can easily calculate moving averages, running totals, or cumulative totals in financial reports.
The Power BI SumX function can also provide the sum of an expression over both filtered and unfiltered tables. Since it uses an iterative process, you can customize the expression for each row. You can also combine SumX with other DAX functions to perform more advanced calculations and leverage its performance optimization feature.
SumX syntax in Power BI
The SumX function returns the sum of an expression from a table. As with all DAX functions, there’s a specific syntax to follow. It goes like this:
SUMX(<table>, <expression>) |
Parameters
- Table – The table containing the rows for which the expression will be evaluated.
- Expression – The expression to be evaluated for each row of the table
Return value
- A decimal number
Note:
- The first argument is a table or an expression that returns a table. The second argument is a column containing the numbers you want to sum or an expression that evaluates a column.
- The function does row-by-row calculations and only counts numbers in the column. Data types such as text, logical values, and blanks are ignored.
Power BI SumX example
It’s not enough to simply know what SumX does or what the syntax looks like. The example below will help you understand how SumX can be applied to your data. Initially, the table had three columns – Product, Sum of Sale Price, and Sum of Units Sold.
But we need to calculate the total sales amount for each row in the table. The Power BI SumX function requires the table name and the expression to be executed for each row. Then, it calculates the numbers and outputs the sum of all values in a new column.
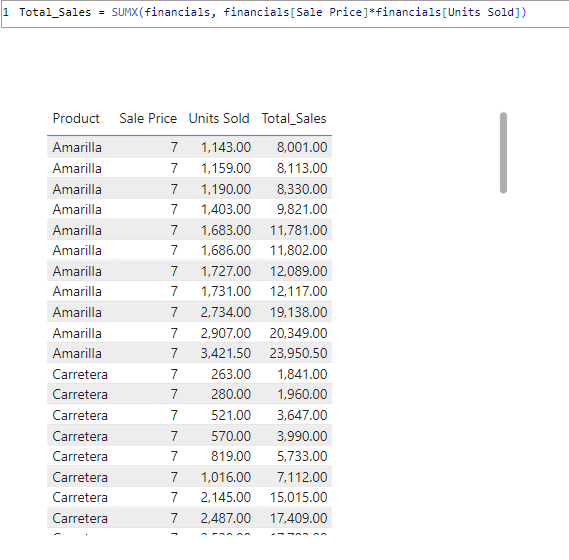
The syntax used in this example goes:
SUMX(financials,financials[Sale Price)*financials[Units Sold]) |
Here are the parameters used in this SUMX example:
- Table – financials
- Expression – financials[Sale Price)*financials[Units Sold])
After executing the expression for each row in the table, the SumX function displays the results in a new column, e.g. Total_Sales in the SumX example above.
How to use SumX in Power BI?
There are two major milestones for analyzing data and building a report in Power BI. First, you have to import your data. Then, you’d create visuals and proceed to analyze data with functions and filters. In this chapter, we show you how to get data and use SUMX with it.
1. Connect your data source to Power BI
Power BI offers multiple data sources, but they can only integrate data manually. The best way to keep track of and analyze big data is through automation. It allows you to plug in a data source and refresh your report as often as you want. A good solution for automated integration is Coupler.io – a data automation platform that allows you to connect and schedule data flows from 60+ apps such as CRMs, marketing, sales, accounting tools, etc., to data visualization tools (including Power BI), spreadsheets, and more.
Let’s quickly import data into Power BI and see how to use SumX. Select the needed source application in the form below and click Proceed. You’ll be offered to create a Coupler.io account for free with no credit card required.
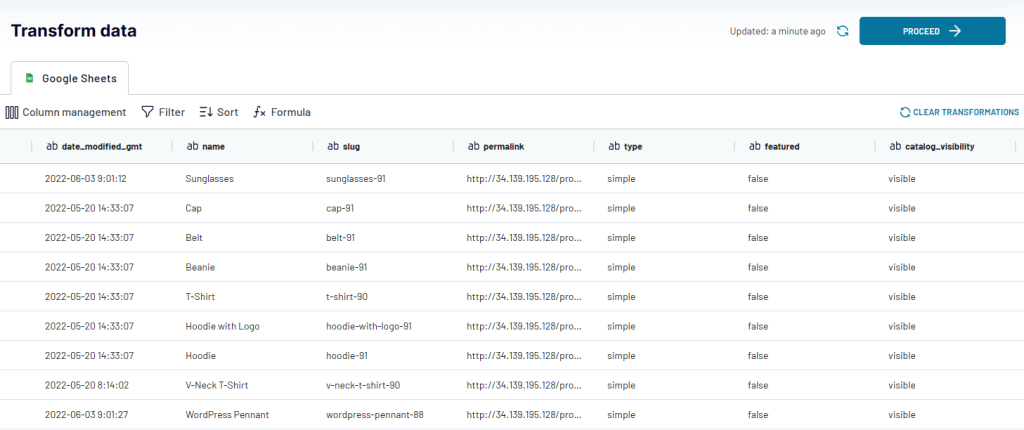
- Follow the instructions to connect your account and select data to extract.
- Then, you can preview and transform your data. For example, you can sort and filter data, hide and rearrange columns, and blend data from several accounts or apps into one dataset. In this step, you can also perform calculations and add formula-based columns.
You can use formulas to create custom columns in the Transform data section. There’s a help article that contains the supported operations and formulas. You can’t use SumX or other DAX functions, but you can apply arithmetic operations, string formulas, math formulas, logical operators, etc. Here is what it looks like:
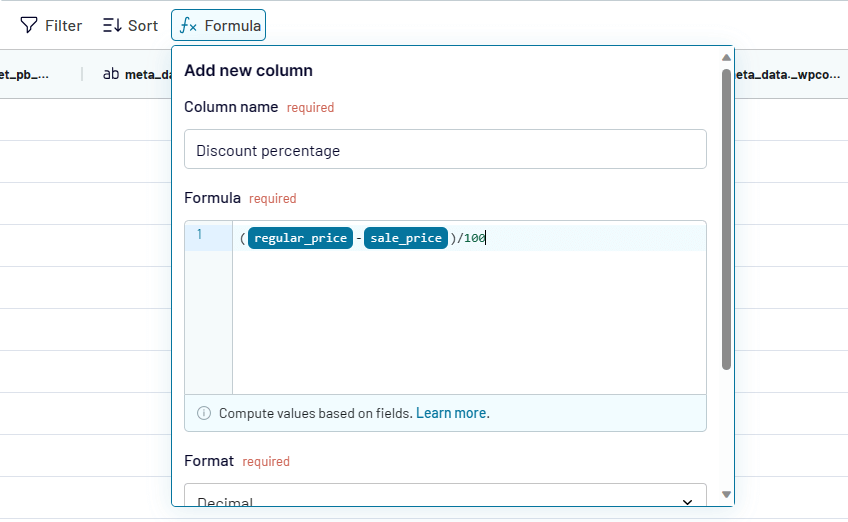
In this example, the formula uses existing columns to compute the values for a new column in your dataset. Once you click Add Column, you’ll find it added.
- Next, you copy the integration URL and proceed to the next page.
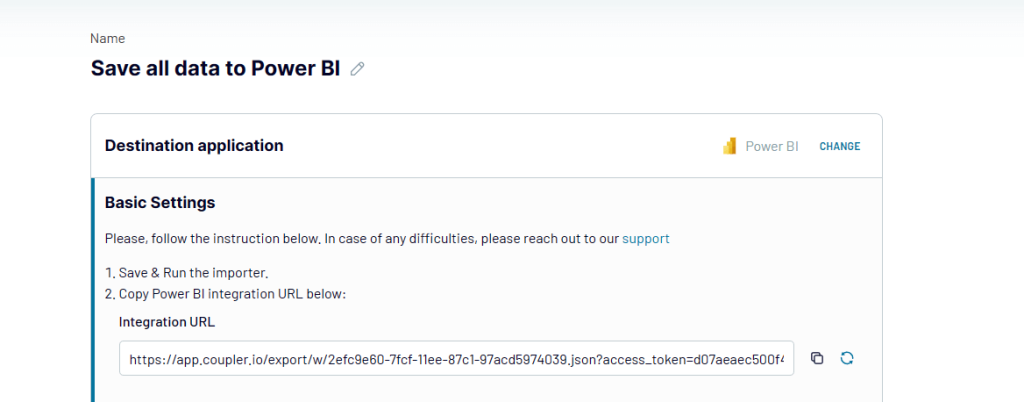
You have the option to turn on Automatic Data Refresh in order to set up the schedule for automatic imports. The refresh interval can be as frequent as every 15 or 30 minutes. When you’re satisfied with everything, click Save and Run. You will be redirected to the importer page, and if it was successful, you should see a notification that says so. In the next section, we’ll use the integration URL to get data in Power BI.
2. Create visuals and add SumX function
Once you open Power BI Desktop, you’ll be asked to Add data to your report. You can choose any of the available options, but if you’re looking to automate with an automation app such as Coupler.io, you should follow the connection steps below:
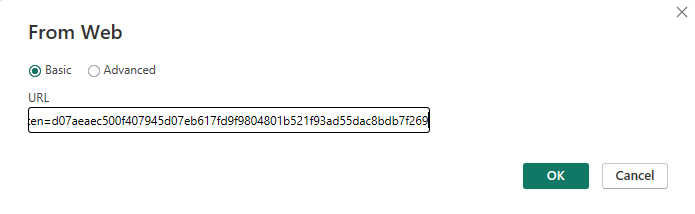
- Click Get data from another source. Pick Other and choose Web. Now, click the Connect button and enter your integration URL, such as done below.
You’ll be asked to choose the level to apply the settings to before you can connect. If successful, you should see your data in Power Query Editor and save to continue.
- Tables are the main visuals for SumX, so create a table and pick the data points.
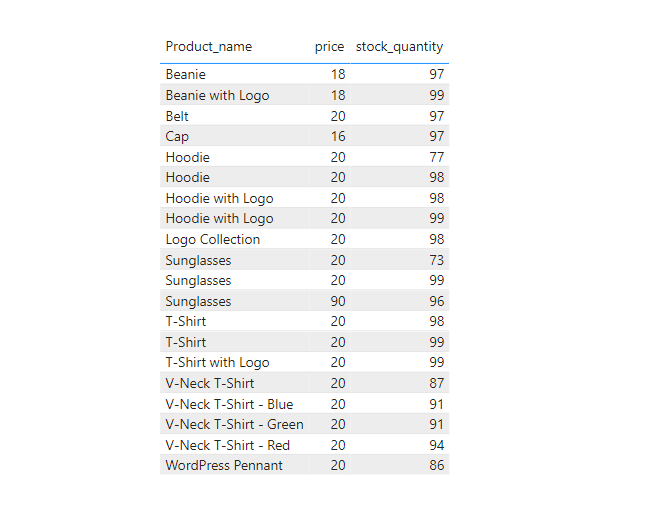
This is some WooCommerce data extracted from Google Sheets in the previous section. We’re adding three columns to our table – Product_name, Price and Stock_Quantity. Then, we calculate the Total Stock Value of our products.
- Next, click on the Modelling tab and click the New Measure icon. This allows you to write a DAX expression that calculates a value from your data.
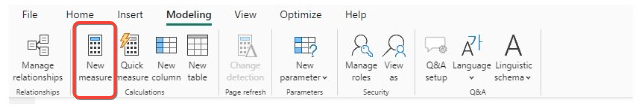
- A textbox will appear under the report tools area. Enter the name of your measure (i.e. the new column for the result) and enter the DAX expression.
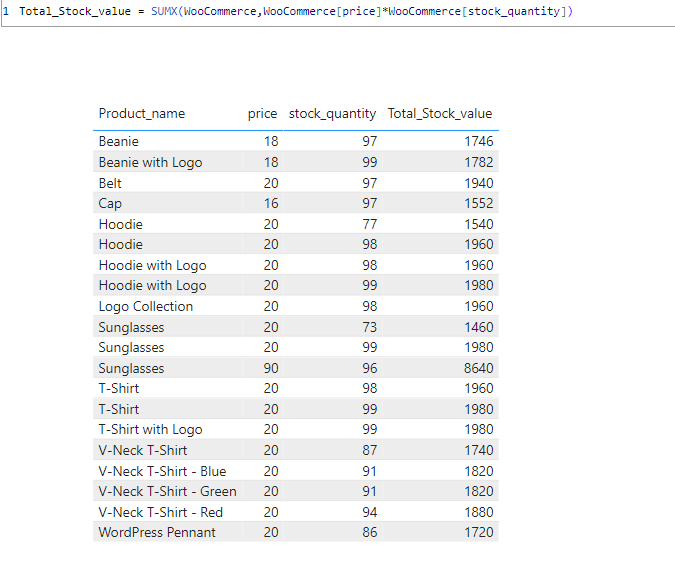
To calculate the total stock value, we multiply the stock quantity by the stock prices. The equation includes the column name and our SumX DAX expression. See below:
Total_Stock_value = SUMX(WooCommerce,WooCommerce[price]*WooCommerce[stock_quantity]) |
PS. PowerBI Desktop provides suggestions when typing DAX expressions. This makes it easier for you to find the table name and the required columns, i.e. parameters.
Tips for using SumX in Power BI
SumX is a function that calculates the sum of an expression over a particular table or groups or rows. Here are some tips to make the most of SumX in your Power BI report.
- Make sure to write the correct syntax to avoid errors. You should also refer to valid columns or tables with the exact data type that works with SumX.
- Learn the Power BI SumX DAX function syntax before you attempt to create complex measures. This is necessary when trying to combine SumX with filters.
- SumX can handle large datasets easily, but you can boost performance by optimizing your data model and using other DAX functions.
- Remove any other functions in use if you’re getting erroneous figures. For example, SumX can be inaccurate when paired with the Summarize function.
- The function can be applied to various scenarios e.g. calculating total ad views, total number of hours worked, total number of delivered products, etc.
- You can calculate the sum of a column in a related table. You just have to call the Related function to add columns from a second table to the DAX expression.
Power BI Sum vs SumX
DAX functions allow Power BI users to perform complex calculations and manipulate their datasets. Sum and SumX are two similar DAX functions available. The Sum function is used to add all numbers in a column but SumX returns the sum of an expression evaluated for each row in a table. The syntax for Sum looks like this:
SUM(<column>) |
While the syntax for SumX in Power BI looks like this:
SUMX(<table>, <expression>) |
Only one parameter is required in a Sum function – the column to sum up. On the other hand, SumX needs two parameters – the table and the expression to evaluate.
Summary: SumX function in Power BI
The SumX function is a powerful aggregation function in Power BI that’s mostly used for numeric data types such as integers and decimals. SumX allows users to perform complex calculations on large datasets without wasting time or slowing Power BI down. You can combine SumX Power BI with filters or slicers and other DAX functions such as Maxx, Minx, Max, AverageX, CALCULATETABLE, and CountX to analyze and extract deeper insights from big data. Coupler.io is reporting automation platform to automate the transfer of massive datasets from numerous sources into Power BI.
For more tips on how to work with Power BI, see our Power BI tutorial and Power BI date table guide, as well as our articles on